Fair Bluff, NC Map & Demographics
Fair Bluff Map
Fair Bluff Overview
$20,914
PER CAPITA INCOME
$25,500
AVG HOUSEHOLD INCOME
34.1%
WAGE / INCOME GAP [ % ]
65.9¢/ $1
WAGE / INCOME GAP [ $ ]
0.44
INEQUALITY / GINI INDEX
437
TOTAL POPULATION
164
MALE POPULATION
273
FEMALE POPULATION
60.07
MALES / 100 FEMALES
166.46
FEMALES / 100 MALES
54.7
MEDIAN AGE
2.9
AVG FAMILY SIZE
2.0
AVG HOUSEHOLD SIZE
183
LABOR FORCE [ PEOPLE ]
47.8%
PERCENT IN LABOR FORCE
3.8%
UNEMPLOYMENT RATE
Fair Bluff Zip Codes
Fair Bluff Area Codes
Income in Fair Bluff
Income Overview in Fair Bluff
| Characteristic | Number | Measure |
| Per Capita Income | 437 | $20,914 |
| Median Family Income | 109 | $0 |
| Mean Family Income | 109 | $58,064 |
| Median Household Income | 220 | $25,500 |
| Mean Household Income | 220 | $40,600 |
| Income Deficit | 109 | $0 |
| Wage / Income Gap (%) | 437 | 34.07% |
| Wage / Income Gap ($) | 437 | 65.93¢ per $1 |
| Gini / Inequality Index | 437 | 0.44 |
Earnings by Sex in Fair Bluff
Average Earnings in Fair Bluff are $17,180, $25,662 for men and $16,919 for women, a difference of 34.1%.
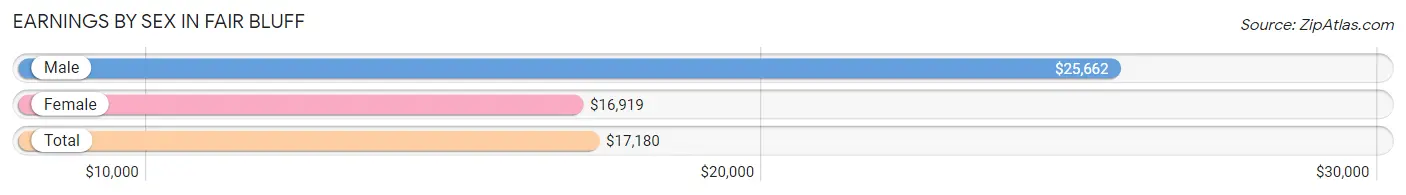
| Sex | Number | Average Earnings |
| Male | 65 (33.0%) | $25,662 |
| Female | 132 (67.0%) | $16,919 |
| Total | 197 (100.0%) | $17,180 |
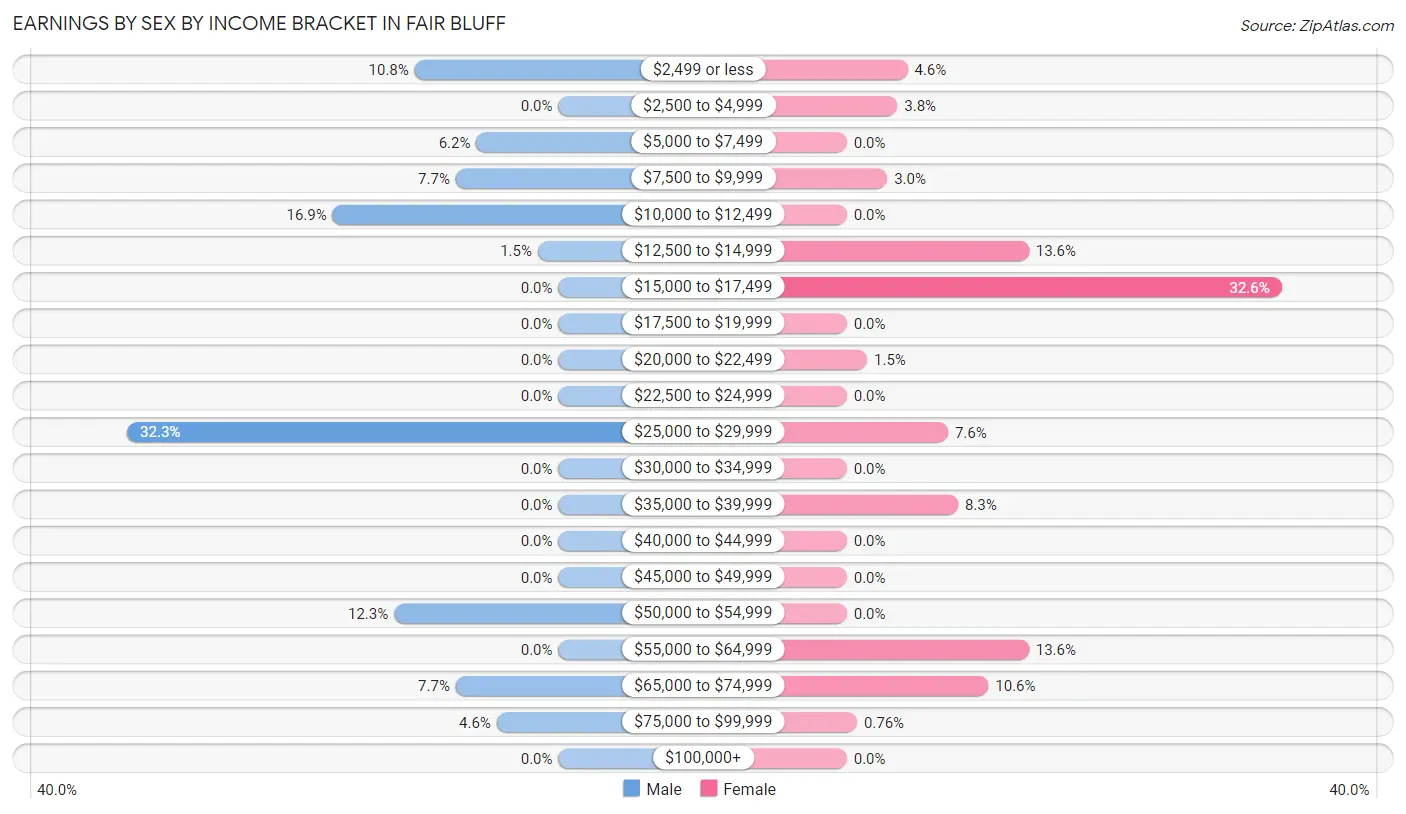
Earnings by Sex by Income Bracket in Fair Bluff
The most common earnings brackets in Fair Bluff are $25,000 to $29,999 for men (21 | 32.3%) and $15,000 to $17,499 for women (43 | 32.6%).
| Income | Male | Female |
| $2,499 or less | 7 (10.8%) | 6 (4.5%) |
| $2,500 to $4,999 | 0 (0.0%) | 5 (3.8%) |
| $5,000 to $7,499 | 4 (6.1%) | 0 (0.0%) |
| $7,500 to $9,999 | 5 (7.7%) | 4 (3.0%) |
| $10,000 to $12,499 | 11 (16.9%) | 0 (0.0%) |
| $12,500 to $14,999 | 1 (1.5%) | 18 (13.6%) |
| $15,000 to $17,499 | 0 (0.0%) | 43 (32.6%) |
| $17,500 to $19,999 | 0 (0.0%) | 0 (0.0%) |
| $20,000 to $22,499 | 0 (0.0%) | 2 (1.5%) |
| $22,500 to $24,999 | 0 (0.0%) | 0 (0.0%) |
| $25,000 to $29,999 | 21 (32.3%) | 10 (7.6%) |
| $30,000 to $34,999 | 0 (0.0%) | 0 (0.0%) |
| $35,000 to $39,999 | 0 (0.0%) | 11 (8.3%) |
| $40,000 to $44,999 | 0 (0.0%) | 0 (0.0%) |
| $45,000 to $49,999 | 0 (0.0%) | 0 (0.0%) |
| $50,000 to $54,999 | 8 (12.3%) | 0 (0.0%) |
| $55,000 to $64,999 | 0 (0.0%) | 18 (13.6%) |
| $65,000 to $74,999 | 5 (7.7%) | 14 (10.6%) |
| $75,000 to $99,999 | 3 (4.6%) | 1 (0.8%) |
| $100,000+ | 0 (0.0%) | 0 (0.0%) |
| Total | 65 (100.0%) | 132 (100.0%) |
Earnings by Sex by Educational Attainment in Fair Bluff
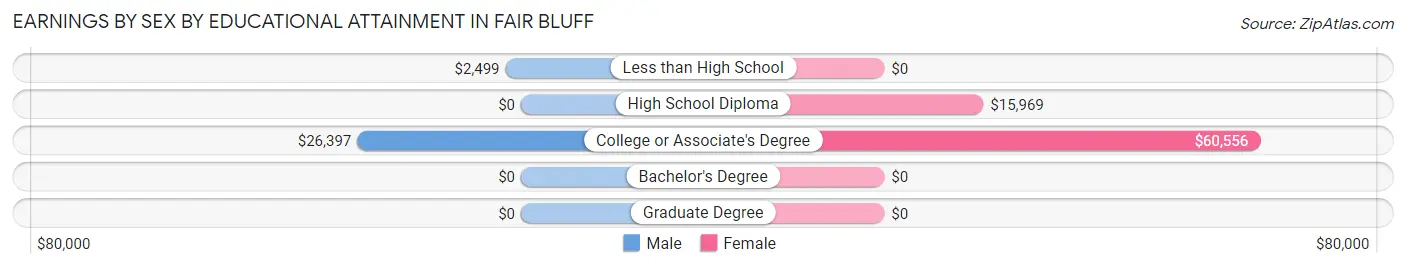
| Educational Attainment | Male Income | Female Income |
| Less than High School | $2,499 | $0 |
| High School Diploma | - | - |
| College or Associate's Degree | $26,397 | $60,556 |
| Bachelor's Degree | - | - |
| Graduate Degree | - | - |
| Total | - | - |
Family Income in Fair Bluff
Family Income Brackets in Fair Bluff
According to the Fair Bluff family income data, there are 30 families falling into the $25,000 to $34,999 income range, which is the most common income bracket and makes up 27.5% of all families.
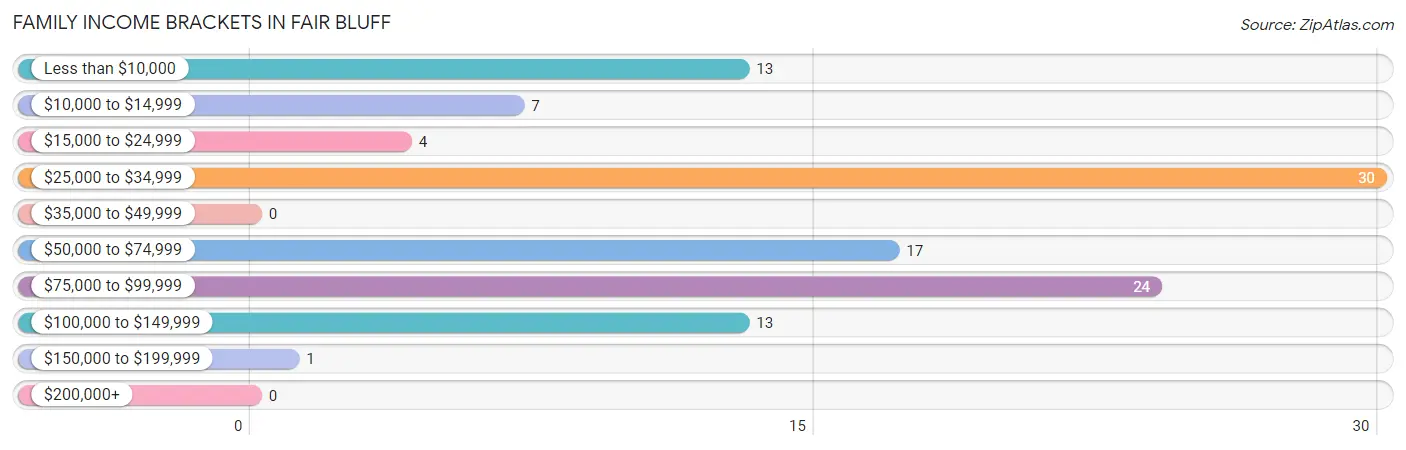
| Income Bracket | # Families | % Families |
| Less than $10,000 | 13 | 11.9% |
| $10,000 to $14,999 | 7 | 6.4% |
| $15,000 to $24,999 | 4 | 3.7% |
| $25,000 to $34,999 | 30 | 27.5% |
| $35,000 to $49,999 | 0 | 0.0% |
| $50,000 to $74,999 | 17 | 15.6% |
| $75,000 to $99,999 | 24 | 22.0% |
| $100,000 to $149,999 | 13 | 11.9% |
| $150,000 to $199,999 | 1 | 0.9% |
| $200,000+ | 0 | 0.0% |
Family Income by Famaliy Size in Fair Bluff
3-person families (36 | 33.0%) account for the highest median family income in Fair Bluff with $80,000 per family, while 3-person families (36 | 33.0%) have the highest median income of $26,667 per family member.
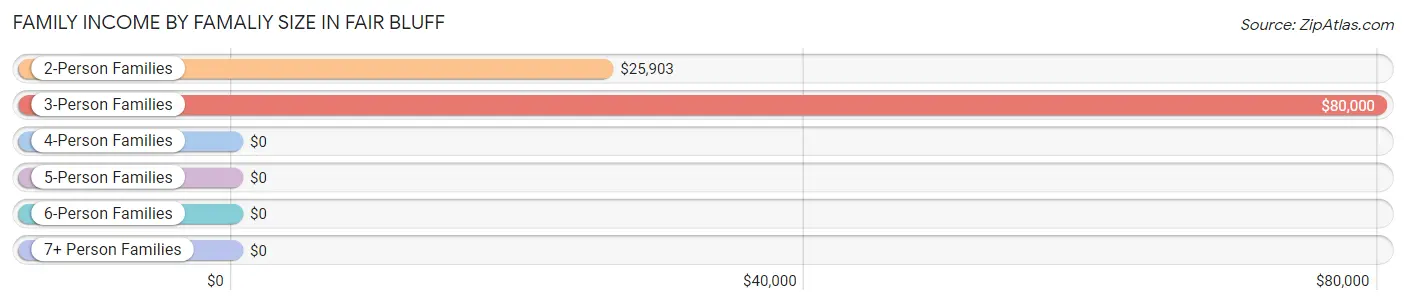
| Income Bracket | # Families | Median Income |
| 2-Person Families | 61 (56.0%) | $25,903 |
| 3-Person Families | 36 (33.0%) | $80,000 |
| 4-Person Families | 7 (6.4%) | $0 |
| 5-Person Families | 0 (0.0%) | $0 |
| 6-Person Families | 5 (4.6%) | $0 |
| 7+ Person Families | 0 (0.0%) | $0 |
| Total | 109 (100.0%) | $0 |
Family Income by Number of Earners in Fair Bluff
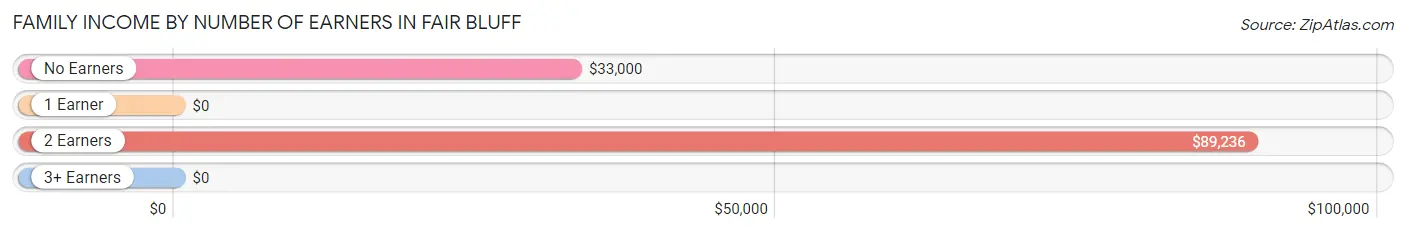
| Number of Earners | # Families | Median Income |
| No Earners | 28 (25.7%) | $33,000 |
| 1 Earner | 48 (44.0%) | $0 |
| 2 Earners | 27 (24.8%) | $89,236 |
| 3+ Earners | 6 (5.5%) | $0 |
| Total | 109 (100.0%) | $0 |
Household Income in Fair Bluff
Household Income Brackets in Fair Bluff
With 54 households falling in the category, the $15,000 to $24,999 income range is the most frequent in Fair Bluff, accounting for 24.5% of all households.
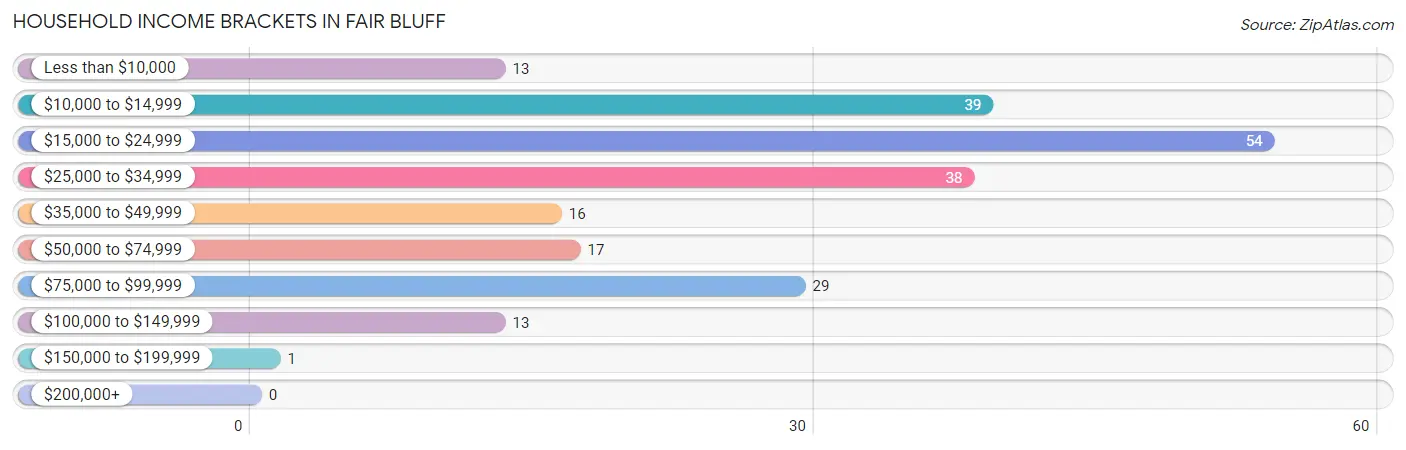
| Income Bracket | # Households | % Households |
| Less than $10,000 | 13 | 5.9% |
| $10,000 to $14,999 | 39 | 17.7% |
| $15,000 to $24,999 | 54 | 24.5% |
| $25,000 to $34,999 | 38 | 17.3% |
| $35,000 to $49,999 | 16 | 7.3% |
| $50,000 to $74,999 | 17 | 7.7% |
| $75,000 to $99,999 | 29 | 13.2% |
| $100,000 to $149,999 | 13 | 5.9% |
| $150,000 to $199,999 | 1 | 0.5% |
| $200,000+ | 0 | 0.0% |
Household Income by Householder Age in Fair Bluff
The median household income in Fair Bluff is $25,500, with the highest median household income of $88,194 found in the 25 to 44 years age bracket for the primary householder. A total of 26 households (11.8%) fall into this category.
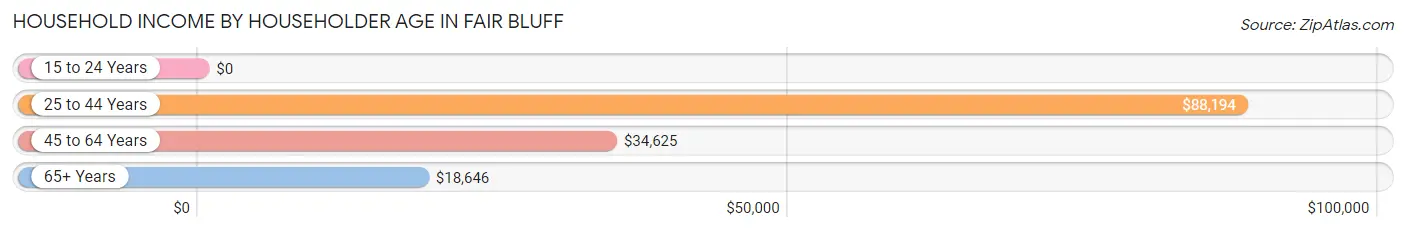
| Income Bracket | # Households | Median Income |
| 15 to 24 Years | 0 (0.0%) | $0 |
| 25 to 44 Years | 26 (11.8%) | $88,194 |
| 45 to 64 Years | 97 (44.1%) | $34,625 |
| 65+ Years | 97 (44.1%) | $18,646 |
| Total | 220 (100.0%) | $25,500 |
Poverty in Fair Bluff
Income Below Poverty by Sex and Age in Fair Bluff
With 25.0% poverty level for males and 16.5% for females among the residents of Fair Bluff, 65 to 74 year old males and 12 to 14 year old females are the most vulnerable to poverty, with 21 males (77.8%) and 5 females (100.0%) in their respective age groups living below the poverty level.
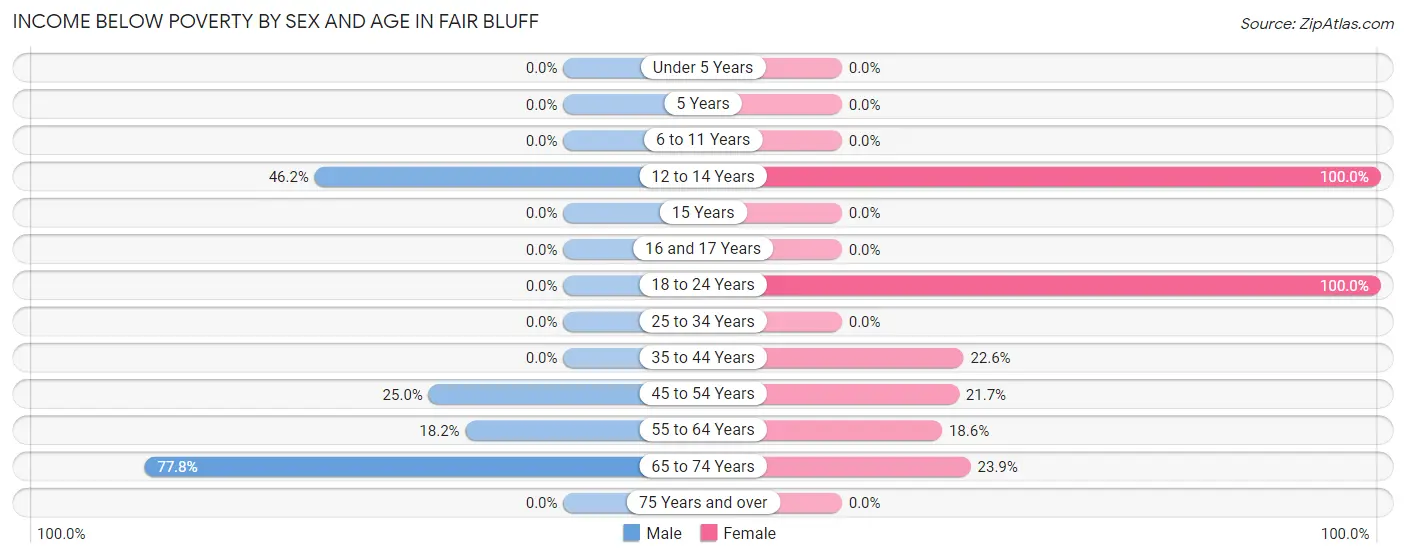
| Age Bracket | Male | Female |
| Under 5 Years | 0 (0.0%) | 0 (0.0%) |
| 5 Years | 0 (0.0%) | 0 (0.0%) |
| 6 to 11 Years | 0 (0.0%) | 0 (0.0%) |
| 12 to 14 Years | 6 (46.2%) | 5 (100.0%) |
| 15 Years | 0 (0.0%) | 0 (0.0%) |
| 16 and 17 Years | 0 (0.0%) | 0 (0.0%) |
| 18 to 24 Years | 0 (0.0%) | 4 (100.0%) |
| 25 to 34 Years | 0 (0.0%) | 0 (0.0%) |
| 35 to 44 Years | 0 (0.0%) | 7 (22.6%) |
| 45 to 54 Years | 6 (25.0%) | 10 (21.7%) |
| 55 to 64 Years | 8 (18.2%) | 8 (18.6%) |
| 65 to 74 Years | 21 (77.8%) | 11 (23.9%) |
| 75 Years and over | 0 (0.0%) | 0 (0.0%) |
| Total | 41 (25.0%) | 45 (16.5%) |
Income Above Poverty by Sex and Age in Fair Bluff
According to the poverty statistics in Fair Bluff, males aged 6 to 11 years and females aged 6 to 11 years are the age groups that are most secure financially, with 100.0% of males and 100.0% of females in these age groups living above the poverty line.
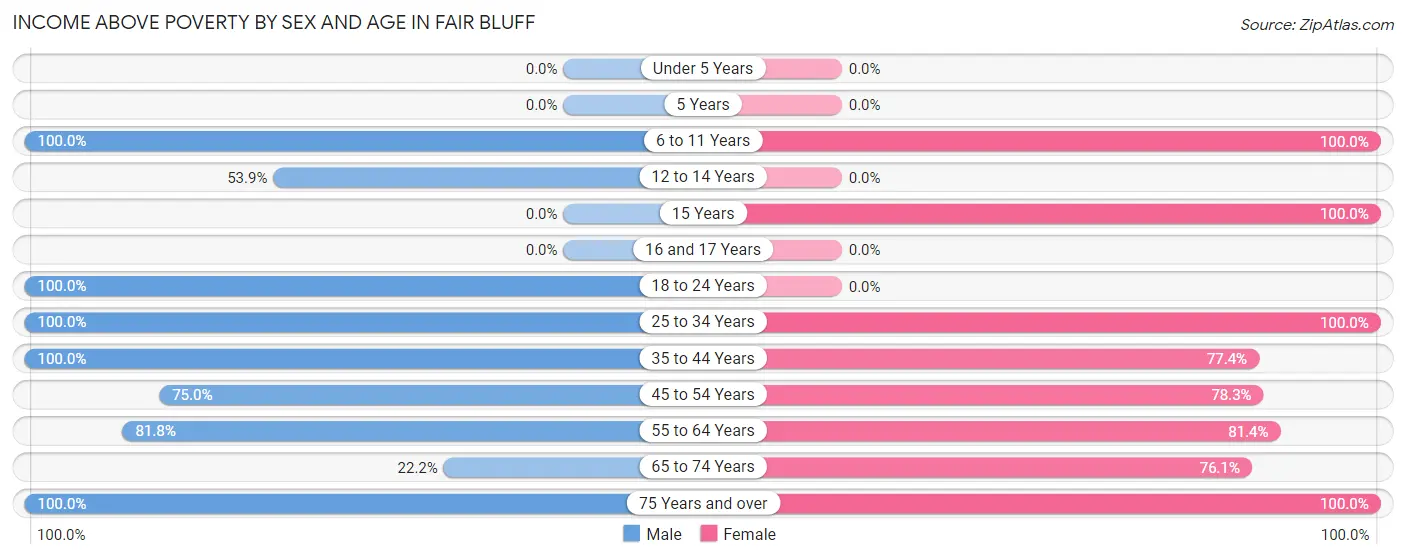
| Age Bracket | Male | Female |
| Under 5 Years | 0 (0.0%) | 0 (0.0%) |
| 5 Years | 0 (0.0%) | 0 (0.0%) |
| 6 to 11 Years | 17 (100.0%) | 15 (100.0%) |
| 12 to 14 Years | 7 (53.8%) | 0 (0.0%) |
| 15 Years | 0 (0.0%) | 4 (100.0%) |
| 16 and 17 Years | 0 (0.0%) | 0 (0.0%) |
| 18 to 24 Years | 4 (100.0%) | 0 (0.0%) |
| 25 to 34 Years | 1 (100.0%) | 40 (100.0%) |
| 35 to 44 Years | 20 (100.0%) | 24 (77.4%) |
| 45 to 54 Years | 18 (75.0%) | 36 (78.3%) |
| 55 to 64 Years | 36 (81.8%) | 35 (81.4%) |
| 65 to 74 Years | 6 (22.2%) | 35 (76.1%) |
| 75 Years and over | 14 (100.0%) | 39 (100.0%) |
| Total | 123 (75.0%) | 228 (83.5%) |
Income Below Poverty Among Married-Couple Families in Fair Bluff
The poverty statistics for married-couple families in Fair Bluff show that 10.3% or 8 of the total 78 families live below the poverty line. Families with no children have the highest poverty rate of 25.0%, comprising of 8 families. On the other hand, families with 1 or 2 children have the lowest poverty rate of 0.0%, which includes 0 families.
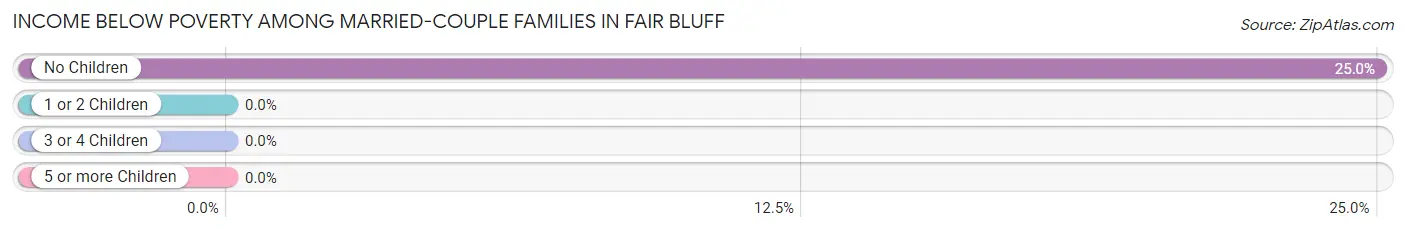
| Children | Above Poverty | Below Poverty |
| No Children | 24 (75.0%) | 8 (25.0%) |
| 1 or 2 Children | 46 (100.0%) | 0 (0.0%) |
| 3 or 4 Children | 0 (0.0%) | 0 (0.0%) |
| 5 or more Children | 0 (0.0%) | 0 (0.0%) |
| Total | 70 (89.7%) | 8 (10.3%) |
Income Below Poverty Among Single-Parent Households in Fair Bluff
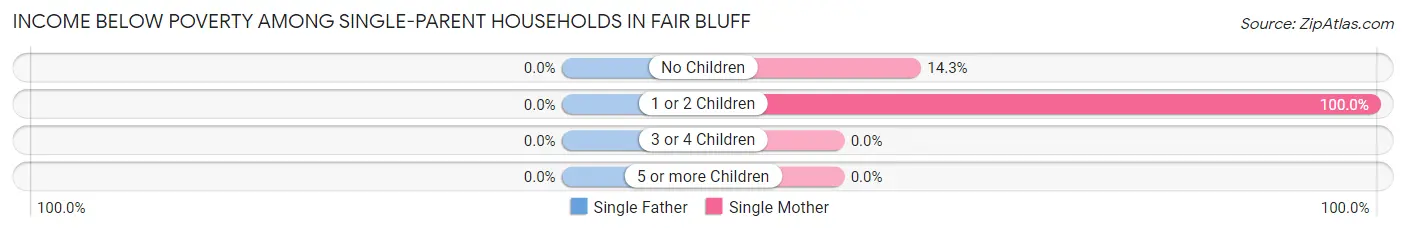
| Children | Single Father | Single Mother |
| No Children | 0 (0.0%) | 3 (14.3%) |
| 1 or 2 Children | 0 (0.0%) | 9 (100.0%) |
| 3 or 4 Children | 0 (0.0%) | 0 (0.0%) |
| 5 or more Children | 0 (0.0%) | 0 (0.0%) |
| Total | 0 (0.0%) | 12 (40.0%) |
Income Below Poverty Among Married-Couple vs Single-Parent Households in Fair Bluff
The poverty data for Fair Bluff shows that 8 of the married-couple family households (10.3%) and 12 of the single-parent households (38.7%) are living below the poverty level. Within the married-couple family households, those with no children have the highest poverty rate, with 8 households (25.0%) falling below the poverty line. Among the single-parent households, those with 1 or 2 children have the highest poverty rate, with 9 household (100.0%) living below poverty.
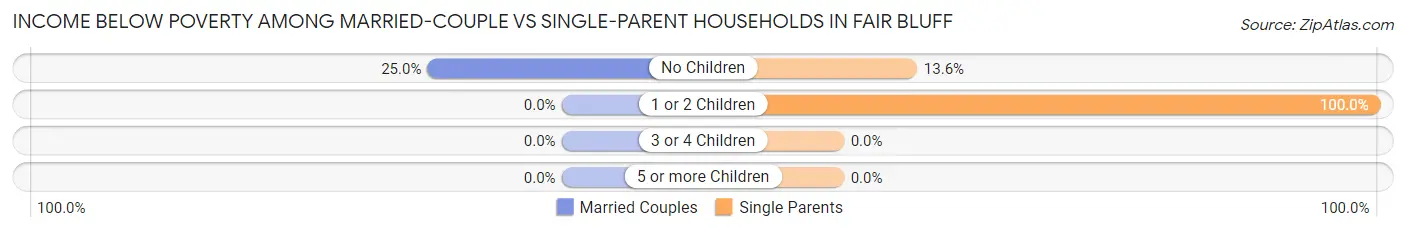
| Children | Married-Couple Families | Single-Parent Households |
| No Children | 8 (25.0%) | 3 (13.6%) |
| 1 or 2 Children | 0 (0.0%) | 9 (100.0%) |
| 3 or 4 Children | 0 (0.0%) | 0 (0.0%) |
| 5 or more Children | 0 (0.0%) | 0 (0.0%) |
| Total | 8 (10.3%) | 12 (38.7%) |
Race in Fair Bluff
The most populous races in Fair Bluff are Black / African American (266 | 60.9%), White / Caucasian (136 | 31.1%), and Native / Alaskan (19 | 4.3%).
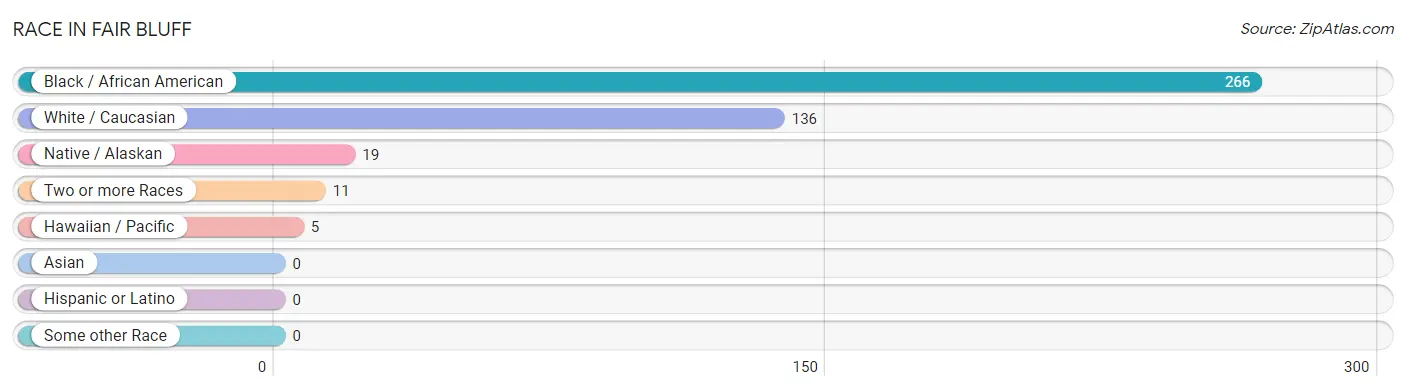
| Race | # Population | % Population |
| Asian | 0 | 0.0% |
| Black / African American | 266 | 60.9% |
| Hawaiian / Pacific | 5 | 1.1% |
| Hispanic or Latino | 0 | 0.0% |
| Native / Alaskan | 19 | 4.3% |
| White / Caucasian | 136 | 31.1% |
| Two or more Races | 11 | 2.5% |
| Some other Race | 0 | 0.0% |
| Total | 437 | 100.0% |
Ancestry in Fair Bluff
The most populous ancestries reported in Fair Bluff are American (22 | 5.0%), Lumbee (18 | 4.1%), Irish (16 | 3.7%), English (13 | 3.0%), and German (9 | 2.1%), together accounting for 17.8% of all Fair Bluff residents.
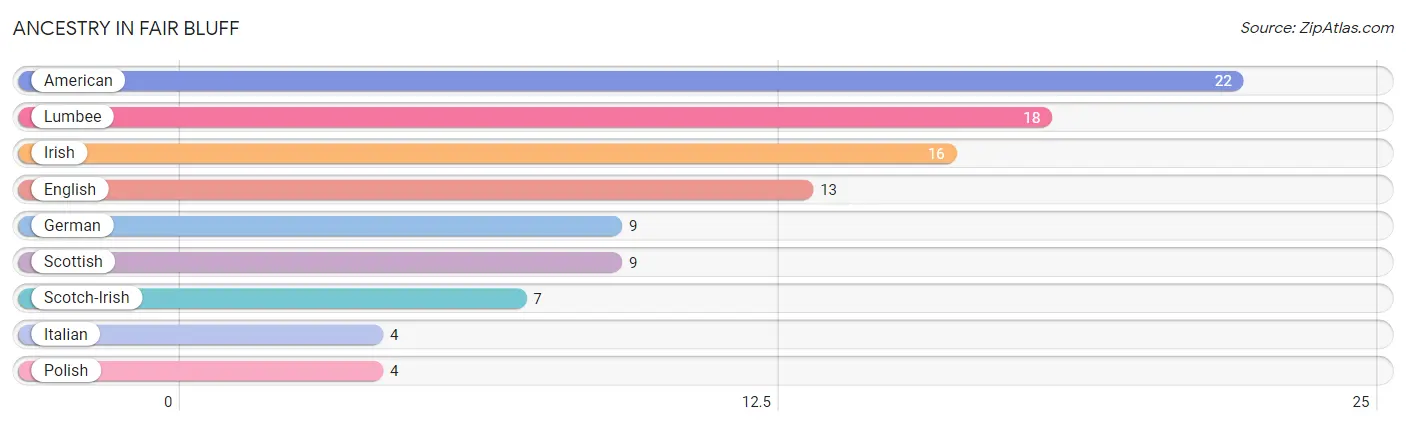
| Ancestry | # Population | % Population |
| American | 22 | 5.0% |
| English | 13 | 3.0% |
| German | 9 | 2.1% |
| Irish | 16 | 3.7% |
| Italian | 4 | 0.9% |
| Lumbee | 18 | 4.1% |
| Polish | 4 | 0.9% |
| Scotch-Irish | 7 | 1.6% |
| Scottish | 9 | 2.1% | View All 9 Rows |
Immigrants in Fair Bluff

| Immigration Origin | # Population | % Population | View All 0 Rows |
Sex and Age in Fair Bluff
Sex and Age in Fair Bluff
The most populous age groups in Fair Bluff are 10 to 14 Years (30 | 18.3%) for men and 25 to 29 Years (40 | 14.6%) for women.
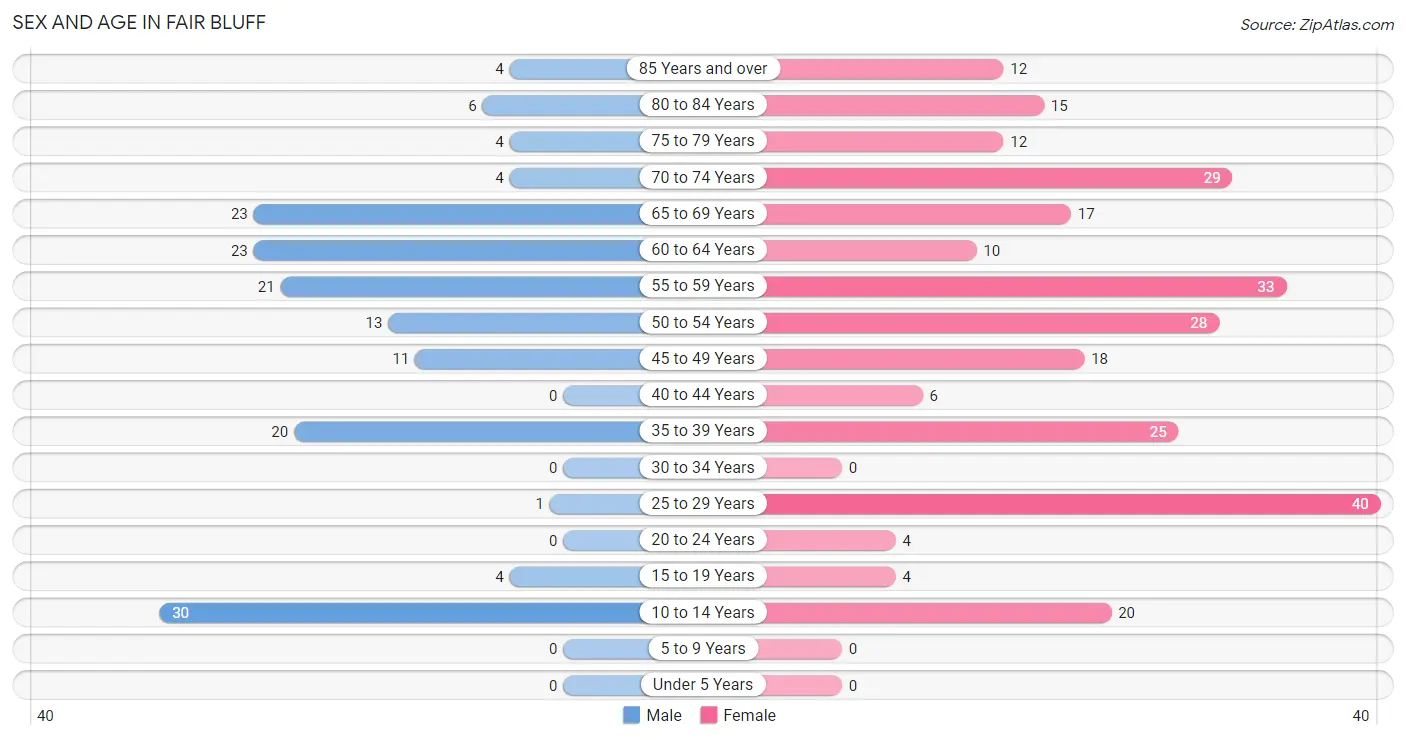
| Age Bracket | Male | Female |
| Under 5 Years | 0 (0.0%) | 0 (0.0%) |
| 5 to 9 Years | 0 (0.0%) | 0 (0.0%) |
| 10 to 14 Years | 30 (18.3%) | 20 (7.3%) |
| 15 to 19 Years | 4 (2.4%) | 4 (1.5%) |
| 20 to 24 Years | 0 (0.0%) | 4 (1.5%) |
| 25 to 29 Years | 1 (0.6%) | 40 (14.6%) |
| 30 to 34 Years | 0 (0.0%) | 0 (0.0%) |
| 35 to 39 Years | 20 (12.2%) | 25 (9.2%) |
| 40 to 44 Years | 0 (0.0%) | 6 (2.2%) |
| 45 to 49 Years | 11 (6.7%) | 18 (6.6%) |
| 50 to 54 Years | 13 (7.9%) | 28 (10.3%) |
| 55 to 59 Years | 21 (12.8%) | 33 (12.1%) |
| 60 to 64 Years | 23 (14.0%) | 10 (3.7%) |
| 65 to 69 Years | 23 (14.0%) | 17 (6.2%) |
| 70 to 74 Years | 4 (2.4%) | 29 (10.6%) |
| 75 to 79 Years | 4 (2.4%) | 12 (4.4%) |
| 80 to 84 Years | 6 (3.7%) | 15 (5.5%) |
| 85 Years and over | 4 (2.4%) | 12 (4.4%) |
| Total | 164 (100.0%) | 273 (100.0%) |
Families and Households in Fair Bluff
Median Family Size in Fair Bluff
The median family size in Fair Bluff is 2.90 persons per family, with single male/father families (1 | 0.9%) accounting for the largest median family size of 4 persons per family. On the other hand, single female/mother families (30 | 27.5%) represent the smallest median family size with 2.77 persons per family.
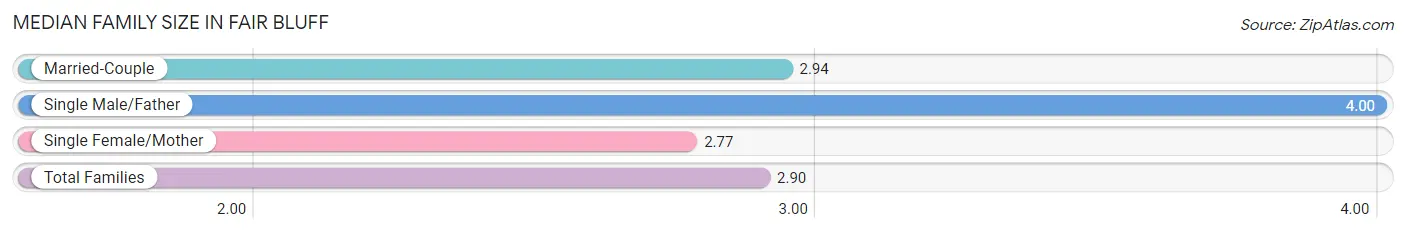
| Family Type | # Families | Family Size |
| Married-Couple | 78 (71.6%) | 2.94 |
| Single Male/Father | 1 (0.9%) | 4.00 |
| Single Female/Mother | 30 (27.5%) | 2.77 |
| Total Families | 109 (100.0%) | 2.90 |
Median Household Size in Fair Bluff
The median household size in Fair Bluff is 1.99 persons per household, with single male/father households (1 | 0.4%) accounting for the largest median household size of 4 persons per household. non-family households (111 | 50.4%) represent the smallest median household size with 1.09 persons per household.
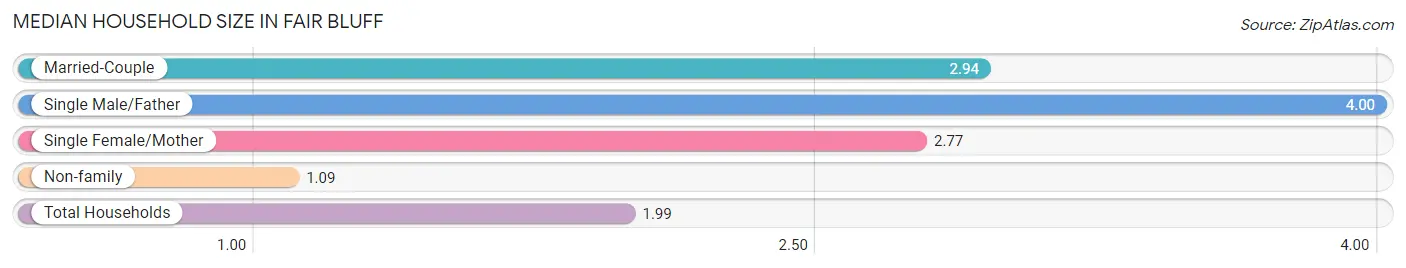
| Household Type | # Households | Household Size |
| Married-Couple | 78 (35.4%) | 2.94 |
| Single Male/Father | 1 (0.4%) | 4.00 |
| Single Female/Mother | 30 (13.6%) | 2.77 |
| Non-family | 111 (50.4%) | 1.09 |
| Total Households | 220 (100.0%) | 1.99 |
Household Size by Marriage Status in Fair Bluff
Out of a total of 220 households in Fair Bluff, 109 (49.5%) are family households, while 111 (50.4%) are nonfamily households. The most numerous type of family households are 2-person households, comprising 61, and the most common type of nonfamily households are 1-person households, comprising 100.
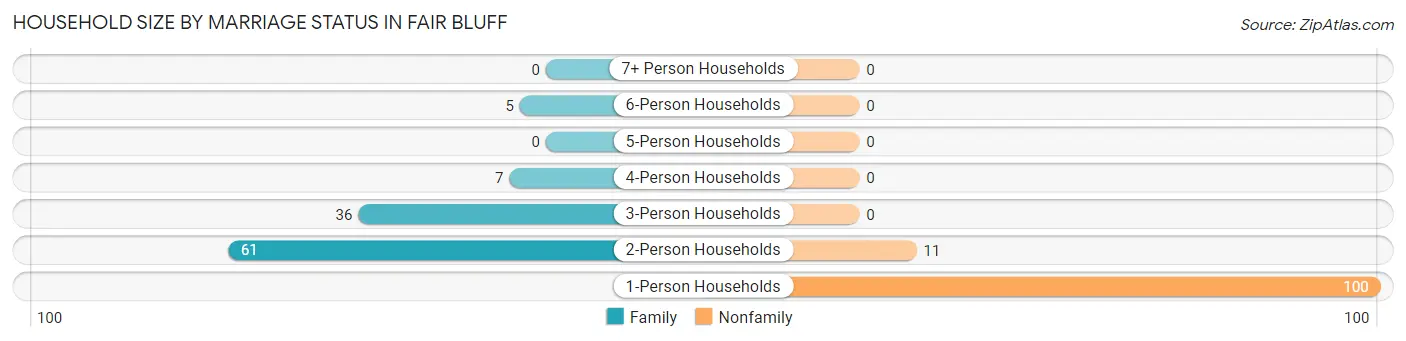
| Household Size | Family Households | Nonfamily Households |
| 1-Person Households | - | 100 (45.5%) |
| 2-Person Households | 61 (27.7%) | 11 (5.0%) |
| 3-Person Households | 36 (16.4%) | 0 (0.0%) |
| 4-Person Households | 7 (3.2%) | 0 (0.0%) |
| 5-Person Households | 0 (0.0%) | 0 (0.0%) |
| 6-Person Households | 5 (2.3%) | 0 (0.0%) |
| 7+ Person Households | 0 (0.0%) | 0 (0.0%) |
| Total | 109 (49.5%) | 111 (50.4%) |
Female Fertility in Fair Bluff
Fertility by Age in Fair Bluff
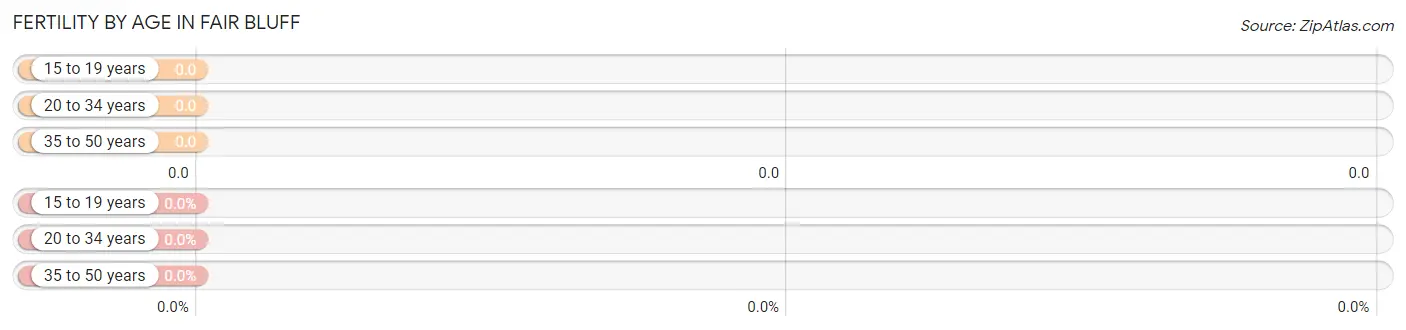
| Age Bracket | Women with Births | Births / 1,000 Women |
| 15 to 19 years | 0 (0.0%) | 0.0 |
| 20 to 34 years | 0 (0.0%) | 0.0 |
| 35 to 50 years | 0 (0.0%) | 0.0 |
| Total | 0 (0.0%) | 0.0 |
Fertility by Age by Marriage Status in Fair Bluff
| Age Bracket | Married | Unmarried |
| 15 to 19 years | 0 (0.0%) | 0 (0.0%) |
| 20 to 34 years | 0 (0.0%) | 0 (0.0%) |
| 35 to 50 years | 0 (0.0%) | 0 (0.0%) |
| Total | 0 (0.0%) | 0 (0.0%) |
Fertility by Education in Fair Bluff
| Educational Attainment | Women with Births | Births / 1,000 Women |
| Less than High School | 0 (0.0%) | 0.0 |
| High School Diploma | 0 (0.0%) | 0.0 |
| College or Associate's Degree | 0 (0.0%) | 0.0 |
| Bachelor's Degree | 0 (0.0%) | 0.0 |
| Graduate Degree | 0 (0.0%) | 0.0 |
| Total | 0 (0.0%) | 0.0 |
Fertility by Education by Marriage Status in Fair Bluff
| Educational Attainment | Married | Unmarried |
| Less than High School | 0 (0.0%) | 0 (0.0%) |
| High School Diploma | 0 (0.0%) | 0 (0.0%) |
| College or Associate's Degree | 0 (0.0%) | 0 (0.0%) |
| Bachelor's Degree | 0 (0.0%) | 0 (0.0%) |
| Graduate Degree | 0 (0.0%) | 0 (0.0%) |
| Total | 0 (0.0%) | 0 (0.0%) |
Employment Characteristics in Fair Bluff
Employment by Class of Employer in Fair Bluff
Among the 172 employed individuals in Fair Bluff, private company employees (107 | 62.2%), state government employees (21 | 12.2%), and not-for-profit organizations (18 | 10.5%) make up the most common classes of employment.
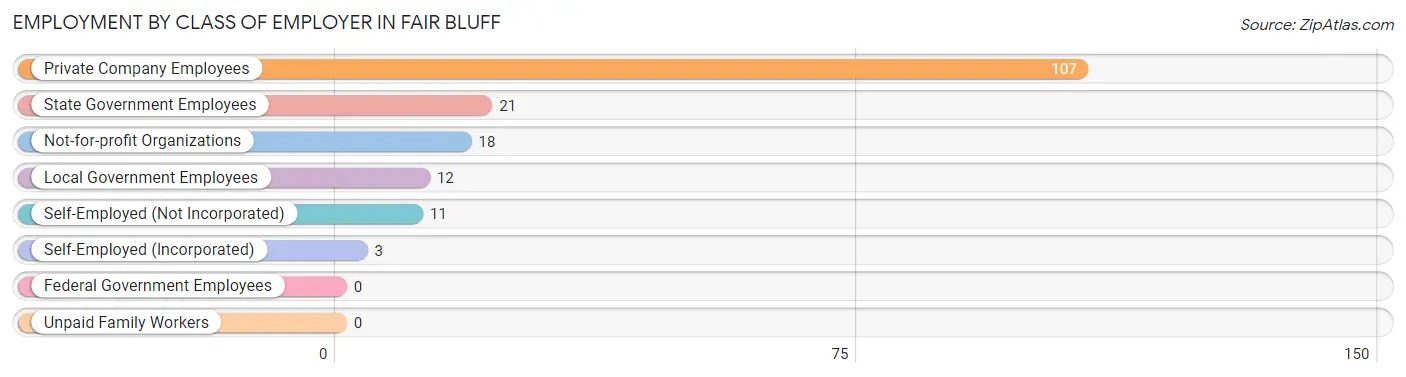
| Employer Class | # Employees | % Employees |
| Private Company Employees | 107 | 62.2% |
| Self-Employed (Incorporated) | 3 | 1.7% |
| Self-Employed (Not Incorporated) | 11 | 6.4% |
| Not-for-profit Organizations | 18 | 10.5% |
| Local Government Employees | 12 | 7.0% |
| State Government Employees | 21 | 12.2% |
| Federal Government Employees | 0 | 0.0% |
| Unpaid Family Workers | 0 | 0.0% |
| Total | 172 | 100.0% |
Employment Status by Age in Fair Bluff
According to the labor force statistics for Fair Bluff, out of the total population over 16 years of age (383), 47.8% or 183 individuals are in the labor force, with 3.8% or 7 of them unemployed. The age group with the highest labor force participation rate is 16 to 19 years, with 100.0% or 4 individuals in the labor force. Within the labor force, the 35 to 44 years age range has the highest percentage of unemployed individuals, with 9.5% or 4 of them being unemployed.
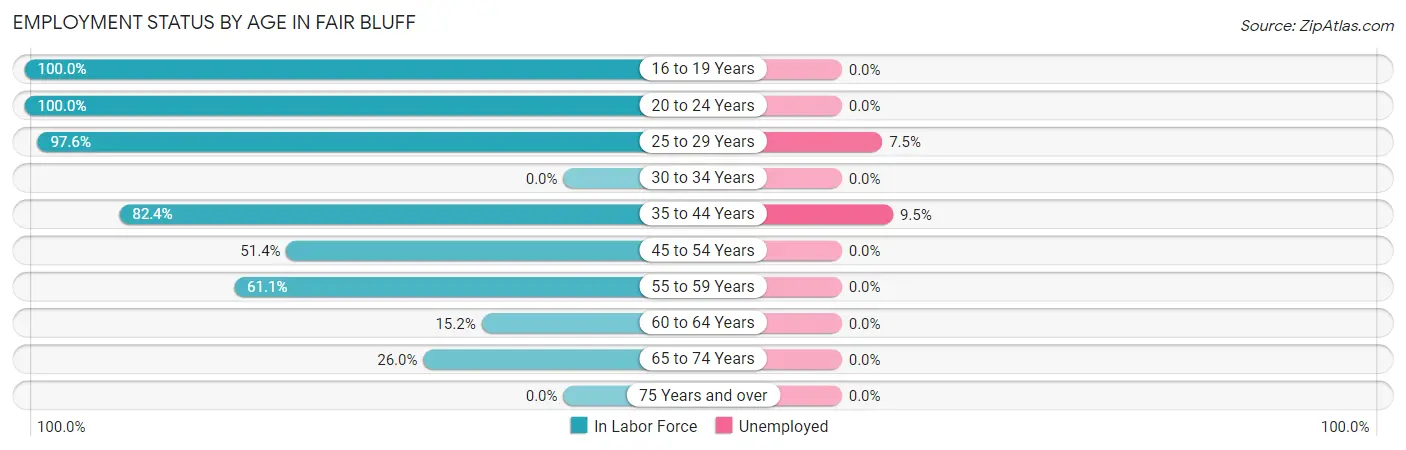
| Age Bracket | In Labor Force | Unemployed |
| 16 to 19 Years | 4 (100.0%) | 0 (0.0%) |
| 20 to 24 Years | 4 (100.0%) | 0 (0.0%) |
| 25 to 29 Years | 40 (97.6%) | 3 (7.5%) |
| 30 to 34 Years | 0 (0.0%) | 0 (0.0%) |
| 35 to 44 Years | 42 (82.4%) | 4 (9.5%) |
| 45 to 54 Years | 36 (51.4%) | 0 (0.0%) |
| 55 to 59 Years | 33 (61.1%) | 0 (0.0%) |
| 60 to 64 Years | 5 (15.2%) | 0 (0.0%) |
| 65 to 74 Years | 19 (26.0%) | 0 (0.0%) |
| 75 Years and over | 0 (0.0%) | 0 (0.0%) |
| Total | 183 (47.8%) | 7 (3.8%) |
Employment Status by Educational Attainment in Fair Bluff
According to labor force statistics for Fair Bluff, 62.7% of individuals (156) out of the total population between 25 and 64 years of age (249) are in the labor force, with 4.5% or 7 of them being unemployed. The group with the highest labor force participation rate are those with the educational attainment of high school diploma, with 66.0% or 62 individuals in the labor force. Within the labor force, individuals with high school diploma education have the highest percentage of unemployment, with 11.3% or 7 of them being unemployed.
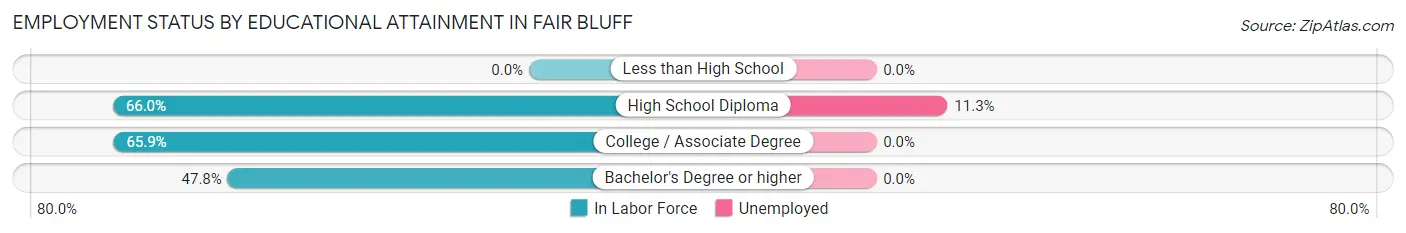
| Educational Attainment | In Labor Force | Unemployed |
| Less than High School | 0 (0.0%) | 0 (0.0%) |
| High School Diploma | 62 (66.0%) | 11 (11.3%) |
| College / Associate Degree | 83 (65.9%) | 0 (0.0%) |
| Bachelor's Degree or higher | 11 (47.8%) | 0 (0.0%) |
| Total | 156 (62.7%) | 11 (4.5%) |
Employment Occupations by Sex in Fair Bluff
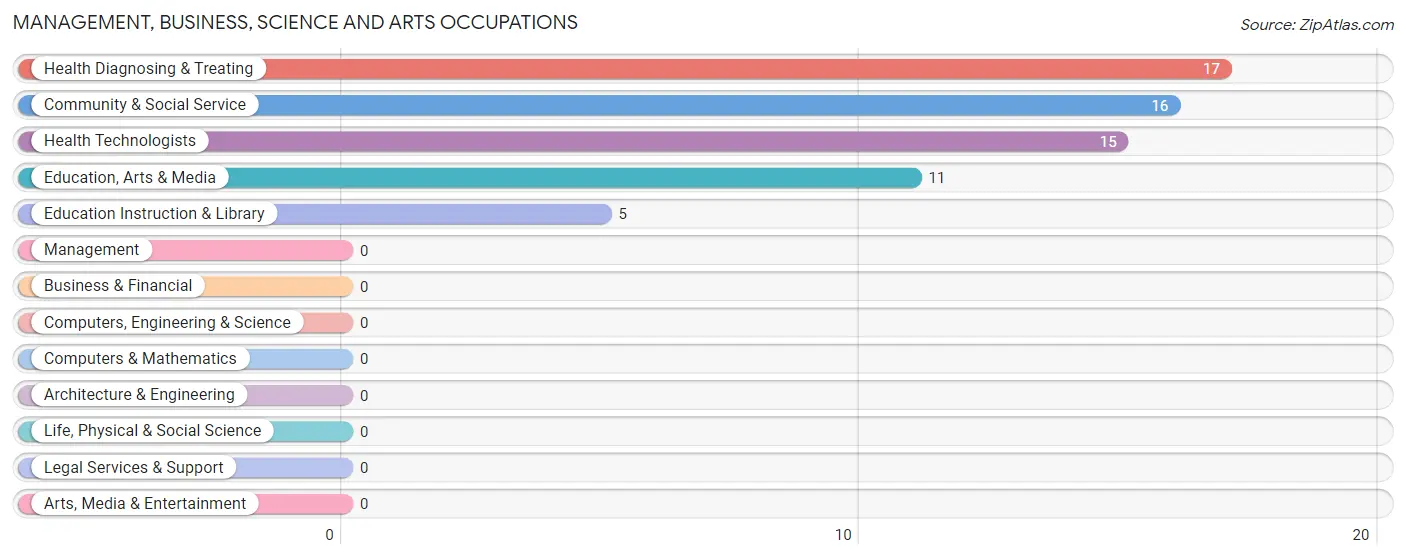
Management, Business, Science and Arts Occupations
The most common Management, Business, Science and Arts occupations in Fair Bluff are Health Diagnosing & Treating (17 | 9.7%), Community & Social Service (16 | 9.1%), Health Technologists (15 | 8.5%), Education, Arts & Media (11 | 6.2%), and Education Instruction & Library (5 | 2.8%).
Management, Business, Science and Arts Occupations by Sex
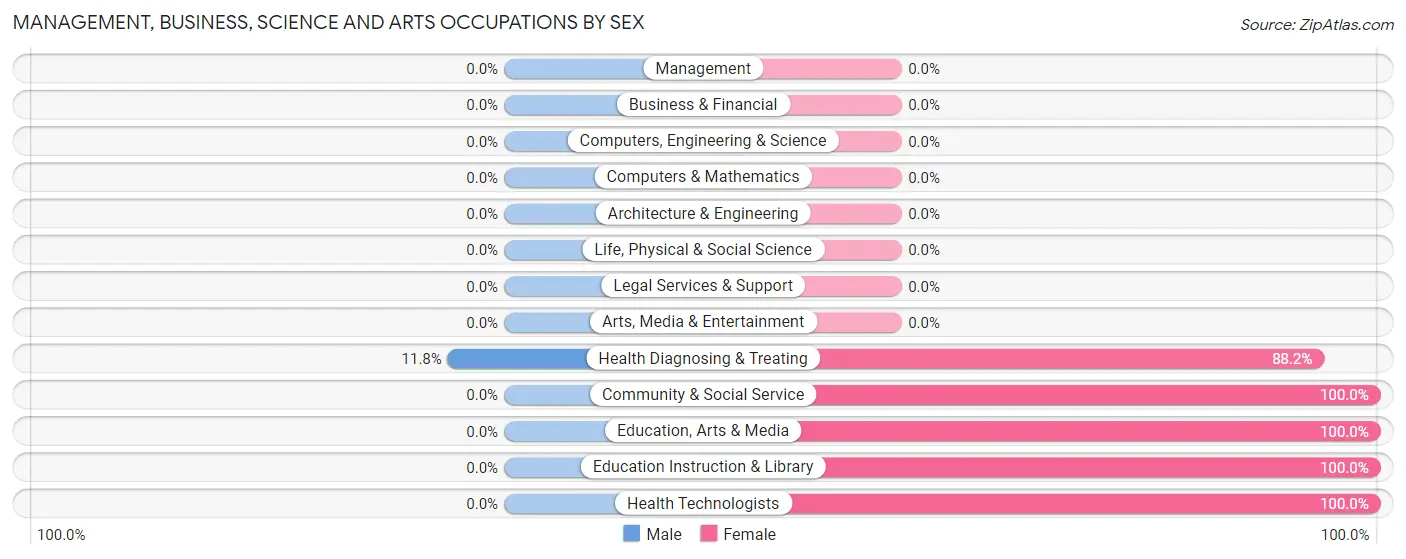
| Occupation | Male | Female |
| Management | 0 (0.0%) | 0 (0.0%) |
| Business & Financial | 0 (0.0%) | 0 (0.0%) |
| Computers, Engineering & Science | 0 (0.0%) | 0 (0.0%) |
| Computers & Mathematics | 0 (0.0%) | 0 (0.0%) |
| Architecture & Engineering | 0 (0.0%) | 0 (0.0%) |
| Life, Physical & Social Science | 0 (0.0%) | 0 (0.0%) |
| Community & Social Service | 0 (0.0%) | 16 (100.0%) |
| Education, Arts & Media | 0 (0.0%) | 11 (100.0%) |
| Legal Services & Support | 0 (0.0%) | 0 (0.0%) |
| Education Instruction & Library | 0 (0.0%) | 5 (100.0%) |
| Arts, Media & Entertainment | 0 (0.0%) | 0 (0.0%) |
| Health Diagnosing & Treating | 2 (11.8%) | 15 (88.2%) |
| Health Technologists | 0 (0.0%) | 15 (100.0%) |
| Total (Category) | 2 (6.1%) | 31 (93.9%) |
| Total (Overall) | 57 (32.4%) | 119 (67.6%) |
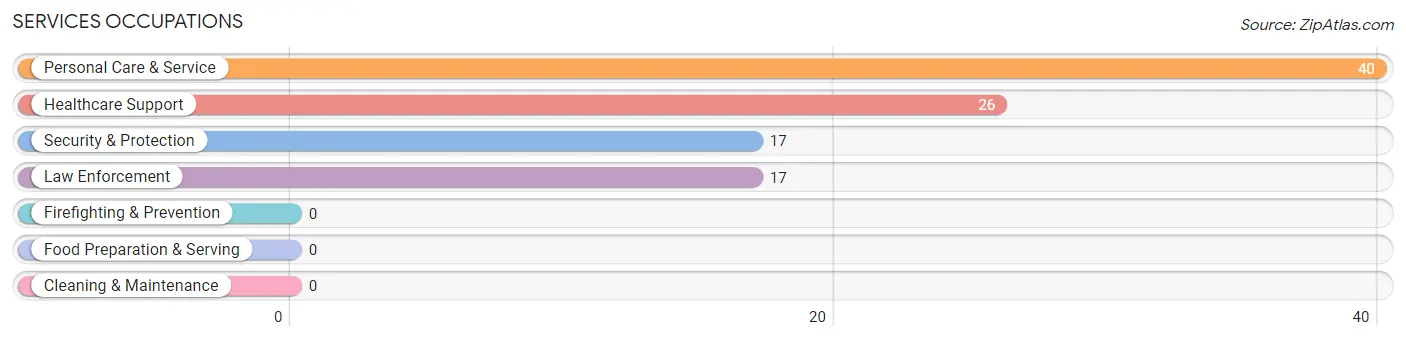
Services Occupations
The most common Services occupations in Fair Bluff are Personal Care & Service (40 | 22.7%), Healthcare Support (26 | 14.8%), Security & Protection (17 | 9.7%), and Law Enforcement (17 | 9.7%).
Services Occupations by Sex
Within the Services occupations in Fair Bluff, the most male-oriented occupations are Security & Protection (100.0%), and Law Enforcement (100.0%), while the most female-oriented occupations are Healthcare Support (100.0%), and Personal Care & Service (100.0%).
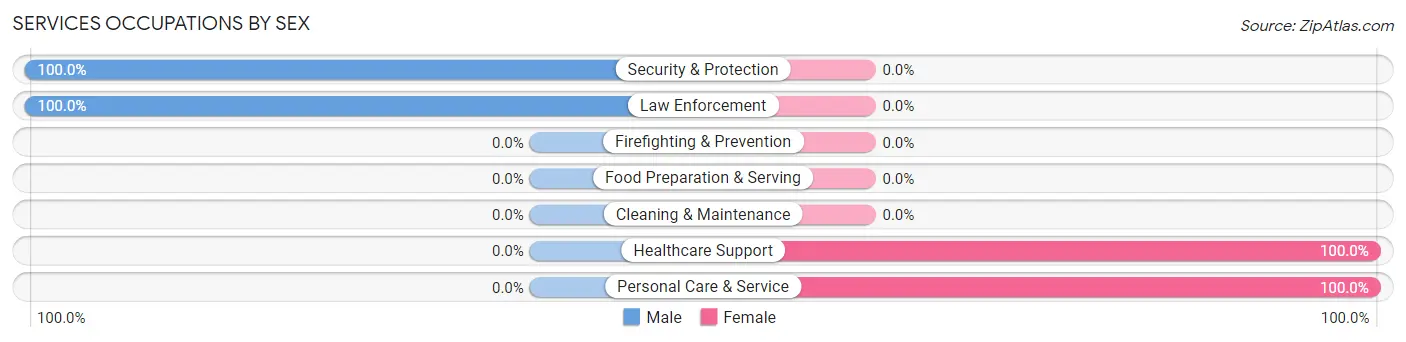
| Occupation | Male | Female |
| Healthcare Support | 0 (0.0%) | 26 (100.0%) |
| Security & Protection | 17 (100.0%) | 0 (0.0%) |
| Firefighting & Prevention | 0 (0.0%) | 0 (0.0%) |
| Law Enforcement | 17 (100.0%) | 0 (0.0%) |
| Food Preparation & Serving | 0 (0.0%) | 0 (0.0%) |
| Cleaning & Maintenance | 0 (0.0%) | 0 (0.0%) |
| Personal Care & Service | 0 (0.0%) | 40 (100.0%) |
| Total (Category) | 17 (20.5%) | 66 (79.5%) |
| Total (Overall) | 57 (32.4%) | 119 (67.6%) |
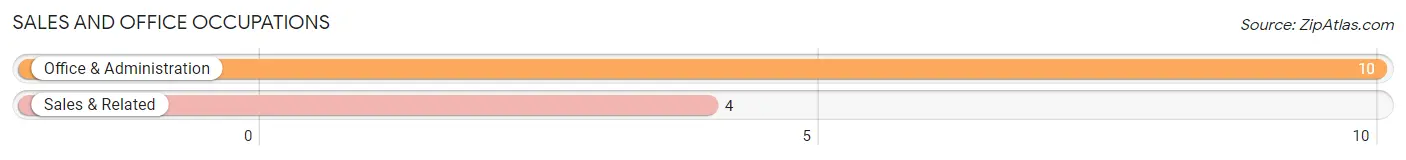
Sales and Office Occupations
The most common Sales and Office occupations in Fair Bluff are Office & Administration (10 | 5.7%), and Sales & Related (4 | 2.3%).
Sales and Office Occupations by Sex
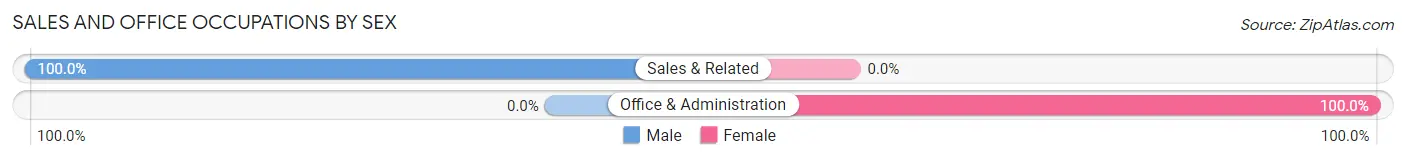
| Occupation | Male | Female |
| Sales & Related | 4 (100.0%) | 0 (0.0%) |
| Office & Administration | 0 (0.0%) | 10 (100.0%) |
| Total (Category) | 4 (28.6%) | 10 (71.4%) |
| Total (Overall) | 57 (32.4%) | 119 (67.6%) |
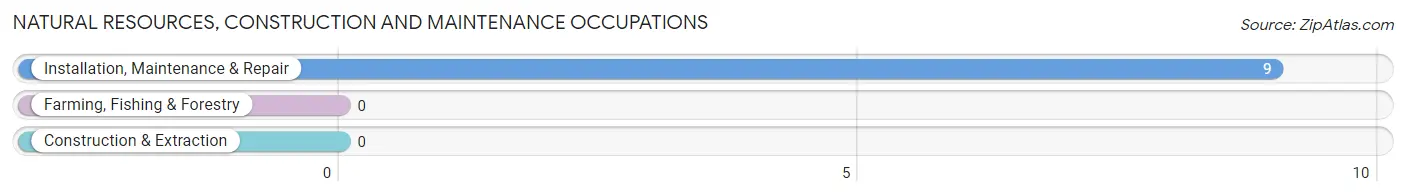
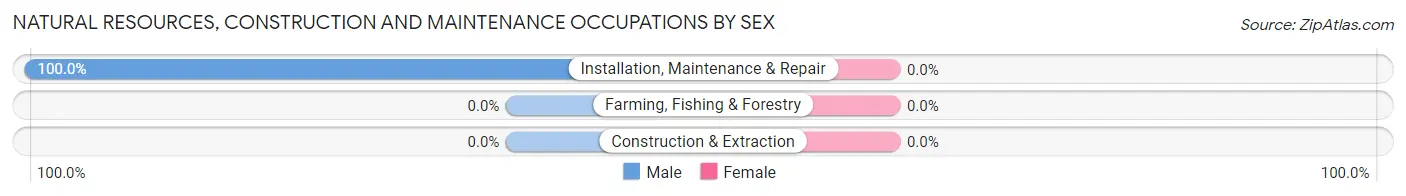
Natural Resources, Construction and Maintenance Occupations
The most common Natural Resources, Construction and Maintenance occupations in Fair Bluff are , and Installation, Maintenance & Repair (9 | 5.1%).
Natural Resources, Construction and Maintenance Occupations by Sex
| Occupation | Male | Female |
| Farming, Fishing & Forestry | 0 (0.0%) | 0 (0.0%) |
| Construction & Extraction | 0 (0.0%) | 0 (0.0%) |
| Installation, Maintenance & Repair | 9 (100.0%) | 0 (0.0%) |
| Total (Category) | 9 (100.0%) | 0 (0.0%) |
| Total (Overall) | 57 (32.4%) | 119 (67.6%) |
Production, Transportation and Moving Occupations
The most common Production, Transportation and Moving occupations in Fair Bluff are Transportation (16 | 9.1%), Material Moving (11 | 6.2%), and Production (10 | 5.7%).
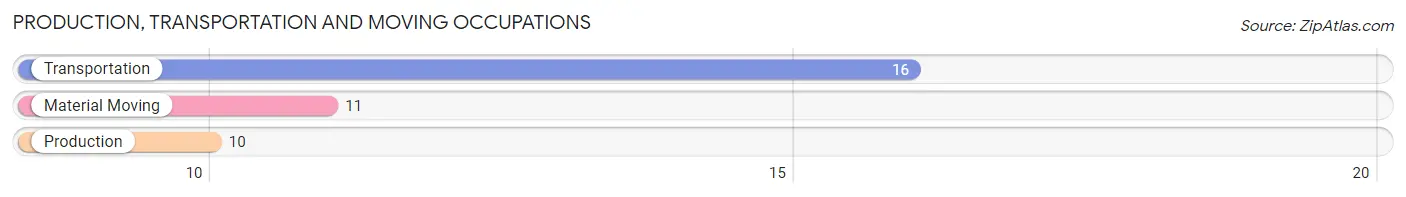
Production, Transportation and Moving Occupations by Sex
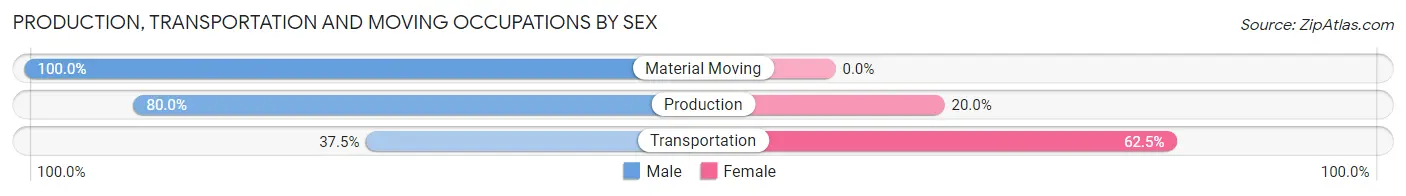
| Occupation | Male | Female |
| Production | 8 (80.0%) | 2 (20.0%) |
| Transportation | 6 (37.5%) | 10 (62.5%) |
| Material Moving | 11 (100.0%) | 0 (0.0%) |
| Total (Category) | 25 (67.6%) | 12 (32.4%) |
| Total (Overall) | 57 (32.4%) | 119 (67.6%) |
Employment Industries by Sex in Fair Bluff
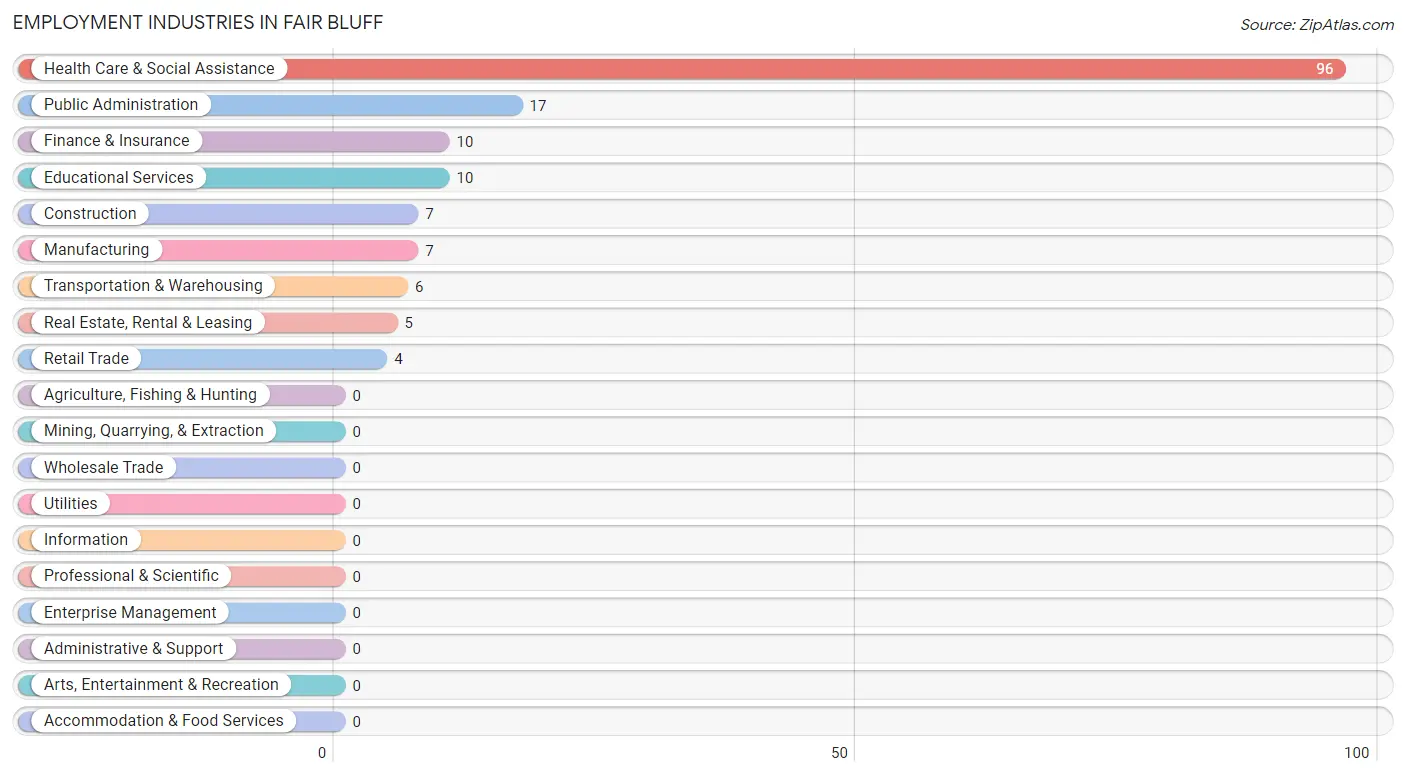
Employment Industries in Fair Bluff
The major employment industries in Fair Bluff include Health Care & Social Assistance (96 | 54.5%), Public Administration (17 | 9.7%), Finance & Insurance (10 | 5.7%), Educational Services (10 | 5.7%), and Construction (7 | 4.0%).
Employment Industries by Sex in Fair Bluff
The Fair Bluff industries that see more men than women are Construction (100.0%), Retail Trade (100.0%), and Transportation & Warehousing (100.0%), whereas the industries that tend to have a higher number of women are Finance & Insurance (100.0%), Educational Services (100.0%), and Health Care & Social Assistance (97.9%).
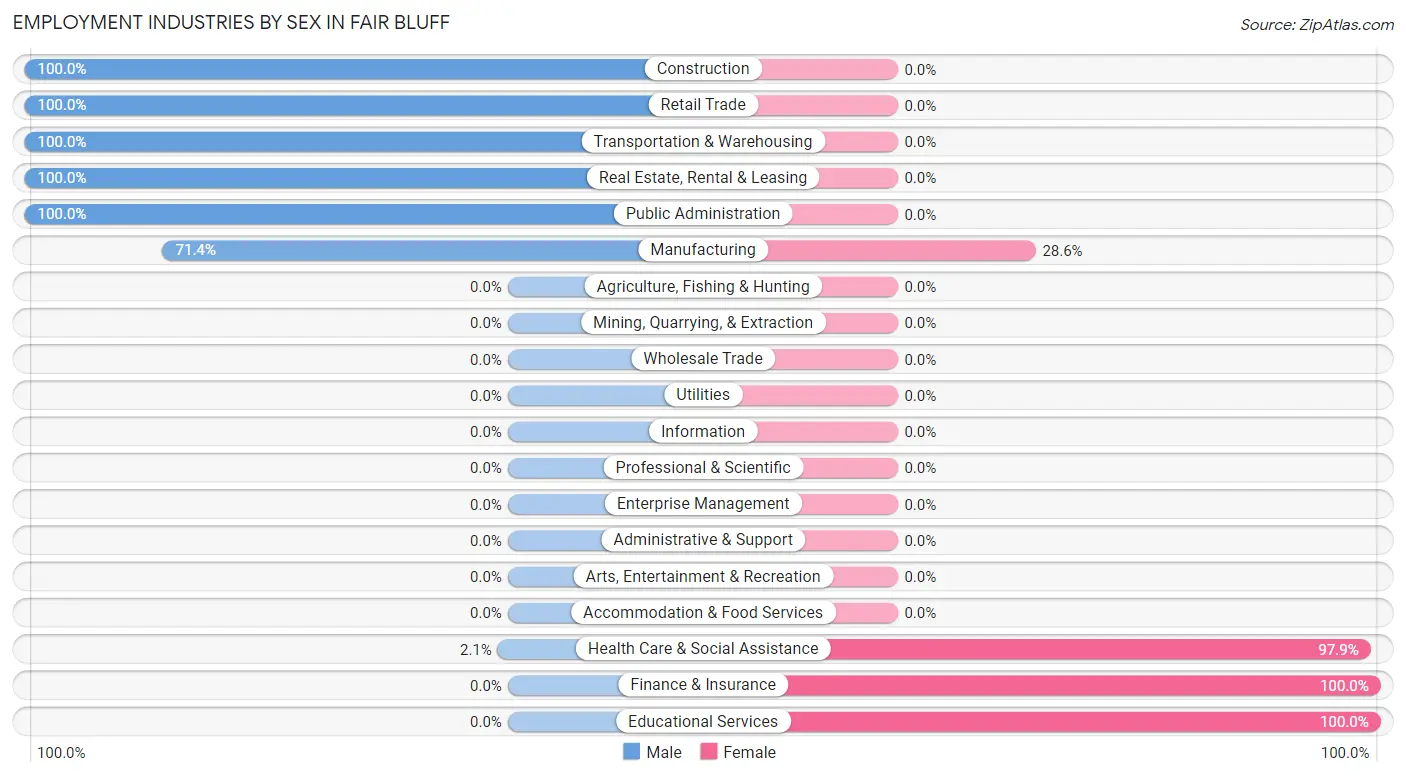
| Industry | Male | Female |
| Agriculture, Fishing & Hunting | 0 (0.0%) | 0 (0.0%) |
| Mining, Quarrying, & Extraction | 0 (0.0%) | 0 (0.0%) |
| Construction | 7 (100.0%) | 0 (0.0%) |
| Manufacturing | 5 (71.4%) | 2 (28.6%) |
| Wholesale Trade | 0 (0.0%) | 0 (0.0%) |
| Retail Trade | 4 (100.0%) | 0 (0.0%) |
| Transportation & Warehousing | 6 (100.0%) | 0 (0.0%) |
| Utilities | 0 (0.0%) | 0 (0.0%) |
| Information | 0 (0.0%) | 0 (0.0%) |
| Finance & Insurance | 0 (0.0%) | 10 (100.0%) |
| Real Estate, Rental & Leasing | 5 (100.0%) | 0 (0.0%) |
| Professional & Scientific | 0 (0.0%) | 0 (0.0%) |
| Enterprise Management | 0 (0.0%) | 0 (0.0%) |
| Administrative & Support | 0 (0.0%) | 0 (0.0%) |
| Educational Services | 0 (0.0%) | 10 (100.0%) |
| Health Care & Social Assistance | 2 (2.1%) | 94 (97.9%) |
| Arts, Entertainment & Recreation | 0 (0.0%) | 0 (0.0%) |
| Accommodation & Food Services | 0 (0.0%) | 0 (0.0%) |
| Public Administration | 17 (100.0%) | 0 (0.0%) |
| Total | 57 (32.4%) | 119 (67.6%) |
Education in Fair Bluff
School Enrollment in Fair Bluff
The most common levels of schooling among the 58 students in Fair Bluff are middle school (50 | 86.2%), high school (4 | 6.9%), and college / undergraduate (4 | 6.9%).
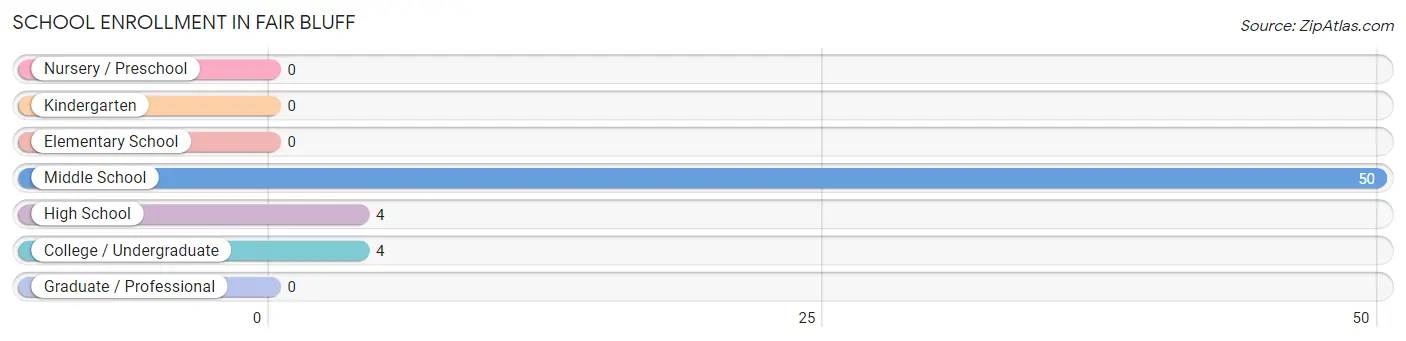
| School Level | # Students | % Students |
| Nursery / Preschool | 0 | 0.0% |
| Kindergarten | 0 | 0.0% |
| Elementary School | 0 | 0.0% |
| Middle School | 50 | 86.2% |
| High School | 4 | 6.9% |
| College / Undergraduate | 4 | 6.9% |
| Graduate / Professional | 0 | 0.0% |
| Total | 58 | 100.0% |
School Enrollment by Age by Funding Source in Fair Bluff
Out of a total of 58 students who are enrolled in schools in Fair Bluff, 4 (6.9%) attend a private institution, while the remaining 54 (93.1%) are enrolled in public schools. The age group of 15 to 17 year olds has the highest likelihood of being enrolled in private schools, with 4 (100.0% in the age bracket) enrolled. Conversely, the age group of 10 to 14 year olds has the lowest likelihood of being enrolled in a private school, with 50 (100.0% in the age bracket) attending a public institution.
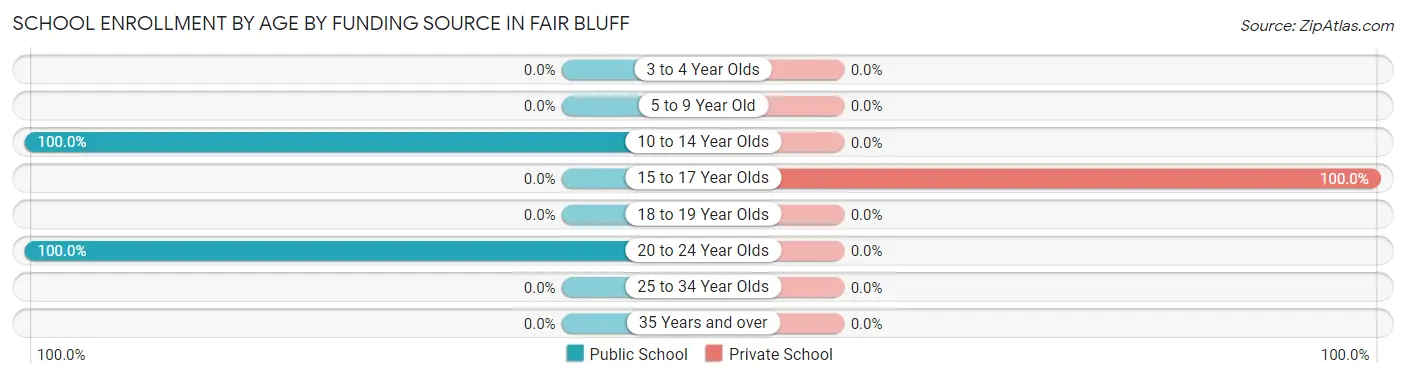
| Age Bracket | Public School | Private School |
| 3 to 4 Year Olds | 0 (0.0%) | 0 (0.0%) |
| 5 to 9 Year Old | 0 (0.0%) | 0 (0.0%) |
| 10 to 14 Year Olds | 50 (100.0%) | 0 (0.0%) |
| 15 to 17 Year Olds | 0 (0.0%) | 4 (100.0%) |
| 18 to 19 Year Olds | 0 (0.0%) | 0 (0.0%) |
| 20 to 24 Year Olds | 4 (100.0%) | 0 (0.0%) |
| 25 to 34 Year Olds | 0 (0.0%) | 0 (0.0%) |
| 35 Years and over | 0 (0.0%) | 0 (0.0%) |
| Total | 54 (93.1%) | 4 (6.9%) |
Educational Attainment by Field of Study in Fair Bluff
Psychology (12 | 41.4%), arts & humanities (11 | 37.9%), and education (6 | 20.7%) are the most common fields of study among 29 individuals in Fair Bluff who have obtained a bachelor's degree or higher.
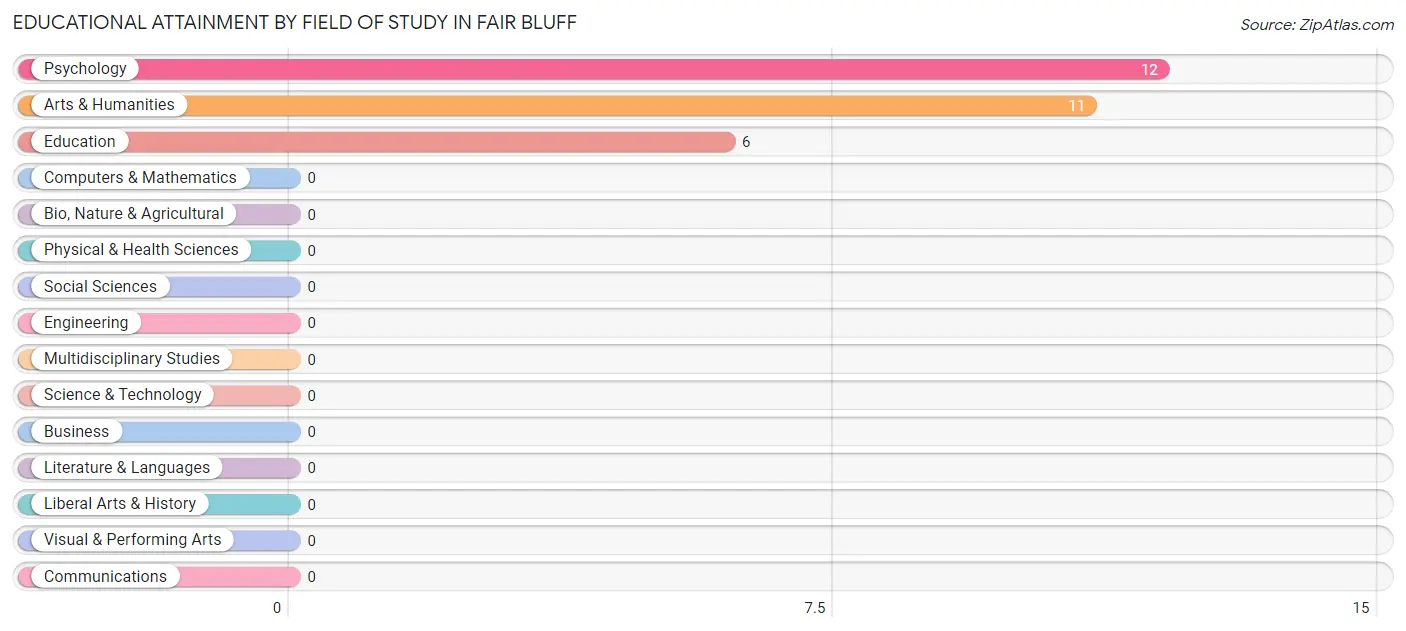
| Field of Study | # Graduates | % Graduates |
| Computers & Mathematics | 0 | 0.0% |
| Bio, Nature & Agricultural | 0 | 0.0% |
| Physical & Health Sciences | 0 | 0.0% |
| Psychology | 12 | 41.4% |
| Social Sciences | 0 | 0.0% |
| Engineering | 0 | 0.0% |
| Multidisciplinary Studies | 0 | 0.0% |
| Science & Technology | 0 | 0.0% |
| Business | 0 | 0.0% |
| Education | 6 | 20.7% |
| Literature & Languages | 0 | 0.0% |
| Liberal Arts & History | 0 | 0.0% |
| Visual & Performing Arts | 0 | 0.0% |
| Communications | 0 | 0.0% |
| Arts & Humanities | 11 | 37.9% |
| Total | 29 | 100.0% |
Transportation & Commute in Fair Bluff
Vehicle Availability by Sex in Fair Bluff
The most prevalent vehicle ownership categories in Fair Bluff are males with 2 vehicles (19, accounting for 33.3%) and females with 2 vehicles (23, making up 16.5%).
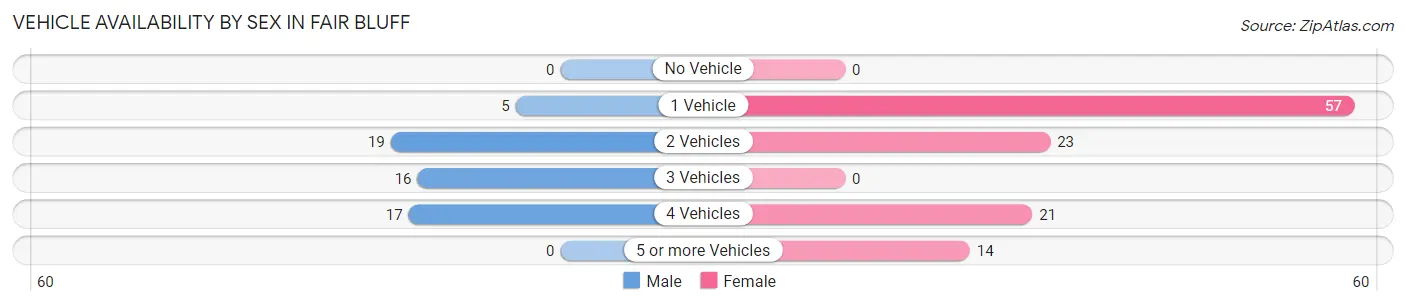
| Vehicles Available | Male | Female |
| No Vehicle | 0 (0.0%) | 0 (0.0%) |
| 1 Vehicle | 5 (8.8%) | 57 (49.6%) |
| 2 Vehicles | 19 (33.3%) | 23 (20.0%) |
| 3 Vehicles | 16 (28.1%) | 0 (0.0%) |
| 4 Vehicles | 17 (29.8%) | 21 (18.3%) |
| 5 or more Vehicles | 0 (0.0%) | 14 (12.2%) |
| Total | 57 (100.0%) | 115 (100.0%) |
Commute Time in Fair Bluff
The most frequently occuring commute durations in Fair Bluff are 15 to 19 minutes (48 commuters, 27.9%), 20 to 24 minutes (45 commuters, 26.2%), and 40 to 44 minutes (41 commuters, 23.8%).
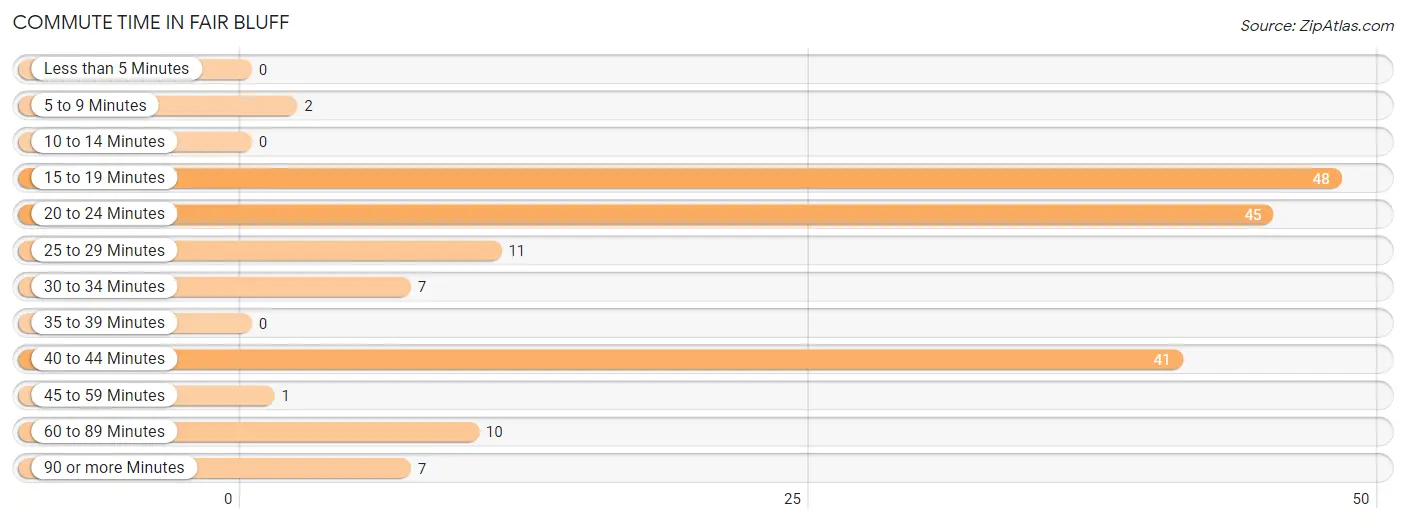
| Commute Time | # Commuters | % Commuters |
| Less than 5 Minutes | 0 | 0.0% |
| 5 to 9 Minutes | 2 | 1.2% |
| 10 to 14 Minutes | 0 | 0.0% |
| 15 to 19 Minutes | 48 | 27.9% |
| 20 to 24 Minutes | 45 | 26.2% |
| 25 to 29 Minutes | 11 | 6.4% |
| 30 to 34 Minutes | 7 | 4.1% |
| 35 to 39 Minutes | 0 | 0.0% |
| 40 to 44 Minutes | 41 | 23.8% |
| 45 to 59 Minutes | 1 | 0.6% |
| 60 to 89 Minutes | 10 | 5.8% |
| 90 or more Minutes | 7 | 4.1% |
Commute Time by Sex in Fair Bluff
The most common commute times in Fair Bluff are 40 to 44 minutes (23 commuters, 40.4%) for males and 15 to 19 minutes (44 commuters, 38.3%) for females.
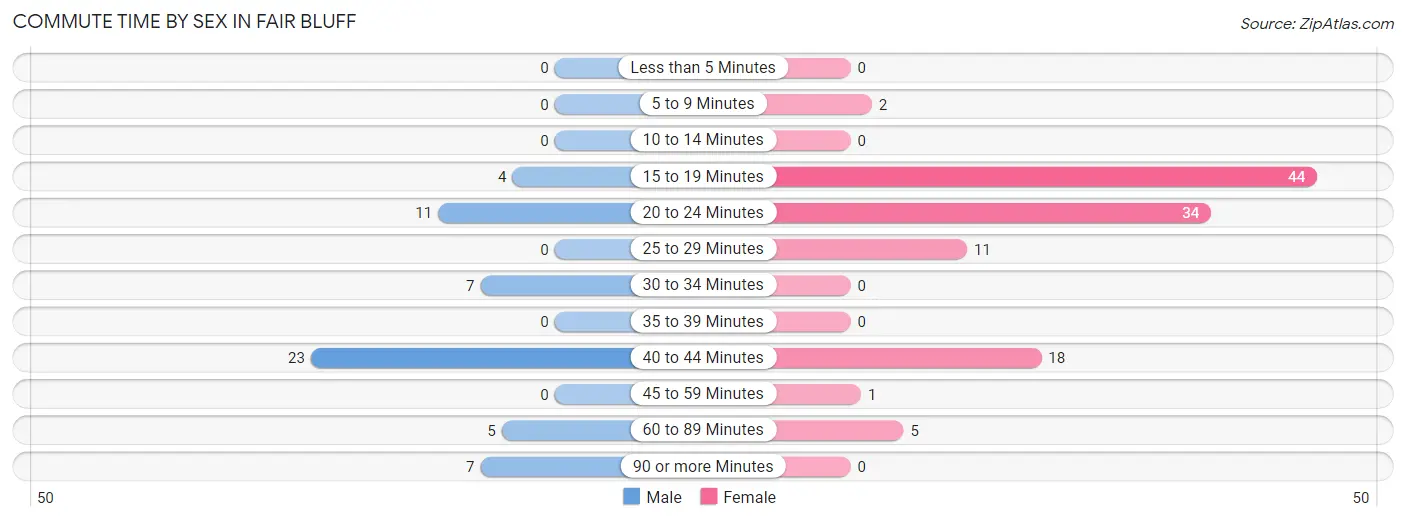
| Commute Time | Male | Female |
| Less than 5 Minutes | 0 (0.0%) | 0 (0.0%) |
| 5 to 9 Minutes | 0 (0.0%) | 2 (1.7%) |
| 10 to 14 Minutes | 0 (0.0%) | 0 (0.0%) |
| 15 to 19 Minutes | 4 (7.0%) | 44 (38.3%) |
| 20 to 24 Minutes | 11 (19.3%) | 34 (29.6%) |
| 25 to 29 Minutes | 0 (0.0%) | 11 (9.6%) |
| 30 to 34 Minutes | 7 (12.3%) | 0 (0.0%) |
| 35 to 39 Minutes | 0 (0.0%) | 0 (0.0%) |
| 40 to 44 Minutes | 23 (40.4%) | 18 (15.7%) |
| 45 to 59 Minutes | 0 (0.0%) | 1 (0.9%) |
| 60 to 89 Minutes | 5 (8.8%) | 5 (4.3%) |
| 90 or more Minutes | 7 (12.3%) | 0 (0.0%) |
Time of Departure to Work by Sex in Fair Bluff
The most frequent times of departure to work in Fair Bluff are 5:00 AM to 5:29 AM (17, 29.8%) for males and 7:30 AM to 7:59 AM (41, 35.6%) for females.
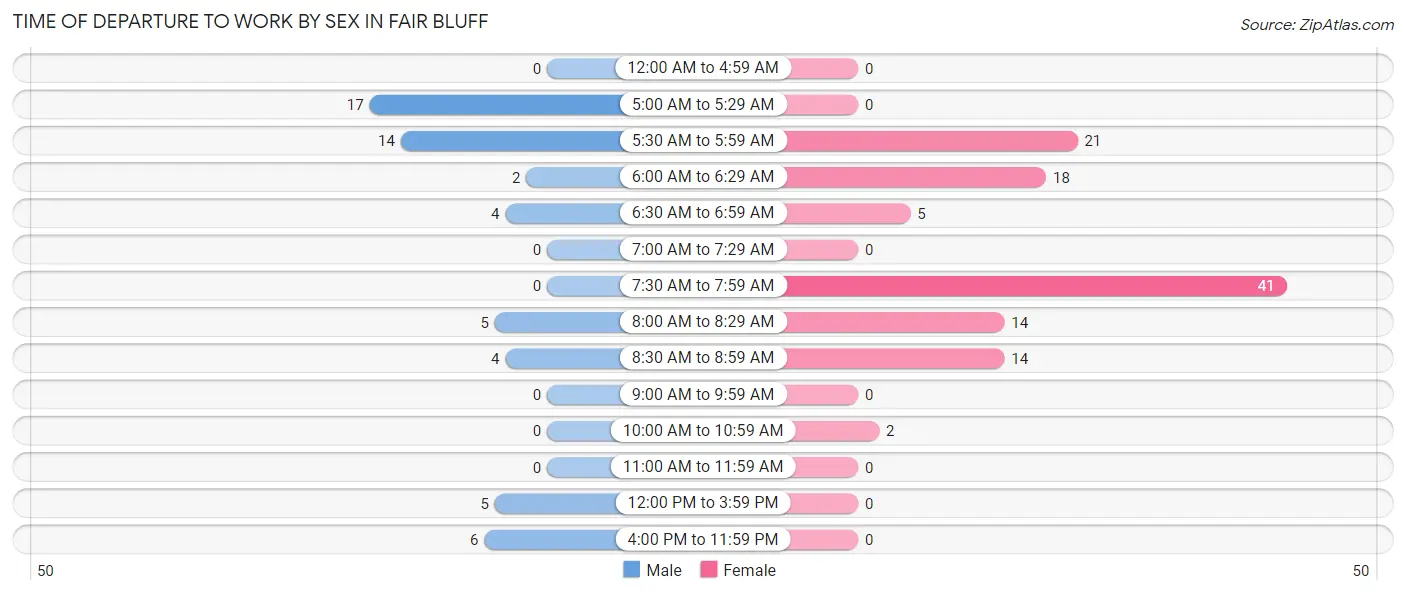
| Time of Departure | Male | Female |
| 12:00 AM to 4:59 AM | 0 (0.0%) | 0 (0.0%) |
| 5:00 AM to 5:29 AM | 17 (29.8%) | 0 (0.0%) |
| 5:30 AM to 5:59 AM | 14 (24.6%) | 21 (18.3%) |
| 6:00 AM to 6:29 AM | 2 (3.5%) | 18 (15.7%) |
| 6:30 AM to 6:59 AM | 4 (7.0%) | 5 (4.3%) |
| 7:00 AM to 7:29 AM | 0 (0.0%) | 0 (0.0%) |
| 7:30 AM to 7:59 AM | 0 (0.0%) | 41 (35.6%) |
| 8:00 AM to 8:29 AM | 5 (8.8%) | 14 (12.2%) |
| 8:30 AM to 8:59 AM | 4 (7.0%) | 14 (12.2%) |
| 9:00 AM to 9:59 AM | 0 (0.0%) | 0 (0.0%) |
| 10:00 AM to 10:59 AM | 0 (0.0%) | 2 (1.7%) |
| 11:00 AM to 11:59 AM | 0 (0.0%) | 0 (0.0%) |
| 12:00 PM to 3:59 PM | 5 (8.8%) | 0 (0.0%) |
| 4:00 PM to 11:59 PM | 6 (10.5%) | 0 (0.0%) |
| Total | 57 (100.0%) | 115 (100.0%) |
Housing Occupancy in Fair Bluff
Occupancy by Ownership in Fair Bluff
Of the total 220 dwellings in Fair Bluff, owner-occupied units account for 169 (76.8%), while renter-occupied units make up 51 (23.2%).
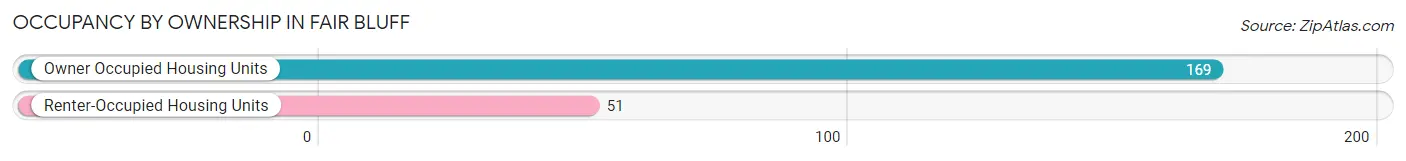
| Occupancy | # Housing Units | % Housing Units |
| Owner Occupied Housing Units | 169 | 76.8% |
| Renter-Occupied Housing Units | 51 | 23.2% |
| Total Occupied Housing Units | 220 | 100.0% |
Occupancy by Household Size in Fair Bluff
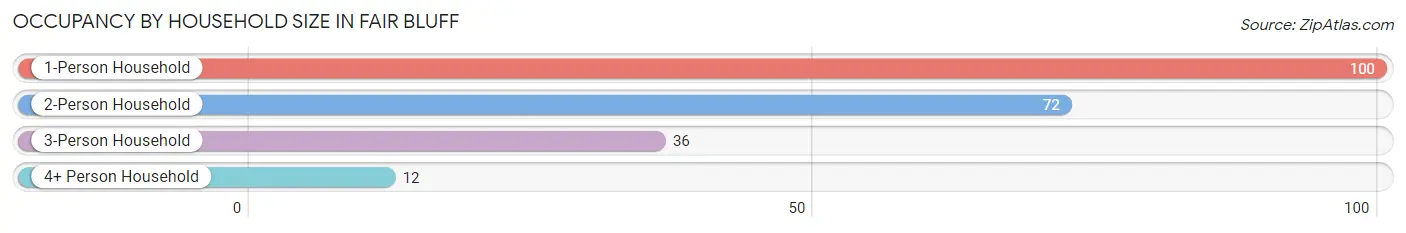
| Household Size | # Housing Units | % Housing Units |
| 1-Person Household | 100 | 45.5% |
| 2-Person Household | 72 | 32.7% |
| 3-Person Household | 36 | 16.4% |
| 4+ Person Household | 12 | 5.4% |
| Total Housing Units | 220 | 100.0% |
Occupancy by Ownership by Household Size in Fair Bluff
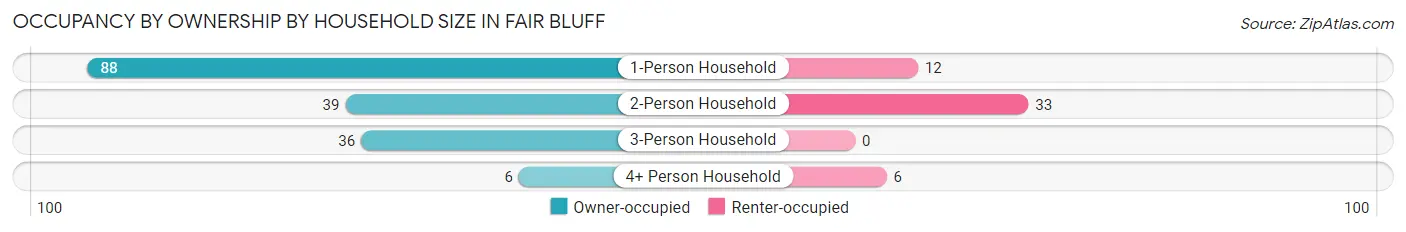
| Household Size | Owner-occupied | Renter-occupied |
| 1-Person Household | 88 (88.0%) | 12 (12.0%) |
| 2-Person Household | 39 (54.2%) | 33 (45.8%) |
| 3-Person Household | 36 (100.0%) | 0 (0.0%) |
| 4+ Person Household | 6 (50.0%) | 6 (50.0%) |
| Total Housing Units | 169 (76.8%) | 51 (23.2%) |
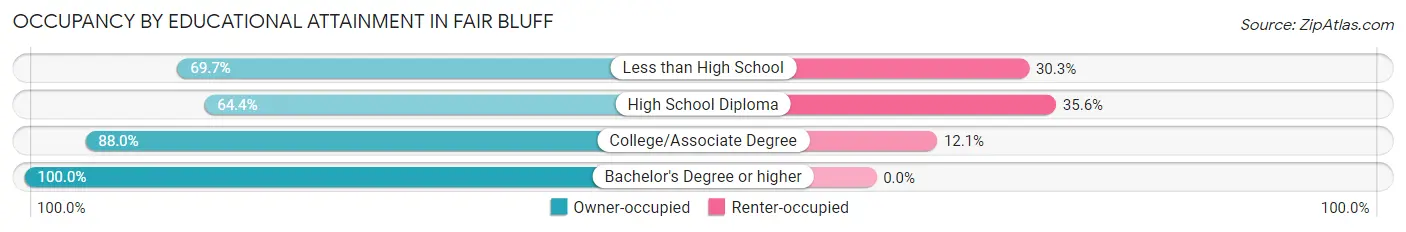
Occupancy by Educational Attainment in Fair Bluff
| Household Size | Owner-occupied | Renter-occupied |
| Less than High School | 23 (69.7%) | 10 (30.3%) |
| High School Diploma | 56 (64.4%) | 31 (35.6%) |
| College/Associate Degree | 73 (87.9%) | 10 (12.0%) |
| Bachelor's Degree or higher | 17 (100.0%) | 0 (0.0%) |
Occupancy by Age of Householder in Fair Bluff
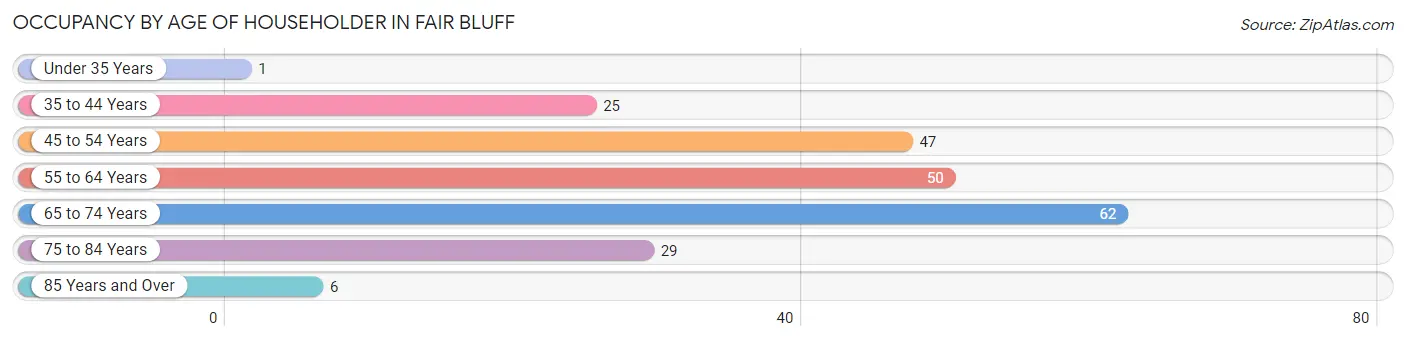
| Age Bracket | # Households | % Households |
| Under 35 Years | 1 | 0.4% |
| 35 to 44 Years | 25 | 11.4% |
| 45 to 54 Years | 47 | 21.4% |
| 55 to 64 Years | 50 | 22.7% |
| 65 to 74 Years | 62 | 28.2% |
| 75 to 84 Years | 29 | 13.2% |
| 85 Years and Over | 6 | 2.7% |
| Total | 220 | 100.0% |
Housing Finances in Fair Bluff
Median Income by Occupancy in Fair Bluff
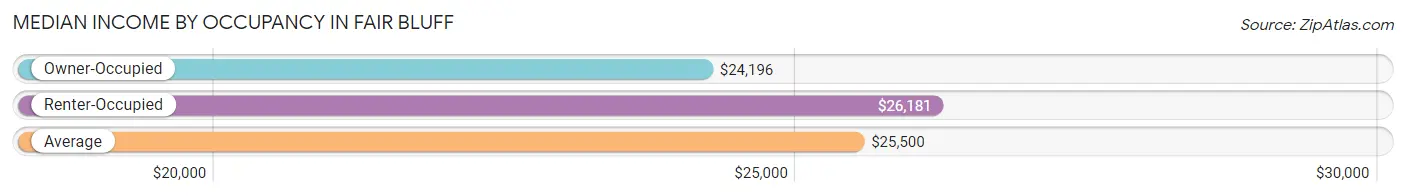
| Occupancy Type | # Households | Median Income |
| Owner-Occupied | 169 (76.8%) | $24,196 |
| Renter-Occupied | 51 (23.2%) | $26,181 |
| Average | 220 (100.0%) | $25,500 |
Occupancy by Householder Income Bracket in Fair Bluff
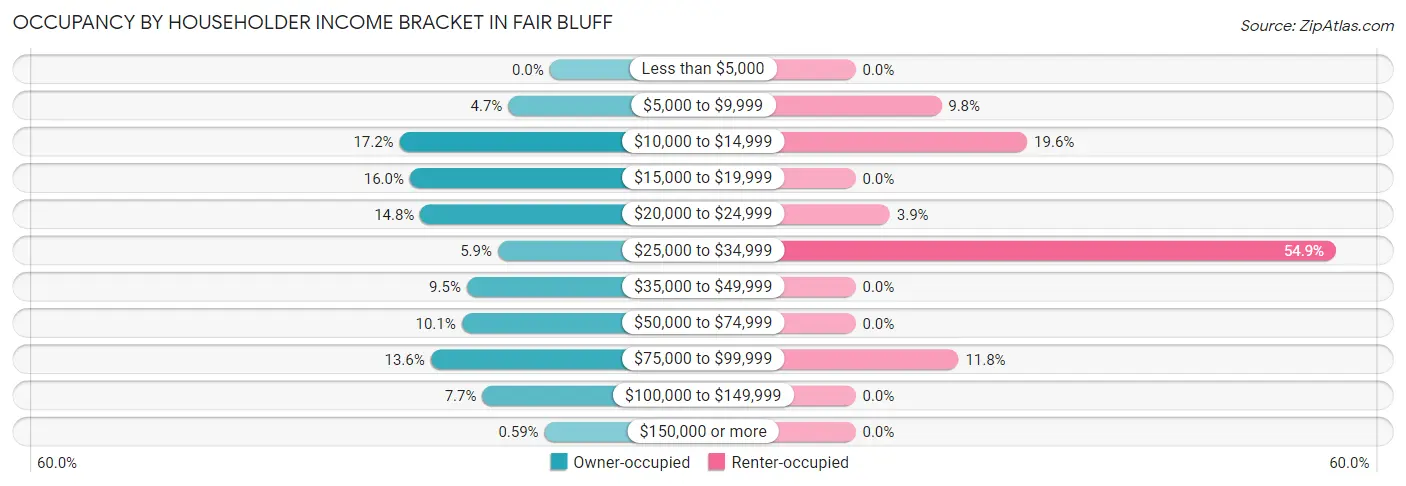
| Income Bracket | Owner-occupied | Renter-occupied |
| Less than $5,000 | 0 (0.0%) | 0 (0.0%) |
| $5,000 to $9,999 | 8 (4.7%) | 5 (9.8%) |
| $10,000 to $14,999 | 29 (17.2%) | 10 (19.6%) |
| $15,000 to $19,999 | 27 (16.0%) | 0 (0.0%) |
| $20,000 to $24,999 | 25 (14.8%) | 2 (3.9%) |
| $25,000 to $34,999 | 10 (5.9%) | 28 (54.9%) |
| $35,000 to $49,999 | 16 (9.5%) | 0 (0.0%) |
| $50,000 to $74,999 | 17 (10.1%) | 0 (0.0%) |
| $75,000 to $99,999 | 23 (13.6%) | 6 (11.8%) |
| $100,000 to $149,999 | 13 (7.7%) | 0 (0.0%) |
| $150,000 or more | 1 (0.6%) | 0 (0.0%) |
| Total | 169 (100.0%) | 51 (100.0%) |
Monthly Housing Cost Tiers in Fair Bluff
| Monthly Cost | Owner-occupied | Renter-occupied |
| Less than $300 | 16 (9.5%) | 0 (0.0%) |
| $300 to $499 | 82 (48.5%) | 10 (19.6%) |
| $500 to $799 | 35 (20.7%) | 6 (11.8%) |
| $800 to $999 | 10 (5.9%) | 18 (35.3%) |
| $1,000 to $1,499 | 18 (10.6%) | 5 (9.8%) |
| $1,500 to $1,999 | 3 (1.8%) | 0 (0.0%) |
| $2,000 to $2,499 | 0 (0.0%) | 0 (0.0%) |
| $2,500 to $2,999 | 5 (3.0%) | 0 (0.0%) |
| $3,000 or more | 0 (0.0%) | 0 (0.0%) |
| Total | 169 (100.0%) | 51 (100.0%) |
Physical Housing Characteristics in Fair Bluff
Housing Structures in Fair Bluff
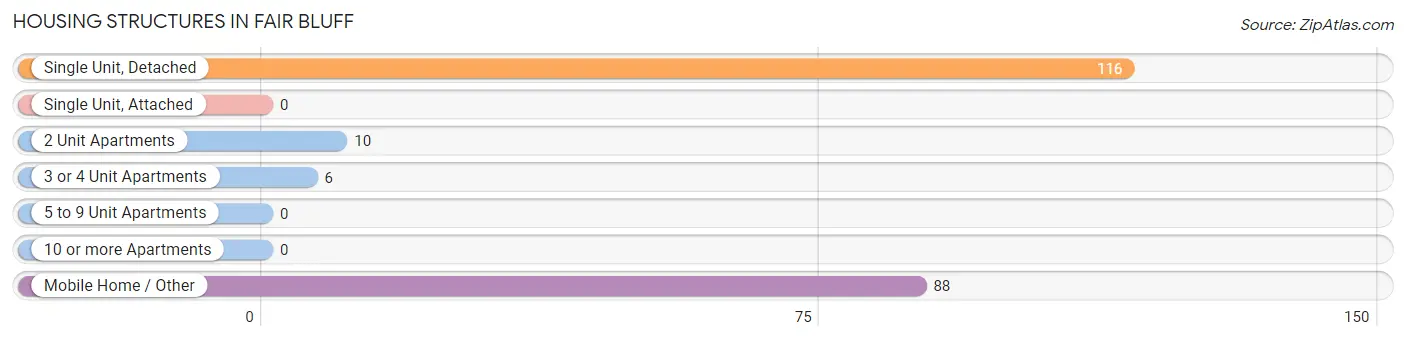
| Structure Type | # Housing Units | % Housing Units |
| Single Unit, Detached | 116 | 52.7% |
| Single Unit, Attached | 0 | 0.0% |
| 2 Unit Apartments | 10 | 4.5% |
| 3 or 4 Unit Apartments | 6 | 2.7% |
| 5 to 9 Unit Apartments | 0 | 0.0% |
| 10 or more Apartments | 0 | 0.0% |
| Mobile Home / Other | 88 | 40.0% |
| Total | 220 | 100.0% |
Housing Structures by Occupancy in Fair Bluff
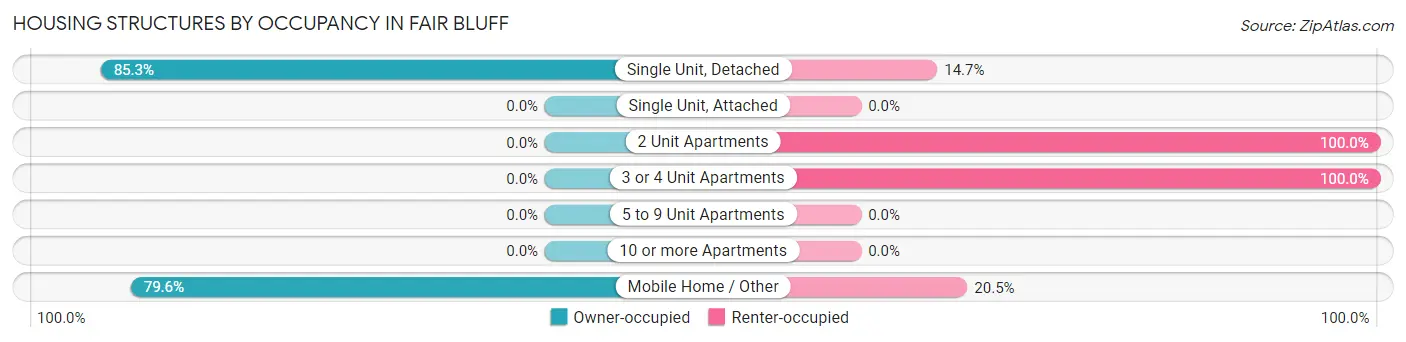
| Structure Type | Owner-occupied | Renter-occupied |
| Single Unit, Detached | 99 (85.3%) | 17 (14.7%) |
| Single Unit, Attached | 0 (0.0%) | 0 (0.0%) |
| 2 Unit Apartments | 0 (0.0%) | 10 (100.0%) |
| 3 or 4 Unit Apartments | 0 (0.0%) | 6 (100.0%) |
| 5 to 9 Unit Apartments | 0 (0.0%) | 0 (0.0%) |
| 10 or more Apartments | 0 (0.0%) | 0 (0.0%) |
| Mobile Home / Other | 70 (79.5%) | 18 (20.4%) |
| Total | 169 (76.8%) | 51 (23.2%) |
Housing Structures by Number of Rooms in Fair Bluff
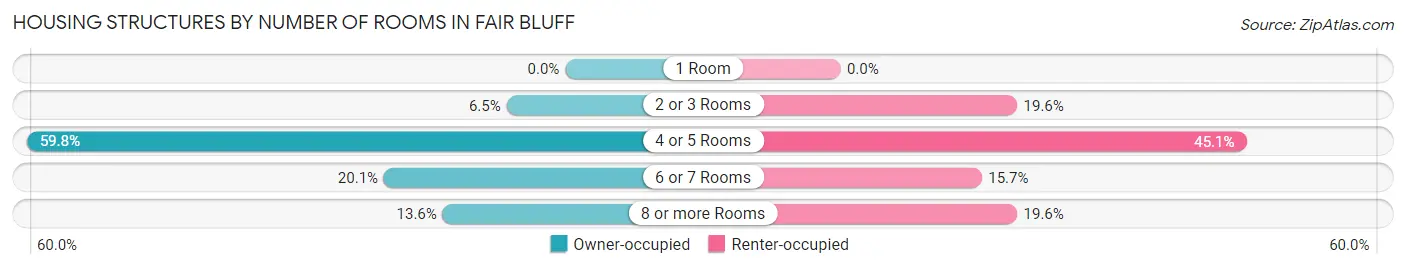
| Number of Rooms | Owner-occupied | Renter-occupied |
| 1 Room | 0 (0.0%) | 0 (0.0%) |
| 2 or 3 Rooms | 11 (6.5%) | 10 (19.6%) |
| 4 or 5 Rooms | 101 (59.8%) | 23 (45.1%) |
| 6 or 7 Rooms | 34 (20.1%) | 8 (15.7%) |
| 8 or more Rooms | 23 (13.6%) | 10 (19.6%) |
| Total | 169 (100.0%) | 51 (100.0%) |
Housing Structure by Heating Type in Fair Bluff
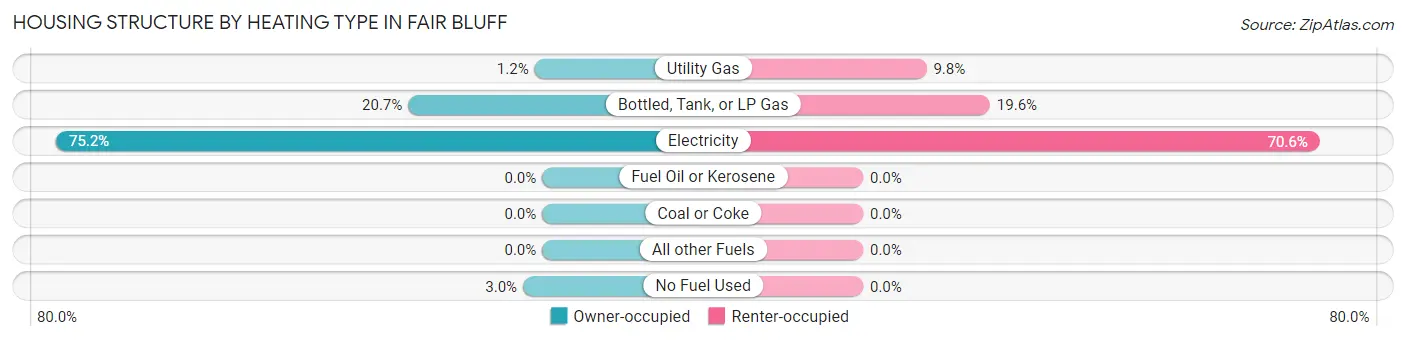
| Heating Type | Owner-occupied | Renter-occupied |
| Utility Gas | 2 (1.2%) | 5 (9.8%) |
| Bottled, Tank, or LP Gas | 35 (20.7%) | 10 (19.6%) |
| Electricity | 127 (75.1%) | 36 (70.6%) |
| Fuel Oil or Kerosene | 0 (0.0%) | 0 (0.0%) |
| Coal or Coke | 0 (0.0%) | 0 (0.0%) |
| All other Fuels | 0 (0.0%) | 0 (0.0%) |
| No Fuel Used | 5 (3.0%) | 0 (0.0%) |
| Total | 169 (100.0%) | 51 (100.0%) |
Household Vehicle Usage in Fair Bluff
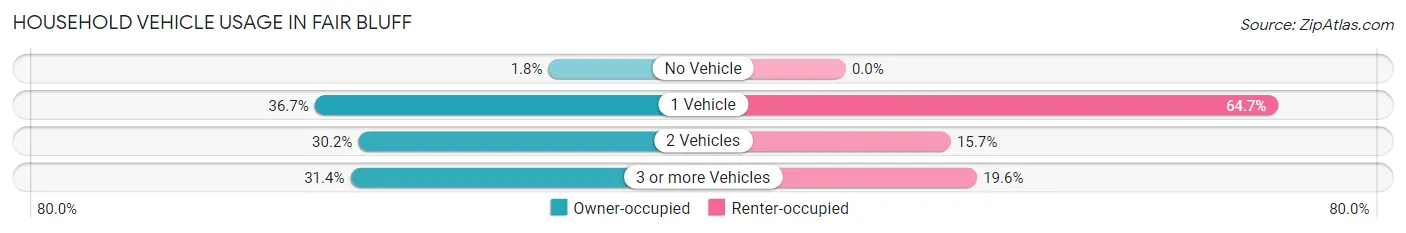
| Vehicles per Household | Owner-occupied | Renter-occupied |
| No Vehicle | 3 (1.8%) | 0 (0.0%) |
| 1 Vehicle | 62 (36.7%) | 33 (64.7%) |
| 2 Vehicles | 51 (30.2%) | 8 (15.7%) |
| 3 or more Vehicles | 53 (31.4%) | 10 (19.6%) |
| Total | 169 (100.0%) | 51 (100.0%) |
Real Estate & Mortgages in Fair Bluff
Real Estate and Mortgage Overview in Fair Bluff
| Characteristic | Without Mortgage | With Mortgage |
| Housing Units | 129 | 40 |
| Median Property Value | $44,600 | $95,300 |
| Median Household Income | $21,964 | $1 |
| Monthly Housing Costs | $391 | $0 |
| Real Estate Taxes | $748 | $1 |
Property Value by Mortgage Status in Fair Bluff
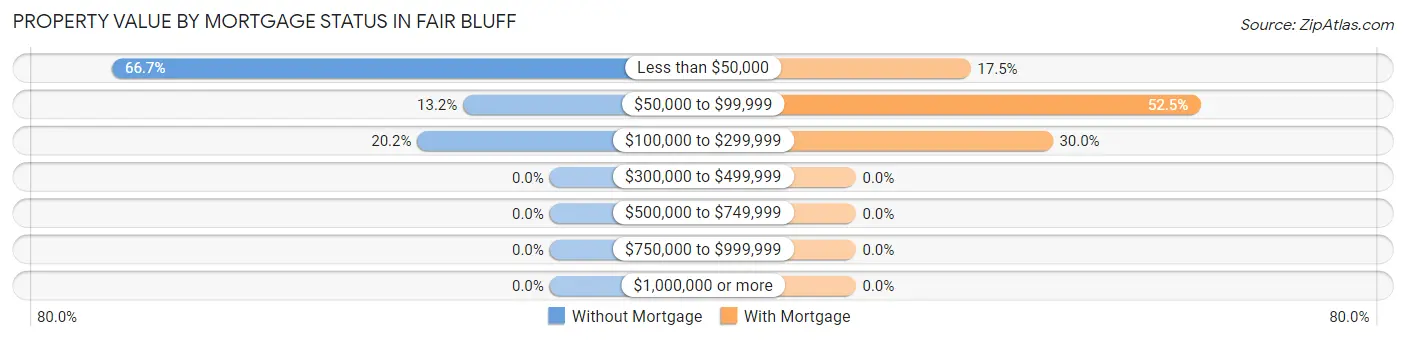
| Property Value | Without Mortgage | With Mortgage |
| Less than $50,000 | 86 (66.7%) | 7 (17.5%) |
| $50,000 to $99,999 | 17 (13.2%) | 21 (52.5%) |
| $100,000 to $299,999 | 26 (20.2%) | 12 (30.0%) |
| $300,000 to $499,999 | 0 (0.0%) | 0 (0.0%) |
| $500,000 to $749,999 | 0 (0.0%) | 0 (0.0%) |
| $750,000 to $999,999 | 0 (0.0%) | 0 (0.0%) |
| $1,000,000 or more | 0 (0.0%) | 0 (0.0%) |
| Total | 129 (100.0%) | 40 (100.0%) |
Household Income by Mortgage Status in Fair Bluff
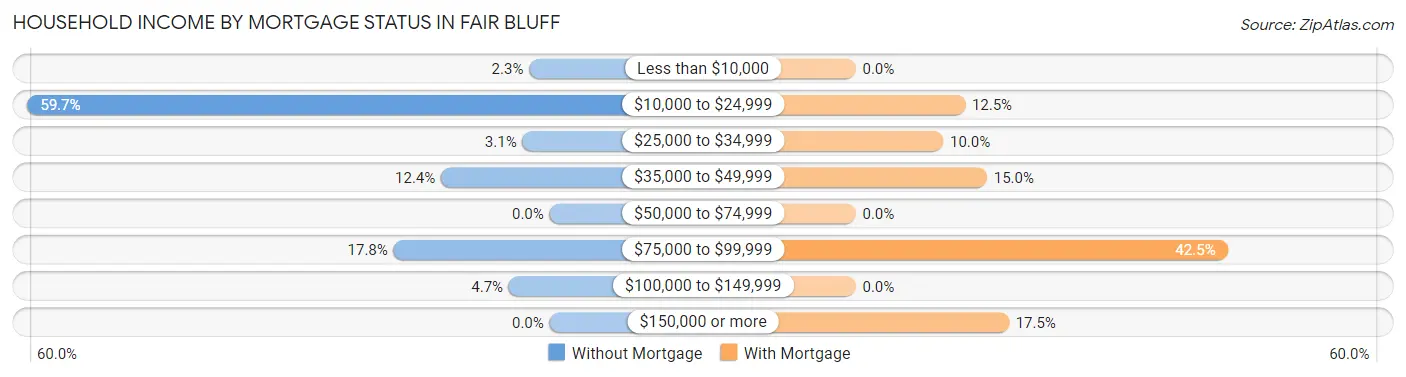
| Household Income | Without Mortgage | With Mortgage |
| Less than $10,000 | 3 (2.3%) | 0 (0.0%) |
| $10,000 to $24,999 | 77 (59.7%) | 5 (12.5%) |
| $25,000 to $34,999 | 4 (3.1%) | 4 (10.0%) |
| $35,000 to $49,999 | 16 (12.4%) | 6 (15.0%) |
| $50,000 to $74,999 | 0 (0.0%) | 0 (0.0%) |
| $75,000 to $99,999 | 23 (17.8%) | 17 (42.5%) |
| $100,000 to $149,999 | 6 (4.6%) | 0 (0.0%) |
| $150,000 or more | 0 (0.0%) | 7 (17.5%) |
| Total | 129 (100.0%) | 40 (100.0%) |
Property Value to Household Income Ratio in Fair Bluff
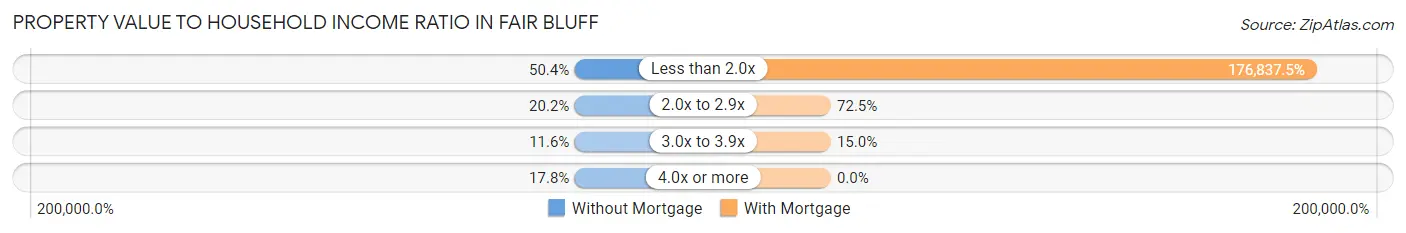
| Value-to-Income Ratio | Without Mortgage | With Mortgage |
| Less than 2.0x | 65 (50.4%) | 70,735 (176,837.5%) |
| 2.0x to 2.9x | 26 (20.2%) | 29 (72.5%) |
| 3.0x to 3.9x | 15 (11.6%) | 6 (15.0%) |
| 4.0x or more | 23 (17.8%) | 0 (0.0%) |
| Total | 129 (100.0%) | 40 (100.0%) |
Real Estate Taxes by Mortgage Status in Fair Bluff
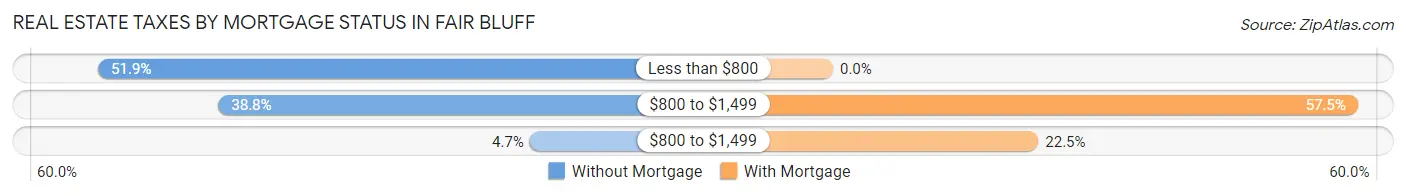
| Property Taxes | Without Mortgage | With Mortgage |
| Less than $800 | 67 (51.9%) | 0 (0.0%) |
| $800 to $1,499 | 50 (38.8%) | 23 (57.5%) |
| $800 to $1,499 | 6 (4.6%) | 9 (22.5%) |
| Total | 129 (100.0%) | 40 (100.0%) |
Health & Disability in Fair Bluff
Health Insurance Coverage by Age in Fair Bluff
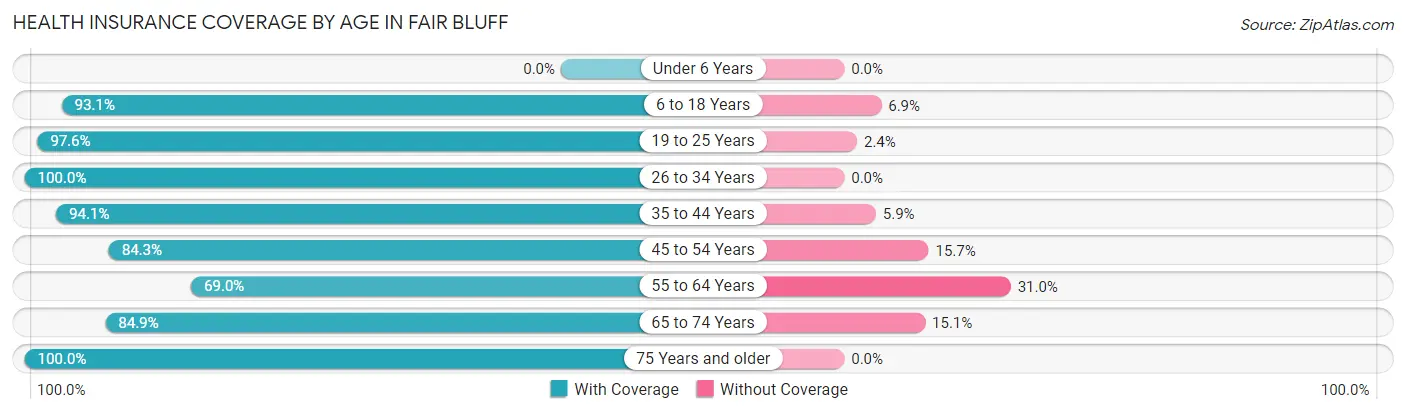
| Age Bracket | With Coverage | Without Coverage |
| Under 6 Years | 0 (0.0%) | 0 (0.0%) |
| 6 to 18 Years | 54 (93.1%) | 4 (6.9%) |
| 19 to 25 Years | 41 (97.6%) | 1 (2.4%) |
| 26 to 34 Years | 3 (100.0%) | 0 (0.0%) |
| 35 to 44 Years | 48 (94.1%) | 3 (5.9%) |
| 45 to 54 Years | 59 (84.3%) | 11 (15.7%) |
| 55 to 64 Years | 60 (69.0%) | 27 (31.0%) |
| 65 to 74 Years | 62 (84.9%) | 11 (15.1%) |
| 75 Years and older | 53 (100.0%) | 0 (0.0%) |
| Total | 380 (87.0%) | 57 (13.0%) |
Health Insurance Coverage by Citizenship Status in Fair Bluff
| Citizenship Status | With Coverage | Without Coverage |
| Native Born | 0 (0.0%) | 0 (0.0%) |
| Foreign Born, Citizen | 54 (93.1%) | 4 (6.9%) |
| Foreign Born, not a Citizen | 41 (97.6%) | 1 (2.4%) |
Health Insurance Coverage by Household Income in Fair Bluff
| Household Income | With Coverage | Without Coverage |
| Under $25,000 | 117 (84.2%) | 22 (15.8%) |
| $25,000 to $49,999 | 99 (90.0%) | 11 (10.0%) |
| $50,000 to $74,999 | 29 (63.0%) | 17 (37.0%) |
| $75,000 to $99,999 | 91 (100.0%) | 0 (0.0%) |
| $100,000 and over | 44 (86.3%) | 7 (13.7%) |
Public vs Private Health Insurance Coverage by Age in Fair Bluff
| Age Bracket | Public Insurance | Private Insurance |
| Under 6 | 0 (0.0%) | 0 (0.0%) |
| 6 to 18 Years | 26 (44.8%) | 28 (48.3%) |
| 19 to 25 Years | 0 (0.0%) | 41 (97.6%) |
| 25 to 34 Years | 0 (0.0%) | 3 (100.0%) |
| 35 to 44 Years | 7 (13.7%) | 41 (80.4%) |
| 45 to 54 Years | 18 (25.7%) | 59 (84.3%) |
| 55 to 64 Years | 38 (43.7%) | 41 (47.1%) |
| 65 to 74 Years | 62 (84.9%) | 26 (35.6%) |
| 75 Years and over | 53 (100.0%) | 22 (41.5%) |
| Total | 204 (46.7%) | 261 (59.7%) |
Disability Status by Sex by Age in Fair Bluff
| Age Bracket | Male | Female |
| Under 5 Years | 0 (0.0%) | 0 (0.0%) |
| 5 to 17 Years | 0 (0.0%) | 0 (0.0%) |
| 18 to 34 Years | 0 (0.0%) | 3 (6.8%) |
| 35 to 64 Years | 12 (13.6%) | 48 (40.0%) |
| 65 to 74 Years | 2 (7.4%) | 13 (28.3%) |
| 75 Years and over | 10 (71.4%) | 23 (59.0%) |
Disability Class by Sex by Age in Fair Bluff
Disability Class: Hearing Difficulty
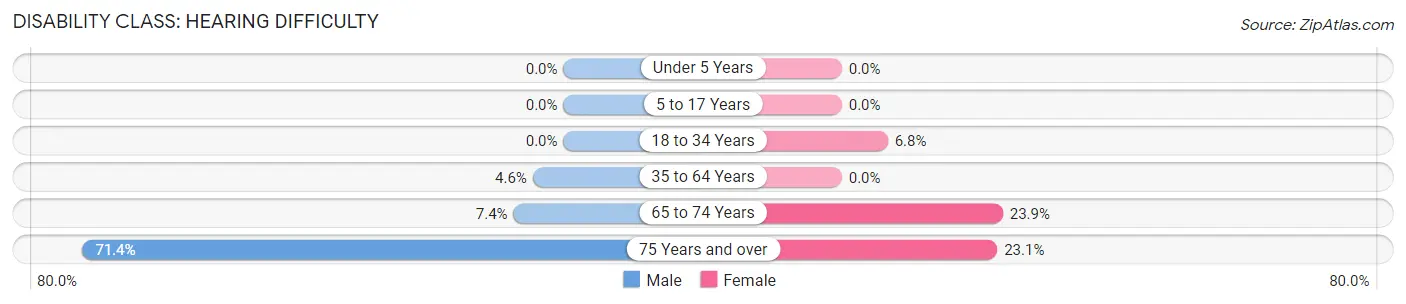
| Age Bracket | Male | Female |
| Under 5 Years | 0 (0.0%) | 0 (0.0%) |
| 5 to 17 Years | 0 (0.0%) | 0 (0.0%) |
| 18 to 34 Years | 0 (0.0%) | 3 (6.8%) |
| 35 to 64 Years | 4 (4.5%) | 0 (0.0%) |
| 65 to 74 Years | 2 (7.4%) | 11 (23.9%) |
| 75 Years and over | 10 (71.4%) | 9 (23.1%) |
Disability Class: Vision Difficulty
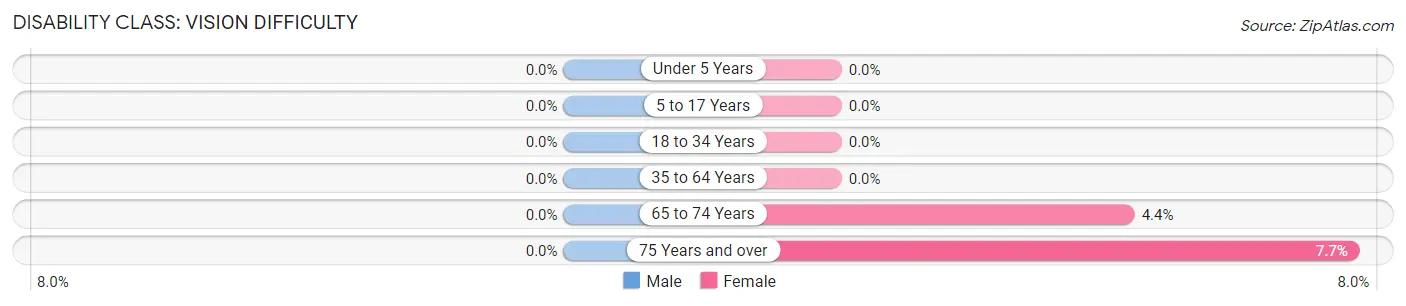
| Age Bracket | Male | Female |
| Under 5 Years | 0 (0.0%) | 0 (0.0%) |
| 5 to 17 Years | 0 (0.0%) | 0 (0.0%) |
| 18 to 34 Years | 0 (0.0%) | 0 (0.0%) |
| 35 to 64 Years | 0 (0.0%) | 0 (0.0%) |
| 65 to 74 Years | 0 (0.0%) | 2 (4.3%) |
| 75 Years and over | 0 (0.0%) | 3 (7.7%) |
Disability Class: Cognitive Difficulty
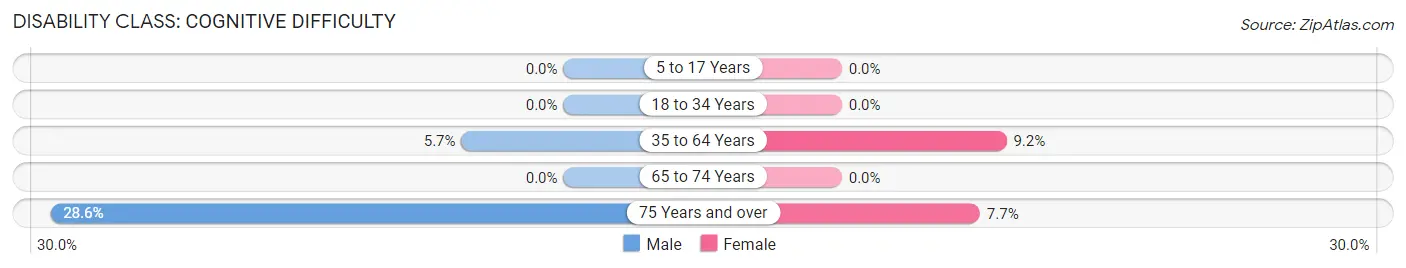
| Age Bracket | Male | Female |
| 5 to 17 Years | 0 (0.0%) | 0 (0.0%) |
| 18 to 34 Years | 0 (0.0%) | 0 (0.0%) |
| 35 to 64 Years | 5 (5.7%) | 11 (9.2%) |
| 65 to 74 Years | 0 (0.0%) | 0 (0.0%) |
| 75 Years and over | 4 (28.6%) | 3 (7.7%) |
Disability Class: Ambulatory Difficulty
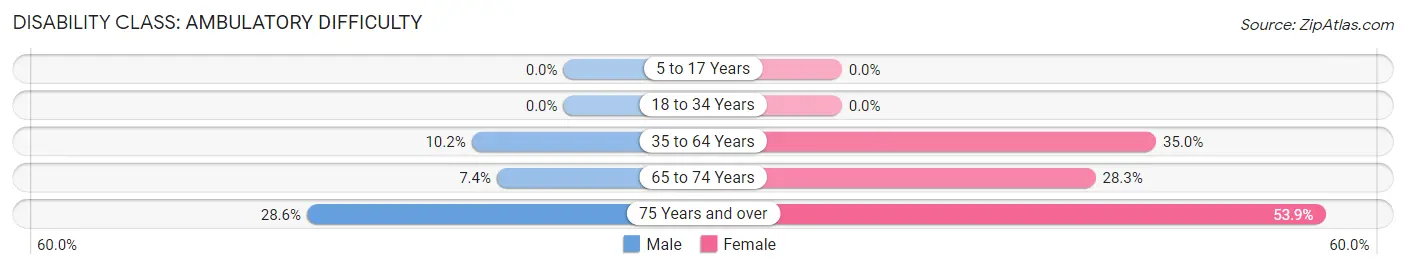
| Age Bracket | Male | Female |
| 5 to 17 Years | 0 (0.0%) | 0 (0.0%) |
| 18 to 34 Years | 0 (0.0%) | 0 (0.0%) |
| 35 to 64 Years | 9 (10.2%) | 42 (35.0%) |
| 65 to 74 Years | 2 (7.4%) | 13 (28.3%) |
| 75 Years and over | 4 (28.6%) | 21 (53.8%) |
Disability Class: Self-Care Difficulty
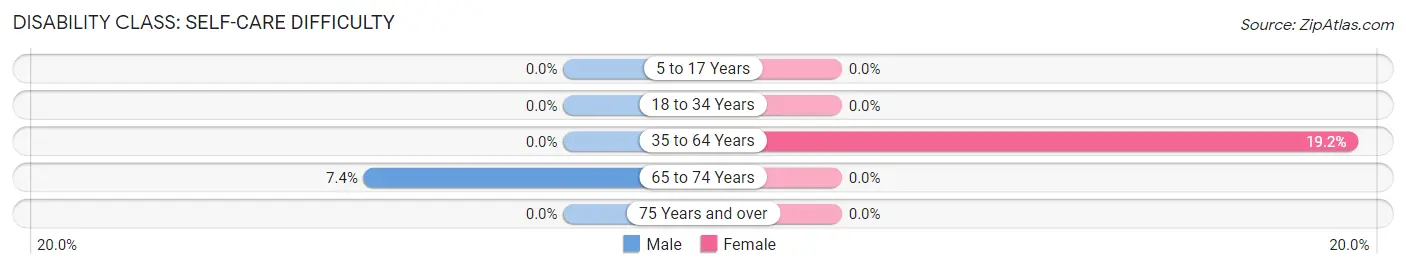
| Age Bracket | Male | Female |
| 5 to 17 Years | 0 (0.0%) | 0 (0.0%) |
| 18 to 34 Years | 0 (0.0%) | 0 (0.0%) |
| 35 to 64 Years | 0 (0.0%) | 23 (19.2%) |
| 65 to 74 Years | 2 (7.4%) | 0 (0.0%) |
| 75 Years and over | 0 (0.0%) | 0 (0.0%) |
Technology Access in Fair Bluff
Computing Device Access in Fair Bluff
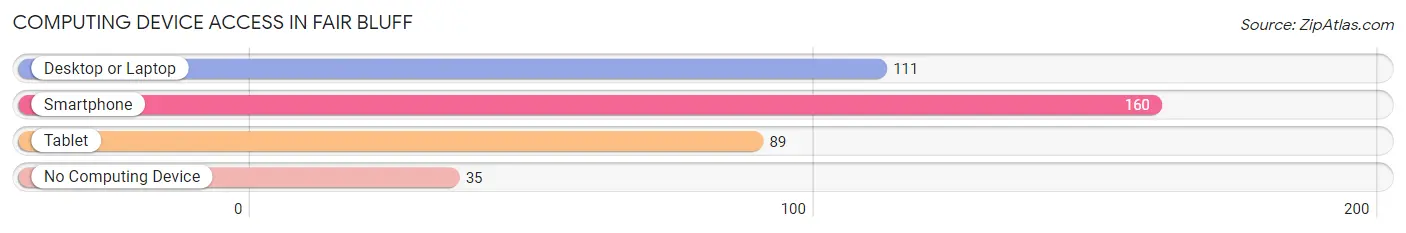
| Device Type | # Households | % Households |
| Desktop or Laptop | 111 | 50.4% |
| Smartphone | 160 | 72.7% |
| Tablet | 89 | 40.5% |
| No Computing Device | 35 | 15.9% |
| Total | 220 | 100.0% |
Internet Access in Fair Bluff
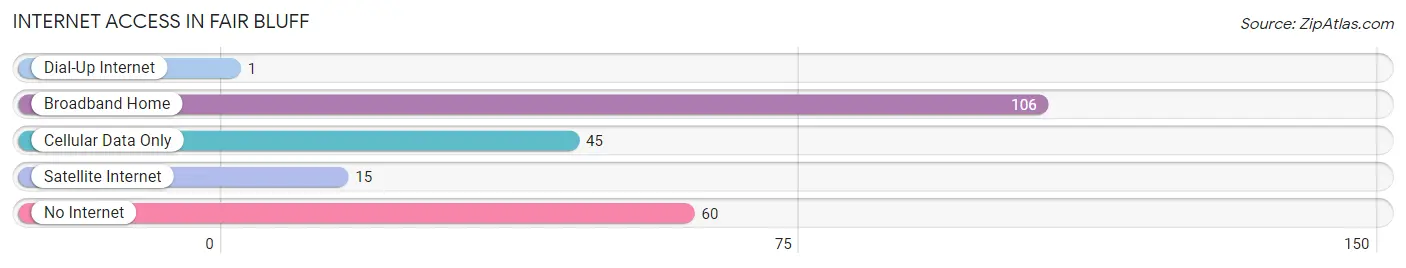
| Internet Type | # Households | % Households |
| Dial-Up Internet | 1 | 0.4% |
| Broadband Home | 106 | 48.2% |
| Cellular Data Only | 45 | 20.4% |
| Satellite Internet | 15 | 6.8% |
| No Internet | 60 | 27.3% |
| Total | 220 | 100.0% |
Fair Bluff Summary
Fair Bluff is a small town located in Columbus County, North Carolina. It is situated on the banks of the Lumber River, which is a tributary of the Cape Fear River. The town was founded in 1883 and has a population of approximately 1,000 people.
Geography
Fair Bluff is located in the southeastern corner of North Carolina, approximately 40 miles from the South Carolina border. The town is situated on the banks of the Lumber River, which is a tributary of the Cape Fear River. The town is surrounded by a variety of natural features, including the Green Swamp, the Lumber River State Park, and the White Lake State Park. The town is also located near the Green Swamp Wildlife Management Area, which is home to a variety of wildlife, including deer, wild turkeys, and black bears.
The town is located in a humid subtropical climate zone, with hot, humid summers and mild winters. The average annual temperature is around 70 degrees Fahrenheit, with an average high of around 90 degrees in the summer and an average low of around 50 degrees in the winter. The town receives an average of around 50 inches of precipitation per year, with most of it falling in the summer months.
History
Fair Bluff was founded in 1883 by a group of settlers from the nearby town of Whiteville. The town was named after the nearby Fair Bluff Plantation, which was owned by the prominent local family of the same name. The town quickly grew and became a center of commerce for the surrounding area. In the early 1900s, the town was home to several sawmills, a cotton gin, and a grist mill.
In the 1920s, the town was connected to the rest of the state by the Atlantic Coast Line Railroad. This allowed the town to become a major shipping center for the surrounding area. The town also became a popular tourist destination, with several hotels and resorts being built in the area.
In the 1950s, the town began to decline as the lumber industry began to decline. The town was also hit hard by Hurricane Hazel in 1954, which caused extensive damage to the town. In the 1960s, the town began to experience a resurgence as the lumber industry began to recover. The town also began to attract new businesses, such as a furniture factory and a textile mill.
Economy
The economy of Fair Bluff is largely based on the lumber industry. The town is home to several sawmills and lumber companies, which provide employment for many of the town’s residents. The town is also home to several other businesses, including a furniture factory, a textile mill, and a variety of retail stores.
The town is also home to several tourist attractions, including the Lumber River State Park, the White Lake State Park, and the Green Swamp Wildlife Management Area. These attractions draw visitors from all over the state and provide an important source of income for the town.
Demographics
As of the 2010 census, the population of Fair Bluff was 1,039. The town is predominantly white, with a small African American population. The median household income is $30,000, and the median home value is $90,000. The town has a poverty rate of 22.7%, which is higher than the state average.
Conclusion
Fair Bluff is a small town located in Columbus County, North Carolina. It is situated on the banks of the Lumber River and is surrounded by a variety of natural features. The town was founded in 1883 and has a population of approximately 1,000 people. The economy of Fair Bluff is largely based on the lumber industry, and the town is also home to several tourist attractions. The town is predominantly white, with a small African American population. The median household income is $30,000, and the median home value is $90,000.
Common Questions
What is Per Capita Income in Fair Bluff?
Per Capita income in Fair Bluff is $20,914.
What is the Median Household income in Fair Bluff?
Median Household Income in Fair Bluff is $25,500.
What is Income or Wage Gap in Fair Bluff?
Income or Wage Gap in Fair Bluff is 34.1%.
Women in Fair Bluff earn 65.9 cents for every dollar earned by a man.
What is Inequality or Gini Index in Fair Bluff?
Inequality or Gini Index in Fair Bluff is 0.44.
What is the Total Population of Fair Bluff?
Total Population of Fair Bluff is 437.
What is the Total Male Population of Fair Bluff?
Total Male Population of Fair Bluff is 164.
What is the Total Female Population of Fair Bluff?
Total Female Population of Fair Bluff is 273.
What is the Ratio of Males per 100 Females in Fair Bluff?
There are 60.07 Males per 100 Females in Fair Bluff.
What is the Ratio of Females per 100 Males in Fair Bluff?
There are 166.46 Females per 100 Males in Fair Bluff.
What is the Median Population Age in Fair Bluff?
Median Population Age in Fair Bluff is 54.7 Years.
What is the Average Family Size in Fair Bluff
Average Family Size in Fair Bluff is 2.9 People.
What is the Average Household Size in Fair Bluff
Average Household Size in Fair Bluff is 2.0 People.
How Large is the Labor Force in Fair Bluff?
There are 183 People in the Labor Forcein in Fair Bluff.
What is the Percentage of People in the Labor Force in Fair Bluff?
47.8% of People are in the Labor Force in Fair Bluff.
What is the Unemployment Rate in Fair Bluff?
Unemployment Rate in Fair Bluff is 3.8%.