Ellerbe, NC Map & Demographics
Ellerbe Map
Ellerbe Overview
$23,394
PER CAPITA INCOME
$51,875
AVG FAMILY INCOME
$45,654
AVG HOUSEHOLD INCOME
40.3%
WAGE / INCOME GAP [ % ]
59.7¢/ $1
WAGE / INCOME GAP [ $ ]
0.43
INEQUALITY / GINI INDEX
1,156
TOTAL POPULATION
471
MALE POPULATION
685
FEMALE POPULATION
68.76
MALES / 100 FEMALES
145.44
FEMALES / 100 MALES
33.7
MEDIAN AGE
3.0
AVG FAMILY SIZE
2.4
AVG HOUSEHOLD SIZE
589
LABOR FORCE [ PEOPLE ]
68.4%
PERCENT IN LABOR FORCE
19.8%
UNEMPLOYMENT RATE
Ellerbe Zip Codes
Ellerbe Area Codes
Income in Ellerbe
Income Overview in Ellerbe
Per Capita Income in Ellerbe is $23,394, while median incomes of families and households are $51,875 and $45,654 respectively.
| Characteristic | Number | Measure |
| Per Capita Income | 1,156 | $23,394 |
| Median Family Income | 311 | $51,875 |
| Mean Family Income | 311 | $74,789 |
| Median Household Income | 478 | $45,654 |
| Mean Household Income | 478 | $60,763 |
| Income Deficit | 311 | $0 |
| Wage / Income Gap (%) | 1,156 | 40.33% |
| Wage / Income Gap ($) | 1,156 | 59.67¢ per $1 |
| Gini / Inequality Index | 1,156 | 0.43 |
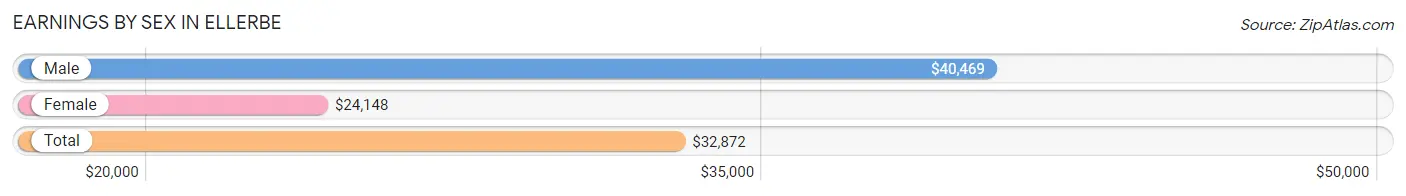
Earnings by Sex in Ellerbe
Average Earnings in Ellerbe are $32,872, $40,469 for men and $24,148 for women, a difference of 40.3%.
| Sex | Number | Average Earnings |
| Male | 203 (36.8%) | $40,469 |
| Female | 349 (63.2%) | $24,148 |
| Total | 552 (100.0%) | $32,872 |
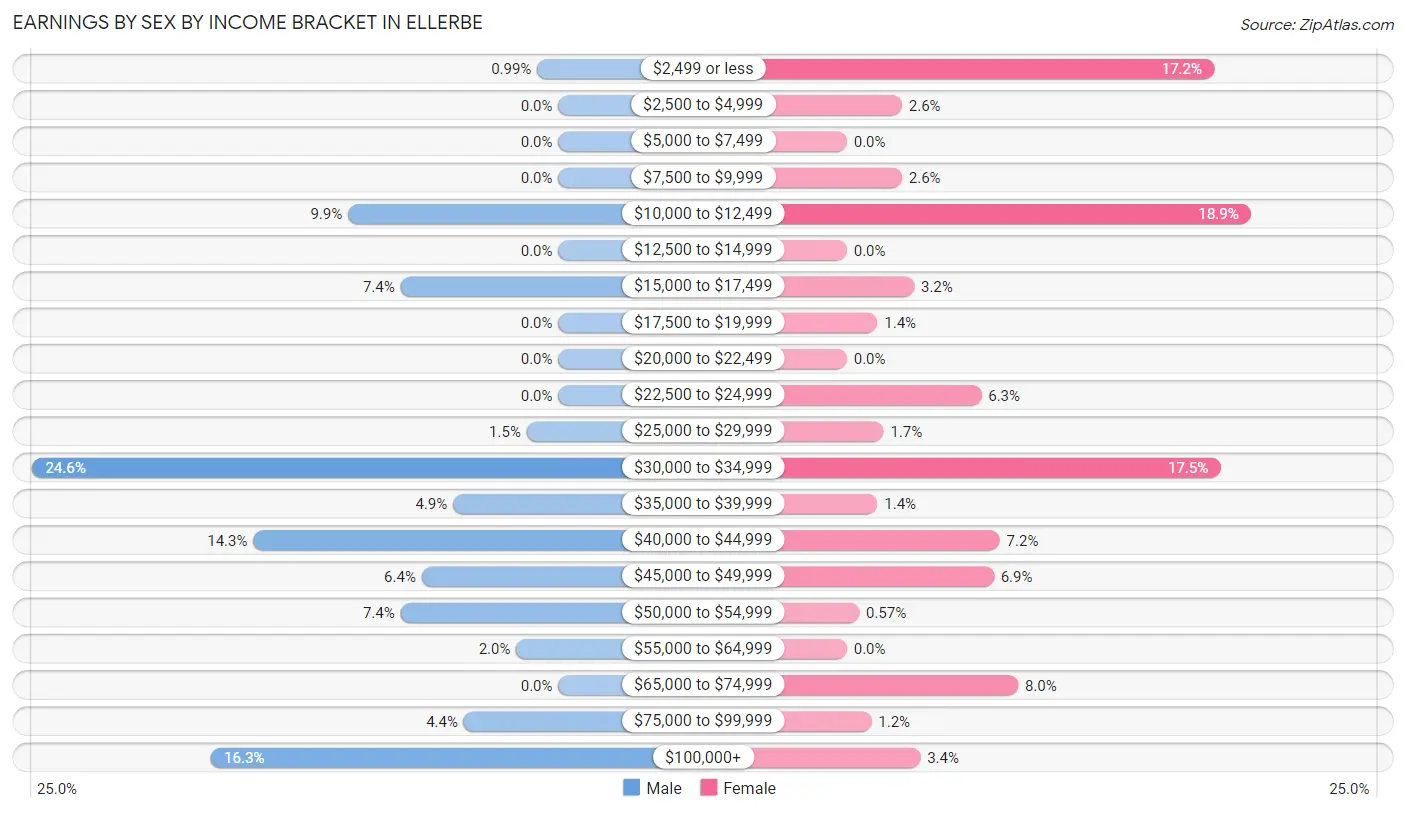
Earnings by Sex by Income Bracket in Ellerbe
The most common earnings brackets in Ellerbe are $30,000 to $34,999 for men (50 | 24.6%) and $10,000 to $12,499 for women (66 | 18.9%).
| Income | Male | Female |
| $2,499 or less | 2 (1.0%) | 60 (17.2%) |
| $2,500 to $4,999 | 0 (0.0%) | 9 (2.6%) |
| $5,000 to $7,499 | 0 (0.0%) | 0 (0.0%) |
| $7,500 to $9,999 | 0 (0.0%) | 9 (2.6%) |
| $10,000 to $12,499 | 20 (9.9%) | 66 (18.9%) |
| $12,500 to $14,999 | 0 (0.0%) | 0 (0.0%) |
| $15,000 to $17,499 | 15 (7.4%) | 11 (3.2%) |
| $17,500 to $19,999 | 0 (0.0%) | 5 (1.4%) |
| $20,000 to $22,499 | 0 (0.0%) | 0 (0.0%) |
| $22,500 to $24,999 | 0 (0.0%) | 22 (6.3%) |
| $25,000 to $29,999 | 3 (1.5%) | 6 (1.7%) |
| $30,000 to $34,999 | 50 (24.6%) | 61 (17.5%) |
| $35,000 to $39,999 | 10 (4.9%) | 5 (1.4%) |
| $40,000 to $44,999 | 29 (14.3%) | 25 (7.2%) |
| $45,000 to $49,999 | 13 (6.4%) | 24 (6.9%) |
| $50,000 to $54,999 | 15 (7.4%) | 2 (0.6%) |
| $55,000 to $64,999 | 4 (2.0%) | 0 (0.0%) |
| $65,000 to $74,999 | 0 (0.0%) | 28 (8.0%) |
| $75,000 to $99,999 | 9 (4.4%) | 4 (1.1%) |
| $100,000+ | 33 (16.3%) | 12 (3.4%) |
| Total | 203 (100.0%) | 349 (100.0%) |
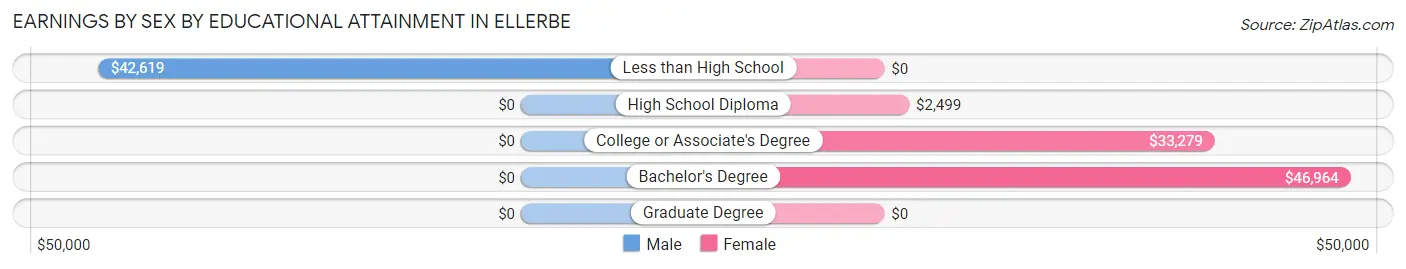
Earnings by Sex by Educational Attainment in Ellerbe
Average earnings in Ellerbe are $40,156 for men and $33,566 for women, a difference of 16.4%. Men with an educational attainment of less than high school enjoy the highest average annual earnings of $42,619, while those with less than high school education earn the least with $42,619. Women with an educational attainment of bachelor's degree earn the most with the average annual earnings of $46,964, while those with high school diploma education have the smallest earnings of $2,499.
| Educational Attainment | Male Income | Female Income |
| Less than High School | $42,619 | $0 |
| High School Diploma | - | - |
| College or Associate's Degree | - | - |
| Bachelor's Degree | - | - |
| Graduate Degree | - | - |
| Total | $40,156 | $33,566 |
Family Income in Ellerbe
Family Income Brackets in Ellerbe
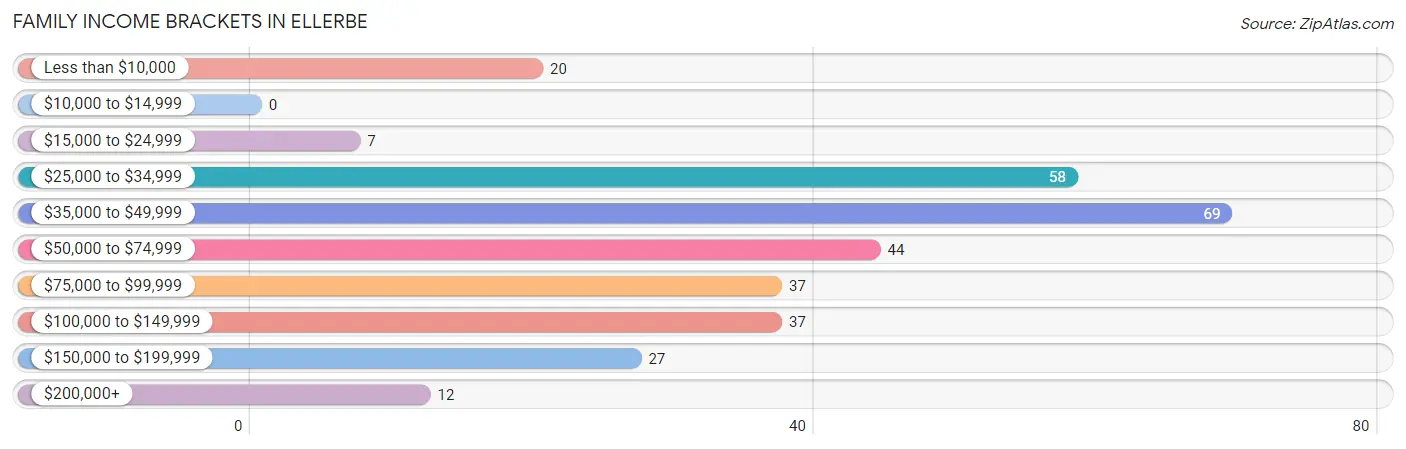
According to the Ellerbe family income data, there are 69 families falling into the $35,000 to $49,999 income range, which is the most common income bracket and makes up 22.2% of all families.
| Income Bracket | # Families | % Families |
| Less than $10,000 | 20 | 6.4% |
| $10,000 to $14,999 | 0 | 0.0% |
| $15,000 to $24,999 | 7 | 2.3% |
| $25,000 to $34,999 | 58 | 18.6% |
| $35,000 to $49,999 | 69 | 22.2% |
| $50,000 to $74,999 | 44 | 14.1% |
| $75,000 to $99,999 | 37 | 11.9% |
| $100,000 to $149,999 | 37 | 11.9% |
| $150,000 to $199,999 | 27 | 8.7% |
| $200,000+ | 12 | 3.9% |
Family Income by Famaliy Size in Ellerbe
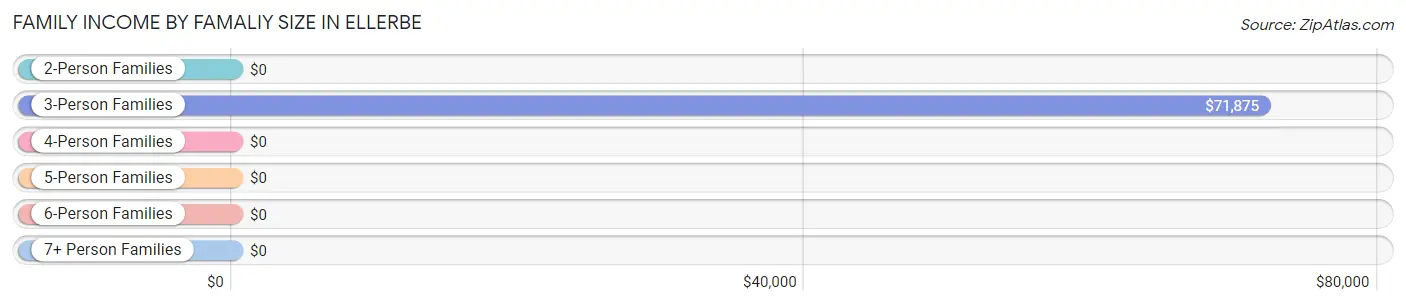
3-person families (48 | 15.4%) account for the highest median family income in Ellerbe with $71,875 per family, while 3-person families (48 | 15.4%) have the highest median income of $23,958 per family member.
| Income Bracket | # Families | Median Income |
| 2-Person Families | 132 (42.4%) | $0 |
| 3-Person Families | 48 (15.4%) | $71,875 |
| 4-Person Families | 58 (18.6%) | $0 |
| 5-Person Families | 49 (15.8%) | $0 |
| 6-Person Families | 24 (7.7%) | $0 |
| 7+ Person Families | 0 (0.0%) | $0 |
| Total | 311 (100.0%) | $51,875 |
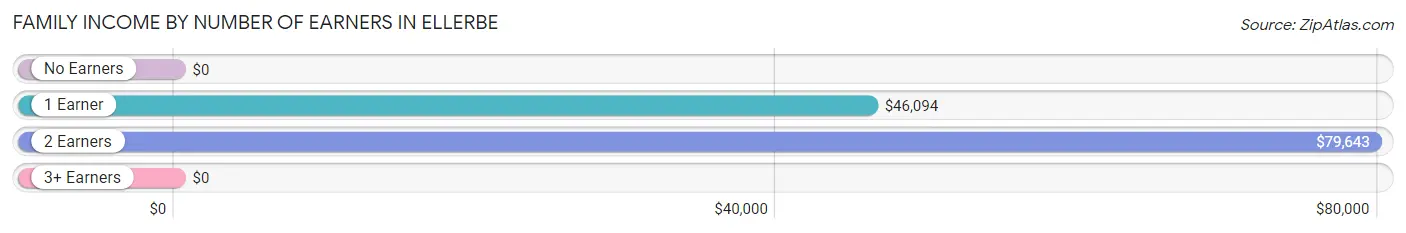
Family Income by Number of Earners in Ellerbe
| Number of Earners | # Families | Median Income |
| No Earners | 62 (19.9%) | $0 |
| 1 Earner | 116 (37.3%) | $46,094 |
| 2 Earners | 84 (27.0%) | $79,643 |
| 3+ Earners | 49 (15.8%) | $0 |
| Total | 311 (100.0%) | $51,875 |
Household Income in Ellerbe
Household Income Brackets in Ellerbe
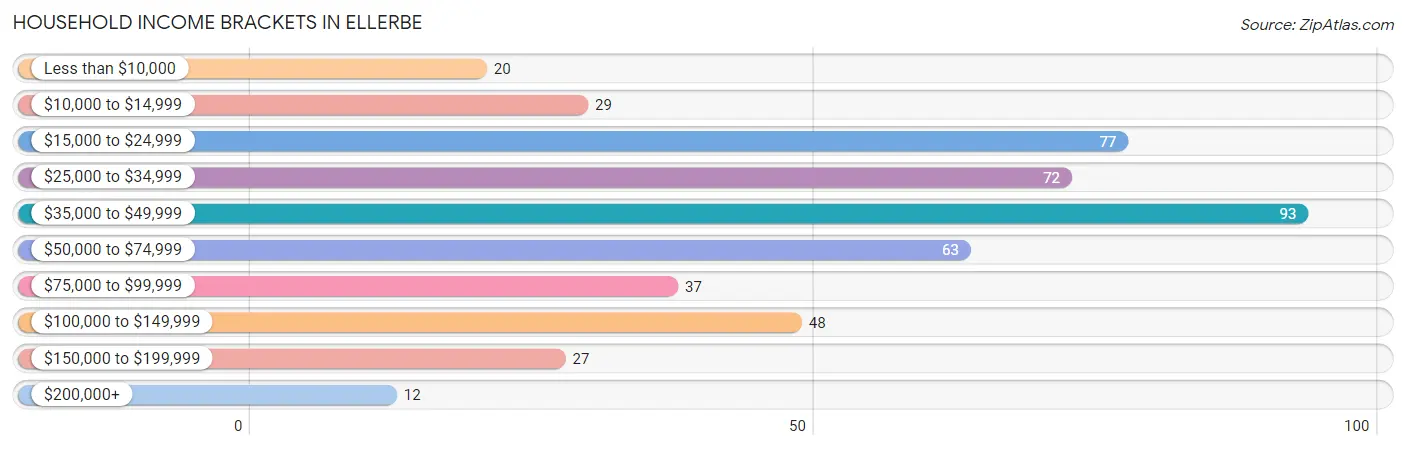
With 93 households falling in the category, the $35,000 to $49,999 income range is the most frequent in Ellerbe, accounting for 19.5% of all households. In contrast, only 12 households (2.5%) fall into the $200,000+ income bracket, making it the least populous group.
| Income Bracket | # Households | % Households |
| Less than $10,000 | 20 | 4.2% |
| $10,000 to $14,999 | 29 | 6.1% |
| $15,000 to $24,999 | 77 | 16.1% |
| $25,000 to $34,999 | 72 | 15.1% |
| $35,000 to $49,999 | 93 | 19.5% |
| $50,000 to $74,999 | 63 | 13.2% |
| $75,000 to $99,999 | 37 | 7.7% |
| $100,000 to $149,999 | 48 | 10.0% |
| $150,000 to $199,999 | 27 | 5.6% |
| $200,000+ | 12 | 2.5% |
Household Income by Householder Age in Ellerbe
The median household income in Ellerbe is $45,654, with the highest median household income of $68,000 found in the 25 to 44 years age bracket for the primary householder. A total of 162 households (33.9%) fall into this category. Meanwhile, the 15 to 24 years age bracket for the primary householder has the lowest median household income of $0, with 4 households (0.8%) in this group.

| Income Bracket | # Households | Median Income |
| 15 to 24 Years | 4 (0.8%) | $0 |
| 25 to 44 Years | 162 (33.9%) | $68,000 |
| 45 to 64 Years | 183 (38.3%) | $45,281 |
| 65+ Years | 129 (27.0%) | $25,859 |
| Total | 478 (100.0%) | $45,654 |
Poverty in Ellerbe
Income Below Poverty by Sex and Age in Ellerbe
With 24.2% poverty level for males and 13.1% for females among the residents of Ellerbe, 15 year old males and 35 to 44 year old females are the most vulnerable to poverty, with 5 males (100.0%) and 14 females (30.4%) in their respective age groups living below the poverty level.
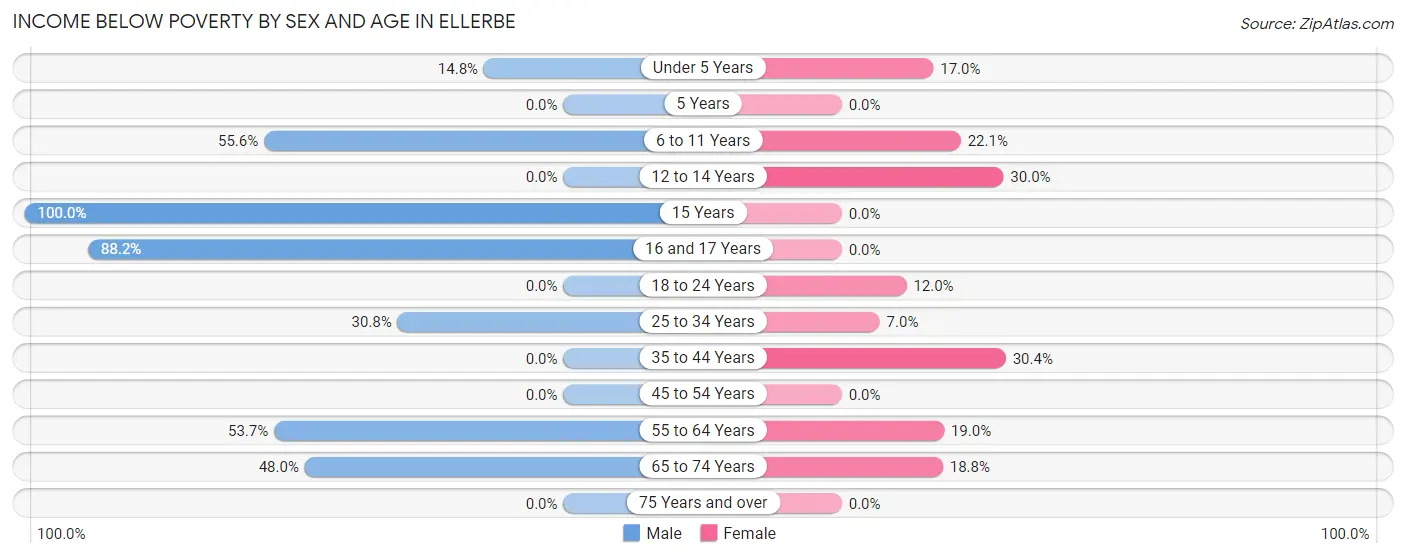
| Age Bracket | Male | Female |
| Under 5 Years | 9 (14.7%) | 9 (17.0%) |
| 5 Years | 0 (0.0%) | 0 (0.0%) |
| 6 to 11 Years | 20 (55.6%) | 17 (22.1%) |
| 12 to 14 Years | 0 (0.0%) | 18 (30.0%) |
| 15 Years | 5 (100.0%) | 0 (0.0%) |
| 16 and 17 Years | 15 (88.2%) | 0 (0.0%) |
| 18 to 24 Years | 0 (0.0%) | 9 (12.0%) |
| 25 to 34 Years | 24 (30.8%) | 9 (7.0%) |
| 35 to 44 Years | 0 (0.0%) | 14 (30.4%) |
| 45 to 54 Years | 0 (0.0%) | 0 (0.0%) |
| 55 to 64 Years | 29 (53.7%) | 11 (19.0%) |
| 65 to 74 Years | 12 (48.0%) | 3 (18.8%) |
| 75 Years and over | 0 (0.0%) | 0 (0.0%) |
| Total | 114 (24.2%) | 90 (13.1%) |
Income Above Poverty by Sex and Age in Ellerbe
According to the poverty statistics in Ellerbe, males aged 18 to 24 years and females aged 5 years are the age groups that are most secure financially, with 100.0% of males and 100.0% of females in these age groups living above the poverty line.
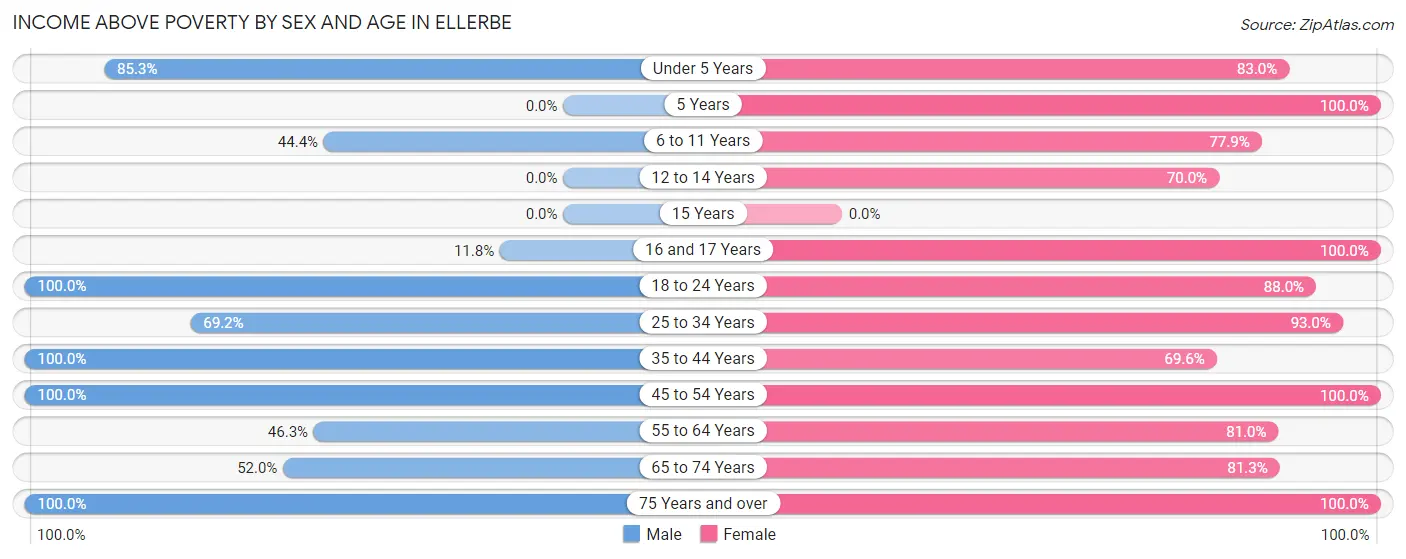
| Age Bracket | Male | Female |
| Under 5 Years | 52 (85.3%) | 44 (83.0%) |
| 5 Years | 0 (0.0%) | 3 (100.0%) |
| 6 to 11 Years | 16 (44.4%) | 60 (77.9%) |
| 12 to 14 Years | 0 (0.0%) | 42 (70.0%) |
| 15 Years | 0 (0.0%) | 0 (0.0%) |
| 16 and 17 Years | 2 (11.8%) | 4 (100.0%) |
| 18 to 24 Years | 35 (100.0%) | 66 (88.0%) |
| 25 to 34 Years | 54 (69.2%) | 119 (93.0%) |
| 35 to 44 Years | 52 (100.0%) | 32 (69.6%) |
| 45 to 54 Years | 61 (100.0%) | 89 (100.0%) |
| 55 to 64 Years | 25 (46.3%) | 47 (81.0%) |
| 65 to 74 Years | 13 (52.0%) | 13 (81.2%) |
| 75 Years and over | 47 (100.0%) | 76 (100.0%) |
| Total | 357 (75.8%) | 595 (86.9%) |
Income Below Poverty Among Married-Couple Families in Ellerbe
The poverty statistics for married-couple families in Ellerbe show that 19.0% or 35 of the total 184 families live below the poverty line. Families with 3 or 4 children have the highest poverty rate of 88.9%, comprising of 24 families. On the other hand, families with no children have the lowest poverty rate of 0.0%, which includes 0 families.
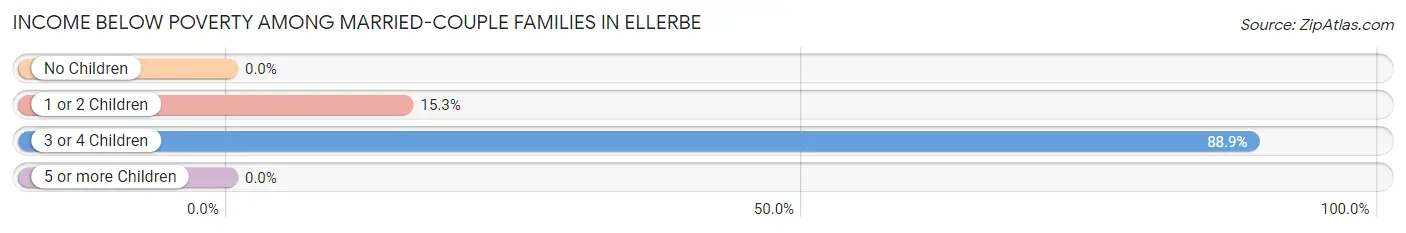
| Children | Above Poverty | Below Poverty |
| No Children | 85 (100.0%) | 0 (0.0%) |
| 1 or 2 Children | 61 (84.7%) | 11 (15.3%) |
| 3 or 4 Children | 3 (11.1%) | 24 (88.9%) |
| 5 or more Children | 0 (0.0%) | 0 (0.0%) |
| Total | 149 (81.0%) | 35 (19.0%) |
Income Below Poverty Among Single-Parent Households in Ellerbe
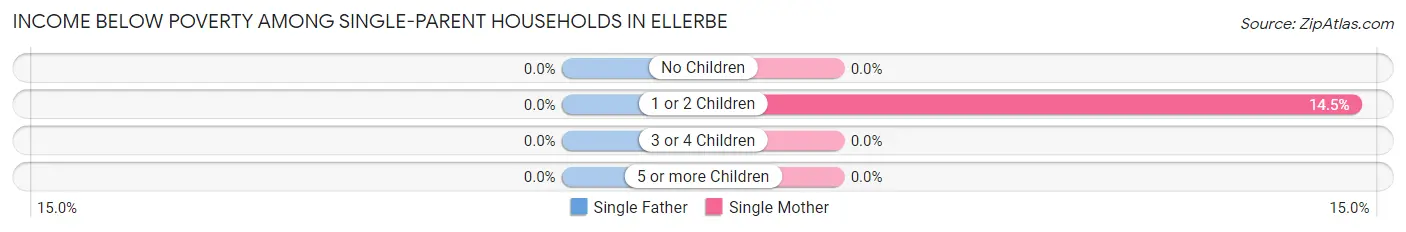
| Children | Single Father | Single Mother |
| No Children | 0 (0.0%) | 0 (0.0%) |
| 1 or 2 Children | 0 (0.0%) | 12 (14.5%) |
| 3 or 4 Children | 0 (0.0%) | 0 (0.0%) |
| 5 or more Children | 0 (0.0%) | 0 (0.0%) |
| Total | 0 (0.0%) | 12 (11.0%) |
Income Below Poverty Among Married-Couple vs Single-Parent Households in Ellerbe
The poverty data for Ellerbe shows that 35 of the married-couple family households (19.0%) and 12 of the single-parent households (9.5%) are living below the poverty level. Within the married-couple family households, those with 3 or 4 children have the highest poverty rate, with 24 households (88.9%) falling below the poverty line. Among the single-parent households, those with 1 or 2 children have the highest poverty rate, with 12 household (12.2%) living below poverty.
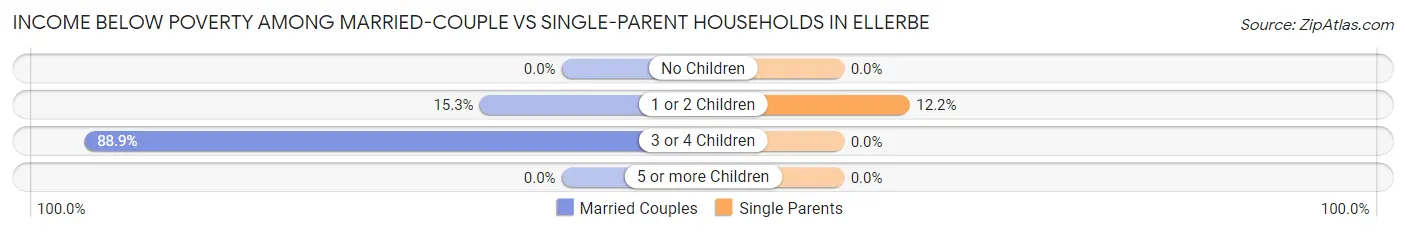
| Children | Married-Couple Families | Single-Parent Households |
| No Children | 0 (0.0%) | 0 (0.0%) |
| 1 or 2 Children | 11 (15.3%) | 12 (12.2%) |
| 3 or 4 Children | 24 (88.9%) | 0 (0.0%) |
| 5 or more Children | 0 (0.0%) | 0 (0.0%) |
| Total | 35 (19.0%) | 12 (9.5%) |
Race in Ellerbe
The most populous races in Ellerbe are Black / African American (546 | 47.2%), White / Caucasian (414 | 35.8%), and Hispanic or Latino (158 | 13.7%).
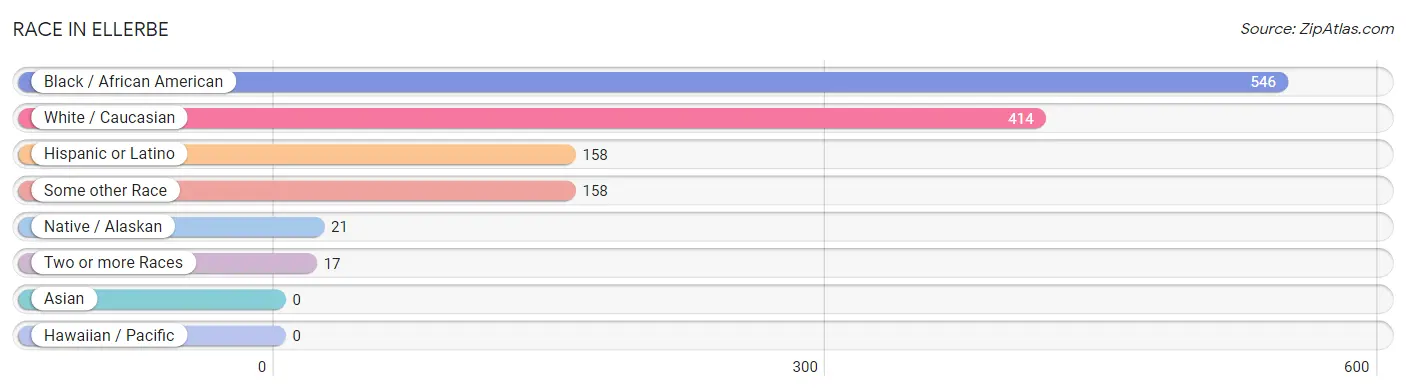
| Race | # Population | % Population |
| Asian | 0 | 0.0% |
| Black / African American | 546 | 47.2% |
| Hawaiian / Pacific | 0 | 0.0% |
| Hispanic or Latino | 158 | 13.7% |
| Native / Alaskan | 21 | 1.8% |
| White / Caucasian | 414 | 35.8% |
| Two or more Races | 17 | 1.5% |
| Some other Race | 158 | 13.7% |
| Total | 1,156 | 100.0% |
Ancestry in Ellerbe
The most populous ancestries reported in Ellerbe are Mexican (82 | 7.1%), Puerto Rican (73 | 6.3%), American (61 | 5.3%), English (47 | 4.1%), and Scotch-Irish (23 | 2.0%), together accounting for 24.7% of all Ellerbe residents.
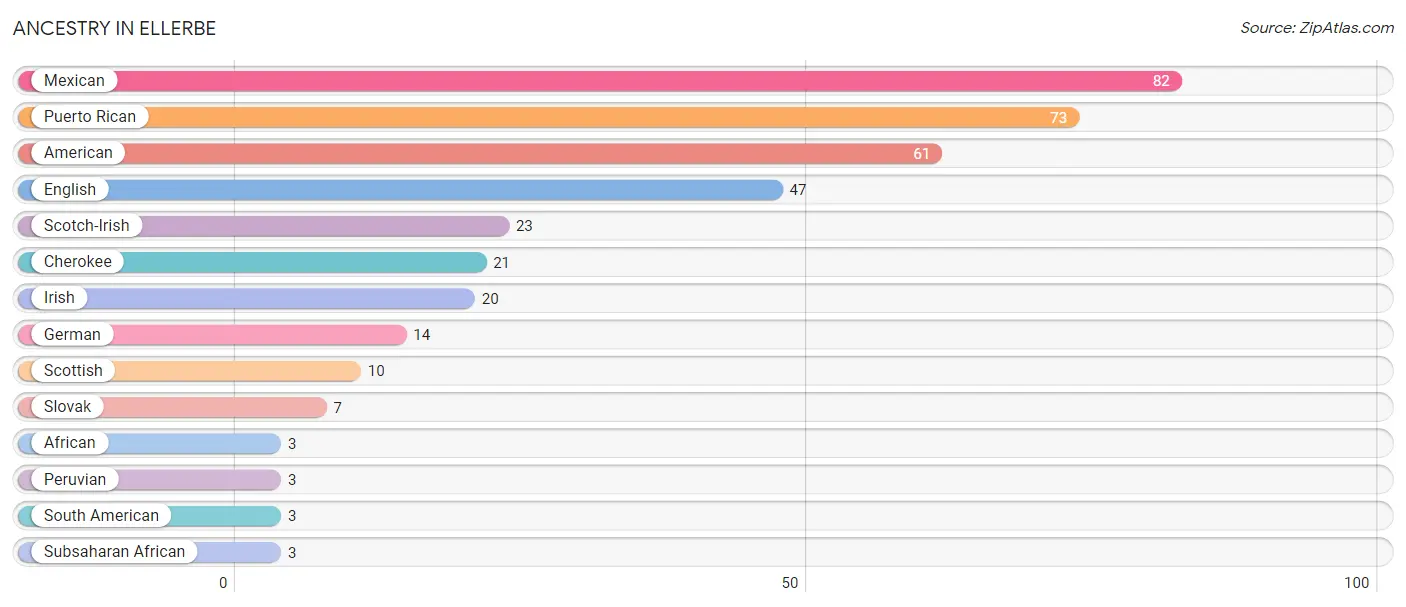
| Ancestry | # Population | % Population |
| African | 3 | 0.3% |
| American | 61 | 5.3% |
| Cherokee | 21 | 1.8% |
| English | 47 | 4.1% |
| German | 14 | 1.2% |
| Irish | 20 | 1.7% |
| Mexican | 82 | 7.1% |
| Peruvian | 3 | 0.3% |
| Puerto Rican | 73 | 6.3% |
| Scotch-Irish | 23 | 2.0% |
| Scottish | 10 | 0.9% |
| Slovak | 7 | 0.6% |
| South American | 3 | 0.3% |
| Subsaharan African | 3 | 0.3% | View All 14 Rows |
Immigrants in Ellerbe
The most numerous immigrant groups reported in Ellerbe came from Latin America (47 | 4.1%), Central America (39 | 3.4%), Mexico (39 | 3.4%), Peru (8 | 0.7%), and South America (8 | 0.7%), together accounting for 12.2% of all Ellerbe residents.
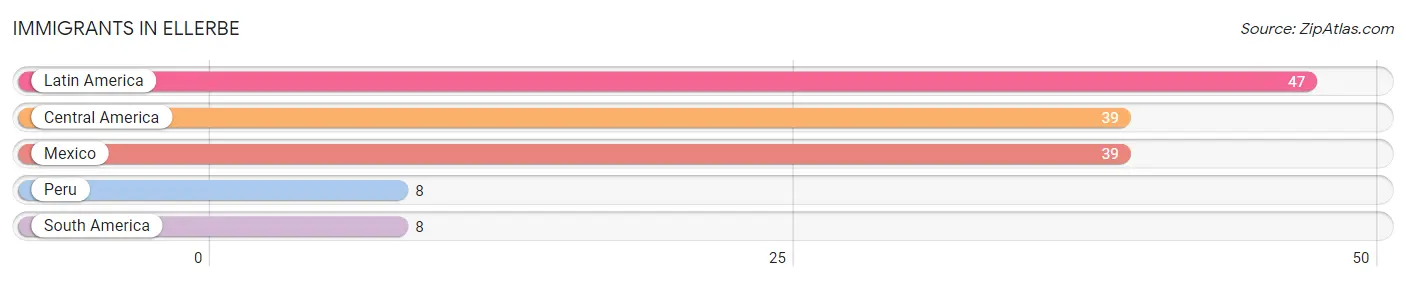
| Immigration Origin | # Population | % Population |
| Central America | 39 | 3.4% |
| Latin America | 47 | 4.1% |
| Mexico | 39 | 3.4% |
| Peru | 8 | 0.7% |
| South America | 8 | 0.7% | View All 5 Rows |
Sex and Age in Ellerbe
Sex and Age in Ellerbe
The most populous age groups in Ellerbe are Under 5 Years (61 | 13.0%) for men and 5 to 9 Years (80 | 11.7%) for women.
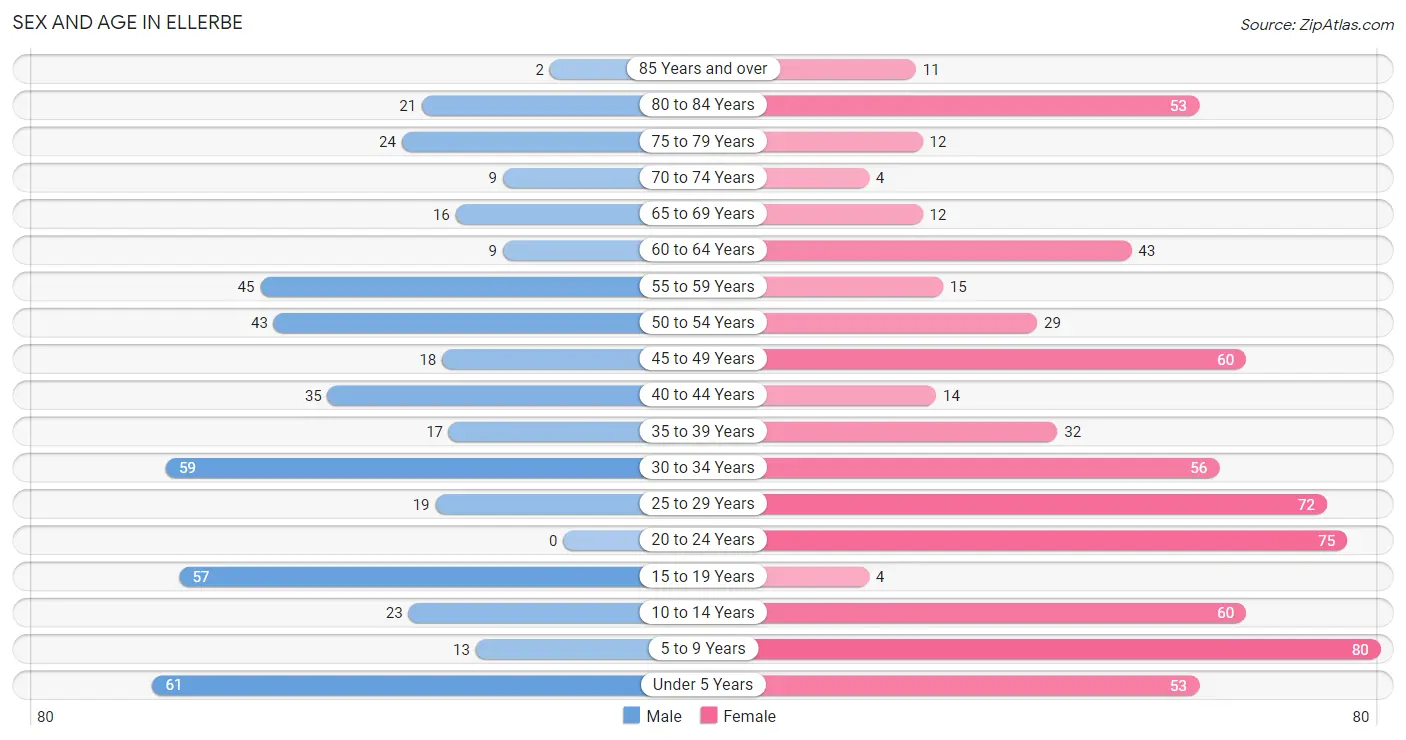
| Age Bracket | Male | Female |
| Under 5 Years | 61 (13.0%) | 53 (7.7%) |
| 5 to 9 Years | 13 (2.8%) | 80 (11.7%) |
| 10 to 14 Years | 23 (4.9%) | 60 (8.8%) |
| 15 to 19 Years | 57 (12.1%) | 4 (0.6%) |
| 20 to 24 Years | 0 (0.0%) | 75 (11.0%) |
| 25 to 29 Years | 19 (4.0%) | 72 (10.5%) |
| 30 to 34 Years | 59 (12.5%) | 56 (8.2%) |
| 35 to 39 Years | 17 (3.6%) | 32 (4.7%) |
| 40 to 44 Years | 35 (7.4%) | 14 (2.0%) |
| 45 to 49 Years | 18 (3.8%) | 60 (8.8%) |
| 50 to 54 Years | 43 (9.1%) | 29 (4.2%) |
| 55 to 59 Years | 45 (9.6%) | 15 (2.2%) |
| 60 to 64 Years | 9 (1.9%) | 43 (6.3%) |
| 65 to 69 Years | 16 (3.4%) | 12 (1.8%) |
| 70 to 74 Years | 9 (1.9%) | 4 (0.6%) |
| 75 to 79 Years | 24 (5.1%) | 12 (1.8%) |
| 80 to 84 Years | 21 (4.5%) | 53 (7.7%) |
| 85 Years and over | 2 (0.4%) | 11 (1.6%) |
| Total | 471 (100.0%) | 685 (100.0%) |
Families and Households in Ellerbe
Median Family Size in Ellerbe
The median family size in Ellerbe is 2.97 persons per family, with single female/mother families (109 | 35.0%) accounting for the largest median family size of 3.84 persons per family. On the other hand, single male/father families (18 | 5.8%) represent the smallest median family size with 2.00 persons per family.
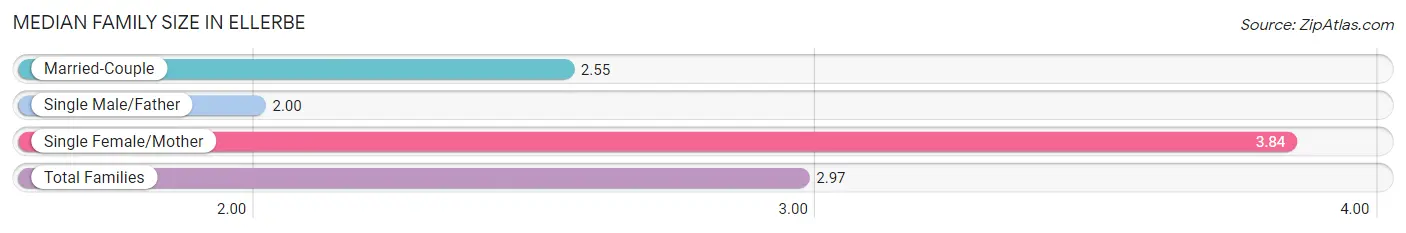
| Family Type | # Families | Family Size |
| Married-Couple | 184 (59.2%) | 2.55 |
| Single Male/Father | 18 (5.8%) | 2.00 |
| Single Female/Mother | 109 (35.0%) | 3.84 |
| Total Families | 311 (100.0%) | 2.97 |
Median Household Size in Ellerbe
The median household size in Ellerbe is 2.40 persons per household, with single female/mother households (109 | 22.8%) accounting for the largest median household size of 3.98 persons per household. non-family households (167 | 34.9%) represent the smallest median household size with 1.25 persons per household.
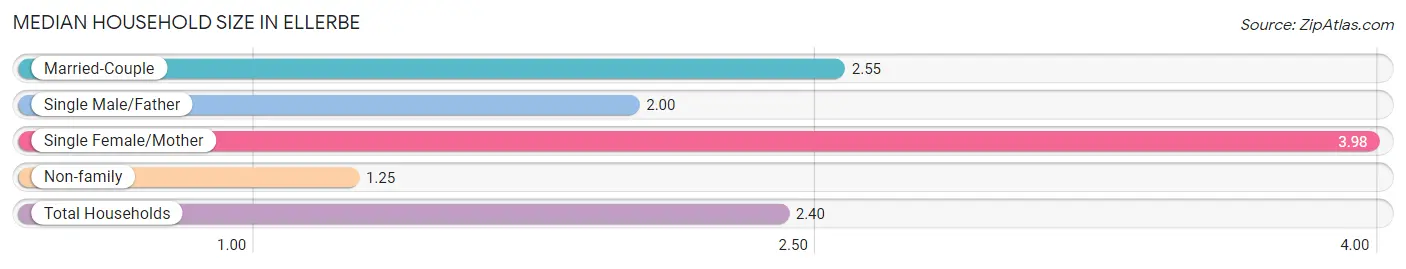
| Household Type | # Households | Household Size |
| Married-Couple | 184 (38.5%) | 2.55 |
| Single Male/Father | 18 (3.8%) | 2.00 |
| Single Female/Mother | 109 (22.8%) | 3.98 |
| Non-family | 167 (34.9%) | 1.25 |
| Total Households | 478 (100.0%) | 2.40 |
Household Size by Marriage Status in Ellerbe
Out of a total of 478 households in Ellerbe, 311 (65.1%) are family households, while 167 (34.9%) are nonfamily households. The most numerous type of family households are 2-person households, comprising 122, and the most common type of nonfamily households are 1-person households, comprising 150.
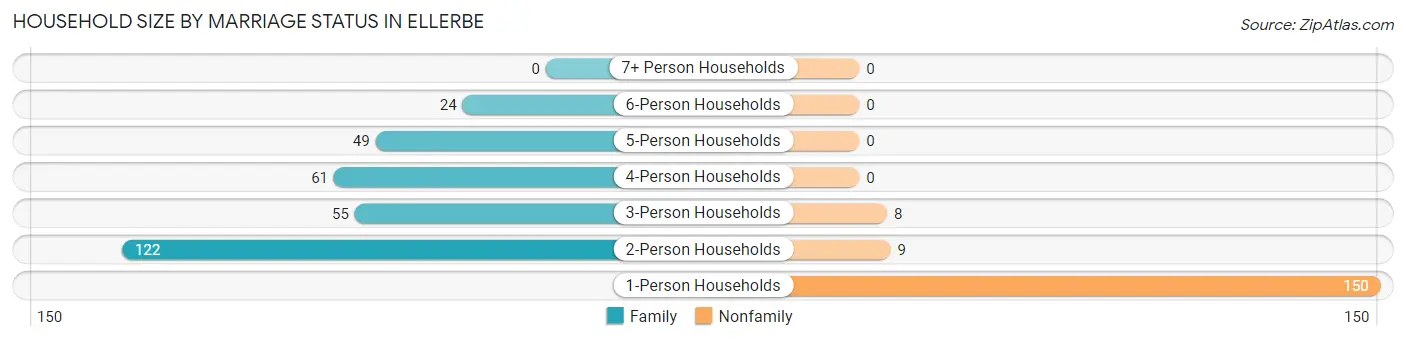
| Household Size | Family Households | Nonfamily Households |
| 1-Person Households | - | 150 (31.4%) |
| 2-Person Households | 122 (25.5%) | 9 (1.9%) |
| 3-Person Households | 55 (11.5%) | 8 (1.7%) |
| 4-Person Households | 61 (12.8%) | 0 (0.0%) |
| 5-Person Households | 49 (10.2%) | 0 (0.0%) |
| 6-Person Households | 24 (5.0%) | 0 (0.0%) |
| 7+ Person Households | 0 (0.0%) | 0 (0.0%) |
| Total | 311 (65.1%) | 167 (34.9%) |
Female Fertility in Ellerbe
Fertility by Age in Ellerbe
| Age Bracket | Women with Births | Births / 1,000 Women |
| 15 to 19 years | 0 (0.0%) | 0.0 |
| 20 to 34 years | 0 (0.0%) | 0.0 |
| 35 to 50 years | 0 (0.0%) | 0.0 |
| Total | 0 (0.0%) | 0.0 |
Fertility by Age by Marriage Status in Ellerbe
| Age Bracket | Married | Unmarried |
| 15 to 19 years | 0 (0.0%) | 0 (0.0%) |
| 20 to 34 years | 0 (0.0%) | 0 (0.0%) |
| 35 to 50 years | 0 (0.0%) | 0 (0.0%) |
| Total | 0 (0.0%) | 0 (0.0%) |
Fertility by Education in Ellerbe
| Educational Attainment | Women with Births | Births / 1,000 Women |
| Less than High School | 0 (0.0%) | 0.0 |
| High School Diploma | 0 (0.0%) | 0.0 |
| College or Associate's Degree | 0 (0.0%) | 0.0 |
| Bachelor's Degree | 0 (0.0%) | 0.0 |
| Graduate Degree | 0 (0.0%) | 0.0 |
| Total | 0 (0.0%) | 0.0 |
Fertility by Education by Marriage Status in Ellerbe
| Educational Attainment | Married | Unmarried |
| Less than High School | 0 (0.0%) | 0 (0.0%) |
| High School Diploma | 0 (0.0%) | 0 (0.0%) |
| College or Associate's Degree | 0 (0.0%) | 0 (0.0%) |
| Bachelor's Degree | 0 (0.0%) | 0 (0.0%) |
| Graduate Degree | 0 (0.0%) | 0 (0.0%) |
| Total | 0 (0.0%) | 0 (0.0%) |
Employment Characteristics in Ellerbe
Employment by Class of Employer in Ellerbe
Among the 473 employed individuals in Ellerbe, private company employees (345 | 72.9%), state government employees (62 | 13.1%), and local government employees (29 | 6.1%) make up the most common classes of employment.
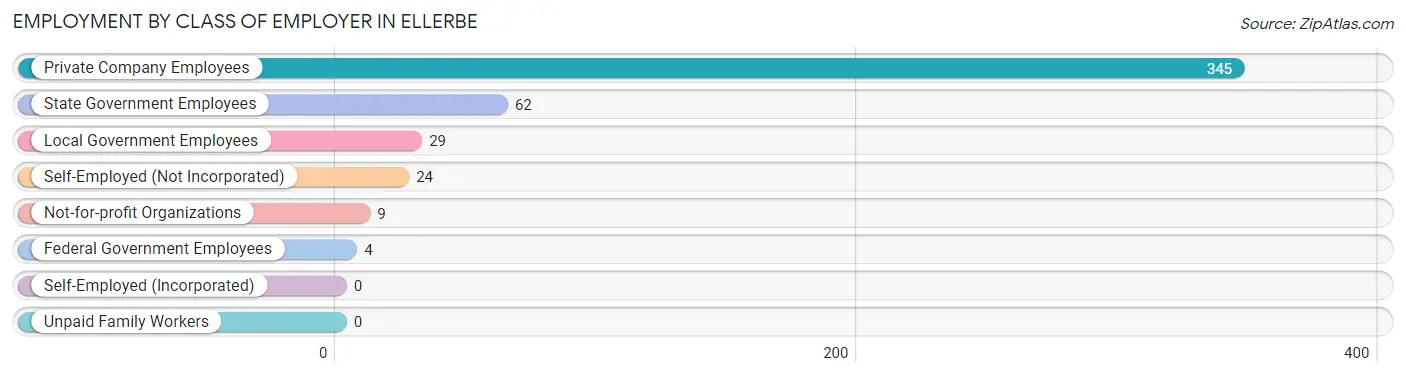
| Employer Class | # Employees | % Employees |
| Private Company Employees | 345 | 72.9% |
| Self-Employed (Incorporated) | 0 | 0.0% |
| Self-Employed (Not Incorporated) | 24 | 5.1% |
| Not-for-profit Organizations | 9 | 1.9% |
| Local Government Employees | 29 | 6.1% |
| State Government Employees | 62 | 13.1% |
| Federal Government Employees | 4 | 0.9% |
| Unpaid Family Workers | 0 | 0.0% |
| Total | 473 | 100.0% |
Employment Status by Age in Ellerbe
According to the labor force statistics for Ellerbe, out of the total population over 16 years of age (861), 68.4% or 589 individuals are in the labor force, with 19.8% or 117 of them unemployed. The age group with the highest labor force participation rate is 20 to 24 years, with 100.0% or 75 individuals in the labor force. Within the labor force, the 25 to 29 years age range has the highest percentage of unemployed individuals, with 59.8% or 54 of them being unemployed.
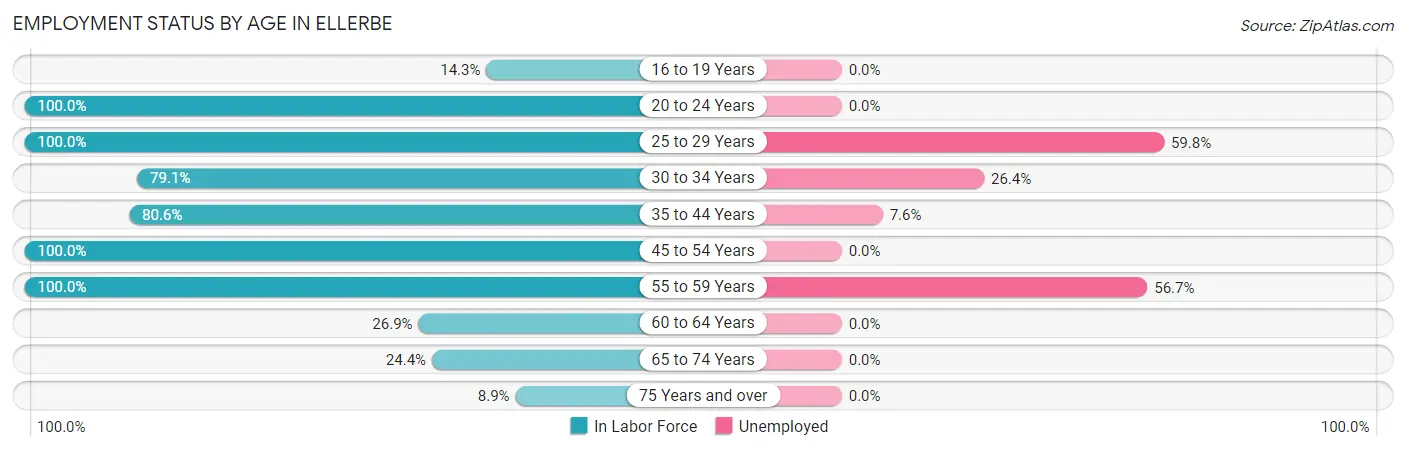
| Age Bracket | In Labor Force | Unemployed |
| 16 to 19 Years | 8 (14.3%) | 0 (0.0%) |
| 20 to 24 Years | 75 (100.0%) | 0 (0.0%) |
| 25 to 29 Years | 91 (100.0%) | 54 (59.8%) |
| 30 to 34 Years | 91 (79.1%) | 24 (26.4%) |
| 35 to 44 Years | 79 (80.6%) | 6 (7.6%) |
| 45 to 54 Years | 150 (100.0%) | 0 (0.0%) |
| 55 to 59 Years | 60 (100.0%) | 34 (56.7%) |
| 60 to 64 Years | 14 (26.9%) | 0 (0.0%) |
| 65 to 74 Years | 10 (24.4%) | 0 (0.0%) |
| 75 Years and over | 11 (8.9%) | 0 (0.0%) |
| Total | 589 (68.4%) | 117 (19.8%) |
Employment Status by Educational Attainment in Ellerbe
According to labor force statistics for Ellerbe, 85.7% of individuals (485) out of the total population between 25 and 64 years of age (566) are in the labor force, with 24.1% or 117 of them being unemployed. The group with the highest labor force participation rate are those with the educational attainment of high school diploma, with 100.0% or 91 individuals in the labor force. Within the labor force, individuals with high school diploma education have the highest percentage of unemployment, with 33.0% or 30 of them being unemployed.
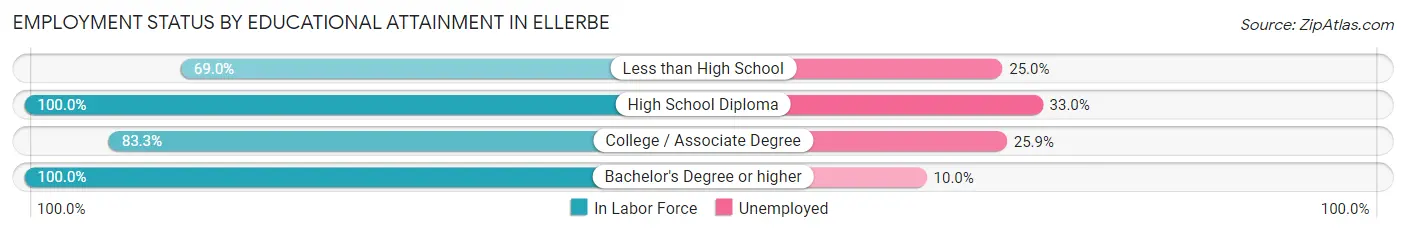
| Educational Attainment | In Labor Force | Unemployed |
| Less than High School | 80 (69.0%) | 29 (25.0%) |
| High School Diploma | 91 (100.0%) | 30 (33.0%) |
| College / Associate Degree | 224 (83.3%) | 70 (25.9%) |
| Bachelor's Degree or higher | 90 (100.0%) | 9 (10.0%) |
| Total | 485 (85.7%) | 136 (24.1%) |
Employment Occupations by Sex in Ellerbe
Management, Business, Science and Arts Occupations
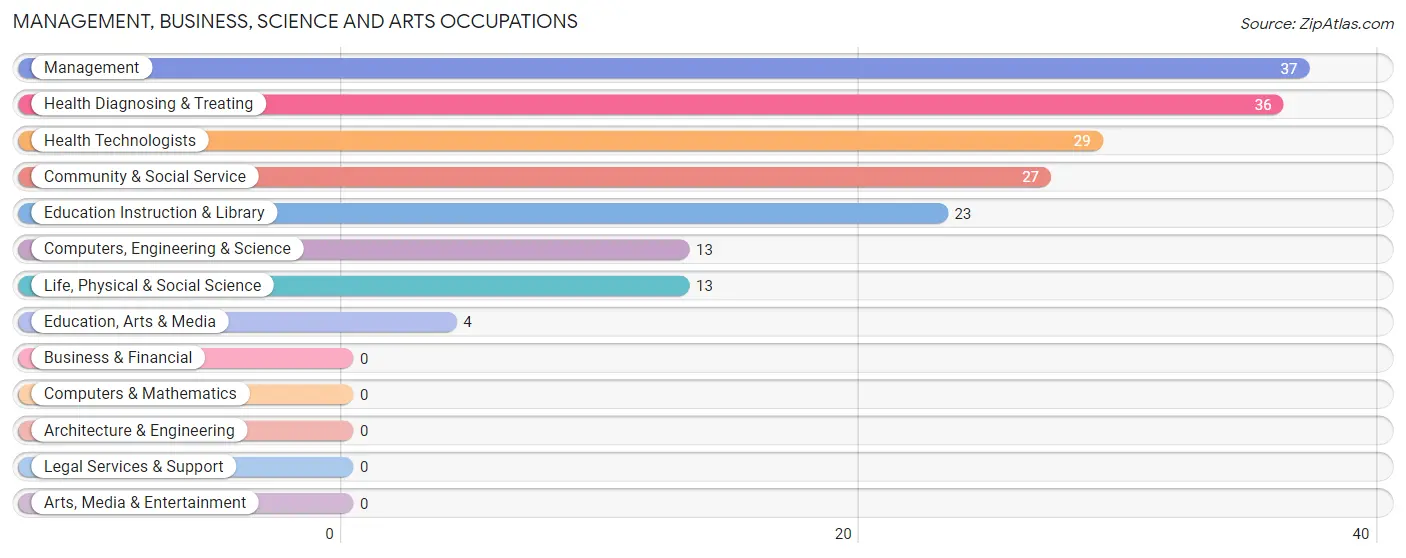
The most common Management, Business, Science and Arts occupations in Ellerbe are Management (37 | 7.9%), Health Diagnosing & Treating (36 | 7.7%), Health Technologists (29 | 6.2%), Community & Social Service (27 | 5.8%), and Education Instruction & Library (23 | 4.9%).
Management, Business, Science and Arts Occupations by Sex
Within the Management, Business, Science and Arts occupations in Ellerbe, the most male-oriented occupations are Computers, Engineering & Science (100.0%), Life, Physical & Social Science (100.0%), and Education, Arts & Media (100.0%), while the most female-oriented occupations are Education Instruction & Library (100.0%), Health Technologists (100.0%), and Community & Social Service (85.2%).
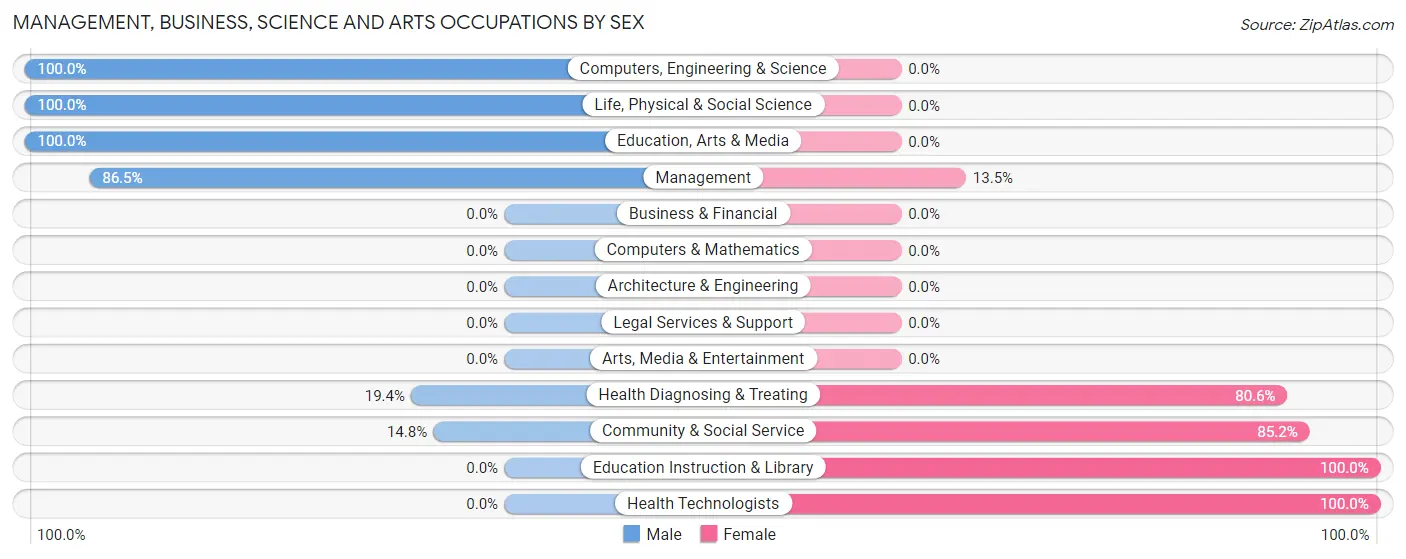
| Occupation | Male | Female |
| Management | 32 (86.5%) | 5 (13.5%) |
| Business & Financial | 0 (0.0%) | 0 (0.0%) |
| Computers, Engineering & Science | 13 (100.0%) | 0 (0.0%) |
| Computers & Mathematics | 0 (0.0%) | 0 (0.0%) |
| Architecture & Engineering | 0 (0.0%) | 0 (0.0%) |
| Life, Physical & Social Science | 13 (100.0%) | 0 (0.0%) |
| Community & Social Service | 4 (14.8%) | 23 (85.2%) |
| Education, Arts & Media | 4 (100.0%) | 0 (0.0%) |
| Legal Services & Support | 0 (0.0%) | 0 (0.0%) |
| Education Instruction & Library | 0 (0.0%) | 23 (100.0%) |
| Arts, Media & Entertainment | 0 (0.0%) | 0 (0.0%) |
| Health Diagnosing & Treating | 7 (19.4%) | 29 (80.6%) |
| Health Technologists | 0 (0.0%) | 29 (100.0%) |
| Total (Category) | 56 (49.6%) | 57 (50.4%) |
| Total (Overall) | 177 (37.7%) | 292 (62.3%) |
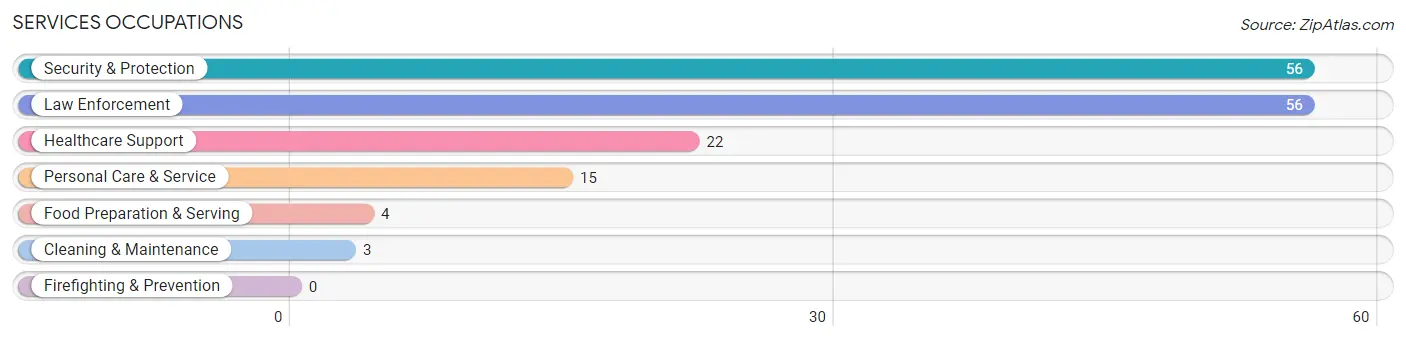
Services Occupations
The most common Services occupations in Ellerbe are Security & Protection (56 | 11.9%), Law Enforcement (56 | 11.9%), Healthcare Support (22 | 4.7%), Personal Care & Service (15 | 3.2%), and Food Preparation & Serving (4 | 0.9%).
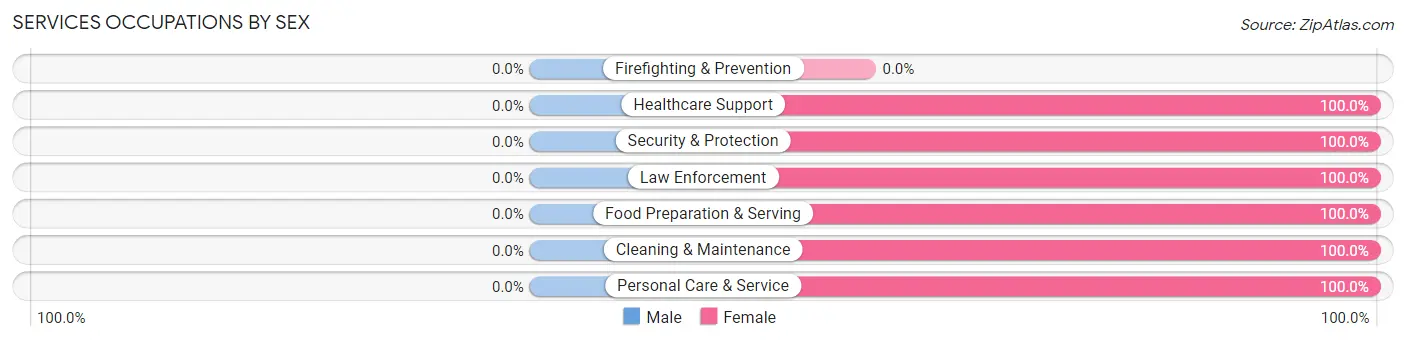
Services Occupations by Sex
| Occupation | Male | Female |
| Healthcare Support | 0 (0.0%) | 22 (100.0%) |
| Security & Protection | 0 (0.0%) | 56 (100.0%) |
| Firefighting & Prevention | 0 (0.0%) | 0 (0.0%) |
| Law Enforcement | 0 (0.0%) | 56 (100.0%) |
| Food Preparation & Serving | 0 (0.0%) | 4 (100.0%) |
| Cleaning & Maintenance | 0 (0.0%) | 3 (100.0%) |
| Personal Care & Service | 0 (0.0%) | 15 (100.0%) |
| Total (Category) | 0 (0.0%) | 100 (100.0%) |
| Total (Overall) | 177 (37.7%) | 292 (62.3%) |
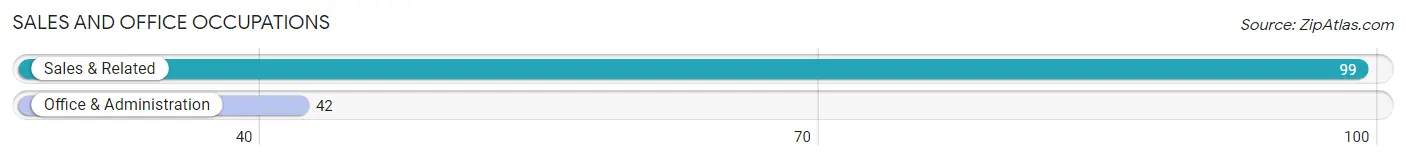
Sales and Office Occupations
The most common Sales and Office occupations in Ellerbe are Sales & Related (99 | 21.1%), and Office & Administration (42 | 9.0%).
Sales and Office Occupations by Sex
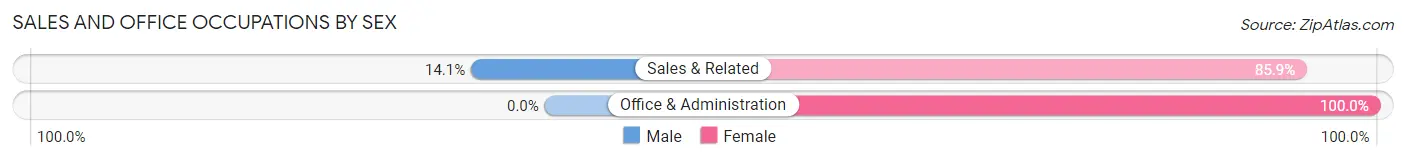
| Occupation | Male | Female |
| Sales & Related | 14 (14.1%) | 85 (85.9%) |
| Office & Administration | 0 (0.0%) | 42 (100.0%) |
| Total (Category) | 14 (9.9%) | 127 (90.1%) |
| Total (Overall) | 177 (37.7%) | 292 (62.3%) |
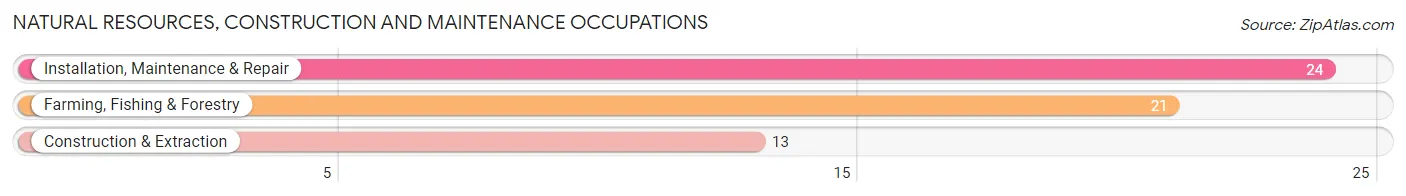
Natural Resources, Construction and Maintenance Occupations
The most common Natural Resources, Construction and Maintenance occupations in Ellerbe are Installation, Maintenance & Repair (24 | 5.1%), Farming, Fishing & Forestry (21 | 4.5%), and Construction & Extraction (13 | 2.8%).
Natural Resources, Construction and Maintenance Occupations by Sex
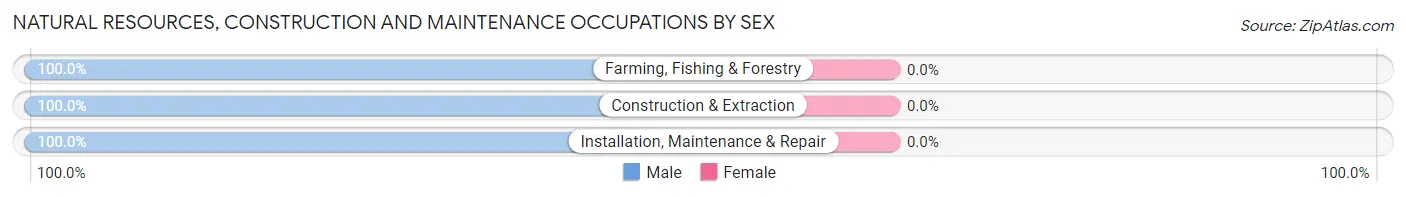
| Occupation | Male | Female |
| Farming, Fishing & Forestry | 21 (100.0%) | 0 (0.0%) |
| Construction & Extraction | 13 (100.0%) | 0 (0.0%) |
| Installation, Maintenance & Repair | 24 (100.0%) | 0 (0.0%) |
| Total (Category) | 58 (100.0%) | 0 (0.0%) |
| Total (Overall) | 177 (37.7%) | 292 (62.3%) |
Production, Transportation and Moving Occupations
The most common Production, Transportation and Moving occupations in Ellerbe are Production (38 | 8.1%), and Material Moving (19 | 4.1%).
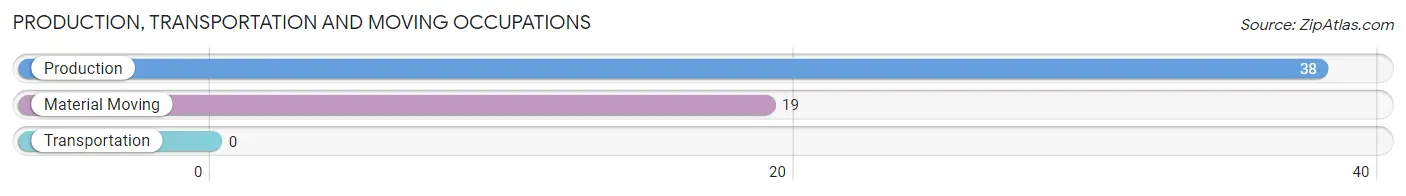
Production, Transportation and Moving Occupations by Sex
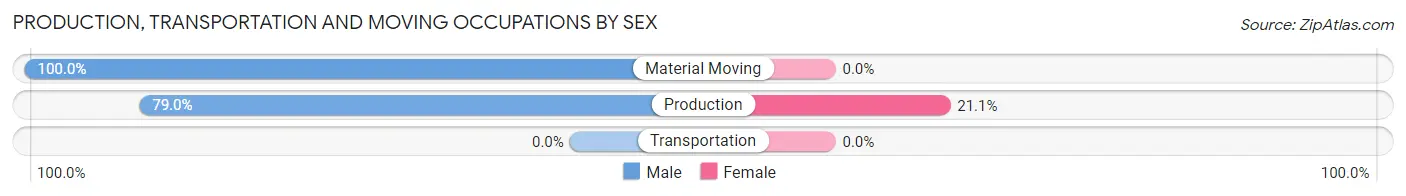
| Occupation | Male | Female |
| Production | 30 (78.9%) | 8 (21.0%) |
| Transportation | 0 (0.0%) | 0 (0.0%) |
| Material Moving | 19 (100.0%) | 0 (0.0%) |
| Total (Category) | 49 (86.0%) | 8 (14.0%) |
| Total (Overall) | 177 (37.7%) | 292 (62.3%) |
Employment Industries by Sex in Ellerbe
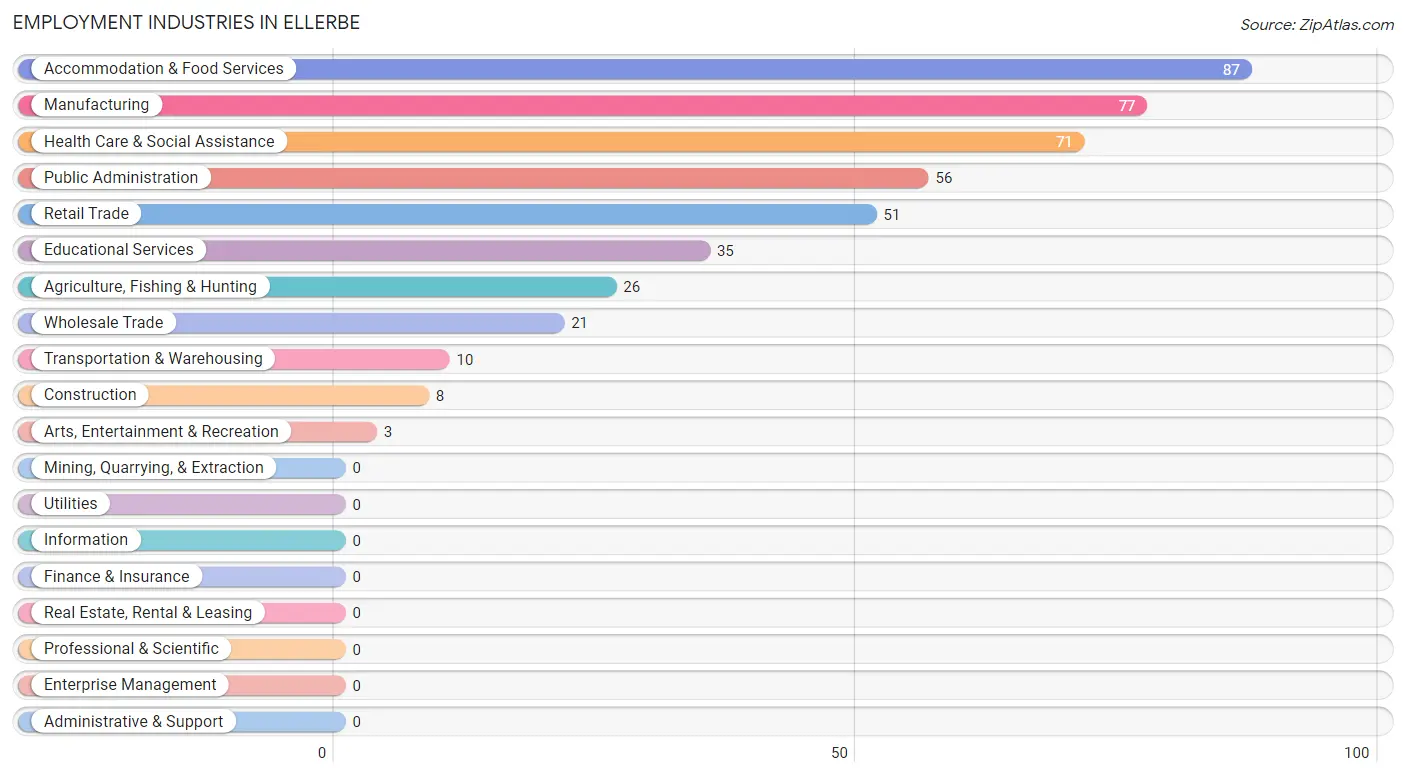
Employment Industries in Ellerbe
The major employment industries in Ellerbe include Accommodation & Food Services (87 | 18.5%), Manufacturing (77 | 16.4%), Health Care & Social Assistance (71 | 15.1%), Public Administration (56 | 11.9%), and Retail Trade (51 | 10.9%).
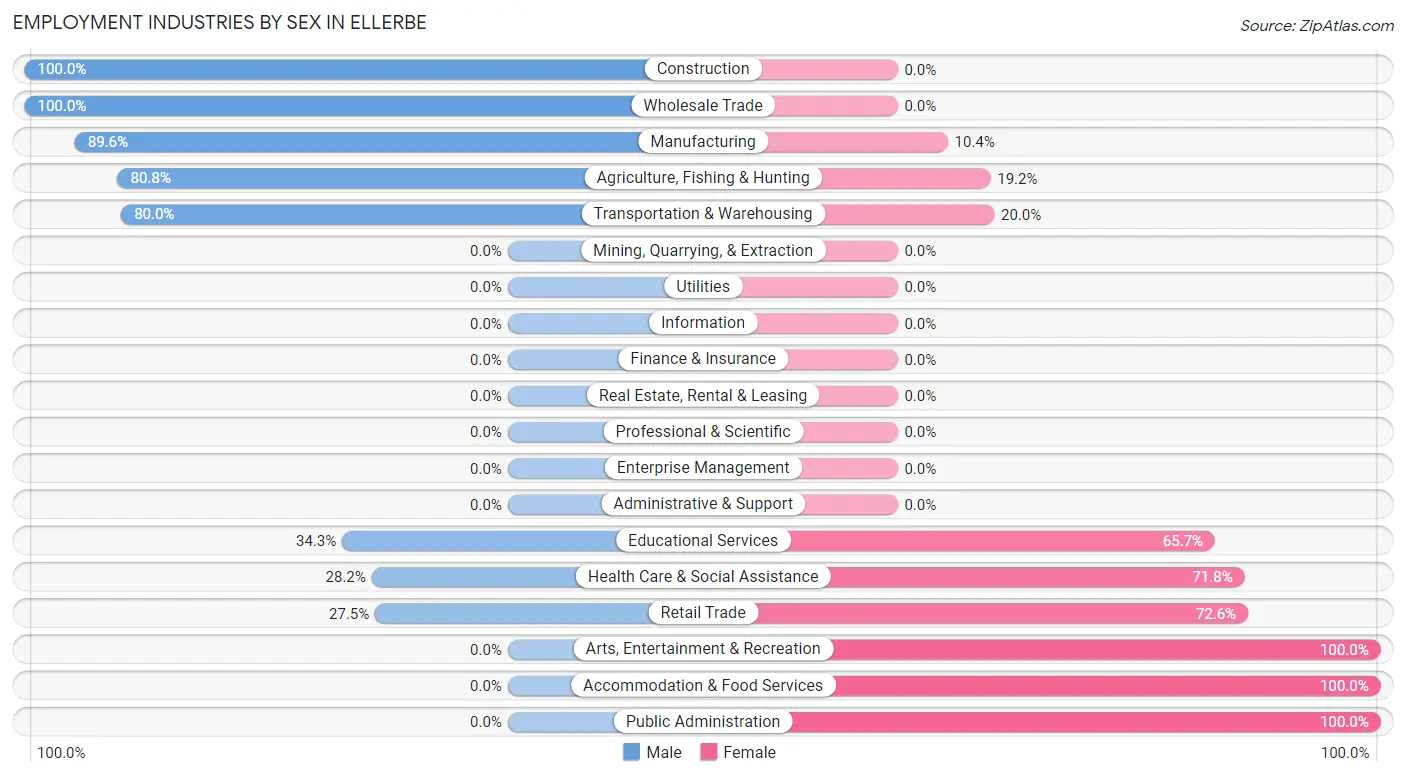
Employment Industries by Sex in Ellerbe
The Ellerbe industries that see more men than women are Construction (100.0%), Wholesale Trade (100.0%), and Manufacturing (89.6%), whereas the industries that tend to have a higher number of women are Arts, Entertainment & Recreation (100.0%), Accommodation & Food Services (100.0%), and Public Administration (100.0%).
| Industry | Male | Female |
| Agriculture, Fishing & Hunting | 21 (80.8%) | 5 (19.2%) |
| Mining, Quarrying, & Extraction | 0 (0.0%) | 0 (0.0%) |
| Construction | 8 (100.0%) | 0 (0.0%) |
| Manufacturing | 69 (89.6%) | 8 (10.4%) |
| Wholesale Trade | 21 (100.0%) | 0 (0.0%) |
| Retail Trade | 14 (27.5%) | 37 (72.6%) |
| Transportation & Warehousing | 8 (80.0%) | 2 (20.0%) |
| Utilities | 0 (0.0%) | 0 (0.0%) |
| Information | 0 (0.0%) | 0 (0.0%) |
| Finance & Insurance | 0 (0.0%) | 0 (0.0%) |
| Real Estate, Rental & Leasing | 0 (0.0%) | 0 (0.0%) |
| Professional & Scientific | 0 (0.0%) | 0 (0.0%) |
| Enterprise Management | 0 (0.0%) | 0 (0.0%) |
| Administrative & Support | 0 (0.0%) | 0 (0.0%) |
| Educational Services | 12 (34.3%) | 23 (65.7%) |
| Health Care & Social Assistance | 20 (28.2%) | 51 (71.8%) |
| Arts, Entertainment & Recreation | 0 (0.0%) | 3 (100.0%) |
| Accommodation & Food Services | 0 (0.0%) | 87 (100.0%) |
| Public Administration | 0 (0.0%) | 56 (100.0%) |
| Total | 177 (37.7%) | 292 (62.3%) |
Education in Ellerbe
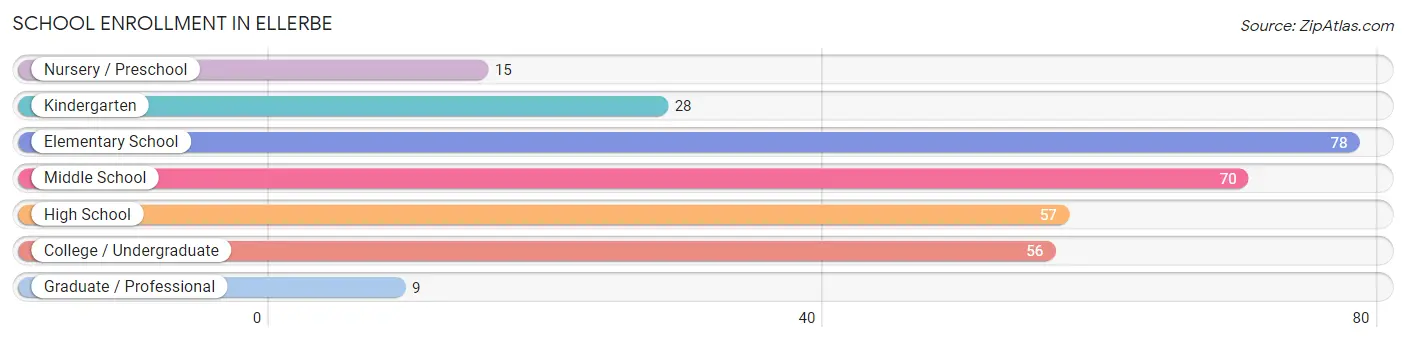
School Enrollment in Ellerbe
The most common levels of schooling among the 313 students in Ellerbe are elementary school (78 | 24.9%), middle school (70 | 22.4%), and high school (57 | 18.2%).
| School Level | # Students | % Students |
| Nursery / Preschool | 15 | 4.8% |
| Kindergarten | 28 | 8.9% |
| Elementary School | 78 | 24.9% |
| Middle School | 70 | 22.4% |
| High School | 57 | 18.2% |
| College / Undergraduate | 56 | 17.9% |
| Graduate / Professional | 9 | 2.9% |
| Total | 313 | 100.0% |
School Enrollment by Age by Funding Source in Ellerbe
Out of a total of 313 students who are enrolled in schools in Ellerbe, 20 (6.4%) attend a private institution, while the remaining 293 (93.6%) are enrolled in public schools. The age group of 5 to 9 year old has the highest likelihood of being enrolled in private schools, with 18 (19.4% in the age bracket) enrolled. Conversely, the age group of 3 to 4 year olds has the lowest likelihood of being enrolled in a private school, with 15 (100.0% in the age bracket) attending a public institution.
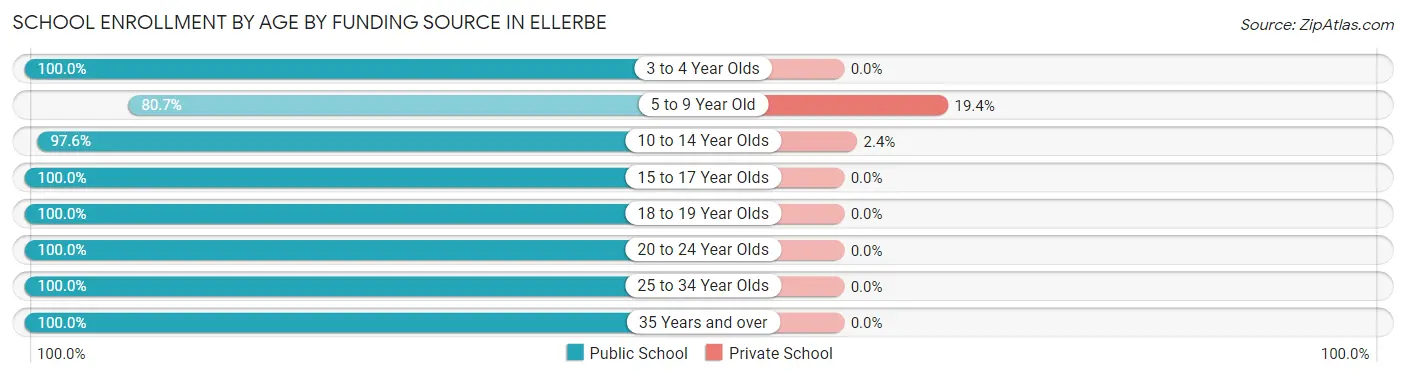
| Age Bracket | Public School | Private School |
| 3 to 4 Year Olds | 15 (100.0%) | 0 (0.0%) |
| 5 to 9 Year Old | 75 (80.6%) | 18 (19.4%) |
| 10 to 14 Year Olds | 81 (97.6%) | 2 (2.4%) |
| 15 to 17 Year Olds | 26 (100.0%) | 0 (0.0%) |
| 18 to 19 Year Olds | 31 (100.0%) | 0 (0.0%) |
| 20 to 24 Year Olds | 9 (100.0%) | 0 (0.0%) |
| 25 to 34 Year Olds | 52 (100.0%) | 0 (0.0%) |
| 35 Years and over | 4 (100.0%) | 0 (0.0%) |
| Total | 293 (93.6%) | 20 (6.4%) |
Educational Attainment by Field of Study in Ellerbe
Science & technology (31 | 27.9%), liberal arts & history (23 | 20.7%), education (16 | 14.4%), computers & mathematics (12 | 10.8%), and social sciences (12 | 10.8%) are the most common fields of study among 111 individuals in Ellerbe who have obtained a bachelor's degree or higher.
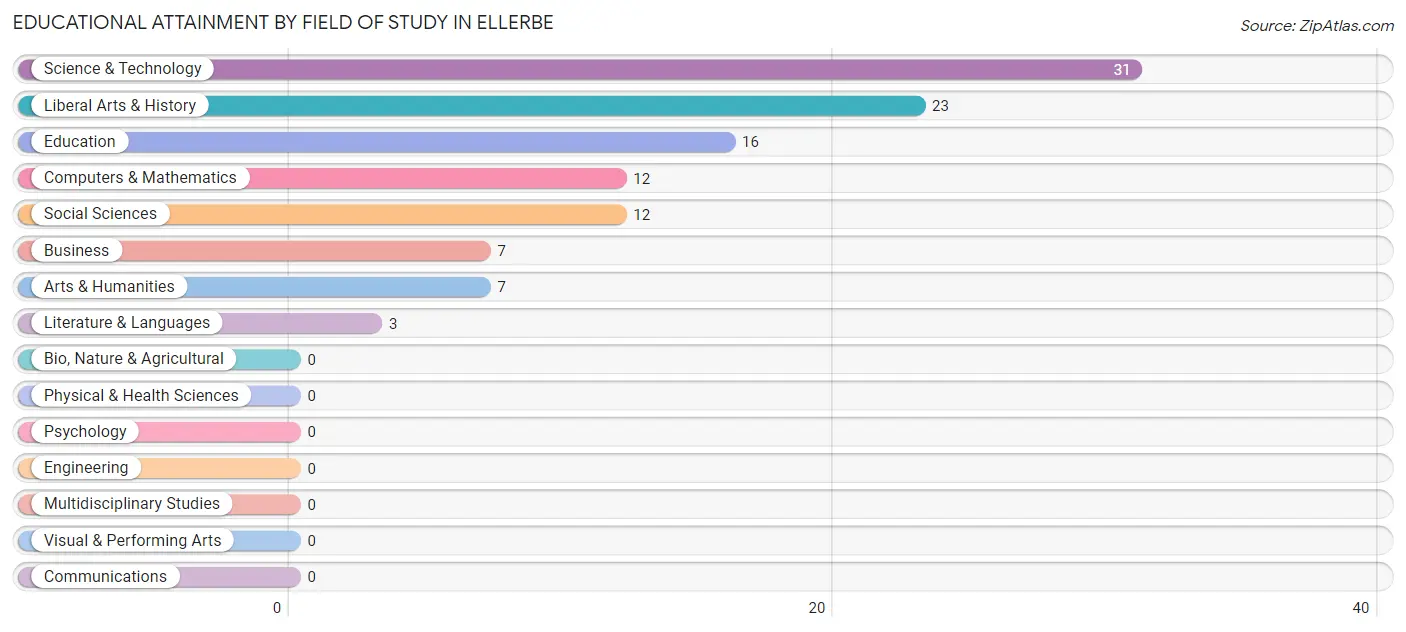
| Field of Study | # Graduates | % Graduates |
| Computers & Mathematics | 12 | 10.8% |
| Bio, Nature & Agricultural | 0 | 0.0% |
| Physical & Health Sciences | 0 | 0.0% |
| Psychology | 0 | 0.0% |
| Social Sciences | 12 | 10.8% |
| Engineering | 0 | 0.0% |
| Multidisciplinary Studies | 0 | 0.0% |
| Science & Technology | 31 | 27.9% |
| Business | 7 | 6.3% |
| Education | 16 | 14.4% |
| Literature & Languages | 3 | 2.7% |
| Liberal Arts & History | 23 | 20.7% |
| Visual & Performing Arts | 0 | 0.0% |
| Communications | 0 | 0.0% |
| Arts & Humanities | 7 | 6.3% |
| Total | 111 | 100.0% |
Transportation & Commute in Ellerbe
Vehicle Availability by Sex in Ellerbe
The most prevalent vehicle ownership categories in Ellerbe are males with 2 vehicles (94, accounting for 51.9%) and females with 2 vehicles (183, making up 32.2%).
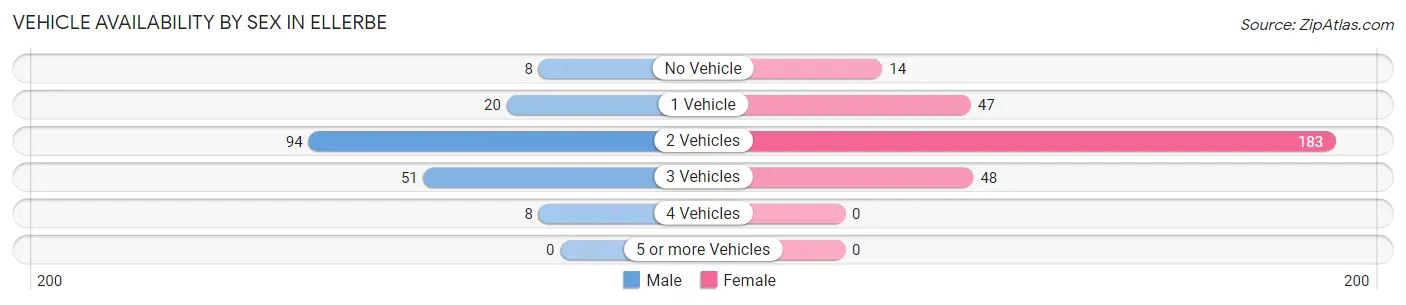
| Vehicles Available | Male | Female |
| No Vehicle | 8 (4.4%) | 14 (4.8%) |
| 1 Vehicle | 20 (11.1%) | 47 (16.1%) |
| 2 Vehicles | 94 (51.9%) | 183 (62.7%) |
| 3 Vehicles | 51 (28.2%) | 48 (16.4%) |
| 4 Vehicles | 8 (4.4%) | 0 (0.0%) |
| 5 or more Vehicles | 0 (0.0%) | 0 (0.0%) |
| Total | 181 (100.0%) | 292 (100.0%) |
Commute Time in Ellerbe
The most frequently occuring commute durations in Ellerbe are 25 to 29 minutes (82 commuters, 17.3%), 45 to 59 minutes (81 commuters, 17.1%), and 20 to 24 minutes (72 commuters, 15.2%).
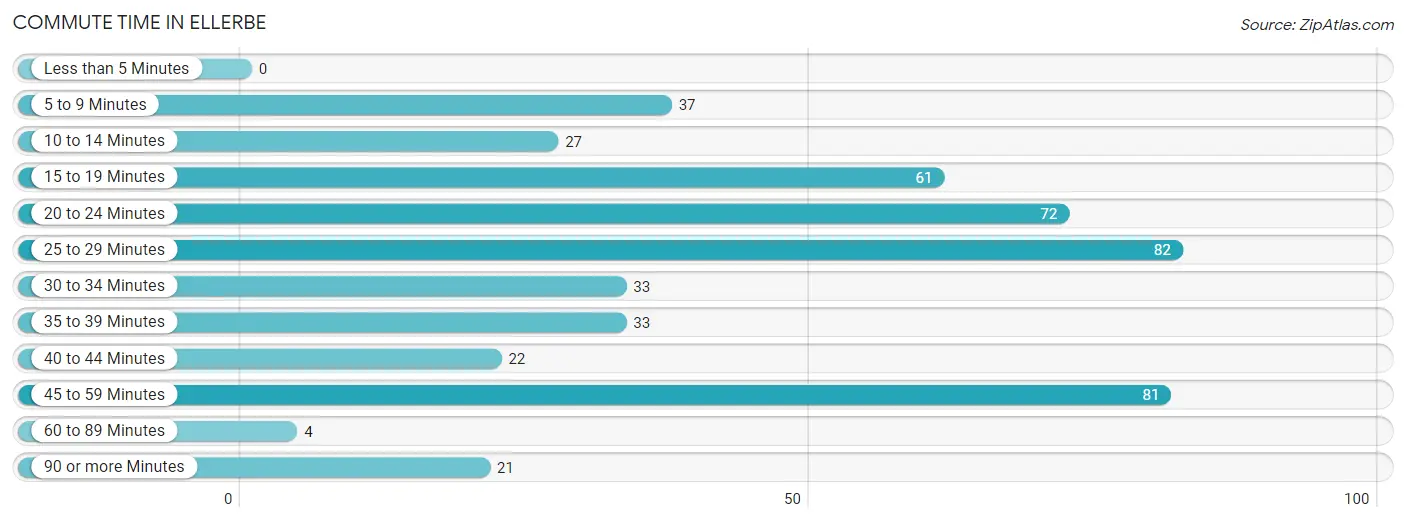
| Commute Time | # Commuters | % Commuters |
| Less than 5 Minutes | 0 | 0.0% |
| 5 to 9 Minutes | 37 | 7.8% |
| 10 to 14 Minutes | 27 | 5.7% |
| 15 to 19 Minutes | 61 | 12.9% |
| 20 to 24 Minutes | 72 | 15.2% |
| 25 to 29 Minutes | 82 | 17.3% |
| 30 to 34 Minutes | 33 | 7.0% |
| 35 to 39 Minutes | 33 | 7.0% |
| 40 to 44 Minutes | 22 | 4.6% |
| 45 to 59 Minutes | 81 | 17.1% |
| 60 to 89 Minutes | 4 | 0.9% |
| 90 or more Minutes | 21 | 4.4% |
Commute Time by Sex in Ellerbe
The most common commute times in Ellerbe are 20 to 24 minutes (46 commuters, 25.4%) for males and 45 to 59 minutes (70 commuters, 24.0%) for females.
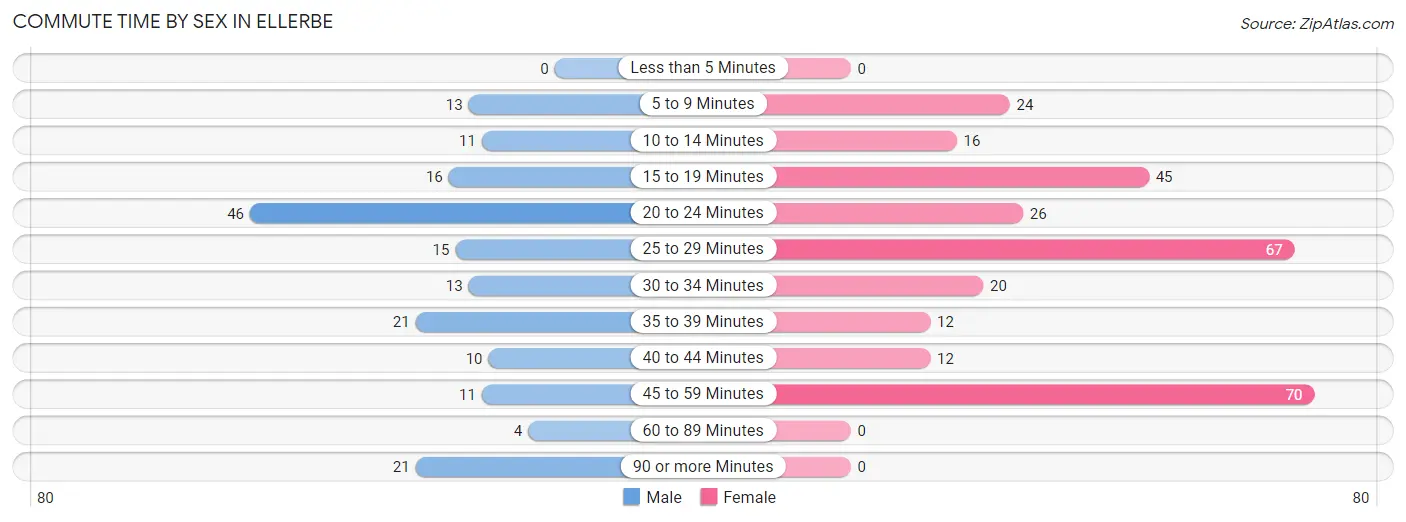
| Commute Time | Male | Female |
| Less than 5 Minutes | 0 (0.0%) | 0 (0.0%) |
| 5 to 9 Minutes | 13 (7.2%) | 24 (8.2%) |
| 10 to 14 Minutes | 11 (6.1%) | 16 (5.5%) |
| 15 to 19 Minutes | 16 (8.8%) | 45 (15.4%) |
| 20 to 24 Minutes | 46 (25.4%) | 26 (8.9%) |
| 25 to 29 Minutes | 15 (8.3%) | 67 (23.0%) |
| 30 to 34 Minutes | 13 (7.2%) | 20 (6.9%) |
| 35 to 39 Minutes | 21 (11.6%) | 12 (4.1%) |
| 40 to 44 Minutes | 10 (5.5%) | 12 (4.1%) |
| 45 to 59 Minutes | 11 (6.1%) | 70 (24.0%) |
| 60 to 89 Minutes | 4 (2.2%) | 0 (0.0%) |
| 90 or more Minutes | 21 (11.6%) | 0 (0.0%) |
Time of Departure to Work by Sex in Ellerbe
The most frequent times of departure to work in Ellerbe are 7:00 AM to 7:29 AM (35, 19.3%) for males and 7:00 AM to 7:29 AM (85, 29.1%) for females.
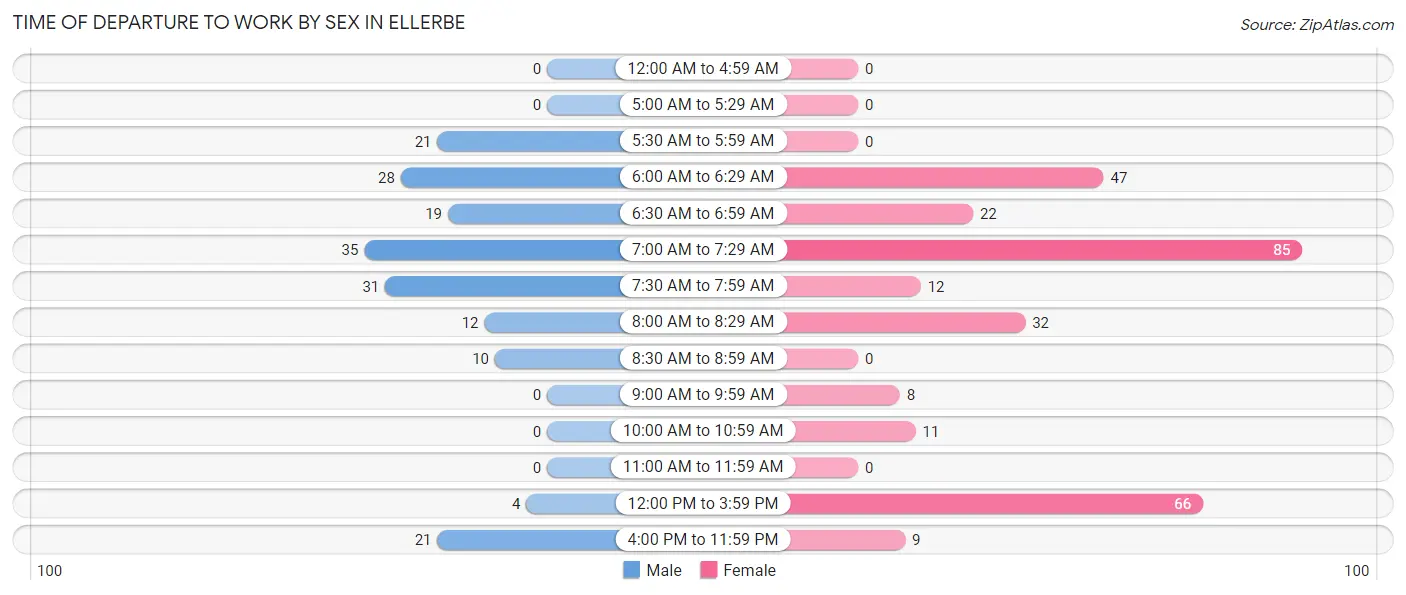
| Time of Departure | Male | Female |
| 12:00 AM to 4:59 AM | 0 (0.0%) | 0 (0.0%) |
| 5:00 AM to 5:29 AM | 0 (0.0%) | 0 (0.0%) |
| 5:30 AM to 5:59 AM | 21 (11.6%) | 0 (0.0%) |
| 6:00 AM to 6:29 AM | 28 (15.5%) | 47 (16.1%) |
| 6:30 AM to 6:59 AM | 19 (10.5%) | 22 (7.5%) |
| 7:00 AM to 7:29 AM | 35 (19.3%) | 85 (29.1%) |
| 7:30 AM to 7:59 AM | 31 (17.1%) | 12 (4.1%) |
| 8:00 AM to 8:29 AM | 12 (6.6%) | 32 (11.0%) |
| 8:30 AM to 8:59 AM | 10 (5.5%) | 0 (0.0%) |
| 9:00 AM to 9:59 AM | 0 (0.0%) | 8 (2.7%) |
| 10:00 AM to 10:59 AM | 0 (0.0%) | 11 (3.8%) |
| 11:00 AM to 11:59 AM | 0 (0.0%) | 0 (0.0%) |
| 12:00 PM to 3:59 PM | 4 (2.2%) | 66 (22.6%) |
| 4:00 PM to 11:59 PM | 21 (11.6%) | 9 (3.1%) |
| Total | 181 (100.0%) | 292 (100.0%) |
Housing Occupancy in Ellerbe
Occupancy by Ownership in Ellerbe
Of the total 478 dwellings in Ellerbe, owner-occupied units account for 288 (60.3%), while renter-occupied units make up 190 (39.8%).
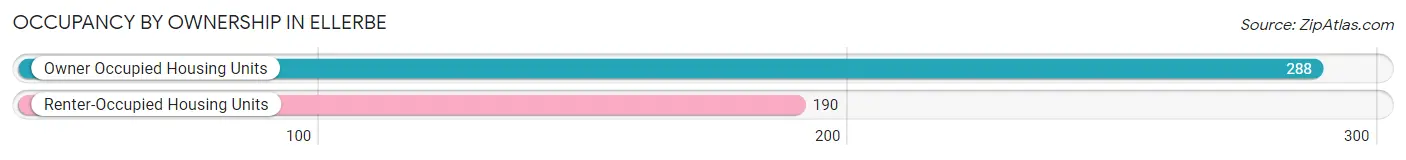
| Occupancy | # Housing Units | % Housing Units |
| Owner Occupied Housing Units | 288 | 60.3% |
| Renter-Occupied Housing Units | 190 | 39.8% |
| Total Occupied Housing Units | 478 | 100.0% |
Occupancy by Household Size in Ellerbe
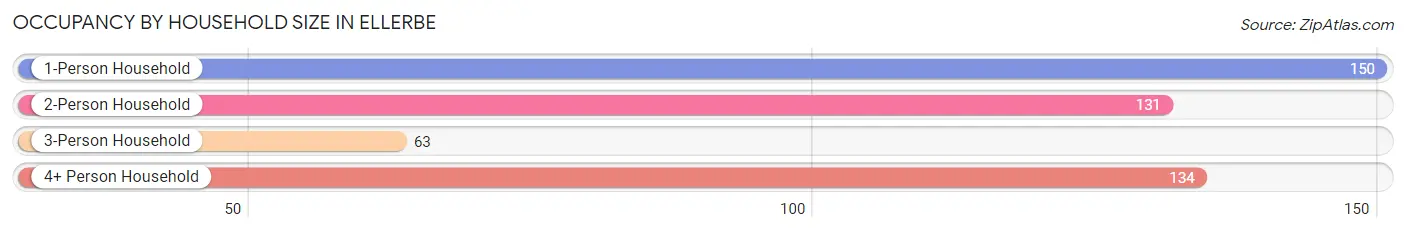
| Household Size | # Housing Units | % Housing Units |
| 1-Person Household | 150 | 31.4% |
| 2-Person Household | 131 | 27.4% |
| 3-Person Household | 63 | 13.2% |
| 4+ Person Household | 134 | 28.0% |
| Total Housing Units | 478 | 100.0% |
Occupancy by Ownership by Household Size in Ellerbe
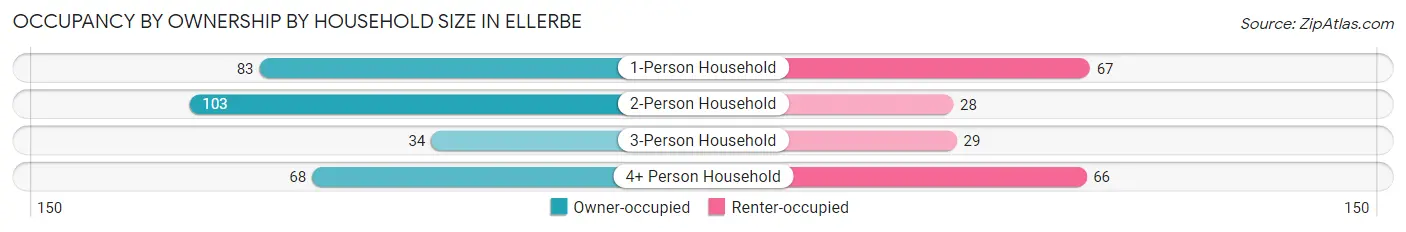
| Household Size | Owner-occupied | Renter-occupied |
| 1-Person Household | 83 (55.3%) | 67 (44.7%) |
| 2-Person Household | 103 (78.6%) | 28 (21.4%) |
| 3-Person Household | 34 (54.0%) | 29 (46.0%) |
| 4+ Person Household | 68 (50.7%) | 66 (49.2%) |
| Total Housing Units | 288 (60.3%) | 190 (39.8%) |
Occupancy by Educational Attainment in Ellerbe
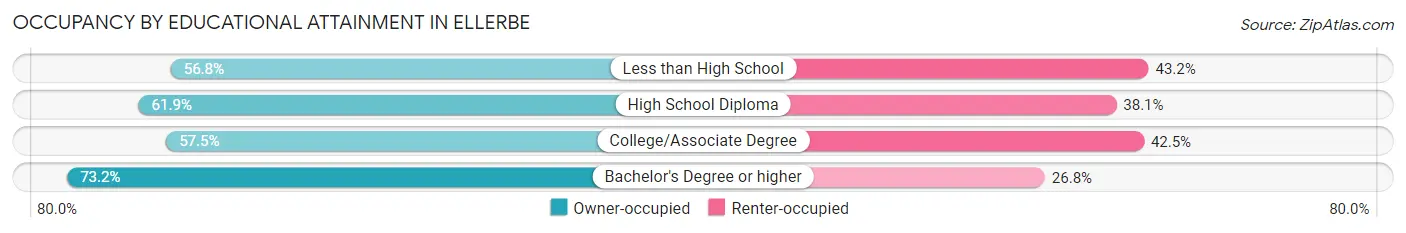
| Household Size | Owner-occupied | Renter-occupied |
| Less than High School | 71 (56.8%) | 54 (43.2%) |
| High School Diploma | 39 (61.9%) | 24 (38.1%) |
| College/Associate Degree | 126 (57.5%) | 93 (42.5%) |
| Bachelor's Degree or higher | 52 (73.2%) | 19 (26.8%) |
Occupancy by Age of Householder in Ellerbe
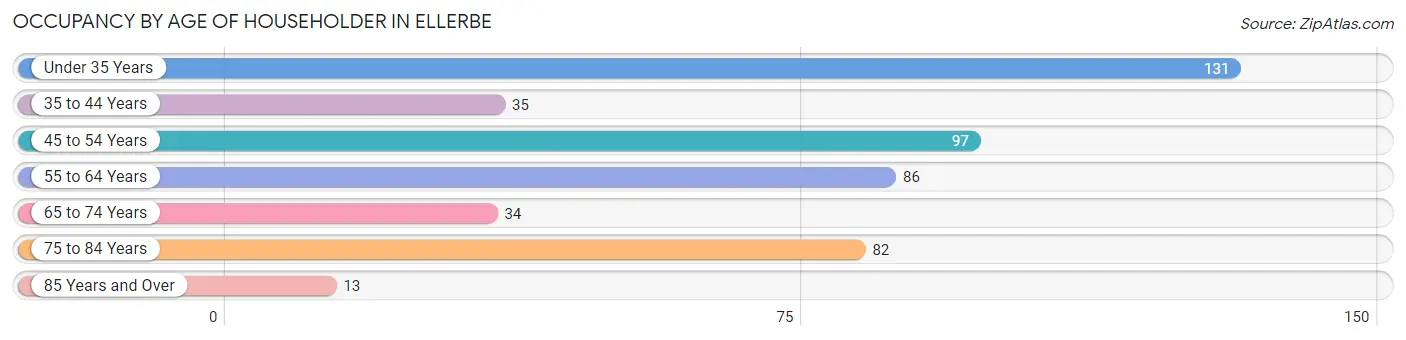
| Age Bracket | # Households | % Households |
| Under 35 Years | 131 | 27.4% |
| 35 to 44 Years | 35 | 7.3% |
| 45 to 54 Years | 97 | 20.3% |
| 55 to 64 Years | 86 | 18.0% |
| 65 to 74 Years | 34 | 7.1% |
| 75 to 84 Years | 82 | 17.2% |
| 85 Years and Over | 13 | 2.7% |
| Total | 478 | 100.0% |
Housing Finances in Ellerbe
Median Income by Occupancy in Ellerbe
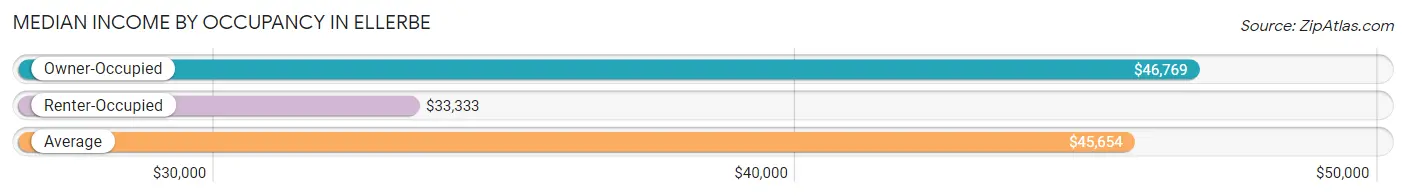
| Occupancy Type | # Households | Median Income |
| Owner-Occupied | 288 (60.3%) | $46,769 |
| Renter-Occupied | 190 (39.8%) | $33,333 |
| Average | 478 (100.0%) | $45,654 |
Occupancy by Householder Income Bracket in Ellerbe
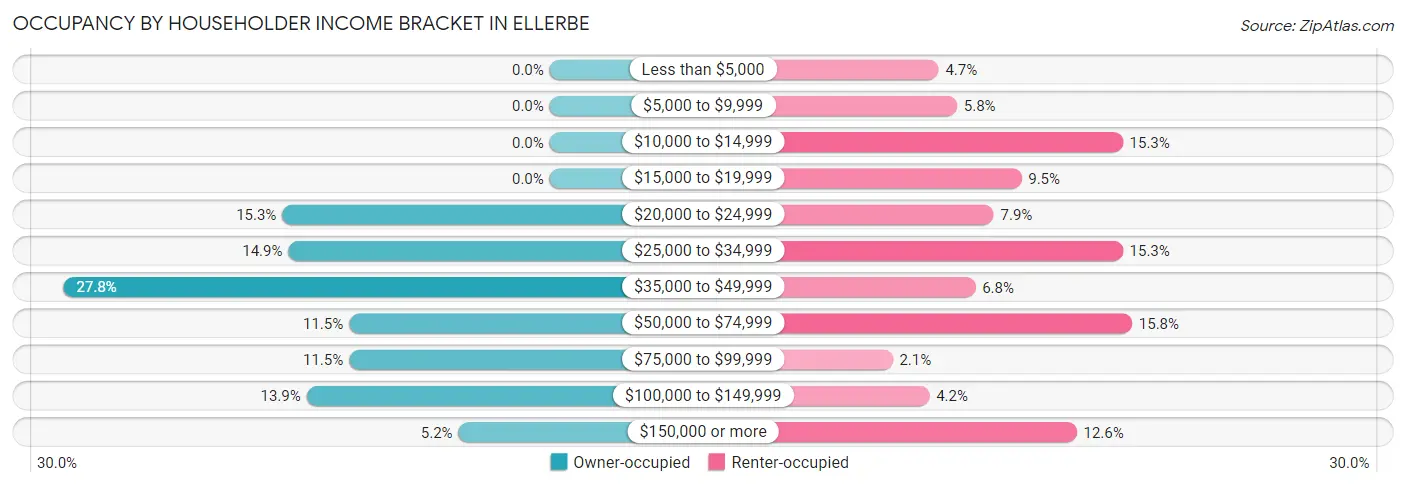
| Income Bracket | Owner-occupied | Renter-occupied |
| Less than $5,000 | 0 (0.0%) | 9 (4.7%) |
| $5,000 to $9,999 | 0 (0.0%) | 11 (5.8%) |
| $10,000 to $14,999 | 0 (0.0%) | 29 (15.3%) |
| $15,000 to $19,999 | 0 (0.0%) | 18 (9.5%) |
| $20,000 to $24,999 | 44 (15.3%) | 15 (7.9%) |
| $25,000 to $34,999 | 43 (14.9%) | 29 (15.3%) |
| $35,000 to $49,999 | 80 (27.8%) | 13 (6.8%) |
| $50,000 to $74,999 | 33 (11.5%) | 30 (15.8%) |
| $75,000 to $99,999 | 33 (11.5%) | 4 (2.1%) |
| $100,000 to $149,999 | 40 (13.9%) | 8 (4.2%) |
| $150,000 or more | 15 (5.2%) | 24 (12.6%) |
| Total | 288 (100.0%) | 190 (100.0%) |
Monthly Housing Cost Tiers in Ellerbe
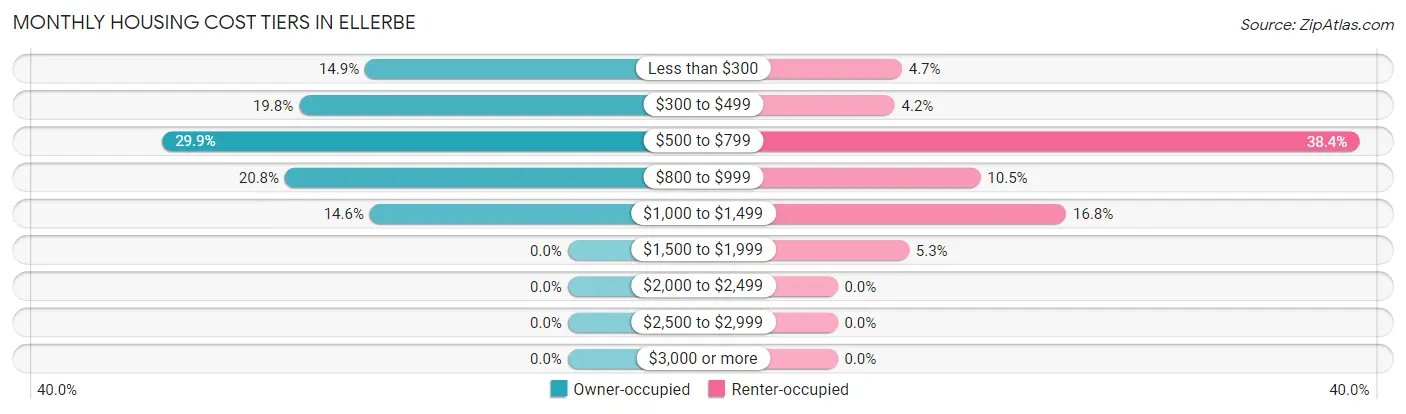
| Monthly Cost | Owner-occupied | Renter-occupied |
| Less than $300 | 43 (14.9%) | 9 (4.7%) |
| $300 to $499 | 57 (19.8%) | 8 (4.2%) |
| $500 to $799 | 86 (29.9%) | 73 (38.4%) |
| $800 to $999 | 60 (20.8%) | 20 (10.5%) |
| $1,000 to $1,499 | 42 (14.6%) | 32 (16.8%) |
| $1,500 to $1,999 | 0 (0.0%) | 10 (5.3%) |
| $2,000 to $2,499 | 0 (0.0%) | 0 (0.0%) |
| $2,500 to $2,999 | 0 (0.0%) | 0 (0.0%) |
| $3,000 or more | 0 (0.0%) | 0 (0.0%) |
| Total | 288 (100.0%) | 190 (100.0%) |
Physical Housing Characteristics in Ellerbe
Housing Structures in Ellerbe
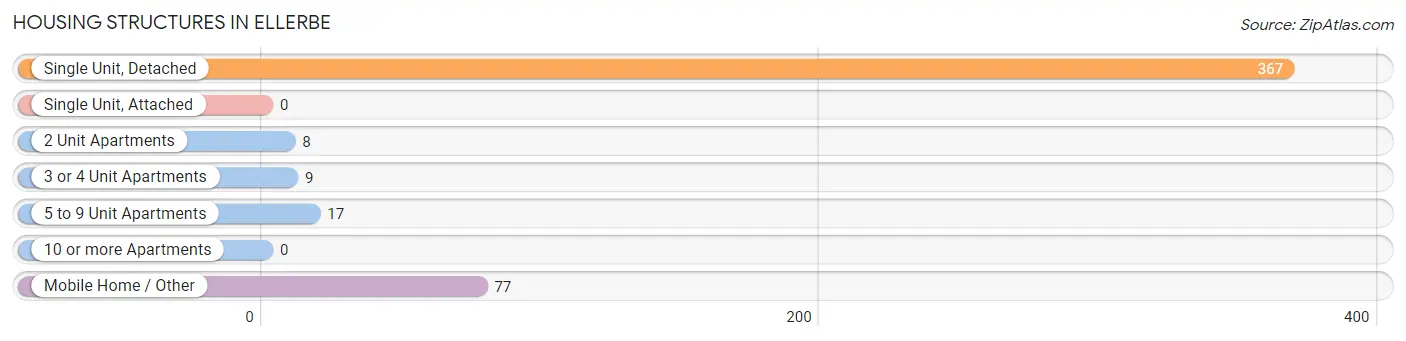
| Structure Type | # Housing Units | % Housing Units |
| Single Unit, Detached | 367 | 76.8% |
| Single Unit, Attached | 0 | 0.0% |
| 2 Unit Apartments | 8 | 1.7% |
| 3 or 4 Unit Apartments | 9 | 1.9% |
| 5 to 9 Unit Apartments | 17 | 3.6% |
| 10 or more Apartments | 0 | 0.0% |
| Mobile Home / Other | 77 | 16.1% |
| Total | 478 | 100.0% |
Housing Structures by Occupancy in Ellerbe
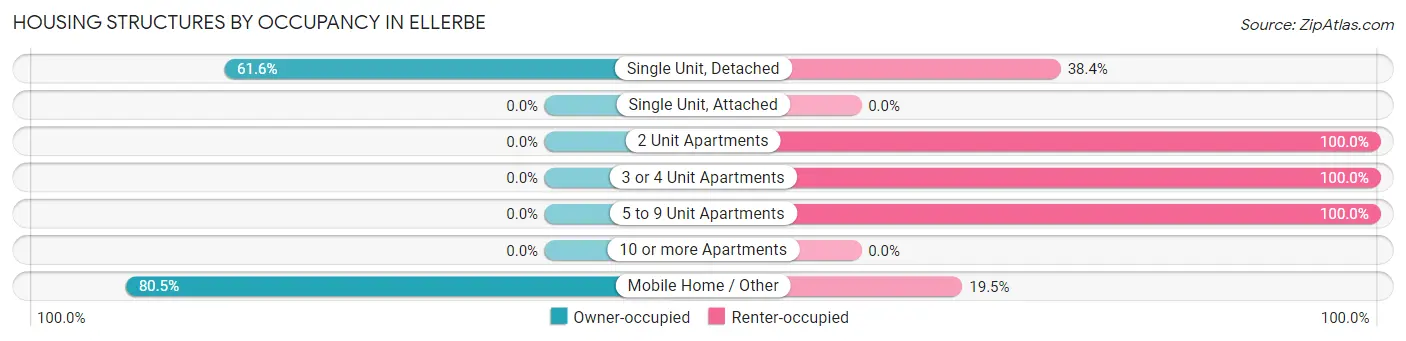
| Structure Type | Owner-occupied | Renter-occupied |
| Single Unit, Detached | 226 (61.6%) | 141 (38.4%) |
| Single Unit, Attached | 0 (0.0%) | 0 (0.0%) |
| 2 Unit Apartments | 0 (0.0%) | 8 (100.0%) |
| 3 or 4 Unit Apartments | 0 (0.0%) | 9 (100.0%) |
| 5 to 9 Unit Apartments | 0 (0.0%) | 17 (100.0%) |
| 10 or more Apartments | 0 (0.0%) | 0 (0.0%) |
| Mobile Home / Other | 62 (80.5%) | 15 (19.5%) |
| Total | 288 (60.3%) | 190 (39.8%) |
Housing Structures by Number of Rooms in Ellerbe
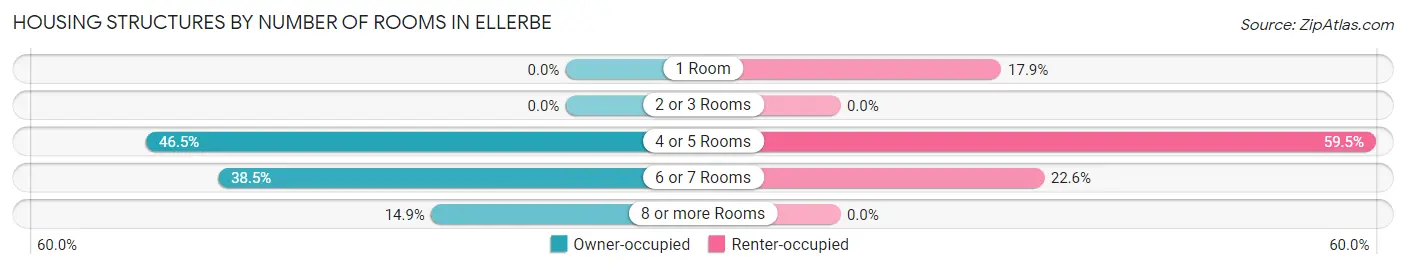
| Number of Rooms | Owner-occupied | Renter-occupied |
| 1 Room | 0 (0.0%) | 34 (17.9%) |
| 2 or 3 Rooms | 0 (0.0%) | 0 (0.0%) |
| 4 or 5 Rooms | 134 (46.5%) | 113 (59.5%) |
| 6 or 7 Rooms | 111 (38.5%) | 43 (22.6%) |
| 8 or more Rooms | 43 (14.9%) | 0 (0.0%) |
| Total | 288 (100.0%) | 190 (100.0%) |
Housing Structure by Heating Type in Ellerbe
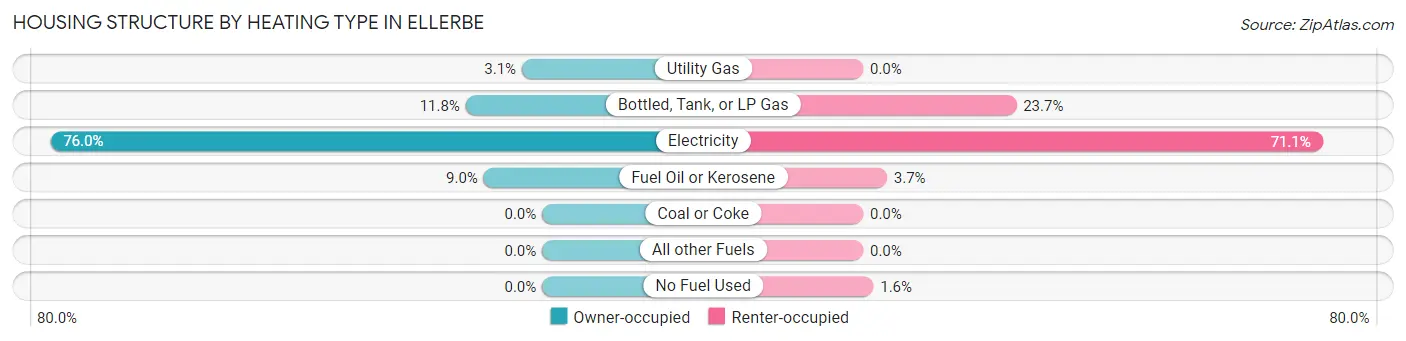
| Heating Type | Owner-occupied | Renter-occupied |
| Utility Gas | 9 (3.1%) | 0 (0.0%) |
| Bottled, Tank, or LP Gas | 34 (11.8%) | 45 (23.7%) |
| Electricity | 219 (76.0%) | 135 (71.1%) |
| Fuel Oil or Kerosene | 26 (9.0%) | 7 (3.7%) |
| Coal or Coke | 0 (0.0%) | 0 (0.0%) |
| All other Fuels | 0 (0.0%) | 0 (0.0%) |
| No Fuel Used | 0 (0.0%) | 3 (1.6%) |
| Total | 288 (100.0%) | 190 (100.0%) |
Household Vehicle Usage in Ellerbe
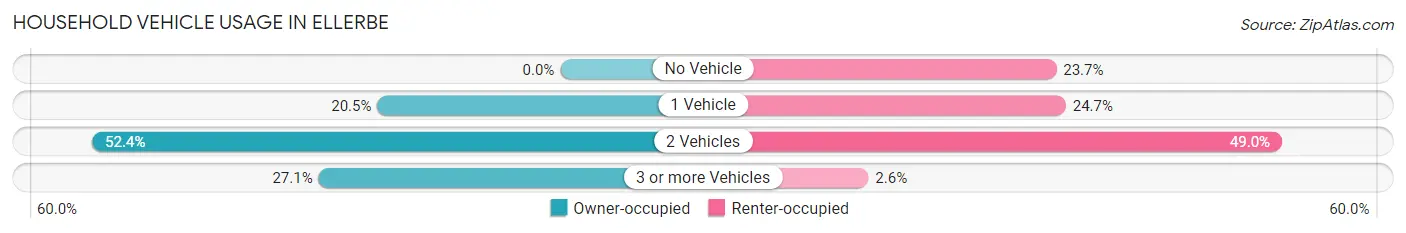
| Vehicles per Household | Owner-occupied | Renter-occupied |
| No Vehicle | 0 (0.0%) | 45 (23.7%) |
| 1 Vehicle | 59 (20.5%) | 47 (24.7%) |
| 2 Vehicles | 151 (52.4%) | 93 (48.9%) |
| 3 or more Vehicles | 78 (27.1%) | 5 (2.6%) |
| Total | 288 (100.0%) | 190 (100.0%) |
Real Estate & Mortgages in Ellerbe
Real Estate and Mortgage Overview in Ellerbe
| Characteristic | Without Mortgage | With Mortgage |
| Housing Units | 193 | 95 |
| Median Property Value | $84,200 | $101,000 |
| Median Household Income | $45,434 | $3 |
| Monthly Housing Costs | $475 | $0 |
| Real Estate Taxes | $590 | $0 |
Property Value by Mortgage Status in Ellerbe
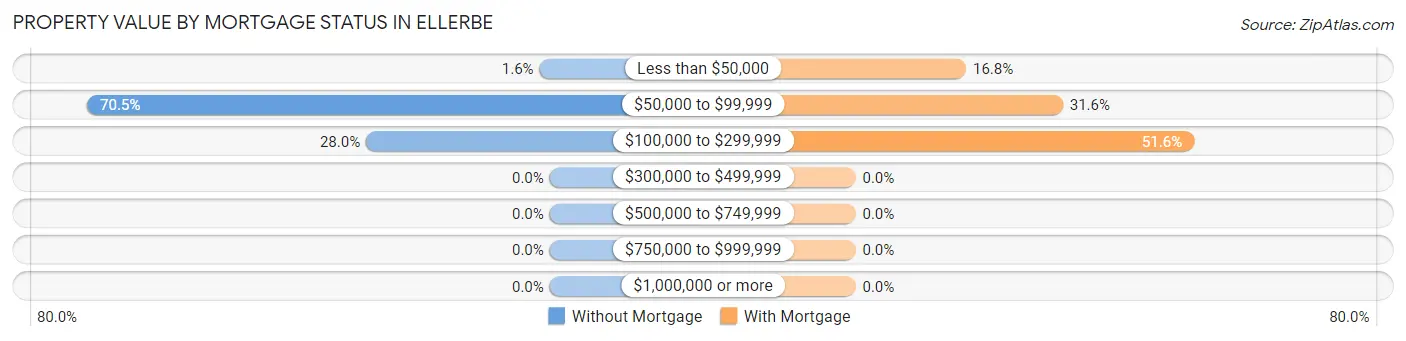
| Property Value | Without Mortgage | With Mortgage |
| Less than $50,000 | 3 (1.5%) | 16 (16.8%) |
| $50,000 to $99,999 | 136 (70.5%) | 30 (31.6%) |
| $100,000 to $299,999 | 54 (28.0%) | 49 (51.6%) |
| $300,000 to $499,999 | 0 (0.0%) | 0 (0.0%) |
| $500,000 to $749,999 | 0 (0.0%) | 0 (0.0%) |
| $750,000 to $999,999 | 0 (0.0%) | 0 (0.0%) |
| $1,000,000 or more | 0 (0.0%) | 0 (0.0%) |
| Total | 193 (100.0%) | 95 (100.0%) |
Household Income by Mortgage Status in Ellerbe
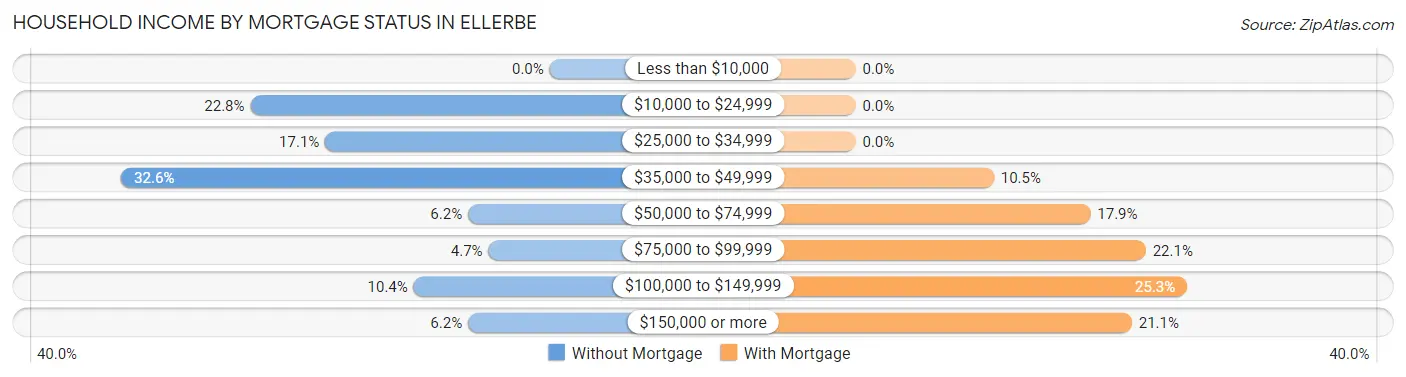
| Household Income | Without Mortgage | With Mortgage |
| Less than $10,000 | 0 (0.0%) | 0 (0.0%) |
| $10,000 to $24,999 | 44 (22.8%) | 0 (0.0%) |
| $25,000 to $34,999 | 33 (17.1%) | 0 (0.0%) |
| $35,000 to $49,999 | 63 (32.6%) | 10 (10.5%) |
| $50,000 to $74,999 | 12 (6.2%) | 17 (17.9%) |
| $75,000 to $99,999 | 9 (4.7%) | 21 (22.1%) |
| $100,000 to $149,999 | 20 (10.4%) | 24 (25.3%) |
| $150,000 or more | 12 (6.2%) | 20 (21.0%) |
| Total | 193 (100.0%) | 95 (100.0%) |
Property Value to Household Income Ratio in Ellerbe
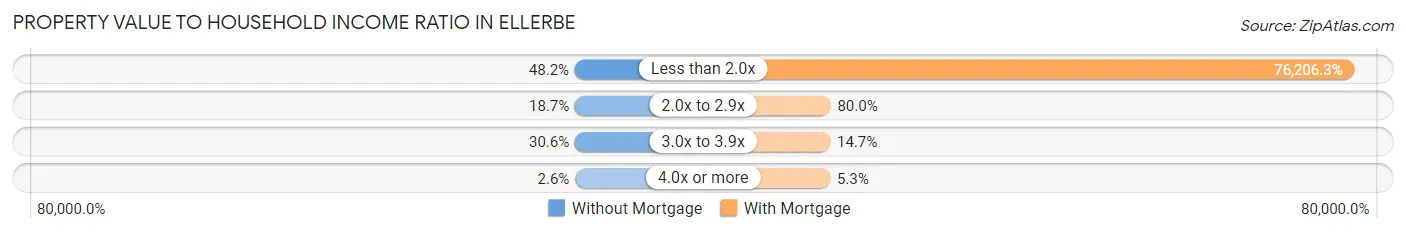
| Value-to-Income Ratio | Without Mortgage | With Mortgage |
| Less than 2.0x | 93 (48.2%) | 72,396 (76,206.3%) |
| 2.0x to 2.9x | 36 (18.6%) | 76 (80.0%) |
| 3.0x to 3.9x | 59 (30.6%) | 14 (14.7%) |
| 4.0x or more | 5 (2.6%) | 5 (5.3%) |
| Total | 193 (100.0%) | 95 (100.0%) |
Real Estate Taxes by Mortgage Status in Ellerbe
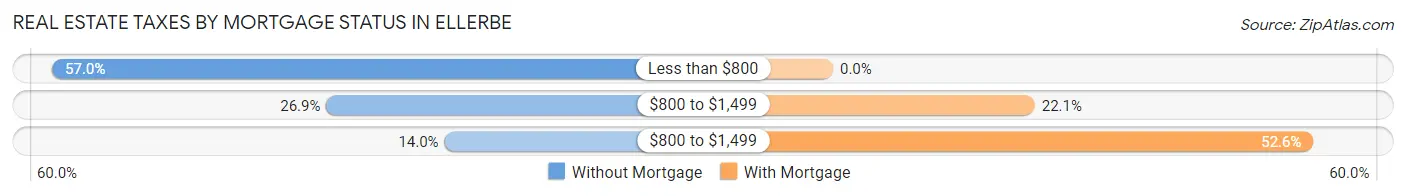
| Property Taxes | Without Mortgage | With Mortgage |
| Less than $800 | 110 (57.0%) | 0 (0.0%) |
| $800 to $1,499 | 52 (26.9%) | 21 (22.1%) |
| $800 to $1,499 | 27 (14.0%) | 50 (52.6%) |
| Total | 193 (100.0%) | 95 (100.0%) |
Health & Disability in Ellerbe
Health Insurance Coverage by Age in Ellerbe
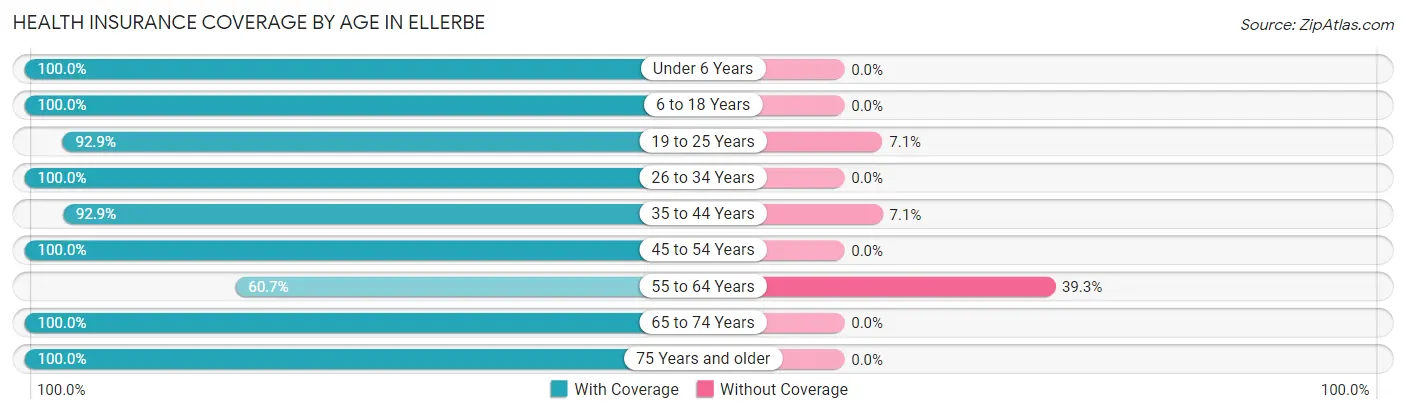
| Age Bracket | With Coverage | Without Coverage |
| Under 6 Years | 117 (100.0%) | 0 (0.0%) |
| 6 to 18 Years | 230 (100.0%) | 0 (0.0%) |
| 19 to 25 Years | 118 (92.9%) | 9 (7.1%) |
| 26 to 34 Years | 154 (100.0%) | 0 (0.0%) |
| 35 to 44 Years | 91 (92.9%) | 7 (7.1%) |
| 45 to 54 Years | 150 (100.0%) | 0 (0.0%) |
| 55 to 64 Years | 68 (60.7%) | 44 (39.3%) |
| 65 to 74 Years | 41 (100.0%) | 0 (0.0%) |
| 75 Years and older | 123 (100.0%) | 0 (0.0%) |
| Total | 1,092 (94.8%) | 60 (5.2%) |
Health Insurance Coverage by Citizenship Status in Ellerbe
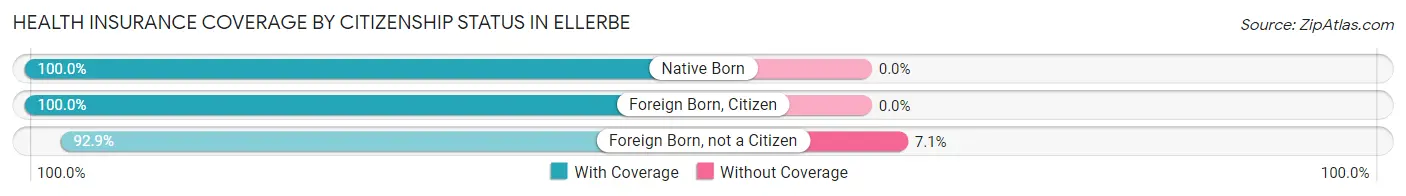
| Citizenship Status | With Coverage | Without Coverage |
| Native Born | 117 (100.0%) | 0 (0.0%) |
| Foreign Born, Citizen | 230 (100.0%) | 0 (0.0%) |
| Foreign Born, not a Citizen | 118 (92.9%) | 9 (7.1%) |
Health Insurance Coverage by Household Income in Ellerbe
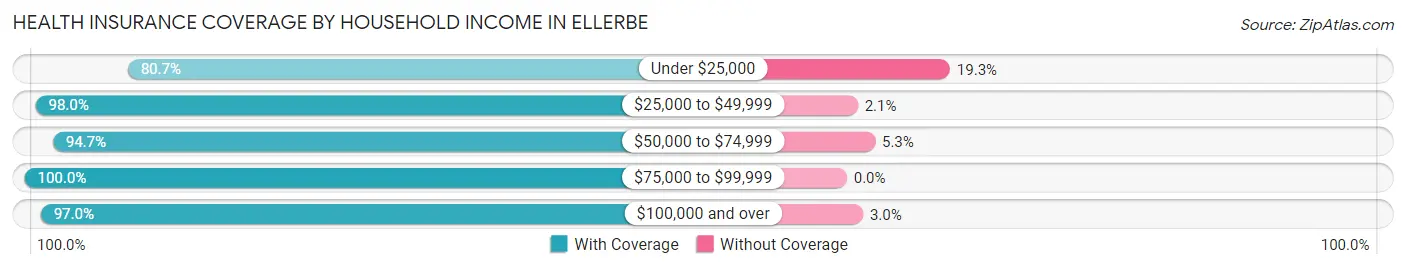
| Household Income | With Coverage | Without Coverage |
| Under $25,000 | 142 (80.7%) | 34 (19.3%) |
| $25,000 to $49,999 | 477 (98.0%) | 10 (2.1%) |
| $50,000 to $74,999 | 161 (94.7%) | 9 (5.3%) |
| $75,000 to $99,999 | 80 (100.0%) | 0 (0.0%) |
| $100,000 and over | 224 (97.0%) | 7 (3.0%) |
Public vs Private Health Insurance Coverage by Age in Ellerbe
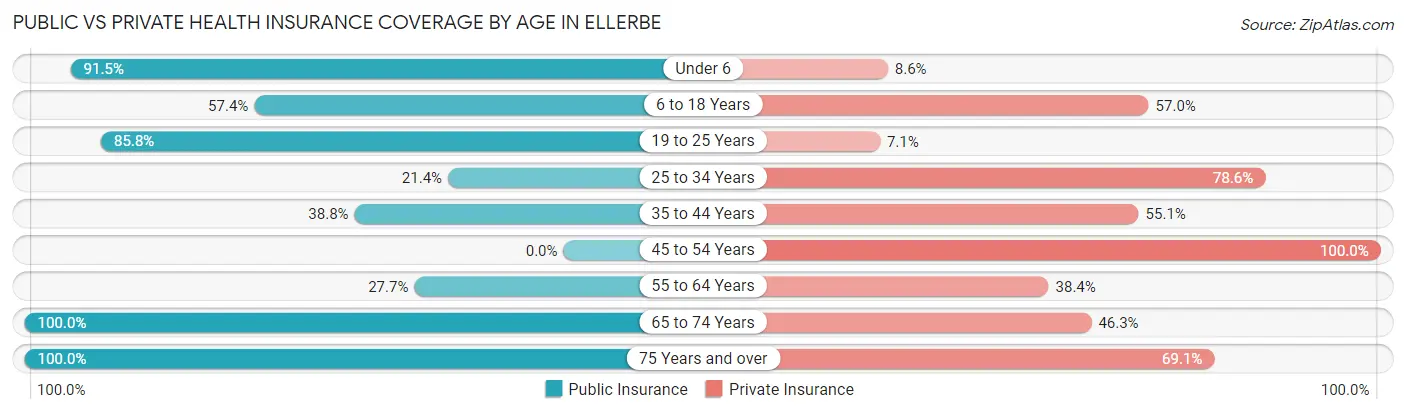
| Age Bracket | Public Insurance | Private Insurance |
| Under 6 | 107 (91.4%) | 10 (8.6%) |
| 6 to 18 Years | 132 (57.4%) | 131 (57.0%) |
| 19 to 25 Years | 109 (85.8%) | 9 (7.1%) |
| 25 to 34 Years | 33 (21.4%) | 121 (78.6%) |
| 35 to 44 Years | 38 (38.8%) | 54 (55.1%) |
| 45 to 54 Years | 0 (0.0%) | 150 (100.0%) |
| 55 to 64 Years | 31 (27.7%) | 43 (38.4%) |
| 65 to 74 Years | 41 (100.0%) | 19 (46.3%) |
| 75 Years and over | 123 (100.0%) | 85 (69.1%) |
| Total | 614 (53.3%) | 622 (54.0%) |
Disability Status by Sex by Age in Ellerbe
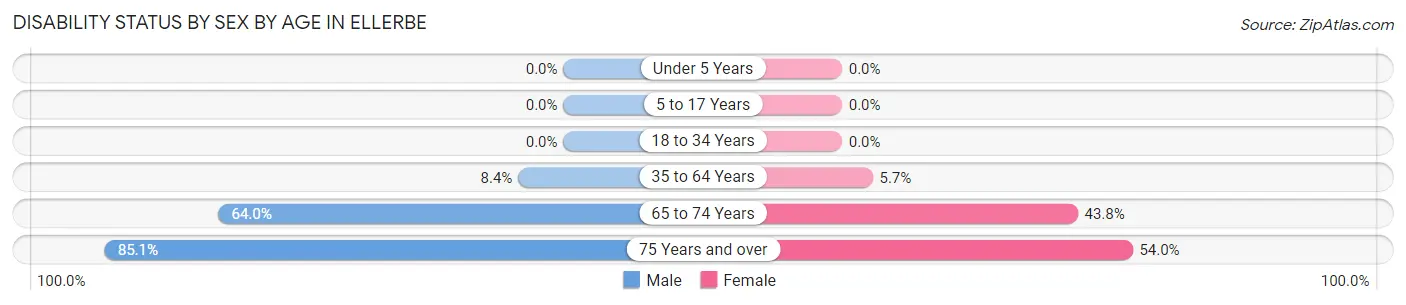
| Age Bracket | Male | Female |
| Under 5 Years | 0 (0.0%) | 0 (0.0%) |
| 5 to 17 Years | 0 (0.0%) | 0 (0.0%) |
| 18 to 34 Years | 0 (0.0%) | 0 (0.0%) |
| 35 to 64 Years | 14 (8.4%) | 11 (5.7%) |
| 65 to 74 Years | 16 (64.0%) | 7 (43.8%) |
| 75 Years and over | 40 (85.1%) | 41 (53.9%) |
Disability Class by Sex by Age in Ellerbe
Disability Class: Hearing Difficulty
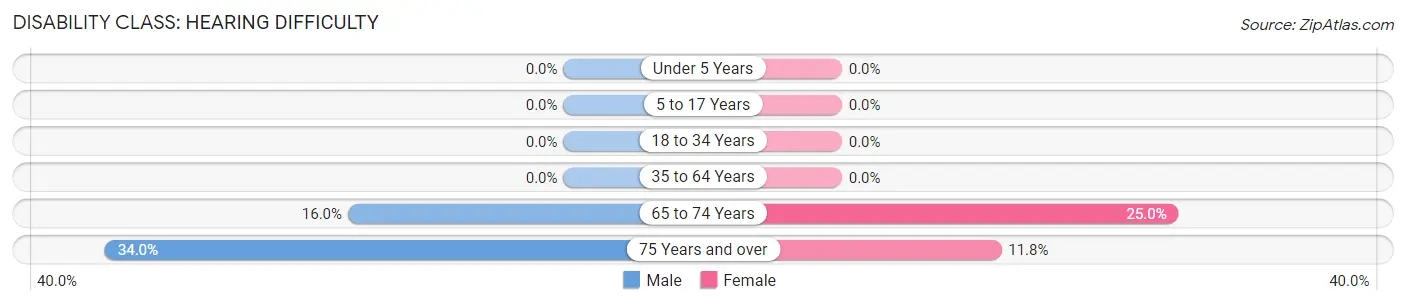
| Age Bracket | Male | Female |
| Under 5 Years | 0 (0.0%) | 0 (0.0%) |
| 5 to 17 Years | 0 (0.0%) | 0 (0.0%) |
| 18 to 34 Years | 0 (0.0%) | 0 (0.0%) |
| 35 to 64 Years | 0 (0.0%) | 0 (0.0%) |
| 65 to 74 Years | 4 (16.0%) | 4 (25.0%) |
| 75 Years and over | 16 (34.0%) | 9 (11.8%) |
Disability Class: Vision Difficulty
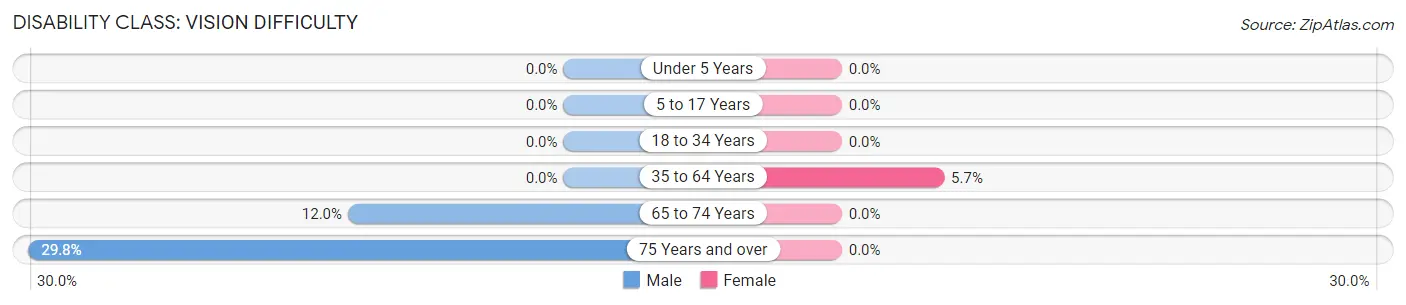
| Age Bracket | Male | Female |
| Under 5 Years | 0 (0.0%) | 0 (0.0%) |
| 5 to 17 Years | 0 (0.0%) | 0 (0.0%) |
| 18 to 34 Years | 0 (0.0%) | 0 (0.0%) |
| 35 to 64 Years | 0 (0.0%) | 11 (5.7%) |
| 65 to 74 Years | 3 (12.0%) | 0 (0.0%) |
| 75 Years and over | 14 (29.8%) | 0 (0.0%) |
Disability Class: Cognitive Difficulty
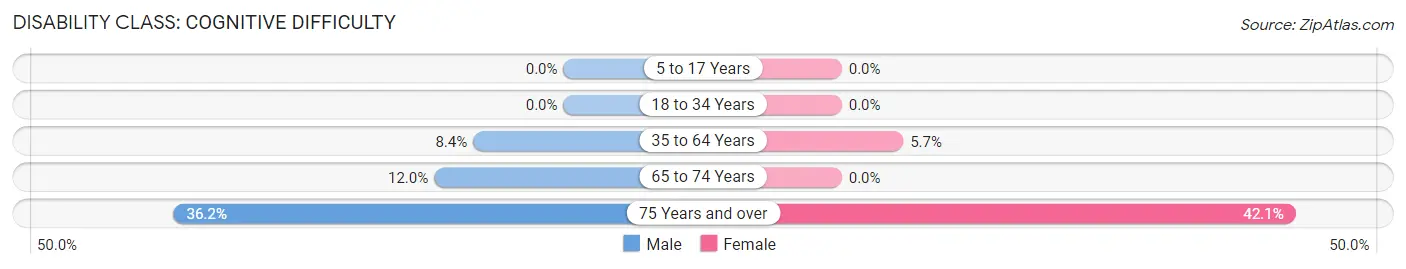
| Age Bracket | Male | Female |
| 5 to 17 Years | 0 (0.0%) | 0 (0.0%) |
| 18 to 34 Years | 0 (0.0%) | 0 (0.0%) |
| 35 to 64 Years | 14 (8.4%) | 11 (5.7%) |
| 65 to 74 Years | 3 (12.0%) | 0 (0.0%) |
| 75 Years and over | 17 (36.2%) | 32 (42.1%) |
Disability Class: Ambulatory Difficulty
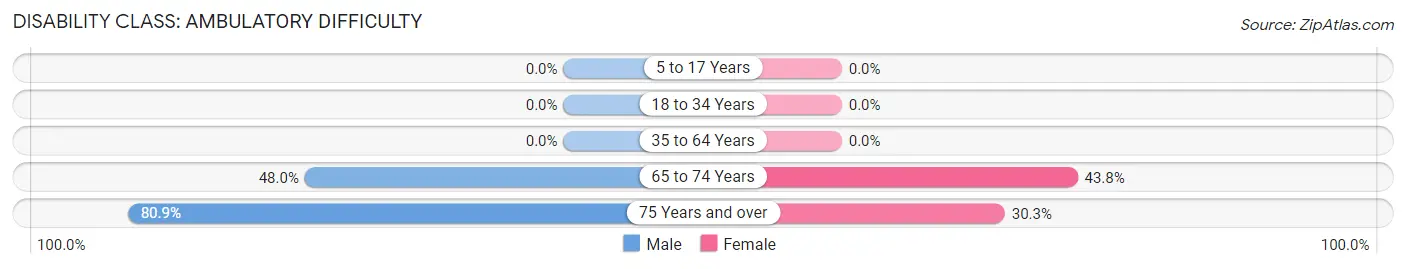
| Age Bracket | Male | Female |
| 5 to 17 Years | 0 (0.0%) | 0 (0.0%) |
| 18 to 34 Years | 0 (0.0%) | 0 (0.0%) |
| 35 to 64 Years | 0 (0.0%) | 0 (0.0%) |
| 65 to 74 Years | 12 (48.0%) | 7 (43.8%) |
| 75 Years and over | 38 (80.8%) | 23 (30.3%) |
Disability Class: Self-Care Difficulty
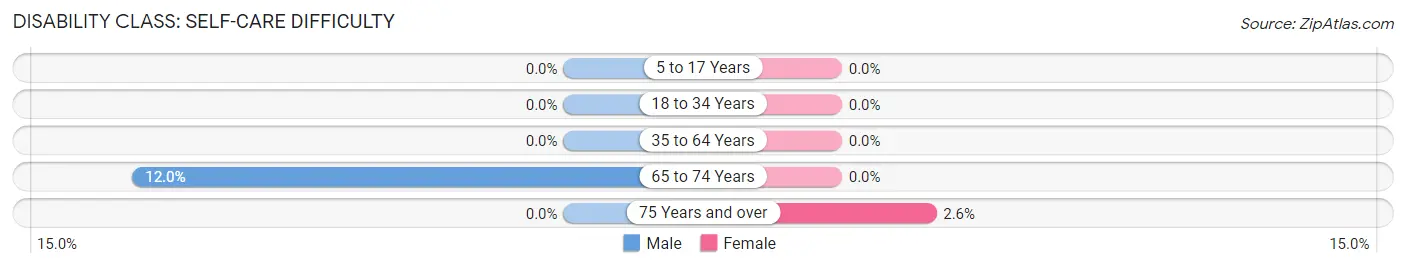
| Age Bracket | Male | Female |
| 5 to 17 Years | 0 (0.0%) | 0 (0.0%) |
| 18 to 34 Years | 0 (0.0%) | 0 (0.0%) |
| 35 to 64 Years | 0 (0.0%) | 0 (0.0%) |
| 65 to 74 Years | 3 (12.0%) | 0 (0.0%) |
| 75 Years and over | 0 (0.0%) | 2 (2.6%) |
Technology Access in Ellerbe
Computing Device Access in Ellerbe
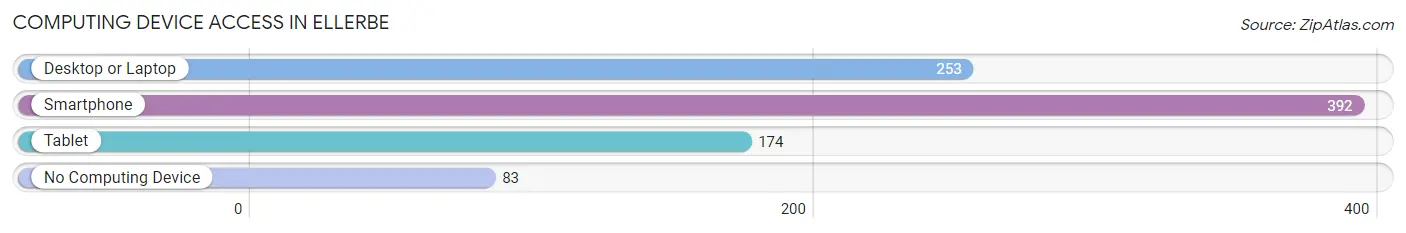
| Device Type | # Households | % Households |
| Desktop or Laptop | 253 | 52.9% |
| Smartphone | 392 | 82.0% |
| Tablet | 174 | 36.4% |
| No Computing Device | 83 | 17.4% |
| Total | 478 | 100.0% |
Internet Access in Ellerbe
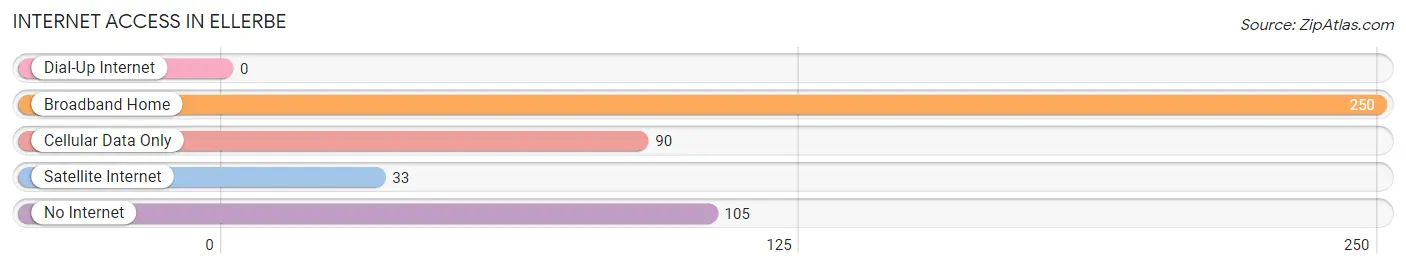
| Internet Type | # Households | % Households |
| Dial-Up Internet | 0 | 0.0% |
| Broadband Home | 250 | 52.3% |
| Cellular Data Only | 90 | 18.8% |
| Satellite Internet | 33 | 6.9% |
| No Internet | 105 | 22.0% |
| Total | 478 | 100.0% |
Ellerbe Summary
Ellerbe is a small town located in Richmond County, North Carolina. It is situated in the Sandhills region of the state, about 25 miles south of the city of Rockingham. The town was founded in 1887 and named after the Ellerbe family, who were prominent landowners in the area. The population of Ellerbe was estimated to be 1,072 in 2019.
Geography
Ellerbe is located in the Sandhills region of North Carolina, which is characterized by rolling hills and sandy soils. The town is situated in the Pee Dee River basin, and is bordered by the towns of Rockingham, Hoffman, and Norman. The town is located at an elevation of approximately 300 feet above sea level.
The climate in Ellerbe is humid subtropical, with hot, humid summers and mild winters. The average annual temperature is around 70 degrees Fahrenheit, with average highs in the summer reaching the mid-90s and average lows in the winter reaching the mid-30s. The town receives an average of 48 inches of precipitation per year, with most of it falling in the summer months.
Economy
The economy of Ellerbe is largely based on agriculture and manufacturing. The town is home to several large farms, which produce a variety of crops, including corn, soybeans, cotton, and tobacco. The town is also home to several manufacturing companies, which produce a variety of products, including furniture, textiles, and automotive parts.
The town is also home to several small businesses, including restaurants, retail stores, and service providers. The town is served by several major highways, including US Highway 1 and US Highway 74, which provide access to larger cities in the region.
Demographics
As of the 2019 census, the population of Ellerbe was estimated to be 1,072. The racial makeup of the town was 79.2% White, 17.2% African American, 0.7% Native American, 0.3% Asian, and 2.6% from other races. The median household income in the town was $31,250, and the median age was 41.
The town is served by the Richmond County School District, which includes two elementary schools, one middle school, and one high school. The town is also home to several churches, including the Ellerbe Baptist Church, the Ellerbe United Methodist Church, and the Ellerbe Presbyterian Church.
Conclusion
Ellerbe is a small town located in Richmond County, North Carolina. It is situated in the Sandhills region of the state, and is home to a population of approximately 1,072 people. The economy of the town is largely based on agriculture and manufacturing, and the town is served by several major highways. The town is also served by the Richmond County School District, and is home to several churches.
Common Questions
What is Per Capita Income in Ellerbe?
Per Capita income in Ellerbe is $23,394.
What is the Median Family Income in Ellerbe?
Median Family Income in Ellerbe is $51,875.
What is the Median Household income in Ellerbe?
Median Household Income in Ellerbe is $45,654.
What is Income or Wage Gap in Ellerbe?
Income or Wage Gap in Ellerbe is 40.3%.
Women in Ellerbe earn 59.7 cents for every dollar earned by a man.
What is Inequality or Gini Index in Ellerbe?
Inequality or Gini Index in Ellerbe is 0.43.
What is the Total Population of Ellerbe?
Total Population of Ellerbe is 1,156.
What is the Total Male Population of Ellerbe?
Total Male Population of Ellerbe is 471.
What is the Total Female Population of Ellerbe?
Total Female Population of Ellerbe is 685.
What is the Ratio of Males per 100 Females in Ellerbe?
There are 68.76 Males per 100 Females in Ellerbe.
What is the Ratio of Females per 100 Males in Ellerbe?
There are 145.44 Females per 100 Males in Ellerbe.
What is the Median Population Age in Ellerbe?
Median Population Age in Ellerbe is 33.7 Years.
What is the Average Family Size in Ellerbe
Average Family Size in Ellerbe is 3.0 People.
What is the Average Household Size in Ellerbe
Average Household Size in Ellerbe is 2.4 People.
How Large is the Labor Force in Ellerbe?
There are 589 People in the Labor Forcein in Ellerbe.
What is the Percentage of People in the Labor Force in Ellerbe?
68.4% of People are in the Labor Force in Ellerbe.
What is the Unemployment Rate in Ellerbe?
Unemployment Rate in Ellerbe is 19.8%.