Dallas, NC Map & Demographics
Dallas Map
Dallas Overview
$28,083
PER CAPITA INCOME
$70,417
AVG FAMILY INCOME
$55,979
AVG HOUSEHOLD INCOME
26.0%
WAGE / INCOME GAP [ % ]
74.0¢/ $1
WAGE / INCOME GAP [ $ ]
0.40
INEQUALITY / GINI INDEX
5,889
TOTAL POPULATION
2,532
MALE POPULATION
3,357
FEMALE POPULATION
75.42
MALES / 100 FEMALES
132.58
FEMALES / 100 MALES
38.9
MEDIAN AGE
3.5
AVG FAMILY SIZE
2.7
AVG HOUSEHOLD SIZE
3,203
LABOR FORCE [ PEOPLE ]
65.9%
PERCENT IN LABOR FORCE
4.1%
UNEMPLOYMENT RATE
Dallas Zip Codes
Dallas Area Codes
Income in Dallas
Income Overview in Dallas
Per Capita Income in Dallas is $28,083, while median incomes of families and households are $70,417 and $55,979 respectively.
| Characteristic | Number | Measure |
| Per Capita Income | 5,889 | $28,083 |
| Median Family Income | 1,380 | $70,417 |
| Mean Family Income | 1,380 | $81,251 |
| Median Household Income | 2,161 | $55,979 |
| Mean Household Income | 2,161 | $66,644 |
| Income Deficit | 1,380 | $0 |
| Wage / Income Gap (%) | 5,889 | 26.02% |
| Wage / Income Gap ($) | 5,889 | 73.98¢ per $1 |
| Gini / Inequality Index | 5,889 | 0.40 |
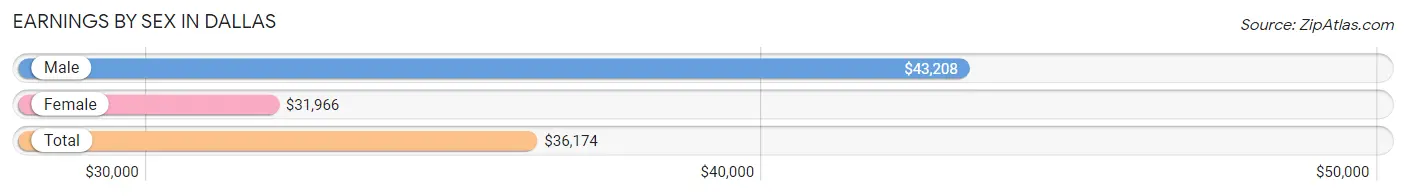
Earnings by Sex in Dallas
Average Earnings in Dallas are $36,174, $43,208 for men and $31,966 for women, a difference of 26.0%.
| Sex | Number | Average Earnings |
| Male | 1,477 (45.0%) | $43,208 |
| Female | 1,803 (55.0%) | $31,966 |
| Total | 3,280 (100.0%) | $36,174 |
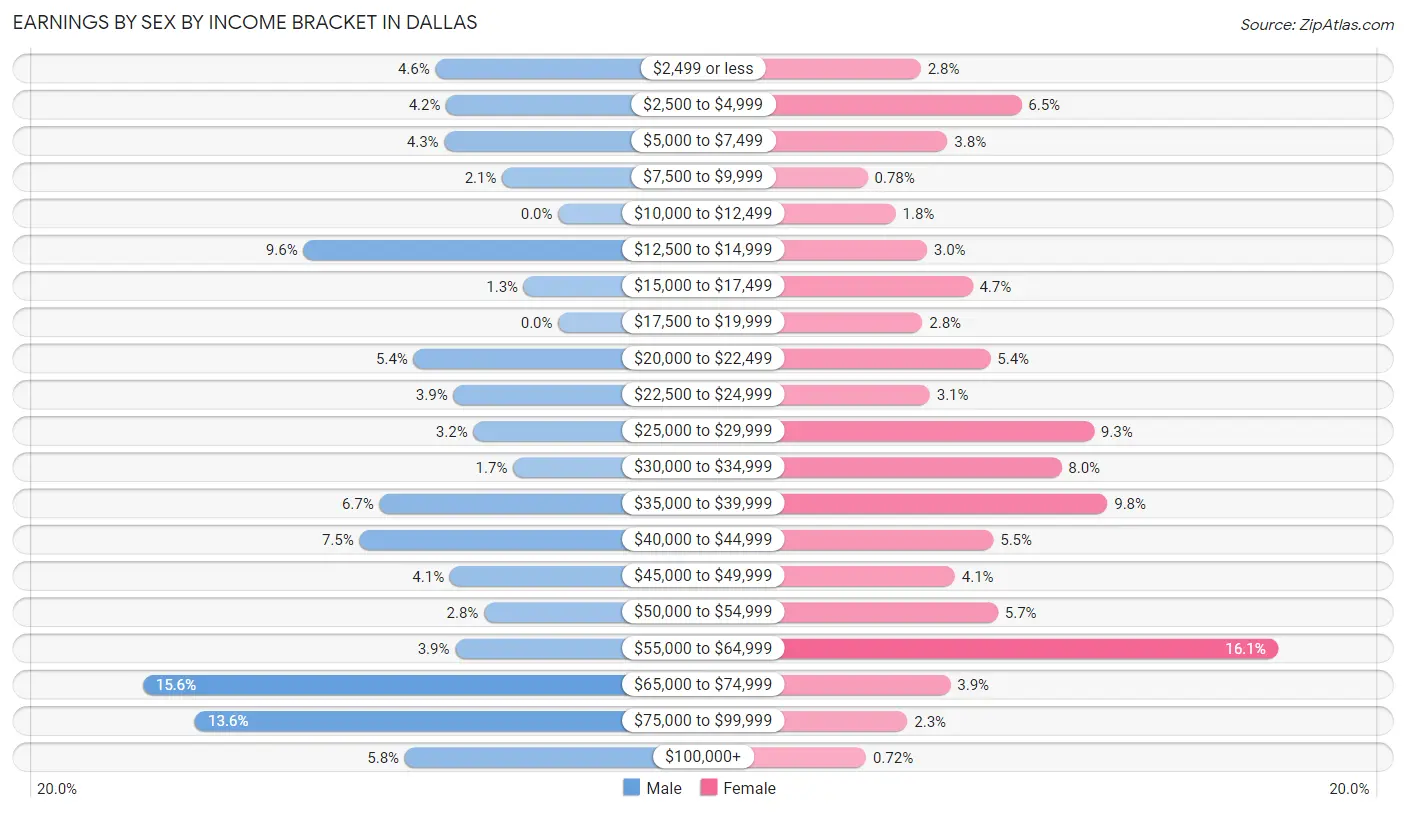
Earnings by Sex by Income Bracket in Dallas
The most common earnings brackets in Dallas are $65,000 to $74,999 for men (230 | 15.6%) and $55,000 to $64,999 for women (291 | 16.1%).
| Income | Male | Female |
| $2,499 or less | 68 (4.6%) | 50 (2.8%) |
| $2,500 to $4,999 | 62 (4.2%) | 118 (6.5%) |
| $5,000 to $7,499 | 63 (4.3%) | 68 (3.8%) |
| $7,500 to $9,999 | 31 (2.1%) | 14 (0.8%) |
| $10,000 to $12,499 | 0 (0.0%) | 33 (1.8%) |
| $12,500 to $14,999 | 141 (9.6%) | 54 (3.0%) |
| $15,000 to $17,499 | 19 (1.3%) | 85 (4.7%) |
| $17,500 to $19,999 | 0 (0.0%) | 51 (2.8%) |
| $20,000 to $22,499 | 80 (5.4%) | 97 (5.4%) |
| $22,500 to $24,999 | 58 (3.9%) | 56 (3.1%) |
| $25,000 to $29,999 | 47 (3.2%) | 167 (9.3%) |
| $30,000 to $34,999 | 25 (1.7%) | 145 (8.0%) |
| $35,000 to $39,999 | 99 (6.7%) | 176 (9.8%) |
| $40,000 to $44,999 | 110 (7.4%) | 99 (5.5%) |
| $45,000 to $49,999 | 60 (4.1%) | 73 (4.1%) |
| $50,000 to $54,999 | 41 (2.8%) | 102 (5.7%) |
| $55,000 to $64,999 | 57 (3.9%) | 291 (16.1%) |
| $65,000 to $74,999 | 230 (15.6%) | 70 (3.9%) |
| $75,000 to $99,999 | 201 (13.6%) | 41 (2.3%) |
| $100,000+ | 85 (5.8%) | 13 (0.7%) |
| Total | 1,477 (100.0%) | 1,803 (100.0%) |
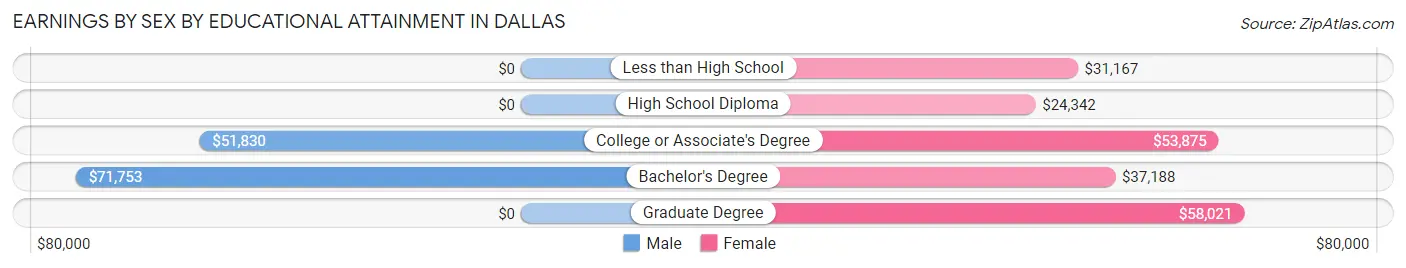
Earnings by Sex by Educational Attainment in Dallas
Average earnings in Dallas are $50,089 for men and $36,674 for women, a difference of 26.8%. Men with an educational attainment of bachelor's degree enjoy the highest average annual earnings of $71,753, while those with college or associate's degree education earn the least with $51,830. Women with an educational attainment of graduate degree earn the most with the average annual earnings of $58,021, while those with high school diploma education have the smallest earnings of $24,342.
| Educational Attainment | Male Income | Female Income |
| Less than High School | - | - |
| High School Diploma | - | - |
| College or Associate's Degree | $51,830 | $53,875 |
| Bachelor's Degree | $71,753 | $37,188 |
| Graduate Degree | - | - |
| Total | $50,089 | $36,674 |
Family Income in Dallas
Family Income Brackets in Dallas
According to the Dallas family income data, there are 319 families falling into the $75,000 to $99,999 income range, which is the most common income bracket and makes up 23.1% of all families.
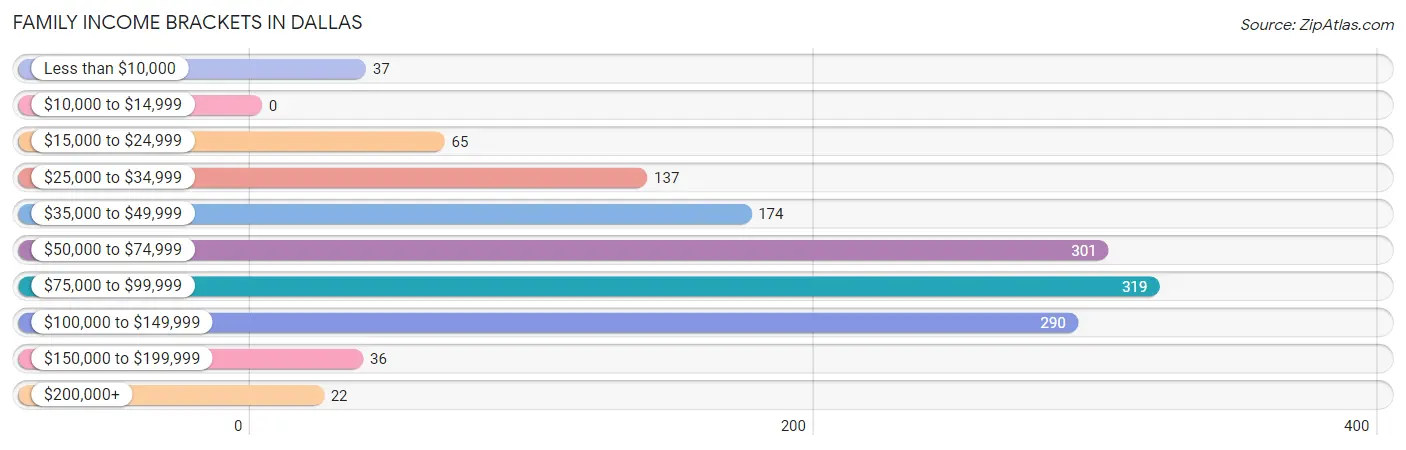
| Income Bracket | # Families | % Families |
| Less than $10,000 | 37 | 2.7% |
| $10,000 to $14,999 | 0 | 0.0% |
| $15,000 to $24,999 | 65 | 4.7% |
| $25,000 to $34,999 | 137 | 9.9% |
| $35,000 to $49,999 | 174 | 12.6% |
| $50,000 to $74,999 | 301 | 21.8% |
| $75,000 to $99,999 | 319 | 23.1% |
| $100,000 to $149,999 | 290 | 21.0% |
| $150,000 to $199,999 | 36 | 2.6% |
| $200,000+ | 22 | 1.6% |
Family Income by Famaliy Size in Dallas
4-person families (344 | 24.9%) account for the highest median family income in Dallas with $98,147 per family, while 2-person families (557 | 40.4%) have the highest median income of $30,039 per family member.
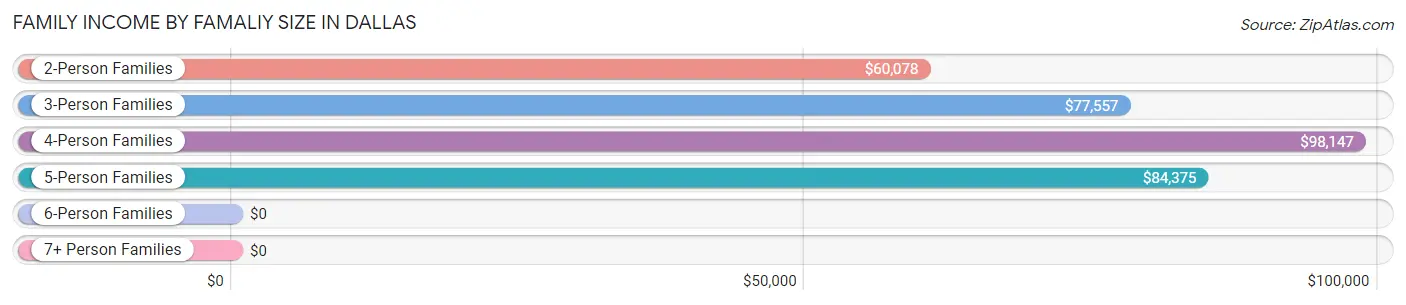
| Income Bracket | # Families | Median Income |
| 2-Person Families | 557 (40.4%) | $60,078 |
| 3-Person Families | 300 (21.7%) | $77,557 |
| 4-Person Families | 344 (24.9%) | $98,147 |
| 5-Person Families | 165 (12.0%) | $84,375 |
| 6-Person Families | 0 (0.0%) | $0 |
| 7+ Person Families | 14 (1.0%) | $0 |
| Total | 1,380 (100.0%) | $70,417 |
Family Income by Number of Earners in Dallas
The median family income in Dallas is $70,417, with families comprising 3+ earners (221) having the highest median family income of $93,792, while families with no earners (136) have the lowest median family income of $26,048, accounting for 16.0% and 9.9% of families, respectively.
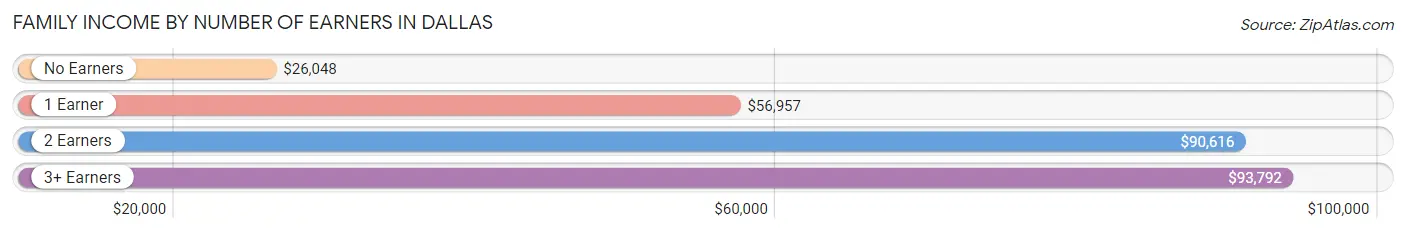
| Number of Earners | # Families | Median Income |
| No Earners | 136 (9.9%) | $26,048 |
| 1 Earner | 478 (34.6%) | $56,957 |
| 2 Earners | 545 (39.5%) | $90,616 |
| 3+ Earners | 221 (16.0%) | $93,792 |
| Total | 1,380 (100.0%) | $70,417 |
Household Income in Dallas
Household Income Brackets in Dallas
With 527 households falling in the category, the $50,000 to $74,999 income range is the most frequent in Dallas, accounting for 24.4% of all households. In contrast, only 30 households (1.4%) fall into the $200,000+ income bracket, making it the least populous group.
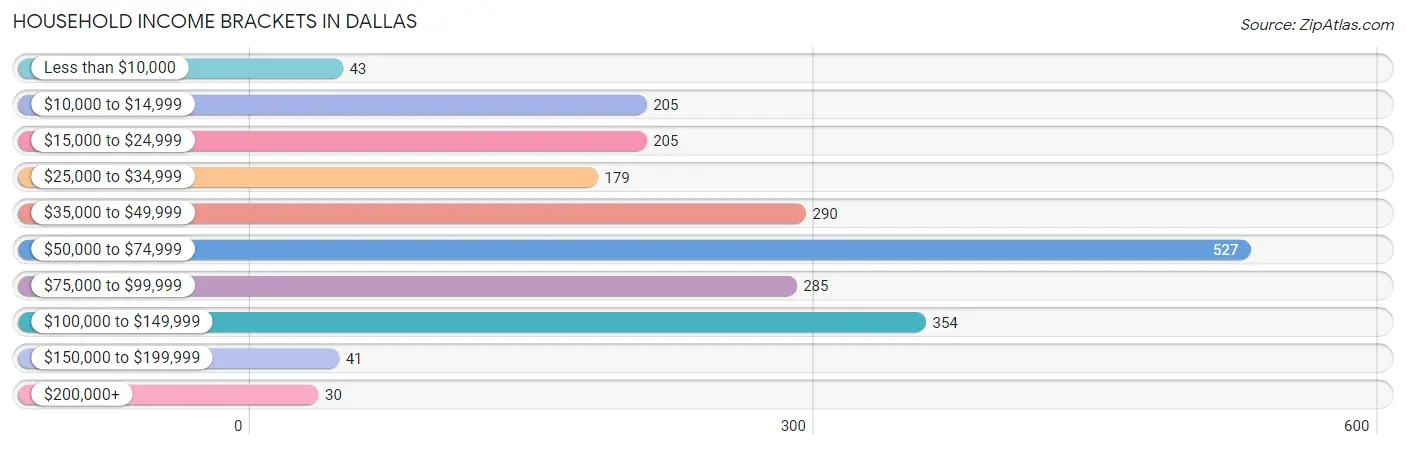
| Income Bracket | # Households | % Households |
| Less than $10,000 | 43 | 2.0% |
| $10,000 to $14,999 | 205 | 9.5% |
| $15,000 to $24,999 | 205 | 9.5% |
| $25,000 to $34,999 | 179 | 8.3% |
| $35,000 to $49,999 | 290 | 13.4% |
| $50,000 to $74,999 | 527 | 24.4% |
| $75,000 to $99,999 | 285 | 13.2% |
| $100,000 to $149,999 | 354 | 16.4% |
| $150,000 to $199,999 | 41 | 1.9% |
| $200,000+ | 30 | 1.4% |
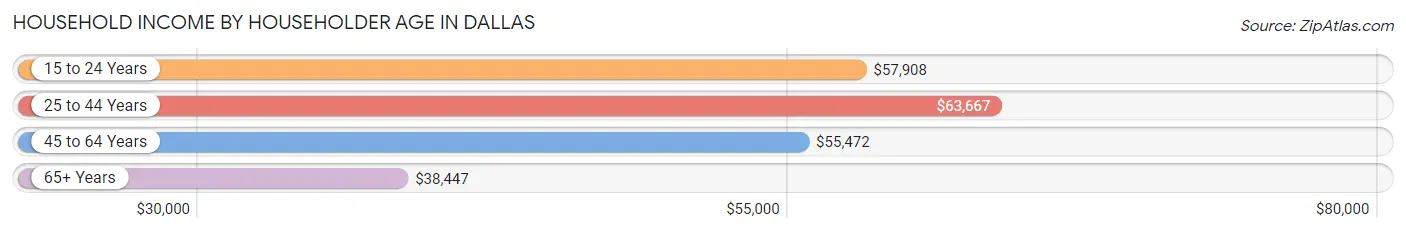
Household Income by Householder Age in Dallas
The median household income in Dallas is $55,979, with the highest median household income of $63,667 found in the 25 to 44 years age bracket for the primary householder. A total of 624 households (28.9%) fall into this category. Meanwhile, the 65+ years age bracket for the primary householder has the lowest median household income of $38,447, with 477 households (22.1%) in this group.
| Income Bracket | # Households | Median Income |
| 15 to 24 Years | 171 (7.9%) | $57,908 |
| 25 to 44 Years | 624 (28.9%) | $63,667 |
| 45 to 64 Years | 889 (41.1%) | $55,472 |
| 65+ Years | 477 (22.1%) | $38,447 |
| Total | 2,161 (100.0%) | $55,979 |
Poverty in Dallas
Income Below Poverty by Sex and Age in Dallas
With 6.9% poverty level for males and 10.5% for females among the residents of Dallas, 75 year old and over males and 15 year old females are the most vulnerable to poverty, with 20 males (20.0%) and 39 females (43.8%) in their respective age groups living below the poverty level.
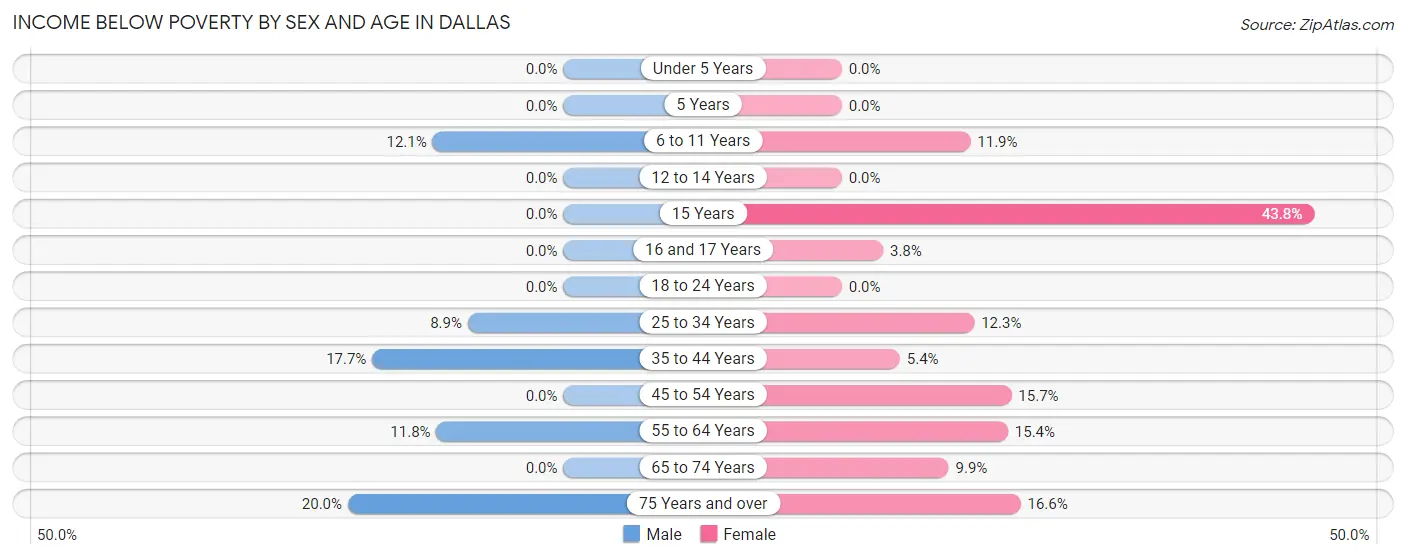
| Age Bracket | Male | Female |
| Under 5 Years | 0 (0.0%) | 0 (0.0%) |
| 5 Years | 0 (0.0%) | 0 (0.0%) |
| 6 to 11 Years | 17 (12.1%) | 26 (11.9%) |
| 12 to 14 Years | 0 (0.0%) | 0 (0.0%) |
| 15 Years | 0 (0.0%) | 39 (43.8%) |
| 16 and 17 Years | 0 (0.0%) | 10 (3.8%) |
| 18 to 24 Years | 0 (0.0%) | 0 (0.0%) |
| 25 to 34 Years | 29 (8.9%) | 37 (12.3%) |
| 35 to 44 Years | 69 (17.7%) | 37 (5.4%) |
| 45 to 54 Years | 0 (0.0%) | 48 (15.7%) |
| 55 to 64 Years | 39 (11.8%) | 96 (15.4%) |
| 65 to 74 Years | 0 (0.0%) | 23 (9.9%) |
| 75 Years and over | 20 (20.0%) | 35 (16.6%) |
| Total | 174 (6.9%) | 351 (10.5%) |
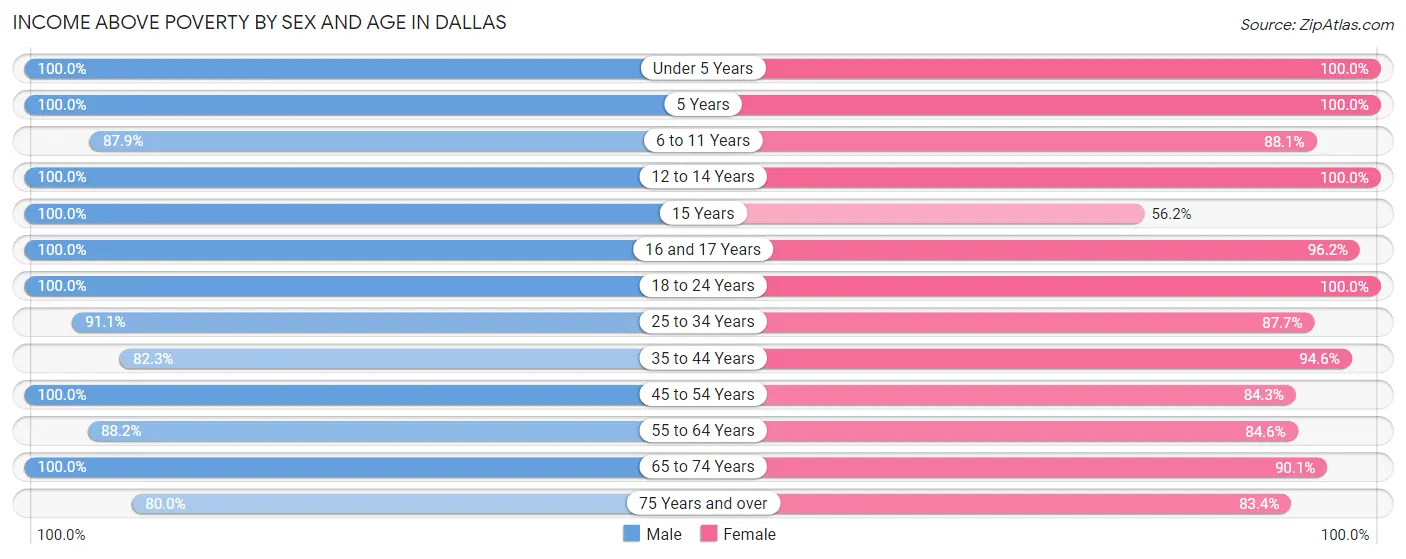
Income Above Poverty by Sex and Age in Dallas
According to the poverty statistics in Dallas, males aged under 5 years and females aged under 5 years are the age groups that are most secure financially, with 100.0% of males and 100.0% of females in these age groups living above the poverty line.
| Age Bracket | Male | Female |
| Under 5 Years | 282 (100.0%) | 91 (100.0%) |
| 5 Years | 23 (100.0%) | 11 (100.0%) |
| 6 to 11 Years | 123 (87.9%) | 192 (88.1%) |
| 12 to 14 Years | 30 (100.0%) | 87 (100.0%) |
| 15 Years | 23 (100.0%) | 50 (56.2%) |
| 16 and 17 Years | 77 (100.0%) | 251 (96.2%) |
| 18 to 24 Years | 257 (100.0%) | 225 (100.0%) |
| 25 to 34 Years | 298 (91.1%) | 264 (87.7%) |
| 35 to 44 Years | 320 (82.3%) | 649 (94.6%) |
| 45 to 54 Years | 292 (100.0%) | 257 (84.3%) |
| 55 to 64 Years | 292 (88.2%) | 527 (84.6%) |
| 65 to 74 Years | 244 (100.0%) | 209 (90.1%) |
| 75 Years and over | 80 (80.0%) | 176 (83.4%) |
| Total | 2,341 (93.1%) | 2,989 (89.5%) |
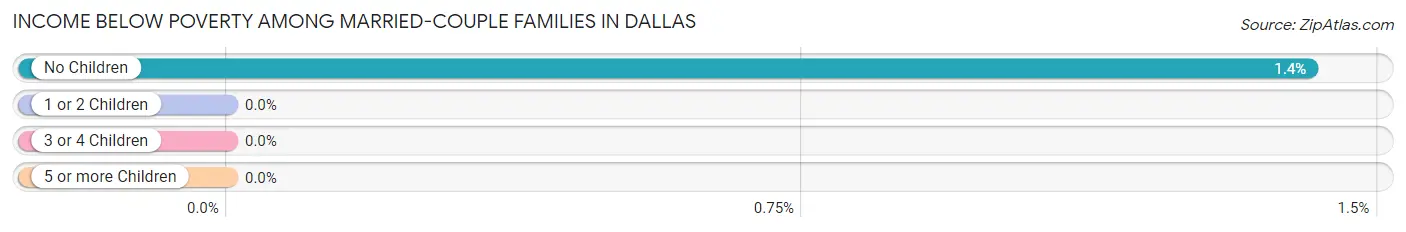
Income Below Poverty Among Married-Couple Families in Dallas
The poverty statistics for married-couple families in Dallas show that 0.7% or 6 of the total 893 families live below the poverty line. Families with no children have the highest poverty rate of 1.4%, comprising of 6 families. On the other hand, families with 1 or 2 children have the lowest poverty rate of 0.0%, which includes 0 families.
| Children | Above Poverty | Below Poverty |
| No Children | 421 (98.6%) | 6 (1.4%) |
| 1 or 2 Children | 371 (100.0%) | 0 (0.0%) |
| 3 or 4 Children | 95 (100.0%) | 0 (0.0%) |
| 5 or more Children | 0 (0.0%) | 0 (0.0%) |
| Total | 887 (99.3%) | 6 (0.7%) |
Income Below Poverty Among Single-Parent Households in Dallas
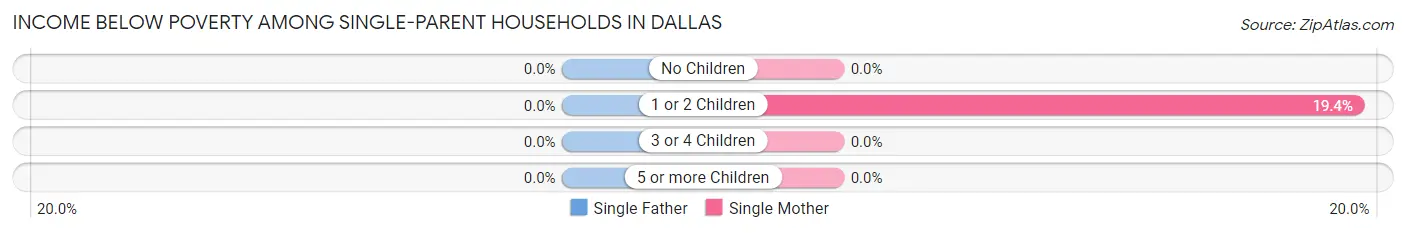
| Children | Single Father | Single Mother |
| No Children | 0 (0.0%) | 0 (0.0%) |
| 1 or 2 Children | 0 (0.0%) | 46 (19.4%) |
| 3 or 4 Children | 0 (0.0%) | 0 (0.0%) |
| 5 or more Children | 0 (0.0%) | 0 (0.0%) |
| Total | 0 (0.0%) | 46 (14.1%) |
Income Below Poverty Among Married-Couple vs Single-Parent Households in Dallas
The poverty data for Dallas shows that 6 of the married-couple family households (0.7%) and 46 of the single-parent households (9.5%) are living below the poverty level. Within the married-couple family households, those with no children have the highest poverty rate, with 6 households (1.4%) falling below the poverty line. Among the single-parent households, those with 1 or 2 children have the highest poverty rate, with 46 household (14.3%) living below poverty.
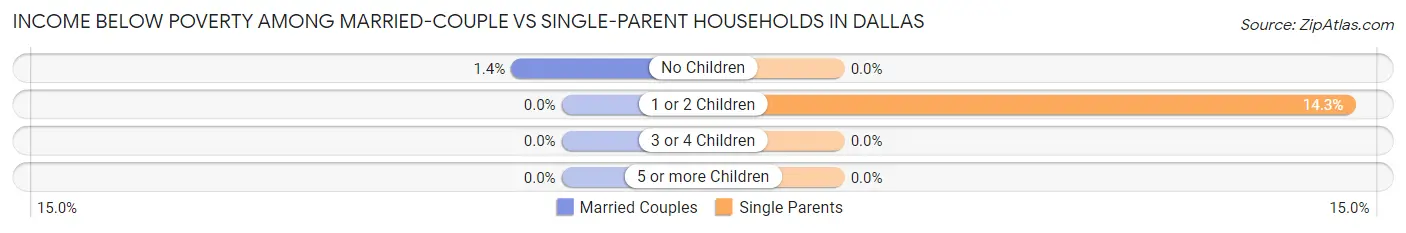
| Children | Married-Couple Families | Single-Parent Households |
| No Children | 6 (1.4%) | 0 (0.0%) |
| 1 or 2 Children | 0 (0.0%) | 46 (14.3%) |
| 3 or 4 Children | 0 (0.0%) | 0 (0.0%) |
| 5 or more Children | 0 (0.0%) | 0 (0.0%) |
| Total | 6 (0.7%) | 46 (9.5%) |
Race in Dallas
The most populous races in Dallas are White / Caucasian (3,410 | 57.9%), Black / African American (1,923 | 32.7%), and Hispanic or Latino (977 | 16.6%).
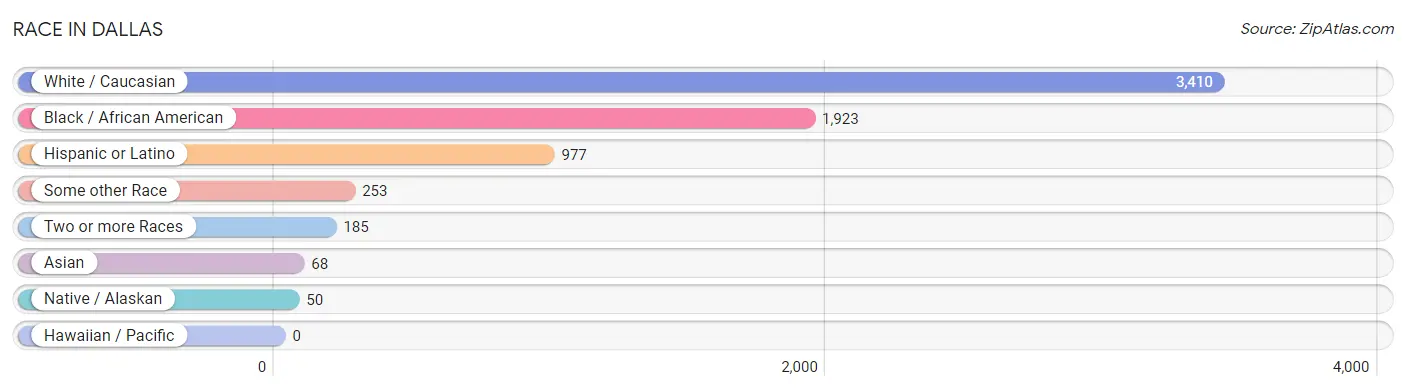
| Race | # Population | % Population |
| Asian | 68 | 1.1% |
| Black / African American | 1,923 | 32.7% |
| Hawaiian / Pacific | 0 | 0.0% |
| Hispanic or Latino | 977 | 16.6% |
| Native / Alaskan | 50 | 0.9% |
| White / Caucasian | 3,410 | 57.9% |
| Two or more Races | 185 | 3.1% |
| Some other Race | 253 | 4.3% |
| Total | 5,889 | 100.0% |
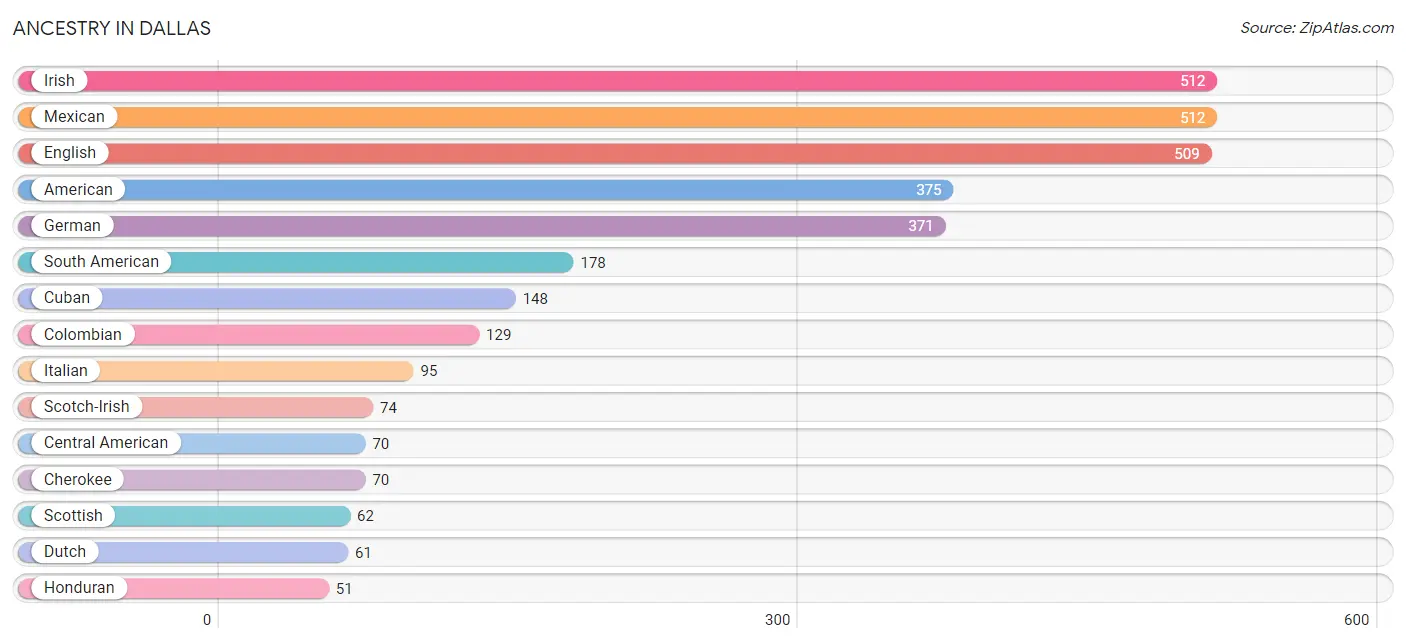
Ancestry in Dallas
The most populous ancestries reported in Dallas are Irish (512 | 8.7%), Mexican (512 | 8.7%), English (509 | 8.6%), American (375 | 6.4%), and German (371 | 6.3%), together accounting for 38.7% of all Dallas residents.
| Ancestry | # Population | % Population |
| American | 375 | 6.4% |
| Arab | 7 | 0.1% |
| Argentinean | 24 | 0.4% |
| Burmese | 16 | 0.3% |
| Canadian | 27 | 0.5% |
| Central American | 70 | 1.2% |
| Cherokee | 70 | 1.2% |
| Colombian | 129 | 2.2% |
| Cuban | 148 | 2.5% |
| Dutch | 61 | 1.0% |
| English | 509 | 8.6% |
| European | 17 | 0.3% |
| French | 23 | 0.4% |
| French Canadian | 18 | 0.3% |
| German | 371 | 6.3% |
| Greek | 31 | 0.5% |
| Haitian | 35 | 0.6% |
| Honduran | 51 | 0.9% |
| Irish | 512 | 8.7% |
| Italian | 95 | 1.6% |
| Korean | 43 | 0.7% |
| Lebanese | 7 | 0.1% |
| Mexican | 512 | 8.7% |
| Norwegian | 27 | 0.5% |
| Polish | 23 | 0.4% |
| Puerto Rican | 39 | 0.7% |
| Salvadoran | 19 | 0.3% |
| Scotch-Irish | 74 | 1.3% |
| Scottish | 62 | 1.1% |
| South American | 178 | 3.0% |
| Spaniard | 9 | 0.2% |
| Thai | 25 | 0.4% |
| Venezuelan | 25 | 0.4% |
| Welsh | 5 | 0.1% | View All 34 Rows |
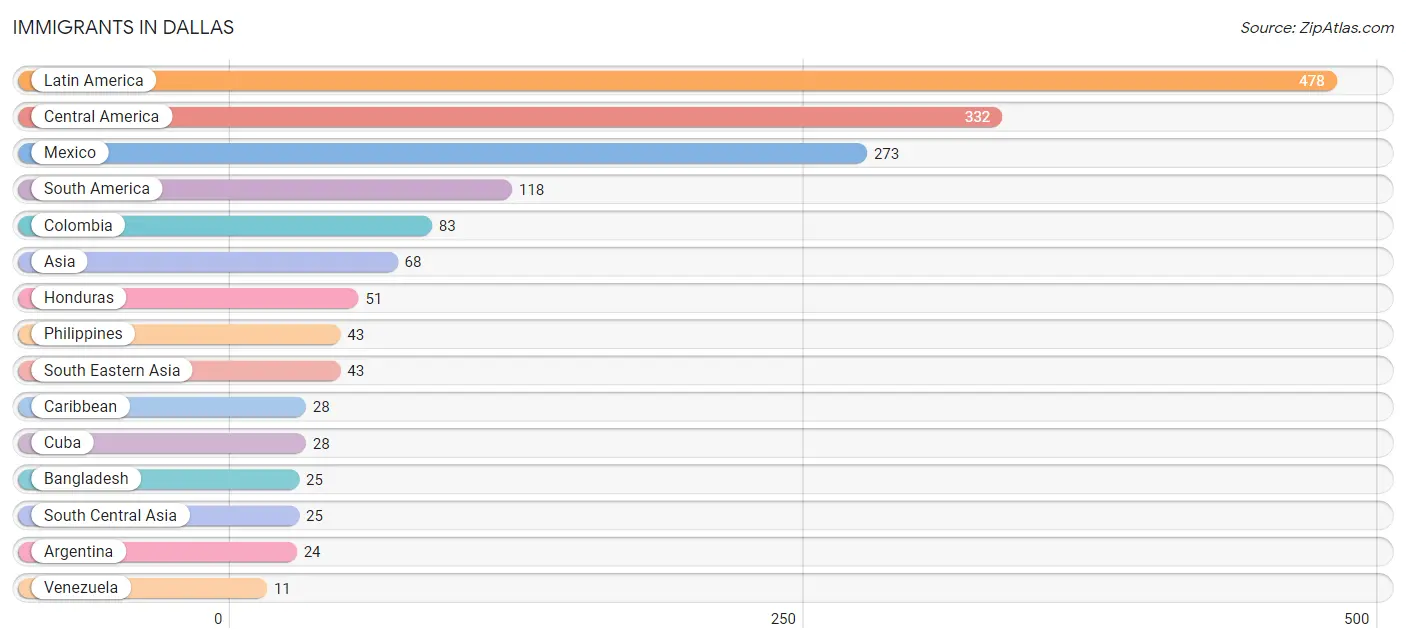
Immigrants in Dallas
The most numerous immigrant groups reported in Dallas came from Latin America (478 | 8.1%), Central America (332 | 5.6%), Mexico (273 | 4.6%), South America (118 | 2.0%), and Colombia (83 | 1.4%), together accounting for 21.8% of all Dallas residents.
| Immigration Origin | # Population | % Population |
| Argentina | 24 | 0.4% |
| Asia | 68 | 1.1% |
| Bangladesh | 25 | 0.4% |
| Caribbean | 28 | 0.5% |
| Central America | 332 | 5.6% |
| Colombia | 83 | 1.4% |
| Cuba | 28 | 0.5% |
| El Salvador | 8 | 0.1% |
| Honduras | 51 | 0.9% |
| Latin America | 478 | 8.1% |
| Mexico | 273 | 4.6% |
| Philippines | 43 | 0.7% |
| South America | 118 | 2.0% |
| South Central Asia | 25 | 0.4% |
| South Eastern Asia | 43 | 0.7% |
| Venezuela | 11 | 0.2% | View All 16 Rows |
Sex and Age in Dallas
Sex and Age in Dallas
The most populous age groups in Dallas are Under 5 Years (282 | 11.1%) for men and 35 to 39 Years (436 | 13.0%) for women.

| Age Bracket | Male | Female |
| Under 5 Years | 282 (11.1%) | 91 (2.7%) |
| 5 to 9 Years | 107 (4.2%) | 207 (6.2%) |
| 10 to 14 Years | 103 (4.1%) | 126 (3.7%) |
| 15 to 19 Years | 208 (8.2%) | 377 (11.2%) |
| 20 to 24 Years | 149 (5.9%) | 198 (5.9%) |
| 25 to 29 Years | 203 (8.0%) | 169 (5.0%) |
| 30 to 34 Years | 124 (4.9%) | 132 (3.9%) |
| 35 to 39 Years | 114 (4.5%) | 436 (13.0%) |
| 40 to 44 Years | 275 (10.9%) | 250 (7.4%) |
| 45 to 49 Years | 164 (6.5%) | 181 (5.4%) |
| 50 to 54 Years | 128 (5.1%) | 124 (3.7%) |
| 55 to 59 Years | 196 (7.7%) | 388 (11.6%) |
| 60 to 64 Years | 135 (5.3%) | 235 (7.0%) |
| 65 to 69 Years | 116 (4.6%) | 101 (3.0%) |
| 70 to 74 Years | 128 (5.1%) | 131 (3.9%) |
| 75 to 79 Years | 94 (3.7%) | 92 (2.7%) |
| 80 to 84 Years | 0 (0.0%) | 90 (2.7%) |
| 85 Years and over | 6 (0.2%) | 29 (0.9%) |
| Total | 2,532 (100.0%) | 3,357 (100.0%) |
Families and Households in Dallas
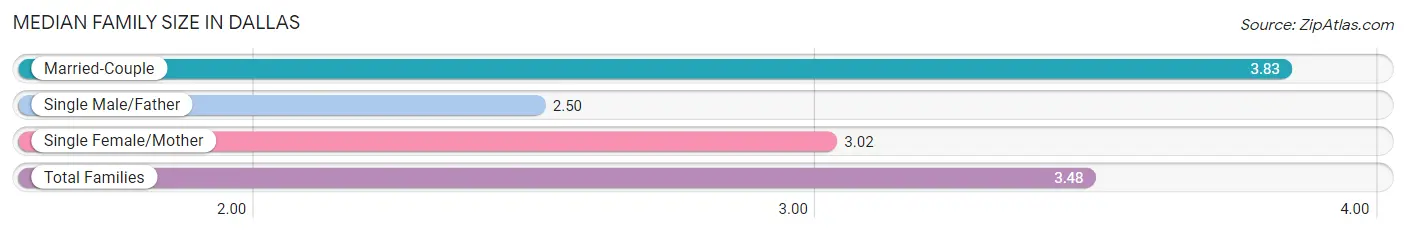
Median Family Size in Dallas
The median family size in Dallas is 3.48 persons per family, with married-couple families (893 | 64.7%) accounting for the largest median family size of 3.83 persons per family. On the other hand, single male/father families (161 | 11.7%) represent the smallest median family size with 2.50 persons per family.
| Family Type | # Families | Family Size |
| Married-Couple | 893 (64.7%) | 3.83 |
| Single Male/Father | 161 (11.7%) | 2.50 |
| Single Female/Mother | 326 (23.6%) | 3.02 |
| Total Families | 1,380 (100.0%) | 3.48 |
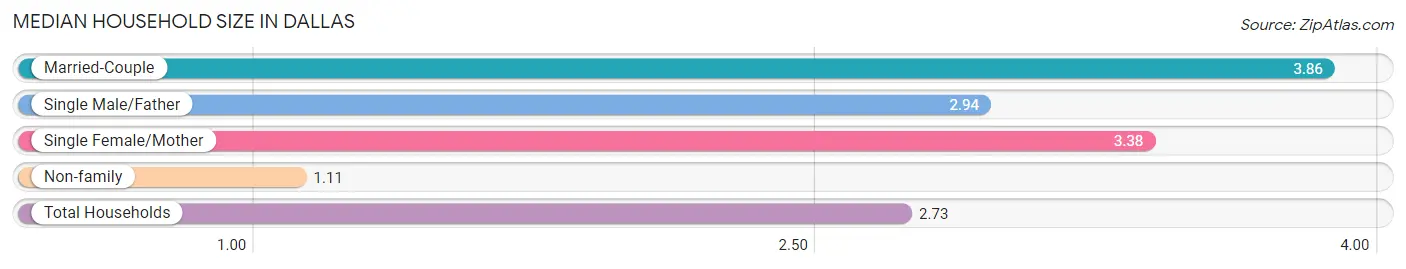
Median Household Size in Dallas
The median household size in Dallas is 2.73 persons per household, with married-couple households (893 | 41.3%) accounting for the largest median household size of 3.86 persons per household. non-family households (781 | 36.1%) represent the smallest median household size with 1.11 persons per household.
| Household Type | # Households | Household Size |
| Married-Couple | 893 (41.3%) | 3.86 |
| Single Male/Father | 161 (7.4%) | 2.94 |
| Single Female/Mother | 326 (15.1%) | 3.38 |
| Non-family | 781 (36.1%) | 1.11 |
| Total Households | 2,161 (100.0%) | 2.73 |
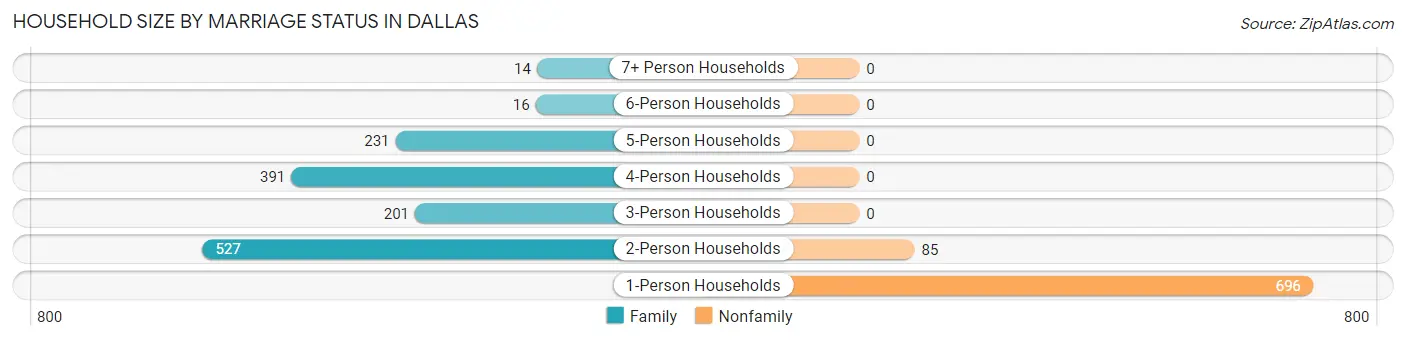
Household Size by Marriage Status in Dallas
Out of a total of 2,161 households in Dallas, 1,380 (63.9%) are family households, while 781 (36.1%) are nonfamily households. The most numerous type of family households are 2-person households, comprising 527, and the most common type of nonfamily households are 1-person households, comprising 696.
| Household Size | Family Households | Nonfamily Households |
| 1-Person Households | - | 696 (32.2%) |
| 2-Person Households | 527 (24.4%) | 85 (3.9%) |
| 3-Person Households | 201 (9.3%) | 0 (0.0%) |
| 4-Person Households | 391 (18.1%) | 0 (0.0%) |
| 5-Person Households | 231 (10.7%) | 0 (0.0%) |
| 6-Person Households | 16 (0.7%) | 0 (0.0%) |
| 7+ Person Households | 14 (0.6%) | 0 (0.0%) |
| Total | 1,380 (63.9%) | 781 (36.1%) |
Female Fertility in Dallas
Fertility by Age in Dallas
Average fertility rate in Dallas is 75.0 births per 1,000 women. Women in the age bracket of 20 to 34 years have the highest fertility rate with 267.0 births per 1,000 women. Women in the age bracket of 20 to 34 years acount for 100.0% of all women with births.
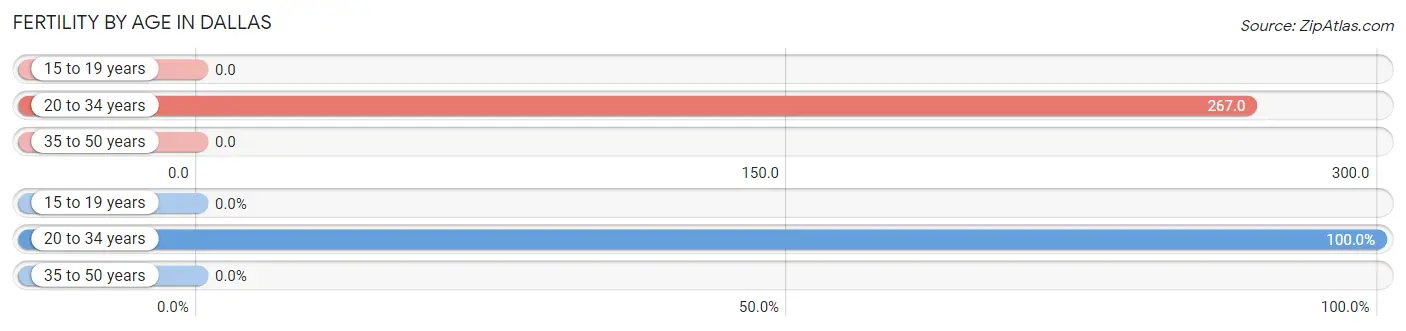
| Age Bracket | Women with Births | Births / 1,000 Women |
| 15 to 19 years | 0 (0.0%) | 0.0 |
| 20 to 34 years | 133 (100.0%) | 267.0 |
| 35 to 50 years | 0 (0.0%) | 0.0 |
| Total | 133 (100.0%) | 75.0 |
Fertility by Age by Marriage Status in Dallas
48.1% of women with births (133) in Dallas are married. The highest percentage of unmarried women with births falls into 20 to 34 years age bracket with 51.9% of them unmarried at the time of birth, while the lowest percentage of unmarried women with births belong to 20 to 34 years age bracket with 51.9% of them unmarried.
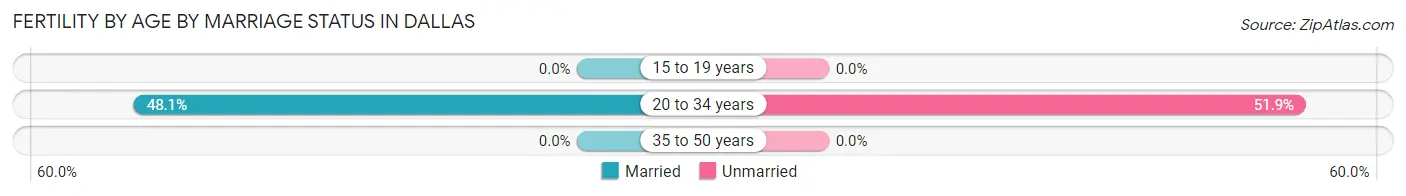
| Age Bracket | Married | Unmarried |
| 15 to 19 years | 0 (0.0%) | 0 (0.0%) |
| 20 to 34 years | 64 (48.1%) | 69 (51.9%) |
| 35 to 50 years | 0 (0.0%) | 0 (0.0%) |
| Total | 64 (48.1%) | 69 (51.9%) |
Fertility by Education in Dallas
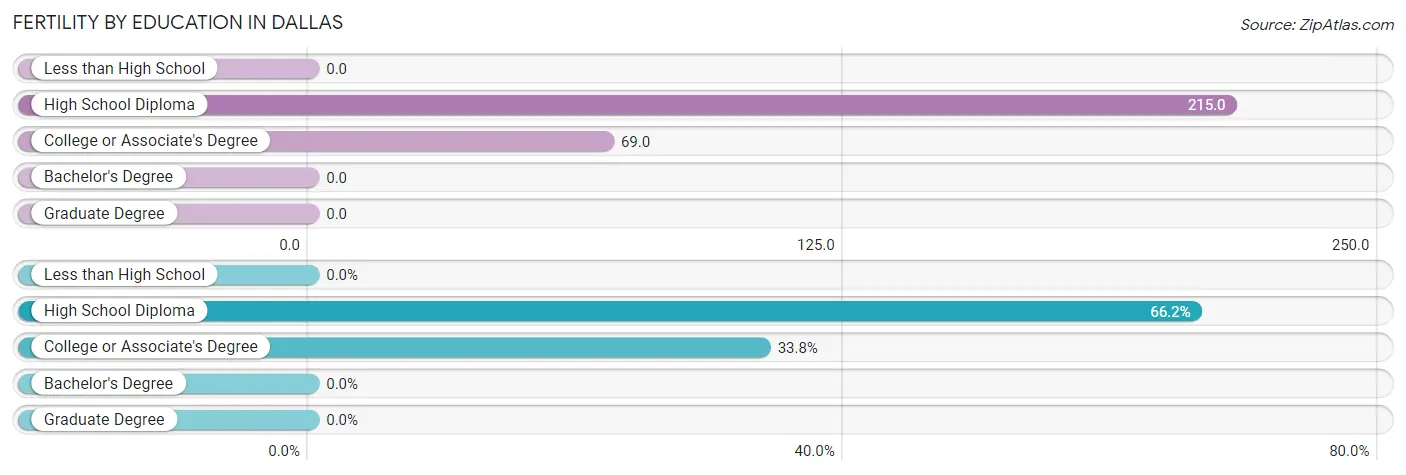
| Educational Attainment | Women with Births | Births / 1,000 Women |
| Less than High School | 0 (0.0%) | 0.0 |
| High School Diploma | 88 (66.2%) | 215.0 |
| College or Associate's Degree | 45 (33.8%) | 69.0 |
| Bachelor's Degree | 0 (0.0%) | 0.0 |
| Graduate Degree | 0 (0.0%) | 0.0 |
| Total | 133 (100.0%) | 75.0 |
Fertility by Education by Marriage Status in Dallas
51.9% of women with births in Dallas are unmarried. Women with the educational attainment of college or associate's degree are most likely to be married with 80.0% of them married at childbirth, while women with the educational attainment of high school diploma are least likely to be married with 68.2% of them unmarried at childbirth.
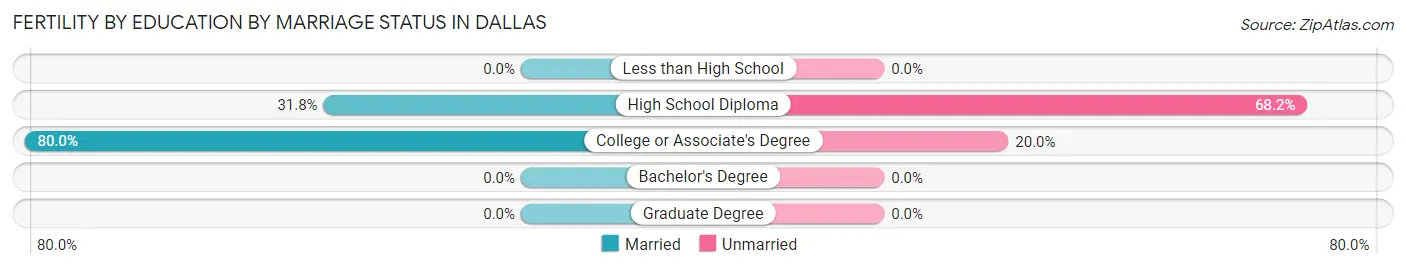
| Educational Attainment | Married | Unmarried |
| Less than High School | 0 (0.0%) | 0 (0.0%) |
| High School Diploma | 28 (31.8%) | 60 (68.2%) |
| College or Associate's Degree | 36 (80.0%) | 9 (20.0%) |
| Bachelor's Degree | 0 (0.0%) | 0 (0.0%) |
| Graduate Degree | 0 (0.0%) | 0 (0.0%) |
| Total | 64 (48.1%) | 69 (51.9%) |
Employment Characteristics in Dallas
Employment by Class of Employer in Dallas
Among the 3,072 employed individuals in Dallas, private company employees (2,439 | 79.4%), state government employees (175 | 5.7%), and not-for-profit organizations (159 | 5.2%) make up the most common classes of employment.
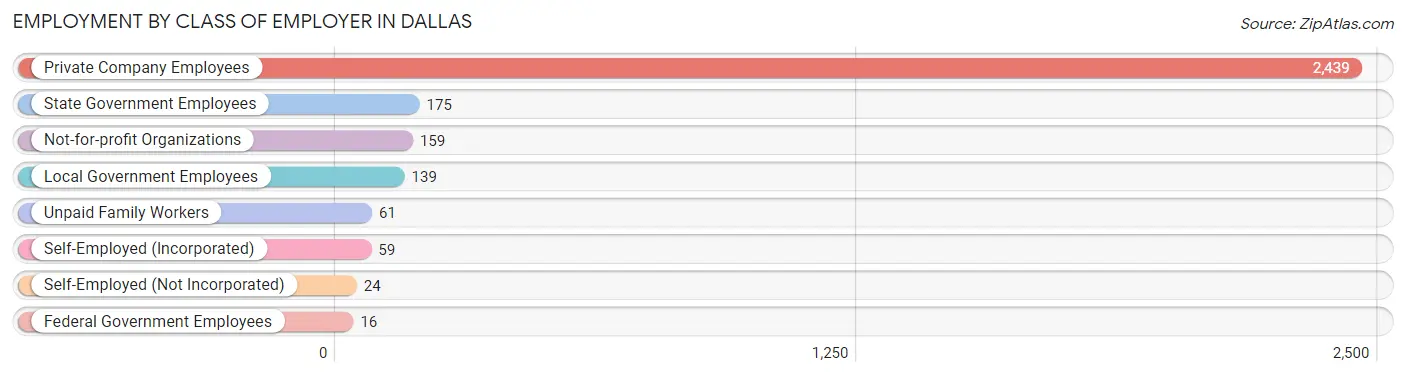
| Employer Class | # Employees | % Employees |
| Private Company Employees | 2,439 | 79.4% |
| Self-Employed (Incorporated) | 59 | 1.9% |
| Self-Employed (Not Incorporated) | 24 | 0.8% |
| Not-for-profit Organizations | 159 | 5.2% |
| Local Government Employees | 139 | 4.5% |
| State Government Employees | 175 | 5.7% |
| Federal Government Employees | 16 | 0.5% |
| Unpaid Family Workers | 61 | 2.0% |
| Total | 3,072 | 100.0% |
Employment Status by Age in Dallas
According to the labor force statistics for Dallas, out of the total population over 16 years of age (4,861), 65.9% or 3,203 individuals are in the labor force, with 4.1% or 131 of them unemployed. The age group with the highest labor force participation rate is 25 to 29 years, with 87.4% or 325 individuals in the labor force. Within the labor force, the 20 to 24 years age range has the highest percentage of unemployed individuals, with 14.2% or 43 of them being unemployed.
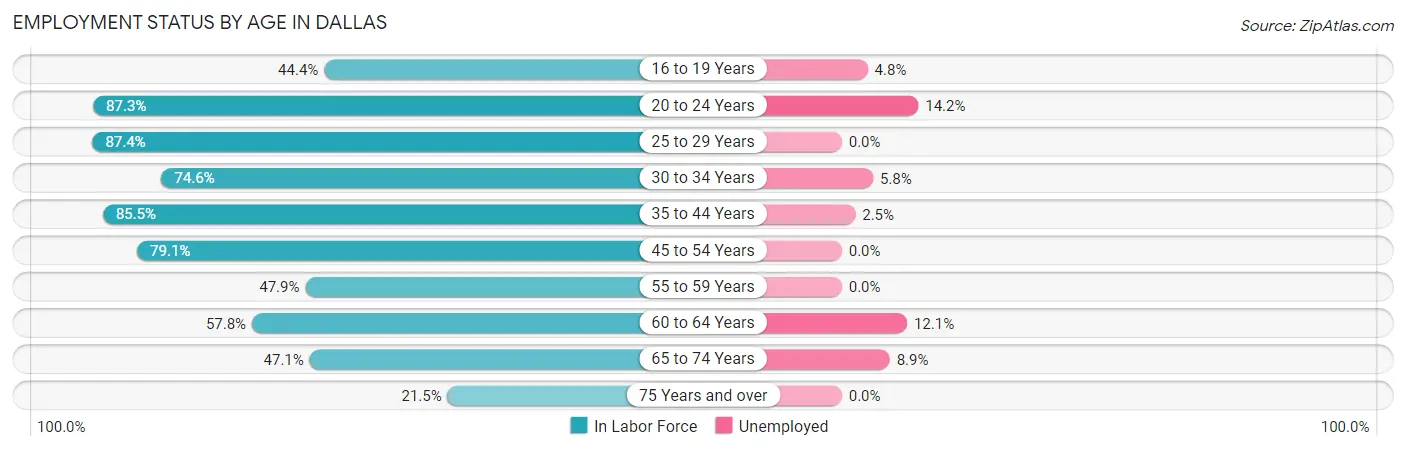
| Age Bracket | In Labor Force | Unemployed |
| 16 to 19 Years | 210 (44.4%) | 10 (4.8%) |
| 20 to 24 Years | 303 (87.3%) | 43 (14.2%) |
| 25 to 29 Years | 325 (87.4%) | 0 (0.0%) |
| 30 to 34 Years | 191 (74.6%) | 11 (5.8%) |
| 35 to 44 Years | 919 (85.5%) | 23 (2.5%) |
| 45 to 54 Years | 472 (79.1%) | 0 (0.0%) |
| 55 to 59 Years | 280 (47.9%) | 0 (0.0%) |
| 60 to 64 Years | 214 (57.8%) | 26 (12.1%) |
| 65 to 74 Years | 224 (47.1%) | 20 (8.9%) |
| 75 Years and over | 67 (21.5%) | 0 (0.0%) |
| Total | 3,203 (65.9%) | 131 (4.1%) |
Employment Status by Educational Attainment in Dallas
According to labor force statistics for Dallas, 73.8% of individuals (2,401) out of the total population between 25 and 64 years of age (3,254) are in the labor force, with 2.5% or 60 of them being unemployed. The group with the highest labor force participation rate are those with the educational attainment of bachelor's degree or higher, with 91.6% or 480 individuals in the labor force. Within the labor force, individuals with less than high school education have the highest percentage of unemployment, with 13.6% or 23 of them being unemployed.
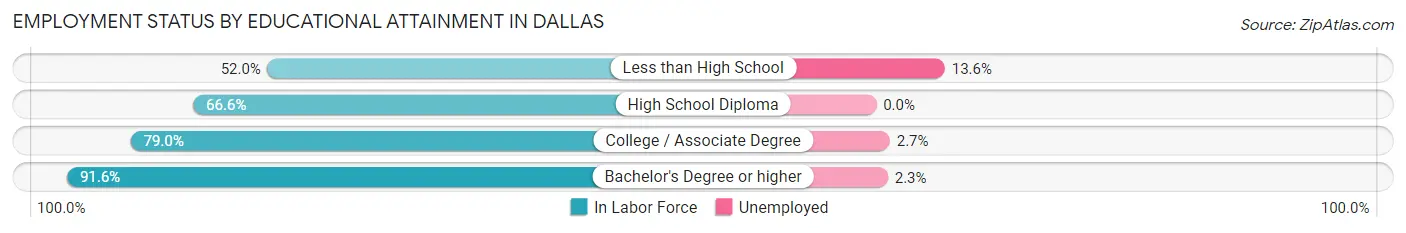
| Educational Attainment | In Labor Force | Unemployed |
| Less than High School | 169 (52.0%) | 44 (13.6%) |
| High School Diploma | 798 (66.6%) | 0 (0.0%) |
| College / Associate Degree | 954 (79.0%) | 33 (2.7%) |
| Bachelor's Degree or higher | 480 (91.6%) | 12 (2.3%) |
| Total | 2,401 (73.8%) | 81 (2.5%) |
Employment Occupations by Sex in Dallas
Management, Business, Science and Arts Occupations
The most common Management, Business, Science and Arts occupations in Dallas are Health Diagnosing & Treating (326 | 10.6%), Community & Social Service (241 | 7.9%), Management (203 | 6.6%), Education Instruction & Library (146 | 4.8%), and Business & Financial (79 | 2.6%).
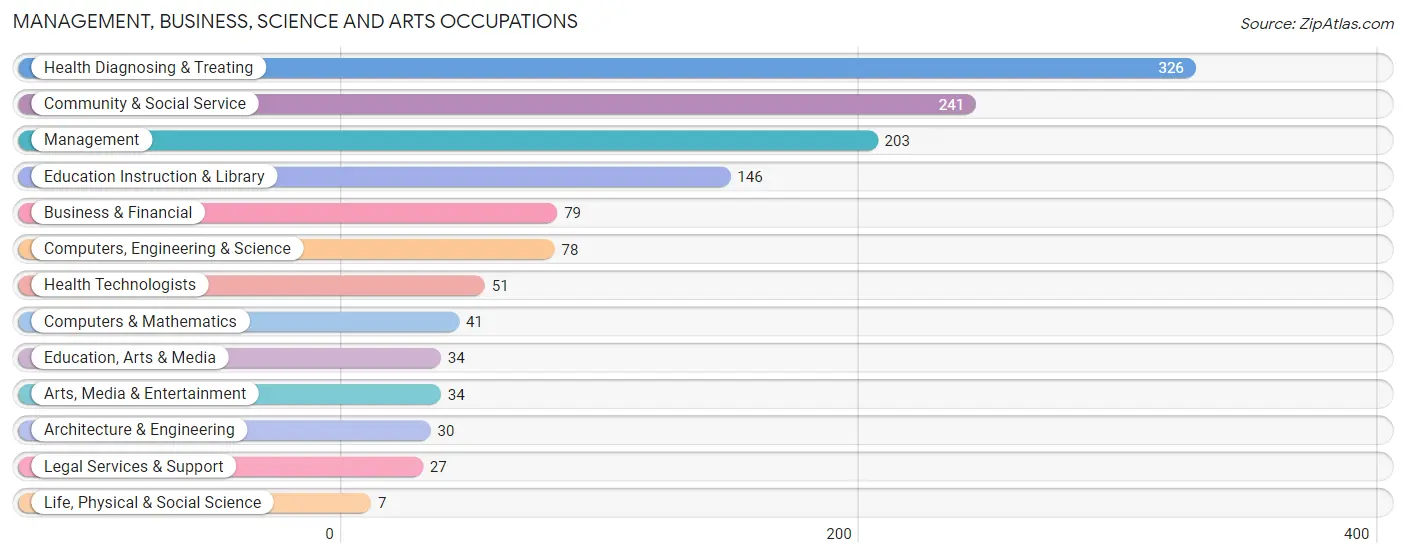
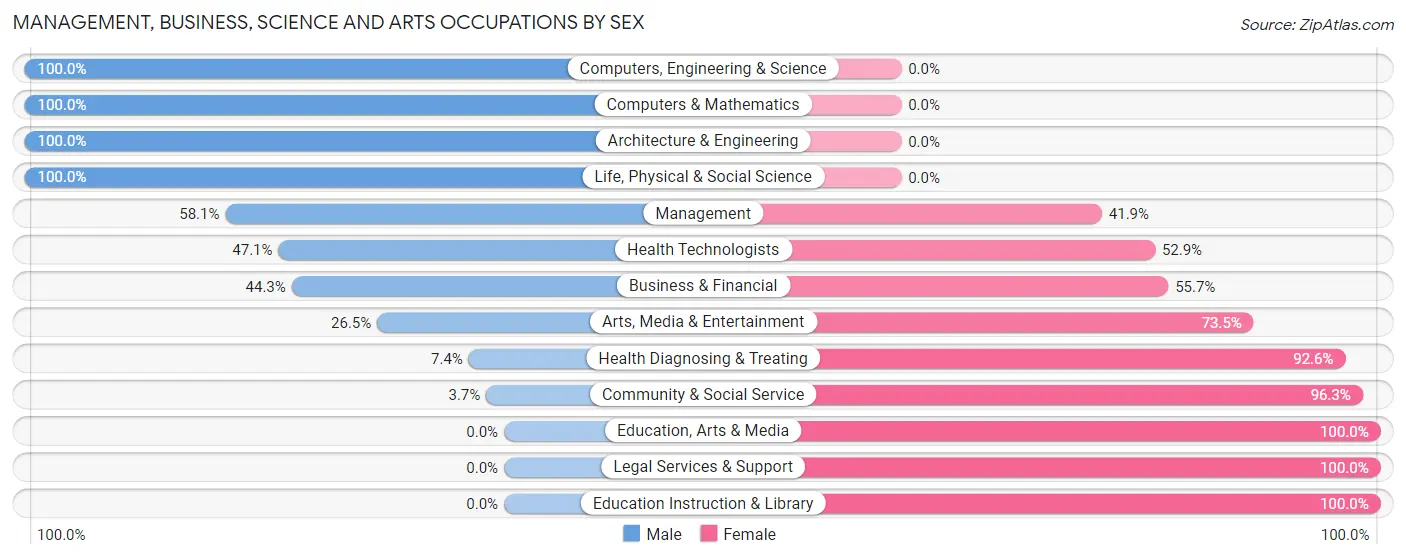
Management, Business, Science and Arts Occupations by Sex
Within the Management, Business, Science and Arts occupations in Dallas, the most male-oriented occupations are Computers, Engineering & Science (100.0%), Computers & Mathematics (100.0%), and Architecture & Engineering (100.0%), while the most female-oriented occupations are Education, Arts & Media (100.0%), Legal Services & Support (100.0%), and Education Instruction & Library (100.0%).
| Occupation | Male | Female |
| Management | 118 (58.1%) | 85 (41.9%) |
| Business & Financial | 35 (44.3%) | 44 (55.7%) |
| Computers, Engineering & Science | 78 (100.0%) | 0 (0.0%) |
| Computers & Mathematics | 41 (100.0%) | 0 (0.0%) |
| Architecture & Engineering | 30 (100.0%) | 0 (0.0%) |
| Life, Physical & Social Science | 7 (100.0%) | 0 (0.0%) |
| Community & Social Service | 9 (3.7%) | 232 (96.3%) |
| Education, Arts & Media | 0 (0.0%) | 34 (100.0%) |
| Legal Services & Support | 0 (0.0%) | 27 (100.0%) |
| Education Instruction & Library | 0 (0.0%) | 146 (100.0%) |
| Arts, Media & Entertainment | 9 (26.5%) | 25 (73.5%) |
| Health Diagnosing & Treating | 24 (7.4%) | 302 (92.6%) |
| Health Technologists | 24 (47.1%) | 27 (52.9%) |
| Total (Category) | 264 (28.5%) | 663 (71.5%) |
| Total (Overall) | 1,436 (46.7%) | 1,636 (53.3%) |
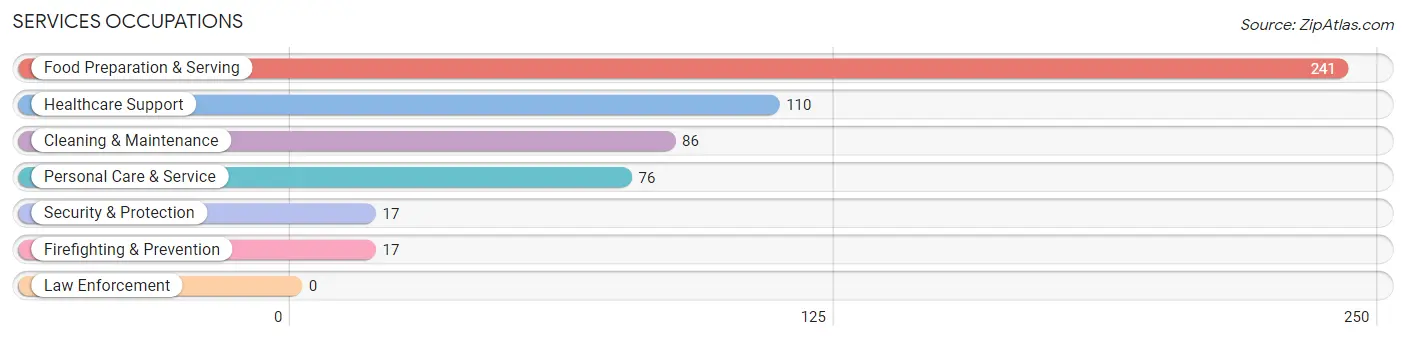
Services Occupations
The most common Services occupations in Dallas are Food Preparation & Serving (241 | 7.9%), Healthcare Support (110 | 3.6%), Cleaning & Maintenance (86 | 2.8%), Personal Care & Service (76 | 2.5%), and Security & Protection (17 | 0.5%).
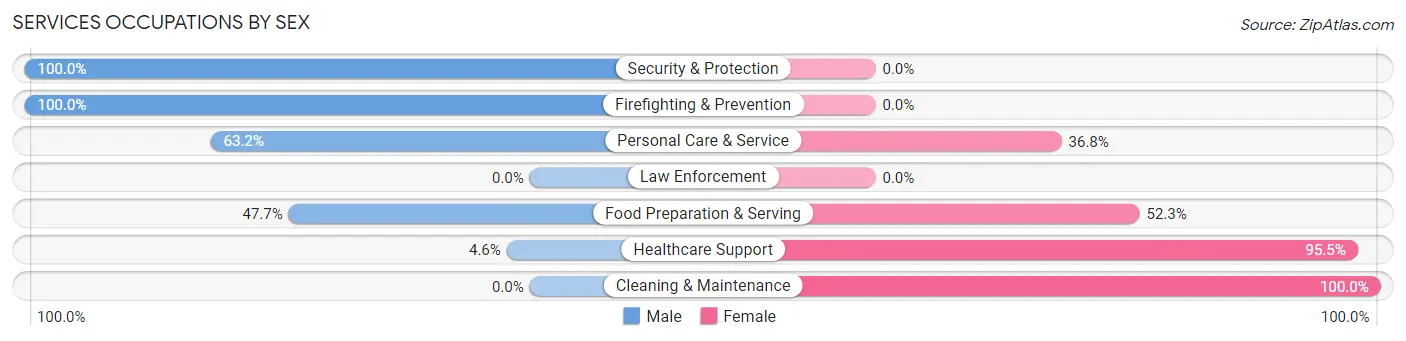
Services Occupations by Sex
Within the Services occupations in Dallas, the most male-oriented occupations are Security & Protection (100.0%), Firefighting & Prevention (100.0%), and Personal Care & Service (63.2%), while the most female-oriented occupations are Cleaning & Maintenance (100.0%), Healthcare Support (95.5%), and Food Preparation & Serving (52.3%).
| Occupation | Male | Female |
| Healthcare Support | 5 (4.5%) | 105 (95.5%) |
| Security & Protection | 17 (100.0%) | 0 (0.0%) |
| Firefighting & Prevention | 17 (100.0%) | 0 (0.0%) |
| Law Enforcement | 0 (0.0%) | 0 (0.0%) |
| Food Preparation & Serving | 115 (47.7%) | 126 (52.3%) |
| Cleaning & Maintenance | 0 (0.0%) | 86 (100.0%) |
| Personal Care & Service | 48 (63.2%) | 28 (36.8%) |
| Total (Category) | 185 (34.9%) | 345 (65.1%) |
| Total (Overall) | 1,436 (46.7%) | 1,636 (53.3%) |
Sales and Office Occupations
The most common Sales and Office occupations in Dallas are Sales & Related (306 | 10.0%), and Office & Administration (285 | 9.3%).

Sales and Office Occupations by Sex

| Occupation | Male | Female |
| Sales & Related | 155 (50.6%) | 151 (49.3%) |
| Office & Administration | 86 (30.2%) | 199 (69.8%) |
| Total (Category) | 241 (40.8%) | 350 (59.2%) |
| Total (Overall) | 1,436 (46.7%) | 1,636 (53.3%) |
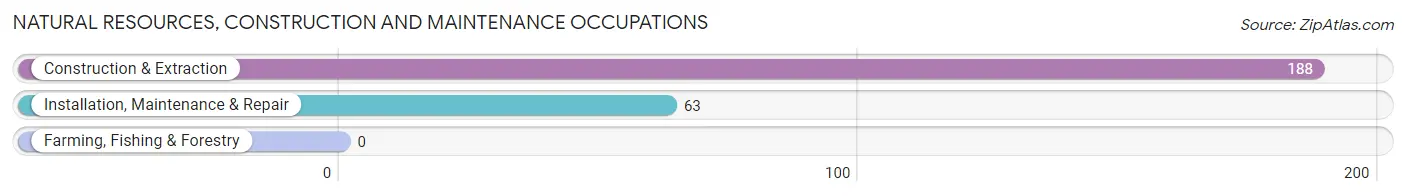
Natural Resources, Construction and Maintenance Occupations
The most common Natural Resources, Construction and Maintenance occupations in Dallas are Construction & Extraction (188 | 6.1%), and Installation, Maintenance & Repair (63 | 2.1%).
Natural Resources, Construction and Maintenance Occupations by Sex
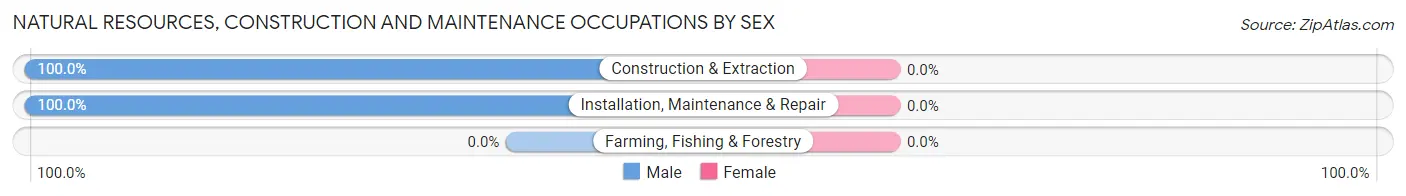
| Occupation | Male | Female |
| Farming, Fishing & Forestry | 0 (0.0%) | 0 (0.0%) |
| Construction & Extraction | 188 (100.0%) | 0 (0.0%) |
| Installation, Maintenance & Repair | 63 (100.0%) | 0 (0.0%) |
| Total (Category) | 251 (100.0%) | 0 (0.0%) |
| Total (Overall) | 1,436 (46.7%) | 1,636 (53.3%) |
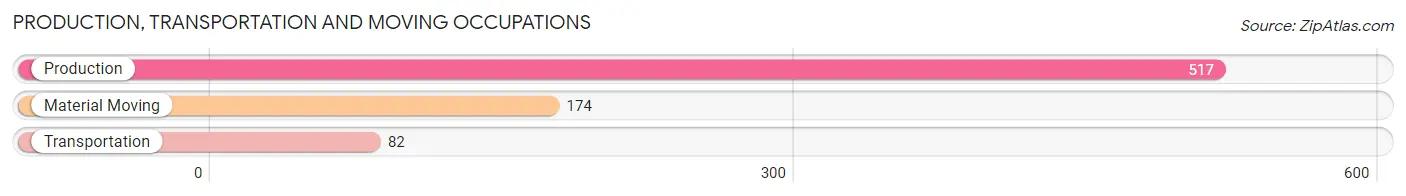
Production, Transportation and Moving Occupations
The most common Production, Transportation and Moving occupations in Dallas are Production (517 | 16.8%), Material Moving (174 | 5.7%), and Transportation (82 | 2.7%).
Production, Transportation and Moving Occupations by Sex
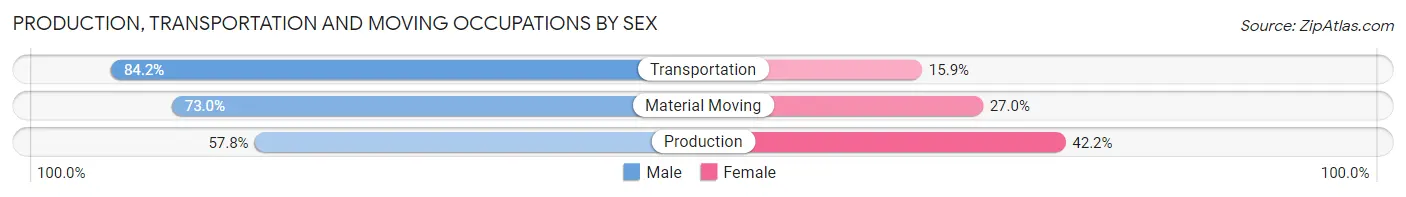
| Occupation | Male | Female |
| Production | 299 (57.8%) | 218 (42.2%) |
| Transportation | 69 (84.2%) | 13 (15.9%) |
| Material Moving | 127 (73.0%) | 47 (27.0%) |
| Total (Category) | 495 (64.0%) | 278 (36.0%) |
| Total (Overall) | 1,436 (46.7%) | 1,636 (53.3%) |
Employment Industries by Sex in Dallas
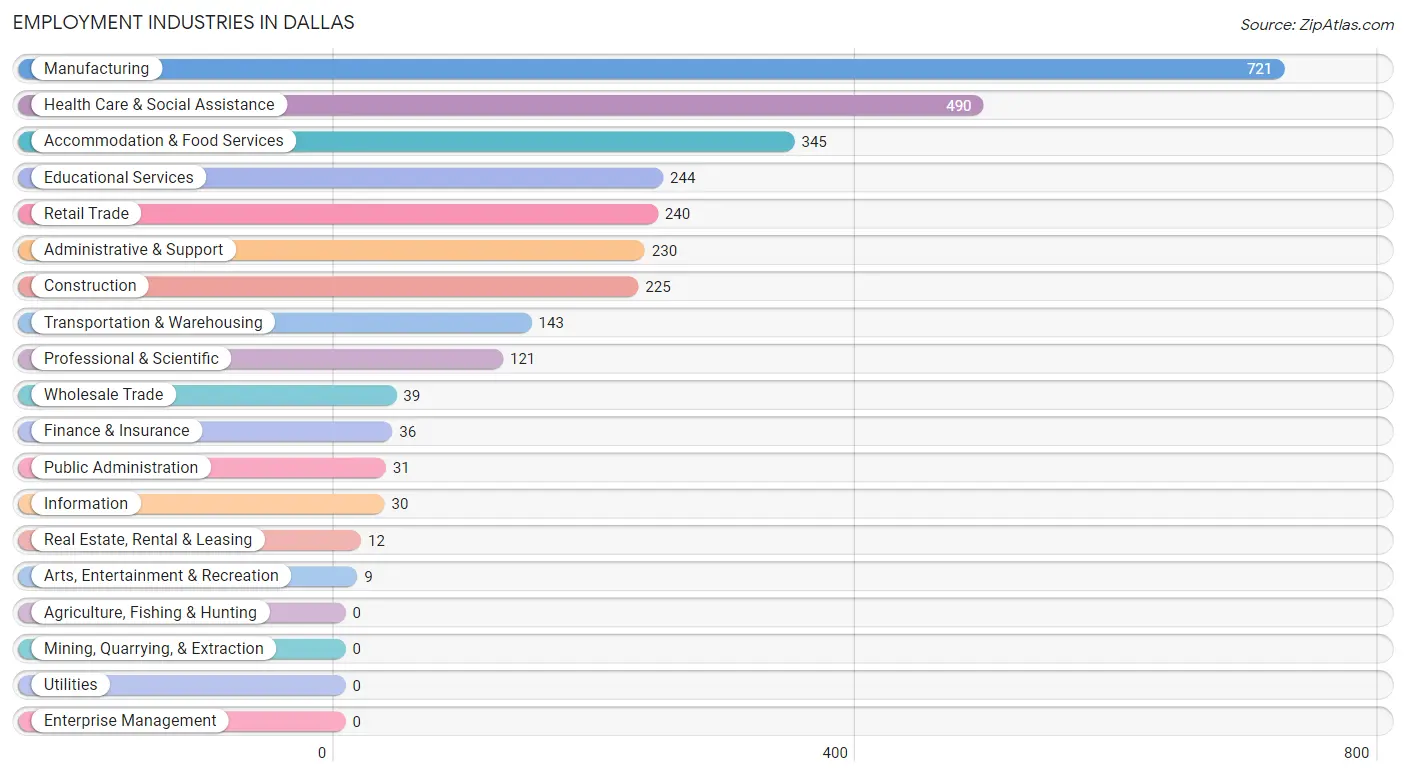
Employment Industries in Dallas
The major employment industries in Dallas include Manufacturing (721 | 23.5%), Health Care & Social Assistance (490 | 16.0%), Accommodation & Food Services (345 | 11.2%), Educational Services (244 | 7.9%), and Retail Trade (240 | 7.8%).
Employment Industries by Sex in Dallas
The Dallas industries that see more men than women are Construction (100.0%), Wholesale Trade (100.0%), and Arts, Entertainment & Recreation (100.0%), whereas the industries that tend to have a higher number of women are Information (100.0%), Real Estate, Rental & Leasing (100.0%), and Public Administration (100.0%).
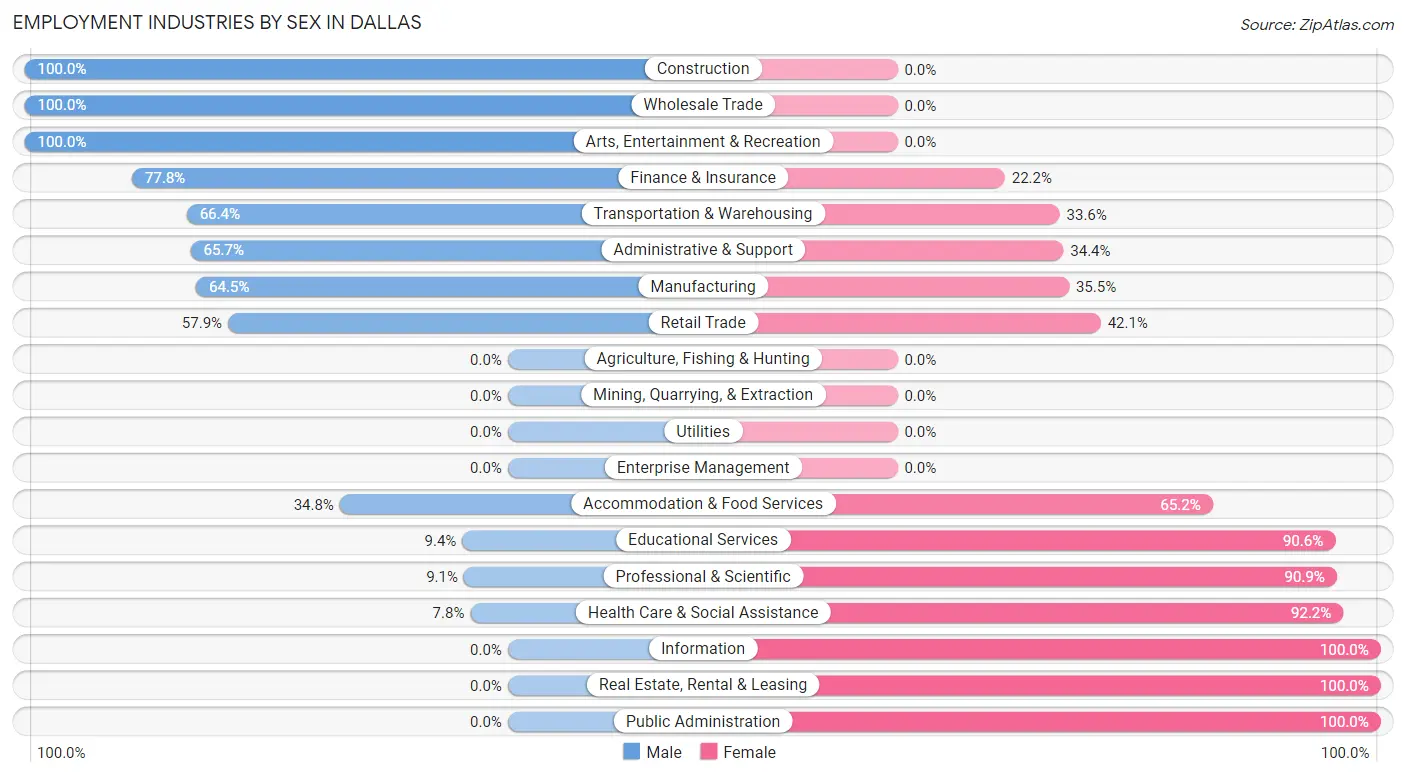
| Industry | Male | Female |
| Agriculture, Fishing & Hunting | 0 (0.0%) | 0 (0.0%) |
| Mining, Quarrying, & Extraction | 0 (0.0%) | 0 (0.0%) |
| Construction | 225 (100.0%) | 0 (0.0%) |
| Manufacturing | 465 (64.5%) | 256 (35.5%) |
| Wholesale Trade | 39 (100.0%) | 0 (0.0%) |
| Retail Trade | 139 (57.9%) | 101 (42.1%) |
| Transportation & Warehousing | 95 (66.4%) | 48 (33.6%) |
| Utilities | 0 (0.0%) | 0 (0.0%) |
| Information | 0 (0.0%) | 30 (100.0%) |
| Finance & Insurance | 28 (77.8%) | 8 (22.2%) |
| Real Estate, Rental & Leasing | 0 (0.0%) | 12 (100.0%) |
| Professional & Scientific | 11 (9.1%) | 110 (90.9%) |
| Enterprise Management | 0 (0.0%) | 0 (0.0%) |
| Administrative & Support | 151 (65.6%) | 79 (34.4%) |
| Educational Services | 23 (9.4%) | 221 (90.6%) |
| Health Care & Social Assistance | 38 (7.8%) | 452 (92.2%) |
| Arts, Entertainment & Recreation | 9 (100.0%) | 0 (0.0%) |
| Accommodation & Food Services | 120 (34.8%) | 225 (65.2%) |
| Public Administration | 0 (0.0%) | 31 (100.0%) |
| Total | 1,436 (46.7%) | 1,636 (53.3%) |
Education in Dallas
School Enrollment in Dallas
The most common levels of schooling among the 1,247 students in Dallas are high school (445 | 35.7%), elementary school (219 | 17.6%), and middle school (203 | 16.3%).
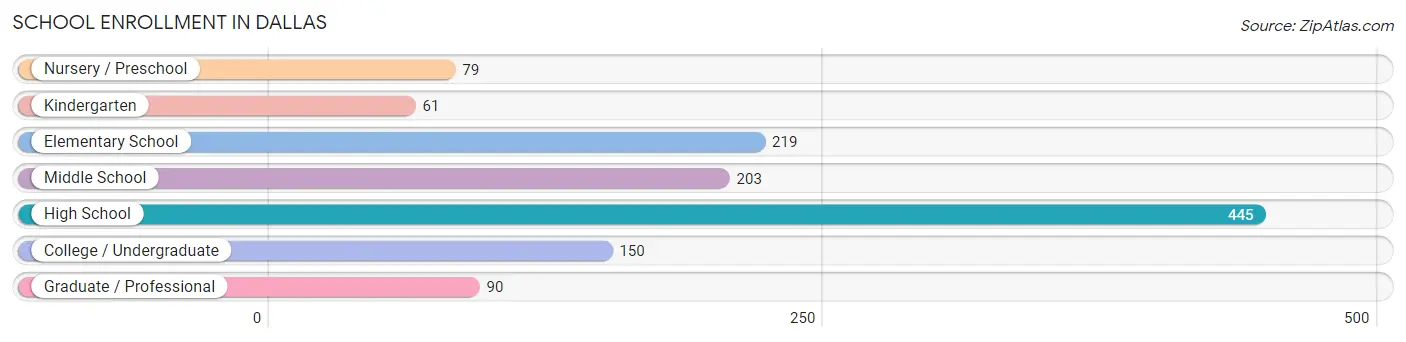
| School Level | # Students | % Students |
| Nursery / Preschool | 79 | 6.3% |
| Kindergarten | 61 | 4.9% |
| Elementary School | 219 | 17.6% |
| Middle School | 203 | 16.3% |
| High School | 445 | 35.7% |
| College / Undergraduate | 150 | 12.0% |
| Graduate / Professional | 90 | 7.2% |
| Total | 1,247 | 100.0% |
School Enrollment by Age by Funding Source in Dallas
Out of a total of 1,247 students who are enrolled in schools in Dallas, 185 (14.8%) attend a private institution, while the remaining 1,062 (85.2%) are enrolled in public schools. The age group of 25 to 34 year olds has the highest likelihood of being enrolled in private schools, with 67 (84.8% in the age bracket) enrolled. Conversely, the age group of 3 to 4 year olds has the lowest likelihood of being enrolled in a private school, with 45 (100.0% in the age bracket) attending a public institution.
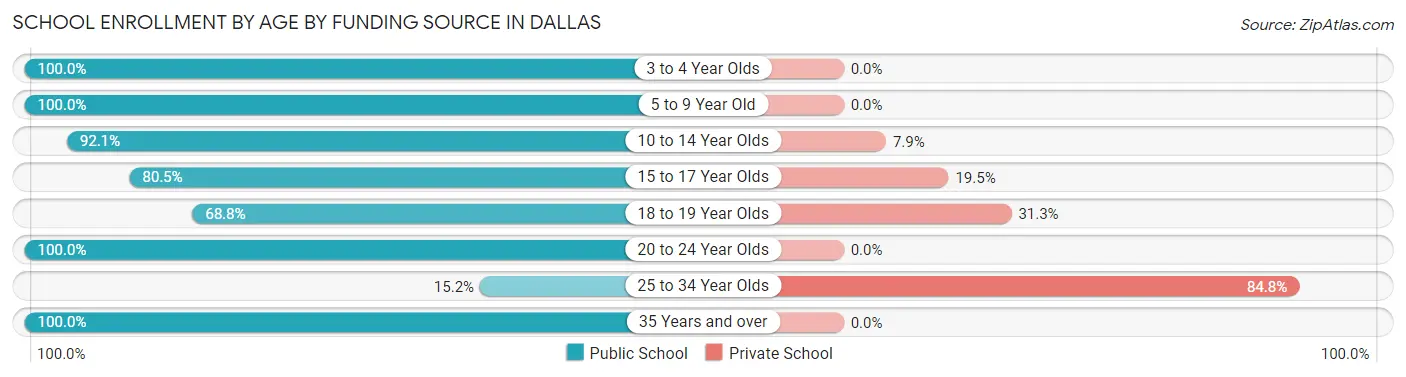
| Age Bracket | Public School | Private School |
| 3 to 4 Year Olds | 45 (100.0%) | 0 (0.0%) |
| 5 to 9 Year Old | 314 (100.0%) | 0 (0.0%) |
| 10 to 14 Year Olds | 187 (92.1%) | 16 (7.9%) |
| 15 to 17 Year Olds | 334 (80.5%) | 81 (19.5%) |
| 18 to 19 Year Olds | 44 (68.8%) | 20 (31.2%) |
| 20 to 24 Year Olds | 28 (100.0%) | 0 (0.0%) |
| 25 to 34 Year Olds | 12 (15.2%) | 67 (84.8%) |
| 35 Years and over | 99 (100.0%) | 0 (0.0%) |
| Total | 1,062 (85.2%) | 185 (14.8%) |
Educational Attainment by Field of Study in Dallas
Business (259 | 36.3%), bio, nature & agricultural (87 | 12.2%), education (83 | 11.6%), arts & humanities (75 | 10.5%), and science & technology (53 | 7.4%) are the most common fields of study among 713 individuals in Dallas who have obtained a bachelor's degree or higher.
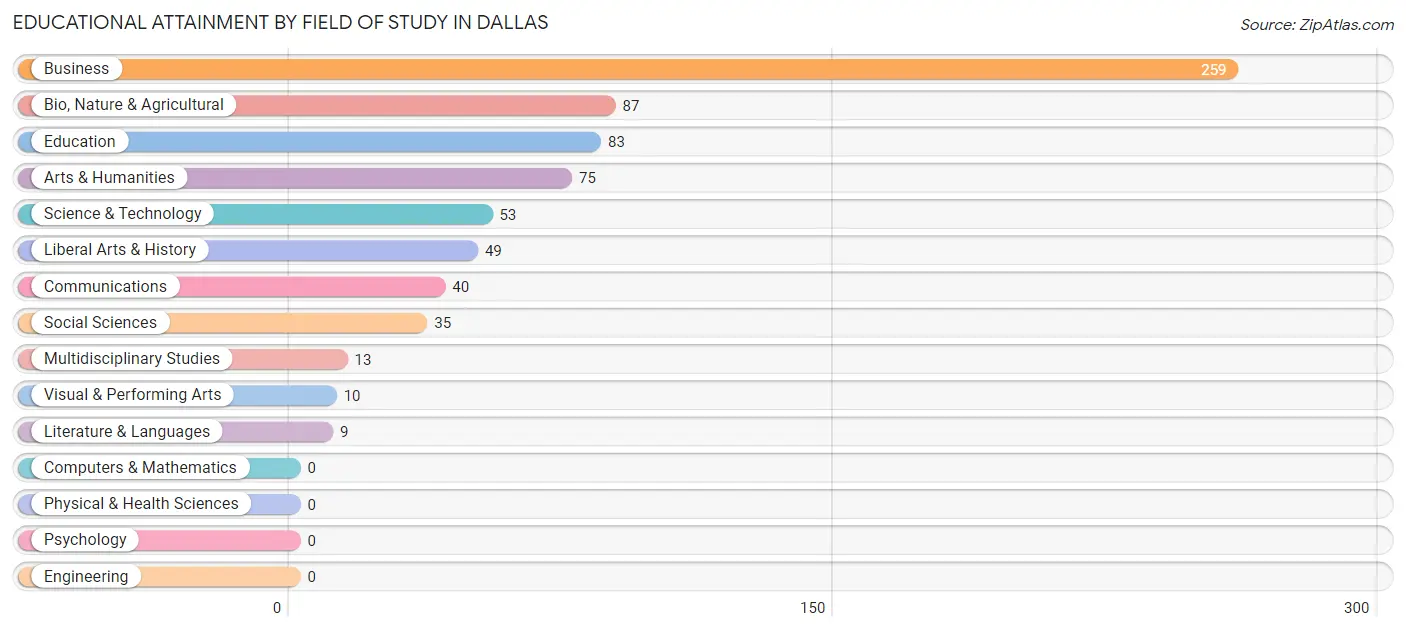
| Field of Study | # Graduates | % Graduates |
| Computers & Mathematics | 0 | 0.0% |
| Bio, Nature & Agricultural | 87 | 12.2% |
| Physical & Health Sciences | 0 | 0.0% |
| Psychology | 0 | 0.0% |
| Social Sciences | 35 | 4.9% |
| Engineering | 0 | 0.0% |
| Multidisciplinary Studies | 13 | 1.8% |
| Science & Technology | 53 | 7.4% |
| Business | 259 | 36.3% |
| Education | 83 | 11.6% |
| Literature & Languages | 9 | 1.3% |
| Liberal Arts & History | 49 | 6.9% |
| Visual & Performing Arts | 10 | 1.4% |
| Communications | 40 | 5.6% |
| Arts & Humanities | 75 | 10.5% |
| Total | 713 | 100.0% |
Transportation & Commute in Dallas
Vehicle Availability by Sex in Dallas
The most prevalent vehicle ownership categories in Dallas are males with 2 vehicles (732, accounting for 51.0%) and females with 2 vehicles (856, making up 44.7%).
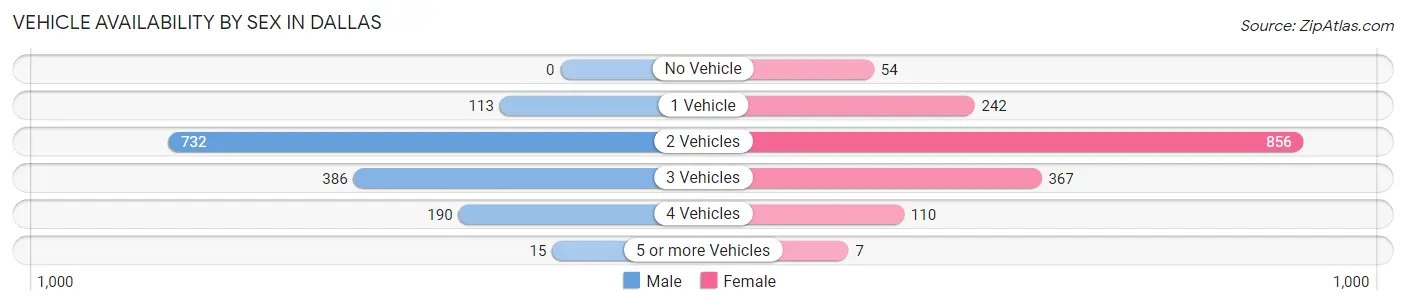
| Vehicles Available | Male | Female |
| No Vehicle | 0 (0.0%) | 54 (3.3%) |
| 1 Vehicle | 113 (7.9%) | 242 (14.8%) |
| 2 Vehicles | 732 (51.0%) | 856 (52.3%) |
| 3 Vehicles | 386 (26.9%) | 367 (22.4%) |
| 4 Vehicles | 190 (13.2%) | 110 (6.7%) |
| 5 or more Vehicles | 15 (1.0%) | 7 (0.4%) |
| Total | 1,436 (100.0%) | 1,636 (100.0%) |
Commute Time in Dallas
The most frequently occuring commute durations in Dallas are 10 to 14 minutes (588 commuters, 19.5%), 30 to 34 minutes (571 commuters, 19.0%), and 15 to 19 minutes (439 commuters, 14.6%).
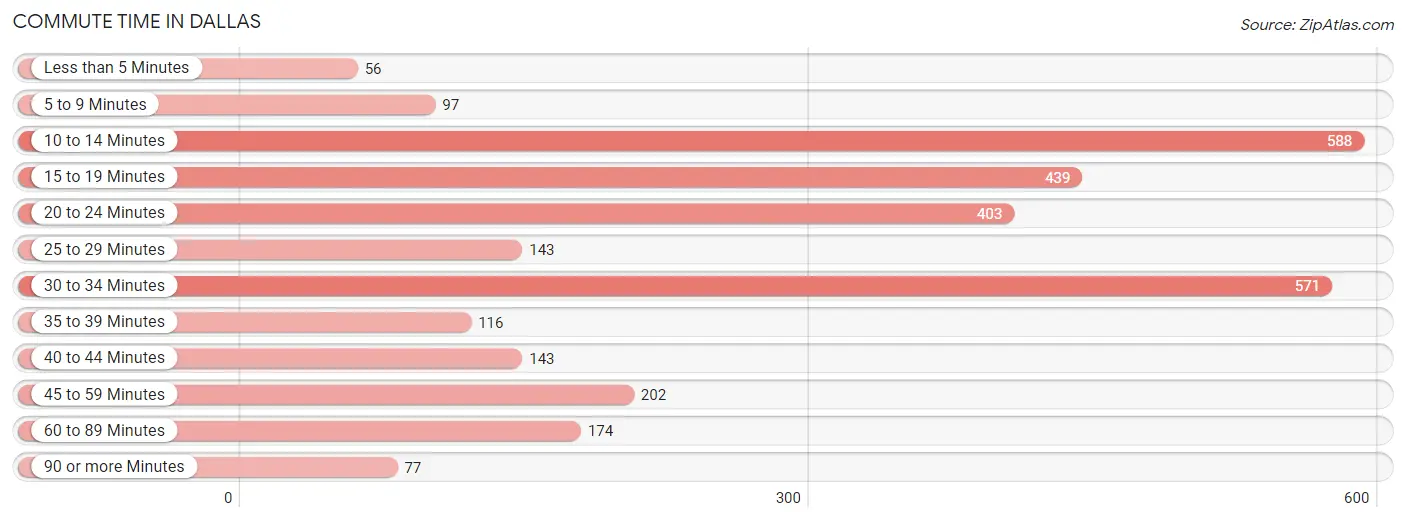
| Commute Time | # Commuters | % Commuters |
| Less than 5 Minutes | 56 | 1.9% |
| 5 to 9 Minutes | 97 | 3.2% |
| 10 to 14 Minutes | 588 | 19.5% |
| 15 to 19 Minutes | 439 | 14.6% |
| 20 to 24 Minutes | 403 | 13.4% |
| 25 to 29 Minutes | 143 | 4.8% |
| 30 to 34 Minutes | 571 | 19.0% |
| 35 to 39 Minutes | 116 | 3.9% |
| 40 to 44 Minutes | 143 | 4.8% |
| 45 to 59 Minutes | 202 | 6.7% |
| 60 to 89 Minutes | 174 | 5.8% |
| 90 or more Minutes | 77 | 2.6% |
Commute Time by Sex in Dallas
The most common commute times in Dallas are 15 to 19 minutes (216 commuters, 15.3%) for males and 30 to 34 minutes (396 commuters, 24.8%) for females.
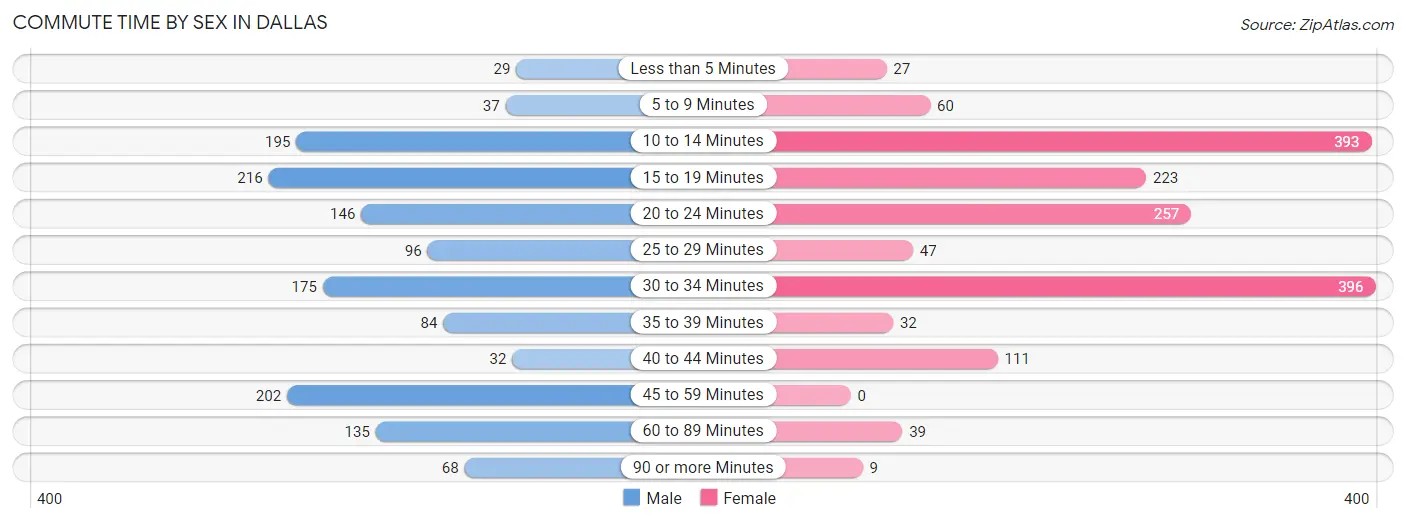
| Commute Time | Male | Female |
| Less than 5 Minutes | 29 (2.1%) | 27 (1.7%) |
| 5 to 9 Minutes | 37 (2.6%) | 60 (3.8%) |
| 10 to 14 Minutes | 195 (13.8%) | 393 (24.6%) |
| 15 to 19 Minutes | 216 (15.3%) | 223 (14.0%) |
| 20 to 24 Minutes | 146 (10.3%) | 257 (16.1%) |
| 25 to 29 Minutes | 96 (6.8%) | 47 (2.9%) |
| 30 to 34 Minutes | 175 (12.4%) | 396 (24.8%) |
| 35 to 39 Minutes | 84 (5.9%) | 32 (2.0%) |
| 40 to 44 Minutes | 32 (2.3%) | 111 (7.0%) |
| 45 to 59 Minutes | 202 (14.3%) | 0 (0.0%) |
| 60 to 89 Minutes | 135 (9.5%) | 39 (2.5%) |
| 90 or more Minutes | 68 (4.8%) | 9 (0.6%) |
Time of Departure to Work by Sex in Dallas
The most frequent times of departure to work in Dallas are 6:30 AM to 6:59 AM (281, 19.9%) for males and 7:00 AM to 7:29 AM (338, 21.2%) for females.
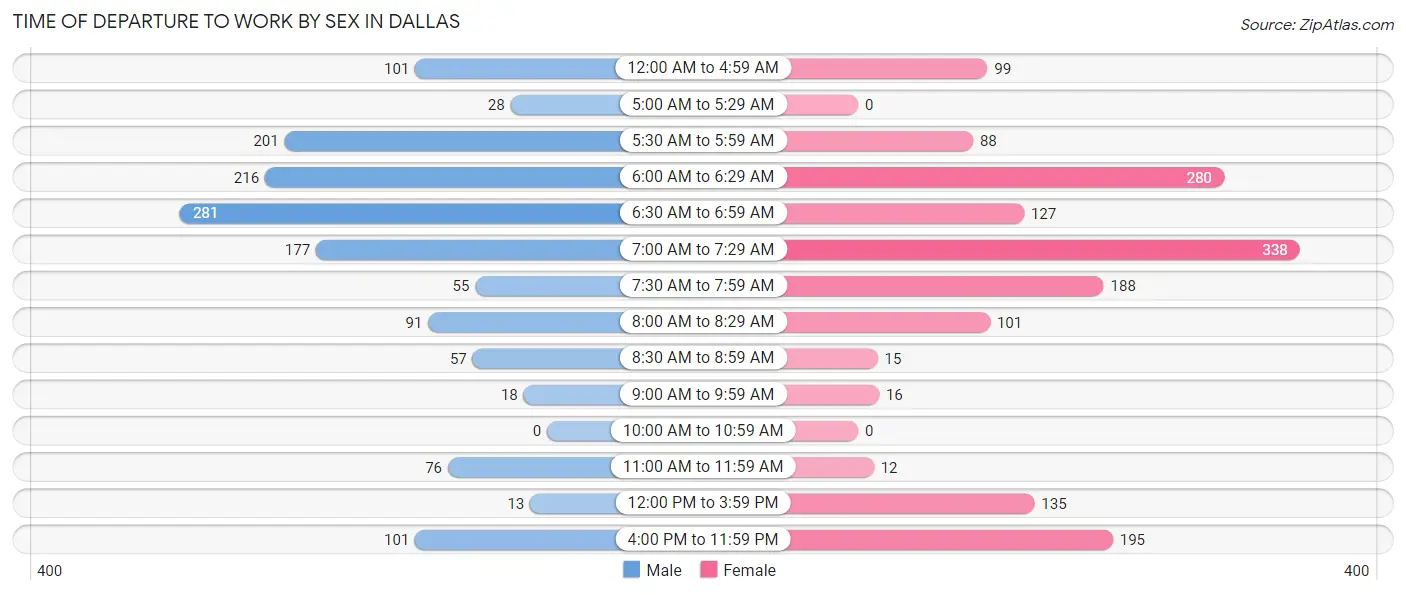
| Time of Departure | Male | Female |
| 12:00 AM to 4:59 AM | 101 (7.1%) | 99 (6.2%) |
| 5:00 AM to 5:29 AM | 28 (2.0%) | 0 (0.0%) |
| 5:30 AM to 5:59 AM | 201 (14.2%) | 88 (5.5%) |
| 6:00 AM to 6:29 AM | 216 (15.3%) | 280 (17.6%) |
| 6:30 AM to 6:59 AM | 281 (19.9%) | 127 (8.0%) |
| 7:00 AM to 7:29 AM | 177 (12.5%) | 338 (21.2%) |
| 7:30 AM to 7:59 AM | 55 (3.9%) | 188 (11.8%) |
| 8:00 AM to 8:29 AM | 91 (6.4%) | 101 (6.3%) |
| 8:30 AM to 8:59 AM | 57 (4.0%) | 15 (0.9%) |
| 9:00 AM to 9:59 AM | 18 (1.3%) | 16 (1.0%) |
| 10:00 AM to 10:59 AM | 0 (0.0%) | 0 (0.0%) |
| 11:00 AM to 11:59 AM | 76 (5.4%) | 12 (0.7%) |
| 12:00 PM to 3:59 PM | 13 (0.9%) | 135 (8.5%) |
| 4:00 PM to 11:59 PM | 101 (7.1%) | 195 (12.2%) |
| Total | 1,415 (100.0%) | 1,594 (100.0%) |
Housing Occupancy in Dallas
Occupancy by Ownership in Dallas
Of the total 2,161 dwellings in Dallas, owner-occupied units account for 1,137 (52.6%), while renter-occupied units make up 1,024 (47.4%).
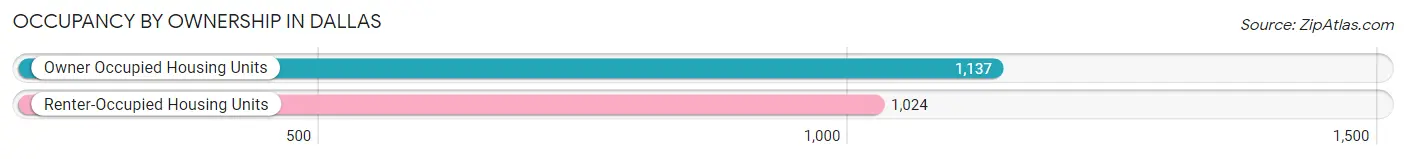
| Occupancy | # Housing Units | % Housing Units |
| Owner Occupied Housing Units | 1,137 | 52.6% |
| Renter-Occupied Housing Units | 1,024 | 47.4% |
| Total Occupied Housing Units | 2,161 | 100.0% |
Occupancy by Household Size in Dallas
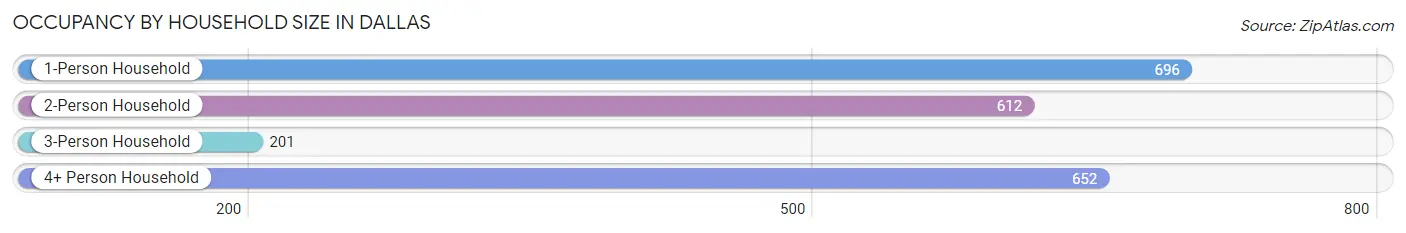
| Household Size | # Housing Units | % Housing Units |
| 1-Person Household | 696 | 32.2% |
| 2-Person Household | 612 | 28.3% |
| 3-Person Household | 201 | 9.3% |
| 4+ Person Household | 652 | 30.2% |
| Total Housing Units | 2,161 | 100.0% |
Occupancy by Ownership by Household Size in Dallas
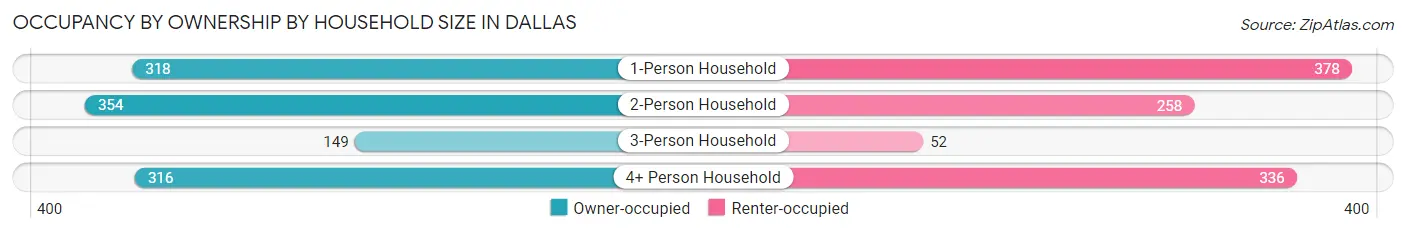
| Household Size | Owner-occupied | Renter-occupied |
| 1-Person Household | 318 (45.7%) | 378 (54.3%) |
| 2-Person Household | 354 (57.8%) | 258 (42.2%) |
| 3-Person Household | 149 (74.1%) | 52 (25.9%) |
| 4+ Person Household | 316 (48.5%) | 336 (51.5%) |
| Total Housing Units | 1,137 (52.6%) | 1,024 (47.4%) |
Occupancy by Educational Attainment in Dallas
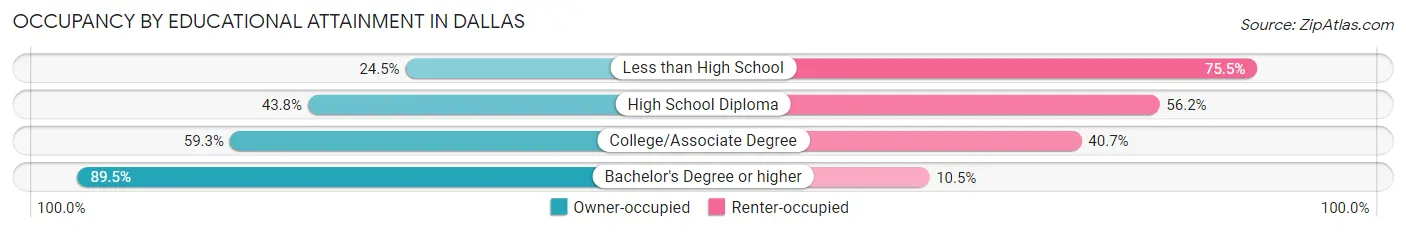
| Household Size | Owner-occupied | Renter-occupied |
| Less than High School | 72 (24.5%) | 222 (75.5%) |
| High School Diploma | 356 (43.8%) | 456 (56.2%) |
| College/Associate Degree | 462 (59.3%) | 317 (40.7%) |
| Bachelor's Degree or higher | 247 (89.5%) | 29 (10.5%) |
Occupancy by Age of Householder in Dallas
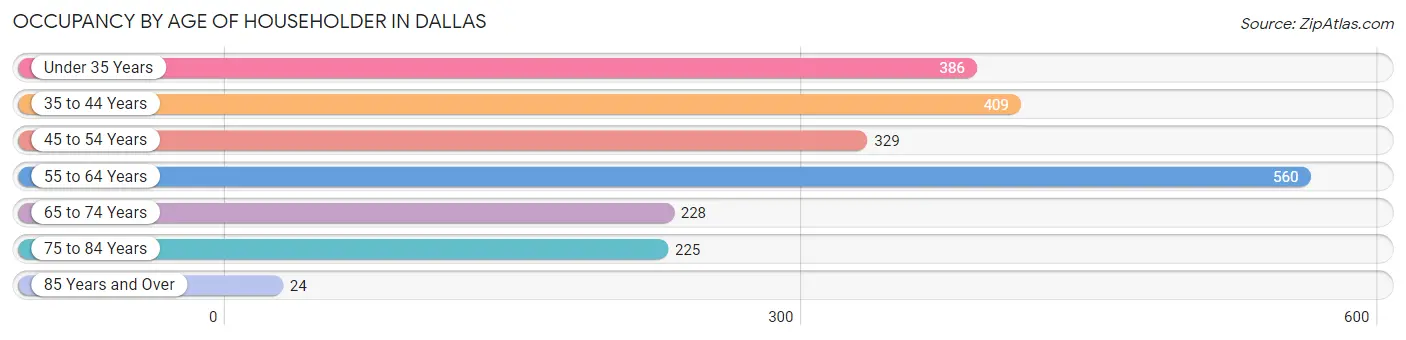
| Age Bracket | # Households | % Households |
| Under 35 Years | 386 | 17.9% |
| 35 to 44 Years | 409 | 18.9% |
| 45 to 54 Years | 329 | 15.2% |
| 55 to 64 Years | 560 | 25.9% |
| 65 to 74 Years | 228 | 10.5% |
| 75 to 84 Years | 225 | 10.4% |
| 85 Years and Over | 24 | 1.1% |
| Total | 2,161 | 100.0% |
Housing Finances in Dallas
Median Income by Occupancy in Dallas
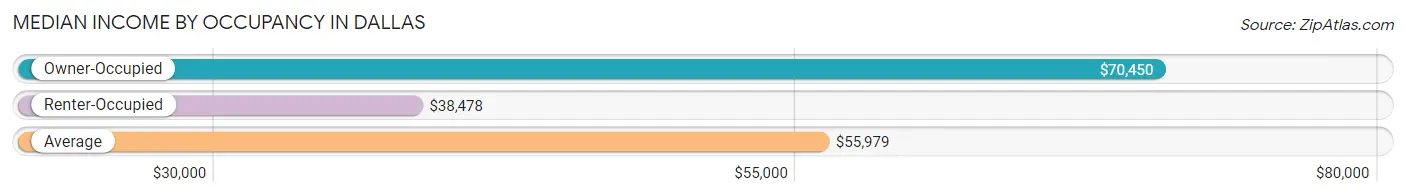
| Occupancy Type | # Households | Median Income |
| Owner-Occupied | 1,137 (52.6%) | $70,450 |
| Renter-Occupied | 1,024 (47.4%) | $38,478 |
| Average | 2,161 (100.0%) | $55,979 |
Occupancy by Householder Income Bracket in Dallas
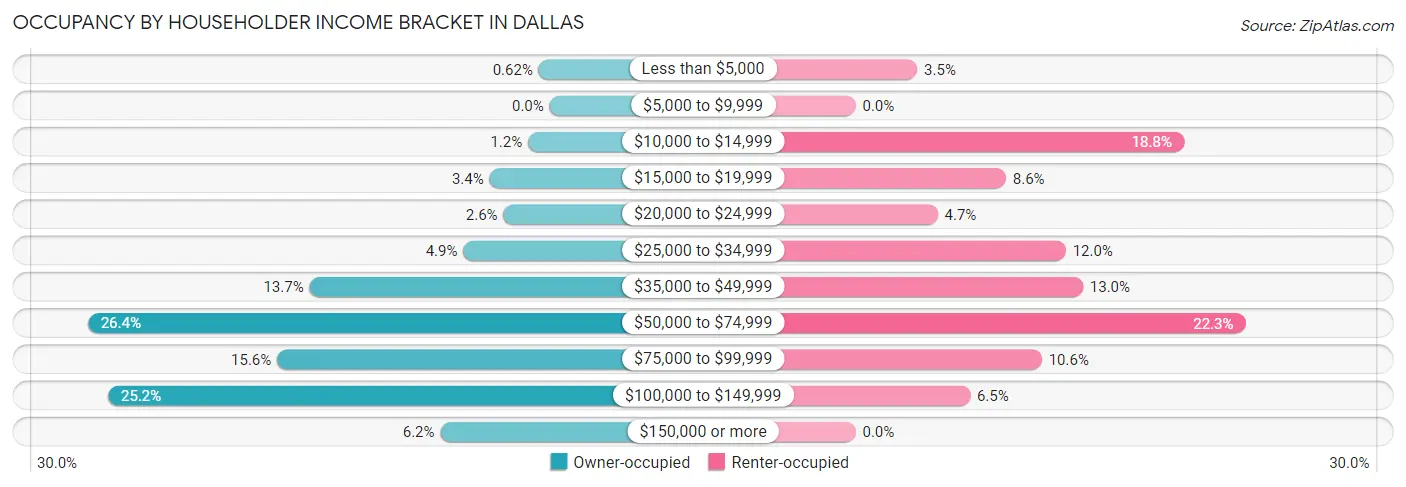
| Income Bracket | Owner-occupied | Renter-occupied |
| Less than $5,000 | 7 (0.6%) | 36 (3.5%) |
| $5,000 to $9,999 | 0 (0.0%) | 0 (0.0%) |
| $10,000 to $14,999 | 14 (1.2%) | 192 (18.8%) |
| $15,000 to $19,999 | 39 (3.4%) | 88 (8.6%) |
| $20,000 to $24,999 | 30 (2.6%) | 48 (4.7%) |
| $25,000 to $34,999 | 56 (4.9%) | 123 (12.0%) |
| $35,000 to $49,999 | 156 (13.7%) | 133 (13.0%) |
| $50,000 to $74,999 | 300 (26.4%) | 228 (22.3%) |
| $75,000 to $99,999 | 177 (15.6%) | 109 (10.6%) |
| $100,000 to $149,999 | 287 (25.2%) | 67 (6.5%) |
| $150,000 or more | 71 (6.2%) | 0 (0.0%) |
| Total | 1,137 (100.0%) | 1,024 (100.0%) |
Monthly Housing Cost Tiers in Dallas
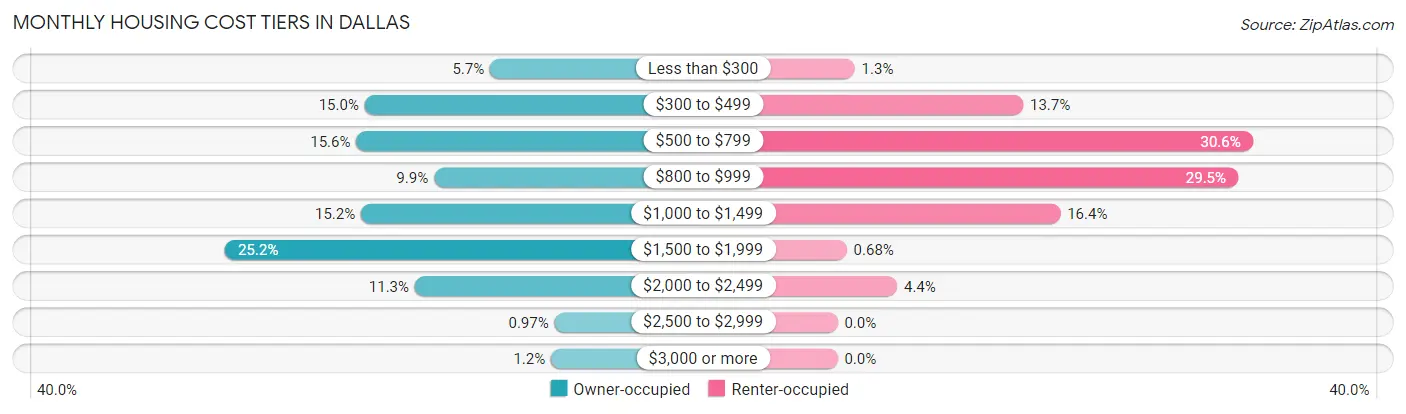
| Monthly Cost | Owner-occupied | Renter-occupied |
| Less than $300 | 65 (5.7%) | 13 (1.3%) |
| $300 to $499 | 170 (14.9%) | 140 (13.7%) |
| $500 to $799 | 177 (15.6%) | 313 (30.6%) |
| $800 to $999 | 112 (9.9%) | 302 (29.5%) |
| $1,000 to $1,499 | 173 (15.2%) | 168 (16.4%) |
| $1,500 to $1,999 | 287 (25.2%) | 7 (0.7%) |
| $2,000 to $2,499 | 128 (11.3%) | 45 (4.4%) |
| $2,500 to $2,999 | 11 (1.0%) | 0 (0.0%) |
| $3,000 or more | 14 (1.2%) | 0 (0.0%) |
| Total | 1,137 (100.0%) | 1,024 (100.0%) |
Physical Housing Characteristics in Dallas
Housing Structures in Dallas
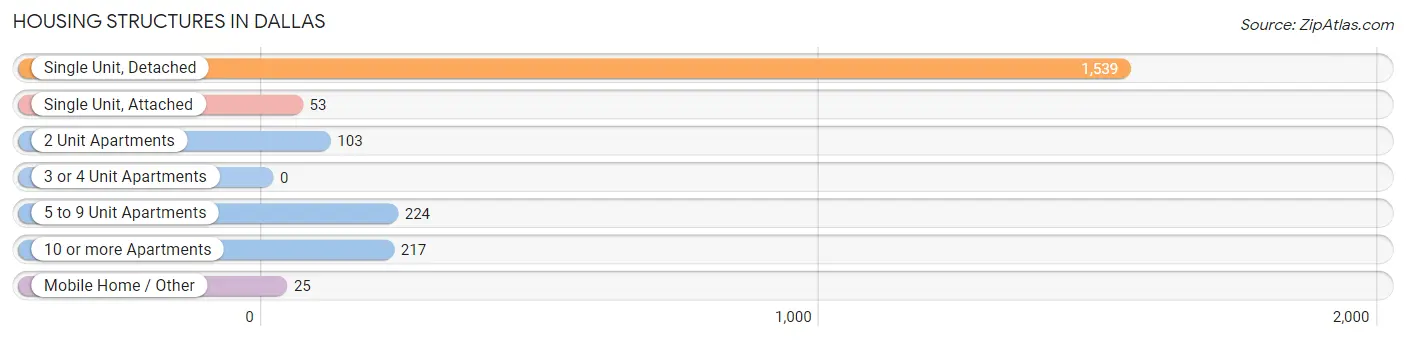
| Structure Type | # Housing Units | % Housing Units |
| Single Unit, Detached | 1,539 | 71.2% |
| Single Unit, Attached | 53 | 2.5% |
| 2 Unit Apartments | 103 | 4.8% |
| 3 or 4 Unit Apartments | 0 | 0.0% |
| 5 to 9 Unit Apartments | 224 | 10.4% |
| 10 or more Apartments | 217 | 10.0% |
| Mobile Home / Other | 25 | 1.2% |
| Total | 2,161 | 100.0% |
Housing Structures by Occupancy in Dallas
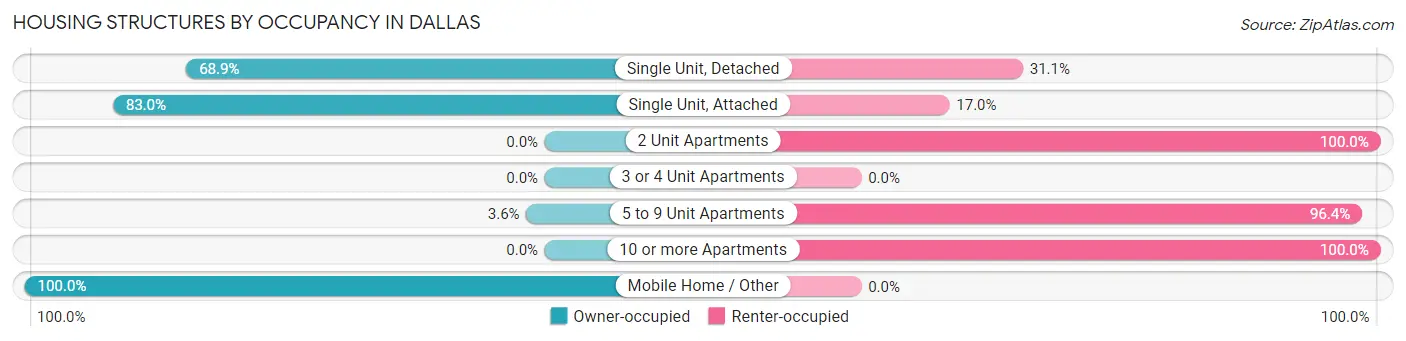
| Structure Type | Owner-occupied | Renter-occupied |
| Single Unit, Detached | 1,060 (68.9%) | 479 (31.1%) |
| Single Unit, Attached | 44 (83.0%) | 9 (17.0%) |
| 2 Unit Apartments | 0 (0.0%) | 103 (100.0%) |
| 3 or 4 Unit Apartments | 0 (0.0%) | 0 (0.0%) |
| 5 to 9 Unit Apartments | 8 (3.6%) | 216 (96.4%) |
| 10 or more Apartments | 0 (0.0%) | 217 (100.0%) |
| Mobile Home / Other | 25 (100.0%) | 0 (0.0%) |
| Total | 1,137 (52.6%) | 1,024 (47.4%) |
Housing Structures by Number of Rooms in Dallas
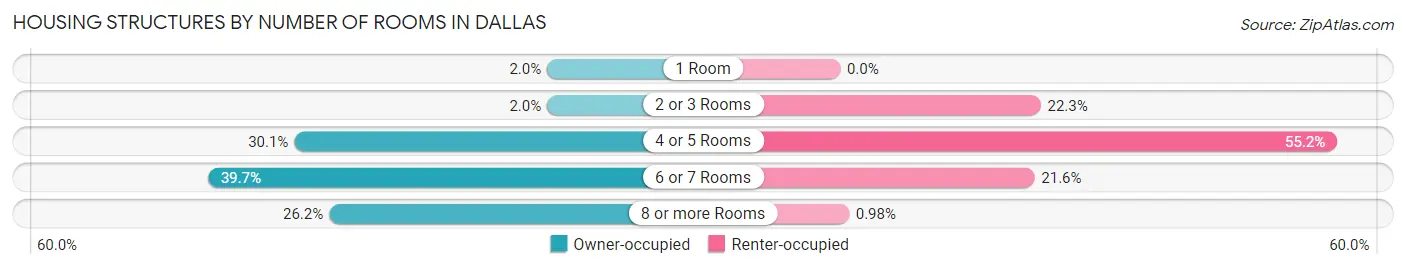
| Number of Rooms | Owner-occupied | Renter-occupied |
| 1 Room | 23 (2.0%) | 0 (0.0%) |
| 2 or 3 Rooms | 23 (2.0%) | 228 (22.3%) |
| 4 or 5 Rooms | 342 (30.1%) | 565 (55.2%) |
| 6 or 7 Rooms | 451 (39.7%) | 221 (21.6%) |
| 8 or more Rooms | 298 (26.2%) | 10 (1.0%) |
| Total | 1,137 (100.0%) | 1,024 (100.0%) |
Housing Structure by Heating Type in Dallas
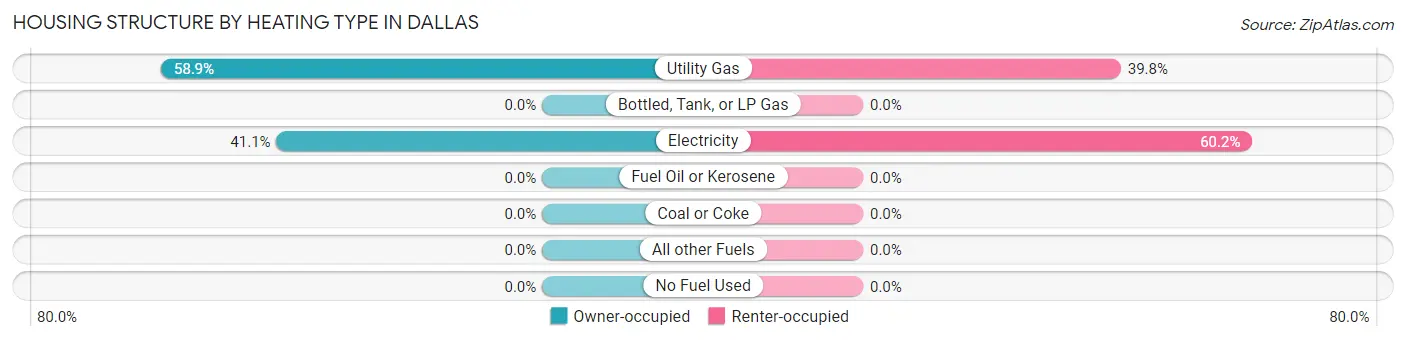
| Heating Type | Owner-occupied | Renter-occupied |
| Utility Gas | 670 (58.9%) | 408 (39.8%) |
| Bottled, Tank, or LP Gas | 0 (0.0%) | 0 (0.0%) |
| Electricity | 467 (41.1%) | 616 (60.2%) |
| Fuel Oil or Kerosene | 0 (0.0%) | 0 (0.0%) |
| Coal or Coke | 0 (0.0%) | 0 (0.0%) |
| All other Fuels | 0 (0.0%) | 0 (0.0%) |
| No Fuel Used | 0 (0.0%) | 0 (0.0%) |
| Total | 1,137 (100.0%) | 1,024 (100.0%) |
Household Vehicle Usage in Dallas
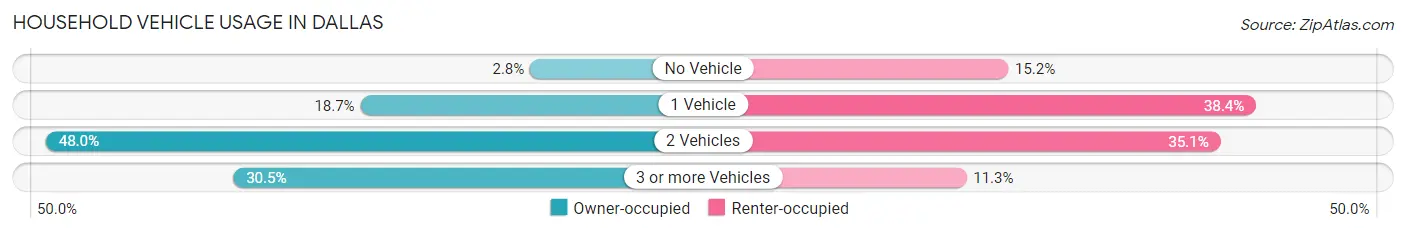
| Vehicles per Household | Owner-occupied | Renter-occupied |
| No Vehicle | 32 (2.8%) | 156 (15.2%) |
| 1 Vehicle | 212 (18.6%) | 393 (38.4%) |
| 2 Vehicles | 546 (48.0%) | 359 (35.1%) |
| 3 or more Vehicles | 347 (30.5%) | 116 (11.3%) |
| Total | 1,137 (100.0%) | 1,024 (100.0%) |
Real Estate & Mortgages in Dallas
Real Estate and Mortgage Overview in Dallas
| Characteristic | Without Mortgage | With Mortgage |
| Housing Units | 340 | 797 |
| Median Property Value | $157,900 | $228,700 |
| Median Household Income | $69,167 | $64 |
| Monthly Housing Costs | $403 | $14 |
| Real Estate Taxes | $1,055 | $22 |
Property Value by Mortgage Status in Dallas
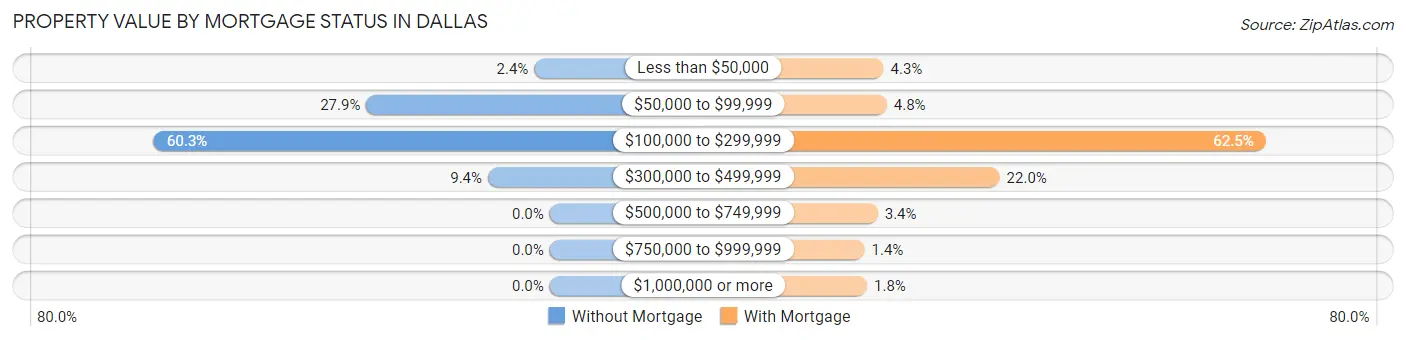
| Property Value | Without Mortgage | With Mortgage |
| Less than $50,000 | 8 (2.4%) | 34 (4.3%) |
| $50,000 to $99,999 | 95 (27.9%) | 38 (4.8%) |
| $100,000 to $299,999 | 205 (60.3%) | 498 (62.5%) |
| $300,000 to $499,999 | 32 (9.4%) | 175 (22.0%) |
| $500,000 to $749,999 | 0 (0.0%) | 27 (3.4%) |
| $750,000 to $999,999 | 0 (0.0%) | 11 (1.4%) |
| $1,000,000 or more | 0 (0.0%) | 14 (1.8%) |
| Total | 340 (100.0%) | 797 (100.0%) |
Household Income by Mortgage Status in Dallas
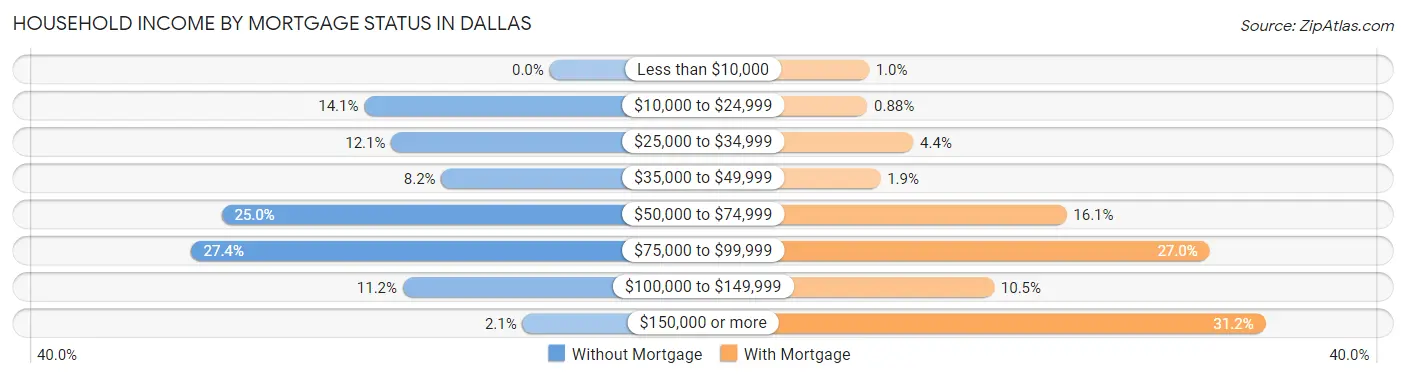
| Household Income | Without Mortgage | With Mortgage |
| Less than $10,000 | 0 (0.0%) | 8 (1.0%) |
| $10,000 to $24,999 | 48 (14.1%) | 7 (0.9%) |
| $25,000 to $34,999 | 41 (12.1%) | 35 (4.4%) |
| $35,000 to $49,999 | 28 (8.2%) | 15 (1.9%) |
| $50,000 to $74,999 | 85 (25.0%) | 128 (16.1%) |
| $75,000 to $99,999 | 93 (27.4%) | 215 (27.0%) |
| $100,000 to $149,999 | 38 (11.2%) | 84 (10.5%) |
| $150,000 or more | 7 (2.1%) | 249 (31.2%) |
| Total | 340 (100.0%) | 797 (100.0%) |
Property Value to Household Income Ratio in Dallas
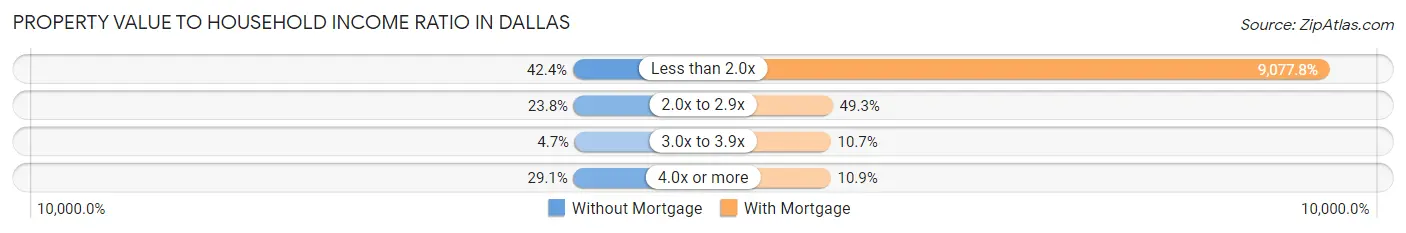
| Value-to-Income Ratio | Without Mortgage | With Mortgage |
| Less than 2.0x | 144 (42.3%) | 72,350 (9,077.8%) |
| 2.0x to 2.9x | 81 (23.8%) | 393 (49.3%) |
| 3.0x to 3.9x | 16 (4.7%) | 85 (10.7%) |
| 4.0x or more | 99 (29.1%) | 87 (10.9%) |
| Total | 340 (100.0%) | 797 (100.0%) |
Real Estate Taxes by Mortgage Status in Dallas
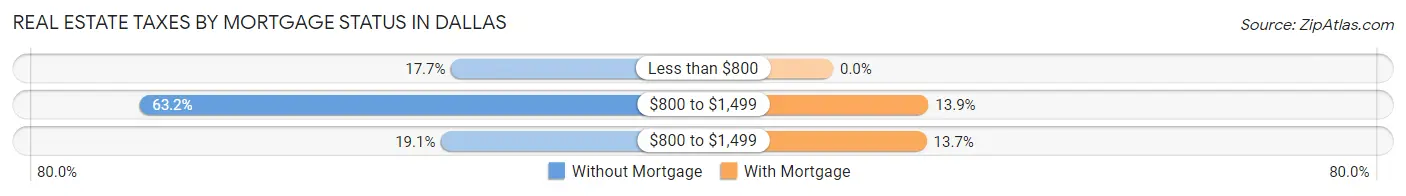
| Property Taxes | Without Mortgage | With Mortgage |
| Less than $800 | 60 (17.6%) | 0 (0.0%) |
| $800 to $1,499 | 215 (63.2%) | 111 (13.9%) |
| $800 to $1,499 | 65 (19.1%) | 109 (13.7%) |
| Total | 340 (100.0%) | 797 (100.0%) |
Health & Disability in Dallas
Health Insurance Coverage by Age in Dallas
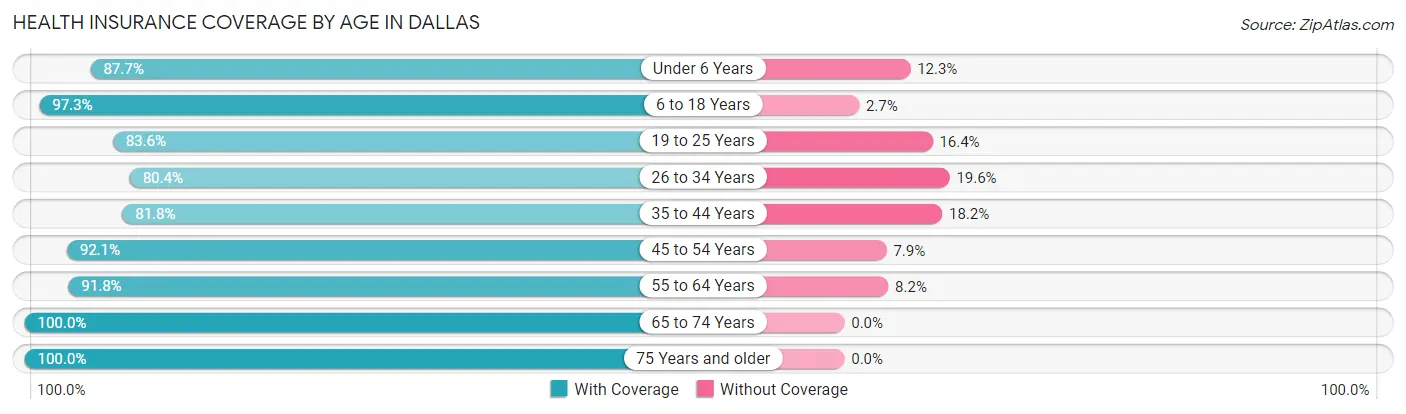
| Age Bracket | With Coverage | Without Coverage |
| Under 6 Years | 357 (87.7%) | 50 (12.3%) |
| 6 to 18 Years | 959 (97.3%) | 27 (2.7%) |
| 19 to 25 Years | 432 (83.6%) | 85 (16.4%) |
| 26 to 34 Years | 455 (80.4%) | 111 (19.6%) |
| 35 to 44 Years | 879 (81.8%) | 196 (18.2%) |
| 45 to 54 Years | 550 (92.1%) | 47 (7.9%) |
| 55 to 64 Years | 876 (91.8%) | 78 (8.2%) |
| 65 to 74 Years | 476 (100.0%) | 0 (0.0%) |
| 75 Years and older | 311 (100.0%) | 0 (0.0%) |
| Total | 5,295 (89.9%) | 594 (10.1%) |
Health Insurance Coverage by Citizenship Status in Dallas
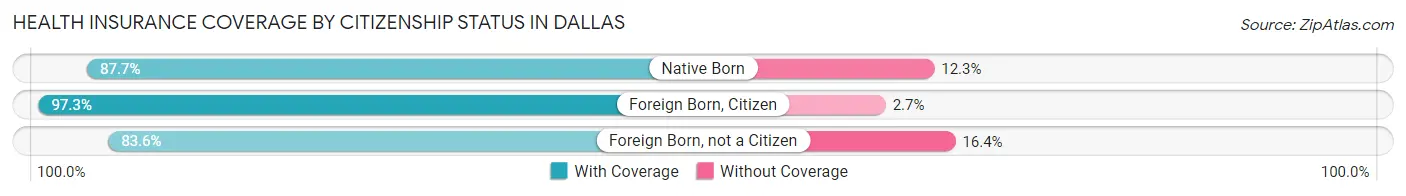
| Citizenship Status | With Coverage | Without Coverage |
| Native Born | 357 (87.7%) | 50 (12.3%) |
| Foreign Born, Citizen | 959 (97.3%) | 27 (2.7%) |
| Foreign Born, not a Citizen | 432 (83.6%) | 85 (16.4%) |
Health Insurance Coverage by Household Income in Dallas
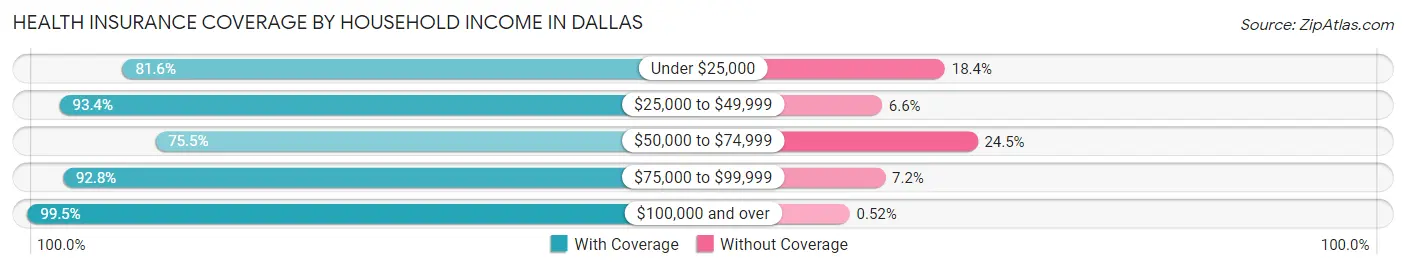
| Household Income | With Coverage | Without Coverage |
| Under $25,000 | 529 (81.6%) | 119 (18.4%) |
| $25,000 to $49,999 | 1,053 (93.4%) | 74 (6.6%) |
| $50,000 to $74,999 | 1,018 (75.5%) | 330 (24.5%) |
| $75,000 to $99,999 | 788 (92.8%) | 61 (7.2%) |
| $100,000 and over | 1,907 (99.5%) | 10 (0.5%) |
Public vs Private Health Insurance Coverage by Age in Dallas
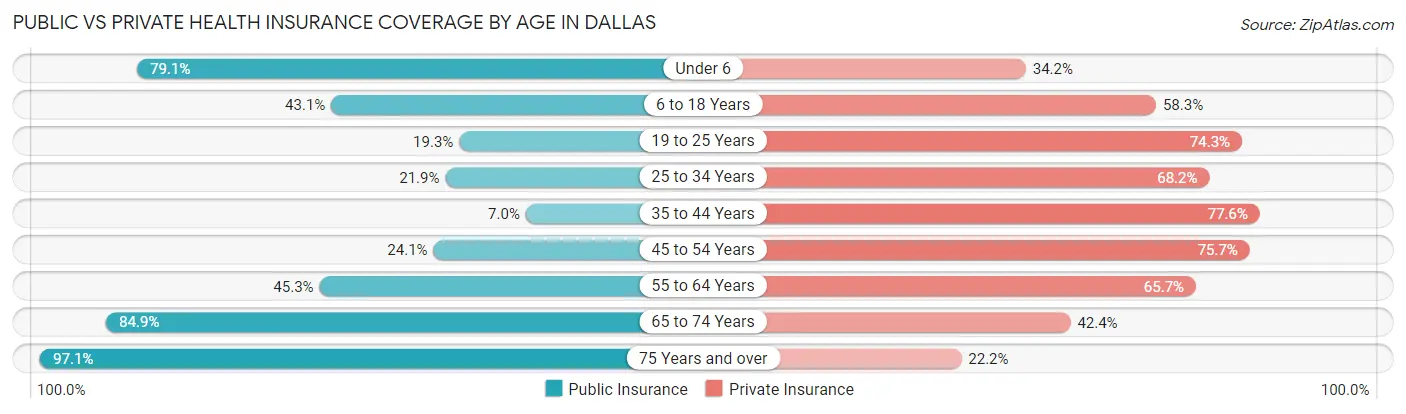
| Age Bracket | Public Insurance | Private Insurance |
| Under 6 | 322 (79.1%) | 139 (34.2%) |
| 6 to 18 Years | 425 (43.1%) | 575 (58.3%) |
| 19 to 25 Years | 100 (19.3%) | 384 (74.3%) |
| 25 to 34 Years | 124 (21.9%) | 386 (68.2%) |
| 35 to 44 Years | 75 (7.0%) | 834 (77.6%) |
| 45 to 54 Years | 144 (24.1%) | 452 (75.7%) |
| 55 to 64 Years | 432 (45.3%) | 627 (65.7%) |
| 65 to 74 Years | 404 (84.9%) | 202 (42.4%) |
| 75 Years and over | 302 (97.1%) | 69 (22.2%) |
| Total | 2,328 (39.5%) | 3,668 (62.3%) |
Disability Status by Sex by Age in Dallas
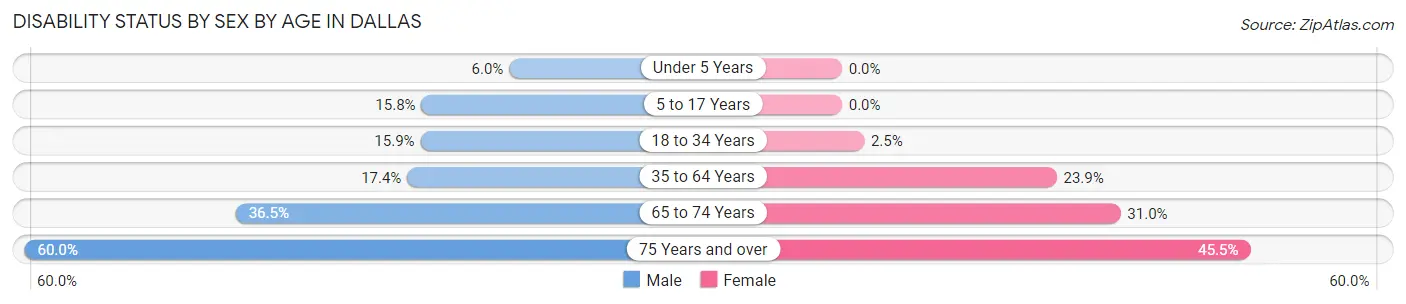
| Age Bracket | Male | Female |
| Under 5 Years | 17 (6.0%) | 0 (0.0%) |
| 5 to 17 Years | 49 (15.8%) | 0 (0.0%) |
| 18 to 34 Years | 93 (15.9%) | 13 (2.5%) |
| 35 to 64 Years | 176 (17.4%) | 386 (23.9%) |
| 65 to 74 Years | 89 (36.5%) | 72 (31.0%) |
| 75 Years and over | 60 (60.0%) | 96 (45.5%) |
Disability Class by Sex by Age in Dallas
Disability Class: Hearing Difficulty
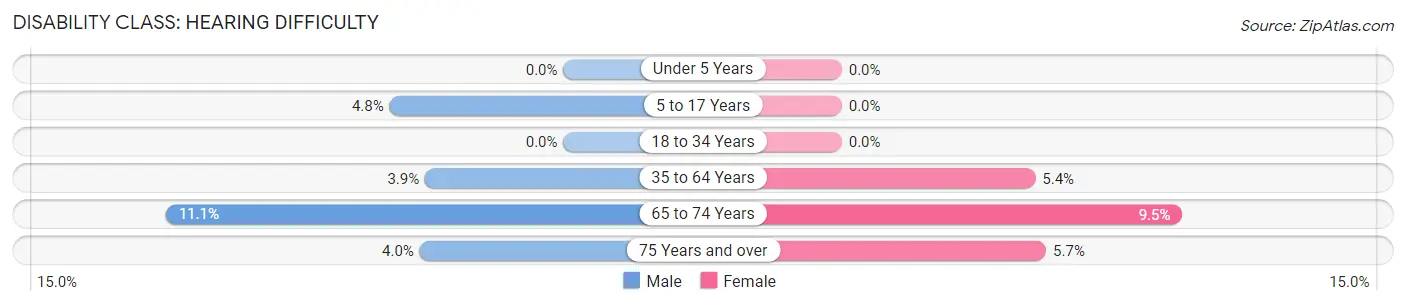
| Age Bracket | Male | Female |
| Under 5 Years | 0 (0.0%) | 0 (0.0%) |
| 5 to 17 Years | 15 (4.8%) | 0 (0.0%) |
| 18 to 34 Years | 0 (0.0%) | 0 (0.0%) |
| 35 to 64 Years | 39 (3.8%) | 87 (5.4%) |
| 65 to 74 Years | 27 (11.1%) | 22 (9.5%) |
| 75 Years and over | 4 (4.0%) | 12 (5.7%) |
Disability Class: Vision Difficulty
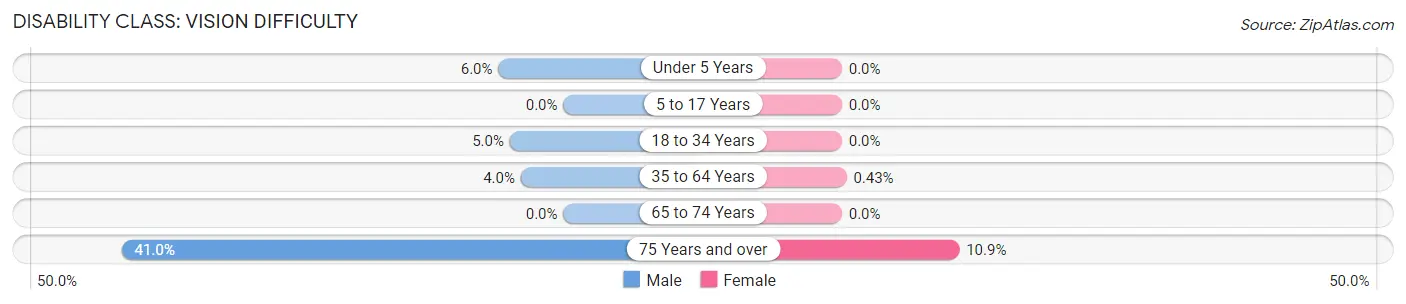
| Age Bracket | Male | Female |
| Under 5 Years | 17 (6.0%) | 0 (0.0%) |
| 5 to 17 Years | 0 (0.0%) | 0 (0.0%) |
| 18 to 34 Years | 29 (5.0%) | 0 (0.0%) |
| 35 to 64 Years | 40 (4.0%) | 7 (0.4%) |
| 65 to 74 Years | 0 (0.0%) | 0 (0.0%) |
| 75 Years and over | 41 (41.0%) | 23 (10.9%) |
Disability Class: Cognitive Difficulty
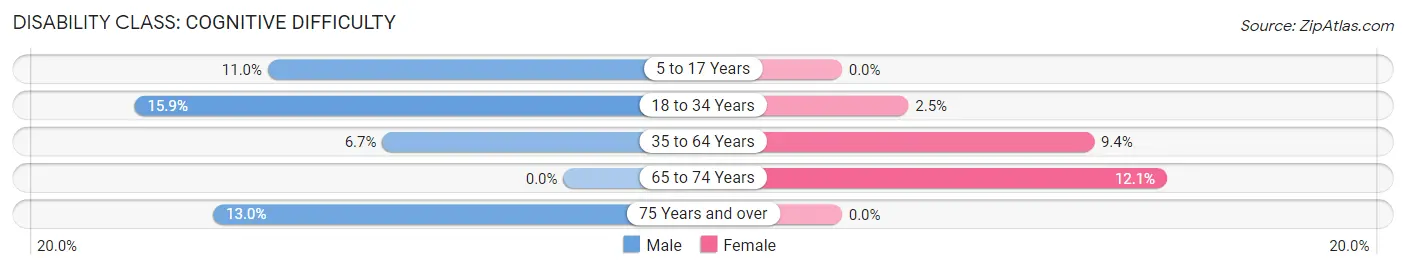
| Age Bracket | Male | Female |
| 5 to 17 Years | 34 (11.0%) | 0 (0.0%) |
| 18 to 34 Years | 93 (15.9%) | 13 (2.5%) |
| 35 to 64 Years | 68 (6.7%) | 151 (9.4%) |
| 65 to 74 Years | 0 (0.0%) | 28 (12.1%) |
| 75 Years and over | 13 (13.0%) | 0 (0.0%) |
Disability Class: Ambulatory Difficulty
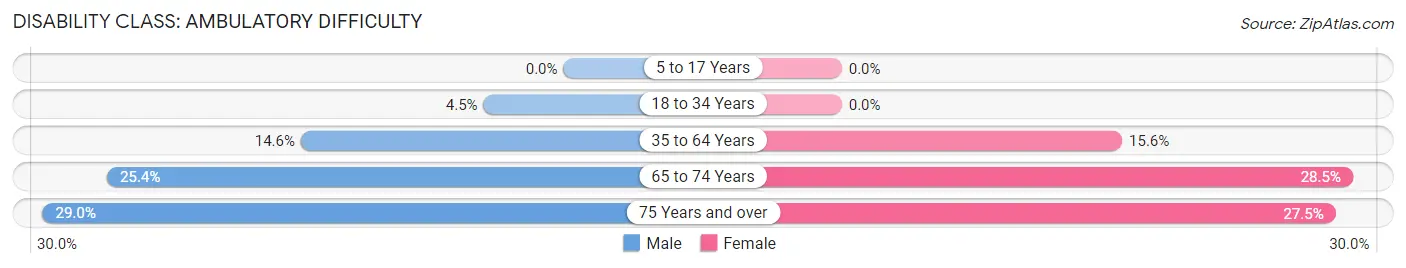
| Age Bracket | Male | Female |
| 5 to 17 Years | 0 (0.0%) | 0 (0.0%) |
| 18 to 34 Years | 26 (4.4%) | 0 (0.0%) |
| 35 to 64 Years | 148 (14.6%) | 252 (15.6%) |
| 65 to 74 Years | 62 (25.4%) | 66 (28.4%) |
| 75 Years and over | 29 (29.0%) | 58 (27.5%) |
Disability Class: Self-Care Difficulty
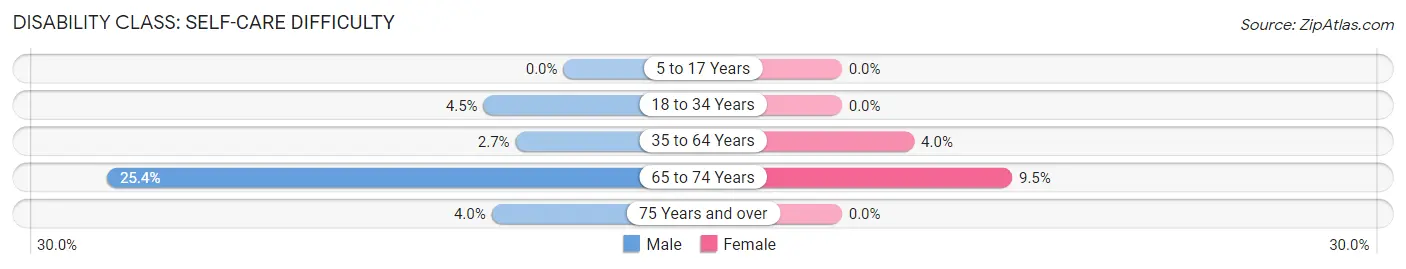
| Age Bracket | Male | Female |
| 5 to 17 Years | 0 (0.0%) | 0 (0.0%) |
| 18 to 34 Years | 26 (4.4%) | 0 (0.0%) |
| 35 to 64 Years | 27 (2.7%) | 65 (4.0%) |
| 65 to 74 Years | 62 (25.4%) | 22 (9.5%) |
| 75 Years and over | 4 (4.0%) | 0 (0.0%) |
Technology Access in Dallas
Computing Device Access in Dallas
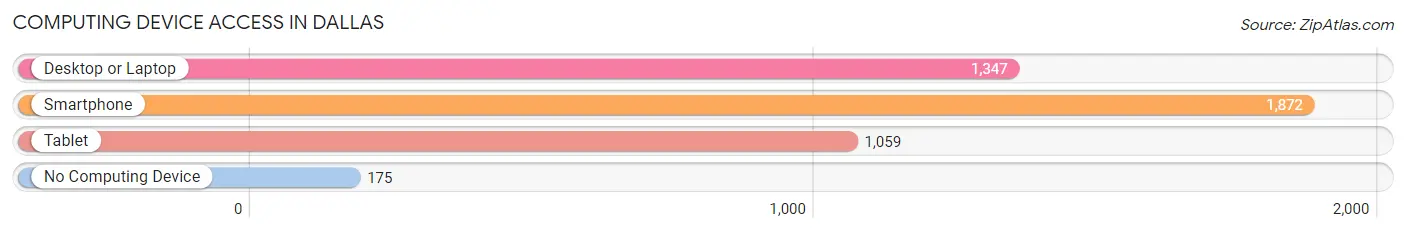
| Device Type | # Households | % Households |
| Desktop or Laptop | 1,347 | 62.3% |
| Smartphone | 1,872 | 86.6% |
| Tablet | 1,059 | 49.0% |
| No Computing Device | 175 | 8.1% |
| Total | 2,161 | 100.0% |
Internet Access in Dallas
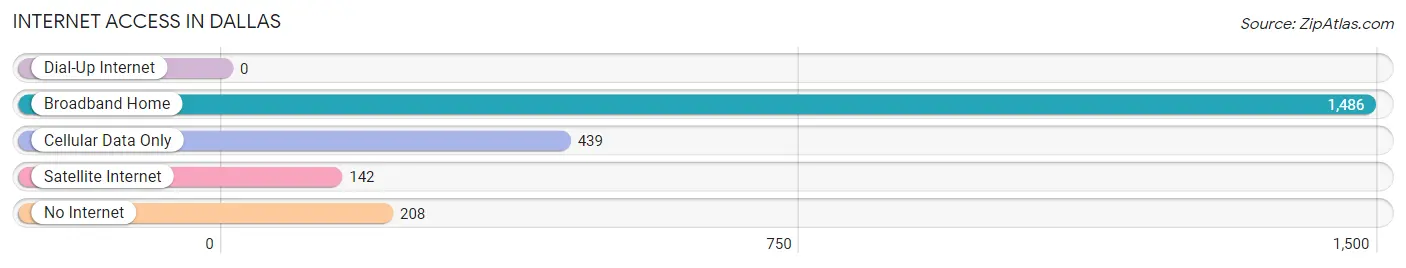
| Internet Type | # Households | % Households |
| Dial-Up Internet | 0 | 0.0% |
| Broadband Home | 1,486 | 68.8% |
| Cellular Data Only | 439 | 20.3% |
| Satellite Internet | 142 | 6.6% |
| No Internet | 208 | 9.6% |
| Total | 2,161 | 100.0% |
Dallas Summary
Dallas, North Carolina is a small town located in Gaston County, North Carolina. It is situated in the foothills of the Blue Ridge Mountains, approximately 25 miles west of Charlotte. The town has a population of approximately 1,500 people and is part of the Gastonia Metropolitan Statistical Area.
Geography
Dallas is located in the foothills of the Blue Ridge Mountains, approximately 25 miles west of Charlotte. The town is situated in the Catawba River Valley, which is part of the Piedmont region of North Carolina. The town is surrounded by rolling hills and forests, and is home to several small lakes and streams. The town is located at an elevation of 830 feet above sea level.
Climate
Dallas has a humid subtropical climate, with hot, humid summers and mild winters. The average annual temperature is around 61 degrees Fahrenheit, with an average high of around 79 degrees in the summer and an average low of around 43 degrees in the winter. The town receives an average of 48 inches of precipitation per year, with most of it falling in the summer months.
Demographics
As of the 2010 census, the population of Dallas was 1,521. The racial makeup of the town was 94.3% White, 2.7% African American, 0.3% Native American, 0.7% Asian, 0.1% Pacific Islander, 0.9% from other races, and 1.1% from two or more races. Hispanic or Latino of any race were 2.3% of the population.
Economy
Dallas is a small town with a largely agricultural economy. The town is home to several small businesses, including a few restaurants, a grocery store, and a few retail stores. The town is also home to several small manufacturing companies, including a furniture manufacturer and a textile mill.
The town is also home to several small farms, which produce a variety of crops, including corn, soybeans, and tobacco. The town is also home to several vineyards, which produce a variety of wines.
Education
Dallas is served by the Gaston County Schools system. The town is home to one elementary school, one middle school, and one high school. The town is also home to a branch of Gaston College, which offers a variety of associate degree programs.
Conclusion
Dallas, North Carolina is a small town located in the foothills of the Blue Ridge Mountains, approximately 25 miles west of Charlotte. The town has a population of approximately 1,500 people and is part of the Gastonia Metropolitan Statistical Area. The town has a humid subtropical climate, with hot, humid summers and mild winters. The town has a largely agricultural economy, with several small businesses, farms, and vineyards. The town is served by the Gaston County Schools system, and is home to a branch of Gaston College.
Common Questions
What is Per Capita Income in Dallas?
Per Capita income in Dallas is $28,083.
What is the Median Family Income in Dallas?
Median Family Income in Dallas is $70,417.
What is the Median Household income in Dallas?
Median Household Income in Dallas is $55,979.
What is Income or Wage Gap in Dallas?
Income or Wage Gap in Dallas is 26.0%.
Women in Dallas earn 74.0 cents for every dollar earned by a man.
What is Inequality or Gini Index in Dallas?
Inequality or Gini Index in Dallas is 0.40.
What is the Total Population of Dallas?
Total Population of Dallas is 5,889.
What is the Total Male Population of Dallas?
Total Male Population of Dallas is 2,532.
What is the Total Female Population of Dallas?
Total Female Population of Dallas is 3,357.
What is the Ratio of Males per 100 Females in Dallas?
There are 75.42 Males per 100 Females in Dallas.
What is the Ratio of Females per 100 Males in Dallas?
There are 132.58 Females per 100 Males in Dallas.
What is the Median Population Age in Dallas?
Median Population Age in Dallas is 38.9 Years.
What is the Average Family Size in Dallas
Average Family Size in Dallas is 3.5 People.
What is the Average Household Size in Dallas
Average Household Size in Dallas is 2.7 People.
How Large is the Labor Force in Dallas?
There are 3,203 People in the Labor Forcein in Dallas.
What is the Percentage of People in the Labor Force in Dallas?
65.9% of People are in the Labor Force in Dallas.
What is the Unemployment Rate in Dallas?
Unemployment Rate in Dallas is 4.1%.