Cherokee, NC Map & Demographics
Cherokee Map
Cherokee Overview
$22,828
PER CAPITA INCOME
$48,906
AVG FAMILY INCOME
$43,655
AVG HOUSEHOLD INCOME
28.4%
WAGE / INCOME GAP [ % ]
71.6¢/ $1
WAGE / INCOME GAP [ $ ]
0.39
INEQUALITY / GINI INDEX
1,604
TOTAL POPULATION
812
MALE POPULATION
792
FEMALE POPULATION
102.53
MALES / 100 FEMALES
97.54
FEMALES / 100 MALES
45.8
MEDIAN AGE
2.7
AVG FAMILY SIZE
2.1
AVG HOUSEHOLD SIZE
628
LABOR FORCE [ PEOPLE ]
47.1%
PERCENT IN LABOR FORCE
1.6%
UNEMPLOYMENT RATE
Cherokee Zip Codes
Cherokee Area Codes
Income in Cherokee
Income Overview in Cherokee
Per Capita Income in Cherokee is $22,828, while median incomes of families and households are $48,906 and $43,655 respectively.
| Characteristic | Number | Measure |
| Per Capita Income | 1,604 | $22,828 |
| Median Family Income | 440 | $48,906 |
| Mean Family Income | 440 | $51,120 |
| Median Household Income | 749 | $43,655 |
| Mean Household Income | 749 | $44,573 |
| Income Deficit | 440 | $0 |
| Wage / Income Gap (%) | 1,604 | 28.36% |
| Wage / Income Gap ($) | 1,604 | 71.64¢ per $1 |
| Gini / Inequality Index | 1,604 | 0.39 |
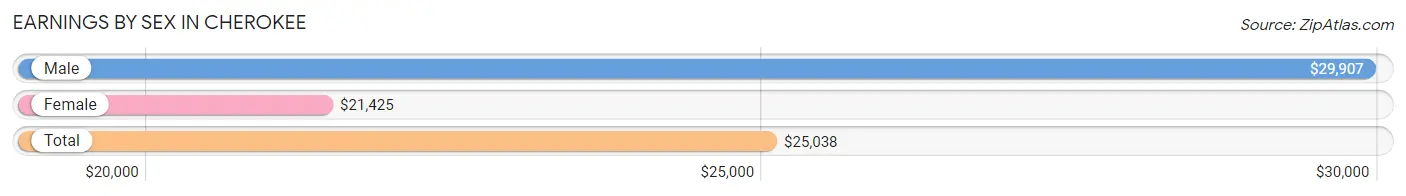
Earnings by Sex in Cherokee
Average Earnings in Cherokee are $25,038, $29,907 for men and $21,425 for women, a difference of 28.4%.
| Sex | Number | Average Earnings |
| Male | 438 (59.6%) | $29,907 |
| Female | 297 (40.4%) | $21,425 |
| Total | 735 (100.0%) | $25,038 |
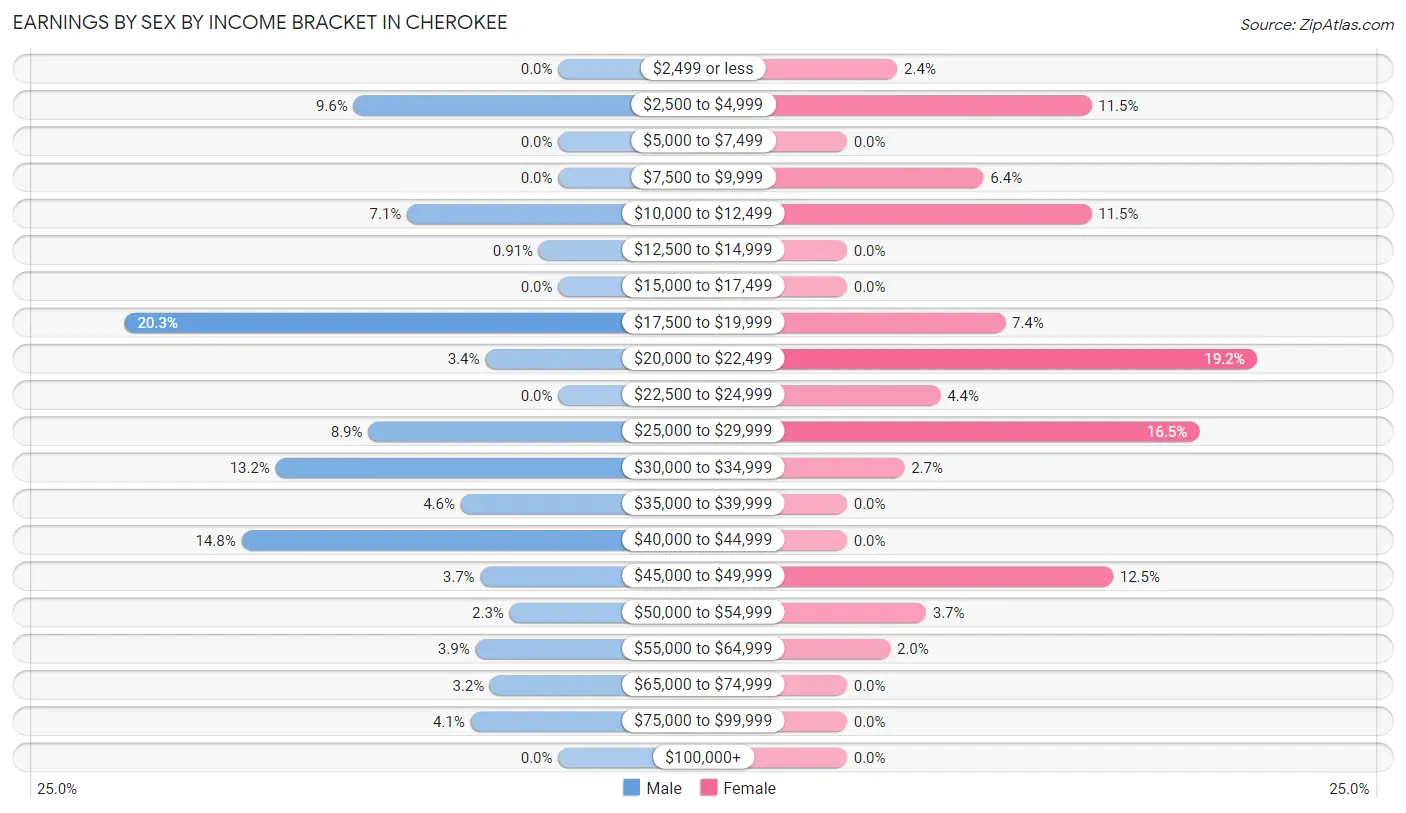
Earnings by Sex by Income Bracket in Cherokee
The most common earnings brackets in Cherokee are $17,500 to $19,999 for men (89 | 20.3%) and $20,000 to $22,499 for women (57 | 19.2%).
| Income | Male | Female |
| $2,499 or less | 0 (0.0%) | 7 (2.4%) |
| $2,500 to $4,999 | 42 (9.6%) | 34 (11.5%) |
| $5,000 to $7,499 | 0 (0.0%) | 0 (0.0%) |
| $7,500 to $9,999 | 0 (0.0%) | 19 (6.4%) |
| $10,000 to $12,499 | 31 (7.1%) | 34 (11.5%) |
| $12,500 to $14,999 | 4 (0.9%) | 0 (0.0%) |
| $15,000 to $17,499 | 0 (0.0%) | 0 (0.0%) |
| $17,500 to $19,999 | 89 (20.3%) | 22 (7.4%) |
| $20,000 to $22,499 | 15 (3.4%) | 57 (19.2%) |
| $22,500 to $24,999 | 0 (0.0%) | 13 (4.4%) |
| $25,000 to $29,999 | 39 (8.9%) | 49 (16.5%) |
| $30,000 to $34,999 | 58 (13.2%) | 8 (2.7%) |
| $35,000 to $39,999 | 20 (4.6%) | 0 (0.0%) |
| $40,000 to $44,999 | 65 (14.8%) | 0 (0.0%) |
| $45,000 to $49,999 | 16 (3.6%) | 37 (12.5%) |
| $50,000 to $54,999 | 10 (2.3%) | 11 (3.7%) |
| $55,000 to $64,999 | 17 (3.9%) | 6 (2.0%) |
| $65,000 to $74,999 | 14 (3.2%) | 0 (0.0%) |
| $75,000 to $99,999 | 18 (4.1%) | 0 (0.0%) |
| $100,000+ | 0 (0.0%) | 0 (0.0%) |
| Total | 438 (100.0%) | 297 (100.0%) |
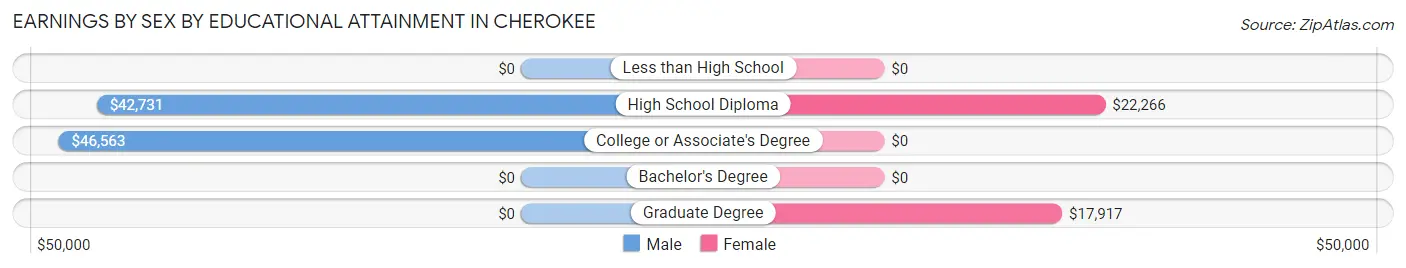
Earnings by Sex by Educational Attainment in Cherokee
Average earnings in Cherokee are $34,461 for men and $21,719 for women, a difference of 37.0%. Men with an educational attainment of college or associate's degree enjoy the highest average annual earnings of $46,563, while those with high school diploma education earn the least with $42,731. Women with an educational attainment of high school diploma earn the most with the average annual earnings of $22,266, while those with graduate degree education have the smallest earnings of $17,917.
| Educational Attainment | Male Income | Female Income |
| Less than High School | - | - |
| High School Diploma | $42,731 | $22,266 |
| College or Associate's Degree | $46,563 | $0 |
| Bachelor's Degree | - | - |
| Graduate Degree | - | - |
| Total | $34,461 | $21,719 |
Family Income in Cherokee
Family Income Brackets in Cherokee
According to the Cherokee family income data, there are 135 families falling into the $50,000 to $74,999 income range, which is the most common income bracket and makes up 30.7% of all families.
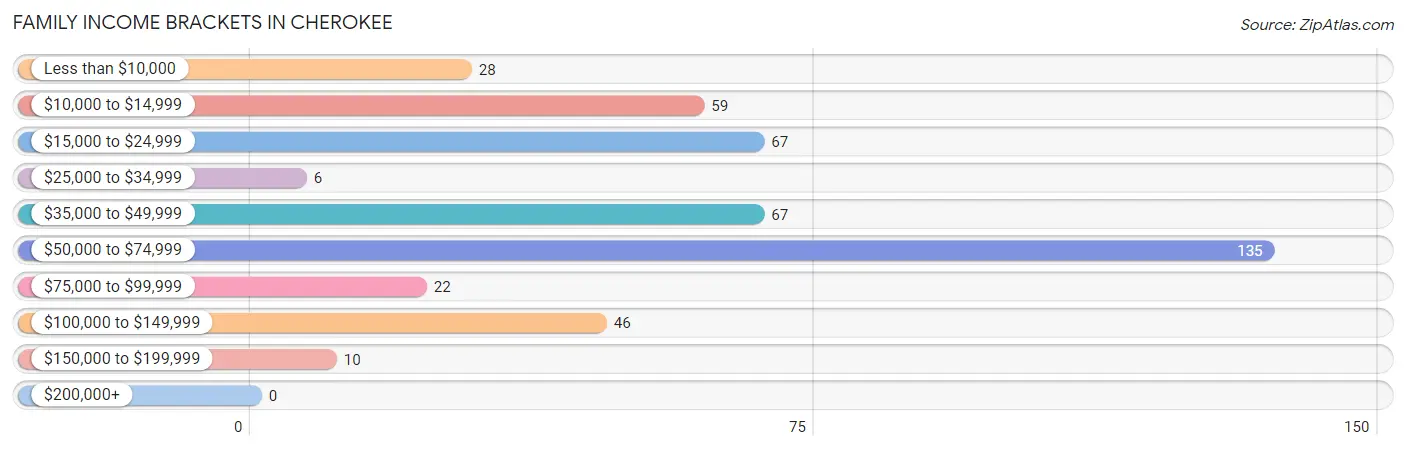
| Income Bracket | # Families | % Families |
| Less than $10,000 | 28 | 6.4% |
| $10,000 to $14,999 | 59 | 13.4% |
| $15,000 to $24,999 | 67 | 15.2% |
| $25,000 to $34,999 | 6 | 1.4% |
| $35,000 to $49,999 | 67 | 15.2% |
| $50,000 to $74,999 | 135 | 30.7% |
| $75,000 to $99,999 | 22 | 5.0% |
| $100,000 to $149,999 | 46 | 10.5% |
| $150,000 to $199,999 | 10 | 2.3% |
| $200,000+ | 0 | 0.0% |
Family Income by Famaliy Size in Cherokee
5-person families (57 | 13.0%) account for the highest median family income in Cherokee with $63,920 per family, while 2-person families (227 | 51.6%) have the highest median income of $30,432 per family member.
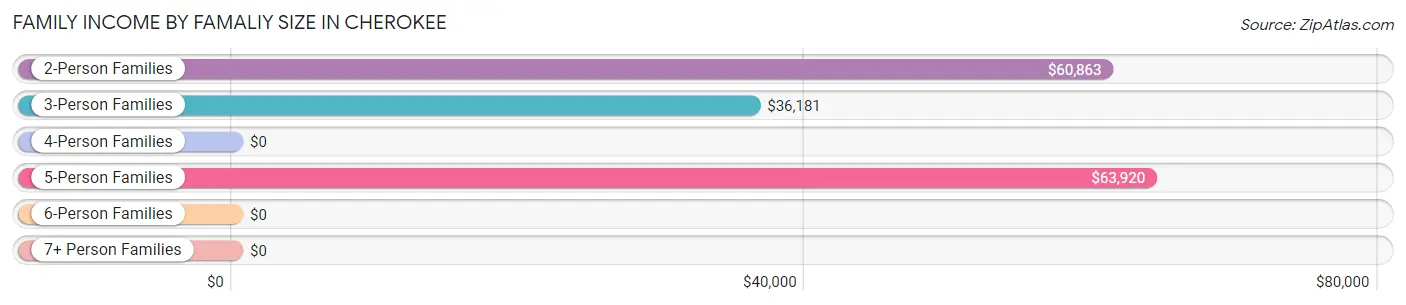
| Income Bracket | # Families | Median Income |
| 2-Person Families | 227 (51.6%) | $60,863 |
| 3-Person Families | 129 (29.3%) | $36,181 |
| 4-Person Families | 27 (6.1%) | $0 |
| 5-Person Families | 57 (13.0%) | $63,920 |
| 6-Person Families | 0 (0.0%) | $0 |
| 7+ Person Families | 0 (0.0%) | $0 |
| Total | 440 (100.0%) | $48,906 |
Family Income by Number of Earners in Cherokee
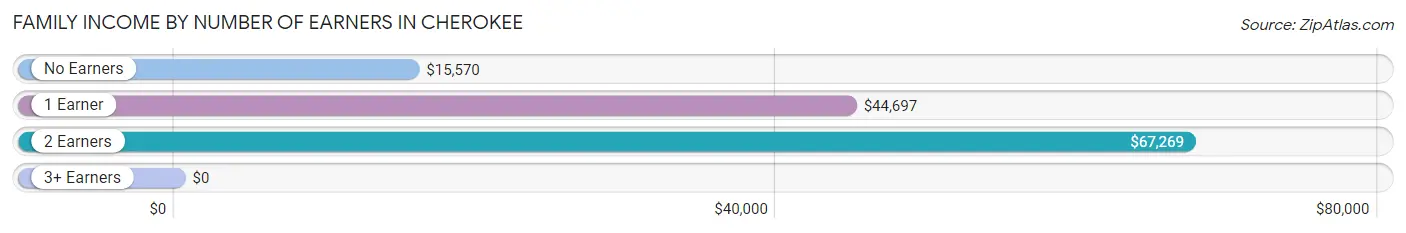
| Number of Earners | # Families | Median Income |
| No Earners | 174 (39.6%) | $15,570 |
| 1 Earner | 152 (34.5%) | $44,697 |
| 2 Earners | 81 (18.4%) | $67,269 |
| 3+ Earners | 33 (7.5%) | $0 |
| Total | 440 (100.0%) | $48,906 |
Household Income in Cherokee
Household Income Brackets in Cherokee
With 190 households falling in the category, the $50,000 to $74,999 income range is the most frequent in Cherokee, accounting for 25.4% of all households.
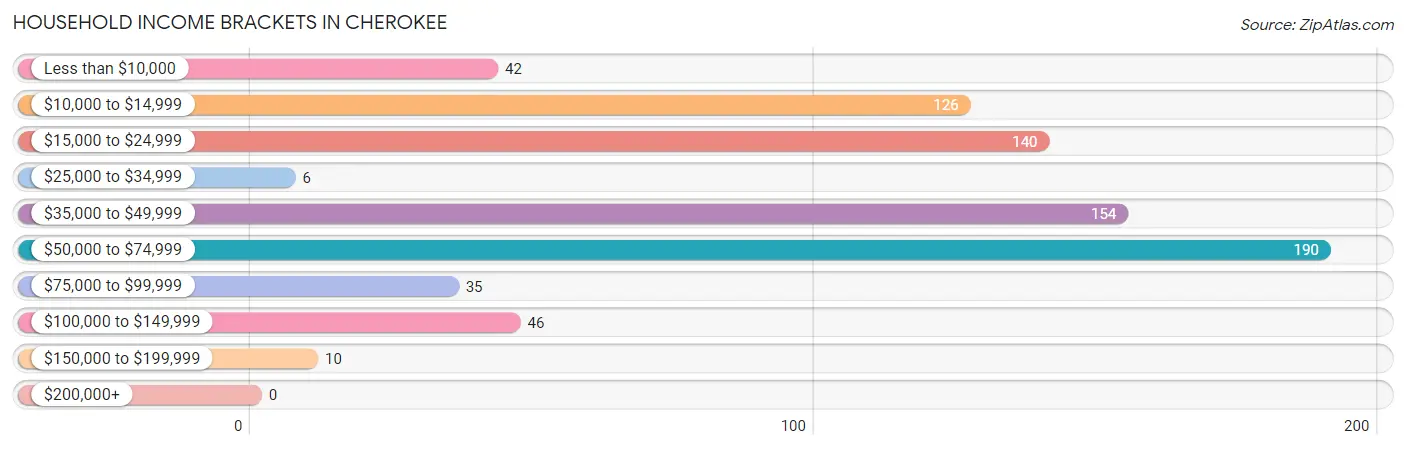
| Income Bracket | # Households | % Households |
| Less than $10,000 | 42 | 5.6% |
| $10,000 to $14,999 | 126 | 16.8% |
| $15,000 to $24,999 | 140 | 18.7% |
| $25,000 to $34,999 | 6 | 0.8% |
| $35,000 to $49,999 | 154 | 20.6% |
| $50,000 to $74,999 | 190 | 25.4% |
| $75,000 to $99,999 | 35 | 4.7% |
| $100,000 to $149,999 | 46 | 6.1% |
| $150,000 to $199,999 | 10 | 1.3% |
| $200,000+ | 0 | 0.0% |
Household Income by Householder Age in Cherokee
The median household income in Cherokee is $43,655, with the highest median household income of $57,206 found in the 25 to 44 years age bracket for the primary householder. A total of 144 households (19.2%) fall into this category. Meanwhile, the 15 to 24 years age bracket for the primary householder has the lowest median household income of $0, with 36 households (4.8%) in this group.
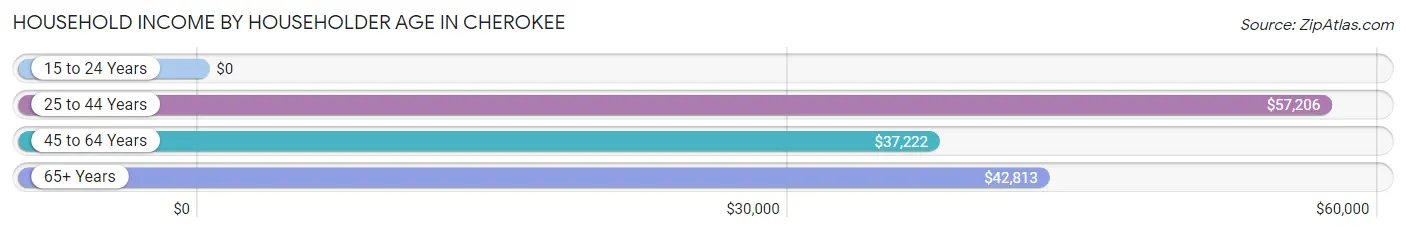
| Income Bracket | # Households | Median Income |
| 15 to 24 Years | 36 (4.8%) | $0 |
| 25 to 44 Years | 144 (19.2%) | $57,206 |
| 45 to 64 Years | 238 (31.8%) | $37,222 |
| 65+ Years | 331 (44.2%) | $42,813 |
| Total | 749 (100.0%) | $43,655 |
Poverty in Cherokee
Income Below Poverty by Sex and Age in Cherokee
With 22.2% poverty level for males and 33.6% for females among the residents of Cherokee, 12 to 14 year old males and under 5 year old females are the most vulnerable to poverty, with 14 males (100.0%) and 33 females (70.2%) in their respective age groups living below the poverty level.
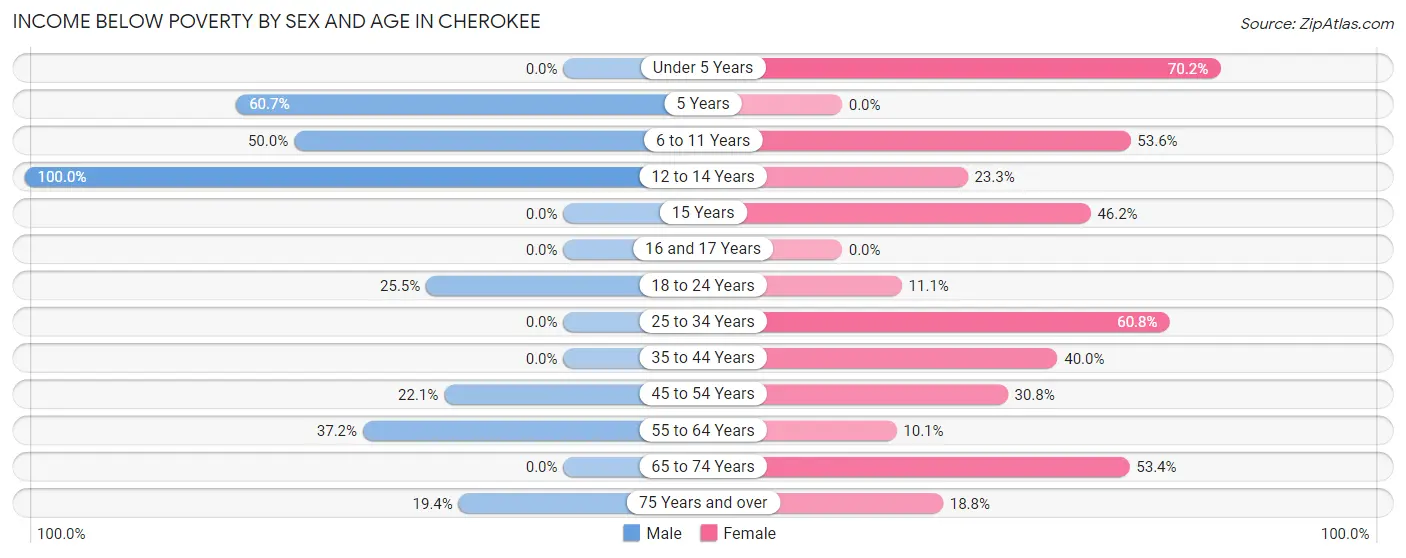
| Age Bracket | Male | Female |
| Under 5 Years | 0 (0.0%) | 33 (70.2%) |
| 5 Years | 17 (60.7%) | 0 (0.0%) |
| 6 to 11 Years | 29 (50.0%) | 15 (53.6%) |
| 12 to 14 Years | 14 (100.0%) | 7 (23.3%) |
| 15 Years | 0 (0.0%) | 6 (46.2%) |
| 16 and 17 Years | 0 (0.0%) | 0 (0.0%) |
| 18 to 24 Years | 27 (25.5%) | 16 (11.1%) |
| 25 to 34 Years | 0 (0.0%) | 31 (60.8%) |
| 35 to 44 Years | 0 (0.0%) | 24 (40.0%) |
| 45 to 54 Years | 27 (22.1%) | 32 (30.8%) |
| 55 to 64 Years | 48 (37.2%) | 8 (10.1%) |
| 65 to 74 Years | 0 (0.0%) | 71 (53.4%) |
| 75 Years and over | 14 (19.4%) | 15 (18.8%) |
| Total | 176 (22.2%) | 258 (33.6%) |
Income Above Poverty by Sex and Age in Cherokee
According to the poverty statistics in Cherokee, males aged under 5 years and females aged 55 to 64 years are the age groups that are most secure financially, with 100.0% of males and 89.9% of females in these age groups living above the poverty line.
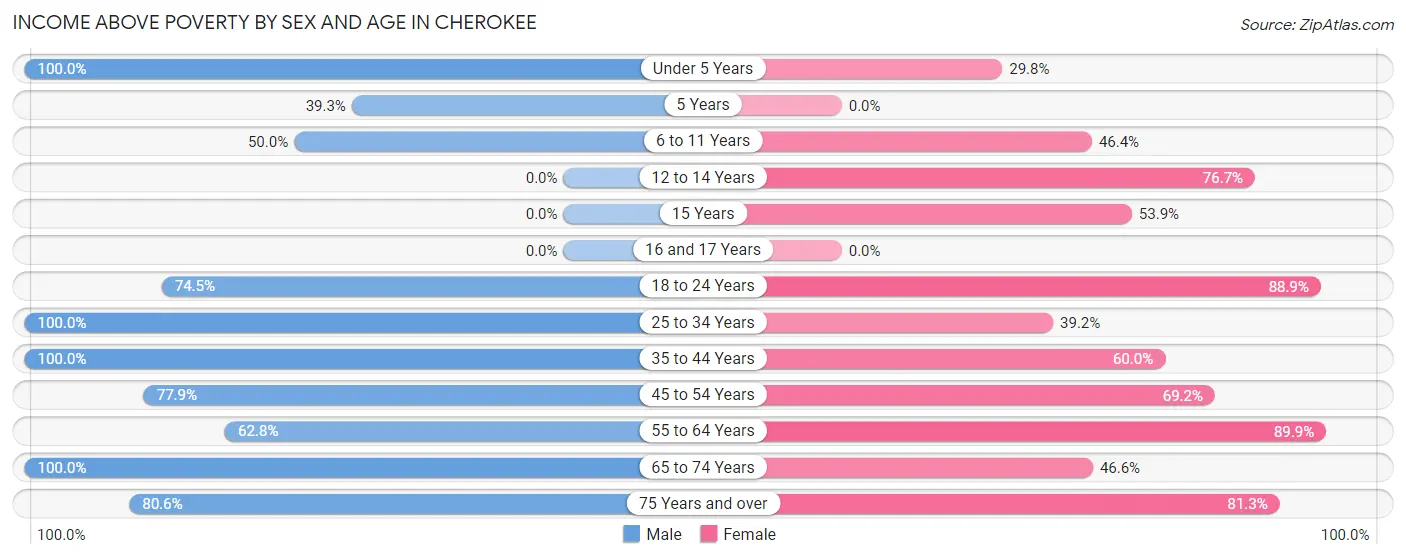
| Age Bracket | Male | Female |
| Under 5 Years | 31 (100.0%) | 14 (29.8%) |
| 5 Years | 11 (39.3%) | 0 (0.0%) |
| 6 to 11 Years | 29 (50.0%) | 13 (46.4%) |
| 12 to 14 Years | 0 (0.0%) | 23 (76.7%) |
| 15 Years | 0 (0.0%) | 7 (53.8%) |
| 16 and 17 Years | 0 (0.0%) | 0 (0.0%) |
| 18 to 24 Years | 79 (74.5%) | 128 (88.9%) |
| 25 to 34 Years | 69 (100.0%) | 20 (39.2%) |
| 35 to 44 Years | 60 (100.0%) | 36 (60.0%) |
| 45 to 54 Years | 95 (77.9%) | 72 (69.2%) |
| 55 to 64 Years | 81 (62.8%) | 71 (89.9%) |
| 65 to 74 Years | 104 (100.0%) | 62 (46.6%) |
| 75 Years and over | 58 (80.6%) | 65 (81.2%) |
| Total | 617 (77.8%) | 511 (66.4%) |
Income Below Poverty Among Married-Couple Families in Cherokee
The poverty statistics for married-couple families in Cherokee show that 27.0% or 68 of the total 252 families live below the poverty line. Families with no children have the highest poverty rate of 30.5%, comprising of 57 families. On the other hand, families with 3 or 4 children have the lowest poverty rate of 0.0%, which includes 0 families.
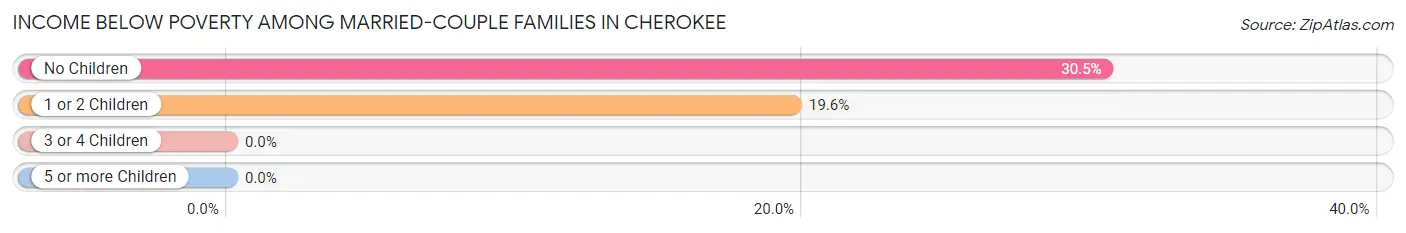
| Children | Above Poverty | Below Poverty |
| No Children | 130 (69.5%) | 57 (30.5%) |
| 1 or 2 Children | 45 (80.4%) | 11 (19.6%) |
| 3 or 4 Children | 9 (100.0%) | 0 (0.0%) |
| 5 or more Children | 0 (0.0%) | 0 (0.0%) |
| Total | 184 (73.0%) | 68 (27.0%) |
Income Below Poverty Among Single-Parent Households in Cherokee
According to the poverty data in Cherokee, 41.1% or 23 single-father households and 47.7% or 63 single-mother households are living below the poverty line. Among single-father households, those with 1 or 2 children have the highest poverty rate, with 23 households (53.5%) experiencing poverty. Likewise, among single-mother households, those with 1 or 2 children have the highest poverty rate, with 63 households (50.4%) falling below the poverty line.
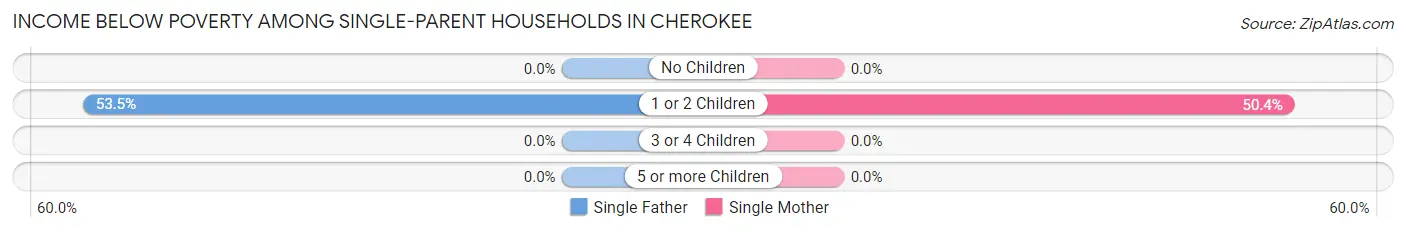
| Children | Single Father | Single Mother |
| No Children | 0 (0.0%) | 0 (0.0%) |
| 1 or 2 Children | 23 (53.5%) | 63 (50.4%) |
| 3 or 4 Children | 0 (0.0%) | 0 (0.0%) |
| 5 or more Children | 0 (0.0%) | 0 (0.0%) |
| Total | 23 (41.1%) | 63 (47.7%) |
Income Below Poverty Among Married-Couple vs Single-Parent Households in Cherokee
The poverty data for Cherokee shows that 68 of the married-couple family households (27.0%) and 86 of the single-parent households (45.7%) are living below the poverty level. Within the married-couple family households, those with no children have the highest poverty rate, with 57 households (30.5%) falling below the poverty line. Among the single-parent households, those with 1 or 2 children have the highest poverty rate, with 86 household (51.2%) living below poverty.
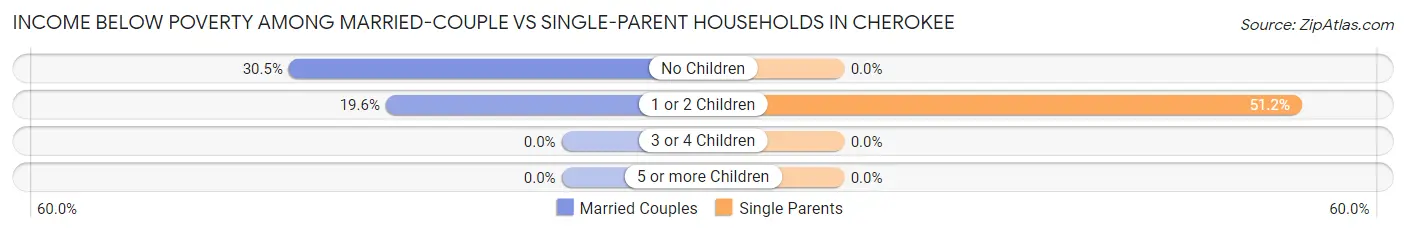
| Children | Married-Couple Families | Single-Parent Households |
| No Children | 57 (30.5%) | 0 (0.0%) |
| 1 or 2 Children | 11 (19.6%) | 86 (51.2%) |
| 3 or 4 Children | 0 (0.0%) | 0 (0.0%) |
| 5 or more Children | 0 (0.0%) | 0 (0.0%) |
| Total | 68 (27.0%) | 86 (45.7%) |
Race in Cherokee
The most populous races in Cherokee are Native / Alaskan (1,277 | 79.6%), White / Caucasian (154 | 9.6%), and Two or more Races (125 | 7.8%).
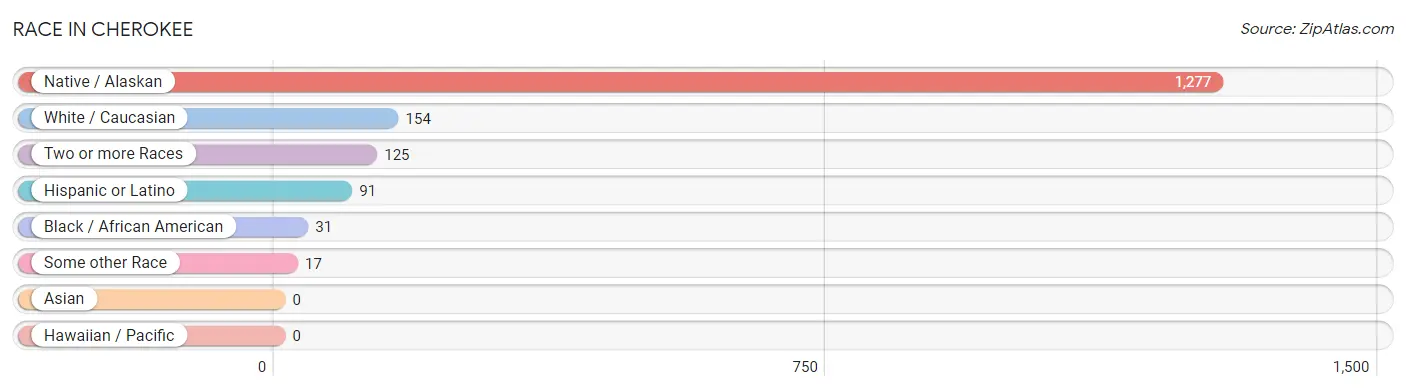
| Race | # Population | % Population |
| Asian | 0 | 0.0% |
| Black / African American | 31 | 1.9% |
| Hawaiian / Pacific | 0 | 0.0% |
| Hispanic or Latino | 91 | 5.7% |
| Native / Alaskan | 1,277 | 79.6% |
| White / Caucasian | 154 | 9.6% |
| Two or more Races | 125 | 7.8% |
| Some other Race | 17 | 1.1% |
| Total | 1,604 | 100.0% |
Ancestry in Cherokee
The most populous ancestries reported in Cherokee are Cherokee (1,210 | 75.4%), Puerto Rican (41 | 2.6%), Lumbee (36 | 2.2%), Mexican (35 | 2.2%), and Irish (25 | 1.6%), together accounting for 84.0% of all Cherokee residents.
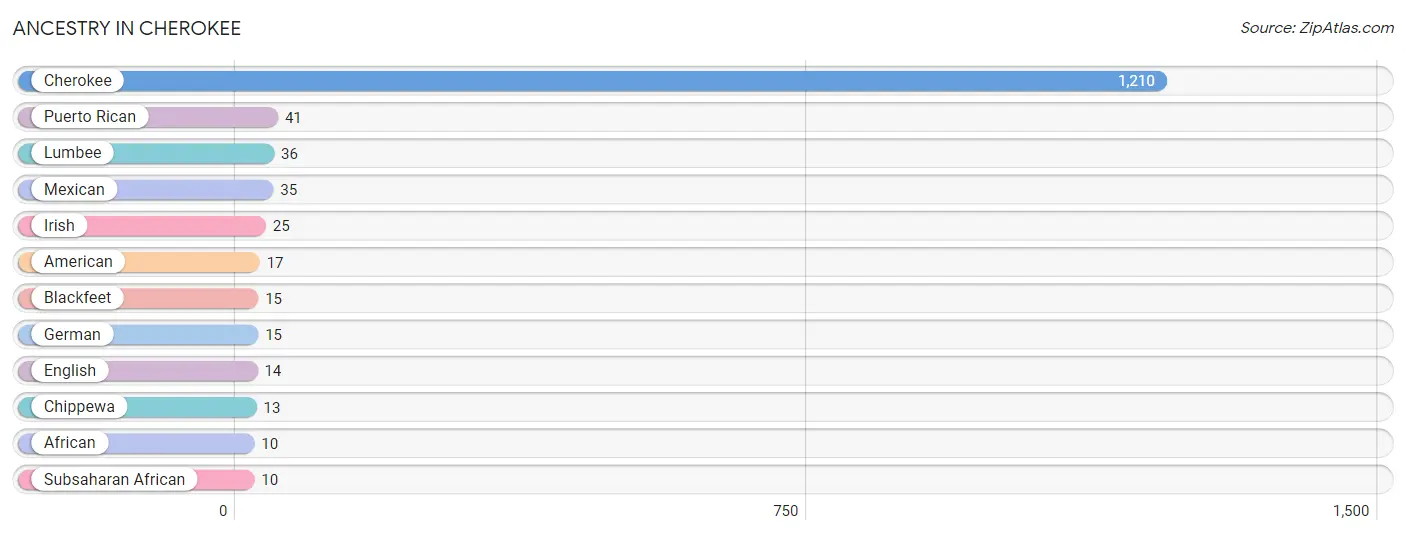
| Ancestry | # Population | % Population |
| African | 10 | 0.6% |
| American | 17 | 1.1% |
| Blackfeet | 15 | 0.9% |
| Cherokee | 1,210 | 75.4% |
| Chippewa | 13 | 0.8% |
| English | 14 | 0.9% |
| German | 15 | 0.9% |
| Irish | 25 | 1.6% |
| Lumbee | 36 | 2.2% |
| Mexican | 35 | 2.2% |
| Puerto Rican | 41 | 2.6% |
| Subsaharan African | 10 | 0.6% | View All 12 Rows |
Immigrants in Cherokee
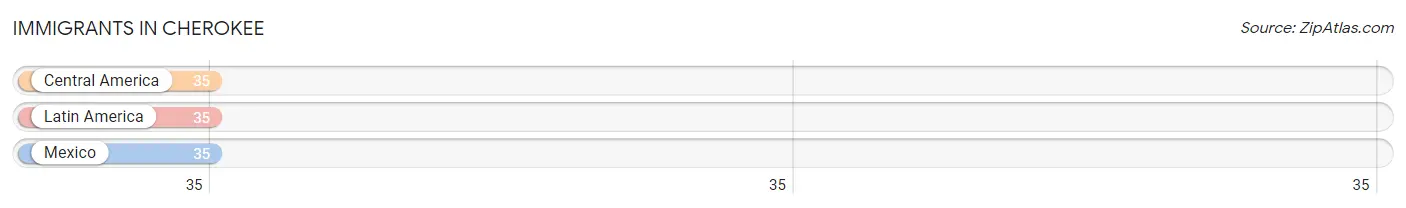
The most numerous immigrant groups reported in Cherokee came from Central America (35 | 2.2%), Latin America (35 | 2.2%), and Mexico (35 | 2.2%), together accounting for 6.5% of all Cherokee residents.
| Immigration Origin | # Population | % Population |
| Central America | 35 | 2.2% |
| Latin America | 35 | 2.2% |
| Mexico | 35 | 2.2% | View All 3 Rows |
Sex and Age in Cherokee
Sex and Age in Cherokee
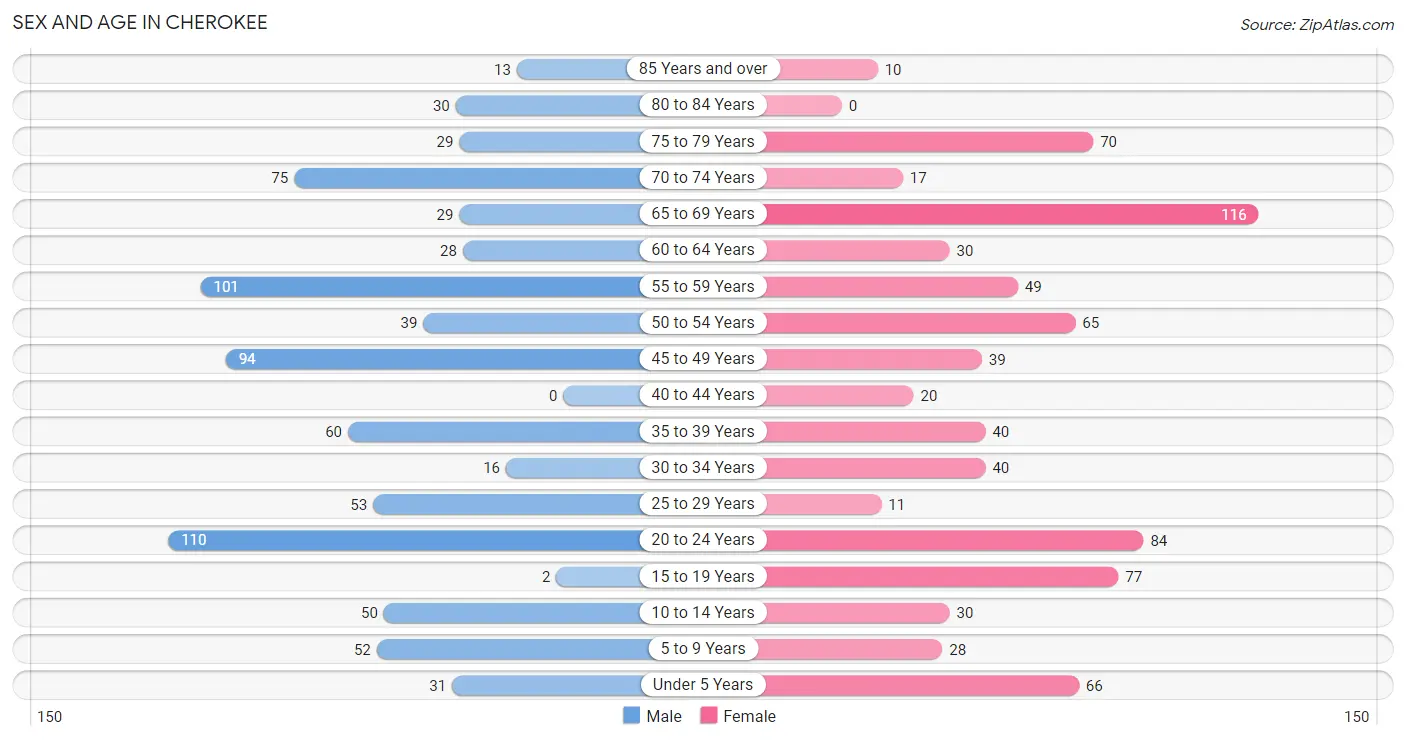
The most populous age groups in Cherokee are 20 to 24 Years (110 | 13.6%) for men and 65 to 69 Years (116 | 14.6%) for women.
| Age Bracket | Male | Female |
| Under 5 Years | 31 (3.8%) | 66 (8.3%) |
| 5 to 9 Years | 52 (6.4%) | 28 (3.5%) |
| 10 to 14 Years | 50 (6.2%) | 30 (3.8%) |
| 15 to 19 Years | 2 (0.3%) | 77 (9.7%) |
| 20 to 24 Years | 110 (13.6%) | 84 (10.6%) |
| 25 to 29 Years | 53 (6.5%) | 11 (1.4%) |
| 30 to 34 Years | 16 (2.0%) | 40 (5.1%) |
| 35 to 39 Years | 60 (7.4%) | 40 (5.1%) |
| 40 to 44 Years | 0 (0.0%) | 20 (2.5%) |
| 45 to 49 Years | 94 (11.6%) | 39 (4.9%) |
| 50 to 54 Years | 39 (4.8%) | 65 (8.2%) |
| 55 to 59 Years | 101 (12.4%) | 49 (6.2%) |
| 60 to 64 Years | 28 (3.5%) | 30 (3.8%) |
| 65 to 69 Years | 29 (3.6%) | 116 (14.6%) |
| 70 to 74 Years | 75 (9.2%) | 17 (2.1%) |
| 75 to 79 Years | 29 (3.6%) | 70 (8.8%) |
| 80 to 84 Years | 30 (3.7%) | 0 (0.0%) |
| 85 Years and over | 13 (1.6%) | 10 (1.3%) |
| Total | 812 (100.0%) | 792 (100.0%) |
Families and Households in Cherokee
Median Family Size in Cherokee
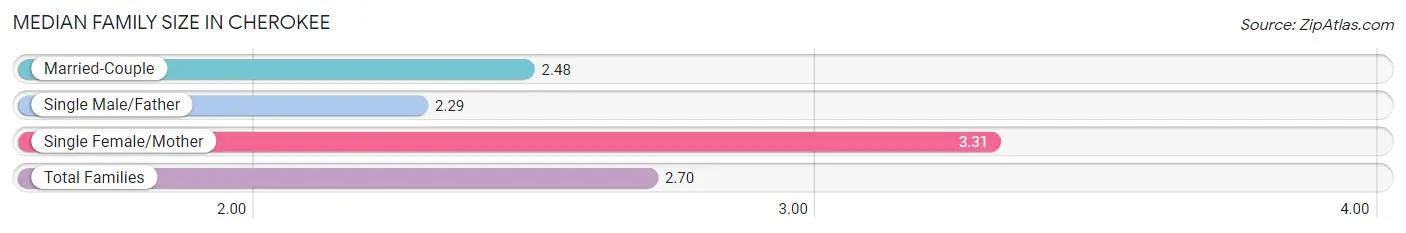
The median family size in Cherokee is 2.70 persons per family, with single female/mother families (132 | 30.0%) accounting for the largest median family size of 3.31 persons per family. On the other hand, single male/father families (56 | 12.7%) represent the smallest median family size with 2.29 persons per family.
| Family Type | # Families | Family Size |
| Married-Couple | 252 (57.3%) | 2.48 |
| Single Male/Father | 56 (12.7%) | 2.29 |
| Single Female/Mother | 132 (30.0%) | 3.31 |
| Total Families | 440 (100.0%) | 2.70 |
Median Household Size in Cherokee
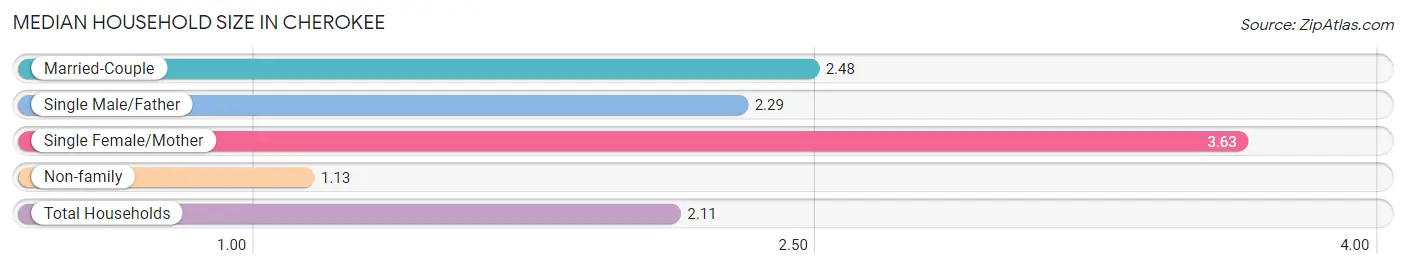
The median household size in Cherokee is 2.11 persons per household, with single female/mother households (132 | 17.6%) accounting for the largest median household size of 3.63 persons per household. non-family households (309 | 41.3%) represent the smallest median household size with 1.13 persons per household.
| Household Type | # Households | Household Size |
| Married-Couple | 252 (33.6%) | 2.48 |
| Single Male/Father | 56 (7.5%) | 2.29 |
| Single Female/Mother | 132 (17.6%) | 3.63 |
| Non-family | 309 (41.3%) | 1.13 |
| Total Households | 749 (100.0%) | 2.11 |
Household Size by Marriage Status in Cherokee
Out of a total of 749 households in Cherokee, 440 (58.7%) are family households, while 309 (41.3%) are nonfamily households. The most numerous type of family households are 2-person households, comprising 221, and the most common type of nonfamily households are 1-person households, comprising 279.
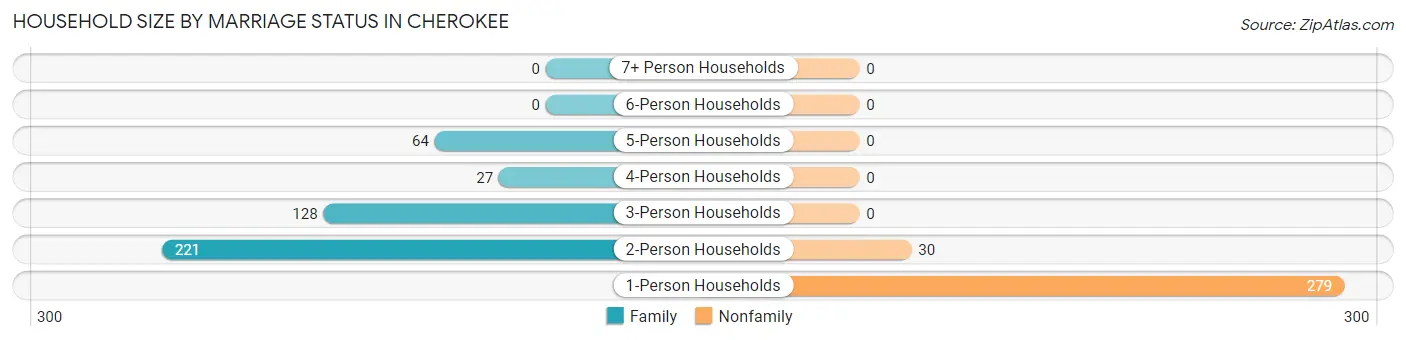
| Household Size | Family Households | Nonfamily Households |
| 1-Person Households | - | 279 (37.2%) |
| 2-Person Households | 221 (29.5%) | 30 (4.0%) |
| 3-Person Households | 128 (17.1%) | 0 (0.0%) |
| 4-Person Households | 27 (3.6%) | 0 (0.0%) |
| 5-Person Households | 64 (8.5%) | 0 (0.0%) |
| 6-Person Households | 0 (0.0%) | 0 (0.0%) |
| 7+ Person Households | 0 (0.0%) | 0 (0.0%) |
| Total | 440 (58.7%) | 309 (41.3%) |
Female Fertility in Cherokee
Fertility by Age in Cherokee
Average fertility rate in Cherokee is 77.0 births per 1,000 women. Women in the age bracket of 35 to 50 years have the highest fertility rate with 131.0 births per 1,000 women. Women in the age bracket of 35 to 50 years acount for 54.2% of all women with births.
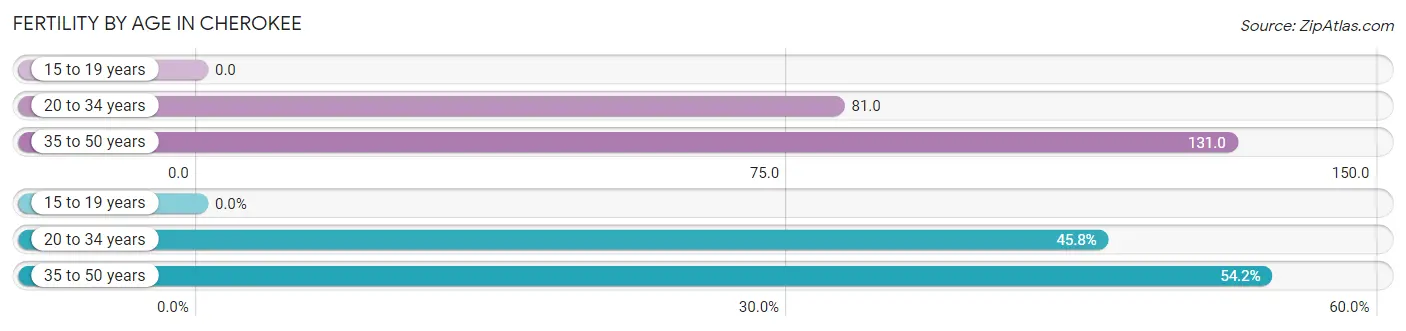
| Age Bracket | Women with Births | Births / 1,000 Women |
| 15 to 19 years | 0 (0.0%) | 0.0 |
| 20 to 34 years | 11 (45.8%) | 81.0 |
| 35 to 50 years | 13 (54.2%) | 131.0 |
| Total | 24 (100.0%) | 77.0 |
Fertility by Age by Marriage Status in Cherokee
54.2% of women with births (24) in Cherokee are married. The highest percentage of unmarried women with births falls into 20 to 34 years age bracket with 100.0% of them unmarried at the time of birth, while the lowest percentage of unmarried women with births belong to 35 to 50 years age bracket with 0.0% of them unmarried.
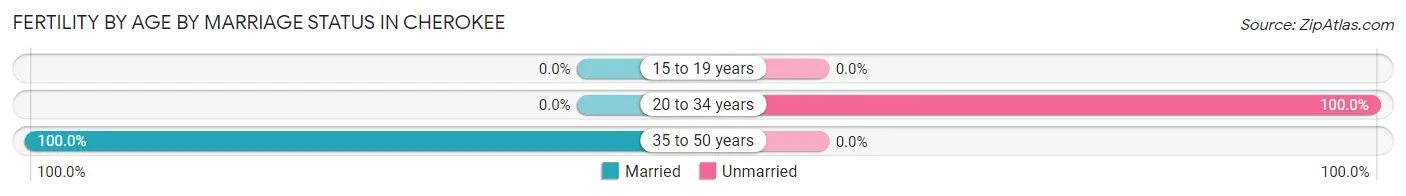
| Age Bracket | Married | Unmarried |
| 15 to 19 years | 0 (0.0%) | 0 (0.0%) |
| 20 to 34 years | 0 (0.0%) | 11 (100.0%) |
| 35 to 50 years | 13 (100.0%) | 0 (0.0%) |
| Total | 13 (54.2%) | 11 (45.8%) |
Fertility by Education in Cherokee
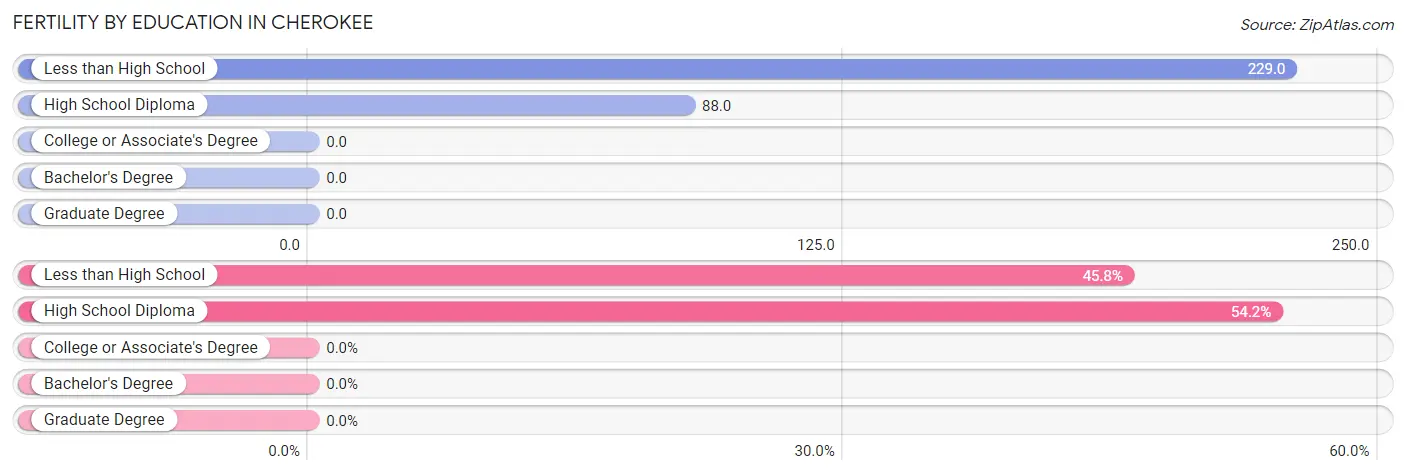
| Educational Attainment | Women with Births | Births / 1,000 Women |
| Less than High School | 11 (45.8%) | 229.0 |
| High School Diploma | 13 (54.2%) | 88.0 |
| College or Associate's Degree | 0 (0.0%) | 0.0 |
| Bachelor's Degree | 0 (0.0%) | 0.0 |
| Graduate Degree | 0 (0.0%) | 0.0 |
| Total | 24 (100.0%) | 77.0 |
Fertility by Education by Marriage Status in Cherokee
45.8% of women with births in Cherokee are unmarried. Women with the educational attainment of high school diploma are most likely to be married with 100.0% of them married at childbirth, while women with the educational attainment of less than high school are least likely to be married with 100.0% of them unmarried at childbirth.
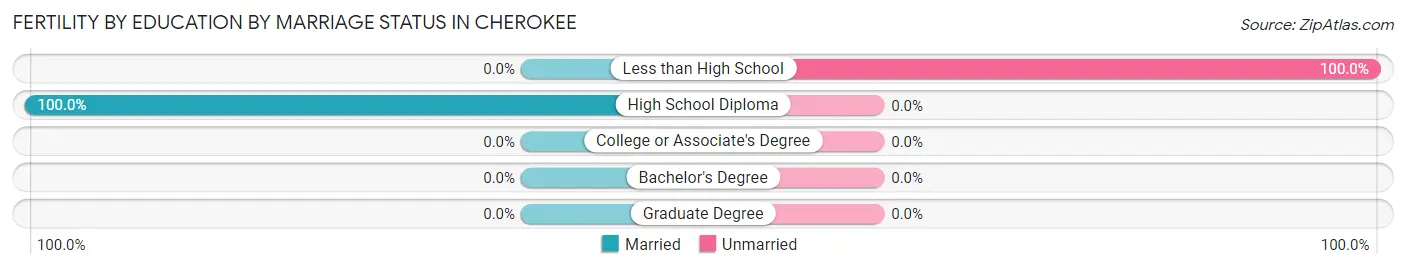
| Educational Attainment | Married | Unmarried |
| Less than High School | 0 (0.0%) | 11 (100.0%) |
| High School Diploma | 13 (100.0%) | 0 (0.0%) |
| College or Associate's Degree | 0 (0.0%) | 0 (0.0%) |
| Bachelor's Degree | 0 (0.0%) | 0 (0.0%) |
| Graduate Degree | 0 (0.0%) | 0 (0.0%) |
| Total | 13 (54.2%) | 11 (45.8%) |
Employment Characteristics in Cherokee
Employment by Class of Employer in Cherokee
Among the 591 employed individuals in Cherokee, private company employees (285 | 48.2%), local government employees (147 | 24.9%), and federal government employees (76 | 12.9%) make up the most common classes of employment.
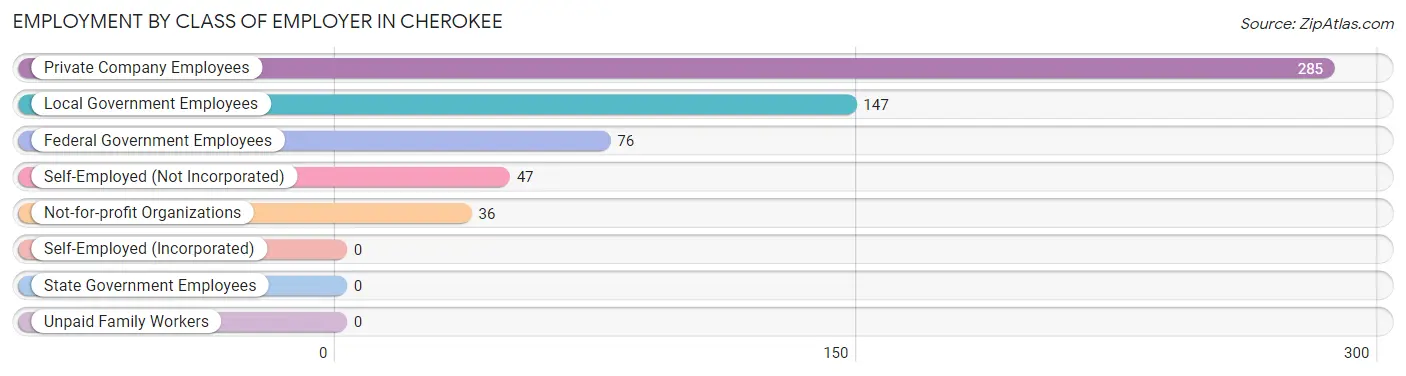
| Employer Class | # Employees | % Employees |
| Private Company Employees | 285 | 48.2% |
| Self-Employed (Incorporated) | 0 | 0.0% |
| Self-Employed (Not Incorporated) | 47 | 8.0% |
| Not-for-profit Organizations | 36 | 6.1% |
| Local Government Employees | 147 | 24.9% |
| State Government Employees | 0 | 0.0% |
| Federal Government Employees | 76 | 12.9% |
| Unpaid Family Workers | 0 | 0.0% |
| Total | 591 | 100.0% |
Employment Status by Age in Cherokee
According to the labor force statistics for Cherokee, out of the total population over 16 years of age (1,334), 47.1% or 628 individuals are in the labor force, with 1.6% or 10 of them unemployed. The age group with the highest labor force participation rate is 25 to 29 years, with 100.0% or 64 individuals in the labor force. Within the labor force, the 45 to 54 years age range has the highest percentage of unemployed individuals, with 9.1% or 10 of them being unemployed.
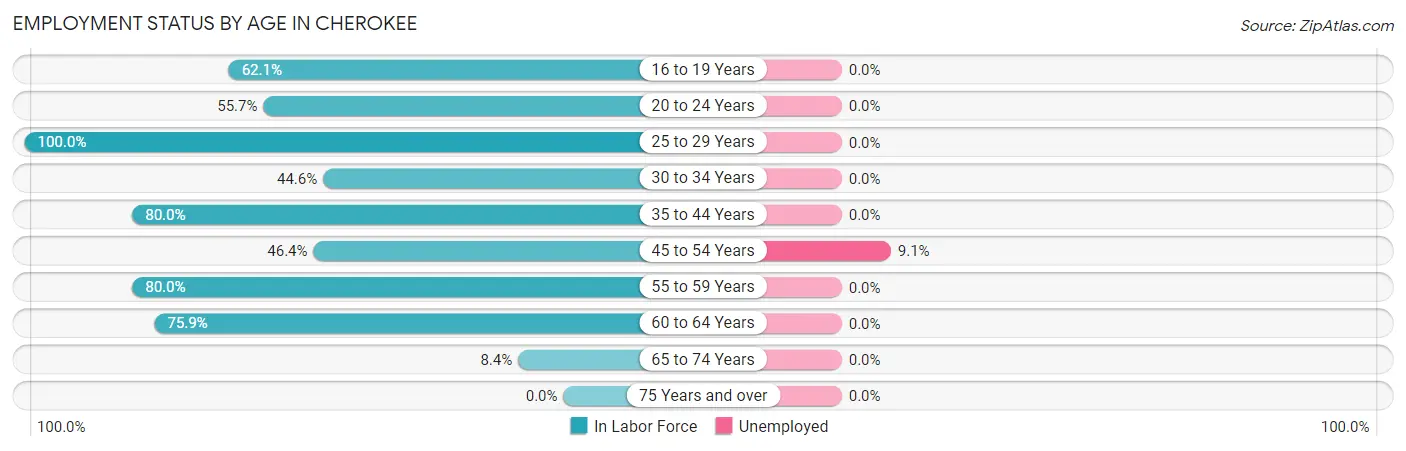
| Age Bracket | In Labor Force | Unemployed |
| 16 to 19 Years | 41 (62.1%) | 0 (0.0%) |
| 20 to 24 Years | 108 (55.7%) | 0 (0.0%) |
| 25 to 29 Years | 64 (100.0%) | 0 (0.0%) |
| 30 to 34 Years | 25 (44.6%) | 0 (0.0%) |
| 35 to 44 Years | 96 (80.0%) | 0 (0.0%) |
| 45 to 54 Years | 110 (46.4%) | 10 (9.1%) |
| 55 to 59 Years | 120 (80.0%) | 0 (0.0%) |
| 60 to 64 Years | 44 (75.9%) | 0 (0.0%) |
| 65 to 74 Years | 20 (8.4%) | 0 (0.0%) |
| 75 Years and over | 0 (0.0%) | 0 (0.0%) |
| Total | 628 (47.1%) | 10 (1.6%) |
Employment Status by Educational Attainment in Cherokee
According to labor force statistics for Cherokee, 67.0% of individuals (459) out of the total population between 25 and 64 years of age (685) are in the labor force, with 2.2% or 10 of them being unemployed. The group with the highest labor force participation rate are those with the educational attainment of high school diploma, with 82.6% or 228 individuals in the labor force. Within the labor force, individuals with high school diploma education have the highest percentage of unemployment, with 4.4% or 10 of them being unemployed.
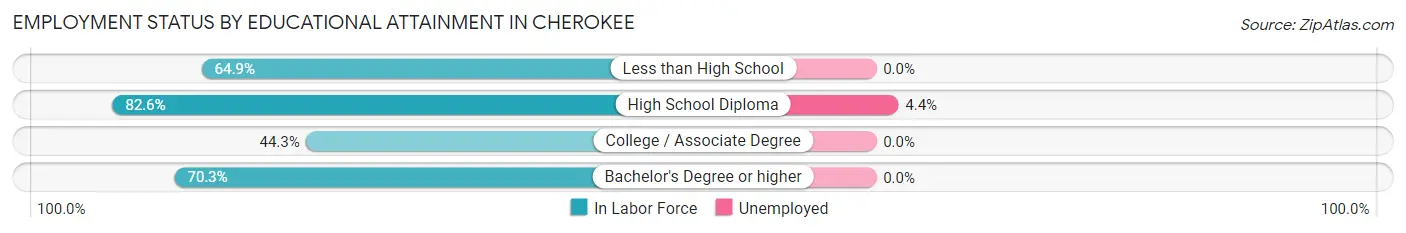
| Educational Attainment | In Labor Force | Unemployed |
| Less than High School | 74 (64.9%) | 0 (0.0%) |
| High School Diploma | 228 (82.6%) | 12 (4.4%) |
| College / Associate Degree | 86 (44.3%) | 0 (0.0%) |
| Bachelor's Degree or higher | 71 (70.3%) | 0 (0.0%) |
| Total | 459 (67.0%) | 15 (2.2%) |
Employment Occupations by Sex in Cherokee
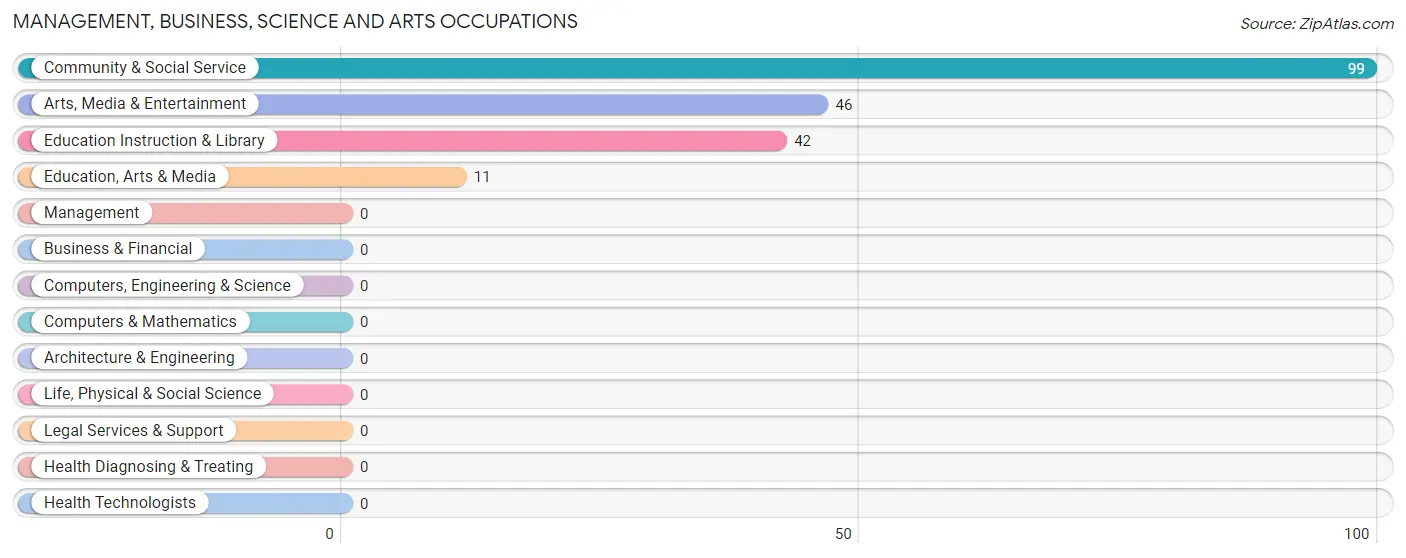
Management, Business, Science and Arts Occupations
The most common Management, Business, Science and Arts occupations in Cherokee are Community & Social Service (99 | 16.0%), Arts, Media & Entertainment (46 | 7.4%), Education Instruction & Library (42 | 6.8%), and Education, Arts & Media (11 | 1.8%).
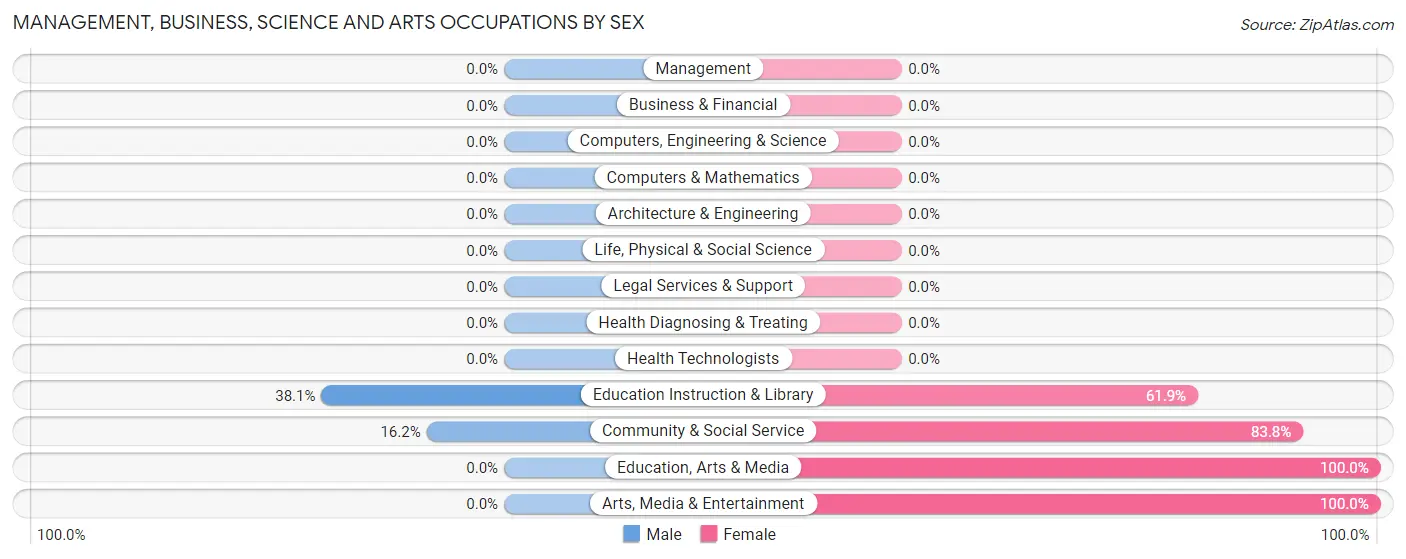
Management, Business, Science and Arts Occupations by Sex
Within the Management, Business, Science and Arts occupations in Cherokee, the most male-oriented occupations are Education Instruction & Library (38.1%), and Community & Social Service (16.2%), while the most female-oriented occupations are Education, Arts & Media (100.0%), Arts, Media & Entertainment (100.0%), and Community & Social Service (83.8%).
| Occupation | Male | Female |
| Management | 0 (0.0%) | 0 (0.0%) |
| Business & Financial | 0 (0.0%) | 0 (0.0%) |
| Computers, Engineering & Science | 0 (0.0%) | 0 (0.0%) |
| Computers & Mathematics | 0 (0.0%) | 0 (0.0%) |
| Architecture & Engineering | 0 (0.0%) | 0 (0.0%) |
| Life, Physical & Social Science | 0 (0.0%) | 0 (0.0%) |
| Community & Social Service | 16 (16.2%) | 83 (83.8%) |
| Education, Arts & Media | 0 (0.0%) | 11 (100.0%) |
| Legal Services & Support | 0 (0.0%) | 0 (0.0%) |
| Education Instruction & Library | 16 (38.1%) | 26 (61.9%) |
| Arts, Media & Entertainment | 0 (0.0%) | 46 (100.0%) |
| Health Diagnosing & Treating | 0 (0.0%) | 0 (0.0%) |
| Health Technologists | 0 (0.0%) | 0 (0.0%) |
| Total (Category) | 16 (16.2%) | 83 (83.8%) |
| Total (Overall) | 344 (55.7%) | 274 (44.3%) |
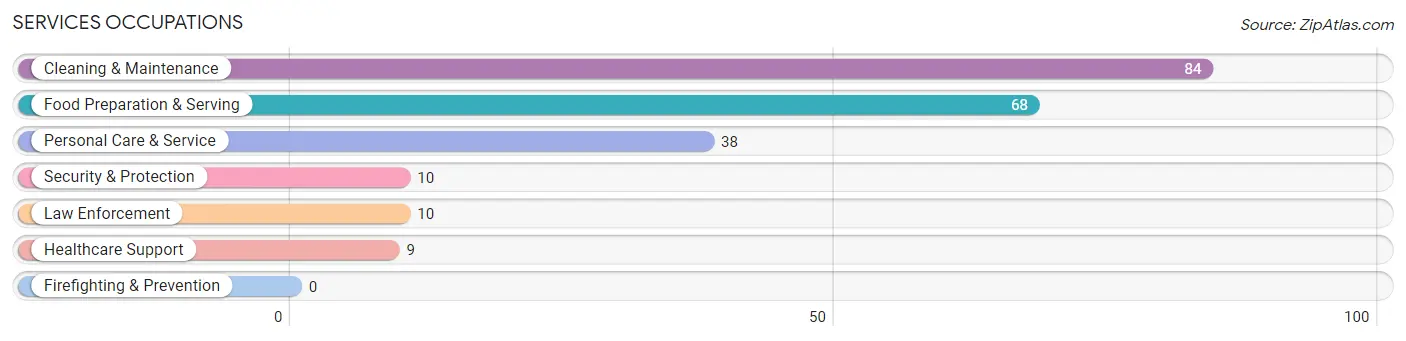
Services Occupations
The most common Services occupations in Cherokee are Cleaning & Maintenance (84 | 13.6%), Food Preparation & Serving (68 | 11.0%), Personal Care & Service (38 | 6.1%), Security & Protection (10 | 1.6%), and Law Enforcement (10 | 1.6%).
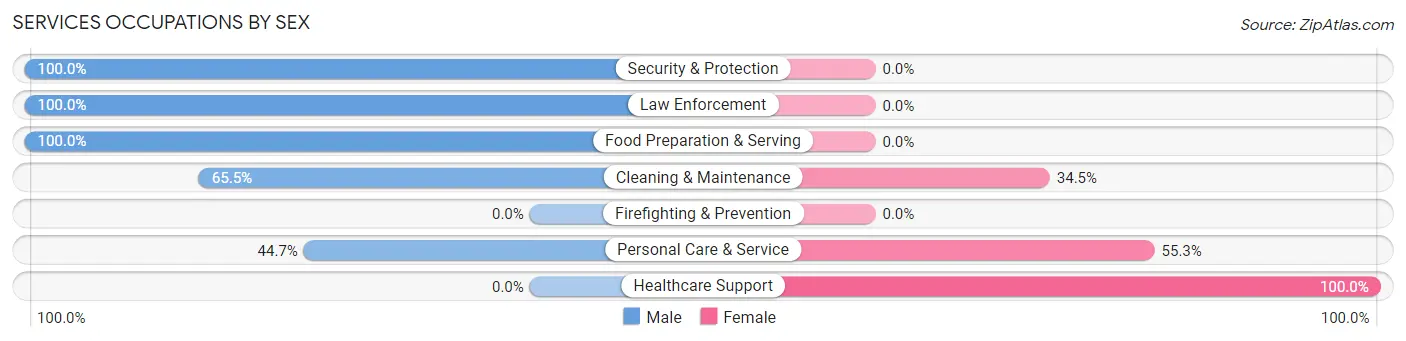
Services Occupations by Sex
Within the Services occupations in Cherokee, the most male-oriented occupations are Security & Protection (100.0%), Law Enforcement (100.0%), and Food Preparation & Serving (100.0%), while the most female-oriented occupations are Healthcare Support (100.0%), Personal Care & Service (55.3%), and Cleaning & Maintenance (34.5%).
| Occupation | Male | Female |
| Healthcare Support | 0 (0.0%) | 9 (100.0%) |
| Security & Protection | 10 (100.0%) | 0 (0.0%) |
| Firefighting & Prevention | 0 (0.0%) | 0 (0.0%) |
| Law Enforcement | 10 (100.0%) | 0 (0.0%) |
| Food Preparation & Serving | 68 (100.0%) | 0 (0.0%) |
| Cleaning & Maintenance | 55 (65.5%) | 29 (34.5%) |
| Personal Care & Service | 17 (44.7%) | 21 (55.3%) |
| Total (Category) | 150 (71.8%) | 59 (28.2%) |
| Total (Overall) | 344 (55.7%) | 274 (44.3%) |
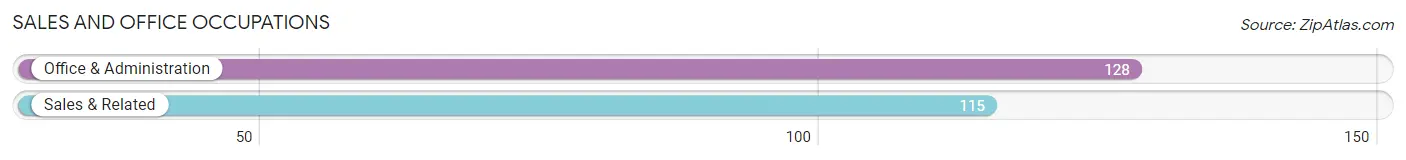
Sales and Office Occupations
The most common Sales and Office occupations in Cherokee are Office & Administration (128 | 20.7%), and Sales & Related (115 | 18.6%).
Sales and Office Occupations by Sex
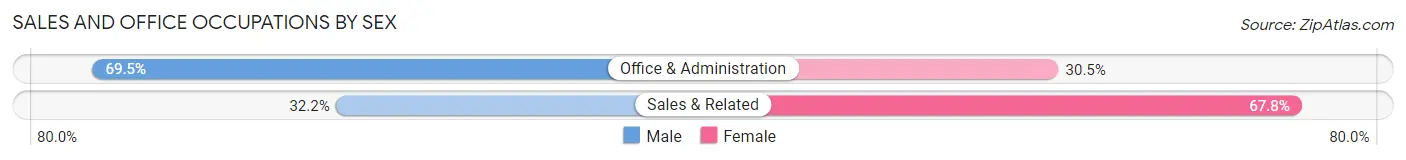
| Occupation | Male | Female |
| Sales & Related | 37 (32.2%) | 78 (67.8%) |
| Office & Administration | 89 (69.5%) | 39 (30.5%) |
| Total (Category) | 126 (51.8%) | 117 (48.1%) |
| Total (Overall) | 344 (55.7%) | 274 (44.3%) |
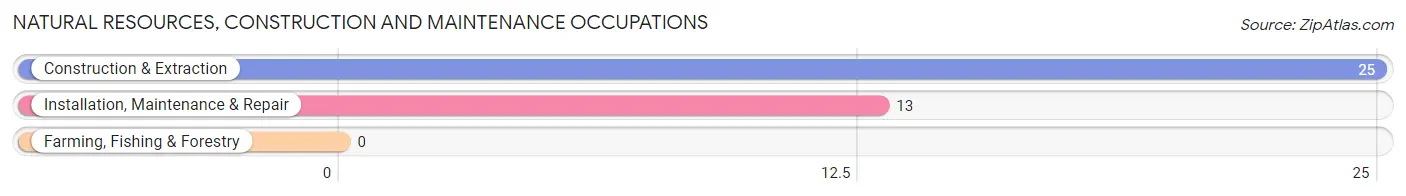
Natural Resources, Construction and Maintenance Occupations
The most common Natural Resources, Construction and Maintenance occupations in Cherokee are Construction & Extraction (25 | 4.1%), and Installation, Maintenance & Repair (13 | 2.1%).
Natural Resources, Construction and Maintenance Occupations by Sex
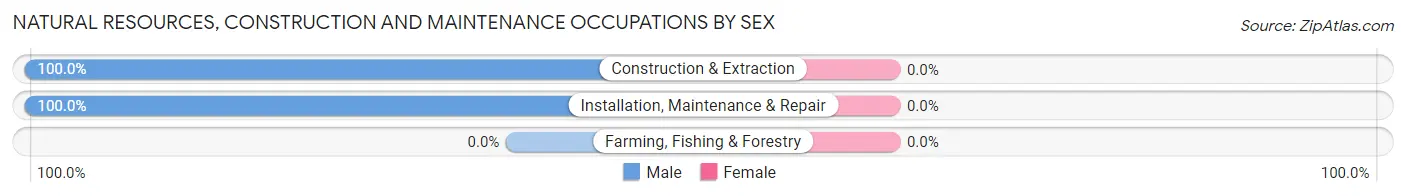
| Occupation | Male | Female |
| Farming, Fishing & Forestry | 0 (0.0%) | 0 (0.0%) |
| Construction & Extraction | 25 (100.0%) | 0 (0.0%) |
| Installation, Maintenance & Repair | 13 (100.0%) | 0 (0.0%) |
| Total (Category) | 38 (100.0%) | 0 (0.0%) |
| Total (Overall) | 344 (55.7%) | 274 (44.3%) |
Production, Transportation and Moving Occupations
The most common Production, Transportation and Moving occupations in Cherokee are , and Production (29 | 4.7%).
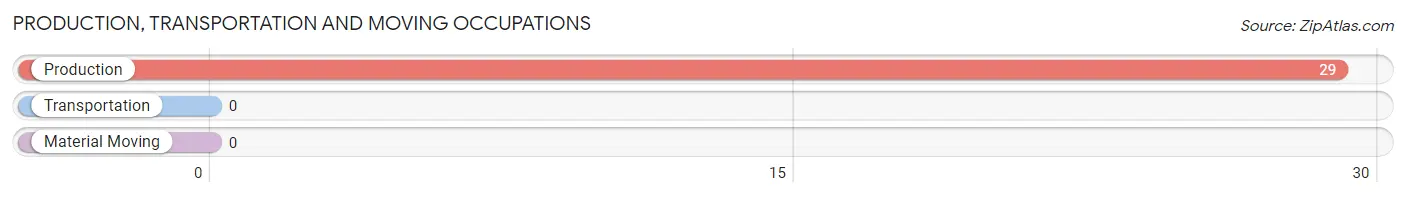
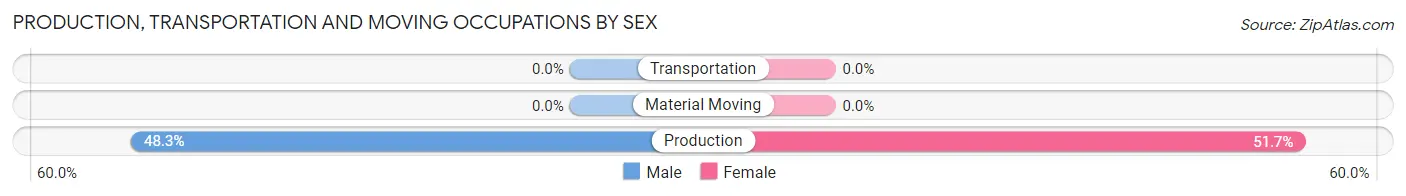
Production, Transportation and Moving Occupations by Sex
| Occupation | Male | Female |
| Production | 14 (48.3%) | 15 (51.7%) |
| Transportation | 0 (0.0%) | 0 (0.0%) |
| Material Moving | 0 (0.0%) | 0 (0.0%) |
| Total (Category) | 14 (48.3%) | 15 (51.7%) |
| Total (Overall) | 344 (55.7%) | 274 (44.3%) |
Employment Industries by Sex in Cherokee
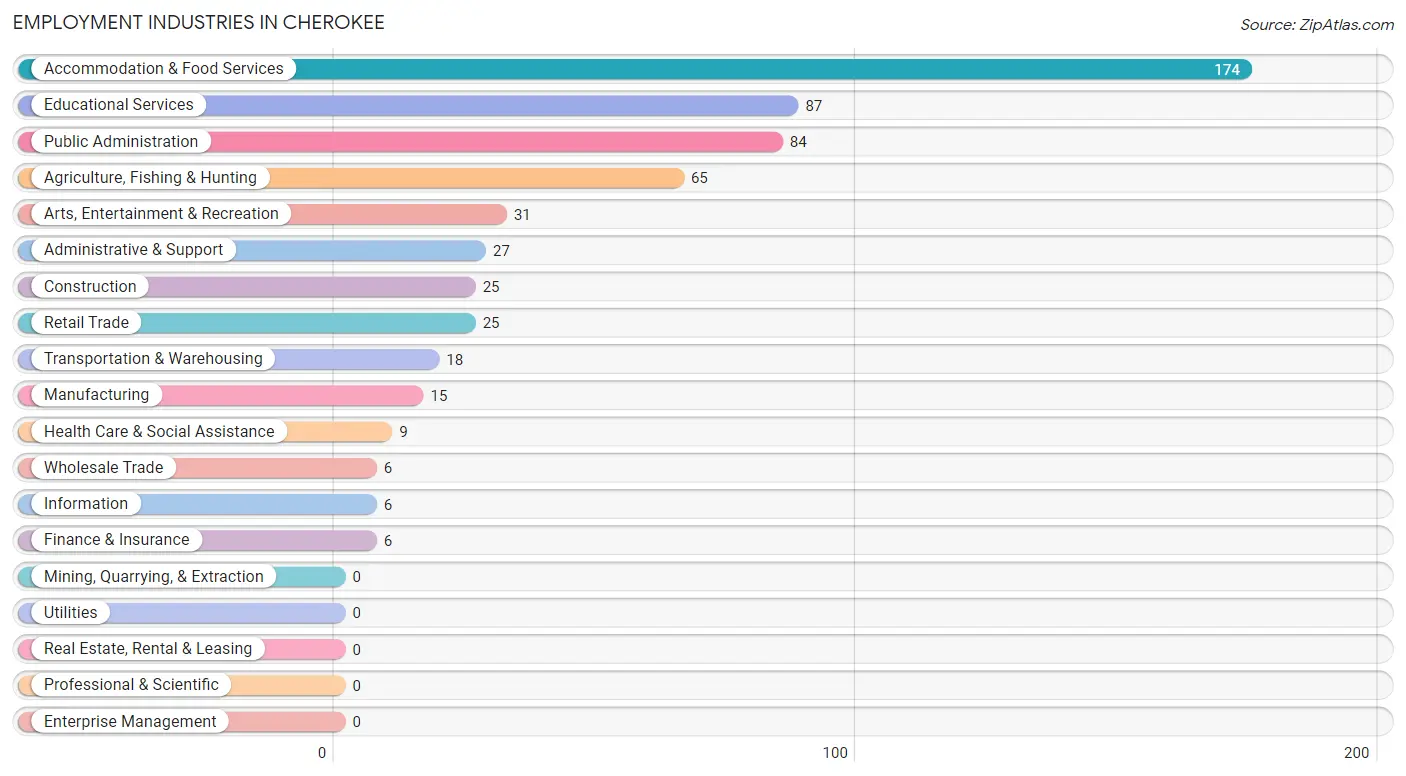
Employment Industries in Cherokee
The major employment industries in Cherokee include Accommodation & Food Services (174 | 28.2%), Educational Services (87 | 14.1%), Public Administration (84 | 13.6%), Agriculture, Fishing & Hunting (65 | 10.5%), and Arts, Entertainment & Recreation (31 | 5.0%).
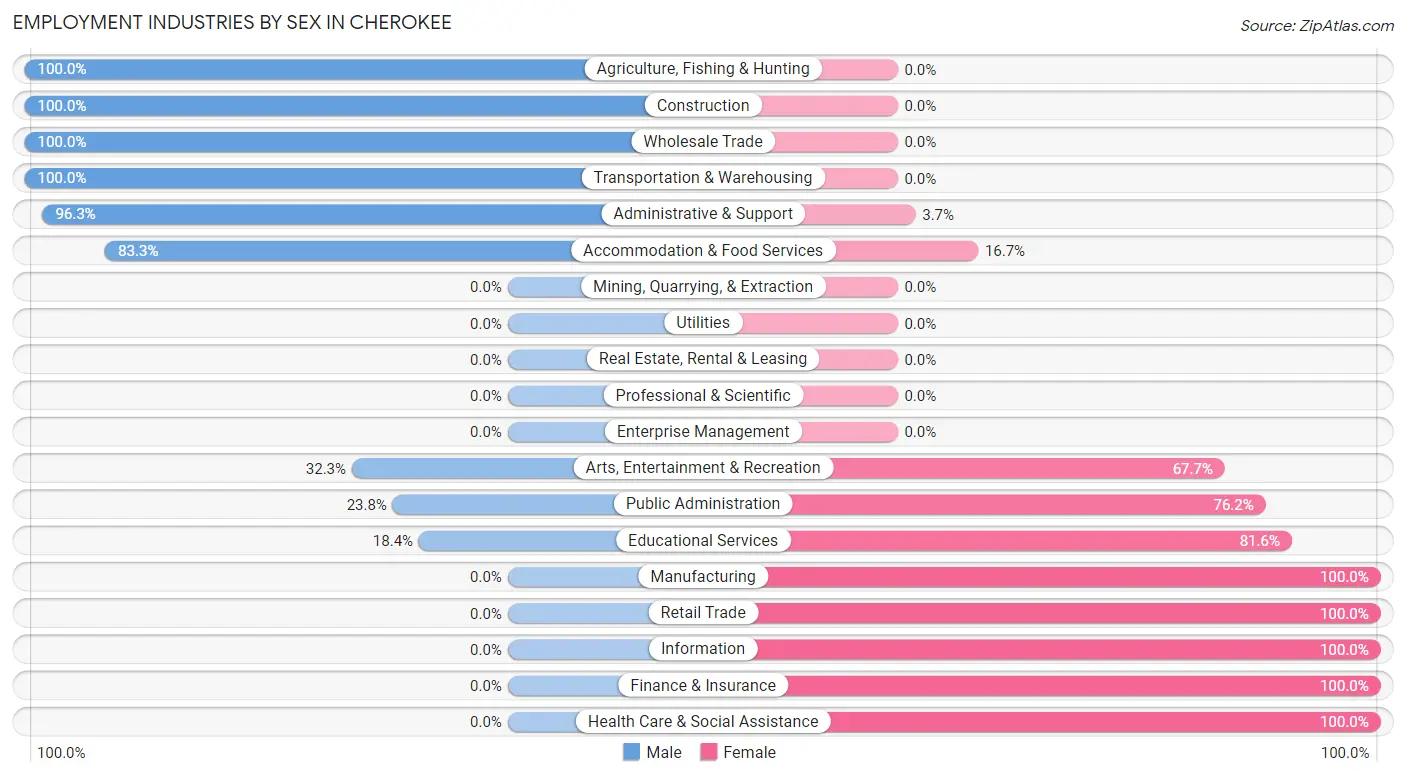
Employment Industries by Sex in Cherokee
The Cherokee industries that see more men than women are Agriculture, Fishing & Hunting (100.0%), Construction (100.0%), and Wholesale Trade (100.0%), whereas the industries that tend to have a higher number of women are Manufacturing (100.0%), Retail Trade (100.0%), and Information (100.0%).
| Industry | Male | Female |
| Agriculture, Fishing & Hunting | 65 (100.0%) | 0 (0.0%) |
| Mining, Quarrying, & Extraction | 0 (0.0%) | 0 (0.0%) |
| Construction | 25 (100.0%) | 0 (0.0%) |
| Manufacturing | 0 (0.0%) | 15 (100.0%) |
| Wholesale Trade | 6 (100.0%) | 0 (0.0%) |
| Retail Trade | 0 (0.0%) | 25 (100.0%) |
| Transportation & Warehousing | 18 (100.0%) | 0 (0.0%) |
| Utilities | 0 (0.0%) | 0 (0.0%) |
| Information | 0 (0.0%) | 6 (100.0%) |
| Finance & Insurance | 0 (0.0%) | 6 (100.0%) |
| Real Estate, Rental & Leasing | 0 (0.0%) | 0 (0.0%) |
| Professional & Scientific | 0 (0.0%) | 0 (0.0%) |
| Enterprise Management | 0 (0.0%) | 0 (0.0%) |
| Administrative & Support | 26 (96.3%) | 1 (3.7%) |
| Educational Services | 16 (18.4%) | 71 (81.6%) |
| Health Care & Social Assistance | 0 (0.0%) | 9 (100.0%) |
| Arts, Entertainment & Recreation | 10 (32.3%) | 21 (67.7%) |
| Accommodation & Food Services | 145 (83.3%) | 29 (16.7%) |
| Public Administration | 20 (23.8%) | 64 (76.2%) |
| Total | 344 (55.7%) | 274 (44.3%) |
Education in Cherokee
School Enrollment in Cherokee
The most common levels of schooling among the 200 students in Cherokee are elementary school (77 | 38.5%), high school (44 | 22.0%), and middle school (37 | 18.5%).
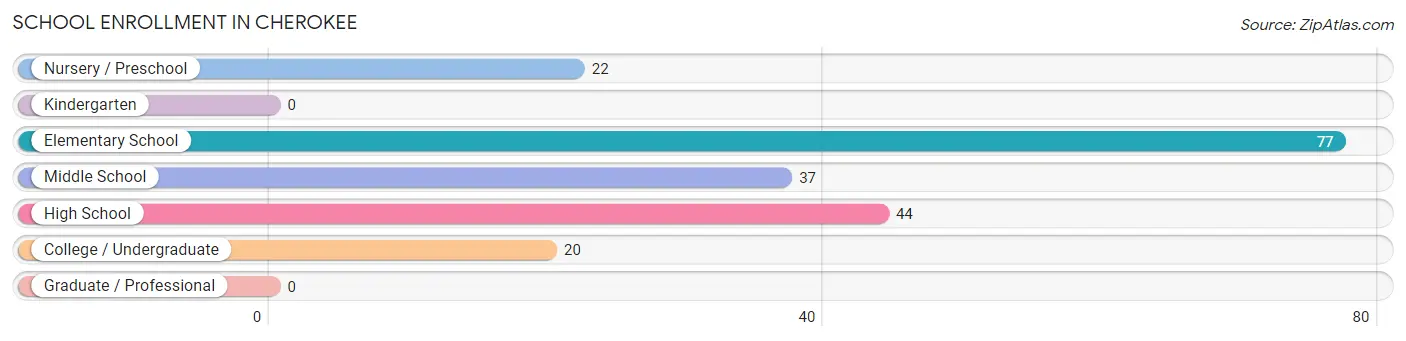
| School Level | # Students | % Students |
| Nursery / Preschool | 22 | 11.0% |
| Kindergarten | 0 | 0.0% |
| Elementary School | 77 | 38.5% |
| Middle School | 37 | 18.5% |
| High School | 44 | 22.0% |
| College / Undergraduate | 20 | 10.0% |
| Graduate / Professional | 0 | 0.0% |
| Total | 200 | 100.0% |
School Enrollment by Age by Funding Source in Cherokee
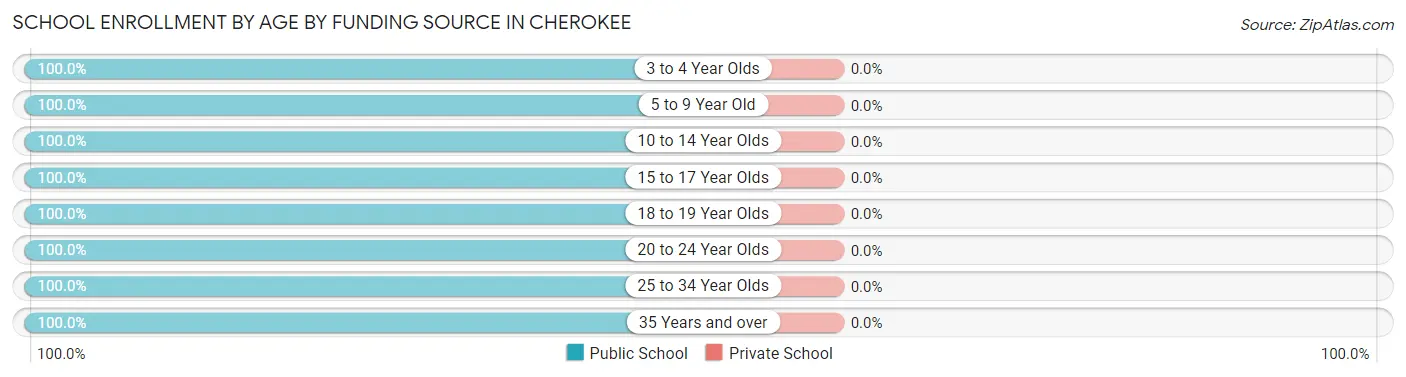
| Age Bracket | Public School | Private School |
| 3 to 4 Year Olds | 5 (100.0%) | 0 (0.0%) |
| 5 to 9 Year Old | 69 (100.0%) | 0 (0.0%) |
| 10 to 14 Year Olds | 65 (100.0%) | 0 (0.0%) |
| 15 to 17 Year Olds | 15 (100.0%) | 0 (0.0%) |
| 18 to 19 Year Olds | 14 (100.0%) | 0 (0.0%) |
| 20 to 24 Year Olds | 4 (100.0%) | 0 (0.0%) |
| 25 to 34 Year Olds | 16 (100.0%) | 0 (0.0%) |
| 35 Years and over | 12 (100.0%) | 0 (0.0%) |
| Total | 200 (100.0%) | 0 (0.0%) |
Educational Attainment by Field of Study in Cherokee
Education (95 | 51.6%), business (63 | 34.2%), engineering (14 | 7.6%), arts & humanities (10 | 5.4%), and physical & health sciences (2 | 1.1%) are the most common fields of study among 184 individuals in Cherokee who have obtained a bachelor's degree or higher.
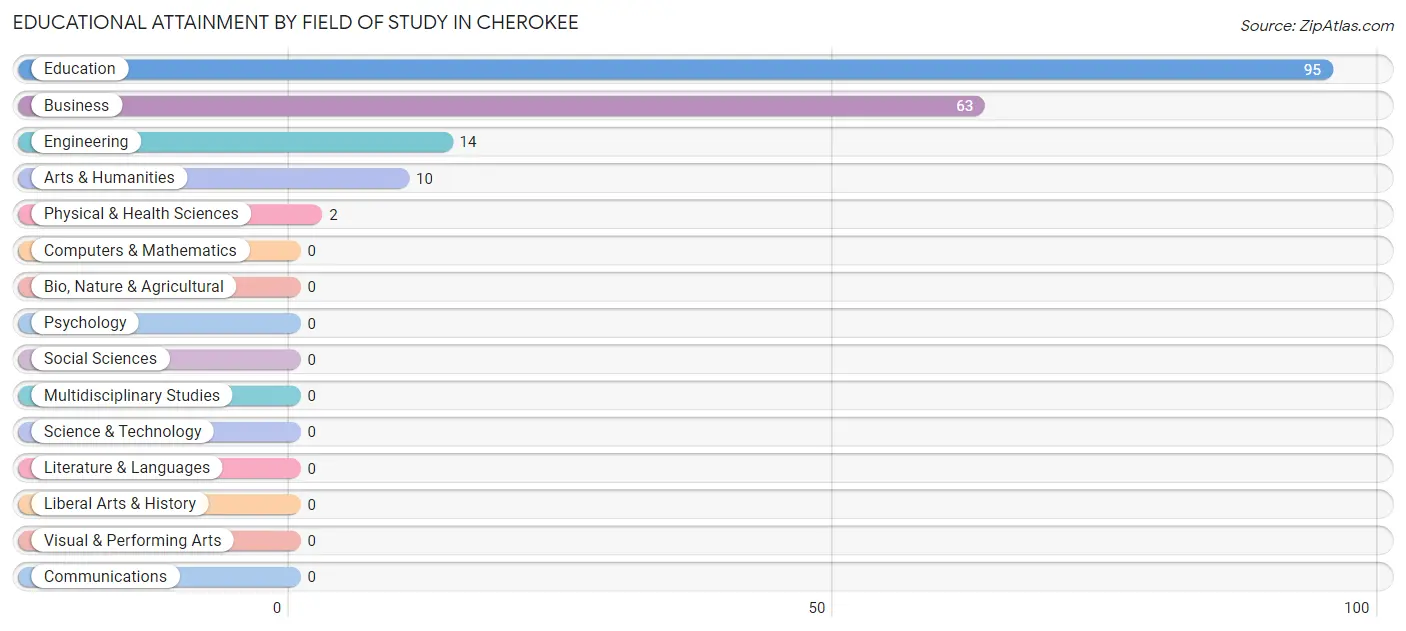
| Field of Study | # Graduates | % Graduates |
| Computers & Mathematics | 0 | 0.0% |
| Bio, Nature & Agricultural | 0 | 0.0% |
| Physical & Health Sciences | 2 | 1.1% |
| Psychology | 0 | 0.0% |
| Social Sciences | 0 | 0.0% |
| Engineering | 14 | 7.6% |
| Multidisciplinary Studies | 0 | 0.0% |
| Science & Technology | 0 | 0.0% |
| Business | 63 | 34.2% |
| Education | 95 | 51.6% |
| Literature & Languages | 0 | 0.0% |
| Liberal Arts & History | 0 | 0.0% |
| Visual & Performing Arts | 0 | 0.0% |
| Communications | 0 | 0.0% |
| Arts & Humanities | 10 | 5.4% |
| Total | 184 | 100.0% |
Transportation & Commute in Cherokee
Vehicle Availability by Sex in Cherokee
The most prevalent vehicle ownership categories in Cherokee are males with 3 vehicles (115, accounting for 34.6%) and females with 3 vehicles (45, making up 44.4%).
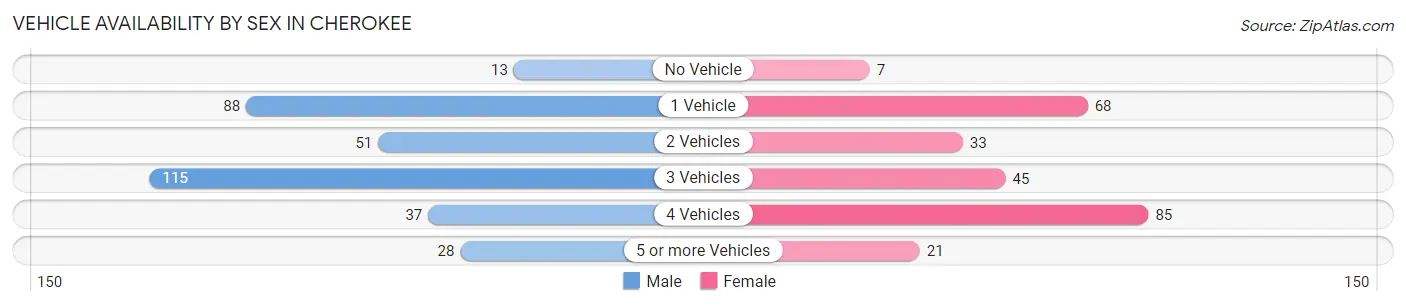
| Vehicles Available | Male | Female |
| No Vehicle | 13 (3.9%) | 7 (2.7%) |
| 1 Vehicle | 88 (26.5%) | 68 (26.3%) |
| 2 Vehicles | 51 (15.4%) | 33 (12.7%) |
| 3 Vehicles | 115 (34.6%) | 45 (17.4%) |
| 4 Vehicles | 37 (11.1%) | 85 (32.8%) |
| 5 or more Vehicles | 28 (8.4%) | 21 (8.1%) |
| Total | 332 (100.0%) | 259 (100.0%) |
Commute Time in Cherokee
The most frequently occuring commute durations in Cherokee are 5 to 9 minutes (210 commuters, 35.9%), 15 to 19 minutes (116 commuters, 19.8%), and 10 to 14 minutes (101 commuters, 17.3%).
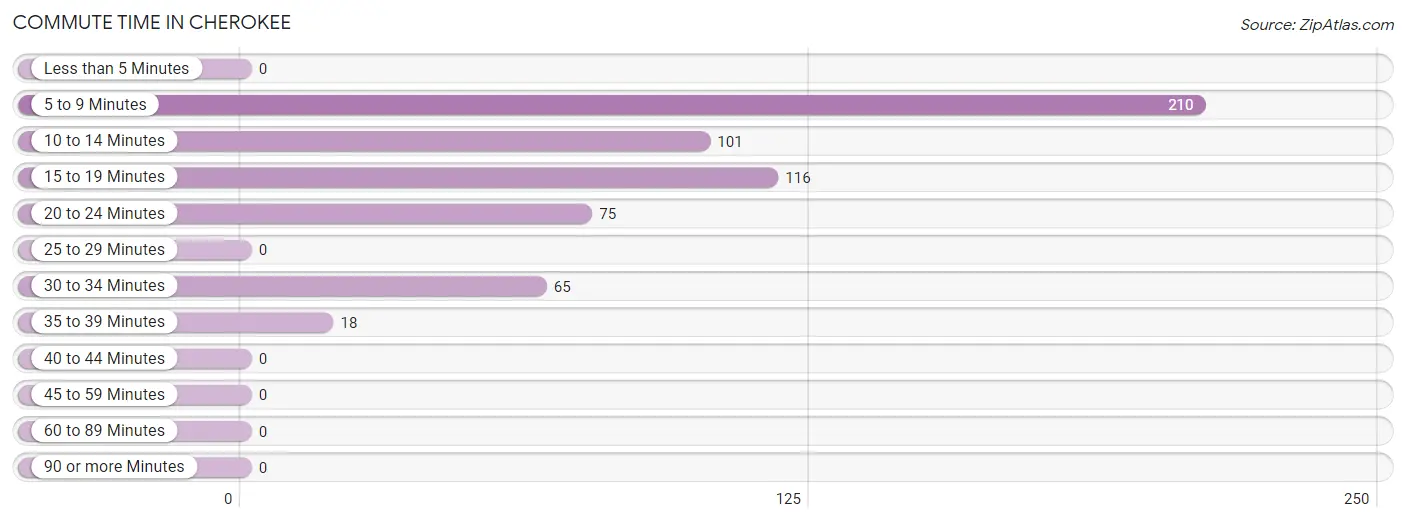
| Commute Time | # Commuters | % Commuters |
| Less than 5 Minutes | 0 | 0.0% |
| 5 to 9 Minutes | 210 | 35.9% |
| 10 to 14 Minutes | 101 | 17.3% |
| 15 to 19 Minutes | 116 | 19.8% |
| 20 to 24 Minutes | 75 | 12.8% |
| 25 to 29 Minutes | 0 | 0.0% |
| 30 to 34 Minutes | 65 | 11.1% |
| 35 to 39 Minutes | 18 | 3.1% |
| 40 to 44 Minutes | 0 | 0.0% |
| 45 to 59 Minutes | 0 | 0.0% |
| 60 to 89 Minutes | 0 | 0.0% |
| 90 or more Minutes | 0 | 0.0% |
Commute Time by Sex in Cherokee
The most common commute times in Cherokee are 10 to 14 minutes (86 commuters, 25.9%) for males and 5 to 9 minutes (126 commuters, 49.8%) for females.
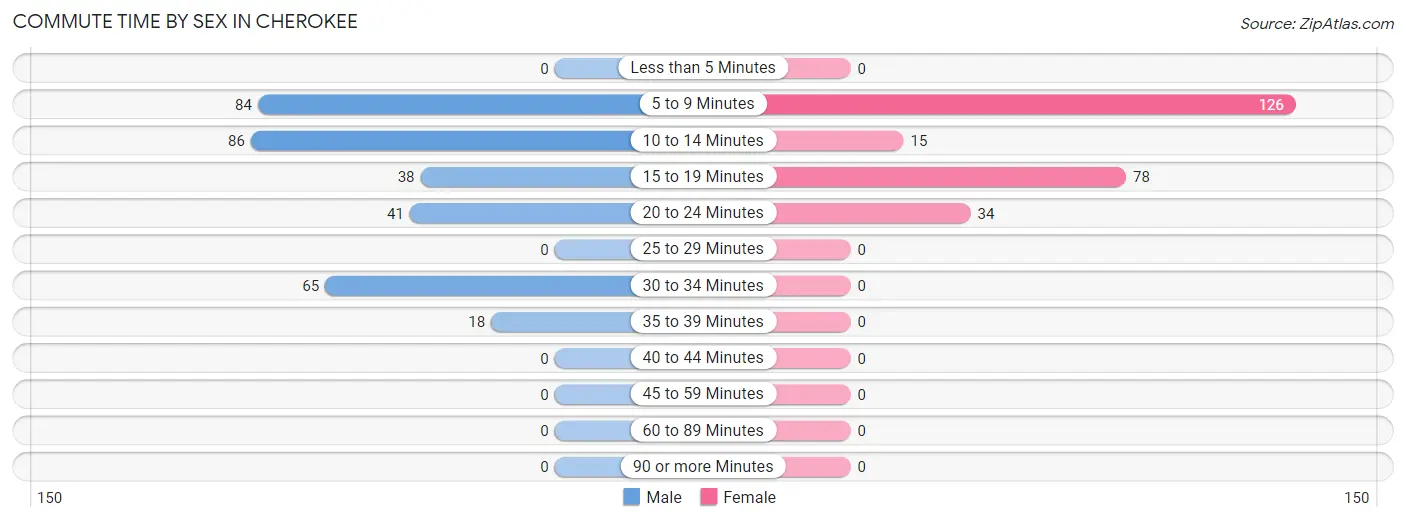
| Commute Time | Male | Female |
| Less than 5 Minutes | 0 (0.0%) | 0 (0.0%) |
| 5 to 9 Minutes | 84 (25.3%) | 126 (49.8%) |
| 10 to 14 Minutes | 86 (25.9%) | 15 (5.9%) |
| 15 to 19 Minutes | 38 (11.5%) | 78 (30.8%) |
| 20 to 24 Minutes | 41 (12.3%) | 34 (13.4%) |
| 25 to 29 Minutes | 0 (0.0%) | 0 (0.0%) |
| 30 to 34 Minutes | 65 (19.6%) | 0 (0.0%) |
| 35 to 39 Minutes | 18 (5.4%) | 0 (0.0%) |
| 40 to 44 Minutes | 0 (0.0%) | 0 (0.0%) |
| 45 to 59 Minutes | 0 (0.0%) | 0 (0.0%) |
| 60 to 89 Minutes | 0 (0.0%) | 0 (0.0%) |
| 90 or more Minutes | 0 (0.0%) | 0 (0.0%) |
Time of Departure to Work by Sex in Cherokee
The most frequent times of departure to work in Cherokee are 8:00 AM to 8:29 AM (115, 34.6%) for males and 9:00 AM to 9:59 AM (67, 26.5%) for females.
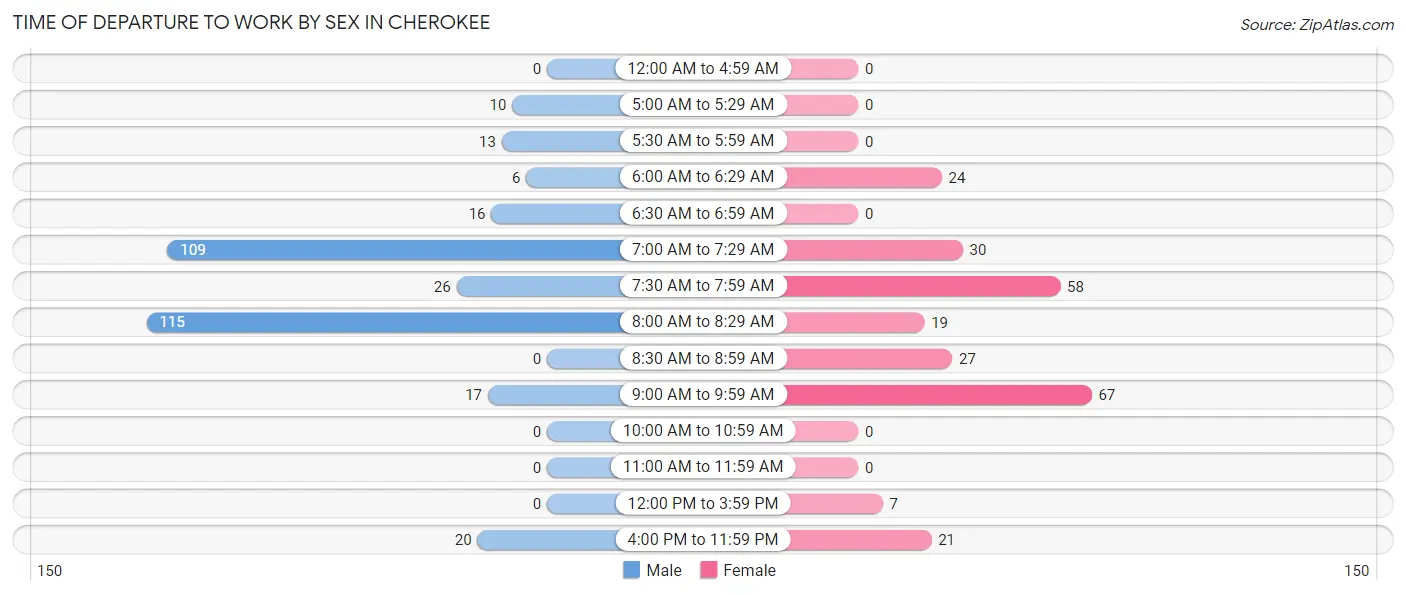
| Time of Departure | Male | Female |
| 12:00 AM to 4:59 AM | 0 (0.0%) | 0 (0.0%) |
| 5:00 AM to 5:29 AM | 10 (3.0%) | 0 (0.0%) |
| 5:30 AM to 5:59 AM | 13 (3.9%) | 0 (0.0%) |
| 6:00 AM to 6:29 AM | 6 (1.8%) | 24 (9.5%) |
| 6:30 AM to 6:59 AM | 16 (4.8%) | 0 (0.0%) |
| 7:00 AM to 7:29 AM | 109 (32.8%) | 30 (11.9%) |
| 7:30 AM to 7:59 AM | 26 (7.8%) | 58 (22.9%) |
| 8:00 AM to 8:29 AM | 115 (34.6%) | 19 (7.5%) |
| 8:30 AM to 8:59 AM | 0 (0.0%) | 27 (10.7%) |
| 9:00 AM to 9:59 AM | 17 (5.1%) | 67 (26.5%) |
| 10:00 AM to 10:59 AM | 0 (0.0%) | 0 (0.0%) |
| 11:00 AM to 11:59 AM | 0 (0.0%) | 0 (0.0%) |
| 12:00 PM to 3:59 PM | 0 (0.0%) | 7 (2.8%) |
| 4:00 PM to 11:59 PM | 20 (6.0%) | 21 (8.3%) |
| Total | 332 (100.0%) | 253 (100.0%) |
Housing Occupancy in Cherokee
Occupancy by Ownership in Cherokee
Of the total 749 dwellings in Cherokee, owner-occupied units account for 448 (59.8%), while renter-occupied units make up 301 (40.2%).
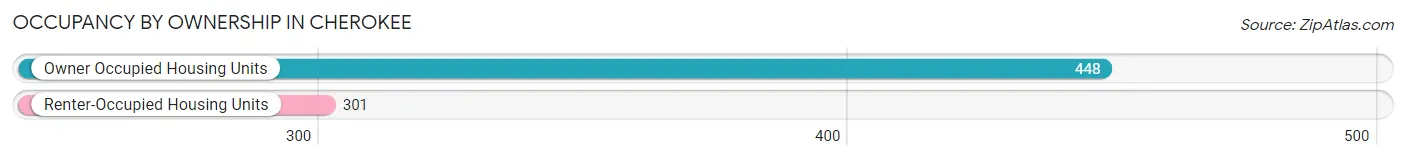
| Occupancy | # Housing Units | % Housing Units |
| Owner Occupied Housing Units | 448 | 59.8% |
| Renter-Occupied Housing Units | 301 | 40.2% |
| Total Occupied Housing Units | 749 | 100.0% |
Occupancy by Household Size in Cherokee
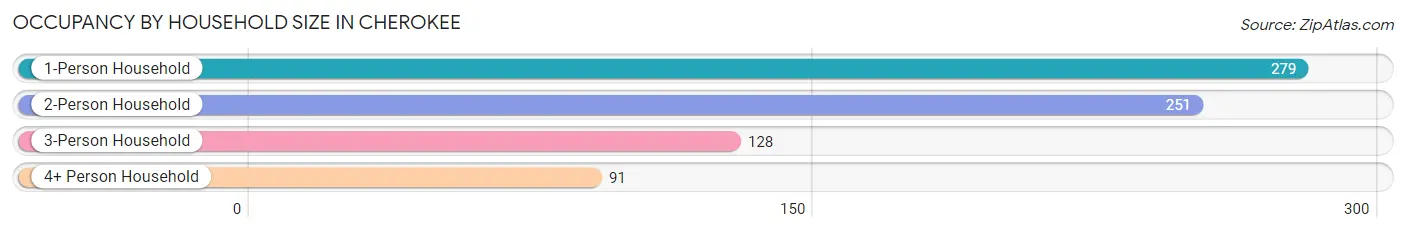
| Household Size | # Housing Units | % Housing Units |
| 1-Person Household | 279 | 37.2% |
| 2-Person Household | 251 | 33.5% |
| 3-Person Household | 128 | 17.1% |
| 4+ Person Household | 91 | 12.1% |
| Total Housing Units | 749 | 100.0% |
Occupancy by Ownership by Household Size in Cherokee
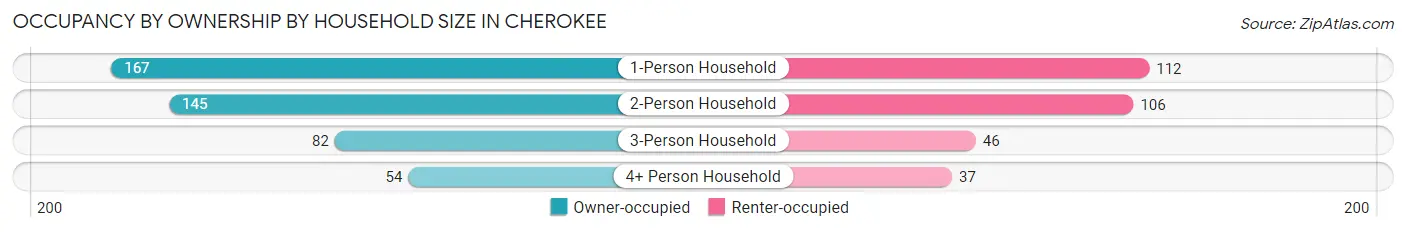
| Household Size | Owner-occupied | Renter-occupied |
| 1-Person Household | 167 (59.9%) | 112 (40.1%) |
| 2-Person Household | 145 (57.8%) | 106 (42.2%) |
| 3-Person Household | 82 (64.1%) | 46 (35.9%) |
| 4+ Person Household | 54 (59.3%) | 37 (40.7%) |
| Total Housing Units | 448 (59.8%) | 301 (40.2%) |
Occupancy by Educational Attainment in Cherokee
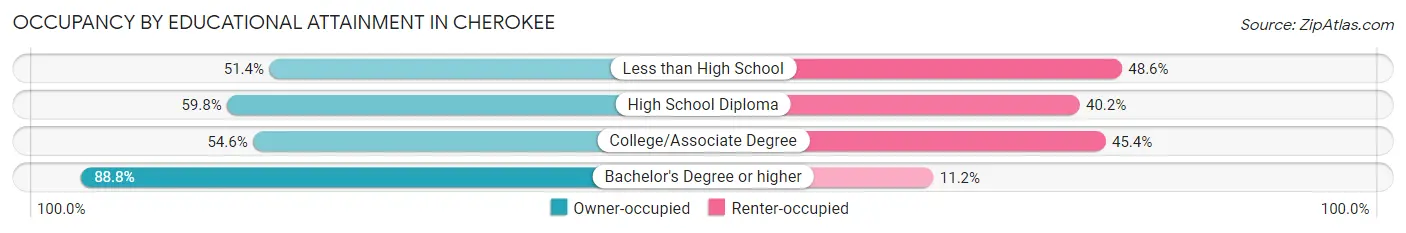
| Household Size | Owner-occupied | Renter-occupied |
| Less than High School | 74 (51.4%) | 70 (48.6%) |
| High School Diploma | 153 (59.8%) | 103 (40.2%) |
| College/Associate Degree | 142 (54.6%) | 118 (45.4%) |
| Bachelor's Degree or higher | 79 (88.8%) | 10 (11.2%) |
Occupancy by Age of Householder in Cherokee
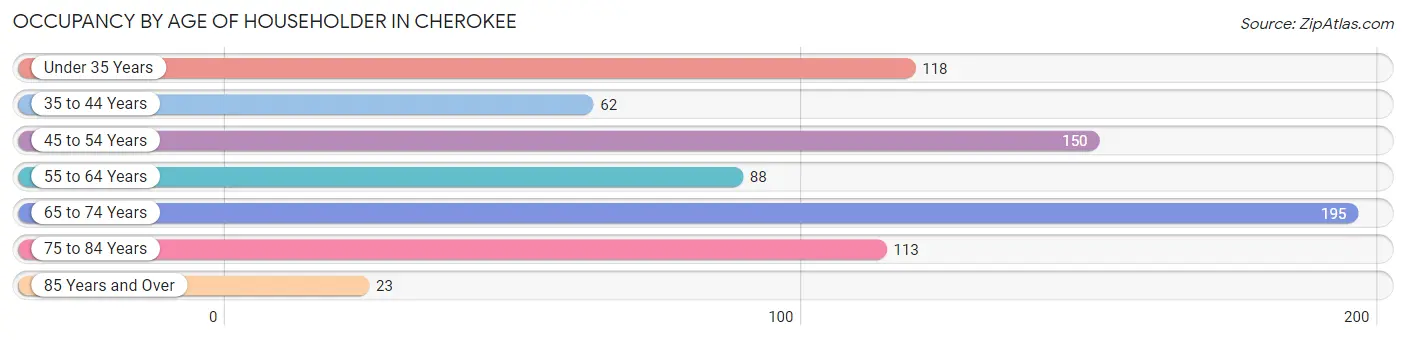
| Age Bracket | # Households | % Households |
| Under 35 Years | 118 | 15.8% |
| 35 to 44 Years | 62 | 8.3% |
| 45 to 54 Years | 150 | 20.0% |
| 55 to 64 Years | 88 | 11.7% |
| 65 to 74 Years | 195 | 26.0% |
| 75 to 84 Years | 113 | 15.1% |
| 85 Years and Over | 23 | 3.1% |
| Total | 749 | 100.0% |
Housing Finances in Cherokee
Median Income by Occupancy in Cherokee
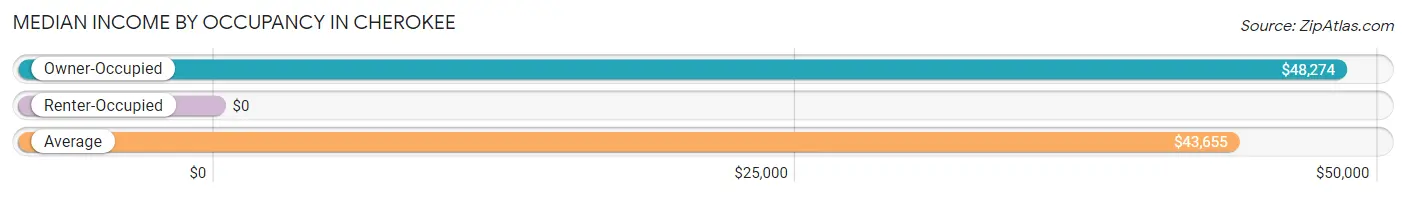
| Occupancy Type | # Households | Median Income |
| Owner-Occupied | 448 (59.8%) | $48,274 |
| Renter-Occupied | 301 (40.2%) | $0 |
| Average | 749 (100.0%) | $43,655 |
Occupancy by Householder Income Bracket in Cherokee
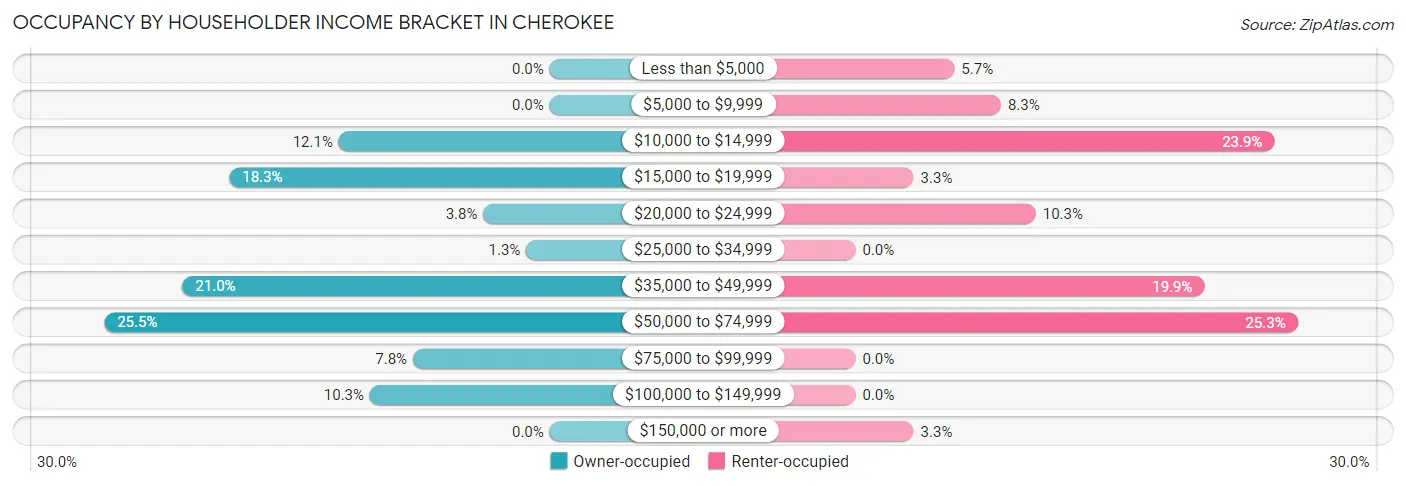
| Income Bracket | Owner-occupied | Renter-occupied |
| Less than $5,000 | 0 (0.0%) | 17 (5.7%) |
| $5,000 to $9,999 | 0 (0.0%) | 25 (8.3%) |
| $10,000 to $14,999 | 54 (12.0%) | 72 (23.9%) |
| $15,000 to $19,999 | 82 (18.3%) | 10 (3.3%) |
| $20,000 to $24,999 | 17 (3.8%) | 31 (10.3%) |
| $25,000 to $34,999 | 6 (1.3%) | 0 (0.0%) |
| $35,000 to $49,999 | 94 (21.0%) | 60 (19.9%) |
| $50,000 to $74,999 | 114 (25.5%) | 76 (25.3%) |
| $75,000 to $99,999 | 35 (7.8%) | 0 (0.0%) |
| $100,000 to $149,999 | 46 (10.3%) | 0 (0.0%) |
| $150,000 or more | 0 (0.0%) | 10 (3.3%) |
| Total | 448 (100.0%) | 301 (100.0%) |
Monthly Housing Cost Tiers in Cherokee
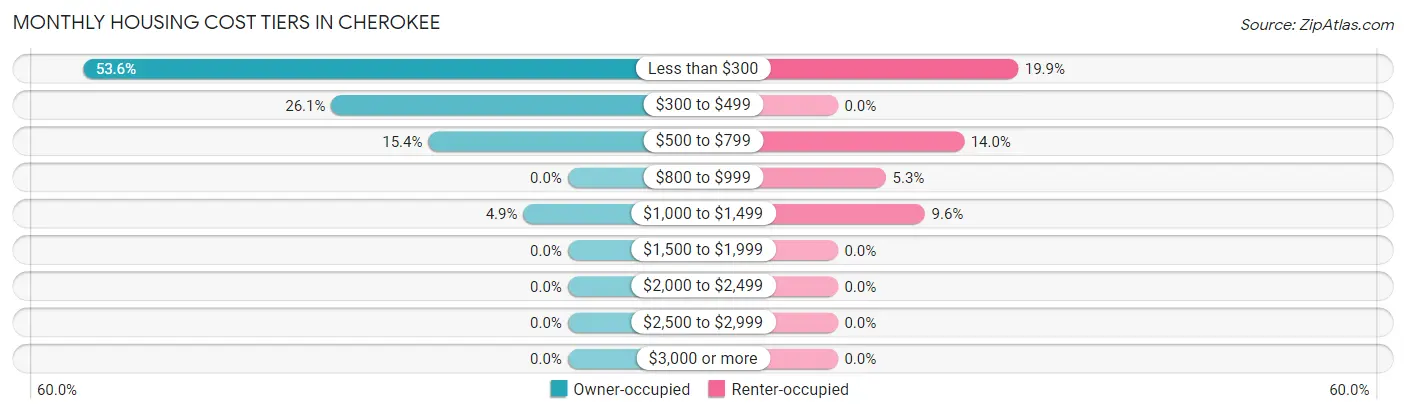
| Monthly Cost | Owner-occupied | Renter-occupied |
| Less than $300 | 240 (53.6%) | 60 (19.9%) |
| $300 to $499 | 117 (26.1%) | 0 (0.0%) |
| $500 to $799 | 69 (15.4%) | 42 (14.0%) |
| $800 to $999 | 0 (0.0%) | 16 (5.3%) |
| $1,000 to $1,499 | 22 (4.9%) | 29 (9.6%) |
| $1,500 to $1,999 | 0 (0.0%) | 0 (0.0%) |
| $2,000 to $2,499 | 0 (0.0%) | 0 (0.0%) |
| $2,500 to $2,999 | 0 (0.0%) | 0 (0.0%) |
| $3,000 or more | 0 (0.0%) | 0 (0.0%) |
| Total | 448 (100.0%) | 301 (100.0%) |
Physical Housing Characteristics in Cherokee
Housing Structures in Cherokee
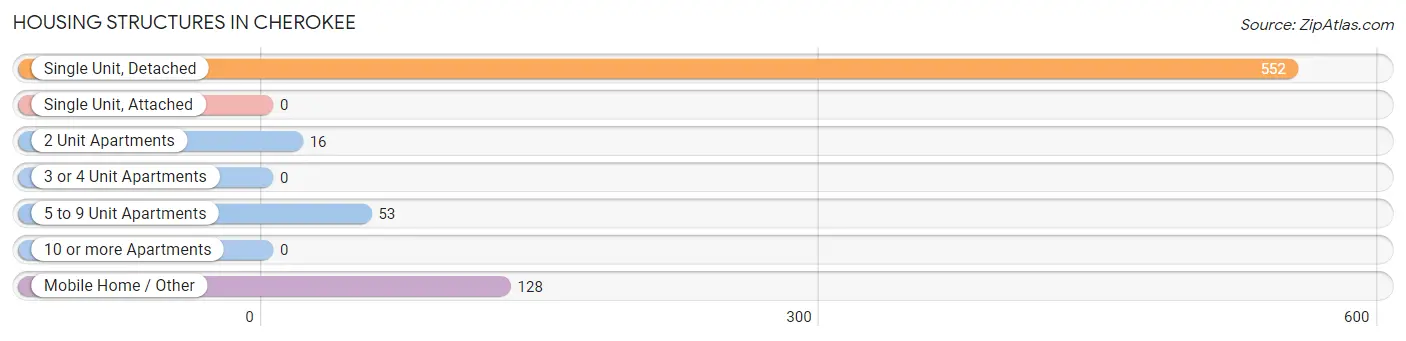
| Structure Type | # Housing Units | % Housing Units |
| Single Unit, Detached | 552 | 73.7% |
| Single Unit, Attached | 0 | 0.0% |
| 2 Unit Apartments | 16 | 2.1% |
| 3 or 4 Unit Apartments | 0 | 0.0% |
| 5 to 9 Unit Apartments | 53 | 7.1% |
| 10 or more Apartments | 0 | 0.0% |
| Mobile Home / Other | 128 | 17.1% |
| Total | 749 | 100.0% |
Housing Structures by Occupancy in Cherokee
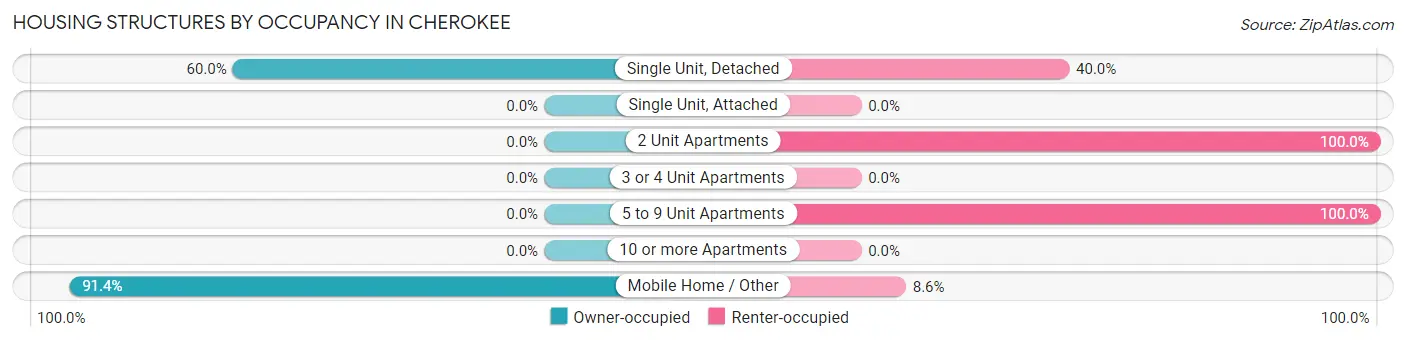
| Structure Type | Owner-occupied | Renter-occupied |
| Single Unit, Detached | 331 (60.0%) | 221 (40.0%) |
| Single Unit, Attached | 0 (0.0%) | 0 (0.0%) |
| 2 Unit Apartments | 0 (0.0%) | 16 (100.0%) |
| 3 or 4 Unit Apartments | 0 (0.0%) | 0 (0.0%) |
| 5 to 9 Unit Apartments | 0 (0.0%) | 53 (100.0%) |
| 10 or more Apartments | 0 (0.0%) | 0 (0.0%) |
| Mobile Home / Other | 117 (91.4%) | 11 (8.6%) |
| Total | 448 (59.8%) | 301 (40.2%) |
Housing Structures by Number of Rooms in Cherokee
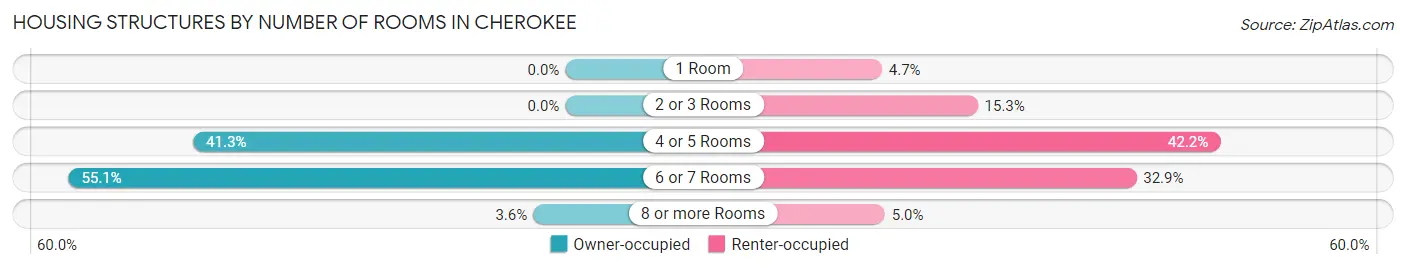
| Number of Rooms | Owner-occupied | Renter-occupied |
| 1 Room | 0 (0.0%) | 14 (4.6%) |
| 2 or 3 Rooms | 0 (0.0%) | 46 (15.3%) |
| 4 or 5 Rooms | 185 (41.3%) | 127 (42.2%) |
| 6 or 7 Rooms | 247 (55.1%) | 99 (32.9%) |
| 8 or more Rooms | 16 (3.6%) | 15 (5.0%) |
| Total | 448 (100.0%) | 301 (100.0%) |
Housing Structure by Heating Type in Cherokee
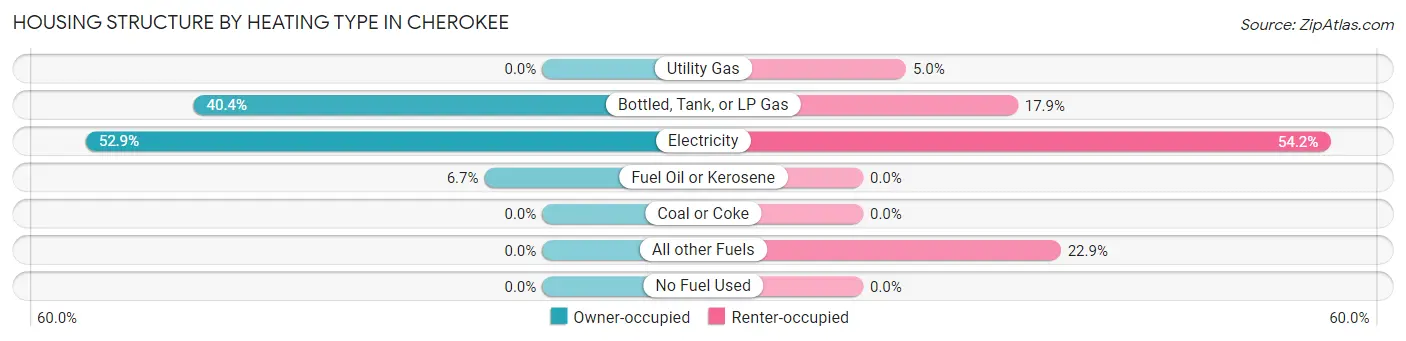
| Heating Type | Owner-occupied | Renter-occupied |
| Utility Gas | 0 (0.0%) | 15 (5.0%) |
| Bottled, Tank, or LP Gas | 181 (40.4%) | 54 (17.9%) |
| Electricity | 237 (52.9%) | 163 (54.1%) |
| Fuel Oil or Kerosene | 30 (6.7%) | 0 (0.0%) |
| Coal or Coke | 0 (0.0%) | 0 (0.0%) |
| All other Fuels | 0 (0.0%) | 69 (22.9%) |
| No Fuel Used | 0 (0.0%) | 0 (0.0%) |
| Total | 448 (100.0%) | 301 (100.0%) |
Household Vehicle Usage in Cherokee
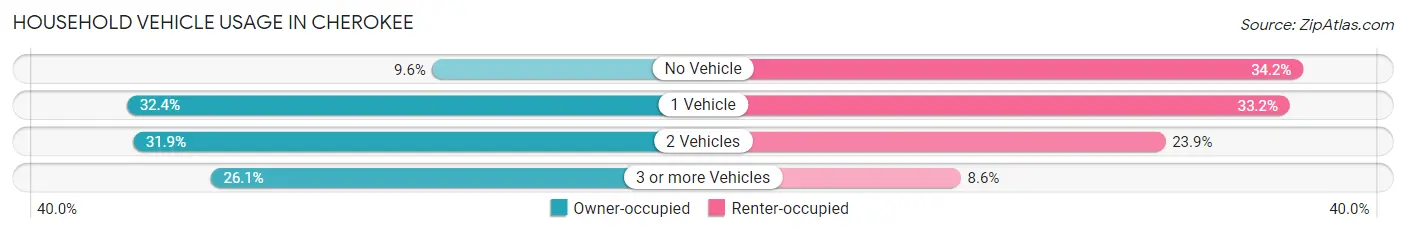
| Vehicles per Household | Owner-occupied | Renter-occupied |
| No Vehicle | 43 (9.6%) | 103 (34.2%) |
| 1 Vehicle | 145 (32.4%) | 100 (33.2%) |
| 2 Vehicles | 143 (31.9%) | 72 (23.9%) |
| 3 or more Vehicles | 117 (26.1%) | 26 (8.6%) |
| Total | 448 (100.0%) | 301 (100.0%) |
Real Estate & Mortgages in Cherokee
Real Estate and Mortgage Overview in Cherokee
| Characteristic | Without Mortgage | With Mortgage |
| Housing Units | 372 | 76 |
| Median Property Value | $139,100 | $0 |
| Median Household Income | $49,345 | $0 |
| Monthly Housing Costs | $273 | $0 |
| Real Estate Taxes | $199 | $62 |
Property Value by Mortgage Status in Cherokee
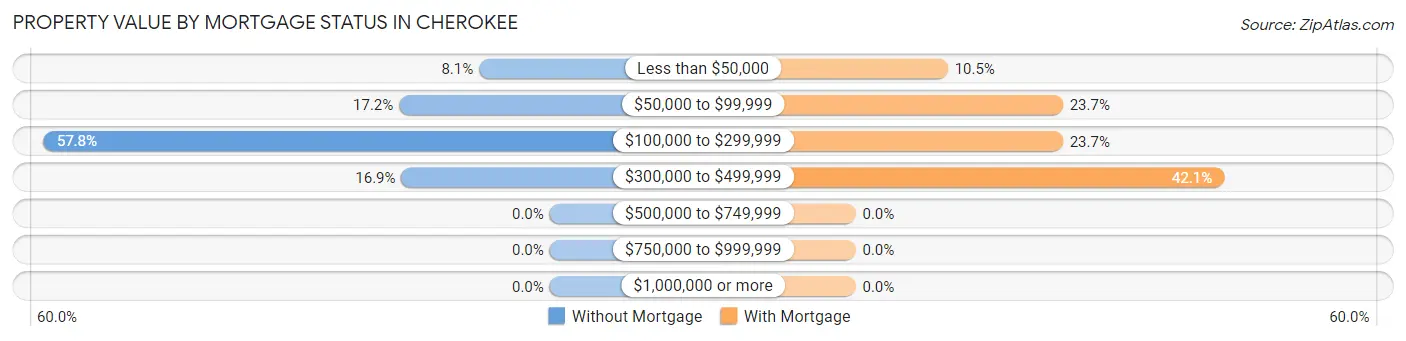
| Property Value | Without Mortgage | With Mortgage |
| Less than $50,000 | 30 (8.1%) | 8 (10.5%) |
| $50,000 to $99,999 | 64 (17.2%) | 18 (23.7%) |
| $100,000 to $299,999 | 215 (57.8%) | 18 (23.7%) |
| $300,000 to $499,999 | 63 (16.9%) | 32 (42.1%) |
| $500,000 to $749,999 | 0 (0.0%) | 0 (0.0%) |
| $750,000 to $999,999 | 0 (0.0%) | 0 (0.0%) |
| $1,000,000 or more | 0 (0.0%) | 0 (0.0%) |
| Total | 372 (100.0%) | 76 (100.0%) |
Household Income by Mortgage Status in Cherokee
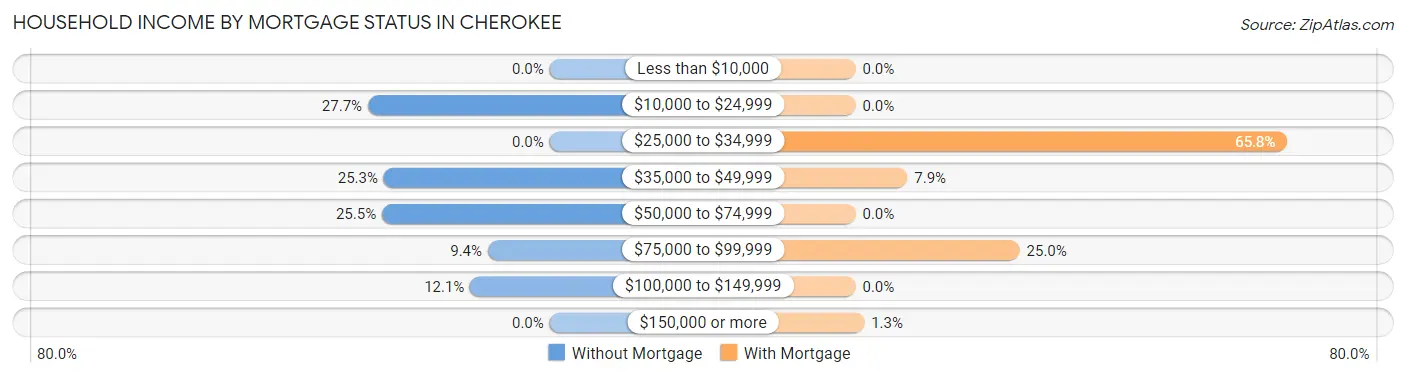
| Household Income | Without Mortgage | With Mortgage |
| Less than $10,000 | 0 (0.0%) | 0 (0.0%) |
| $10,000 to $24,999 | 103 (27.7%) | 0 (0.0%) |
| $25,000 to $34,999 | 0 (0.0%) | 50 (65.8%) |
| $35,000 to $49,999 | 94 (25.3%) | 6 (7.9%) |
| $50,000 to $74,999 | 95 (25.5%) | 0 (0.0%) |
| $75,000 to $99,999 | 35 (9.4%) | 19 (25.0%) |
| $100,000 to $149,999 | 45 (12.1%) | 0 (0.0%) |
| $150,000 or more | 0 (0.0%) | 1 (1.3%) |
| Total | 372 (100.0%) | 76 (100.0%) |
Property Value to Household Income Ratio in Cherokee
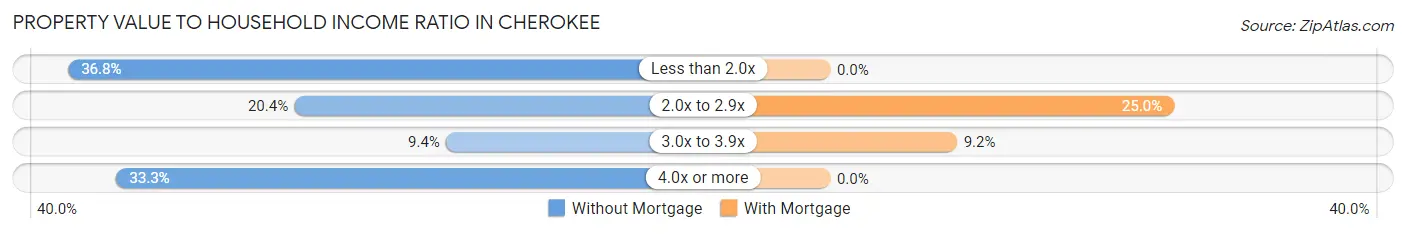
| Value-to-Income Ratio | Without Mortgage | With Mortgage |
| Less than 2.0x | 137 (36.8%) | 0 (0.0%) |
| 2.0x to 2.9x | 76 (20.4%) | 19 (25.0%) |
| 3.0x to 3.9x | 35 (9.4%) | 7 (9.2%) |
| 4.0x or more | 124 (33.3%) | 0 (0.0%) |
| Total | 372 (100.0%) | 76 (100.0%) |
Real Estate Taxes by Mortgage Status in Cherokee
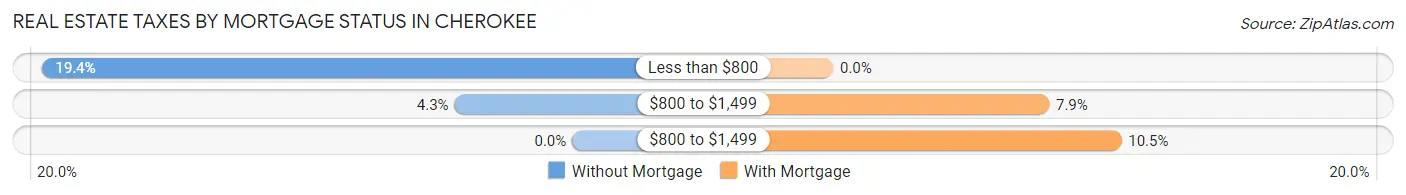
| Property Taxes | Without Mortgage | With Mortgage |
| Less than $800 | 72 (19.4%) | 0 (0.0%) |
| $800 to $1,499 | 16 (4.3%) | 6 (7.9%) |
| $800 to $1,499 | 0 (0.0%) | 8 (10.5%) |
| Total | 372 (100.0%) | 76 (100.0%) |
Health & Disability in Cherokee
Health Insurance Coverage by Age in Cherokee
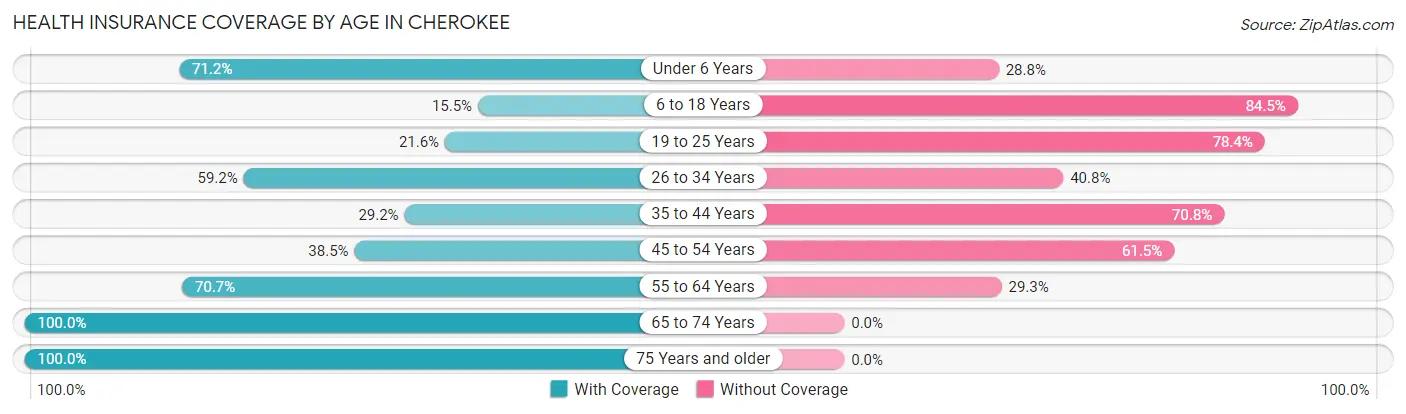
| Age Bracket | With Coverage | Without Coverage |
| Under 6 Years | 89 (71.2%) | 36 (28.8%) |
| 6 to 18 Years | 30 (15.5%) | 164 (84.5%) |
| 19 to 25 Years | 43 (21.6%) | 156 (78.4%) |
| 26 to 34 Years | 71 (59.2%) | 49 (40.8%) |
| 35 to 44 Years | 35 (29.2%) | 85 (70.8%) |
| 45 to 54 Years | 87 (38.5%) | 139 (61.5%) |
| 55 to 64 Years | 147 (70.7%) | 61 (29.3%) |
| 65 to 74 Years | 237 (100.0%) | 0 (0.0%) |
| 75 Years and older | 152 (100.0%) | 0 (0.0%) |
| Total | 891 (56.4%) | 690 (43.6%) |
Health Insurance Coverage by Citizenship Status in Cherokee
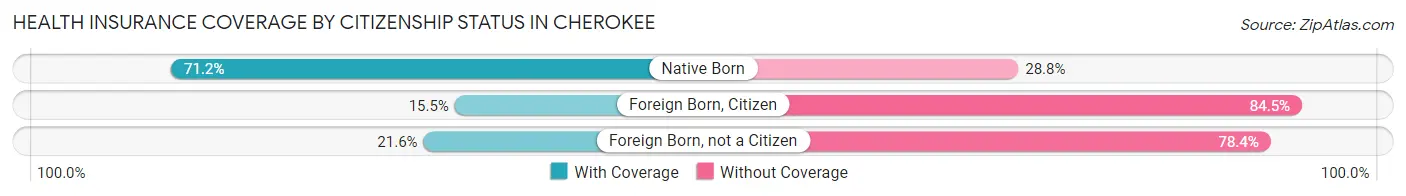
| Citizenship Status | With Coverage | Without Coverage |
| Native Born | 89 (71.2%) | 36 (28.8%) |
| Foreign Born, Citizen | 30 (15.5%) | 164 (84.5%) |
| Foreign Born, not a Citizen | 43 (21.6%) | 156 (78.4%) |
Health Insurance Coverage by Household Income in Cherokee
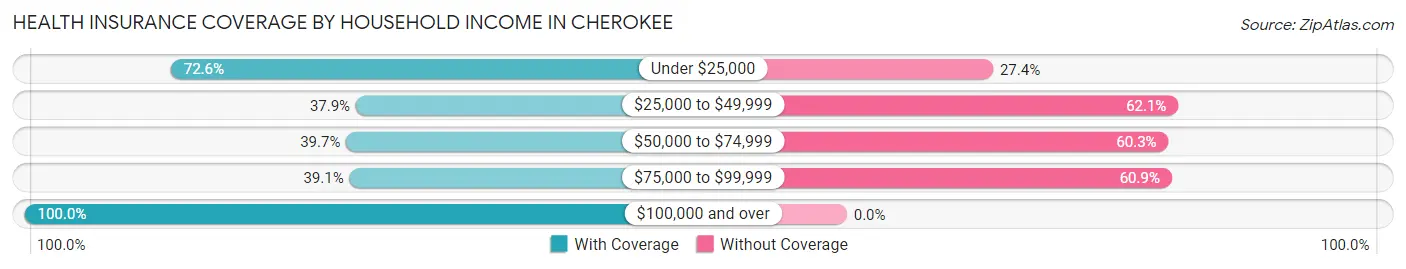
| Household Income | With Coverage | Without Coverage |
| Under $25,000 | 334 (72.6%) | 126 (27.4%) |
| $25,000 to $49,999 | 113 (37.9%) | 185 (62.1%) |
| $50,000 to $74,999 | 213 (39.7%) | 323 (60.3%) |
| $75,000 to $99,999 | 36 (39.1%) | 56 (60.9%) |
| $100,000 and over | 195 (100.0%) | 0 (0.0%) |
Public vs Private Health Insurance Coverage by Age in Cherokee
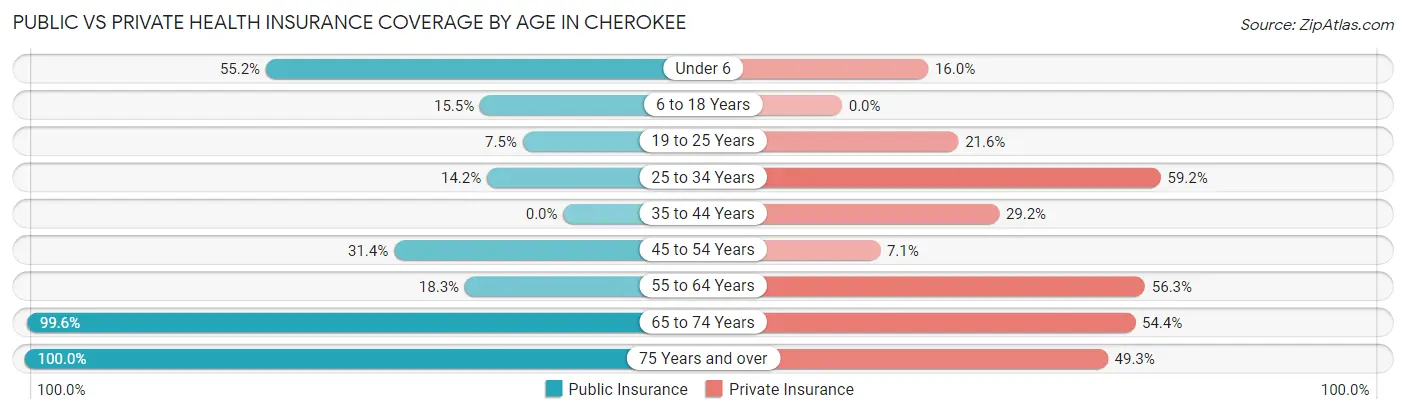
| Age Bracket | Public Insurance | Private Insurance |
| Under 6 | 69 (55.2%) | 20 (16.0%) |
| 6 to 18 Years | 30 (15.5%) | 0 (0.0%) |
| 19 to 25 Years | 15 (7.5%) | 43 (21.6%) |
| 25 to 34 Years | 17 (14.2%) | 71 (59.2%) |
| 35 to 44 Years | 0 (0.0%) | 35 (29.2%) |
| 45 to 54 Years | 71 (31.4%) | 16 (7.1%) |
| 55 to 64 Years | 38 (18.3%) | 117 (56.2%) |
| 65 to 74 Years | 236 (99.6%) | 129 (54.4%) |
| 75 Years and over | 152 (100.0%) | 75 (49.3%) |
| Total | 628 (39.7%) | 506 (32.0%) |
Disability Status by Sex by Age in Cherokee
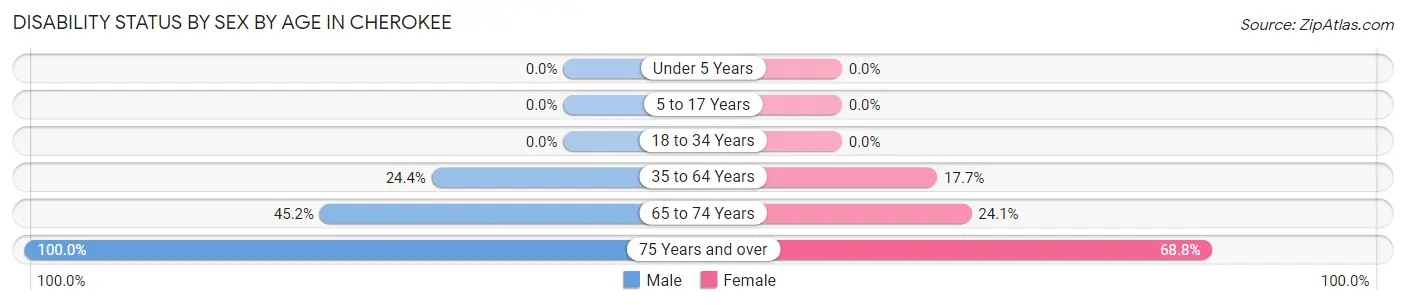
| Age Bracket | Male | Female |
| Under 5 Years | 0 (0.0%) | 0 (0.0%) |
| 5 to 17 Years | 0 (0.0%) | 0 (0.0%) |
| 18 to 34 Years | 0 (0.0%) | 0 (0.0%) |
| 35 to 64 Years | 76 (24.4%) | 43 (17.7%) |
| 65 to 74 Years | 47 (45.2%) | 32 (24.1%) |
| 75 Years and over | 72 (100.0%) | 55 (68.8%) |
Disability Class by Sex by Age in Cherokee
Disability Class: Hearing Difficulty
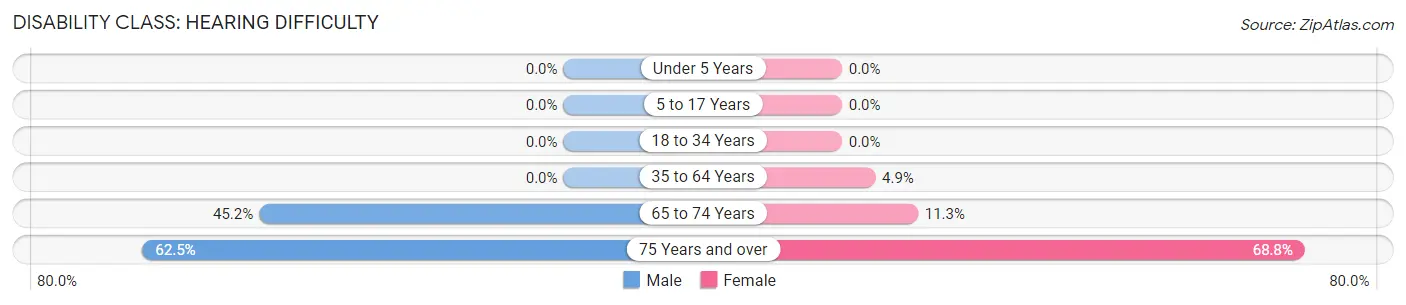
| Age Bracket | Male | Female |
| Under 5 Years | 0 (0.0%) | 0 (0.0%) |
| 5 to 17 Years | 0 (0.0%) | 0 (0.0%) |
| 18 to 34 Years | 0 (0.0%) | 0 (0.0%) |
| 35 to 64 Years | 0 (0.0%) | 12 (4.9%) |
| 65 to 74 Years | 47 (45.2%) | 15 (11.3%) |
| 75 Years and over | 45 (62.5%) | 55 (68.8%) |
Disability Class: Vision Difficulty
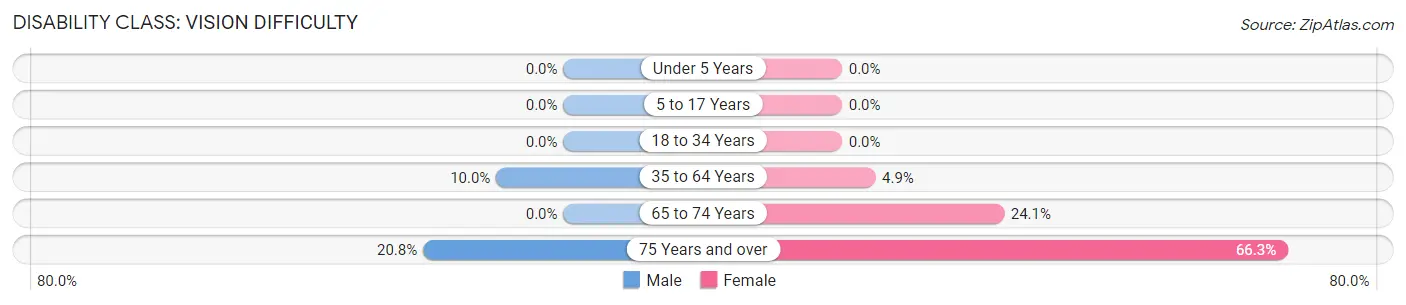
| Age Bracket | Male | Female |
| Under 5 Years | 0 (0.0%) | 0 (0.0%) |
| 5 to 17 Years | 0 (0.0%) | 0 (0.0%) |
| 18 to 34 Years | 0 (0.0%) | 0 (0.0%) |
| 35 to 64 Years | 31 (10.0%) | 12 (4.9%) |
| 65 to 74 Years | 0 (0.0%) | 32 (24.1%) |
| 75 Years and over | 15 (20.8%) | 53 (66.2%) |
Disability Class: Cognitive Difficulty
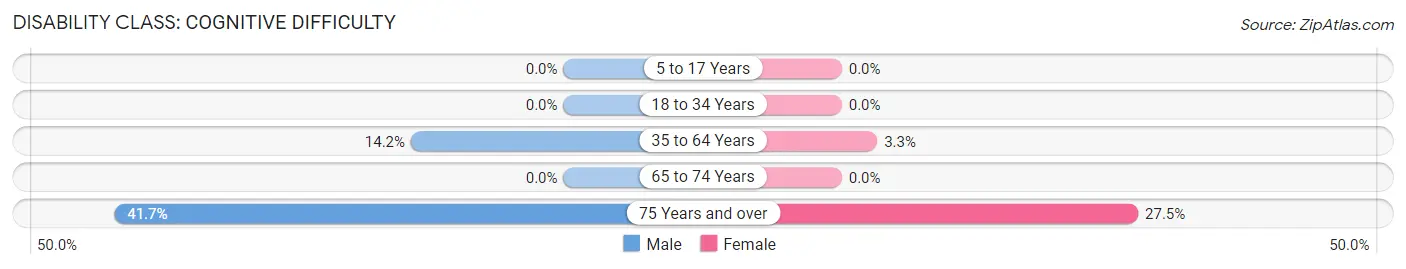
| Age Bracket | Male | Female |
| 5 to 17 Years | 0 (0.0%) | 0 (0.0%) |
| 18 to 34 Years | 0 (0.0%) | 0 (0.0%) |
| 35 to 64 Years | 44 (14.1%) | 8 (3.3%) |
| 65 to 74 Years | 0 (0.0%) | 0 (0.0%) |
| 75 Years and over | 30 (41.7%) | 22 (27.5%) |
Disability Class: Ambulatory Difficulty
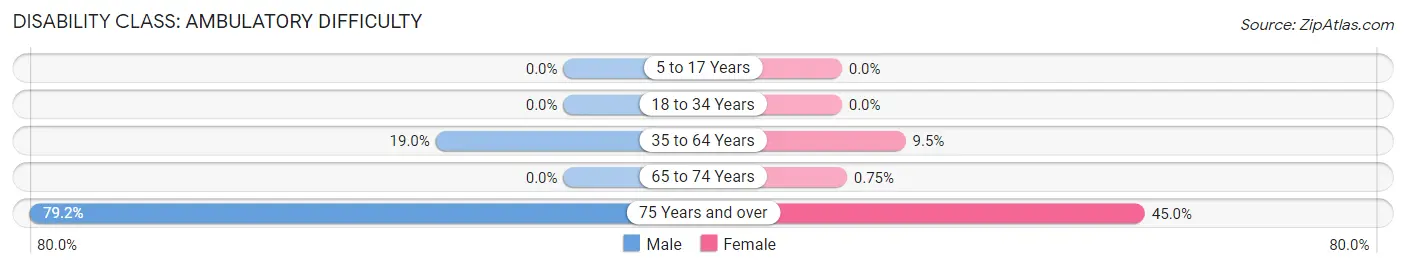
| Age Bracket | Male | Female |
| 5 to 17 Years | 0 (0.0%) | 0 (0.0%) |
| 18 to 34 Years | 0 (0.0%) | 0 (0.0%) |
| 35 to 64 Years | 59 (19.0%) | 23 (9.5%) |
| 65 to 74 Years | 0 (0.0%) | 1 (0.7%) |
| 75 Years and over | 57 (79.2%) | 36 (45.0%) |
Disability Class: Self-Care Difficulty
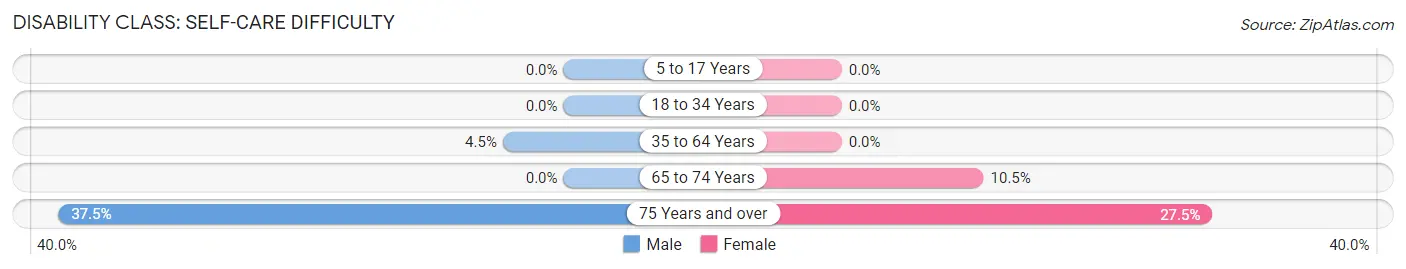
| Age Bracket | Male | Female |
| 5 to 17 Years | 0 (0.0%) | 0 (0.0%) |
| 18 to 34 Years | 0 (0.0%) | 0 (0.0%) |
| 35 to 64 Years | 14 (4.5%) | 0 (0.0%) |
| 65 to 74 Years | 0 (0.0%) | 14 (10.5%) |
| 75 Years and over | 27 (37.5%) | 22 (27.5%) |
Technology Access in Cherokee
Computing Device Access in Cherokee
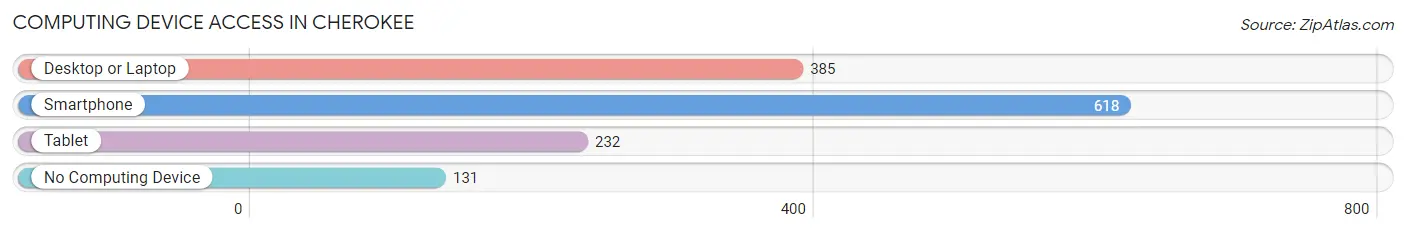
| Device Type | # Households | % Households |
| Desktop or Laptop | 385 | 51.4% |
| Smartphone | 618 | 82.5% |
| Tablet | 232 | 31.0% |
| No Computing Device | 131 | 17.5% |
| Total | 749 | 100.0% |
Internet Access in Cherokee
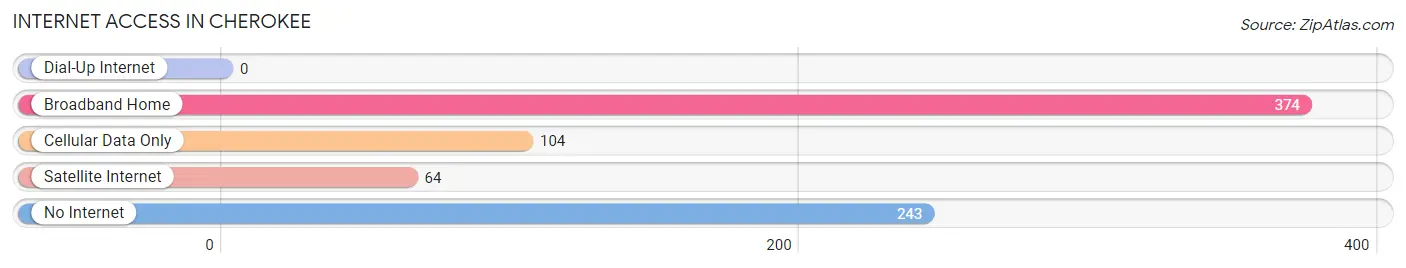
| Internet Type | # Households | % Households |
| Dial-Up Internet | 0 | 0.0% |
| Broadband Home | 374 | 49.9% |
| Cellular Data Only | 104 | 13.9% |
| Satellite Internet | 64 | 8.5% |
| No Internet | 243 | 32.4% |
| Total | 749 | 100.0% |
Cherokee Summary
Cherokee, North Carolina is a small town located in the western part of the state, in the Great Smoky Mountains. It is the home of the Eastern Band of the Cherokee Nation, and is the only federally recognized Indian reservation in North Carolina. The town is situated in the Qualla Boundary, a land trust of the Eastern Band of the Cherokee Nation, and is the largest Native American reservation east of the Mississippi River. The town is located in Swain County, and is bordered by the Nantahala National Forest to the north, the Great Smoky Mountains National Park to the east, and the Blue Ridge Parkway to the south.
Geography
Cherokee is located in the Great Smoky Mountains of western North Carolina, in the Qualla Boundary. The town is situated at an elevation of 2,000 feet, and is surrounded by the Nantahala National Forest to the north, the Great Smoky Mountains National Park to the east, and the Blue Ridge Parkway to the south. The town is located in Swain County, and is approximately 30 miles west of Asheville, North Carolina.
The town is located in a temperate climate, with mild winters and warm summers. The average annual temperature is around 60 degrees Fahrenheit, with an average annual precipitation of around 50 inches. The town is located in a humid subtropical climate, with an average annual snowfall of around 10 inches.
Economy
Cherokee is a small town with a population of around 2,000 people. The town is home to the Eastern Band of the Cherokee Nation, and is the only federally recognized Indian reservation in North Carolina. The town is home to the Harrah's Cherokee Casino Resort, which is the largest employer in the area. The casino employs over 3,000 people, and is the largest employer in the county. Other major employers in the area include the Great Smoky Mountains National Park, the Blue Ridge Parkway, and the Qualla Arts and Crafts Mutual.
The town is also home to a variety of small businesses, including restaurants, shops, and galleries. The town is also home to the Museum of the Cherokee Indian, which is dedicated to preserving and sharing the history and culture of the Cherokee people.
Demographics
As of the 2010 census, the population of Cherokee was 2,138. The racial makeup of the town was 95.3% Native American, 2.2% White, 0.2% African American, 0.2% Asian, 0.1% Pacific Islander, 0.2% from other races, and 1.9% from two or more races. The median age of the population was 38.2 years, and the median household income was $25,972.
Conclusion
Cherokee, North Carolina is a small town located in the western part of the state, in the Great Smoky Mountains. It is the home of the Eastern Band of the Cherokee Nation, and is the only federally recognized Indian reservation in North Carolina. The town is situated in the Qualla Boundary, a land trust of the Eastern Band of the Cherokee Nation, and is the largest Native American reservation east of the Mississippi River. The town is located in Swain County, and is bordered by the Nantahala National Forest to the north, the Great Smoky Mountains National Park to the east, and the Blue Ridge Parkway to the south. The town is home to the Harrah's Cherokee Casino Resort, which is the largest employer in the area, as well as a variety of small businesses. The population of Cherokee was 2,138 as of the 2010 census, with a median age of 38.2 years and a median household income of $25,972.
Common Questions
What is Per Capita Income in Cherokee?
Per Capita income in Cherokee is $22,828.
What is the Median Family Income in Cherokee?
Median Family Income in Cherokee is $48,906.
What is the Median Household income in Cherokee?
Median Household Income in Cherokee is $43,655.
What is Income or Wage Gap in Cherokee?
Income or Wage Gap in Cherokee is 28.4%.
Women in Cherokee earn 71.6 cents for every dollar earned by a man.
What is Inequality or Gini Index in Cherokee?
Inequality or Gini Index in Cherokee is 0.39.
What is the Total Population of Cherokee?
Total Population of Cherokee is 1,604.
What is the Total Male Population of Cherokee?
Total Male Population of Cherokee is 812.
What is the Total Female Population of Cherokee?
Total Female Population of Cherokee is 792.
What is the Ratio of Males per 100 Females in Cherokee?
There are 102.53 Males per 100 Females in Cherokee.
What is the Ratio of Females per 100 Males in Cherokee?
There are 97.54 Females per 100 Males in Cherokee.
What is the Median Population Age in Cherokee?
Median Population Age in Cherokee is 45.8 Years.
What is the Average Family Size in Cherokee
Average Family Size in Cherokee is 2.7 People.
What is the Average Household Size in Cherokee
Average Household Size in Cherokee is 2.1 People.
How Large is the Labor Force in Cherokee?
There are 628 People in the Labor Forcein in Cherokee.
What is the Percentage of People in the Labor Force in Cherokee?
47.1% of People are in the Labor Force in Cherokee.
What is the Unemployment Rate in Cherokee?
Unemployment Rate in Cherokee is 1.6%.