Cedar Rock, NC Map & Demographics
Cedar Rock Map
Cedar Rock Overview
$45,783
PER CAPITA INCOME
$86,563
AVG FAMILY INCOME
$77,143
AVG HOUSEHOLD INCOME
45.6%
WAGE / INCOME GAP [ % ]
54.4¢/ $1
WAGE / INCOME GAP [ $ ]
0.39
INEQUALITY / GINI INDEX
409
TOTAL POPULATION
221
MALE POPULATION
188
FEMALE POPULATION
117.55
MALES / 100 FEMALES
85.07
FEMALES / 100 MALES
47.6
MEDIAN AGE
3.1
AVG FAMILY SIZE
2.5
AVG HOUSEHOLD SIZE
188
LABOR FORCE [ PEOPLE ]
56.3%
PERCENT IN LABOR FORCE
1.6%
UNEMPLOYMENT RATE
Cedar Rock Area Codes
Income in Cedar Rock
Income Overview in Cedar Rock
Per Capita Income in Cedar Rock is $45,783, while median incomes of families and households are $86,563 and $77,143 respectively.
| Characteristic | Number | Measure |
| Per Capita Income | 409 | $45,783 |
| Median Family Income | 113 | $86,563 |
| Mean Family Income | 113 | $130,328 |
| Median Household Income | 164 | $77,143 |
| Mean Household Income | 164 | $109,640 |
| Income Deficit | 113 | $0 |
| Wage / Income Gap (%) | 409 | 45.62% |
| Wage / Income Gap ($) | 409 | 54.38¢ per $1 |
| Gini / Inequality Index | 409 | 0.39 |
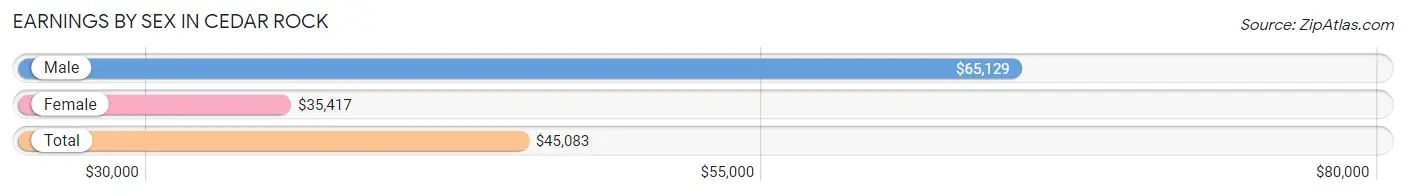
Earnings by Sex in Cedar Rock
Average Earnings in Cedar Rock are $45,083, $65,129 for men and $35,417 for women, a difference of 45.6%.
| Sex | Number | Average Earnings |
| Male | 121 (57.9%) | $65,129 |
| Female | 88 (42.1%) | $35,417 |
| Total | 209 (100.0%) | $45,083 |
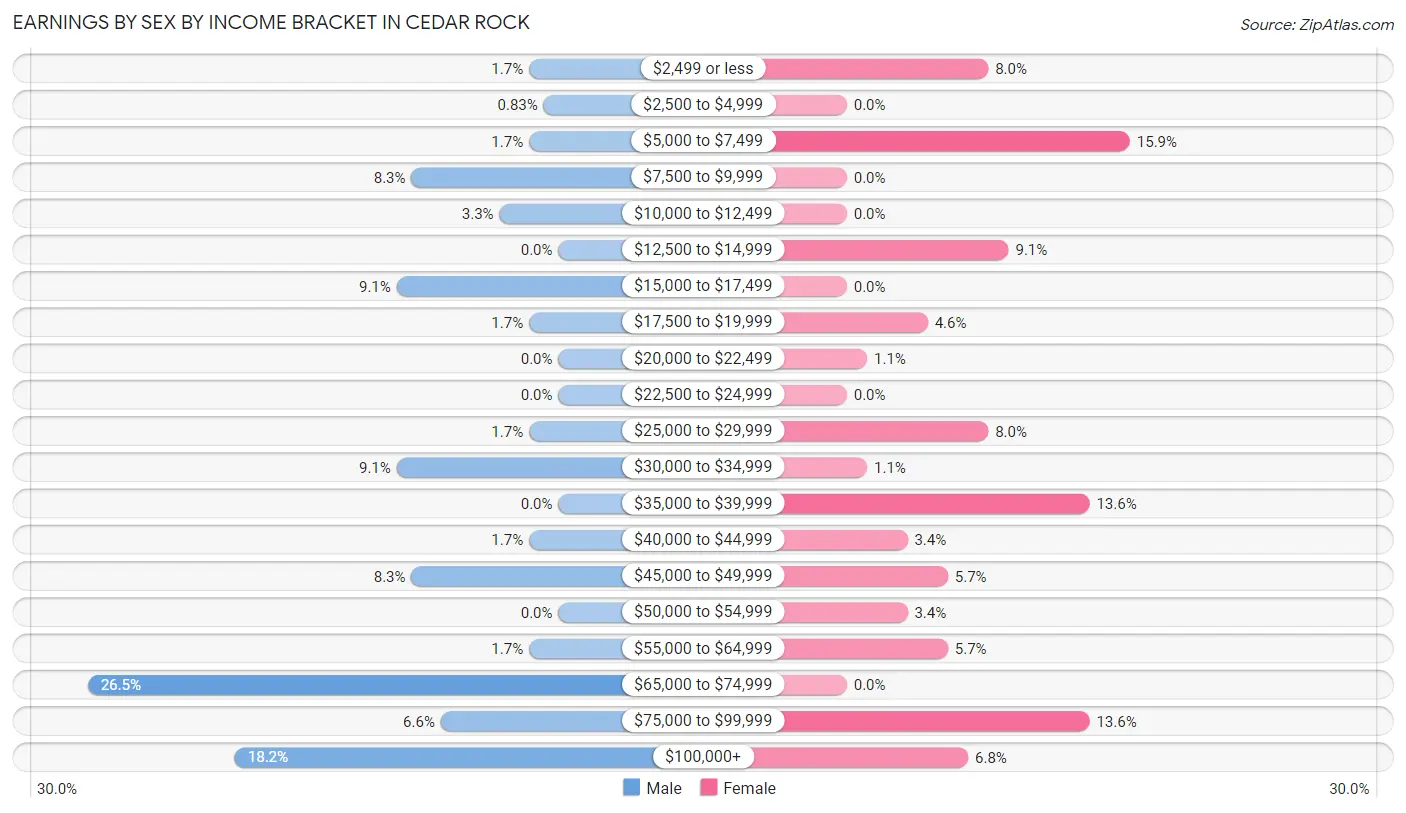
Earnings by Sex by Income Bracket in Cedar Rock
The most common earnings brackets in Cedar Rock are $65,000 to $74,999 for men (32 | 26.5%) and $5,000 to $7,499 for women (14 | 15.9%).
| Income | Male | Female |
| $2,499 or less | 2 (1.7%) | 7 (8.0%) |
| $2,500 to $4,999 | 1 (0.8%) | 0 (0.0%) |
| $5,000 to $7,499 | 2 (1.7%) | 14 (15.9%) |
| $7,500 to $9,999 | 10 (8.3%) | 0 (0.0%) |
| $10,000 to $12,499 | 4 (3.3%) | 0 (0.0%) |
| $12,500 to $14,999 | 0 (0.0%) | 8 (9.1%) |
| $15,000 to $17,499 | 11 (9.1%) | 0 (0.0%) |
| $17,500 to $19,999 | 2 (1.7%) | 4 (4.5%) |
| $20,000 to $22,499 | 0 (0.0%) | 1 (1.1%) |
| $22,500 to $24,999 | 0 (0.0%) | 0 (0.0%) |
| $25,000 to $29,999 | 2 (1.7%) | 7 (8.0%) |
| $30,000 to $34,999 | 11 (9.1%) | 1 (1.1%) |
| $35,000 to $39,999 | 0 (0.0%) | 12 (13.6%) |
| $40,000 to $44,999 | 2 (1.7%) | 3 (3.4%) |
| $45,000 to $49,999 | 10 (8.3%) | 5 (5.7%) |
| $50,000 to $54,999 | 0 (0.0%) | 3 (3.4%) |
| $55,000 to $64,999 | 2 (1.7%) | 5 (5.7%) |
| $65,000 to $74,999 | 32 (26.5%) | 0 (0.0%) |
| $75,000 to $99,999 | 8 (6.6%) | 12 (13.6%) |
| $100,000+ | 22 (18.2%) | 6 (6.8%) |
| Total | 121 (100.0%) | 88 (100.0%) |
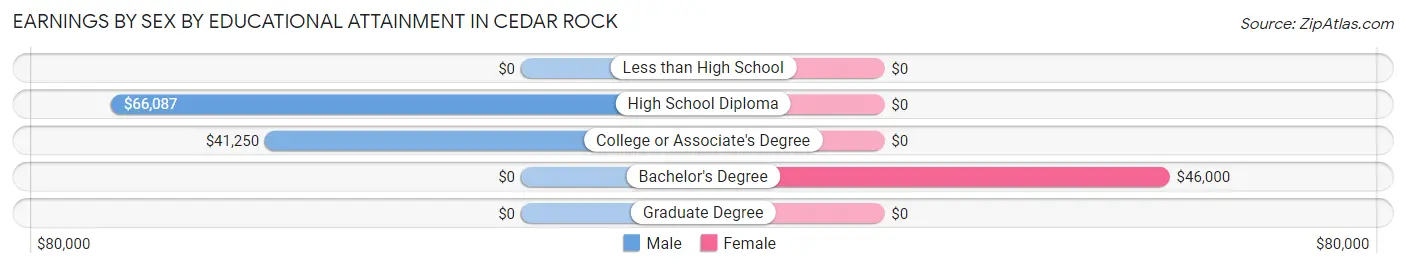
Earnings by Sex by Educational Attainment in Cedar Rock
Average earnings in Cedar Rock are $65,603 for men and $36,146 for women, a difference of 44.9%. Men with an educational attainment of high school diploma enjoy the highest average annual earnings of $66,087, while those with college or associate's degree education earn the least with $41,250. Women with an educational attainment of bachelor's degree earn the most with the average annual earnings of $46,000, while those with bachelor's degree education have the smallest earnings of $46,000.
| Educational Attainment | Male Income | Female Income |
| Less than High School | - | - |
| High School Diploma | $66,087 | $0 |
| College or Associate's Degree | $41,250 | $0 |
| Bachelor's Degree | - | - |
| Graduate Degree | - | - |
| Total | $65,603 | $36,146 |
Family Income in Cedar Rock
Family Income Brackets in Cedar Rock
According to the Cedar Rock family income data, there are 30 families falling into the $75,000 to $99,999 income range, which is the most common income bracket and makes up 26.6% of all families.
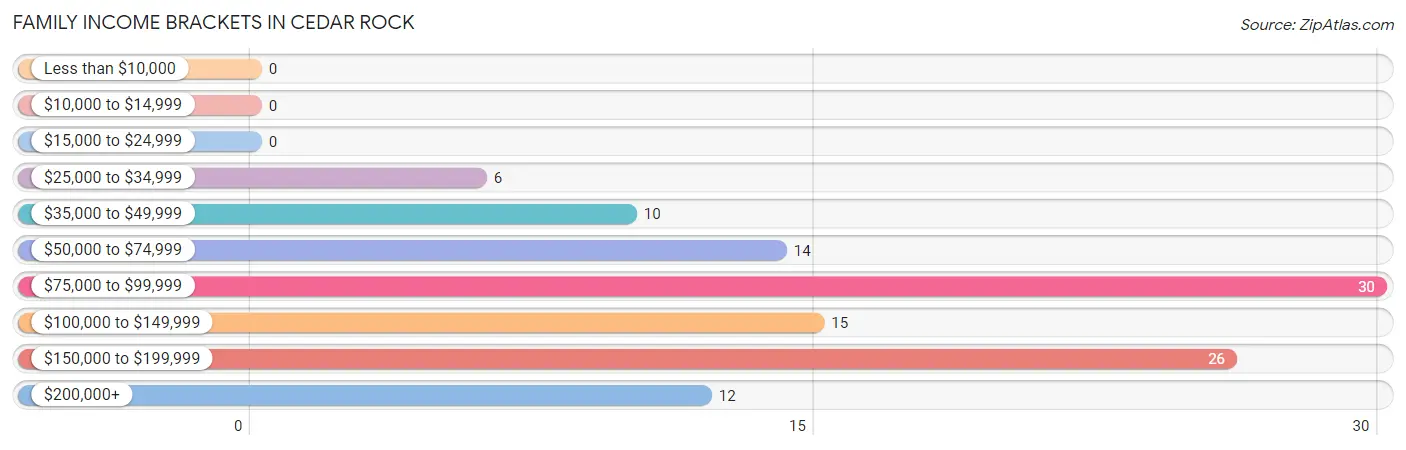
| Income Bracket | # Families | % Families |
| Less than $10,000 | 0 | 0.0% |
| $10,000 to $14,999 | 0 | 0.0% |
| $15,000 to $24,999 | 0 | 0.0% |
| $25,000 to $34,999 | 6 | 5.3% |
| $35,000 to $49,999 | 10 | 8.8% |
| $50,000 to $74,999 | 14 | 12.4% |
| $75,000 to $99,999 | 30 | 26.5% |
| $100,000 to $149,999 | 15 | 13.3% |
| $150,000 to $199,999 | 26 | 23.0% |
| $200,000+ | 12 | 10.6% |
Family Income by Famaliy Size in Cedar Rock
3-person families (33 | 29.2%) account for the highest median family income in Cedar Rock with $158,036 per family, while 3-person families (33 | 29.2%) have the highest median income of $52,679 per family member.
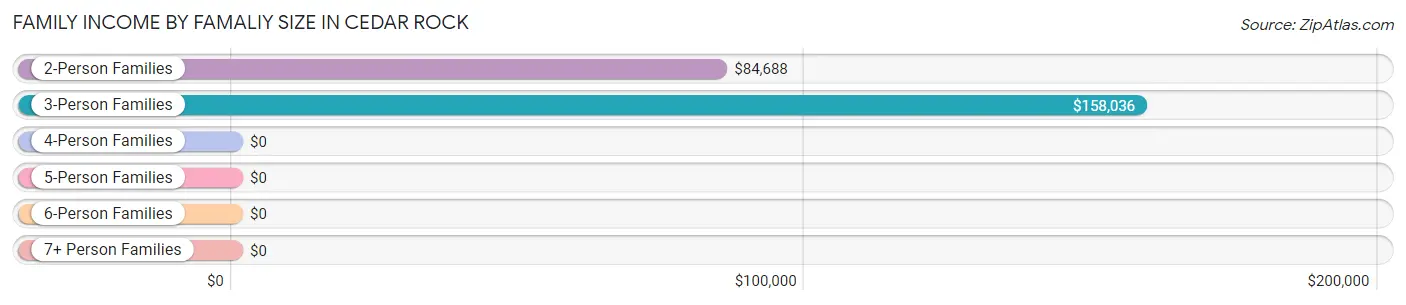
| Income Bracket | # Families | Median Income |
| 2-Person Families | 51 (45.1%) | $84,688 |
| 3-Person Families | 33 (29.2%) | $158,036 |
| 4-Person Families | 19 (16.8%) | $0 |
| 5-Person Families | 10 (8.8%) | $0 |
| 6-Person Families | 0 (0.0%) | $0 |
| 7+ Person Families | 0 (0.0%) | $0 |
| Total | 113 (100.0%) | $86,563 |
Family Income by Number of Earners in Cedar Rock
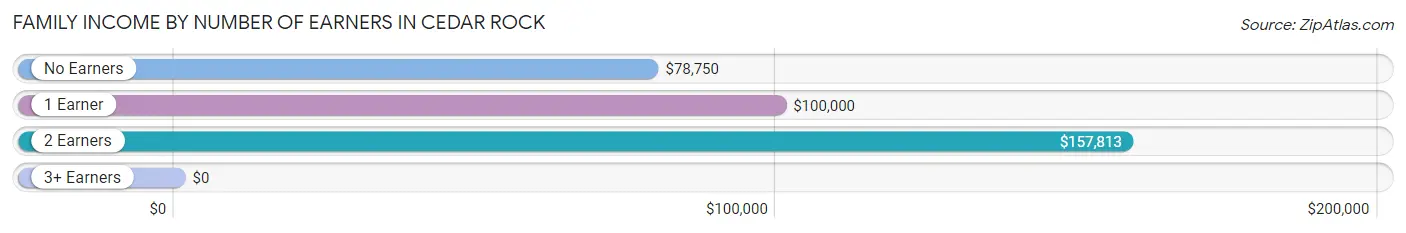
| Number of Earners | # Families | Median Income |
| No Earners | 27 (23.9%) | $78,750 |
| 1 Earner | 40 (35.4%) | $100,000 |
| 2 Earners | 25 (22.1%) | $157,813 |
| 3+ Earners | 21 (18.6%) | $0 |
| Total | 113 (100.0%) | $86,563 |
Household Income in Cedar Rock
Household Income Brackets in Cedar Rock
With 50 households falling in the category, the $50,000 to $74,999 income range is the most frequent in Cedar Rock, accounting for 30.5% of all households.
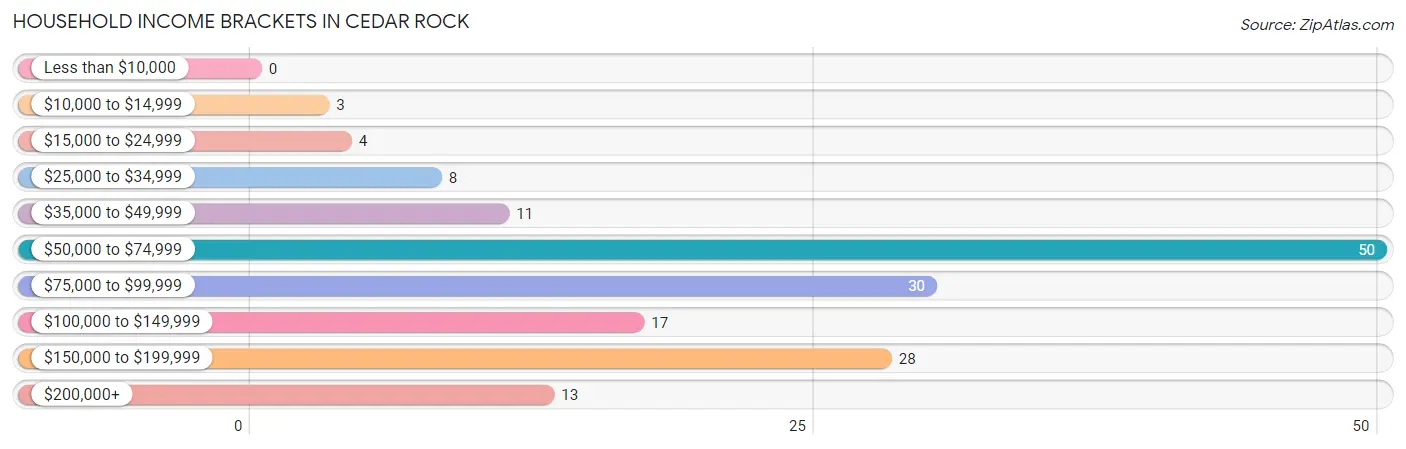
| Income Bracket | # Households | % Households |
| Less than $10,000 | 0 | 0.0% |
| $10,000 to $14,999 | 3 | 1.8% |
| $15,000 to $24,999 | 4 | 2.4% |
| $25,000 to $34,999 | 8 | 4.9% |
| $35,000 to $49,999 | 11 | 6.7% |
| $50,000 to $74,999 | 50 | 30.5% |
| $75,000 to $99,999 | 30 | 18.3% |
| $100,000 to $149,999 | 17 | 10.4% |
| $150,000 to $199,999 | 28 | 17.1% |
| $200,000+ | 13 | 7.9% |
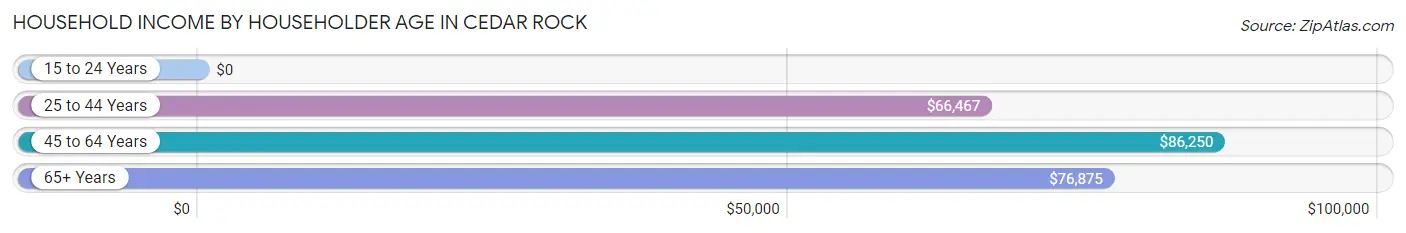
Household Income by Householder Age in Cedar Rock
The median household income in Cedar Rock is $77,143, with the highest median household income of $86,250 found in the 45 to 64 years age bracket for the primary householder. A total of 48 households (29.3%) fall into this category.
| Income Bracket | # Households | Median Income |
| 15 to 24 Years | 0 (0.0%) | $0 |
| 25 to 44 Years | 47 (28.7%) | $66,467 |
| 45 to 64 Years | 48 (29.3%) | $86,250 |
| 65+ Years | 69 (42.1%) | $76,875 |
| Total | 164 (100.0%) | $77,143 |
Poverty in Cedar Rock
Income Below Poverty by Sex and Age in Cedar Rock
With 5.0% poverty level for males and 3.7% for females among the residents of Cedar Rock, 18 to 24 year old males and under 5 year old females are the most vulnerable to poverty, with 8 males (72.7%) and 2 females (25.0%) in their respective age groups living below the poverty level.
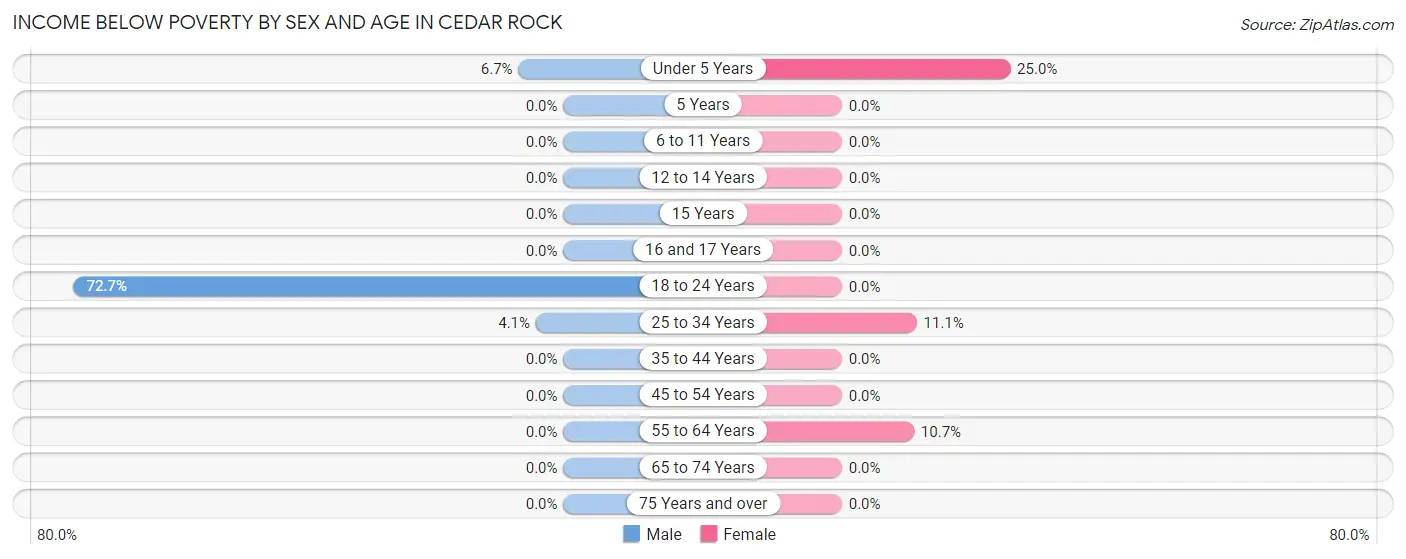
| Age Bracket | Male | Female |
| Under 5 Years | 1 (6.7%) | 2 (25.0%) |
| 5 Years | 0 (0.0%) | 0 (0.0%) |
| 6 to 11 Years | 0 (0.0%) | 0 (0.0%) |
| 12 to 14 Years | 0 (0.0%) | 0 (0.0%) |
| 15 Years | 0 (0.0%) | 0 (0.0%) |
| 16 and 17 Years | 0 (0.0%) | 0 (0.0%) |
| 18 to 24 Years | 8 (72.7%) | 0 (0.0%) |
| 25 to 34 Years | 2 (4.1%) | 2 (11.1%) |
| 35 to 44 Years | 0 (0.0%) | 0 (0.0%) |
| 45 to 54 Years | 0 (0.0%) | 0 (0.0%) |
| 55 to 64 Years | 0 (0.0%) | 3 (10.7%) |
| 65 to 74 Years | 0 (0.0%) | 0 (0.0%) |
| 75 Years and over | 0 (0.0%) | 0 (0.0%) |
| Total | 11 (5.0%) | 7 (3.7%) |
Income Above Poverty by Sex and Age in Cedar Rock
According to the poverty statistics in Cedar Rock, males aged 6 to 11 years and females aged 5 years are the age groups that are most secure financially, with 100.0% of males and 100.0% of females in these age groups living above the poverty line.
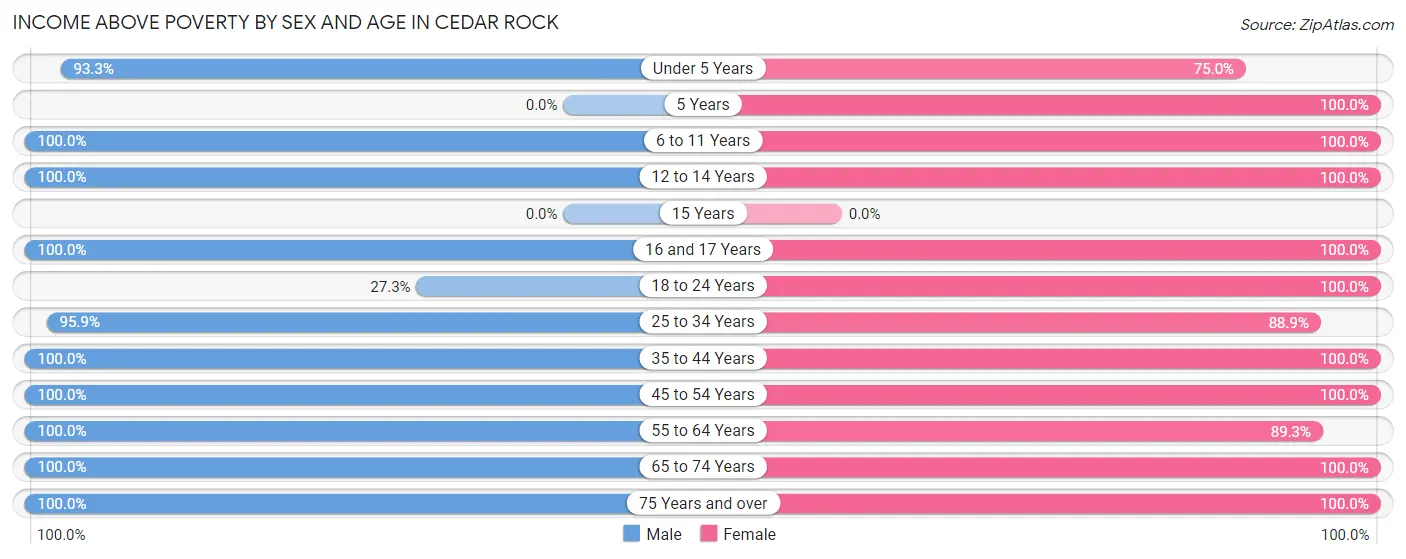
| Age Bracket | Male | Female |
| Under 5 Years | 14 (93.3%) | 6 (75.0%) |
| 5 Years | 0 (0.0%) | 6 (100.0%) |
| 6 to 11 Years | 6 (100.0%) | 18 (100.0%) |
| 12 to 14 Years | 21 (100.0%) | 1 (100.0%) |
| 15 Years | 0 (0.0%) | 0 (0.0%) |
| 16 and 17 Years | 8 (100.0%) | 9 (100.0%) |
| 18 to 24 Years | 3 (27.3%) | 2 (100.0%) |
| 25 to 34 Years | 47 (95.9%) | 16 (88.9%) |
| 35 to 44 Years | 14 (100.0%) | 10 (100.0%) |
| 45 to 54 Years | 31 (100.0%) | 28 (100.0%) |
| 55 to 64 Years | 13 (100.0%) | 25 (89.3%) |
| 65 to 74 Years | 21 (100.0%) | 18 (100.0%) |
| 75 Years and over | 32 (100.0%) | 42 (100.0%) |
| Total | 210 (95.0%) | 181 (96.3%) |
Income Below Poverty Among Married-Couple Families in Cedar Rock
The poverty statistics for married-couple families in Cedar Rock show that 2.1% or 2 of the total 97 families live below the poverty line. Families with 1 or 2 children have the highest poverty rate of 8.3%, comprising of 2 families. On the other hand, families with no children have the lowest poverty rate of 0.0%, which includes 0 families.
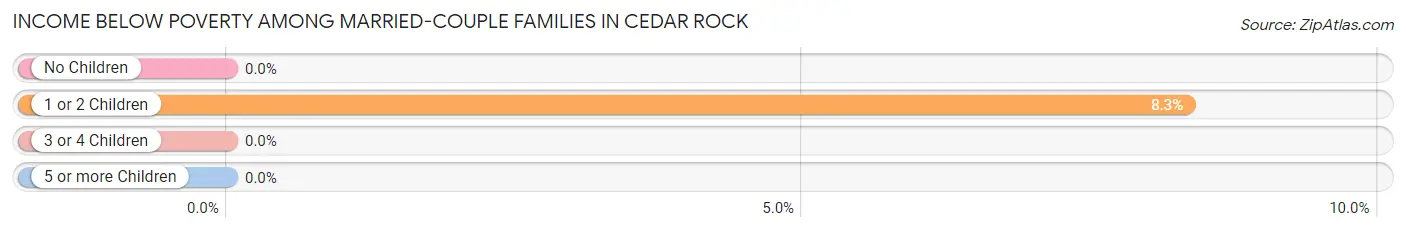
| Children | Above Poverty | Below Poverty |
| No Children | 66 (100.0%) | 0 (0.0%) |
| 1 or 2 Children | 22 (91.7%) | 2 (8.3%) |
| 3 or 4 Children | 7 (100.0%) | 0 (0.0%) |
| 5 or more Children | 0 (0.0%) | 0 (0.0%) |
| Total | 95 (97.9%) | 2 (2.1%) |
Income Below Poverty Among Single-Parent Households in Cedar Rock
| Children | Single Father | Single Mother |
| No Children | 0 (0.0%) | 0 (0.0%) |
| 1 or 2 Children | 0 (0.0%) | 0 (0.0%) |
| 3 or 4 Children | 0 (0.0%) | 0 (0.0%) |
| 5 or more Children | 0 (0.0%) | 0 (0.0%) |
| Total | 0 (0.0%) | 0 (0.0%) |
Income Below Poverty Among Married-Couple vs Single-Parent Households in Cedar Rock
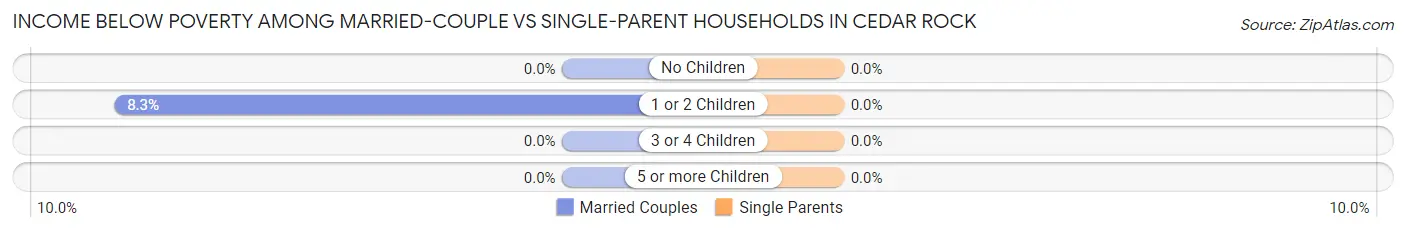
| Children | Married-Couple Families | Single-Parent Households |
| No Children | 0 (0.0%) | 0 (0.0%) |
| 1 or 2 Children | 2 (8.3%) | 0 (0.0%) |
| 3 or 4 Children | 0 (0.0%) | 0 (0.0%) |
| 5 or more Children | 0 (0.0%) | 0 (0.0%) |
| Total | 2 (2.1%) | 0 (0.0%) |
Race in Cedar Rock
The most populous races in Cedar Rock are White / Caucasian (371 | 90.7%), Two or more Races (38 | 9.3%), and Hispanic or Latino (10 | 2.4%).
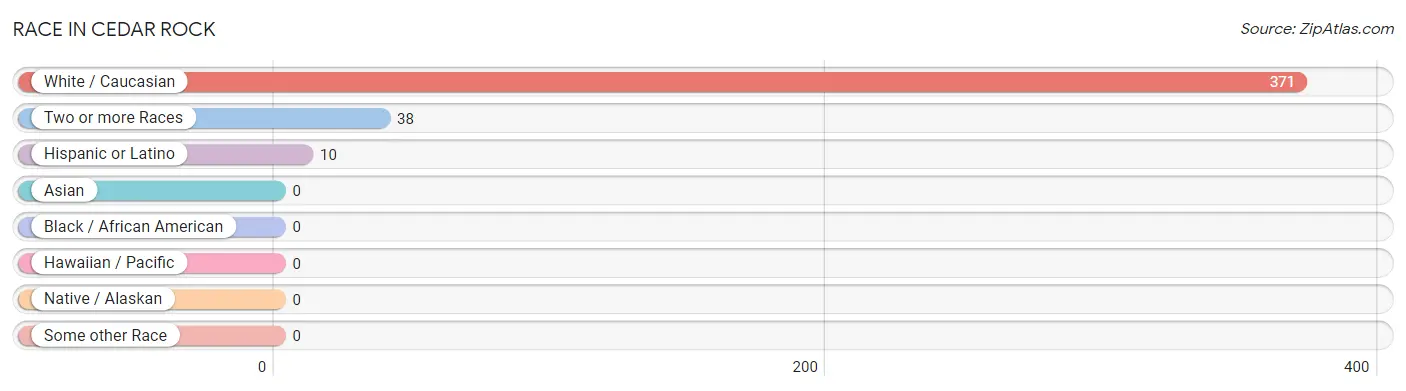
| Race | # Population | % Population |
| Asian | 0 | 0.0% |
| Black / African American | 0 | 0.0% |
| Hawaiian / Pacific | 0 | 0.0% |
| Hispanic or Latino | 10 | 2.4% |
| Native / Alaskan | 0 | 0.0% |
| White / Caucasian | 371 | 90.7% |
| Two or more Races | 38 | 9.3% |
| Some other Race | 0 | 0.0% |
| Total | 409 | 100.0% |
Ancestry in Cedar Rock
The most populous ancestries reported in Cedar Rock are German (124 | 30.3%), Irish (86 | 21.0%), American (68 | 16.6%), English (54 | 13.2%), and Scottish (50 | 12.2%), together accounting for 93.4% of all Cedar Rock residents.
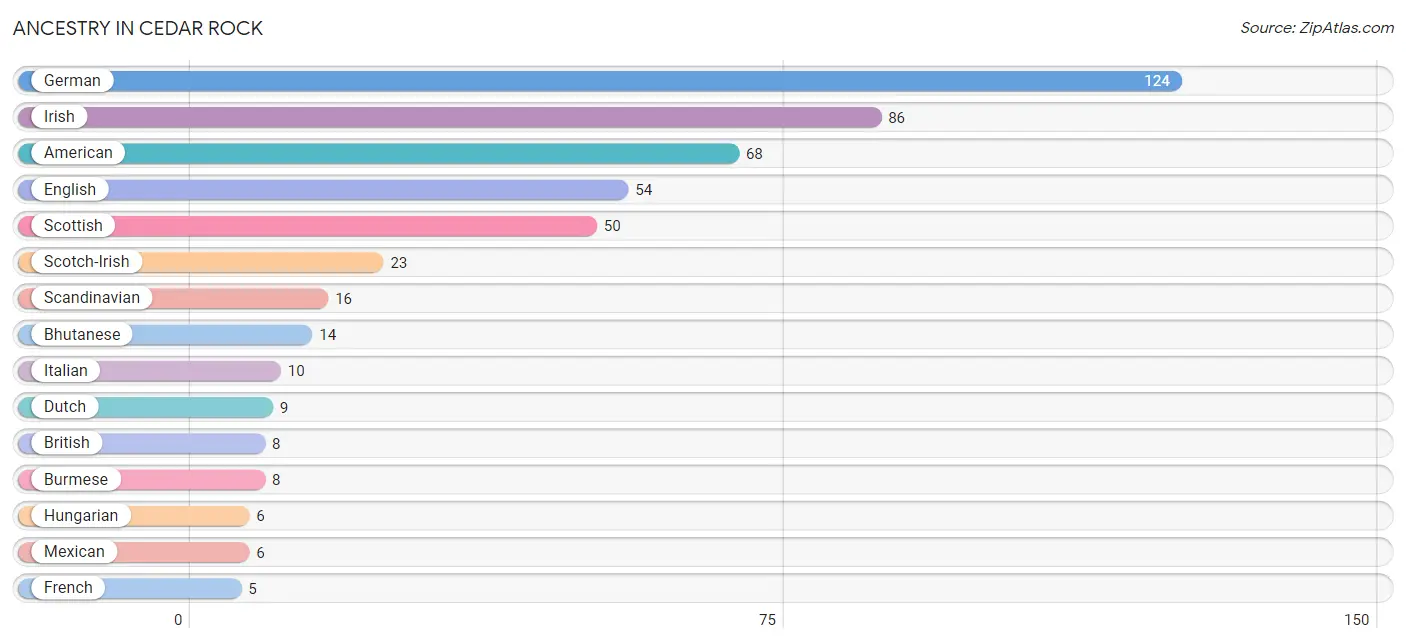
| Ancestry | # Population | % Population |
| American | 68 | 16.6% |
| Bhutanese | 14 | 3.4% |
| British | 8 | 2.0% |
| Burmese | 8 | 2.0% |
| Cherokee | 1 | 0.2% |
| Dutch | 9 | 2.2% |
| English | 54 | 13.2% |
| European | 1 | 0.2% |
| French | 5 | 1.2% |
| French Canadian | 1 | 0.2% |
| German | 124 | 30.3% |
| Hungarian | 6 | 1.5% |
| Indian (Asian) | 3 | 0.7% |
| Iranian | 2 | 0.5% |
| Irish | 86 | 21.0% |
| Italian | 10 | 2.4% |
| Mexican | 6 | 1.5% |
| Norwegian | 5 | 1.2% |
| Scandinavian | 16 | 3.9% |
| Scotch-Irish | 23 | 5.6% |
| Scottish | 50 | 12.2% |
| Spanish | 4 | 1.0% |
| Swedish | 2 | 0.5% |
| Swiss | 1 | 0.2% |
| Welsh | 2 | 0.5% | View All 25 Rows |
Immigrants in Cedar Rock
The most numerous immigrant groups reported in Cedar Rock came from Asia (8 | 2.0%), Eastern Asia (8 | 2.0%), Europe (5 | 1.2%), Germany (5 | 1.2%), and Japan (5 | 1.2%), together accounting for 7.6% of all Cedar Rock residents.
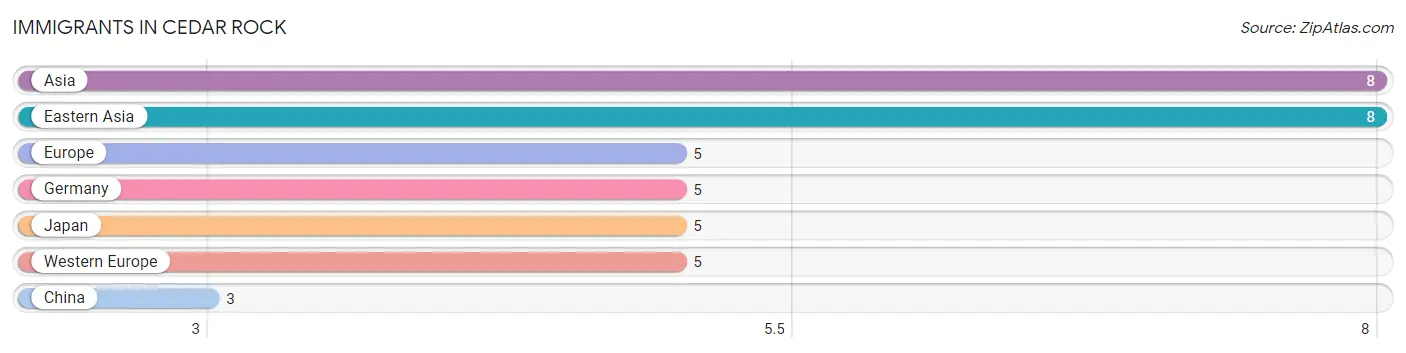
| Immigration Origin | # Population | % Population |
| Asia | 8 | 2.0% |
| China | 3 | 0.7% |
| Eastern Asia | 8 | 2.0% |
| Europe | 5 | 1.2% |
| Germany | 5 | 1.2% |
| Japan | 5 | 1.2% |
| Western Europe | 5 | 1.2% | View All 7 Rows |
Sex and Age in Cedar Rock
Sex and Age in Cedar Rock
The most populous age groups in Cedar Rock are 25 to 29 Years (40 | 18.1%) for men and 75 to 79 Years (25 | 13.3%) for women.
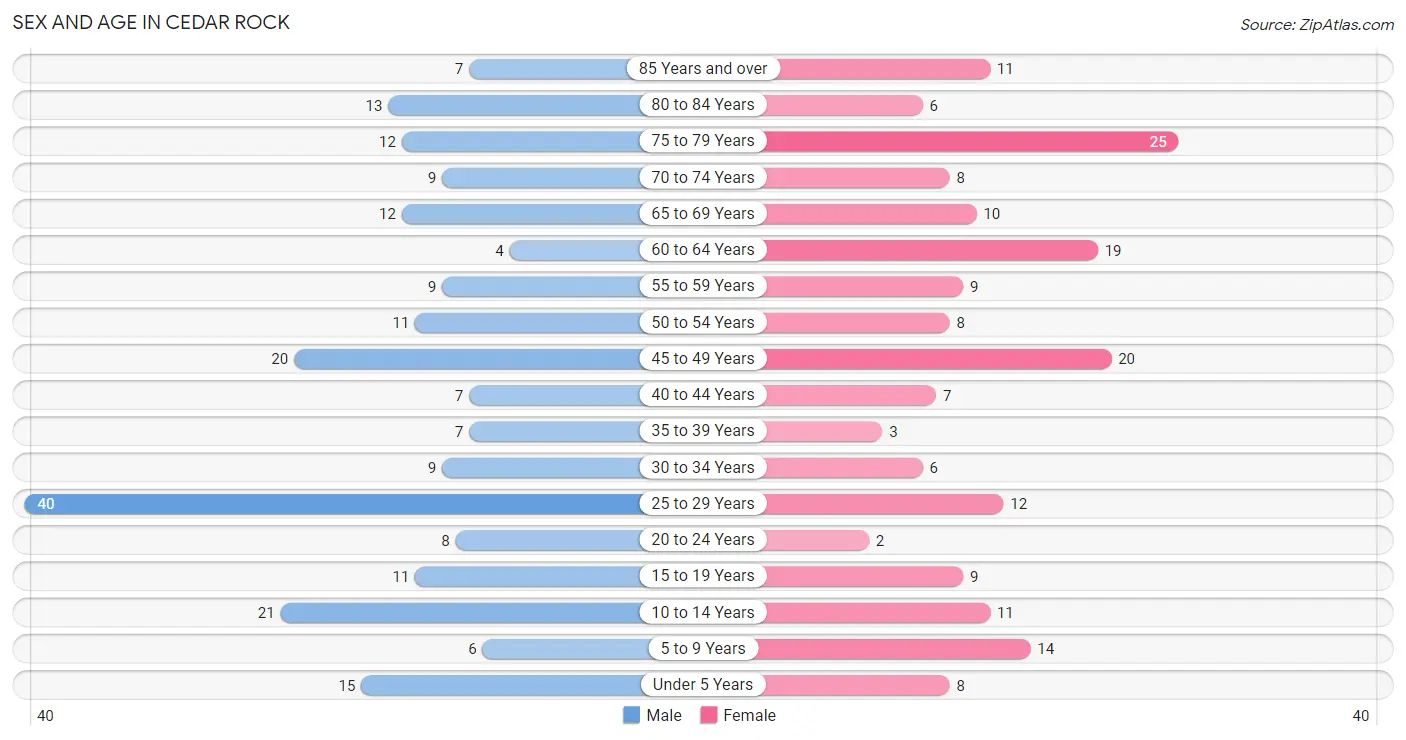
| Age Bracket | Male | Female |
| Under 5 Years | 15 (6.8%) | 8 (4.3%) |
| 5 to 9 Years | 6 (2.7%) | 14 (7.4%) |
| 10 to 14 Years | 21 (9.5%) | 11 (5.9%) |
| 15 to 19 Years | 11 (5.0%) | 9 (4.8%) |
| 20 to 24 Years | 8 (3.6%) | 2 (1.1%) |
| 25 to 29 Years | 40 (18.1%) | 12 (6.4%) |
| 30 to 34 Years | 9 (4.1%) | 6 (3.2%) |
| 35 to 39 Years | 7 (3.2%) | 3 (1.6%) |
| 40 to 44 Years | 7 (3.2%) | 7 (3.7%) |
| 45 to 49 Years | 20 (9.0%) | 20 (10.6%) |
| 50 to 54 Years | 11 (5.0%) | 8 (4.3%) |
| 55 to 59 Years | 9 (4.1%) | 9 (4.8%) |
| 60 to 64 Years | 4 (1.8%) | 19 (10.1%) |
| 65 to 69 Years | 12 (5.4%) | 10 (5.3%) |
| 70 to 74 Years | 9 (4.1%) | 8 (4.3%) |
| 75 to 79 Years | 12 (5.4%) | 25 (13.3%) |
| 80 to 84 Years | 13 (5.9%) | 6 (3.2%) |
| 85 Years and over | 7 (3.2%) | 11 (5.9%) |
| Total | 221 (100.0%) | 188 (100.0%) |
Families and Households in Cedar Rock
Median Family Size in Cedar Rock
The median family size in Cedar Rock is 3.07 persons per family, with single female/mother families (9 | 8.0%) accounting for the largest median family size of 3.44 persons per family. On the other hand, single male/father families (7 | 6.2%) represent the smallest median family size with 2.71 persons per family.
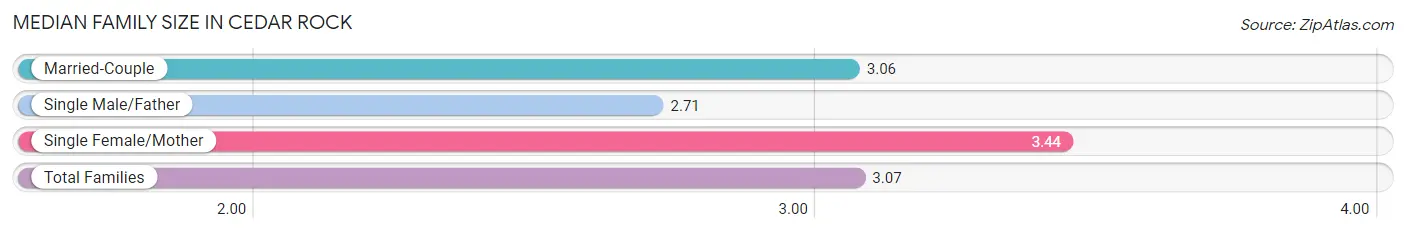
| Family Type | # Families | Family Size |
| Married-Couple | 97 (85.8%) | 3.06 |
| Single Male/Father | 7 (6.2%) | 2.71 |
| Single Female/Mother | 9 (8.0%) | 3.44 |
| Total Families | 113 (100.0%) | 3.07 |
Median Household Size in Cedar Rock
The median household size in Cedar Rock is 2.49 persons per household, with single female/mother households (9 | 5.5%) accounting for the largest median household size of 3.44 persons per household. non-family households (51 | 31.1%) represent the smallest median household size with 1.06 persons per household.
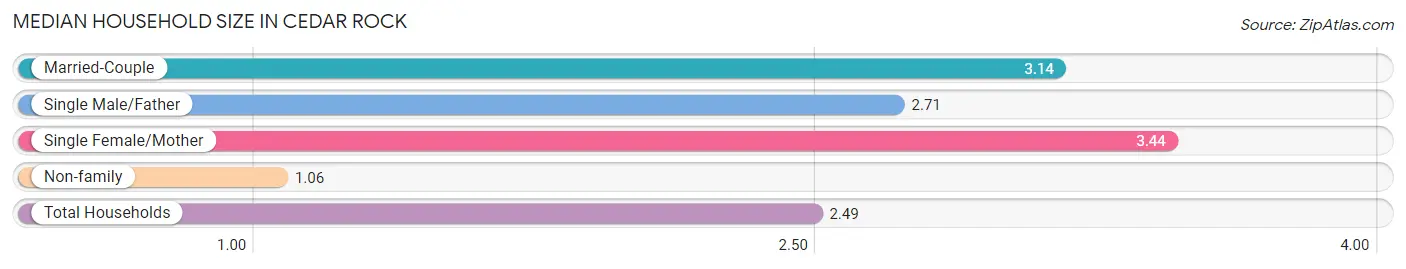
| Household Type | # Households | Household Size |
| Married-Couple | 97 (59.2%) | 3.14 |
| Single Male/Father | 7 (4.3%) | 2.71 |
| Single Female/Mother | 9 (5.5%) | 3.44 |
| Non-family | 51 (31.1%) | 1.06 |
| Total Households | 164 (100.0%) | 2.49 |
Household Size by Marriage Status in Cedar Rock
Out of a total of 164 households in Cedar Rock, 113 (68.9%) are family households, while 51 (31.1%) are nonfamily households. The most numerous type of family households are 2-person households, comprising 51, and the most common type of nonfamily households are 1-person households, comprising 48.
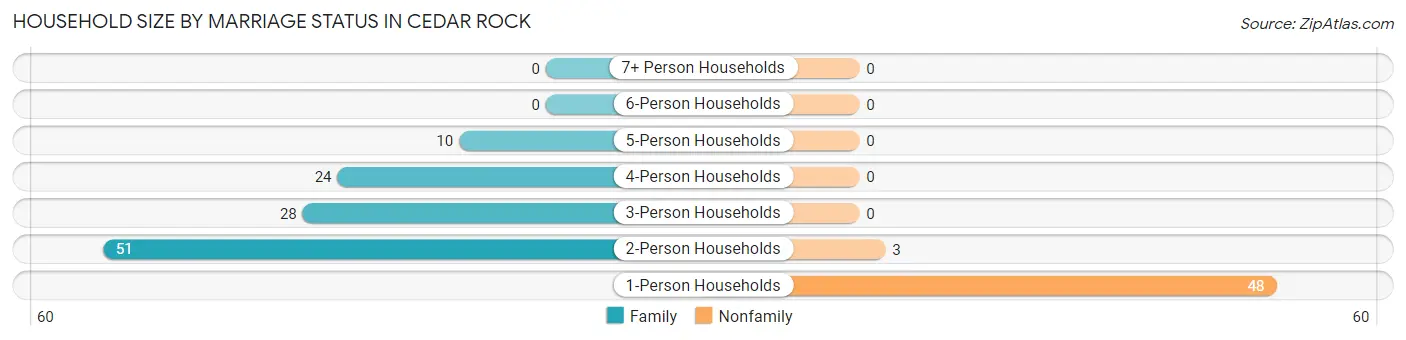
| Household Size | Family Households | Nonfamily Households |
| 1-Person Households | - | 48 (29.3%) |
| 2-Person Households | 51 (31.1%) | 3 (1.8%) |
| 3-Person Households | 28 (17.1%) | 0 (0.0%) |
| 4-Person Households | 24 (14.6%) | 0 (0.0%) |
| 5-Person Households | 10 (6.1%) | 0 (0.0%) |
| 6-Person Households | 0 (0.0%) | 0 (0.0%) |
| 7+ Person Households | 0 (0.0%) | 0 (0.0%) |
| Total | 113 (68.9%) | 51 (31.1%) |
Female Fertility in Cedar Rock
Fertility by Age in Cedar Rock
Average fertility rate in Cedar Rock is 169.0 births per 1,000 women. Women in the age bracket of 20 to 34 years have the highest fertility rate with 500.0 births per 1,000 women. Women in the age bracket of 20 to 34 years acount for 100.0% of all women with births.
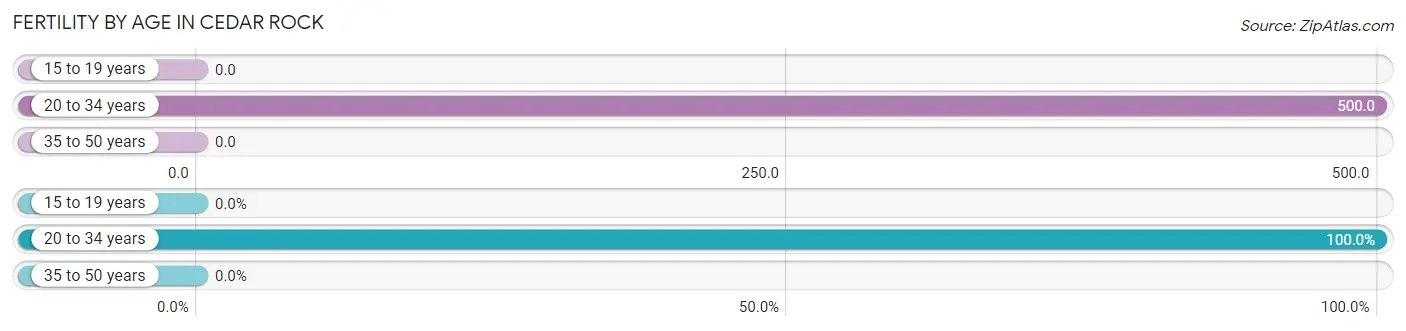
| Age Bracket | Women with Births | Births / 1,000 Women |
| 15 to 19 years | 0 (0.0%) | 0.0 |
| 20 to 34 years | 10 (100.0%) | 500.0 |
| 35 to 50 years | 0 (0.0%) | 0.0 |
| Total | 10 (100.0%) | 169.0 |
Fertility by Age by Marriage Status in Cedar Rock
80.0% of women with births (10) in Cedar Rock are married. The highest percentage of unmarried women with births falls into 20 to 34 years age bracket with 20.0% of them unmarried at the time of birth, while the lowest percentage of unmarried women with births belong to 20 to 34 years age bracket with 20.0% of them unmarried.
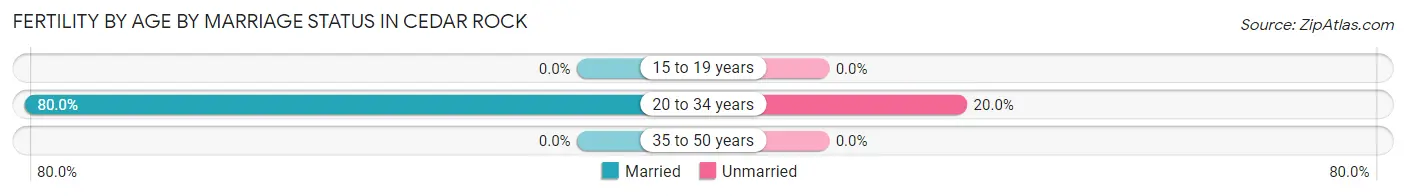
| Age Bracket | Married | Unmarried |
| 15 to 19 years | 0 (0.0%) | 0 (0.0%) |
| 20 to 34 years | 8 (80.0%) | 2 (20.0%) |
| 35 to 50 years | 0 (0.0%) | 0 (0.0%) |
| Total | 8 (80.0%) | 2 (20.0%) |
Fertility by Education in Cedar Rock
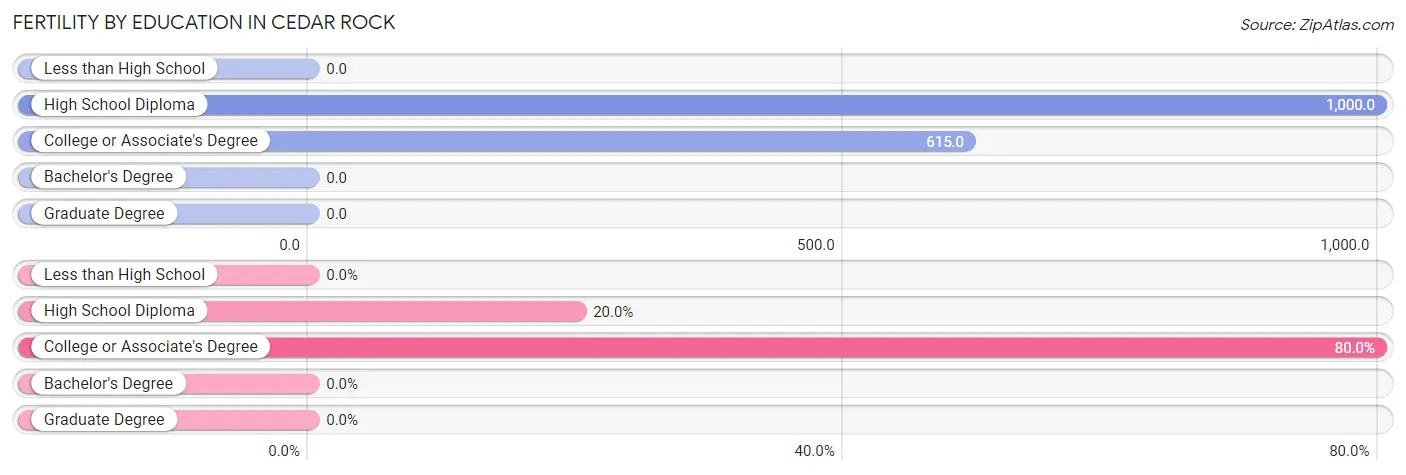
| Educational Attainment | Women with Births | Births / 1,000 Women |
| Less than High School | 0 (0.0%) | 0.0 |
| High School Diploma | 2 (20.0%) | 1,000.0 |
| College or Associate's Degree | 8 (80.0%) | 615.0 |
| Bachelor's Degree | 0 (0.0%) | 0.0 |
| Graduate Degree | 0 (0.0%) | 0.0 |
| Total | 10 (100.0%) | 169.0 |
Fertility by Education by Marriage Status in Cedar Rock
20.0% of women with births in Cedar Rock are unmarried. Women with the educational attainment of college or associate's degree are most likely to be married with 100.0% of them married at childbirth, while women with the educational attainment of high school diploma are least likely to be married with 100.0% of them unmarried at childbirth.
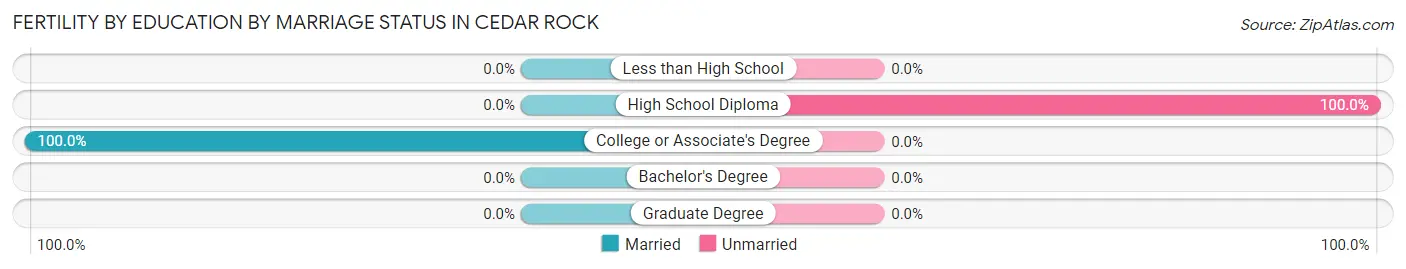
| Educational Attainment | Married | Unmarried |
| Less than High School | 0 (0.0%) | 0 (0.0%) |
| High School Diploma | 0 (0.0%) | 2 (100.0%) |
| College or Associate's Degree | 8 (100.0%) | 0 (0.0%) |
| Bachelor's Degree | 0 (0.0%) | 0 (0.0%) |
| Graduate Degree | 0 (0.0%) | 0 (0.0%) |
| Total | 8 (80.0%) | 2 (20.0%) |
Employment Characteristics in Cedar Rock
Employment by Class of Employer in Cedar Rock
Among the 177 employed individuals in Cedar Rock, private company employees (124 | 70.1%), not-for-profit organizations (15 | 8.5%), and self-employed (not incorporated) (13 | 7.3%) make up the most common classes of employment.
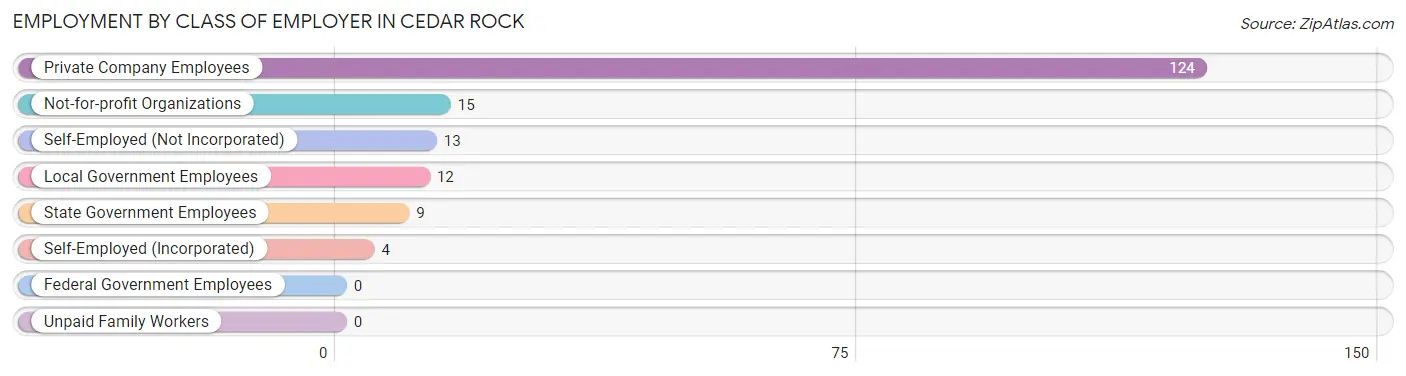
| Employer Class | # Employees | % Employees |
| Private Company Employees | 124 | 70.1% |
| Self-Employed (Incorporated) | 4 | 2.3% |
| Self-Employed (Not Incorporated) | 13 | 7.3% |
| Not-for-profit Organizations | 15 | 8.5% |
| Local Government Employees | 12 | 6.8% |
| State Government Employees | 9 | 5.1% |
| Federal Government Employees | 0 | 0.0% |
| Unpaid Family Workers | 0 | 0.0% |
| Total | 177 | 100.0% |
Employment Status by Age in Cedar Rock
According to the labor force statistics for Cedar Rock, out of the total population over 16 years of age (334), 56.3% or 188 individuals are in the labor force, with 1.6% or 3 of them unemployed. The age group with the highest labor force participation rate is 25 to 29 years, with 100.0% or 52 individuals in the labor force. Within the labor force, the 30 to 34 years age range has the highest percentage of unemployed individuals, with 30.0% or 3 of them being unemployed.
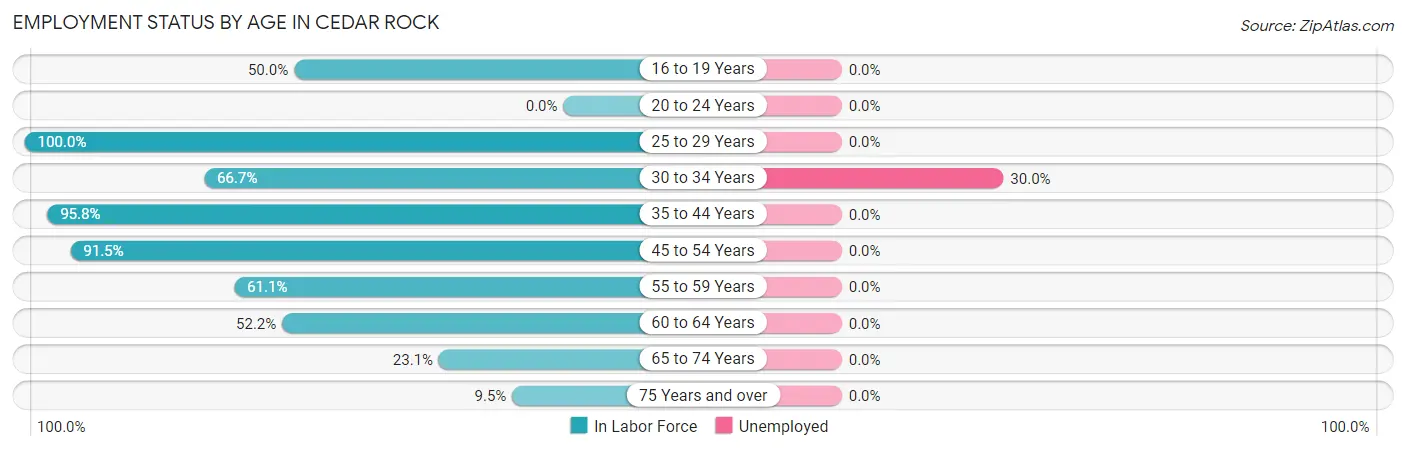
| Age Bracket | In Labor Force | Unemployed |
| 16 to 19 Years | 10 (50.0%) | 0 (0.0%) |
| 20 to 24 Years | 0 (0.0%) | 0 (0.0%) |
| 25 to 29 Years | 52 (100.0%) | 0 (0.0%) |
| 30 to 34 Years | 10 (66.7%) | 3 (30.0%) |
| 35 to 44 Years | 23 (95.8%) | 0 (0.0%) |
| 45 to 54 Years | 54 (91.5%) | 0 (0.0%) |
| 55 to 59 Years | 11 (61.1%) | 0 (0.0%) |
| 60 to 64 Years | 12 (52.2%) | 0 (0.0%) |
| 65 to 74 Years | 9 (23.1%) | 0 (0.0%) |
| 75 Years and over | 7 (9.5%) | 0 (0.0%) |
| Total | 188 (56.3%) | 3 (1.6%) |
Employment Status by Educational Attainment in Cedar Rock
According to labor force statistics for Cedar Rock, 84.8% of individuals (162) out of the total population between 25 and 64 years of age (191) are in the labor force, with 1.9% or 3 of them being unemployed. The group with the highest labor force participation rate are those with the educational attainment of bachelor's degree or higher, with 96.1% or 73 individuals in the labor force. Within the labor force, individuals with bachelor's degree or higher education have the highest percentage of unemployment, with 4.1% or 3 of them being unemployed.
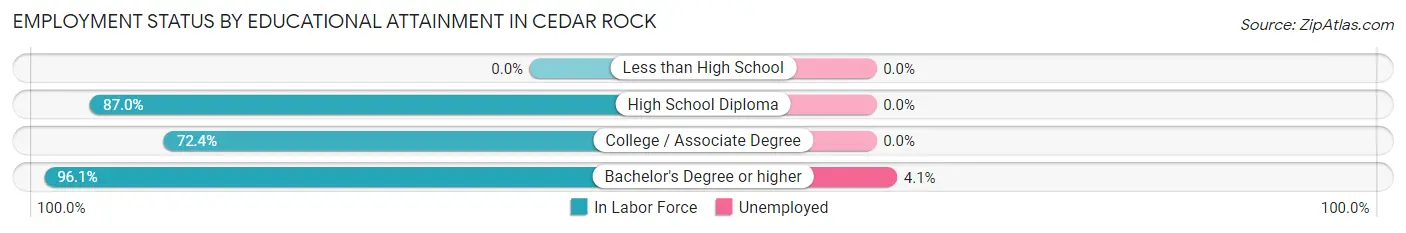
| Educational Attainment | In Labor Force | Unemployed |
| Less than High School | 0 (0.0%) | 0 (0.0%) |
| High School Diploma | 47 (87.0%) | 0 (0.0%) |
| College / Associate Degree | 42 (72.4%) | 0 (0.0%) |
| Bachelor's Degree or higher | 73 (96.1%) | 3 (4.1%) |
| Total | 162 (84.8%) | 4 (1.9%) |
Employment Occupations by Sex in Cedar Rock
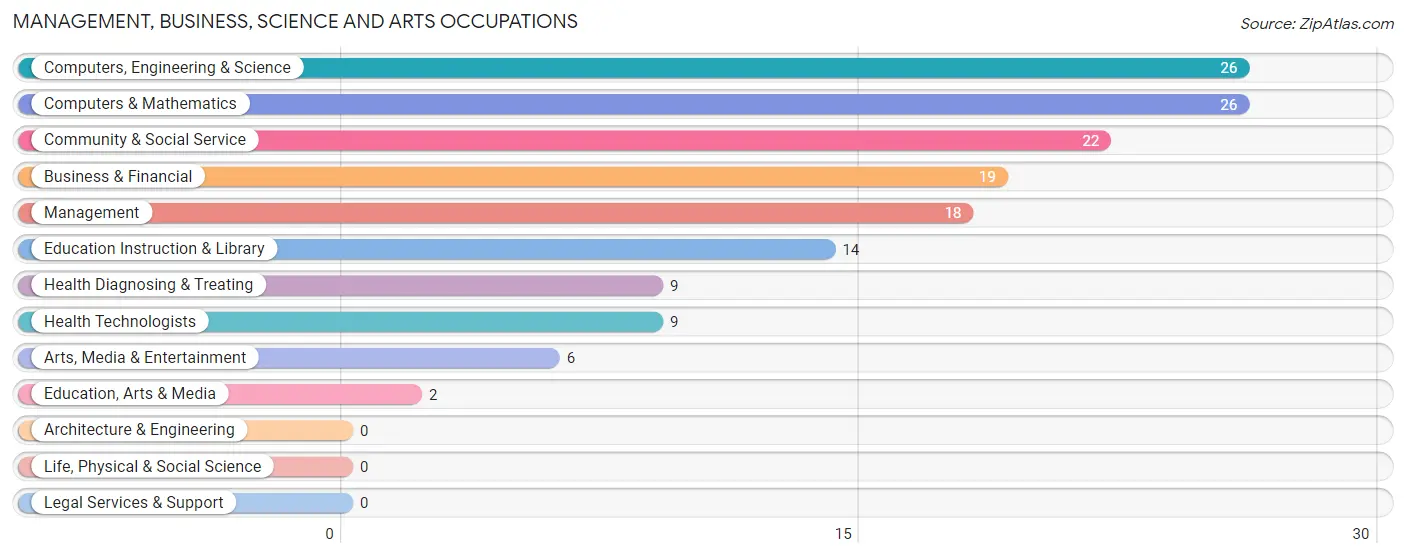
Management, Business, Science and Arts Occupations
The most common Management, Business, Science and Arts occupations in Cedar Rock are Computers, Engineering & Science (26 | 14.1%), Computers & Mathematics (26 | 14.1%), Community & Social Service (22 | 11.9%), Business & Financial (19 | 10.3%), and Management (18 | 9.7%).
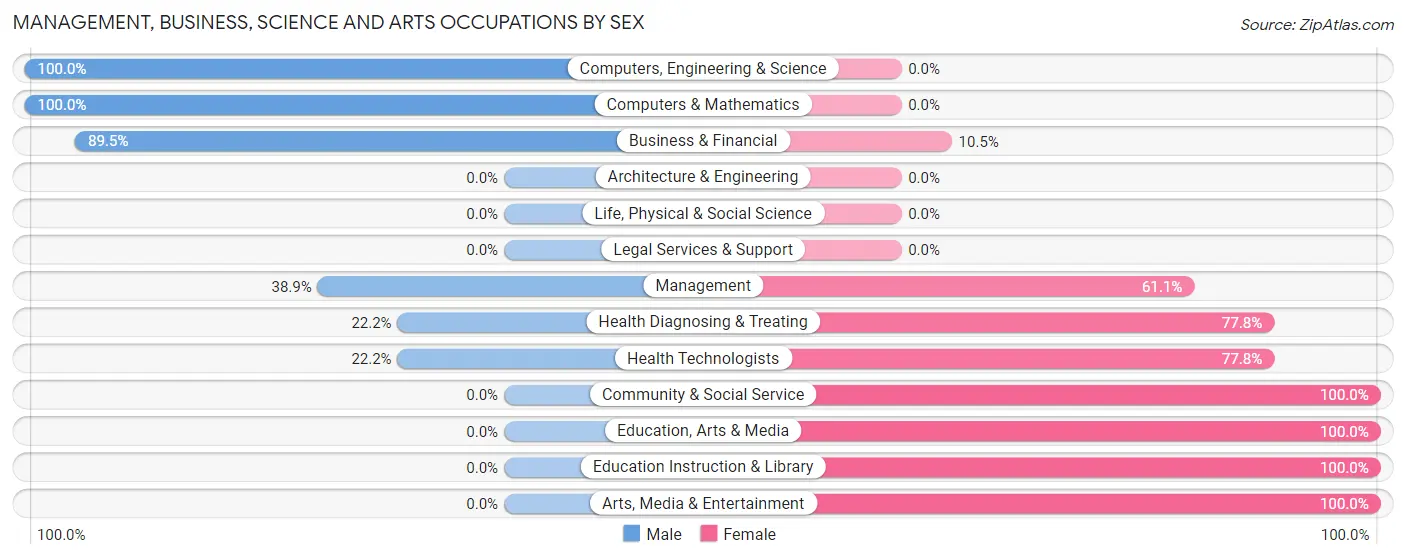
Management, Business, Science and Arts Occupations by Sex
Within the Management, Business, Science and Arts occupations in Cedar Rock, the most male-oriented occupations are Computers, Engineering & Science (100.0%), Computers & Mathematics (100.0%), and Business & Financial (89.5%), while the most female-oriented occupations are Community & Social Service (100.0%), Education, Arts & Media (100.0%), and Education Instruction & Library (100.0%).
| Occupation | Male | Female |
| Management | 7 (38.9%) | 11 (61.1%) |
| Business & Financial | 17 (89.5%) | 2 (10.5%) |
| Computers, Engineering & Science | 26 (100.0%) | 0 (0.0%) |
| Computers & Mathematics | 26 (100.0%) | 0 (0.0%) |
| Architecture & Engineering | 0 (0.0%) | 0 (0.0%) |
| Life, Physical & Social Science | 0 (0.0%) | 0 (0.0%) |
| Community & Social Service | 0 (0.0%) | 22 (100.0%) |
| Education, Arts & Media | 0 (0.0%) | 2 (100.0%) |
| Legal Services & Support | 0 (0.0%) | 0 (0.0%) |
| Education Instruction & Library | 0 (0.0%) | 14 (100.0%) |
| Arts, Media & Entertainment | 0 (0.0%) | 6 (100.0%) |
| Health Diagnosing & Treating | 2 (22.2%) | 7 (77.8%) |
| Health Technologists | 2 (22.2%) | 7 (77.8%) |
| Total (Category) | 52 (55.3%) | 42 (44.7%) |
| Total (Overall) | 112 (60.5%) | 73 (39.5%) |
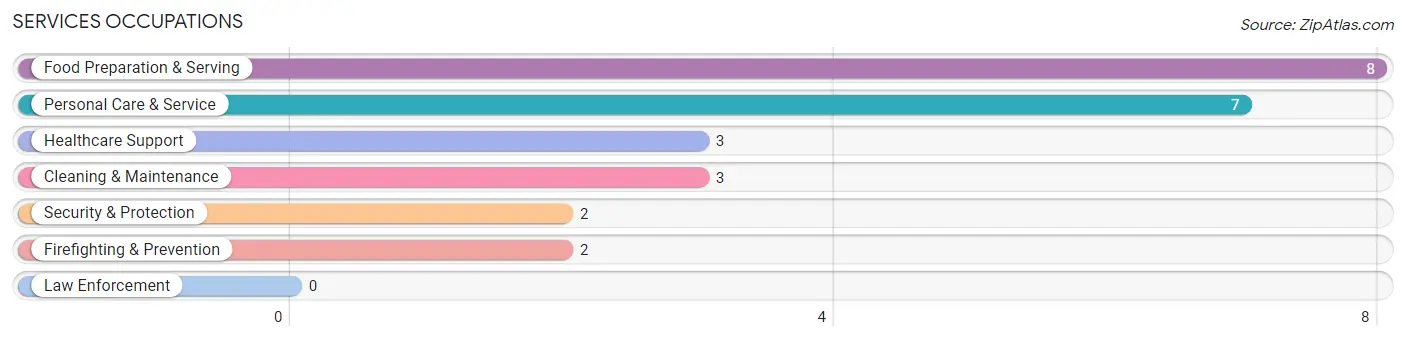
Services Occupations
The most common Services occupations in Cedar Rock are Food Preparation & Serving (8 | 4.3%), Personal Care & Service (7 | 3.8%), Healthcare Support (3 | 1.6%), Cleaning & Maintenance (3 | 1.6%), and Security & Protection (2 | 1.1%).
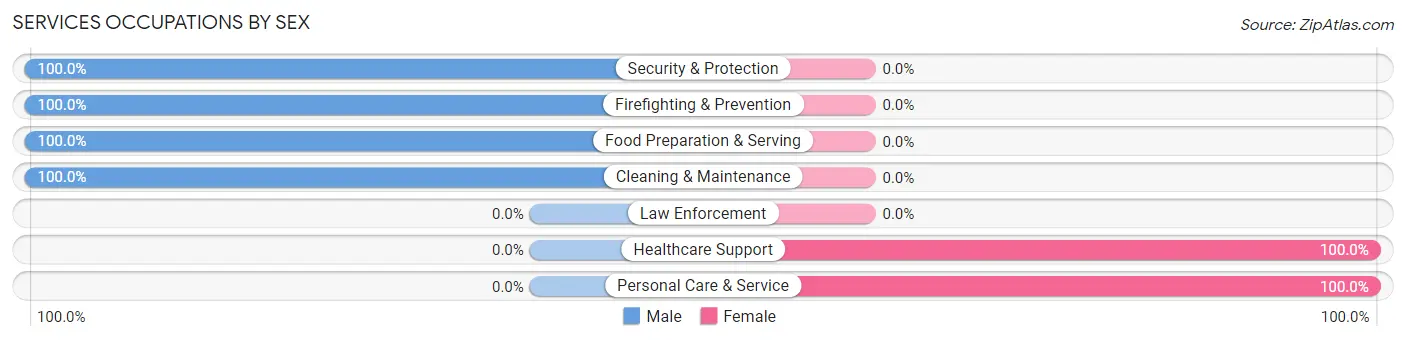
Services Occupations by Sex
Within the Services occupations in Cedar Rock, the most male-oriented occupations are Security & Protection (100.0%), Firefighting & Prevention (100.0%), and Food Preparation & Serving (100.0%), while the most female-oriented occupations are Healthcare Support (100.0%), and Personal Care & Service (100.0%).
| Occupation | Male | Female |
| Healthcare Support | 0 (0.0%) | 3 (100.0%) |
| Security & Protection | 2 (100.0%) | 0 (0.0%) |
| Firefighting & Prevention | 2 (100.0%) | 0 (0.0%) |
| Law Enforcement | 0 (0.0%) | 0 (0.0%) |
| Food Preparation & Serving | 8 (100.0%) | 0 (0.0%) |
| Cleaning & Maintenance | 3 (100.0%) | 0 (0.0%) |
| Personal Care & Service | 0 (0.0%) | 7 (100.0%) |
| Total (Category) | 13 (56.5%) | 10 (43.5%) |
| Total (Overall) | 112 (60.5%) | 73 (39.5%) |
Sales and Office Occupations
The most common Sales and Office occupations in Cedar Rock are Sales & Related (39 | 21.1%), and Office & Administration (19 | 10.3%).
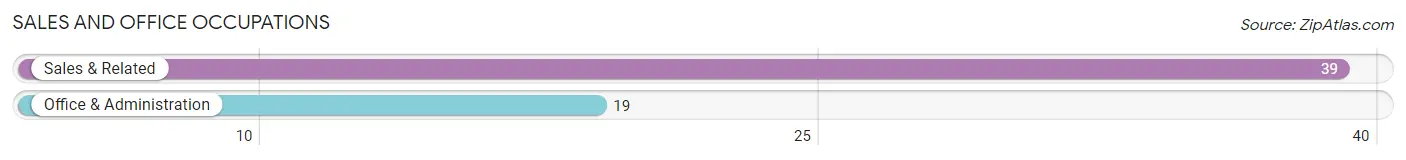
Sales and Office Occupations by Sex

| Occupation | Male | Female |
| Sales & Related | 35 (89.7%) | 4 (10.3%) |
| Office & Administration | 3 (15.8%) | 16 (84.2%) |
| Total (Category) | 38 (65.5%) | 20 (34.5%) |
| Total (Overall) | 112 (60.5%) | 73 (39.5%) |
Natural Resources, Construction and Maintenance Occupations
The most common Natural Resources, Construction and Maintenance occupations in Cedar Rock are Construction & Extraction (3 | 1.6%), and Installation, Maintenance & Repair (1 | 0.5%).
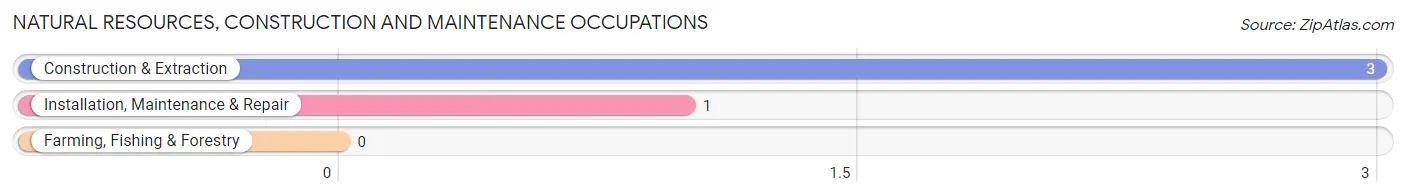
Natural Resources, Construction and Maintenance Occupations by Sex
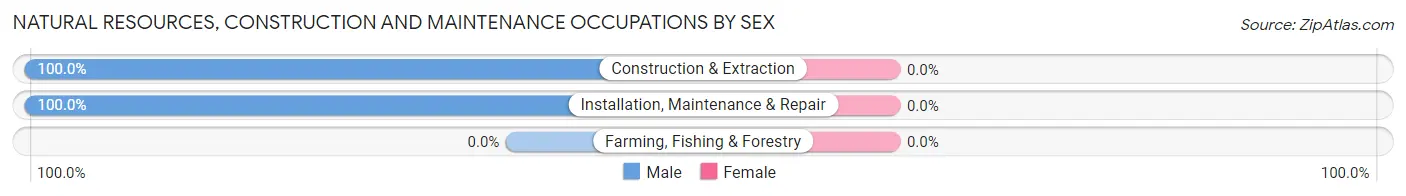
| Occupation | Male | Female |
| Farming, Fishing & Forestry | 0 (0.0%) | 0 (0.0%) |
| Construction & Extraction | 3 (100.0%) | 0 (0.0%) |
| Installation, Maintenance & Repair | 1 (100.0%) | 0 (0.0%) |
| Total (Category) | 4 (100.0%) | 0 (0.0%) |
| Total (Overall) | 112 (60.5%) | 73 (39.5%) |
Production, Transportation and Moving Occupations
The most common Production, Transportation and Moving occupations in Cedar Rock are Production (4 | 2.2%), and Transportation (2 | 1.1%).
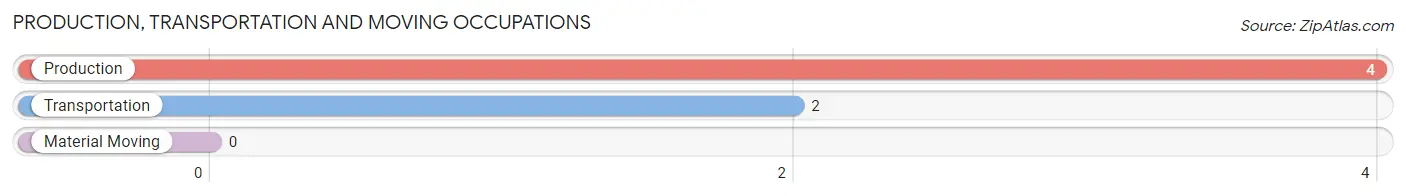
Production, Transportation and Moving Occupations by Sex
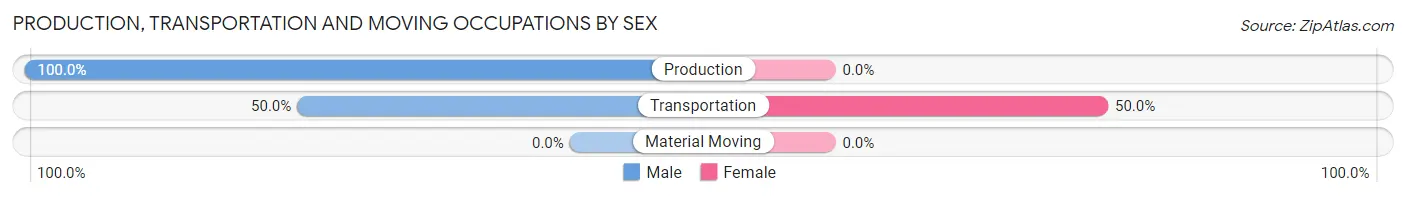
| Occupation | Male | Female |
| Production | 4 (100.0%) | 0 (0.0%) |
| Transportation | 1 (50.0%) | 1 (50.0%) |
| Material Moving | 0 (0.0%) | 0 (0.0%) |
| Total (Category) | 5 (83.3%) | 1 (16.7%) |
| Total (Overall) | 112 (60.5%) | 73 (39.5%) |
Employment Industries by Sex in Cedar Rock
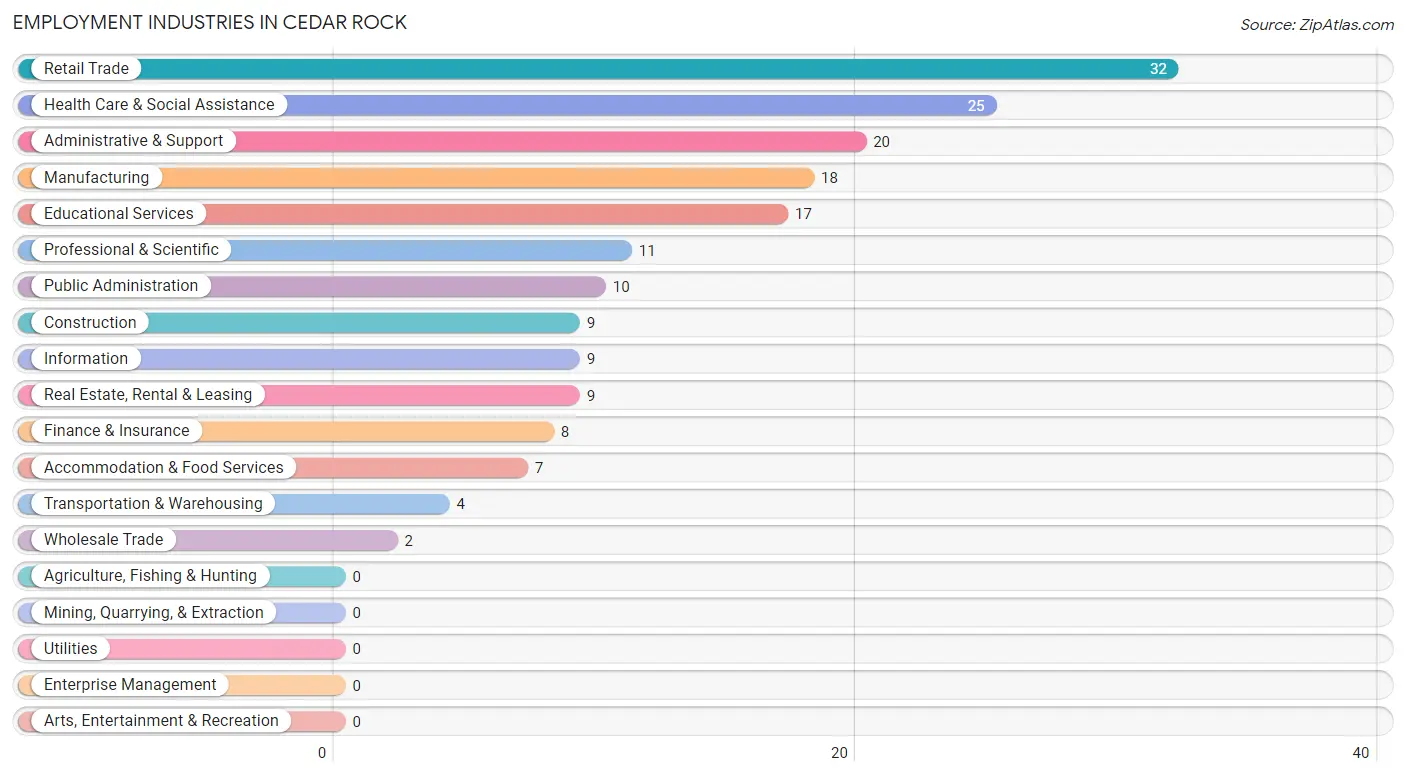
Employment Industries in Cedar Rock
The major employment industries in Cedar Rock include Retail Trade (32 | 17.3%), Health Care & Social Assistance (25 | 13.5%), Administrative & Support (20 | 10.8%), Manufacturing (18 | 9.7%), and Educational Services (17 | 9.2%).
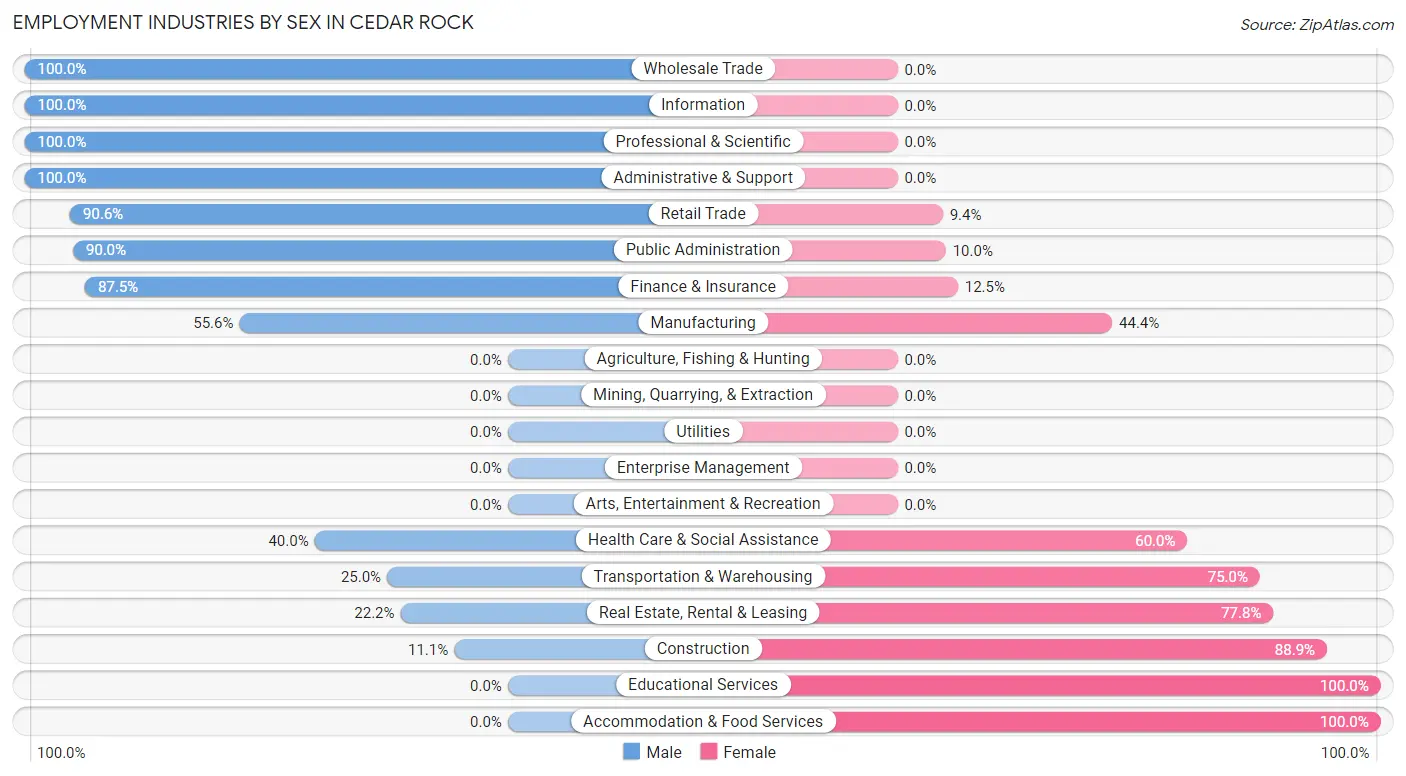
Employment Industries by Sex in Cedar Rock
The Cedar Rock industries that see more men than women are Wholesale Trade (100.0%), Information (100.0%), and Professional & Scientific (100.0%), whereas the industries that tend to have a higher number of women are Educational Services (100.0%), Accommodation & Food Services (100.0%), and Construction (88.9%).
| Industry | Male | Female |
| Agriculture, Fishing & Hunting | 0 (0.0%) | 0 (0.0%) |
| Mining, Quarrying, & Extraction | 0 (0.0%) | 0 (0.0%) |
| Construction | 1 (11.1%) | 8 (88.9%) |
| Manufacturing | 10 (55.6%) | 8 (44.4%) |
| Wholesale Trade | 2 (100.0%) | 0 (0.0%) |
| Retail Trade | 29 (90.6%) | 3 (9.4%) |
| Transportation & Warehousing | 1 (25.0%) | 3 (75.0%) |
| Utilities | 0 (0.0%) | 0 (0.0%) |
| Information | 9 (100.0%) | 0 (0.0%) |
| Finance & Insurance | 7 (87.5%) | 1 (12.5%) |
| Real Estate, Rental & Leasing | 2 (22.2%) | 7 (77.8%) |
| Professional & Scientific | 11 (100.0%) | 0 (0.0%) |
| Enterprise Management | 0 (0.0%) | 0 (0.0%) |
| Administrative & Support | 20 (100.0%) | 0 (0.0%) |
| Educational Services | 0 (0.0%) | 17 (100.0%) |
| Health Care & Social Assistance | 10 (40.0%) | 15 (60.0%) |
| Arts, Entertainment & Recreation | 0 (0.0%) | 0 (0.0%) |
| Accommodation & Food Services | 0 (0.0%) | 7 (100.0%) |
| Public Administration | 9 (90.0%) | 1 (10.0%) |
| Total | 112 (60.5%) | 73 (39.5%) |
Education in Cedar Rock
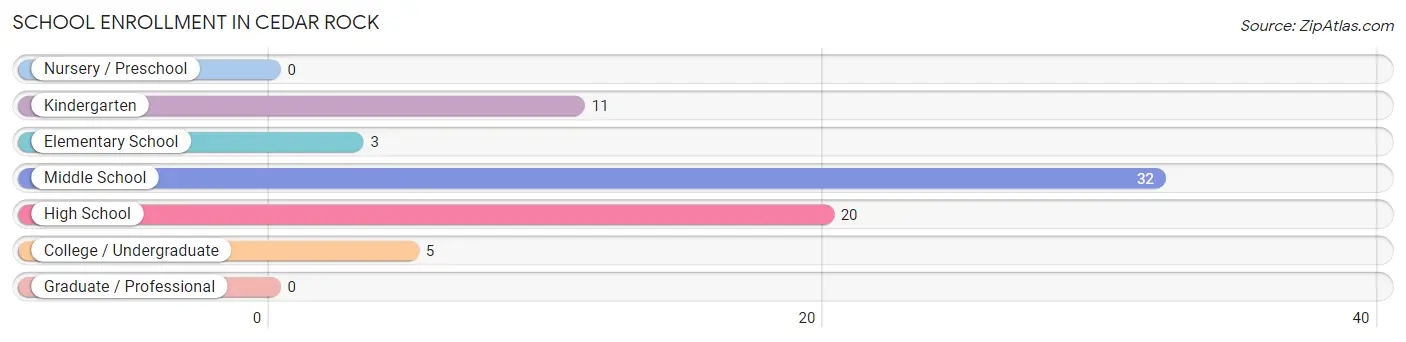
School Enrollment in Cedar Rock
The most common levels of schooling among the 71 students in Cedar Rock are middle school (32 | 45.1%), high school (20 | 28.2%), and kindergarten (11 | 15.5%).
| School Level | # Students | % Students |
| Nursery / Preschool | 0 | 0.0% |
| Kindergarten | 11 | 15.5% |
| Elementary School | 3 | 4.2% |
| Middle School | 32 | 45.1% |
| High School | 20 | 28.2% |
| College / Undergraduate | 5 | 7.0% |
| Graduate / Professional | 0 | 0.0% |
| Total | 71 | 100.0% |
School Enrollment by Age by Funding Source in Cedar Rock
Out of a total of 71 students who are enrolled in schools in Cedar Rock, 3 (4.2%) attend a private institution, while the remaining 68 (95.8%) are enrolled in public schools. The age group of 10 to 14 year olds has the highest likelihood of being enrolled in private schools, with 3 (9.4% in the age bracket) enrolled. Conversely, the age group of 5 to 9 year old has the lowest likelihood of being enrolled in a private school, with 14 (100.0% in the age bracket) attending a public institution.
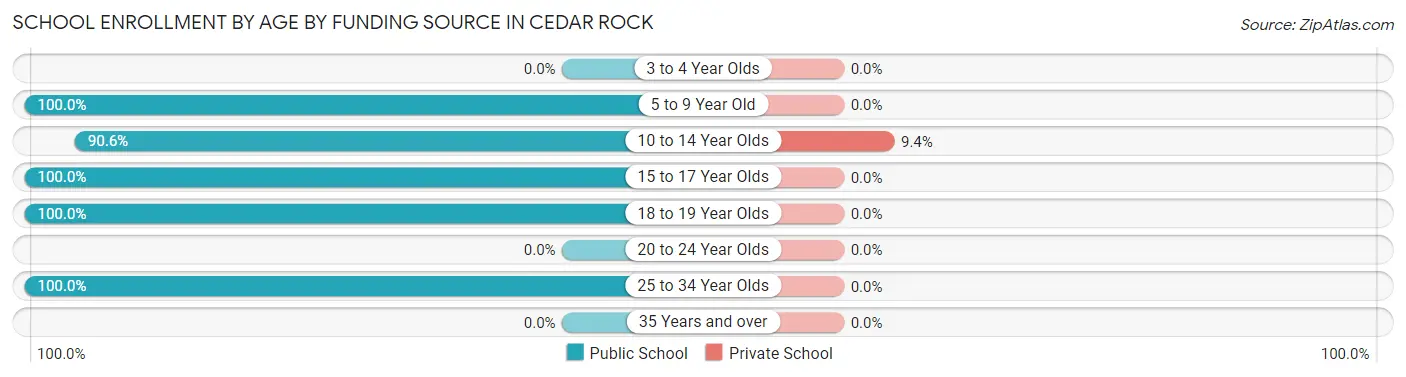
| Age Bracket | Public School | Private School |
| 3 to 4 Year Olds | 0 (0.0%) | 0 (0.0%) |
| 5 to 9 Year Old | 14 (100.0%) | 0 (0.0%) |
| 10 to 14 Year Olds | 29 (90.6%) | 3 (9.4%) |
| 15 to 17 Year Olds | 17 (100.0%) | 0 (0.0%) |
| 18 to 19 Year Olds | 3 (100.0%) | 0 (0.0%) |
| 20 to 24 Year Olds | 0 (0.0%) | 0 (0.0%) |
| 25 to 34 Year Olds | 5 (100.0%) | 0 (0.0%) |
| 35 Years and over | 0 (0.0%) | 0 (0.0%) |
| Total | 68 (95.8%) | 3 (4.2%) |
Educational Attainment by Field of Study in Cedar Rock
Education (26 | 20.3%), science & technology (23 | 18.0%), visual & performing arts (16 | 12.5%), business (14 | 10.9%), and computers & mathematics (11 | 8.6%) are the most common fields of study among 128 individuals in Cedar Rock who have obtained a bachelor's degree or higher.
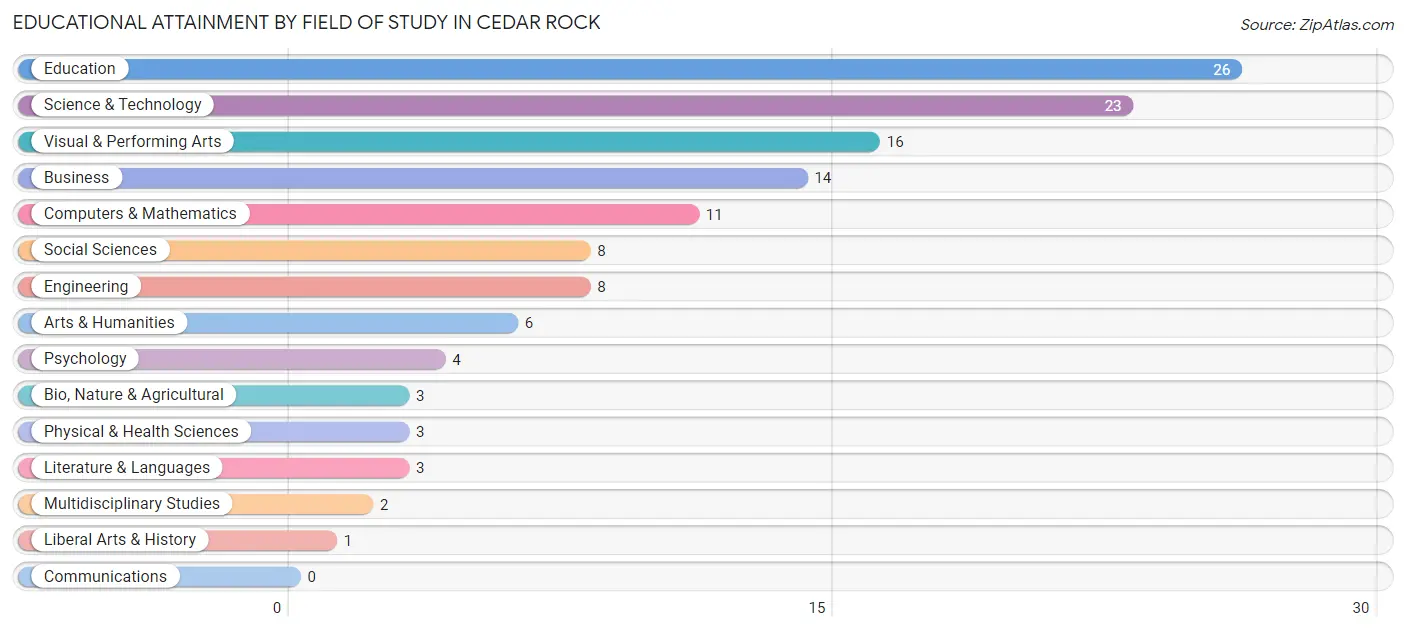
| Field of Study | # Graduates | % Graduates |
| Computers & Mathematics | 11 | 8.6% |
| Bio, Nature & Agricultural | 3 | 2.3% |
| Physical & Health Sciences | 3 | 2.3% |
| Psychology | 4 | 3.1% |
| Social Sciences | 8 | 6.2% |
| Engineering | 8 | 6.2% |
| Multidisciplinary Studies | 2 | 1.6% |
| Science & Technology | 23 | 18.0% |
| Business | 14 | 10.9% |
| Education | 26 | 20.3% |
| Literature & Languages | 3 | 2.3% |
| Liberal Arts & History | 1 | 0.8% |
| Visual & Performing Arts | 16 | 12.5% |
| Communications | 0 | 0.0% |
| Arts & Humanities | 6 | 4.7% |
| Total | 128 | 100.0% |
Transportation & Commute in Cedar Rock
Vehicle Availability by Sex in Cedar Rock
The most prevalent vehicle ownership categories in Cedar Rock are males with 5 or more vehicles (24, accounting for 21.4%) and females with 5 or more vehicles (2, making up 36.9%).
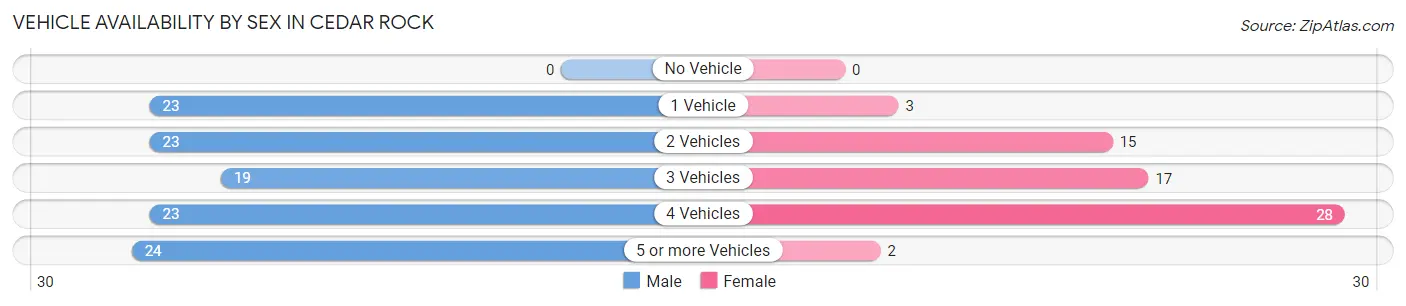
| Vehicles Available | Male | Female |
| No Vehicle | 0 (0.0%) | 0 (0.0%) |
| 1 Vehicle | 23 (20.5%) | 3 (4.6%) |
| 2 Vehicles | 23 (20.5%) | 15 (23.1%) |
| 3 Vehicles | 19 (17.0%) | 17 (26.2%) |
| 4 Vehicles | 23 (20.5%) | 28 (43.1%) |
| 5 or more Vehicles | 24 (21.4%) | 2 (3.1%) |
| Total | 112 (100.0%) | 65 (100.0%) |
Commute Time in Cedar Rock
The most frequently occuring commute durations in Cedar Rock are 15 to 19 minutes (54 commuters, 32.5%), 5 to 9 minutes (27 commuters, 16.3%), and 30 to 34 minutes (23 commuters, 13.9%).
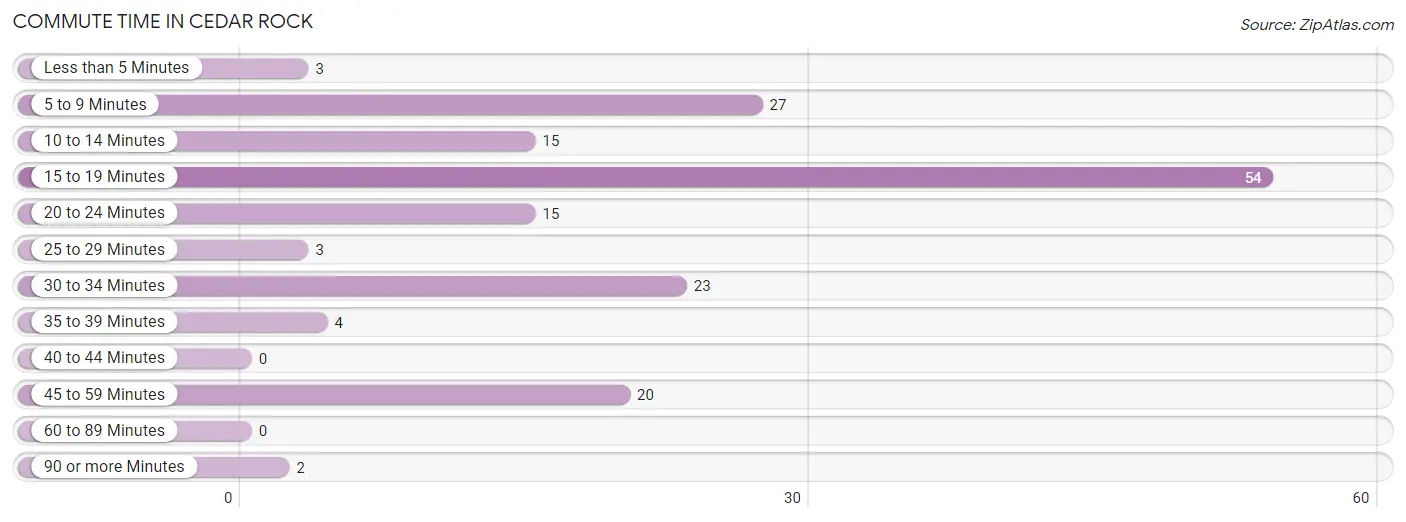
| Commute Time | # Commuters | % Commuters |
| Less than 5 Minutes | 3 | 1.8% |
| 5 to 9 Minutes | 27 | 16.3% |
| 10 to 14 Minutes | 15 | 9.0% |
| 15 to 19 Minutes | 54 | 32.5% |
| 20 to 24 Minutes | 15 | 9.0% |
| 25 to 29 Minutes | 3 | 1.8% |
| 30 to 34 Minutes | 23 | 13.9% |
| 35 to 39 Minutes | 4 | 2.4% |
| 40 to 44 Minutes | 0 | 0.0% |
| 45 to 59 Minutes | 20 | 12.0% |
| 60 to 89 Minutes | 0 | 0.0% |
| 90 or more Minutes | 2 | 1.2% |
Commute Time by Sex in Cedar Rock
The most common commute times in Cedar Rock are 15 to 19 minutes (32 commuters, 29.6%) for males and 15 to 19 minutes (22 commuters, 37.9%) for females.
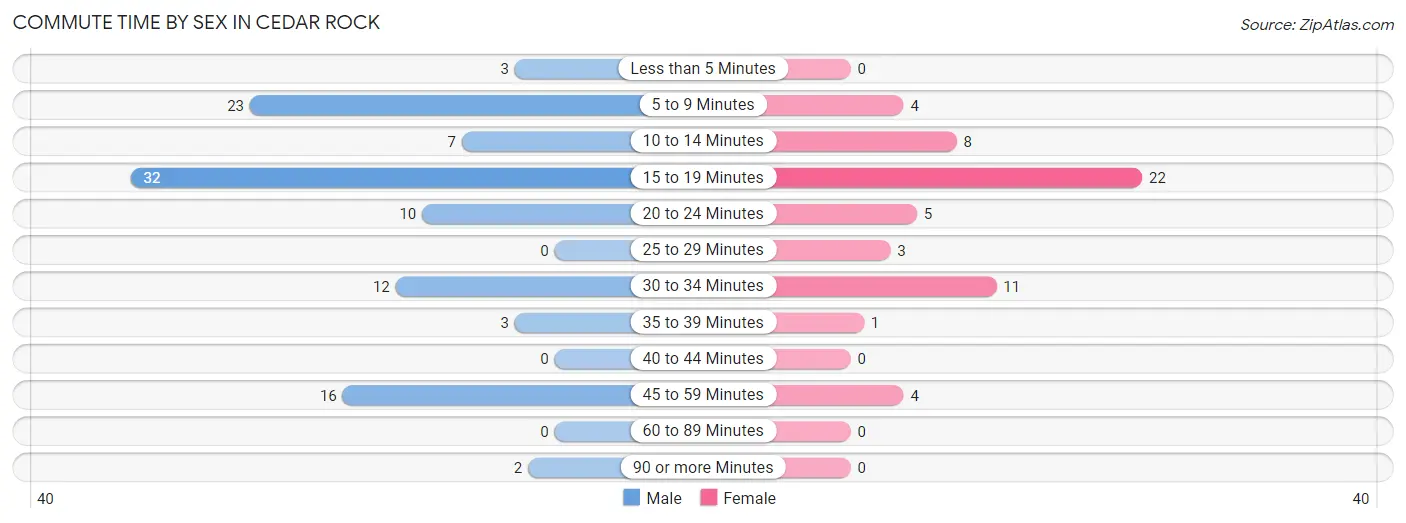
| Commute Time | Male | Female |
| Less than 5 Minutes | 3 (2.8%) | 0 (0.0%) |
| 5 to 9 Minutes | 23 (21.3%) | 4 (6.9%) |
| 10 to 14 Minutes | 7 (6.5%) | 8 (13.8%) |
| 15 to 19 Minutes | 32 (29.6%) | 22 (37.9%) |
| 20 to 24 Minutes | 10 (9.3%) | 5 (8.6%) |
| 25 to 29 Minutes | 0 (0.0%) | 3 (5.2%) |
| 30 to 34 Minutes | 12 (11.1%) | 11 (19.0%) |
| 35 to 39 Minutes | 3 (2.8%) | 1 (1.7%) |
| 40 to 44 Minutes | 0 (0.0%) | 0 (0.0%) |
| 45 to 59 Minutes | 16 (14.8%) | 4 (6.9%) |
| 60 to 89 Minutes | 0 (0.0%) | 0 (0.0%) |
| 90 or more Minutes | 2 (1.8%) | 0 (0.0%) |
Time of Departure to Work by Sex in Cedar Rock
The most frequent times of departure to work in Cedar Rock are 7:30 AM to 7:59 AM (45, 41.7%) for males and 7:00 AM to 7:29 AM (23, 39.7%) for females.
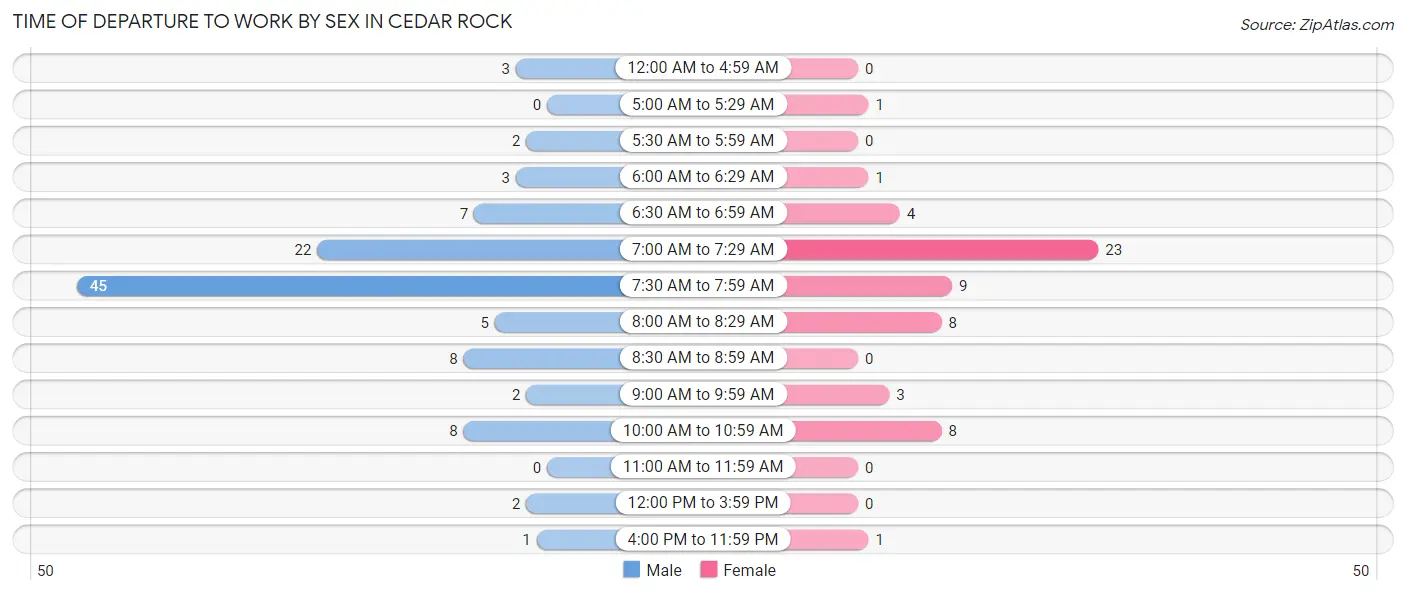
| Time of Departure | Male | Female |
| 12:00 AM to 4:59 AM | 3 (2.8%) | 0 (0.0%) |
| 5:00 AM to 5:29 AM | 0 (0.0%) | 1 (1.7%) |
| 5:30 AM to 5:59 AM | 2 (1.8%) | 0 (0.0%) |
| 6:00 AM to 6:29 AM | 3 (2.8%) | 1 (1.7%) |
| 6:30 AM to 6:59 AM | 7 (6.5%) | 4 (6.9%) |
| 7:00 AM to 7:29 AM | 22 (20.4%) | 23 (39.7%) |
| 7:30 AM to 7:59 AM | 45 (41.7%) | 9 (15.5%) |
| 8:00 AM to 8:29 AM | 5 (4.6%) | 8 (13.8%) |
| 8:30 AM to 8:59 AM | 8 (7.4%) | 0 (0.0%) |
| 9:00 AM to 9:59 AM | 2 (1.8%) | 3 (5.2%) |
| 10:00 AM to 10:59 AM | 8 (7.4%) | 8 (13.8%) |
| 11:00 AM to 11:59 AM | 0 (0.0%) | 0 (0.0%) |
| 12:00 PM to 3:59 PM | 2 (1.8%) | 0 (0.0%) |
| 4:00 PM to 11:59 PM | 1 (0.9%) | 1 (1.7%) |
| Total | 108 (100.0%) | 58 (100.0%) |
Housing Occupancy in Cedar Rock
Occupancy by Ownership in Cedar Rock
Of the total 164 dwellings in Cedar Rock, owner-occupied units account for 154 (93.9%), while renter-occupied units make up 10 (6.1%).
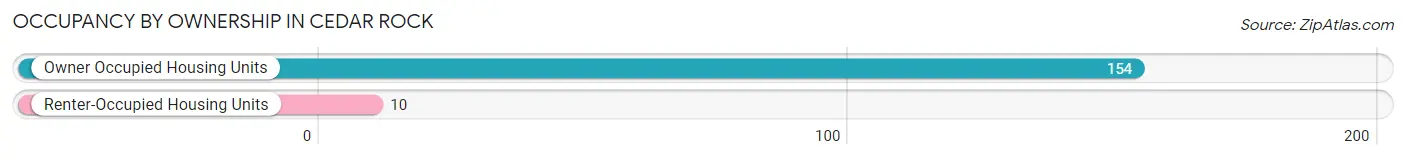
| Occupancy | # Housing Units | % Housing Units |
| Owner Occupied Housing Units | 154 | 93.9% |
| Renter-Occupied Housing Units | 10 | 6.1% |
| Total Occupied Housing Units | 164 | 100.0% |
Occupancy by Household Size in Cedar Rock
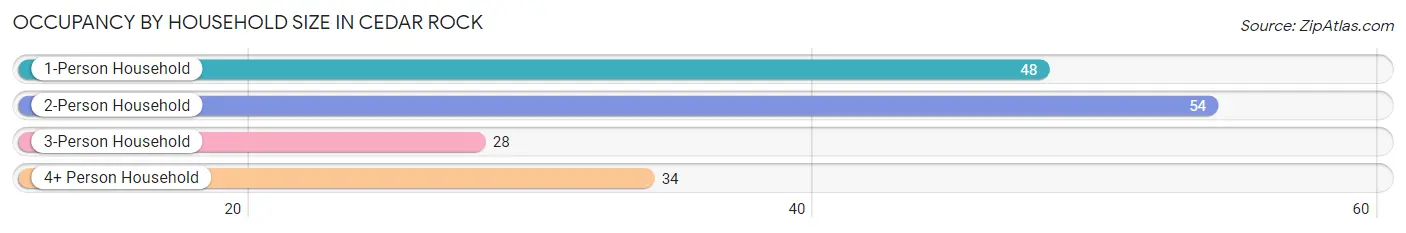
| Household Size | # Housing Units | % Housing Units |
| 1-Person Household | 48 | 29.3% |
| 2-Person Household | 54 | 32.9% |
| 3-Person Household | 28 | 17.1% |
| 4+ Person Household | 34 | 20.7% |
| Total Housing Units | 164 | 100.0% |
Occupancy by Ownership by Household Size in Cedar Rock
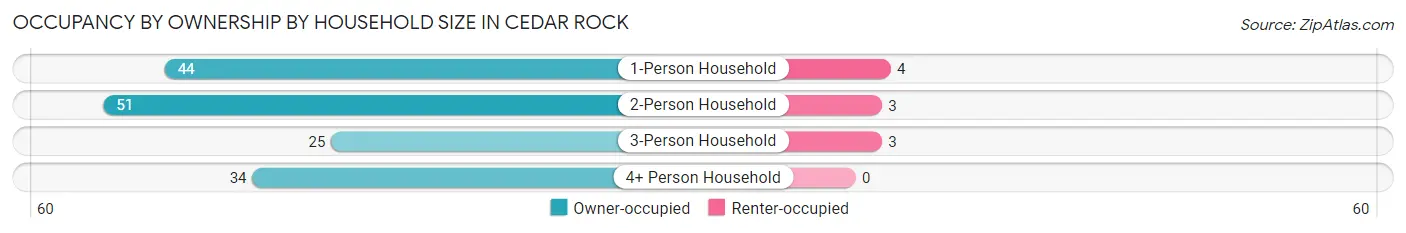
| Household Size | Owner-occupied | Renter-occupied |
| 1-Person Household | 44 (91.7%) | 4 (8.3%) |
| 2-Person Household | 51 (94.4%) | 3 (5.6%) |
| 3-Person Household | 25 (89.3%) | 3 (10.7%) |
| 4+ Person Household | 34 (100.0%) | 0 (0.0%) |
| Total Housing Units | 154 (93.9%) | 10 (6.1%) |
Occupancy by Educational Attainment in Cedar Rock
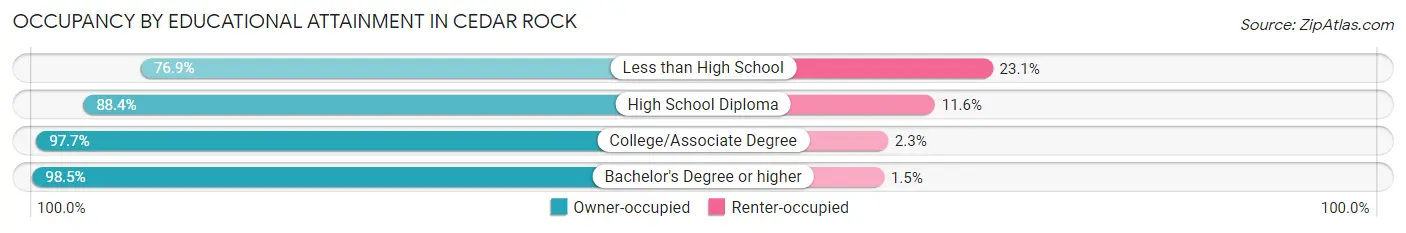
| Household Size | Owner-occupied | Renter-occupied |
| Less than High School | 10 (76.9%) | 3 (23.1%) |
| High School Diploma | 38 (88.4%) | 5 (11.6%) |
| College/Associate Degree | 42 (97.7%) | 1 (2.3%) |
| Bachelor's Degree or higher | 64 (98.5%) | 1 (1.5%) |
Occupancy by Age of Householder in Cedar Rock
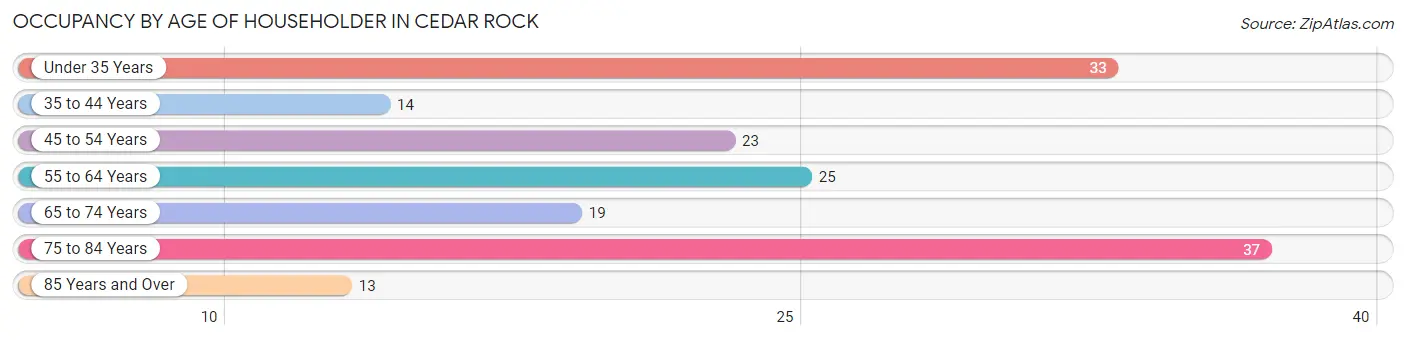
| Age Bracket | # Households | % Households |
| Under 35 Years | 33 | 20.1% |
| 35 to 44 Years | 14 | 8.5% |
| 45 to 54 Years | 23 | 14.0% |
| 55 to 64 Years | 25 | 15.2% |
| 65 to 74 Years | 19 | 11.6% |
| 75 to 84 Years | 37 | 22.6% |
| 85 Years and Over | 13 | 7.9% |
| Total | 164 | 100.0% |
Housing Finances in Cedar Rock
Median Income by Occupancy in Cedar Rock
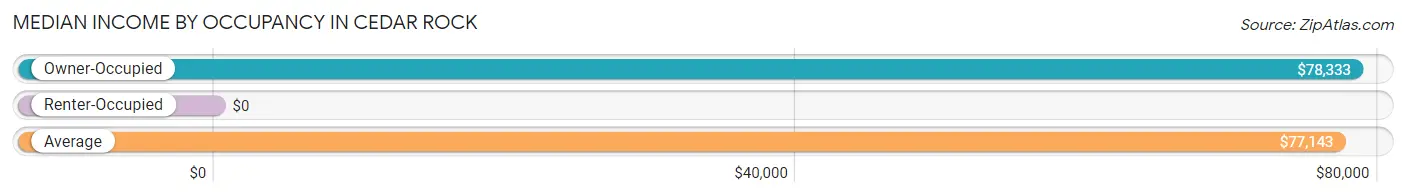
| Occupancy Type | # Households | Median Income |
| Owner-Occupied | 154 (93.9%) | $78,333 |
| Renter-Occupied | 10 (6.1%) | $0 |
| Average | 164 (100.0%) | $77,143 |
Occupancy by Householder Income Bracket in Cedar Rock
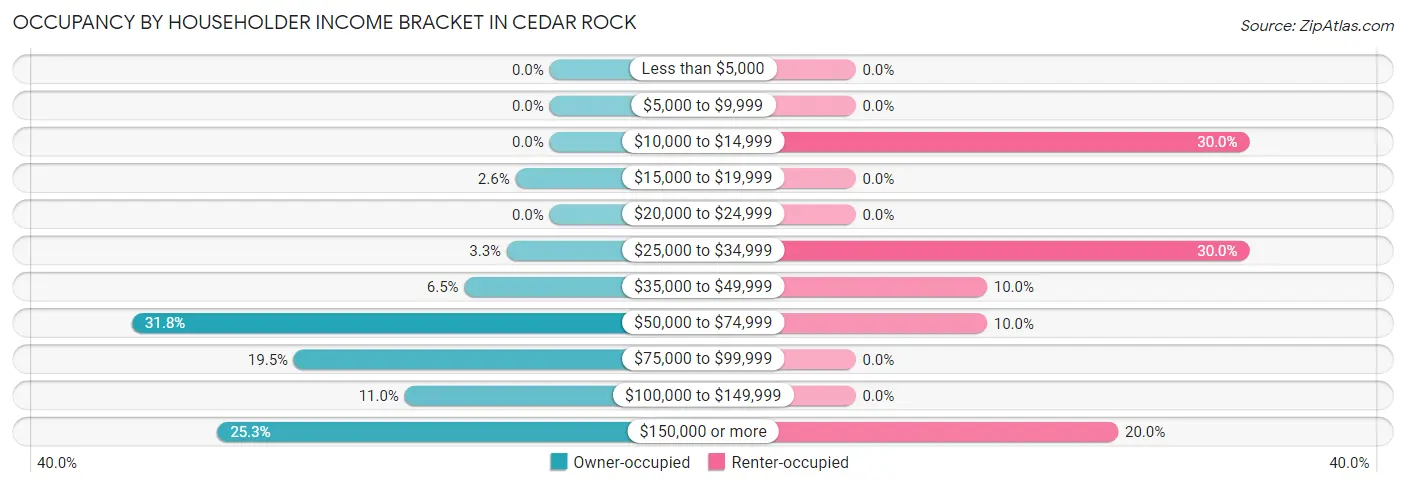
| Income Bracket | Owner-occupied | Renter-occupied |
| Less than $5,000 | 0 (0.0%) | 0 (0.0%) |
| $5,000 to $9,999 | 0 (0.0%) | 0 (0.0%) |
| $10,000 to $14,999 | 0 (0.0%) | 3 (30.0%) |
| $15,000 to $19,999 | 4 (2.6%) | 0 (0.0%) |
| $20,000 to $24,999 | 0 (0.0%) | 0 (0.0%) |
| $25,000 to $34,999 | 5 (3.3%) | 3 (30.0%) |
| $35,000 to $49,999 | 10 (6.5%) | 1 (10.0%) |
| $50,000 to $74,999 | 49 (31.8%) | 1 (10.0%) |
| $75,000 to $99,999 | 30 (19.5%) | 0 (0.0%) |
| $100,000 to $149,999 | 17 (11.0%) | 0 (0.0%) |
| $150,000 or more | 39 (25.3%) | 2 (20.0%) |
| Total | 154 (100.0%) | 10 (100.0%) |
Monthly Housing Cost Tiers in Cedar Rock
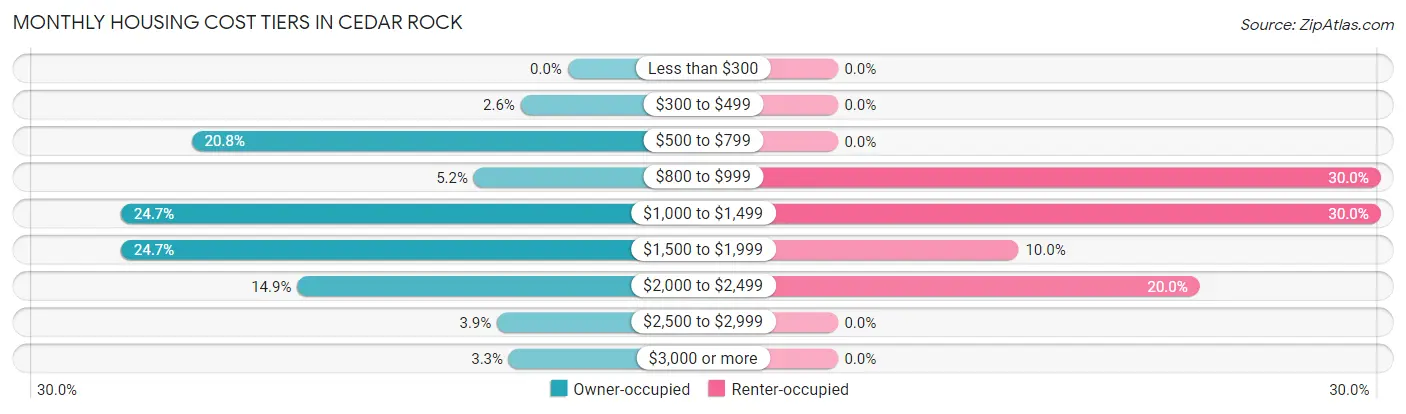
| Monthly Cost | Owner-occupied | Renter-occupied |
| Less than $300 | 0 (0.0%) | 0 (0.0%) |
| $300 to $499 | 4 (2.6%) | 0 (0.0%) |
| $500 to $799 | 32 (20.8%) | 0 (0.0%) |
| $800 to $999 | 8 (5.2%) | 3 (30.0%) |
| $1,000 to $1,499 | 38 (24.7%) | 3 (30.0%) |
| $1,500 to $1,999 | 38 (24.7%) | 1 (10.0%) |
| $2,000 to $2,499 | 23 (14.9%) | 2 (20.0%) |
| $2,500 to $2,999 | 6 (3.9%) | 0 (0.0%) |
| $3,000 or more | 5 (3.3%) | 0 (0.0%) |
| Total | 154 (100.0%) | 10 (100.0%) |
Physical Housing Characteristics in Cedar Rock
Housing Structures in Cedar Rock
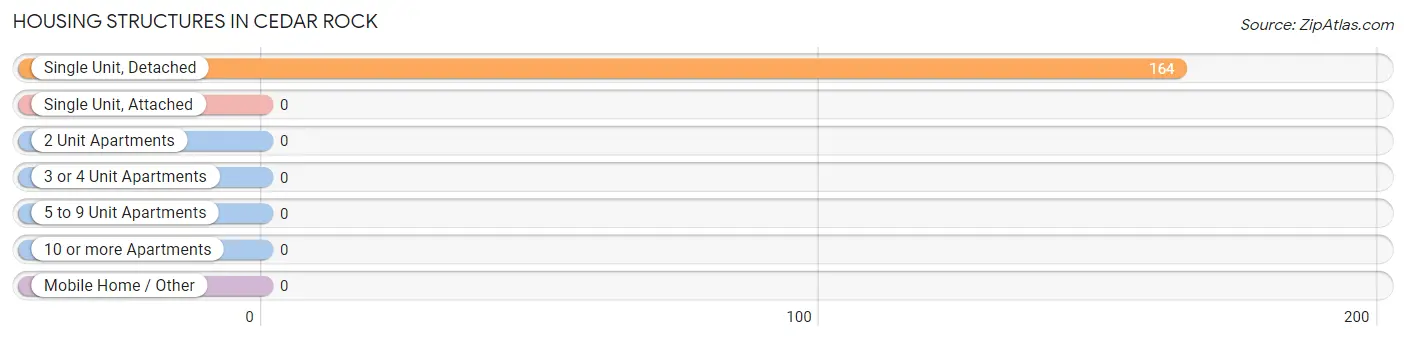
| Structure Type | # Housing Units | % Housing Units |
| Single Unit, Detached | 164 | 100.0% |
| Single Unit, Attached | 0 | 0.0% |
| 2 Unit Apartments | 0 | 0.0% |
| 3 or 4 Unit Apartments | 0 | 0.0% |
| 5 to 9 Unit Apartments | 0 | 0.0% |
| 10 or more Apartments | 0 | 0.0% |
| Mobile Home / Other | 0 | 0.0% |
| Total | 164 | 100.0% |
Housing Structures by Occupancy in Cedar Rock
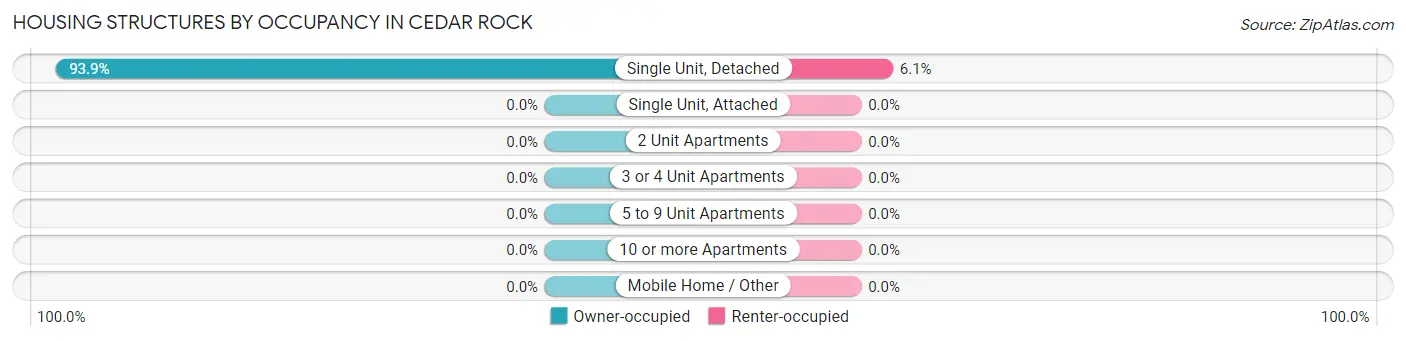
| Structure Type | Owner-occupied | Renter-occupied |
| Single Unit, Detached | 154 (93.9%) | 10 (6.1%) |
| Single Unit, Attached | 0 (0.0%) | 0 (0.0%) |
| 2 Unit Apartments | 0 (0.0%) | 0 (0.0%) |
| 3 or 4 Unit Apartments | 0 (0.0%) | 0 (0.0%) |
| 5 to 9 Unit Apartments | 0 (0.0%) | 0 (0.0%) |
| 10 or more Apartments | 0 (0.0%) | 0 (0.0%) |
| Mobile Home / Other | 0 (0.0%) | 0 (0.0%) |
| Total | 154 (93.9%) | 10 (6.1%) |
Housing Structures by Number of Rooms in Cedar Rock
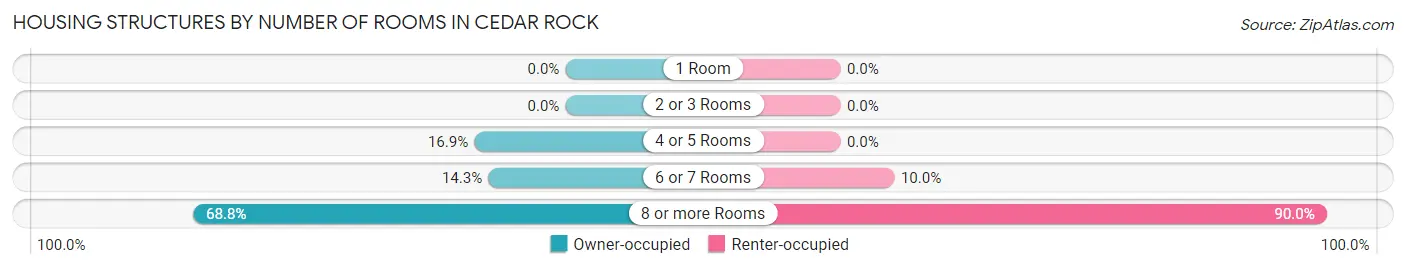
| Number of Rooms | Owner-occupied | Renter-occupied |
| 1 Room | 0 (0.0%) | 0 (0.0%) |
| 2 or 3 Rooms | 0 (0.0%) | 0 (0.0%) |
| 4 or 5 Rooms | 26 (16.9%) | 0 (0.0%) |
| 6 or 7 Rooms | 22 (14.3%) | 1 (10.0%) |
| 8 or more Rooms | 106 (68.8%) | 9 (90.0%) |
| Total | 154 (100.0%) | 10 (100.0%) |
Housing Structure by Heating Type in Cedar Rock
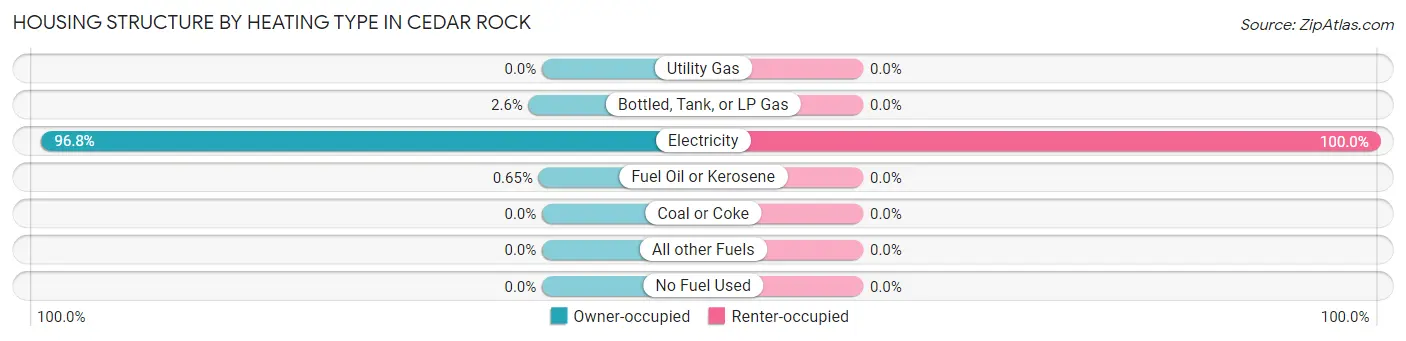
| Heating Type | Owner-occupied | Renter-occupied |
| Utility Gas | 0 (0.0%) | 0 (0.0%) |
| Bottled, Tank, or LP Gas | 4 (2.6%) | 0 (0.0%) |
| Electricity | 149 (96.8%) | 10 (100.0%) |
| Fuel Oil or Kerosene | 1 (0.6%) | 0 (0.0%) |
| Coal or Coke | 0 (0.0%) | 0 (0.0%) |
| All other Fuels | 0 (0.0%) | 0 (0.0%) |
| No Fuel Used | 0 (0.0%) | 0 (0.0%) |
| Total | 154 (100.0%) | 10 (100.0%) |
Household Vehicle Usage in Cedar Rock
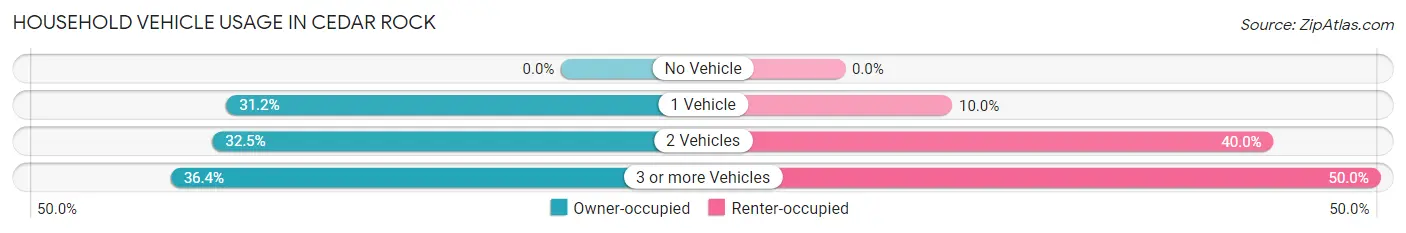
| Vehicles per Household | Owner-occupied | Renter-occupied |
| No Vehicle | 0 (0.0%) | 0 (0.0%) |
| 1 Vehicle | 48 (31.2%) | 1 (10.0%) |
| 2 Vehicles | 50 (32.5%) | 4 (40.0%) |
| 3 or more Vehicles | 56 (36.4%) | 5 (50.0%) |
| Total | 154 (100.0%) | 10 (100.0%) |
Real Estate & Mortgages in Cedar Rock
Real Estate and Mortgage Overview in Cedar Rock
| Characteristic | Without Mortgage | With Mortgage |
| Housing Units | 49 | 105 |
| Median Property Value | $446,900 | $322,100 |
| Median Household Income | $84,063 | $26 |
| Monthly Housing Costs | $650 | $5 |
| Real Estate Taxes | $2,750 | $2 |
Property Value by Mortgage Status in Cedar Rock
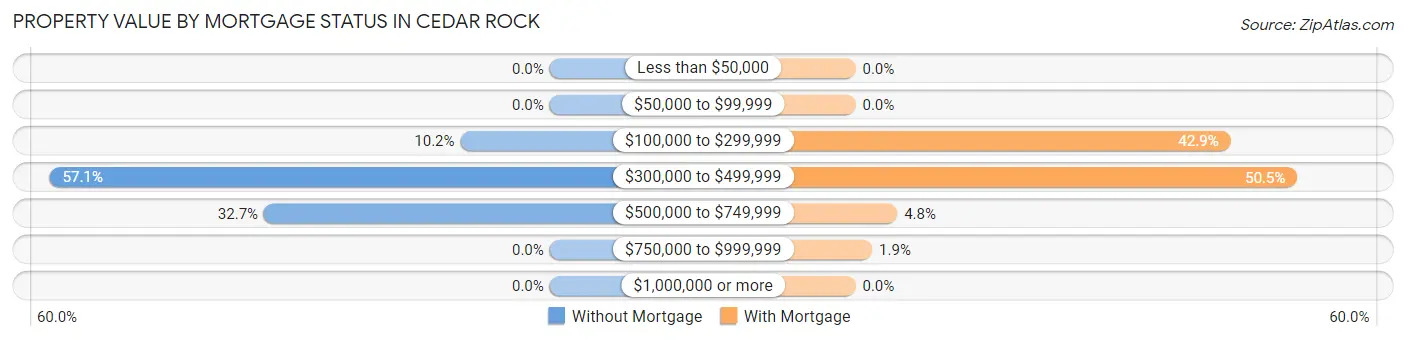
| Property Value | Without Mortgage | With Mortgage |
| Less than $50,000 | 0 (0.0%) | 0 (0.0%) |
| $50,000 to $99,999 | 0 (0.0%) | 0 (0.0%) |
| $100,000 to $299,999 | 5 (10.2%) | 45 (42.9%) |
| $300,000 to $499,999 | 28 (57.1%) | 53 (50.5%) |
| $500,000 to $749,999 | 16 (32.7%) | 5 (4.8%) |
| $750,000 to $999,999 | 0 (0.0%) | 2 (1.9%) |
| $1,000,000 or more | 0 (0.0%) | 0 (0.0%) |
| Total | 49 (100.0%) | 105 (100.0%) |
Household Income by Mortgage Status in Cedar Rock
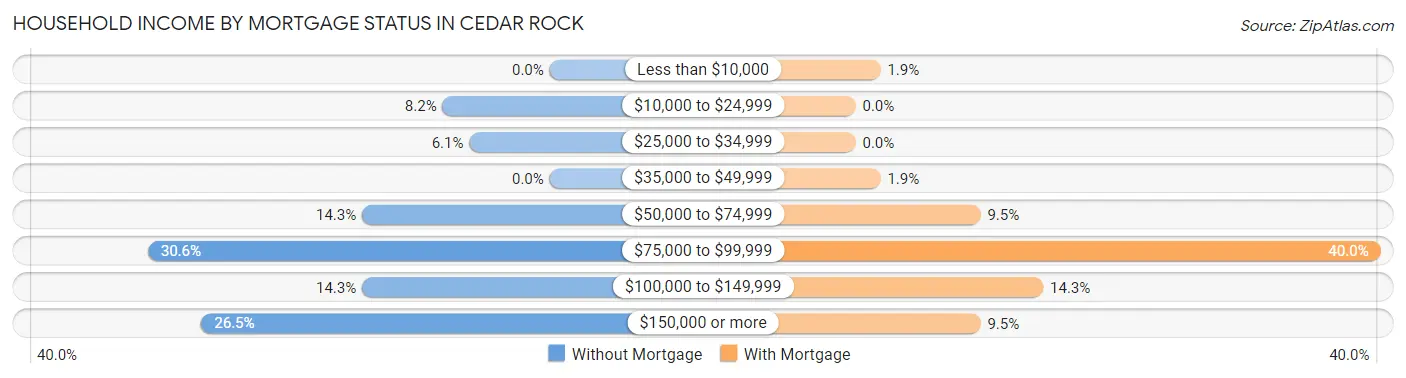
| Household Income | Without Mortgage | With Mortgage |
| Less than $10,000 | 0 (0.0%) | 2 (1.9%) |
| $10,000 to $24,999 | 4 (8.2%) | 0 (0.0%) |
| $25,000 to $34,999 | 3 (6.1%) | 0 (0.0%) |
| $35,000 to $49,999 | 0 (0.0%) | 2 (1.9%) |
| $50,000 to $74,999 | 7 (14.3%) | 10 (9.5%) |
| $75,000 to $99,999 | 15 (30.6%) | 42 (40.0%) |
| $100,000 to $149,999 | 7 (14.3%) | 15 (14.3%) |
| $150,000 or more | 13 (26.5%) | 10 (9.5%) |
| Total | 49 (100.0%) | 105 (100.0%) |
Property Value to Household Income Ratio in Cedar Rock
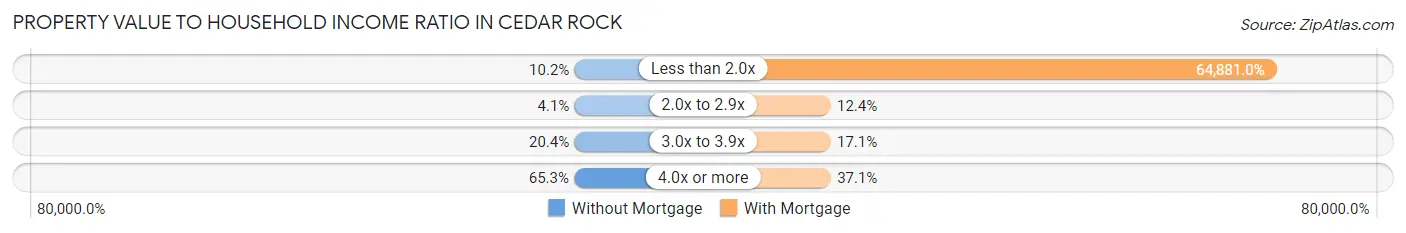
| Value-to-Income Ratio | Without Mortgage | With Mortgage |
| Less than 2.0x | 5 (10.2%) | 68,125 (64,880.9%) |
| 2.0x to 2.9x | 2 (4.1%) | 13 (12.4%) |
| 3.0x to 3.9x | 10 (20.4%) | 18 (17.1%) |
| 4.0x or more | 32 (65.3%) | 39 (37.1%) |
| Total | 49 (100.0%) | 105 (100.0%) |
Real Estate Taxes by Mortgage Status in Cedar Rock

| Property Taxes | Without Mortgage | With Mortgage |
| Less than $800 | 0 (0.0%) | 0 (0.0%) |
| $800 to $1,499 | 2 (4.1%) | 0 (0.0%) |
| $800 to $1,499 | 47 (95.9%) | 23 (21.9%) |
| Total | 49 (100.0%) | 105 (100.0%) |
Health & Disability in Cedar Rock
Health Insurance Coverage by Age in Cedar Rock
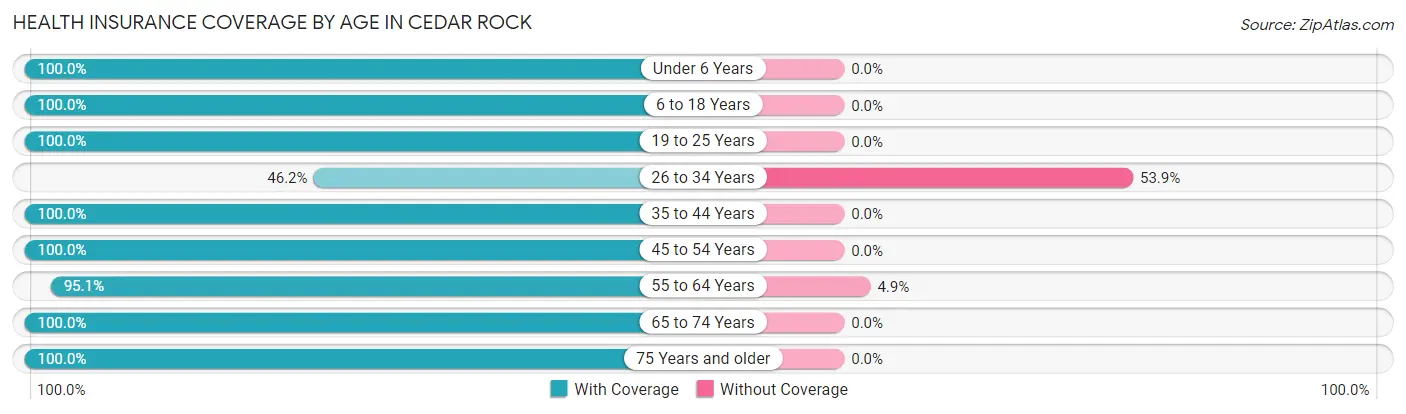
| Age Bracket | With Coverage | Without Coverage |
| Under 6 Years | 29 (100.0%) | 0 (0.0%) |
| 6 to 18 Years | 66 (100.0%) | 0 (0.0%) |
| 19 to 25 Years | 25 (100.0%) | 0 (0.0%) |
| 26 to 34 Years | 24 (46.2%) | 28 (53.8%) |
| 35 to 44 Years | 24 (100.0%) | 0 (0.0%) |
| 45 to 54 Years | 59 (100.0%) | 0 (0.0%) |
| 55 to 64 Years | 39 (95.1%) | 2 (4.9%) |
| 65 to 74 Years | 39 (100.0%) | 0 (0.0%) |
| 75 Years and older | 74 (100.0%) | 0 (0.0%) |
| Total | 379 (92.7%) | 30 (7.3%) |
Health Insurance Coverage by Citizenship Status in Cedar Rock

| Citizenship Status | With Coverage | Without Coverage |
| Native Born | 29 (100.0%) | 0 (0.0%) |
| Foreign Born, Citizen | 66 (100.0%) | 0 (0.0%) |
| Foreign Born, not a Citizen | 25 (100.0%) | 0 (0.0%) |
Health Insurance Coverage by Household Income in Cedar Rock
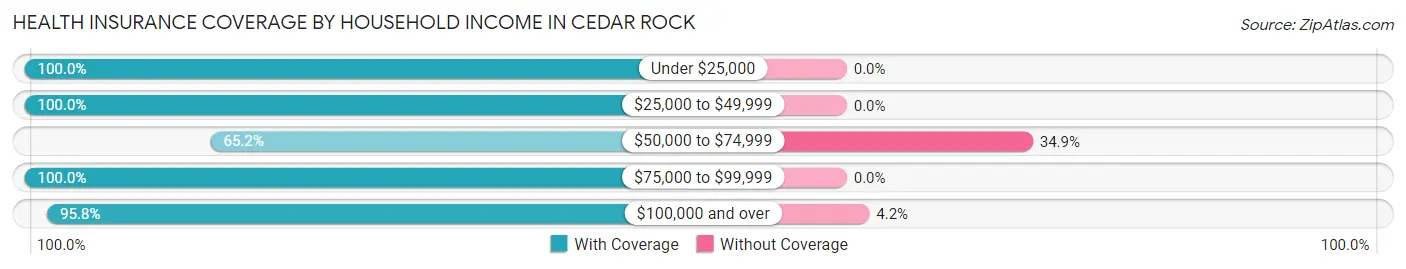
| Household Income | With Coverage | Without Coverage |
| Under $25,000 | 7 (100.0%) | 0 (0.0%) |
| $25,000 to $49,999 | 65 (100.0%) | 0 (0.0%) |
| $50,000 to $74,999 | 43 (65.1%) | 23 (34.8%) |
| $75,000 to $99,999 | 105 (100.0%) | 0 (0.0%) |
| $100,000 and over | 159 (95.8%) | 7 (4.2%) |
Public vs Private Health Insurance Coverage by Age in Cedar Rock
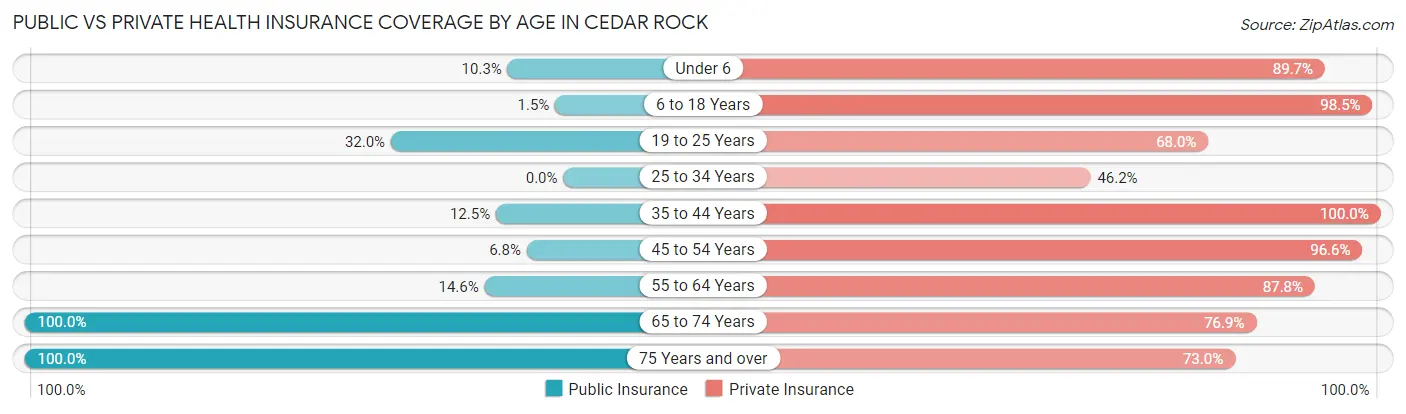
| Age Bracket | Public Insurance | Private Insurance |
| Under 6 | 3 (10.3%) | 26 (89.7%) |
| 6 to 18 Years | 1 (1.5%) | 65 (98.5%) |
| 19 to 25 Years | 8 (32.0%) | 17 (68.0%) |
| 25 to 34 Years | 0 (0.0%) | 24 (46.2%) |
| 35 to 44 Years | 3 (12.5%) | 24 (100.0%) |
| 45 to 54 Years | 4 (6.8%) | 57 (96.6%) |
| 55 to 64 Years | 6 (14.6%) | 36 (87.8%) |
| 65 to 74 Years | 39 (100.0%) | 30 (76.9%) |
| 75 Years and over | 74 (100.0%) | 54 (73.0%) |
| Total | 138 (33.7%) | 333 (81.4%) |
Disability Status by Sex by Age in Cedar Rock
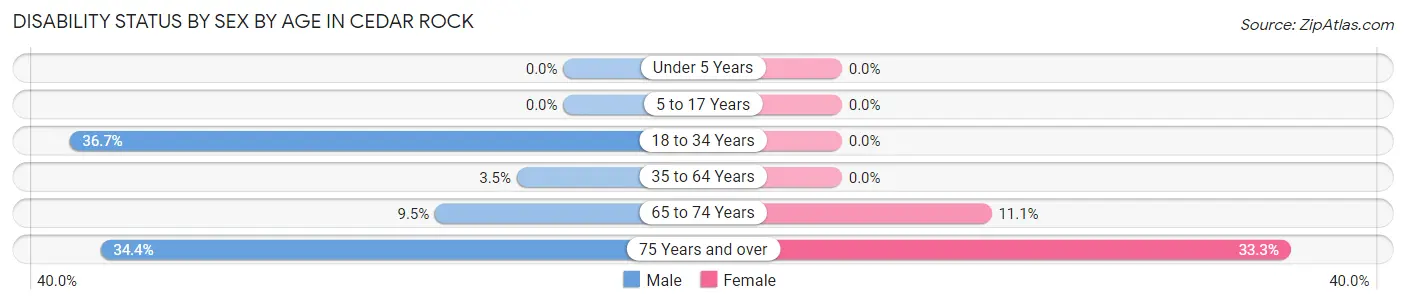
| Age Bracket | Male | Female |
| Under 5 Years | 0 (0.0%) | 0 (0.0%) |
| 5 to 17 Years | 0 (0.0%) | 0 (0.0%) |
| 18 to 34 Years | 22 (36.7%) | 0 (0.0%) |
| 35 to 64 Years | 2 (3.5%) | 0 (0.0%) |
| 65 to 74 Years | 2 (9.5%) | 2 (11.1%) |
| 75 Years and over | 11 (34.4%) | 14 (33.3%) |
Disability Class by Sex by Age in Cedar Rock
Disability Class: Hearing Difficulty
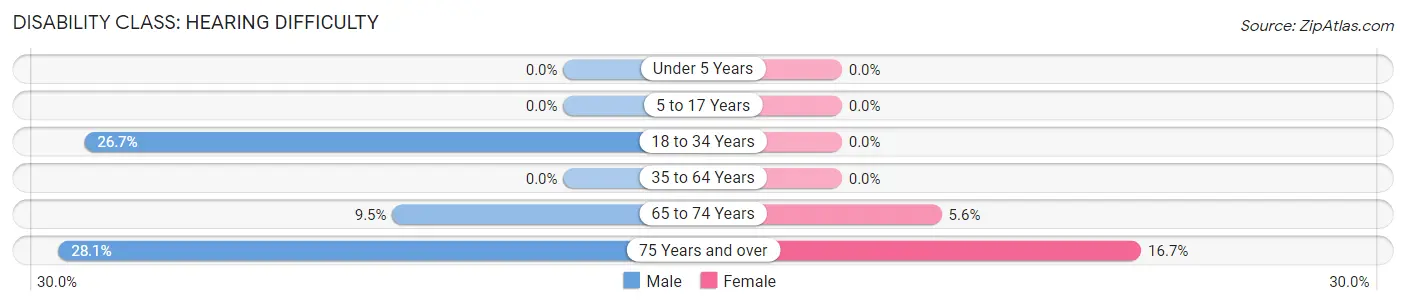
| Age Bracket | Male | Female |
| Under 5 Years | 0 (0.0%) | 0 (0.0%) |
| 5 to 17 Years | 0 (0.0%) | 0 (0.0%) |
| 18 to 34 Years | 16 (26.7%) | 0 (0.0%) |
| 35 to 64 Years | 0 (0.0%) | 0 (0.0%) |
| 65 to 74 Years | 2 (9.5%) | 1 (5.6%) |
| 75 Years and over | 9 (28.1%) | 7 (16.7%) |
Disability Class: Vision Difficulty
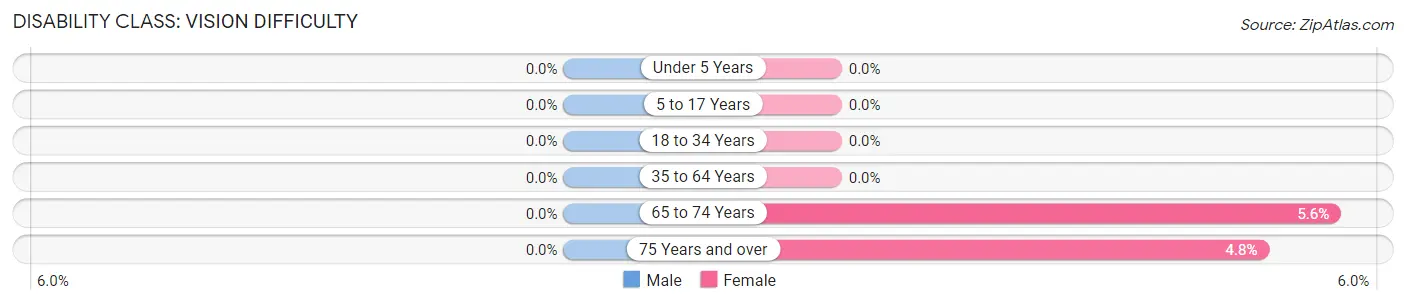
| Age Bracket | Male | Female |
| Under 5 Years | 0 (0.0%) | 0 (0.0%) |
| 5 to 17 Years | 0 (0.0%) | 0 (0.0%) |
| 18 to 34 Years | 0 (0.0%) | 0 (0.0%) |
| 35 to 64 Years | 0 (0.0%) | 0 (0.0%) |
| 65 to 74 Years | 0 (0.0%) | 1 (5.6%) |
| 75 Years and over | 0 (0.0%) | 2 (4.8%) |
Disability Class: Cognitive Difficulty
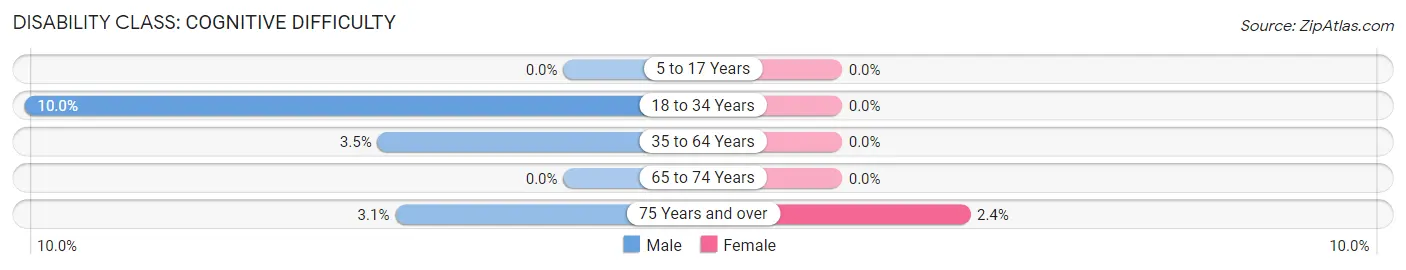
| Age Bracket | Male | Female |
| 5 to 17 Years | 0 (0.0%) | 0 (0.0%) |
| 18 to 34 Years | 6 (10.0%) | 0 (0.0%) |
| 35 to 64 Years | 2 (3.5%) | 0 (0.0%) |
| 65 to 74 Years | 0 (0.0%) | 0 (0.0%) |
| 75 Years and over | 1 (3.1%) | 1 (2.4%) |
Disability Class: Ambulatory Difficulty
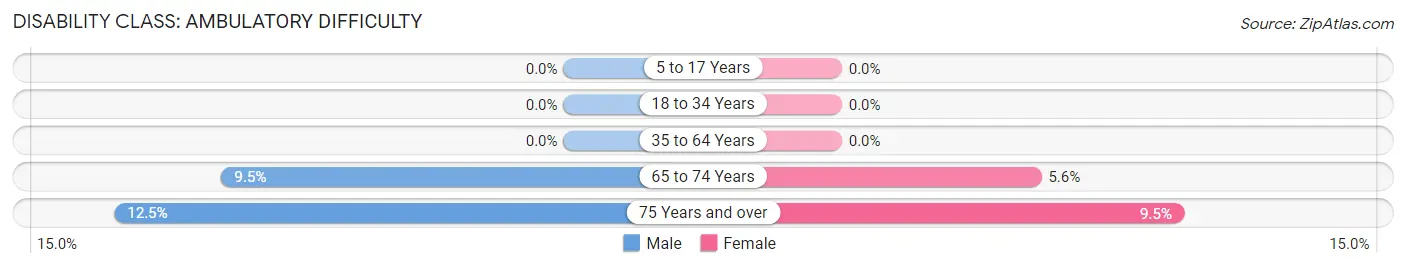
| Age Bracket | Male | Female |
| 5 to 17 Years | 0 (0.0%) | 0 (0.0%) |
| 18 to 34 Years | 0 (0.0%) | 0 (0.0%) |
| 35 to 64 Years | 0 (0.0%) | 0 (0.0%) |
| 65 to 74 Years | 2 (9.5%) | 1 (5.6%) |
| 75 Years and over | 4 (12.5%) | 4 (9.5%) |
Disability Class: Self-Care Difficulty
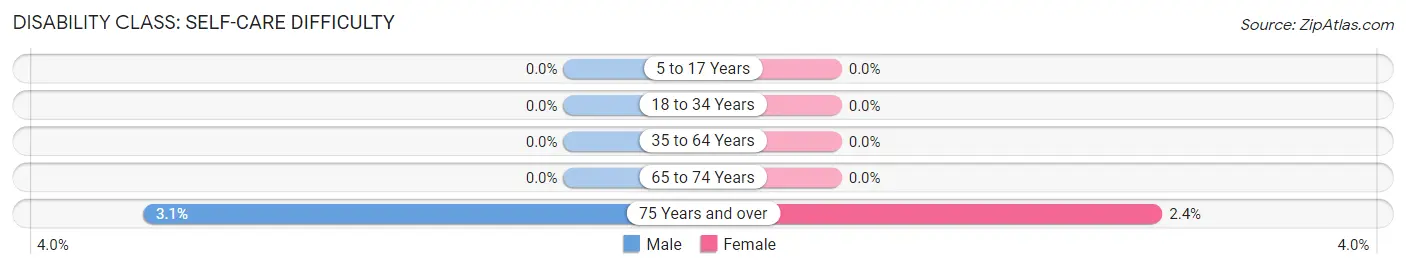
| Age Bracket | Male | Female |
| 5 to 17 Years | 0 (0.0%) | 0 (0.0%) |
| 18 to 34 Years | 0 (0.0%) | 0 (0.0%) |
| 35 to 64 Years | 0 (0.0%) | 0 (0.0%) |
| 65 to 74 Years | 0 (0.0%) | 0 (0.0%) |
| 75 Years and over | 1 (3.1%) | 1 (2.4%) |
Technology Access in Cedar Rock
Computing Device Access in Cedar Rock
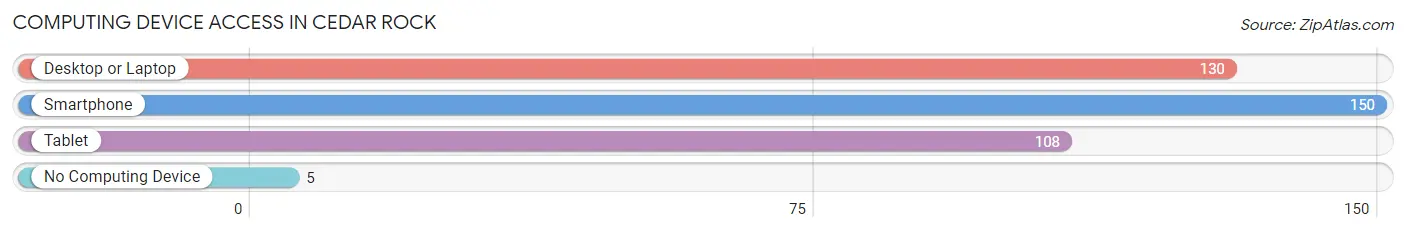
| Device Type | # Households | % Households |
| Desktop or Laptop | 130 | 79.3% |
| Smartphone | 150 | 91.5% |
| Tablet | 108 | 65.8% |
| No Computing Device | 5 | 3.0% |
| Total | 164 | 100.0% |
Internet Access in Cedar Rock
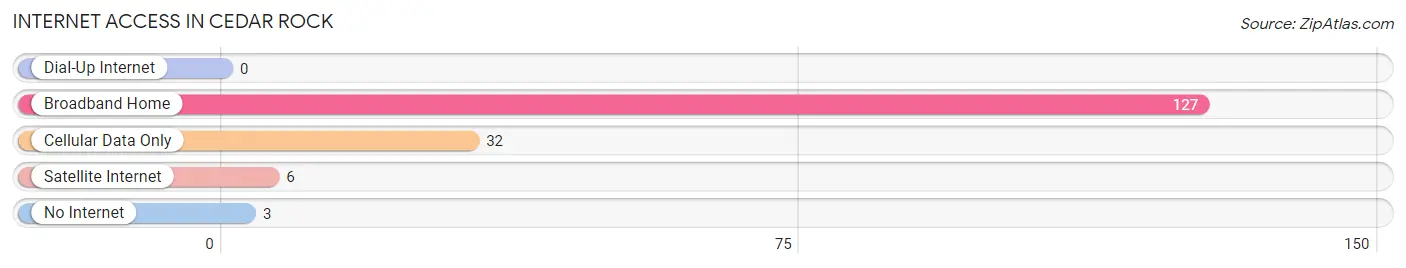
| Internet Type | # Households | % Households |
| Dial-Up Internet | 0 | 0.0% |
| Broadband Home | 127 | 77.4% |
| Cellular Data Only | 32 | 19.5% |
| Satellite Internet | 6 | 3.7% |
| No Internet | 3 | 1.8% |
| Total | 164 | 100.0% |
Cedar Rock Summary
Cedar Rock is a small unincorporated community located in the foothills of the Blue Ridge Mountains in western North Carolina. It is situated in the eastern part of Caldwell County, approximately 20 miles east of the city of Lenoir. The community is located along the banks of the Catawba River, and is surrounded by the towns of Granite Falls, Hudson, and Rhodhiss.
History
The area that is now Cedar Rock was first settled in the late 1700s by a group of German immigrants. The settlers named the area “Cedar Rock” after the abundance of cedar trees in the area. The community was officially established in 1845, when the first post office was opened.
In the late 1800s, Cedar Rock became a popular destination for tourists, who came to enjoy the area’s natural beauty and outdoor activities. The town was also home to several mills, which provided employment for many of the local residents.
In the early 1900s, Cedar Rock was a thriving community with a population of over 500 people. The town had several stores, a hotel, a school, and a church. The town also had a railroad station, which connected it to the larger cities of Lenoir and Hickory.
In the mid-1900s, the population of Cedar Rock began to decline as people moved away in search of better job opportunities. By the late 1990s, the population had dropped to just over 200 people.
Geography
Cedar Rock is located in the foothills of the Blue Ridge Mountains in western North Carolina. The town is situated in the eastern part of Caldwell County, approximately 20 miles east of the city of Lenoir. The community is located along the banks of the Catawba River, and is surrounded by the towns of Granite Falls, Hudson, and Rhodhiss.
The terrain of Cedar Rock is mostly hilly, with some flat areas near the river. The area is heavily forested, with a mix of hardwood and evergreen trees. The climate is mild, with temperatures ranging from the mid-30s in the winter to the mid-80s in the summer.
Economy
The economy of Cedar Rock is largely based on tourism and agriculture. The town is home to several small businesses, including a general store, a restaurant, and a bed and breakfast. The town also has a small airport, which serves as a hub for private planes.
Agriculture is also an important part of the local economy. The area is home to several farms, which produce a variety of crops, including corn, soybeans, and tobacco.
Demographics
As of the 2010 census, the population of Cedar Rock was estimated to be 214 people. The racial makeup of the town was 97.2% White, 0.9% African American, 0.5% Native American, 0.5% Asian, and 0.9% from other races. The median household income was $31,250, and the median age was 44.7 years.
Conclusion
Cedar Rock is a small unincorporated community located in the foothills of the Blue Ridge Mountains in western North Carolina. The town has a long history, and was once a thriving community with a population of over 500 people. Today, the town is largely dependent on tourism and agriculture, and has a population of just over 200 people.
Common Questions
What is Per Capita Income in Cedar Rock?
Per Capita income in Cedar Rock is $45,783.
What is the Median Family Income in Cedar Rock?
Median Family Income in Cedar Rock is $86,563.
What is the Median Household income in Cedar Rock?
Median Household Income in Cedar Rock is $77,143.
What is Income or Wage Gap in Cedar Rock?
Income or Wage Gap in Cedar Rock is 45.6%.
Women in Cedar Rock earn 54.4 cents for every dollar earned by a man.
What is Inequality or Gini Index in Cedar Rock?
Inequality or Gini Index in Cedar Rock is 0.39.
What is the Total Population of Cedar Rock?
Total Population of Cedar Rock is 409.
What is the Total Male Population of Cedar Rock?
Total Male Population of Cedar Rock is 221.
What is the Total Female Population of Cedar Rock?
Total Female Population of Cedar Rock is 188.
What is the Ratio of Males per 100 Females in Cedar Rock?
There are 117.55 Males per 100 Females in Cedar Rock.
What is the Ratio of Females per 100 Males in Cedar Rock?
There are 85.07 Females per 100 Males in Cedar Rock.
What is the Median Population Age in Cedar Rock?
Median Population Age in Cedar Rock is 47.6 Years.
What is the Average Family Size in Cedar Rock
Average Family Size in Cedar Rock is 3.1 People.
What is the Average Household Size in Cedar Rock
Average Household Size in Cedar Rock is 2.5 People.
How Large is the Labor Force in Cedar Rock?
There are 188 People in the Labor Forcein in Cedar Rock.
What is the Percentage of People in the Labor Force in Cedar Rock?
56.3% of People are in the Labor Force in Cedar Rock.
What is the Unemployment Rate in Cedar Rock?
Unemployment Rate in Cedar Rock is 1.6%.