Castle Hayne, NC Map & Demographics
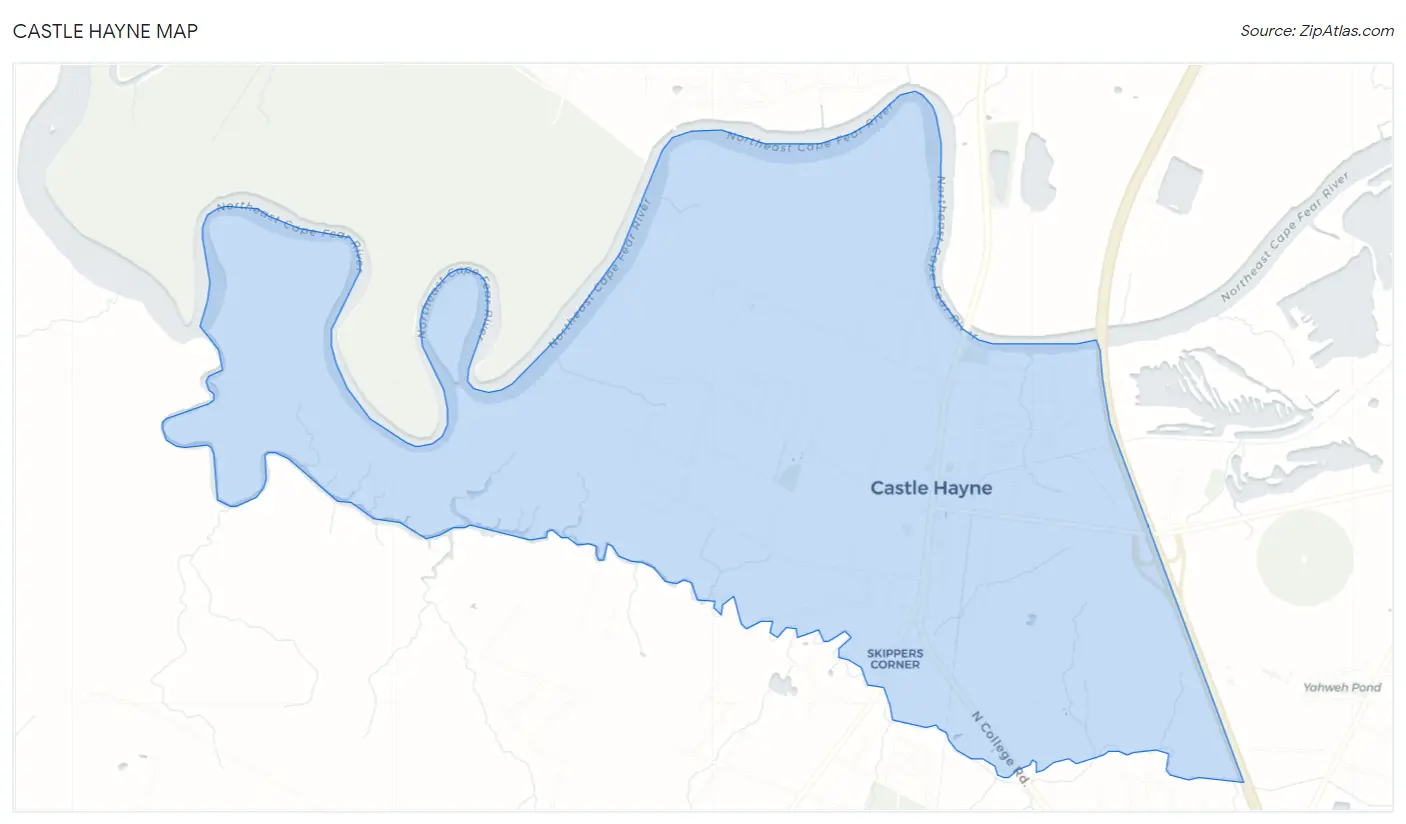
Castle Hayne Map
Castle Hayne Overview
$32,470
PER CAPITA INCOME
$66,327
AVG FAMILY INCOME
$55,625
AVG HOUSEHOLD INCOME
0.34
INEQUALITY / GINI INDEX
970
TOTAL POPULATION
519
MALE POPULATION
451
FEMALE POPULATION
115.08
MALES / 100 FEMALES
86.90
FEMALES / 100 MALES
57.9
MEDIAN AGE
2.4
AVG FAMILY SIZE
1.9
AVG HOUSEHOLD SIZE
502
LABOR FORCE [ PEOPLE ]
57.9%
PERCENT IN LABOR FORCE
4.0%
UNEMPLOYMENT RATE
Castle Hayne Zip Codes
Castle Hayne Area Codes
Income in Castle Hayne
Income Overview in Castle Hayne
Per Capita Income in Castle Hayne is $32,470, while median incomes of families and households are $66,327 and $55,625 respectively.
| Characteristic | Number | Measure |
| Per Capita Income | 970 | $32,470 |
| Median Family Income | 288 | $66,327 |
| Mean Family Income | 288 | $75,719 |
| Median Household Income | 510 | $55,625 |
| Mean Household Income | 510 | $63,714 |
| Income Deficit | 288 | $0 |
| Wage / Income Gap (%) | 970 | 0.00% |
| Wage / Income Gap ($) | 970 | 100.00¢ per $1 |
| Gini / Inequality Index | 970 | 0.34 |
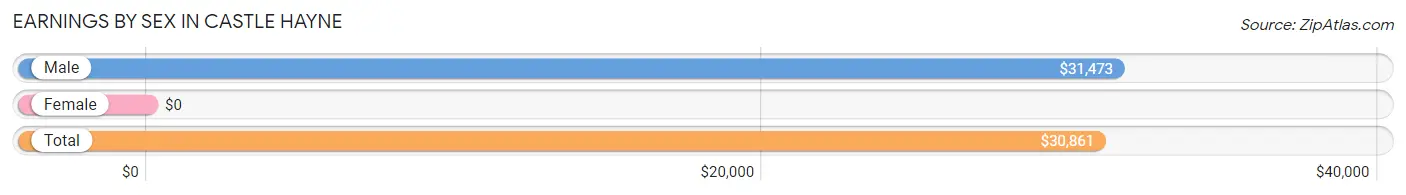
Earnings by Sex in Castle Hayne
| Sex | Number | Average Earnings |
| Male | 342 (68.1%) | $31,473 |
| Female | 160 (31.9%) | $0 |
| Total | 502 (100.0%) | $30,861 |
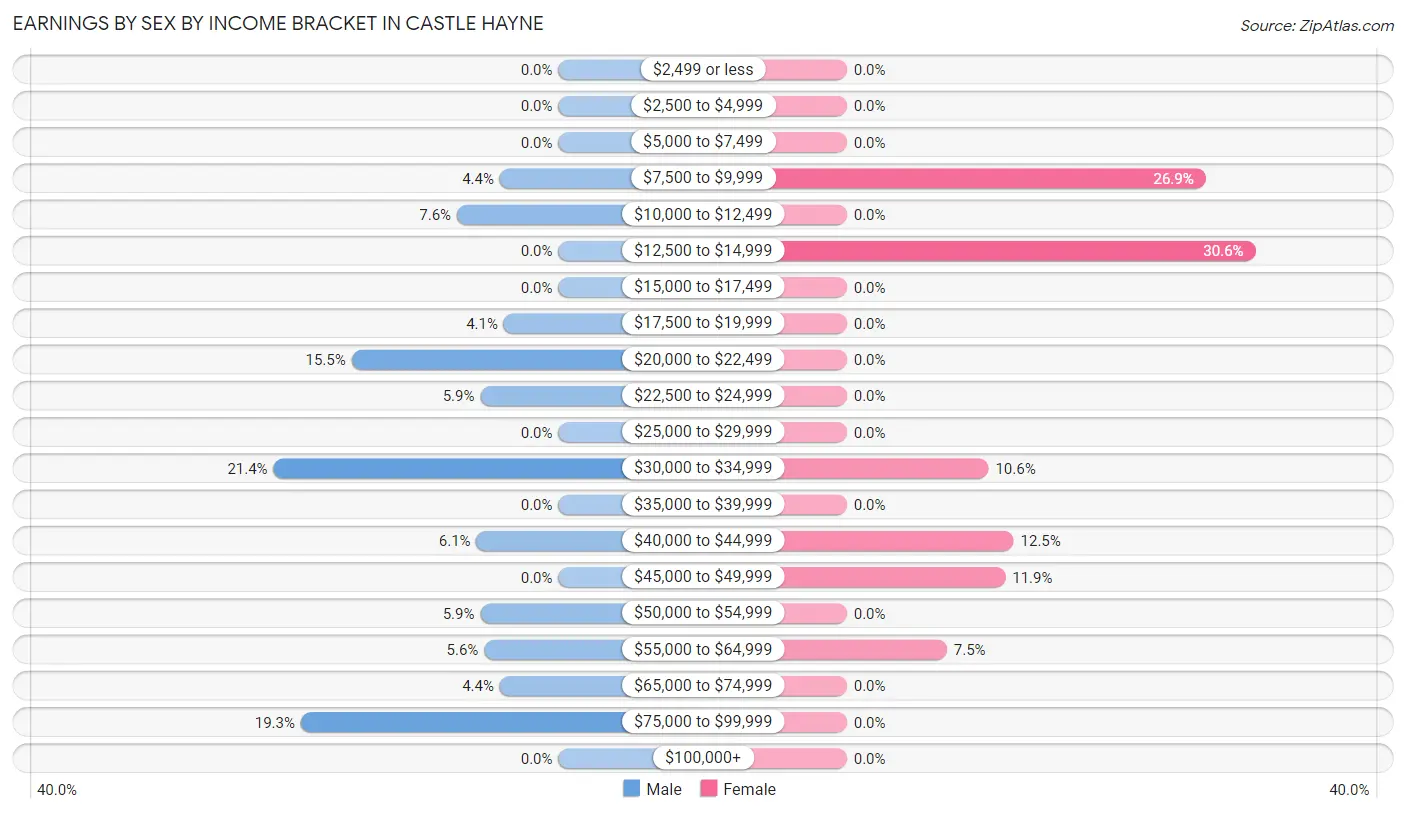
Earnings by Sex by Income Bracket in Castle Hayne
The most common earnings brackets in Castle Hayne are $30,000 to $34,999 for men (73 | 21.3%) and $12,500 to $14,999 for women (49 | 30.6%).
| Income | Male | Female |
| $2,499 or less | 0 (0.0%) | 0 (0.0%) |
| $2,500 to $4,999 | 0 (0.0%) | 0 (0.0%) |
| $5,000 to $7,499 | 0 (0.0%) | 0 (0.0%) |
| $7,500 to $9,999 | 15 (4.4%) | 43 (26.9%) |
| $10,000 to $12,499 | 26 (7.6%) | 0 (0.0%) |
| $12,500 to $14,999 | 0 (0.0%) | 49 (30.6%) |
| $15,000 to $17,499 | 0 (0.0%) | 0 (0.0%) |
| $17,500 to $19,999 | 14 (4.1%) | 0 (0.0%) |
| $20,000 to $22,499 | 53 (15.5%) | 0 (0.0%) |
| $22,500 to $24,999 | 20 (5.9%) | 0 (0.0%) |
| $25,000 to $29,999 | 0 (0.0%) | 0 (0.0%) |
| $30,000 to $34,999 | 73 (21.3%) | 17 (10.6%) |
| $35,000 to $39,999 | 0 (0.0%) | 0 (0.0%) |
| $40,000 to $44,999 | 21 (6.1%) | 20 (12.5%) |
| $45,000 to $49,999 | 0 (0.0%) | 19 (11.9%) |
| $50,000 to $54,999 | 20 (5.9%) | 0 (0.0%) |
| $55,000 to $64,999 | 19 (5.6%) | 12 (7.5%) |
| $65,000 to $74,999 | 15 (4.4%) | 0 (0.0%) |
| $75,000 to $99,999 | 66 (19.3%) | 0 (0.0%) |
| $100,000+ | 0 (0.0%) | 0 (0.0%) |
| Total | 342 (100.0%) | 160 (100.0%) |
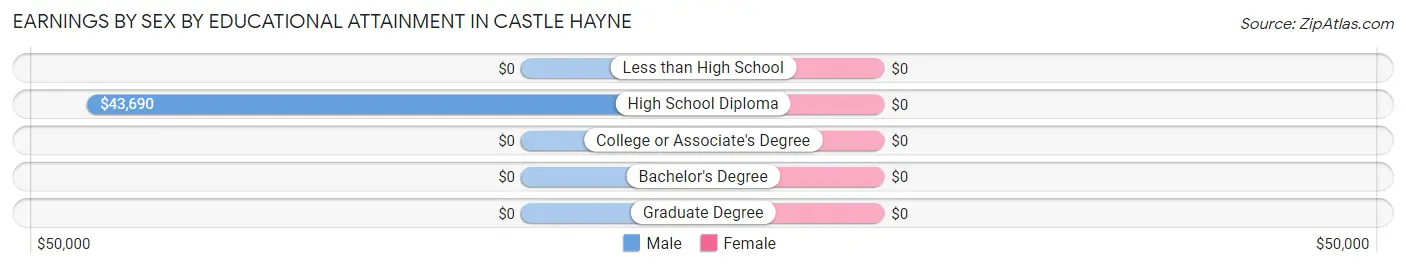
Earnings by Sex by Educational Attainment in Castle Hayne
| Educational Attainment | Male Income | Female Income |
| Less than High School | - | - |
| High School Diploma | $43,690 | $0 |
| College or Associate's Degree | - | - |
| Bachelor's Degree | - | - |
| Graduate Degree | - | - |
| Total | $31,969 | $0 |
Family Income in Castle Hayne
Family Income Brackets in Castle Hayne
According to the Castle Hayne family income data, there are 93 families falling into the $50,000 to $74,999 income range, which is the most common income bracket and makes up 32.3% of all families.
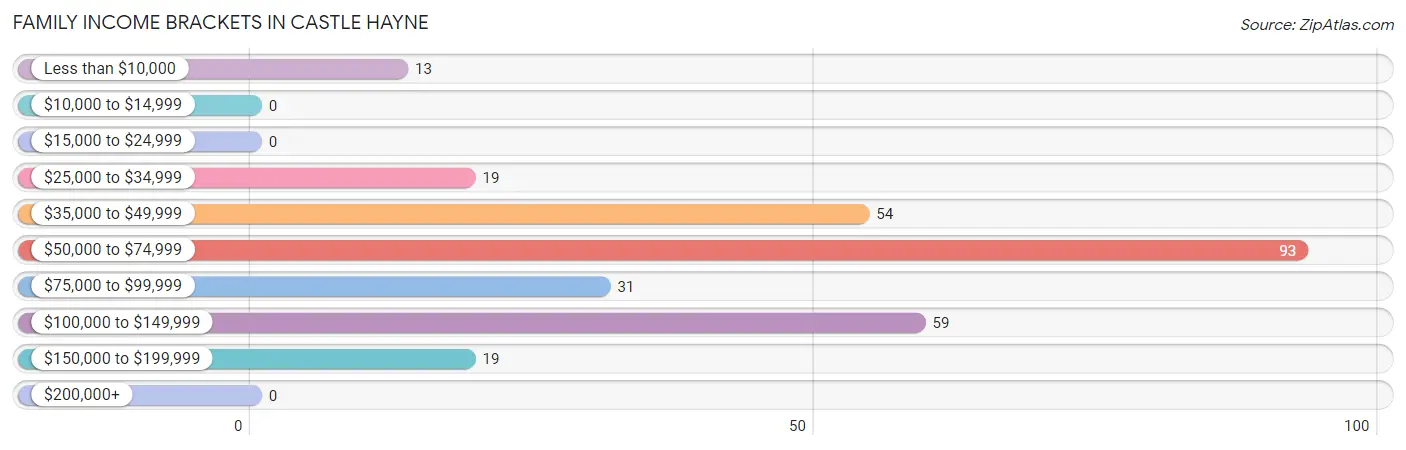
| Income Bracket | # Families | % Families |
| Less than $10,000 | 13 | 4.5% |
| $10,000 to $14,999 | 0 | 0.0% |
| $15,000 to $24,999 | 0 | 0.0% |
| $25,000 to $34,999 | 19 | 6.6% |
| $35,000 to $49,999 | 54 | 18.8% |
| $50,000 to $74,999 | 93 | 32.3% |
| $75,000 to $99,999 | 31 | 10.8% |
| $100,000 to $149,999 | 59 | 20.5% |
| $150,000 to $199,999 | 19 | 6.6% |
| $200,000+ | 0 | 0.0% |
Family Income by Famaliy Size in Castle Hayne
3-person families (52 | 18.1%) account for the highest median family income in Castle Hayne with $68,750 per family, while 2-person families (163 | 56.6%) have the highest median income of $33,456 per family member.
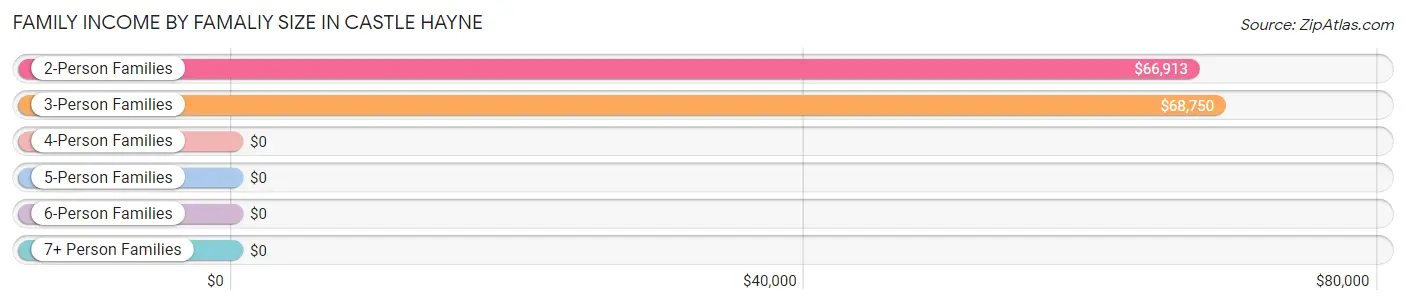
| Income Bracket | # Families | Median Income |
| 2-Person Families | 163 (56.6%) | $66,913 |
| 3-Person Families | 52 (18.1%) | $68,750 |
| 4-Person Families | 54 (18.8%) | $0 |
| 5-Person Families | 19 (6.6%) | $0 |
| 6-Person Families | 0 (0.0%) | $0 |
| 7+ Person Families | 0 (0.0%) | $0 |
| Total | 288 (100.0%) | $66,327 |
Family Income by Number of Earners in Castle Hayne
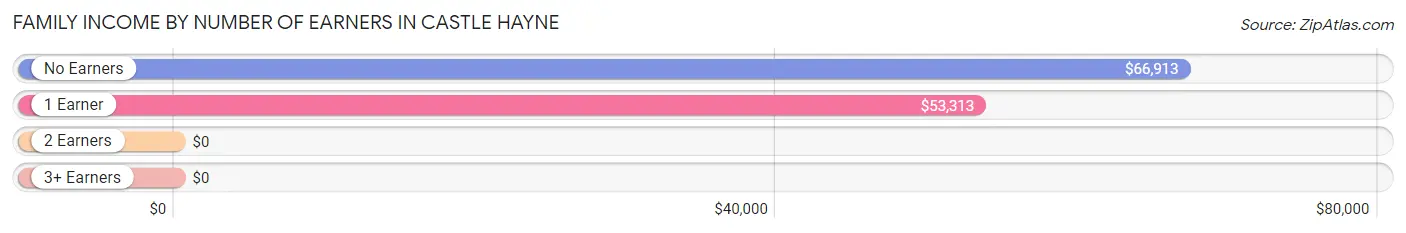
| Number of Earners | # Families | Median Income |
| No Earners | 125 (43.4%) | $66,913 |
| 1 Earner | 51 (17.7%) | $53,313 |
| 2 Earners | 73 (25.4%) | $0 |
| 3+ Earners | 39 (13.5%) | $0 |
| Total | 288 (100.0%) | $66,327 |
Household Income in Castle Hayne
Household Income Brackets in Castle Hayne
With 108 households falling in the category, the $50,000 to $74,999 income range is the most frequent in Castle Hayne, accounting for 21.2% of all households.
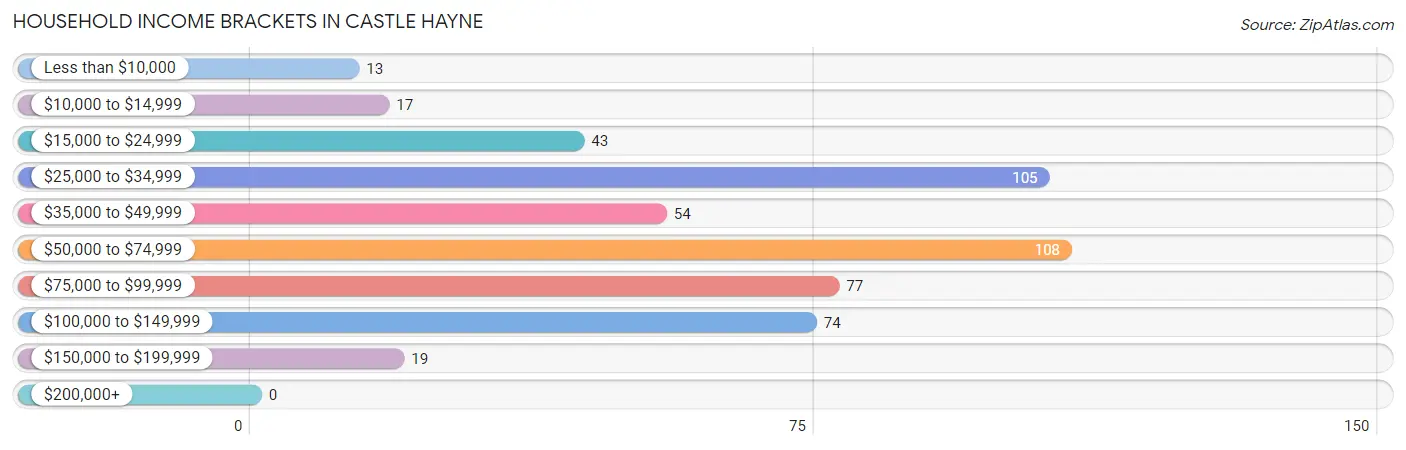
| Income Bracket | # Households | % Households |
| Less than $10,000 | 13 | 2.5% |
| $10,000 to $14,999 | 17 | 3.3% |
| $15,000 to $24,999 | 43 | 8.4% |
| $25,000 to $34,999 | 105 | 20.6% |
| $35,000 to $49,999 | 54 | 10.6% |
| $50,000 to $74,999 | 108 | 21.2% |
| $75,000 to $99,999 | 77 | 15.1% |
| $100,000 to $149,999 | 74 | 14.5% |
| $150,000 to $199,999 | 19 | 3.7% |
| $200,000+ | 0 | 0.0% |
Household Income by Householder Age in Castle Hayne
The median household income in Castle Hayne is $55,625, with the highest median household income of $66,148 found in the 65+ years age bracket for the primary householder. A total of 223 households (43.7%) fall into this category. Meanwhile, the 15 to 24 years age bracket for the primary householder has the lowest median household income of $0, with 22 households (4.3%) in this group.
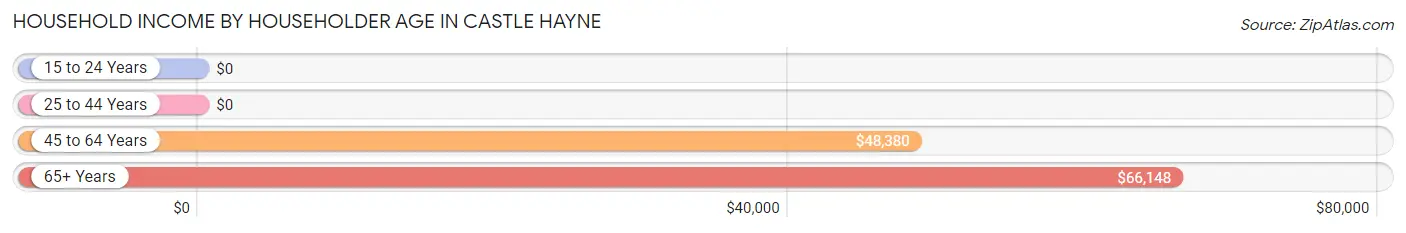
| Income Bracket | # Households | Median Income |
| 15 to 24 Years | 22 (4.3%) | $0 |
| 25 to 44 Years | 39 (7.6%) | $0 |
| 45 to 64 Years | 226 (44.3%) | $48,380 |
| 65+ Years | 223 (43.7%) | $66,148 |
| Total | 510 (100.0%) | $55,625 |
Poverty in Castle Hayne
Income Below Poverty by Sex and Age in Castle Hayne
With 5.4% poverty level for males and 18.4% for females among the residents of Castle Hayne, 18 to 24 year old males and 18 to 24 year old females are the most vulnerable to poverty, with 15 males (51.7%) and 22 females (100.0%) in their respective age groups living below the poverty level.
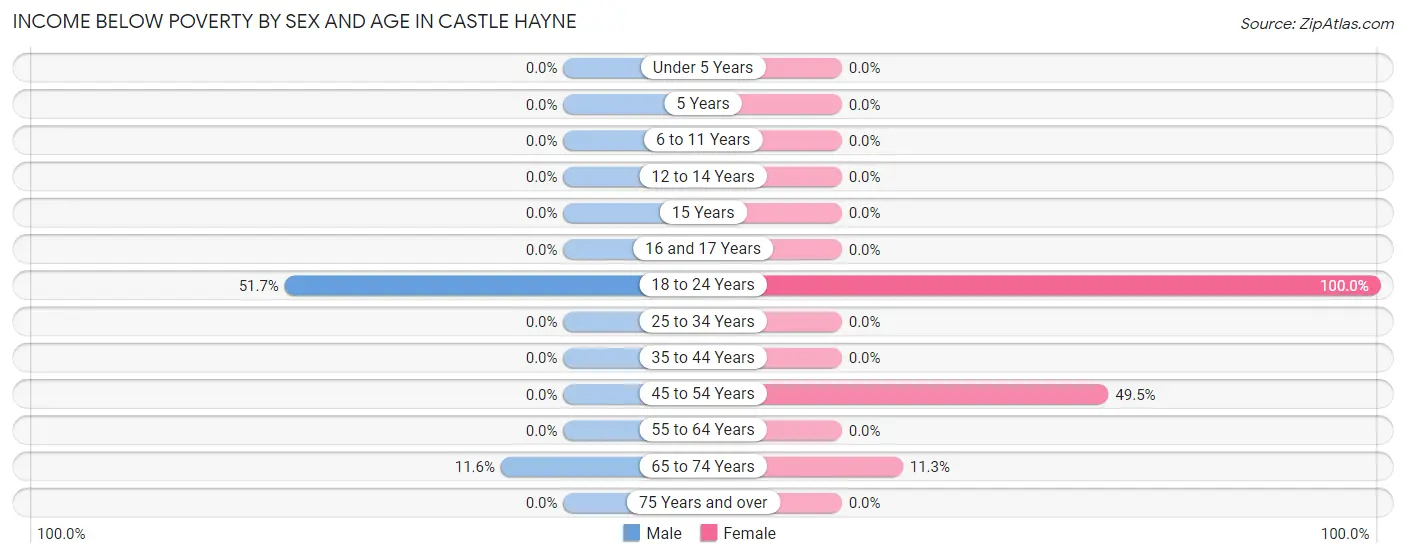
| Age Bracket | Male | Female |
| Under 5 Years | 0 (0.0%) | 0 (0.0%) |
| 5 Years | 0 (0.0%) | 0 (0.0%) |
| 6 to 11 Years | 0 (0.0%) | 0 (0.0%) |
| 12 to 14 Years | 0 (0.0%) | 0 (0.0%) |
| 15 Years | 0 (0.0%) | 0 (0.0%) |
| 16 and 17 Years | 0 (0.0%) | 0 (0.0%) |
| 18 to 24 Years | 15 (51.7%) | 22 (100.0%) |
| 25 to 34 Years | 0 (0.0%) | 0 (0.0%) |
| 35 to 44 Years | 0 (0.0%) | 0 (0.0%) |
| 45 to 54 Years | 0 (0.0%) | 49 (49.5%) |
| 55 to 64 Years | 0 (0.0%) | 0 (0.0%) |
| 65 to 74 Years | 13 (11.6%) | 12 (11.3%) |
| 75 Years and over | 0 (0.0%) | 0 (0.0%) |
| Total | 28 (5.4%) | 83 (18.4%) |
Income Above Poverty by Sex and Age in Castle Hayne
According to the poverty statistics in Castle Hayne, males aged 6 to 11 years and females aged 5 years are the age groups that are most secure financially, with 100.0% of males and 100.0% of females in these age groups living above the poverty line.
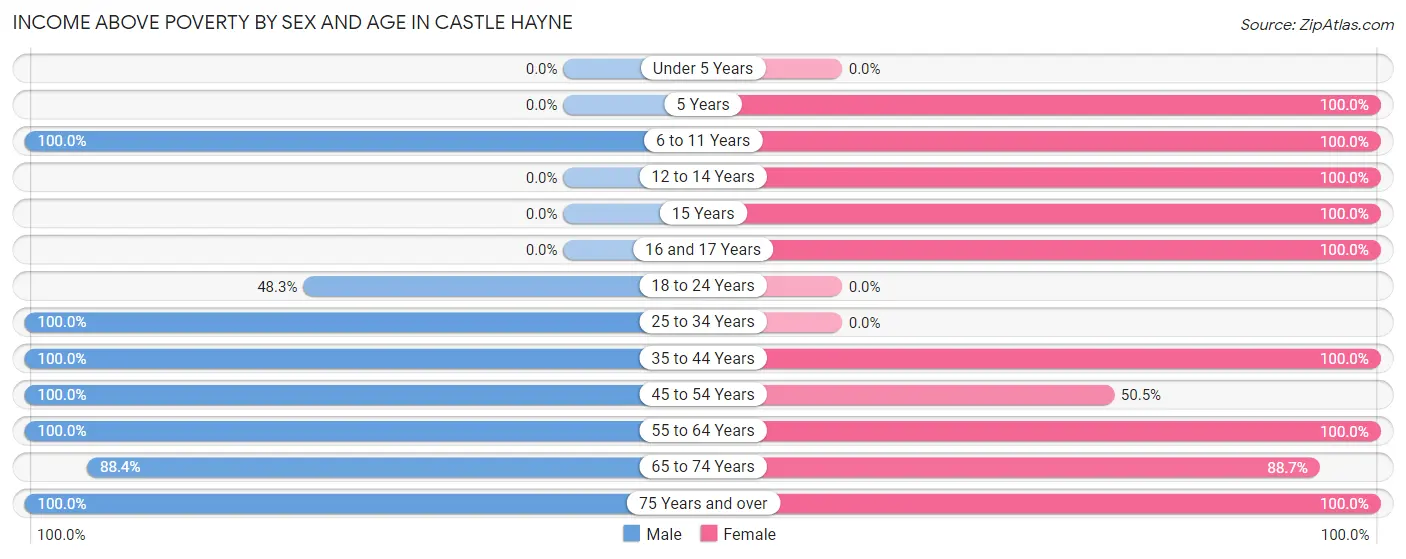
| Age Bracket | Male | Female |
| Under 5 Years | 0 (0.0%) | 0 (0.0%) |
| 5 Years | 0 (0.0%) | 19 (100.0%) |
| 6 to 11 Years | 20 (100.0%) | 19 (100.0%) |
| 12 to 14 Years | 0 (0.0%) | 32 (100.0%) |
| 15 Years | 0 (0.0%) | 13 (100.0%) |
| 16 and 17 Years | 0 (0.0%) | 15 (100.0%) |
| 18 to 24 Years | 14 (48.3%) | 0 (0.0%) |
| 25 to 34 Years | 26 (100.0%) | 0 (0.0%) |
| 35 to 44 Years | 40 (100.0%) | 19 (100.0%) |
| 45 to 54 Years | 54 (100.0%) | 50 (50.5%) |
| 55 to 64 Years | 159 (100.0%) | 41 (100.0%) |
| 65 to 74 Years | 99 (88.4%) | 94 (88.7%) |
| 75 Years and over | 79 (100.0%) | 66 (100.0%) |
| Total | 491 (94.6%) | 368 (81.6%) |
Income Below Poverty Among Married-Couple Families in Castle Hayne
The poverty statistics for married-couple families in Castle Hayne show that 7.1% or 13 of the total 183 families live below the poverty line. Families with no children have the highest poverty rate of 7.9%, comprising of 13 families. On the other hand, families with 1 or 2 children have the lowest poverty rate of 0.0%, which includes 0 families.
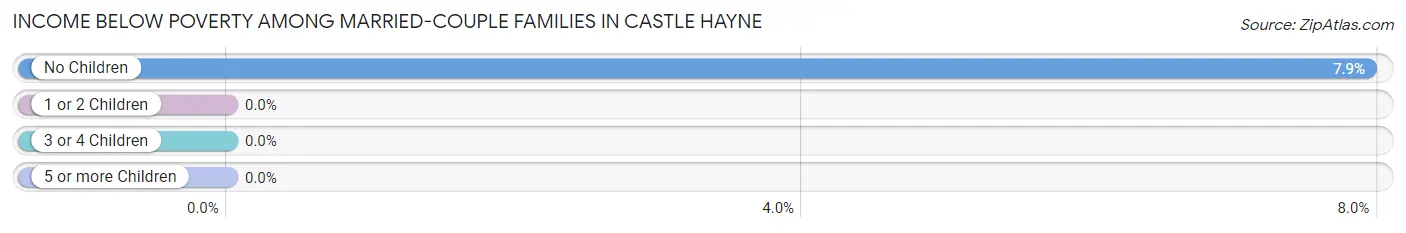
| Children | Above Poverty | Below Poverty |
| No Children | 151 (92.1%) | 13 (7.9%) |
| 1 or 2 Children | 19 (100.0%) | 0 (0.0%) |
| 3 or 4 Children | 0 (0.0%) | 0 (0.0%) |
| 5 or more Children | 0 (0.0%) | 0 (0.0%) |
| Total | 170 (92.9%) | 13 (7.1%) |
Income Below Poverty Among Single-Parent Households in Castle Hayne
| Children | Single Father | Single Mother |
| No Children | 0 (0.0%) | 0 (0.0%) |
| 1 or 2 Children | 0 (0.0%) | 0 (0.0%) |
| 3 or 4 Children | 0 (0.0%) | 0 (0.0%) |
| 5 or more Children | 0 (0.0%) | 0 (0.0%) |
| Total | 0 (0.0%) | 0 (0.0%) |
Income Below Poverty Among Married-Couple vs Single-Parent Households in Castle Hayne
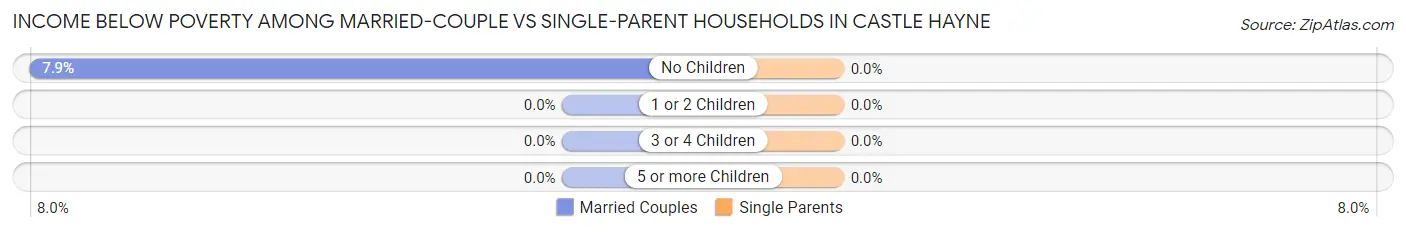
| Children | Married-Couple Families | Single-Parent Households |
| No Children | 13 (7.9%) | 0 (0.0%) |
| 1 or 2 Children | 0 (0.0%) | 0 (0.0%) |
| 3 or 4 Children | 0 (0.0%) | 0 (0.0%) |
| 5 or more Children | 0 (0.0%) | 0 (0.0%) |
| Total | 13 (7.1%) | 0 (0.0%) |
Race in Castle Hayne
The most populous races in Castle Hayne are White / Caucasian (953 | 98.3%), Hispanic or Latino (123 | 12.7%), and Asian (17 | 1.8%).
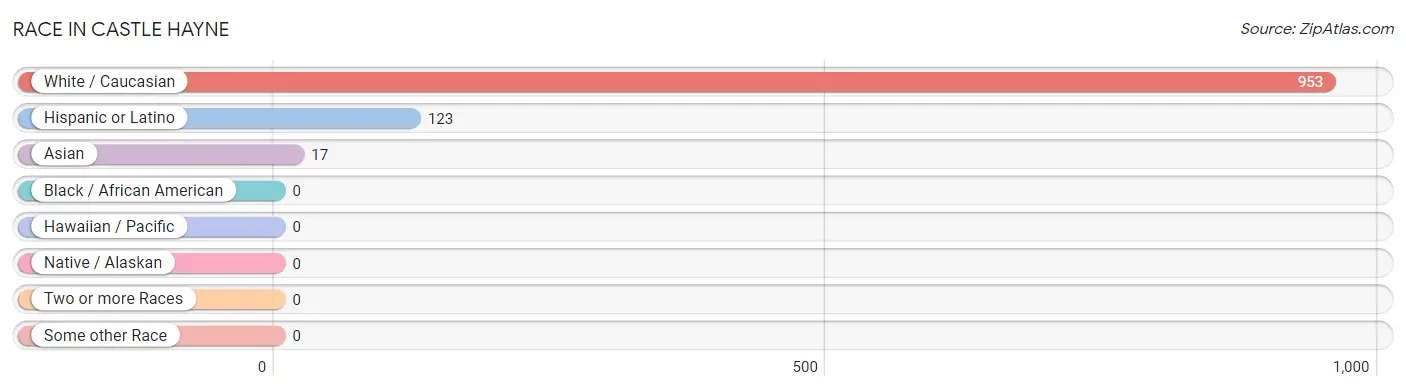
| Race | # Population | % Population |
| Asian | 17 | 1.8% |
| Black / African American | 0 | 0.0% |
| Hawaiian / Pacific | 0 | 0.0% |
| Hispanic or Latino | 123 | 12.7% |
| Native / Alaskan | 0 | 0.0% |
| White / Caucasian | 953 | 98.3% |
| Two or more Races | 0 | 0.0% |
| Some other Race | 0 | 0.0% |
| Total | 970 | 100.0% |
Ancestry in Castle Hayne
The most populous ancestries reported in Castle Hayne are English (211 | 21.7%), German (204 | 21.0%), Irish (131 | 13.5%), Mexican (108 | 11.1%), and Scotch-Irish (68 | 7.0%), together accounting for 74.4% of all Castle Hayne residents.
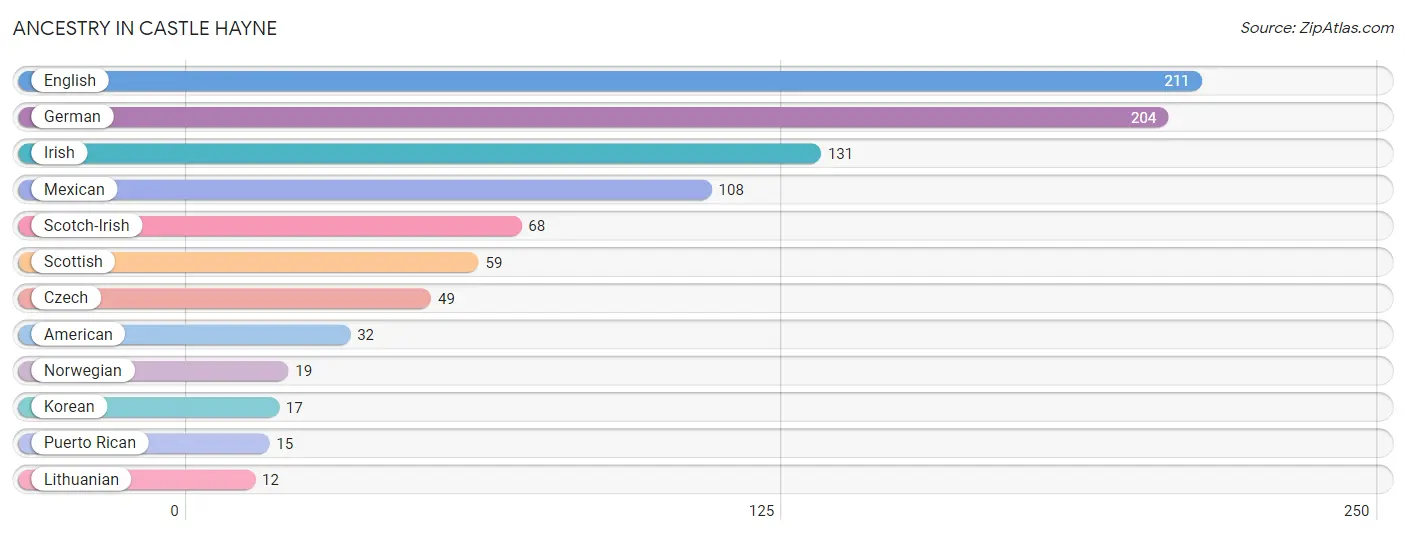
| Ancestry | # Population | % Population |
| American | 32 | 3.3% |
| Czech | 49 | 5.1% |
| English | 211 | 21.7% |
| German | 204 | 21.0% |
| Irish | 131 | 13.5% |
| Korean | 17 | 1.8% |
| Lithuanian | 12 | 1.2% |
| Mexican | 108 | 11.1% |
| Norwegian | 19 | 2.0% |
| Puerto Rican | 15 | 1.5% |
| Scotch-Irish | 68 | 7.0% |
| Scottish | 59 | 6.1% | View All 12 Rows |
Immigrants in Castle Hayne
The most numerous immigrant groups reported in Castle Hayne came from Central America (79 | 8.1%), Latin America (79 | 8.1%), Mexico (79 | 8.1%), Asia (17 | 1.8%), and Philippines (17 | 1.8%), together accounting for 27.9% of all Castle Hayne residents.
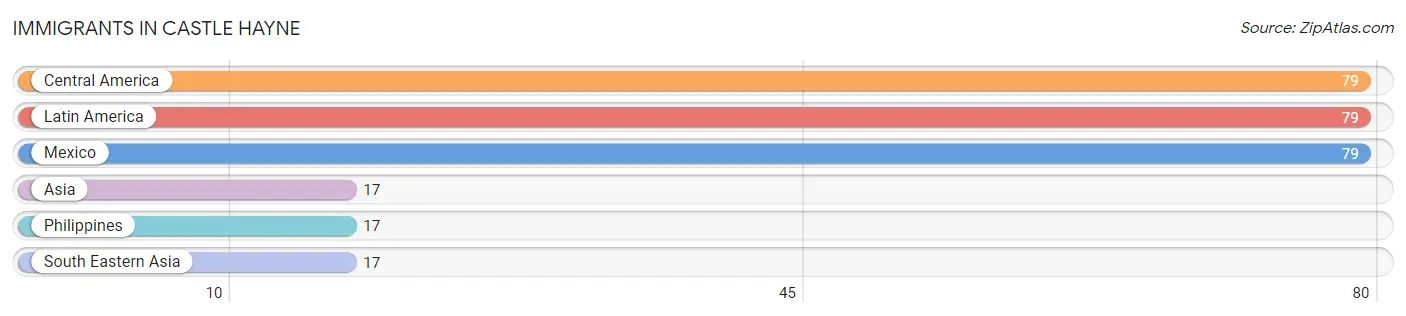
| Immigration Origin | # Population | % Population |
| Asia | 17 | 1.8% |
| Central America | 79 | 8.1% |
| Latin America | 79 | 8.1% |
| Mexico | 79 | 8.1% |
| Philippines | 17 | 1.8% |
| South Eastern Asia | 17 | 1.8% | View All 6 Rows |
Sex and Age in Castle Hayne
Sex and Age in Castle Hayne
The most populous age groups in Castle Hayne are 55 to 59 Years (119 | 22.9%) for men and 50 to 54 Years (99 | 22.0%) for women.
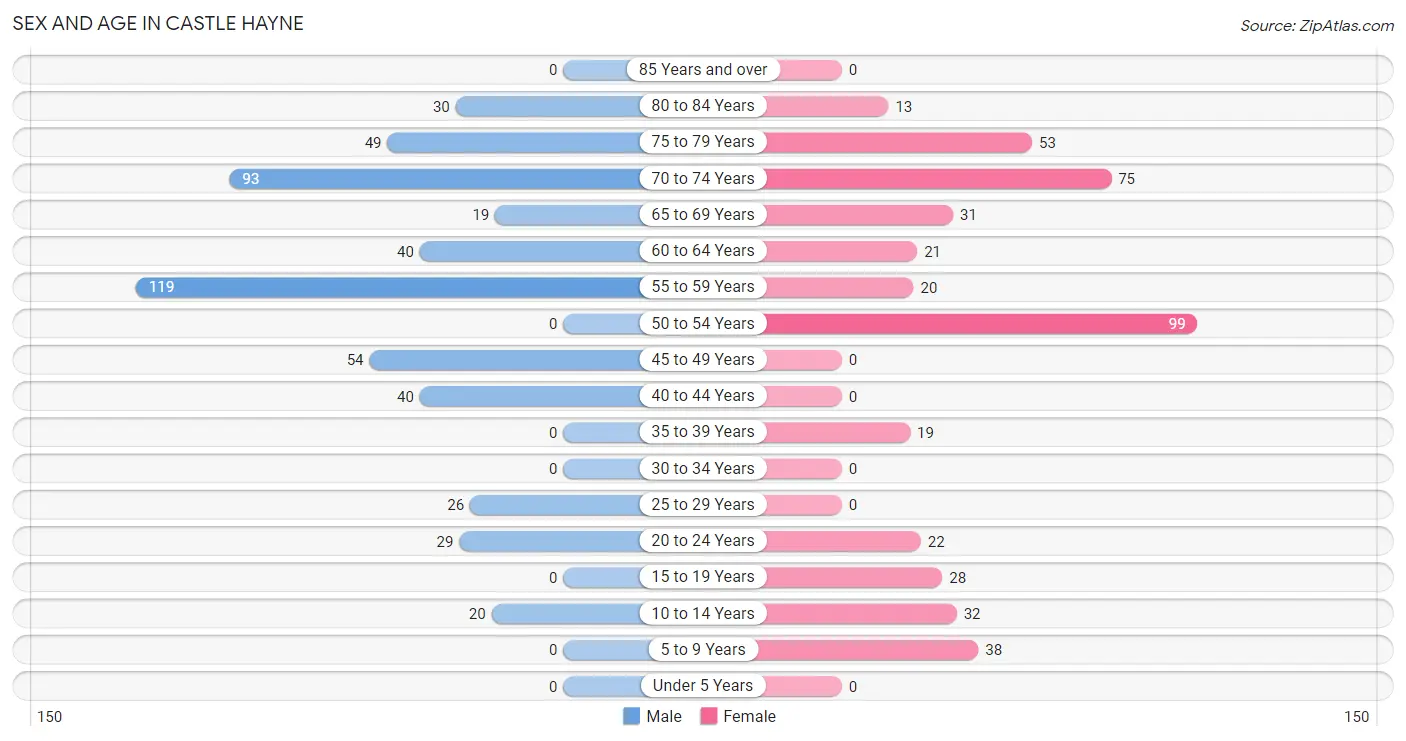
| Age Bracket | Male | Female |
| Under 5 Years | 0 (0.0%) | 0 (0.0%) |
| 5 to 9 Years | 0 (0.0%) | 38 (8.4%) |
| 10 to 14 Years | 20 (3.8%) | 32 (7.1%) |
| 15 to 19 Years | 0 (0.0%) | 28 (6.2%) |
| 20 to 24 Years | 29 (5.6%) | 22 (4.9%) |
| 25 to 29 Years | 26 (5.0%) | 0 (0.0%) |
| 30 to 34 Years | 0 (0.0%) | 0 (0.0%) |
| 35 to 39 Years | 0 (0.0%) | 19 (4.2%) |
| 40 to 44 Years | 40 (7.7%) | 0 (0.0%) |
| 45 to 49 Years | 54 (10.4%) | 0 (0.0%) |
| 50 to 54 Years | 0 (0.0%) | 99 (22.0%) |
| 55 to 59 Years | 119 (22.9%) | 20 (4.4%) |
| 60 to 64 Years | 40 (7.7%) | 21 (4.7%) |
| 65 to 69 Years | 19 (3.7%) | 31 (6.9%) |
| 70 to 74 Years | 93 (17.9%) | 75 (16.6%) |
| 75 to 79 Years | 49 (9.4%) | 53 (11.7%) |
| 80 to 84 Years | 30 (5.8%) | 13 (2.9%) |
| 85 Years and over | 0 (0.0%) | 0 (0.0%) |
| Total | 519 (100.0%) | 451 (100.0%) |
Families and Households in Castle Hayne
Median Family Size in Castle Hayne
The median family size in Castle Hayne is 2.38 persons per family, with single female/mother families (31 | 10.8%) accounting for the largest median family size of 2.52 persons per family. On the other hand, single male/father families (74 | 25.7%) represent the smallest median family size with 2.24 persons per family.
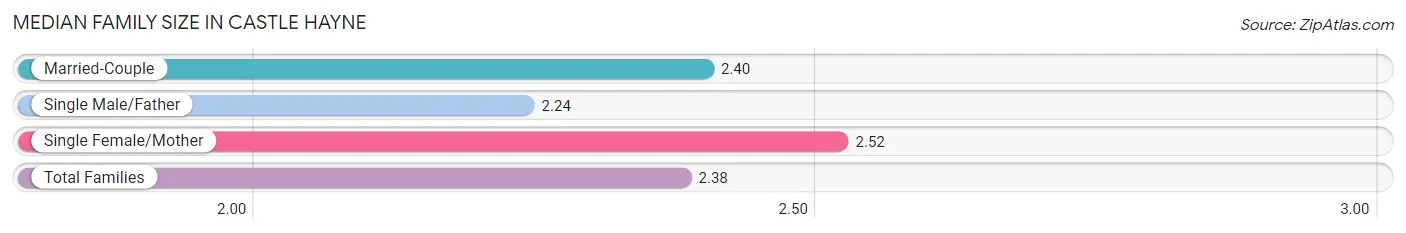
| Family Type | # Families | Family Size |
| Married-Couple | 183 (63.5%) | 2.40 |
| Single Male/Father | 74 (25.7%) | 2.24 |
| Single Female/Mother | 31 (10.8%) | 2.52 |
| Total Families | 288 (100.0%) | 2.38 |
Median Household Size in Castle Hayne
The median household size in Castle Hayne is 1.90 persons per household, with single female/mother households (31 | 6.1%) accounting for the largest median household size of 2.52 persons per household. non-family households (222 | 43.5%) represent the smallest median household size with 1.29 persons per household.
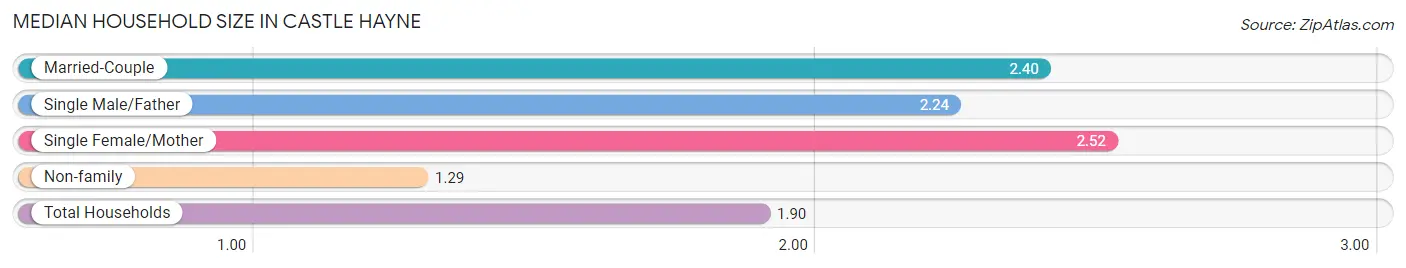
| Household Type | # Households | Household Size |
| Married-Couple | 183 (35.9%) | 2.40 |
| Single Male/Father | 74 (14.5%) | 2.24 |
| Single Female/Mother | 31 (6.1%) | 2.52 |
| Non-family | 222 (43.5%) | 1.29 |
| Total Households | 510 (100.0%) | 1.90 |
Household Size by Marriage Status in Castle Hayne
Out of a total of 510 households in Castle Hayne, 288 (56.5%) are family households, while 222 (43.5%) are nonfamily households. The most numerous type of family households are 2-person households, comprising 163, and the most common type of nonfamily households are 1-person households, comprising 147.
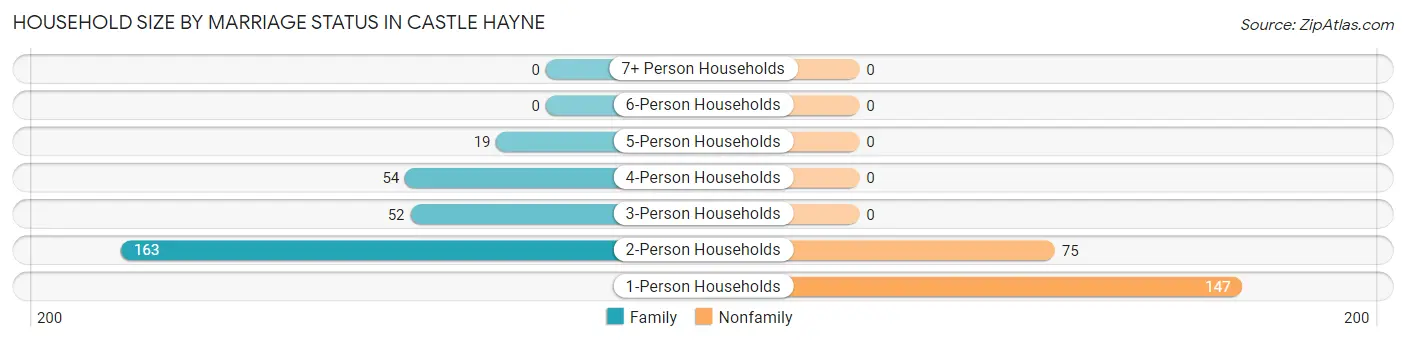
| Household Size | Family Households | Nonfamily Households |
| 1-Person Households | - | 147 (28.8%) |
| 2-Person Households | 163 (32.0%) | 75 (14.7%) |
| 3-Person Households | 52 (10.2%) | 0 (0.0%) |
| 4-Person Households | 54 (10.6%) | 0 (0.0%) |
| 5-Person Households | 19 (3.7%) | 0 (0.0%) |
| 6-Person Households | 0 (0.0%) | 0 (0.0%) |
| 7+ Person Households | 0 (0.0%) | 0 (0.0%) |
| Total | 288 (56.5%) | 222 (43.5%) |
Female Fertility in Castle Hayne
Fertility by Age in Castle Hayne
| Age Bracket | Women with Births | Births / 1,000 Women |
| 15 to 19 years | 0 (0.0%) | 0.0 |
| 20 to 34 years | 0 (0.0%) | 0.0 |
| 35 to 50 years | 0 (0.0%) | 0.0 |
| Total | 0 (0.0%) | 0.0 |
Fertility by Age by Marriage Status in Castle Hayne
| Age Bracket | Married | Unmarried |
| 15 to 19 years | 0 (0.0%) | 0 (0.0%) |
| 20 to 34 years | 0 (0.0%) | 0 (0.0%) |
| 35 to 50 years | 0 (0.0%) | 0 (0.0%) |
| Total | 0 (0.0%) | 0 (0.0%) |
Fertility by Education in Castle Hayne
| Educational Attainment | Women with Births | Births / 1,000 Women |
| Less than High School | 0 (0.0%) | 0.0 |
| High School Diploma | 0 (0.0%) | 0.0 |
| College or Associate's Degree | 0 (0.0%) | 0.0 |
| Bachelor's Degree | 0 (0.0%) | 0.0 |
| Graduate Degree | 0 (0.0%) | 0.0 |
| Total | 0 (0.0%) | 0.0 |
Fertility by Education by Marriage Status in Castle Hayne
| Educational Attainment | Married | Unmarried |
| Less than High School | 0 (0.0%) | 0 (0.0%) |
| High School Diploma | 0 (0.0%) | 0 (0.0%) |
| College or Associate's Degree | 0 (0.0%) | 0 (0.0%) |
| Bachelor's Degree | 0 (0.0%) | 0 (0.0%) |
| Graduate Degree | 0 (0.0%) | 0 (0.0%) |
| Total | 0 (0.0%) | 0 (0.0%) |
Employment Characteristics in Castle Hayne
Employment by Class of Employer in Castle Hayne
Among the 449 employed individuals in Castle Hayne, private company employees (257 | 57.2%), self-employed (not incorporated) (72 | 16.0%), and not-for-profit organizations (49 | 10.9%) make up the most common classes of employment.
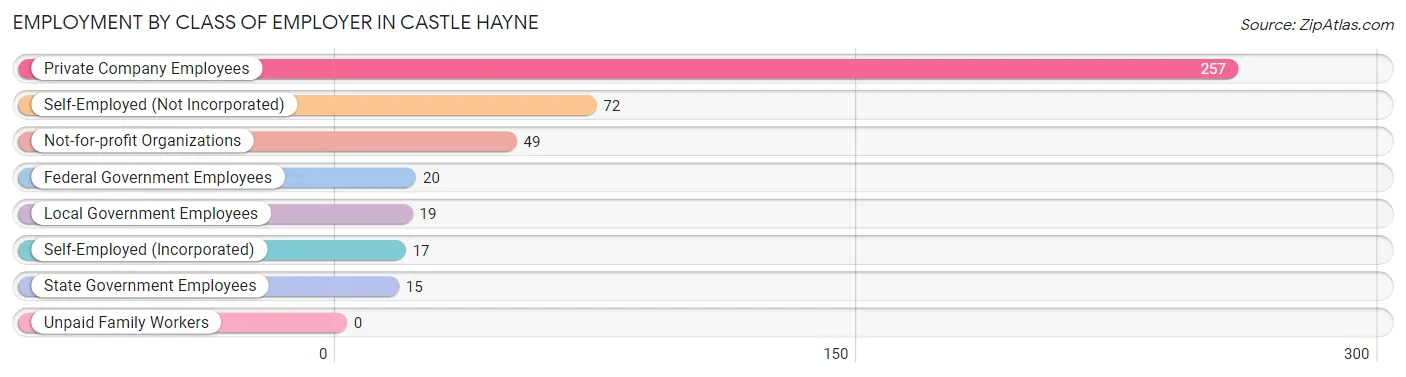
| Employer Class | # Employees | % Employees |
| Private Company Employees | 257 | 57.2% |
| Self-Employed (Incorporated) | 17 | 3.8% |
| Self-Employed (Not Incorporated) | 72 | 16.0% |
| Not-for-profit Organizations | 49 | 10.9% |
| Local Government Employees | 19 | 4.2% |
| State Government Employees | 15 | 3.3% |
| Federal Government Employees | 20 | 4.4% |
| Unpaid Family Workers | 0 | 0.0% |
| Total | 449 | 100.0% |
Employment Status by Age in Castle Hayne
According to the labor force statistics for Castle Hayne, out of the total population over 16 years of age (867), 57.9% or 502 individuals are in the labor force, with 4.0% or 20 of them unemployed. The age group with the highest labor force participation rate is 20 to 24 years, with 100.0% or 51 individuals in the labor force. Within the labor force, the 35 to 44 years age range has the highest percentage of unemployed individuals, with 33.9% or 20 of them being unemployed.
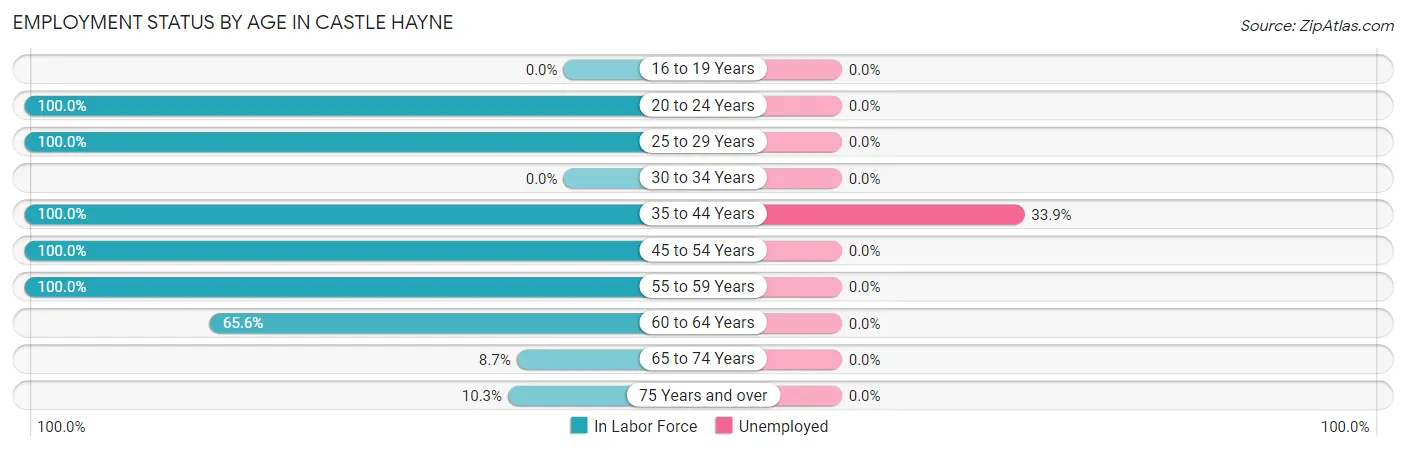
| Age Bracket | In Labor Force | Unemployed |
| 16 to 19 Years | 0 (0.0%) | 0 (0.0%) |
| 20 to 24 Years | 51 (100.0%) | 0 (0.0%) |
| 25 to 29 Years | 26 (100.0%) | 0 (0.0%) |
| 30 to 34 Years | 0 (0.0%) | 0 (0.0%) |
| 35 to 44 Years | 59 (100.0%) | 20 (33.9%) |
| 45 to 54 Years | 153 (100.0%) | 0 (0.0%) |
| 55 to 59 Years | 139 (100.0%) | 0 (0.0%) |
| 60 to 64 Years | 40 (65.6%) | 0 (0.0%) |
| 65 to 74 Years | 19 (8.7%) | 0 (0.0%) |
| 75 Years and over | 15 (10.3%) | 0 (0.0%) |
| Total | 502 (57.9%) | 20 (4.0%) |
Employment Status by Educational Attainment in Castle Hayne
According to labor force statistics for Castle Hayne, 95.2% of individuals (417) out of the total population between 25 and 64 years of age (438) are in the labor force, with 4.8% or 20 of them being unemployed. The group with the highest labor force participation rate are those with the educational attainment of less than high school, with 100.0% or 54 individuals in the labor force. Within the labor force, individuals with college / associate degree education have the highest percentage of unemployment, with 9.7% or 20 of them being unemployed.
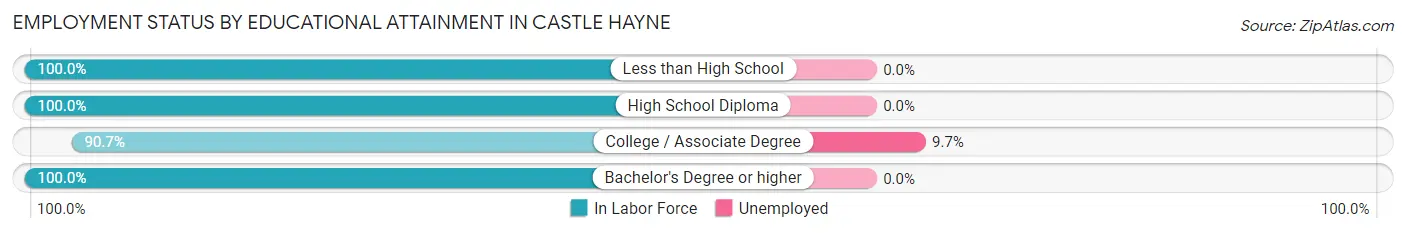
| Educational Attainment | In Labor Force | Unemployed |
| Less than High School | 54 (100.0%) | 0 (0.0%) |
| High School Diploma | 60 (100.0%) | 0 (0.0%) |
| College / Associate Degree | 206 (90.7%) | 22 (9.7%) |
| Bachelor's Degree or higher | 97 (100.0%) | 0 (0.0%) |
| Total | 417 (95.2%) | 21 (4.8%) |
Employment Occupations by Sex in Castle Hayne
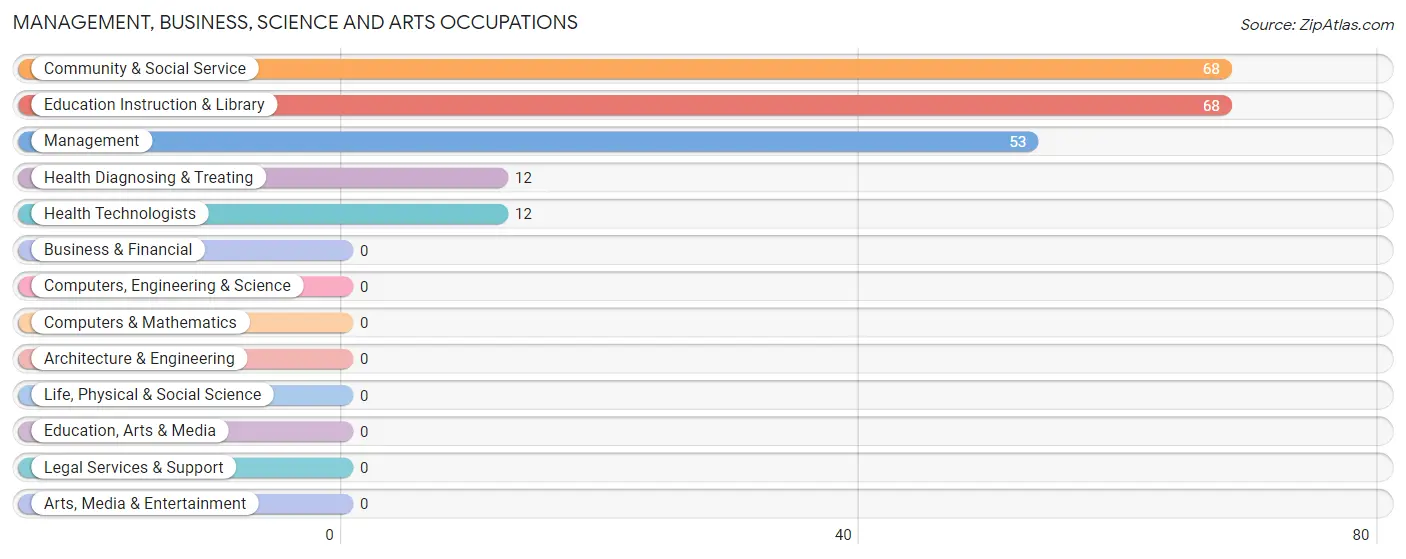
Management, Business, Science and Arts Occupations
The most common Management, Business, Science and Arts occupations in Castle Hayne are Community & Social Service (68 | 14.1%), Education Instruction & Library (68 | 14.1%), Management (53 | 11.0%), Health Diagnosing & Treating (12 | 2.5%), and Health Technologists (12 | 2.5%).
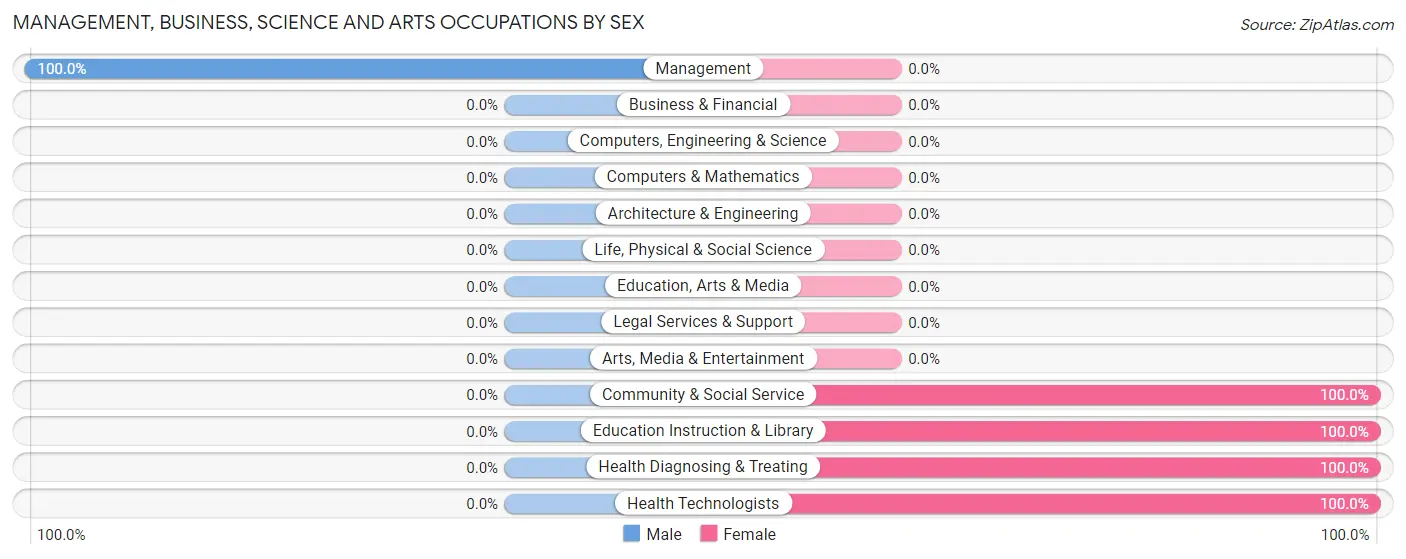
Management, Business, Science and Arts Occupations by Sex
| Occupation | Male | Female |
| Management | 53 (100.0%) | 0 (0.0%) |
| Business & Financial | 0 (0.0%) | 0 (0.0%) |
| Computers, Engineering & Science | 0 (0.0%) | 0 (0.0%) |
| Computers & Mathematics | 0 (0.0%) | 0 (0.0%) |
| Architecture & Engineering | 0 (0.0%) | 0 (0.0%) |
| Life, Physical & Social Science | 0 (0.0%) | 0 (0.0%) |
| Community & Social Service | 0 (0.0%) | 68 (100.0%) |
| Education, Arts & Media | 0 (0.0%) | 0 (0.0%) |
| Legal Services & Support | 0 (0.0%) | 0 (0.0%) |
| Education Instruction & Library | 0 (0.0%) | 68 (100.0%) |
| Arts, Media & Entertainment | 0 (0.0%) | 0 (0.0%) |
| Health Diagnosing & Treating | 0 (0.0%) | 12 (100.0%) |
| Health Technologists | 0 (0.0%) | 12 (100.0%) |
| Total (Category) | 53 (39.9%) | 80 (60.2%) |
| Total (Overall) | 322 (66.8%) | 160 (33.2%) |
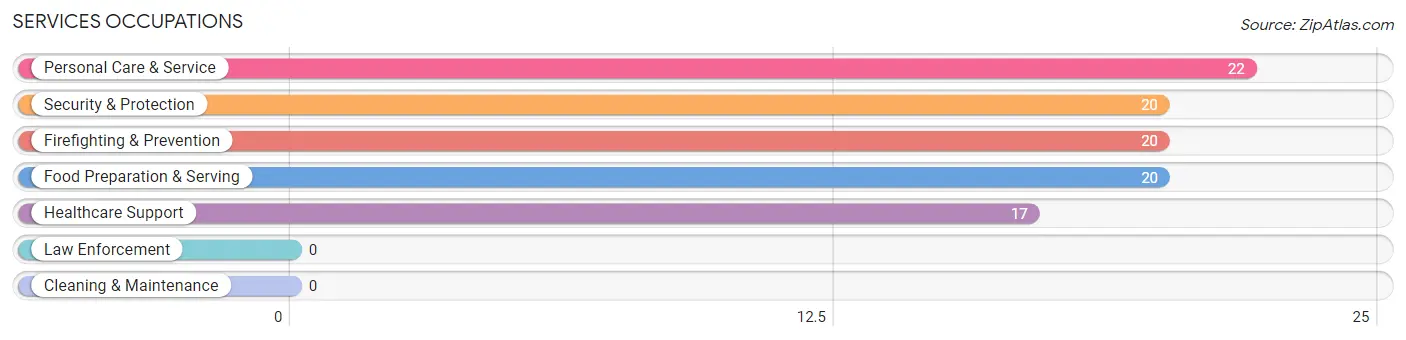
Services Occupations
The most common Services occupations in Castle Hayne are Personal Care & Service (22 | 4.6%), Security & Protection (20 | 4.2%), Firefighting & Prevention (20 | 4.2%), Food Preparation & Serving (20 | 4.2%), and Healthcare Support (17 | 3.5%).
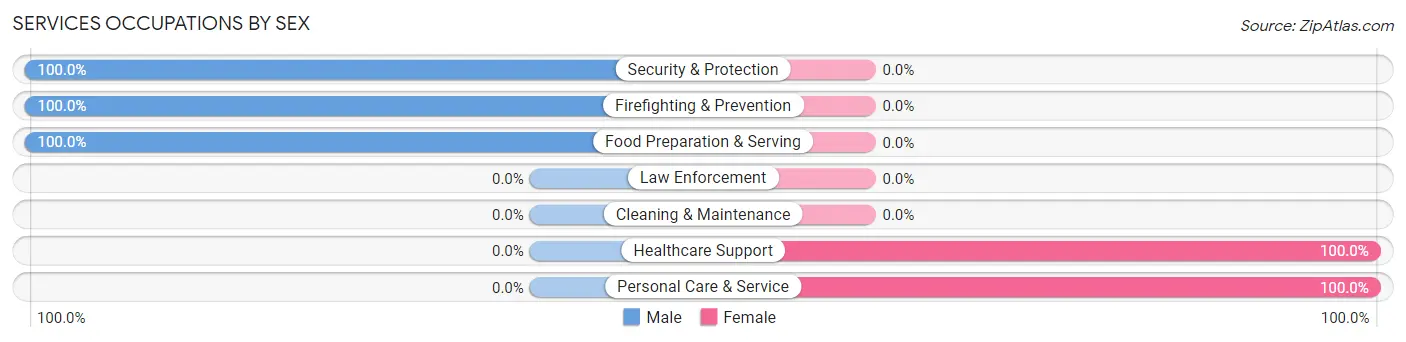
Services Occupations by Sex
Within the Services occupations in Castle Hayne, the most male-oriented occupations are Security & Protection (100.0%), Firefighting & Prevention (100.0%), and Food Preparation & Serving (100.0%), while the most female-oriented occupations are Healthcare Support (100.0%), and Personal Care & Service (100.0%).
| Occupation | Male | Female |
| Healthcare Support | 0 (0.0%) | 17 (100.0%) |
| Security & Protection | 20 (100.0%) | 0 (0.0%) |
| Firefighting & Prevention | 20 (100.0%) | 0 (0.0%) |
| Law Enforcement | 0 (0.0%) | 0 (0.0%) |
| Food Preparation & Serving | 20 (100.0%) | 0 (0.0%) |
| Cleaning & Maintenance | 0 (0.0%) | 0 (0.0%) |
| Personal Care & Service | 0 (0.0%) | 22 (100.0%) |
| Total (Category) | 40 (50.6%) | 39 (49.4%) |
| Total (Overall) | 322 (66.8%) | 160 (33.2%) |
Sales and Office Occupations
The most common Sales and Office occupations in Castle Hayne are , and Office & Administration (35 | 7.3%).
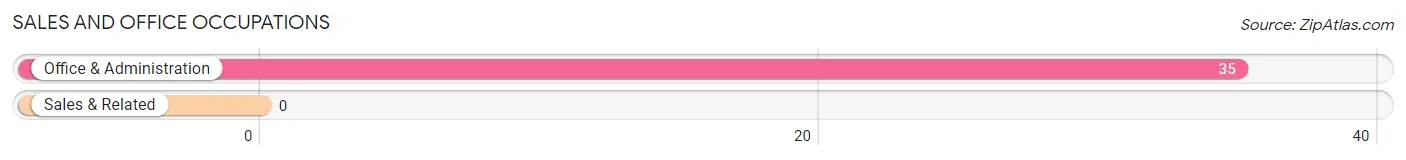
Sales and Office Occupations by Sex
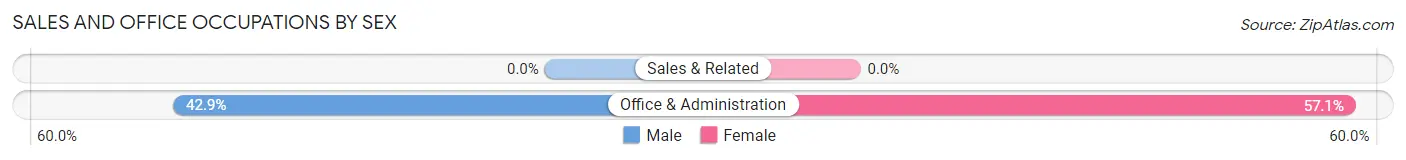
| Occupation | Male | Female |
| Sales & Related | 0 (0.0%) | 0 (0.0%) |
| Office & Administration | 15 (42.9%) | 20 (57.1%) |
| Total (Category) | 15 (42.9%) | 20 (57.1%) |
| Total (Overall) | 322 (66.8%) | 160 (33.2%) |
Natural Resources, Construction and Maintenance Occupations
The most common Natural Resources, Construction and Maintenance occupations in Castle Hayne are Construction & Extraction (68 | 14.1%), and Installation, Maintenance & Repair (19 | 3.9%).
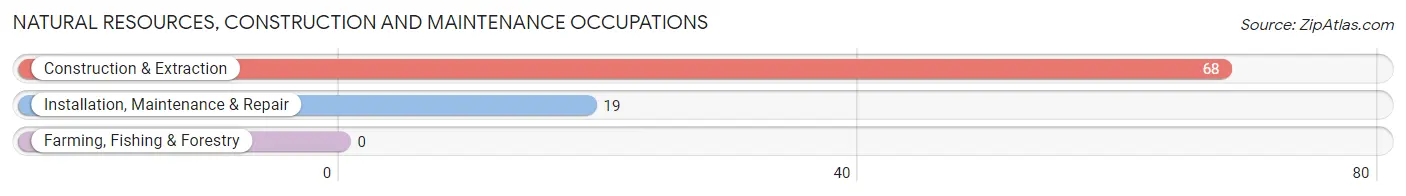
Natural Resources, Construction and Maintenance Occupations by Sex
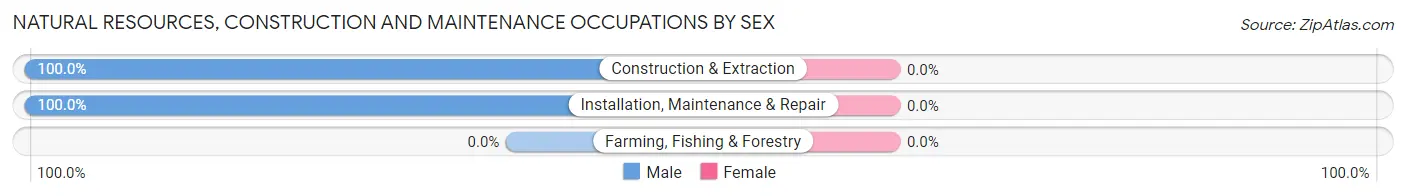
| Occupation | Male | Female |
| Farming, Fishing & Forestry | 0 (0.0%) | 0 (0.0%) |
| Construction & Extraction | 68 (100.0%) | 0 (0.0%) |
| Installation, Maintenance & Repair | 19 (100.0%) | 0 (0.0%) |
| Total (Category) | 87 (100.0%) | 0 (0.0%) |
| Total (Overall) | 322 (66.8%) | 160 (33.2%) |
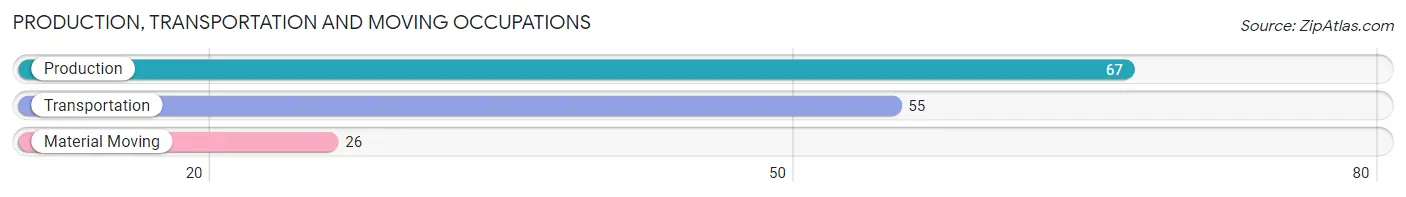
Production, Transportation and Moving Occupations
The most common Production, Transportation and Moving occupations in Castle Hayne are Production (67 | 13.9%), Transportation (55 | 11.4%), and Material Moving (26 | 5.4%).
Production, Transportation and Moving Occupations by Sex
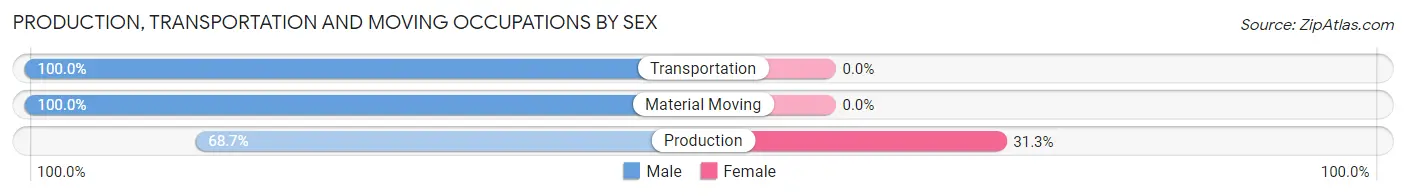
| Occupation | Male | Female |
| Production | 46 (68.7%) | 21 (31.3%) |
| Transportation | 55 (100.0%) | 0 (0.0%) |
| Material Moving | 26 (100.0%) | 0 (0.0%) |
| Total (Category) | 127 (85.8%) | 21 (14.2%) |
| Total (Overall) | 322 (66.8%) | 160 (33.2%) |
Employment Industries by Sex in Castle Hayne
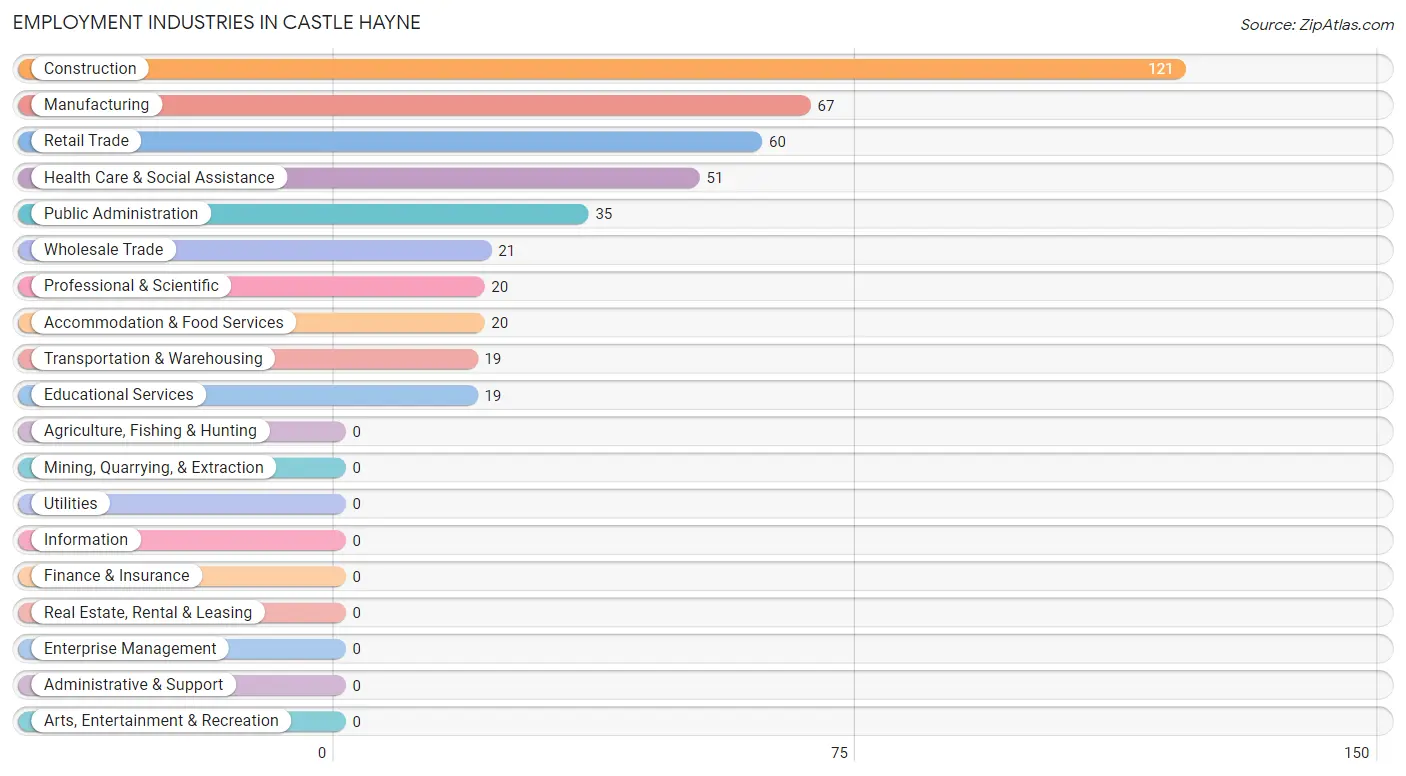
Employment Industries in Castle Hayne
The major employment industries in Castle Hayne include Construction (121 | 25.1%), Manufacturing (67 | 13.9%), Retail Trade (60 | 12.4%), Health Care & Social Assistance (51 | 10.6%), and Public Administration (35 | 7.3%).
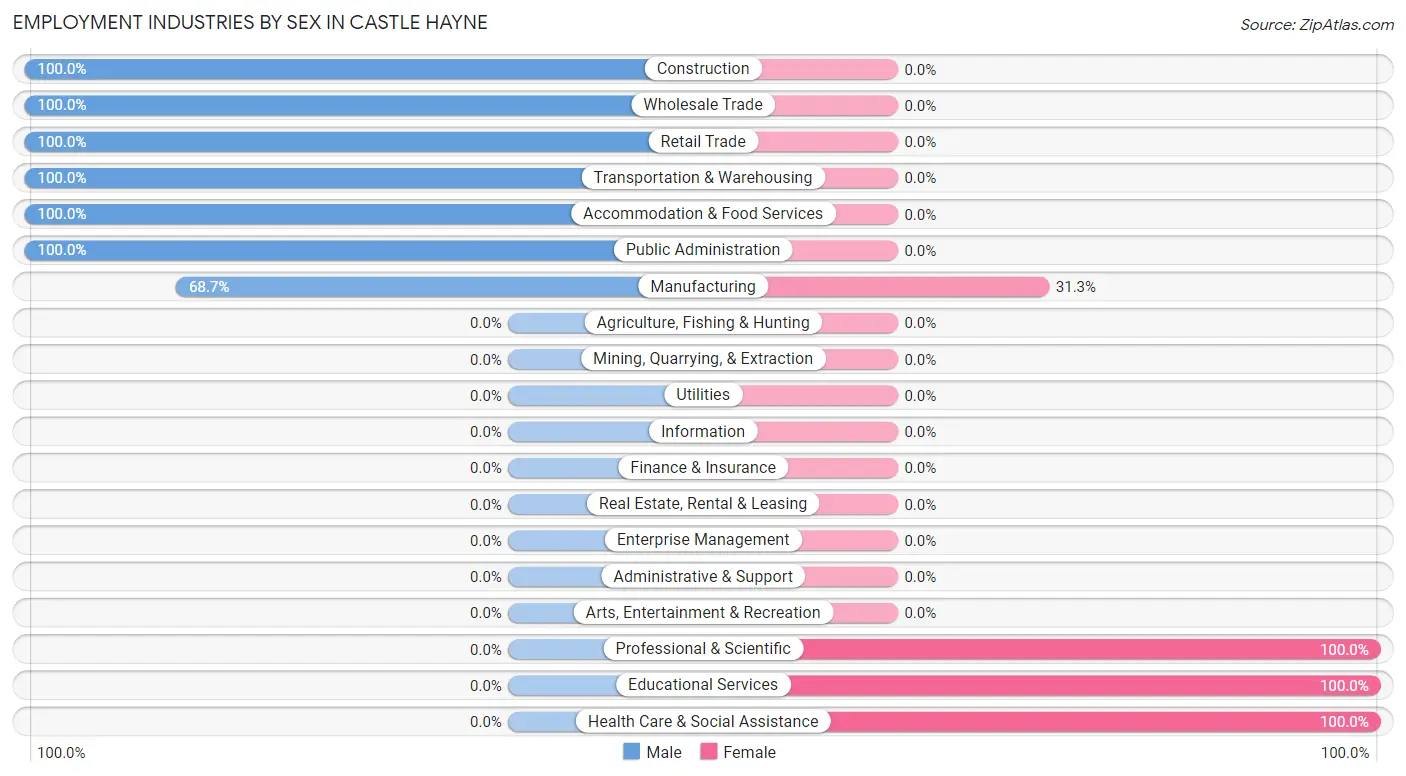
Employment Industries by Sex in Castle Hayne
The Castle Hayne industries that see more men than women are Construction (100.0%), Wholesale Trade (100.0%), and Retail Trade (100.0%), whereas the industries that tend to have a higher number of women are Professional & Scientific (100.0%), Educational Services (100.0%), and Health Care & Social Assistance (100.0%).
| Industry | Male | Female |
| Agriculture, Fishing & Hunting | 0 (0.0%) | 0 (0.0%) |
| Mining, Quarrying, & Extraction | 0 (0.0%) | 0 (0.0%) |
| Construction | 121 (100.0%) | 0 (0.0%) |
| Manufacturing | 46 (68.7%) | 21 (31.3%) |
| Wholesale Trade | 21 (100.0%) | 0 (0.0%) |
| Retail Trade | 60 (100.0%) | 0 (0.0%) |
| Transportation & Warehousing | 19 (100.0%) | 0 (0.0%) |
| Utilities | 0 (0.0%) | 0 (0.0%) |
| Information | 0 (0.0%) | 0 (0.0%) |
| Finance & Insurance | 0 (0.0%) | 0 (0.0%) |
| Real Estate, Rental & Leasing | 0 (0.0%) | 0 (0.0%) |
| Professional & Scientific | 0 (0.0%) | 20 (100.0%) |
| Enterprise Management | 0 (0.0%) | 0 (0.0%) |
| Administrative & Support | 0 (0.0%) | 0 (0.0%) |
| Educational Services | 0 (0.0%) | 19 (100.0%) |
| Health Care & Social Assistance | 0 (0.0%) | 51 (100.0%) |
| Arts, Entertainment & Recreation | 0 (0.0%) | 0 (0.0%) |
| Accommodation & Food Services | 20 (100.0%) | 0 (0.0%) |
| Public Administration | 35 (100.0%) | 0 (0.0%) |
| Total | 322 (66.8%) | 160 (33.2%) |
Education in Castle Hayne
School Enrollment in Castle Hayne
The most common levels of schooling among the 140 students in Castle Hayne are high school (47 | 33.6%), elementary school (39 | 27.9%), and college / undergraduate (22 | 15.7%).
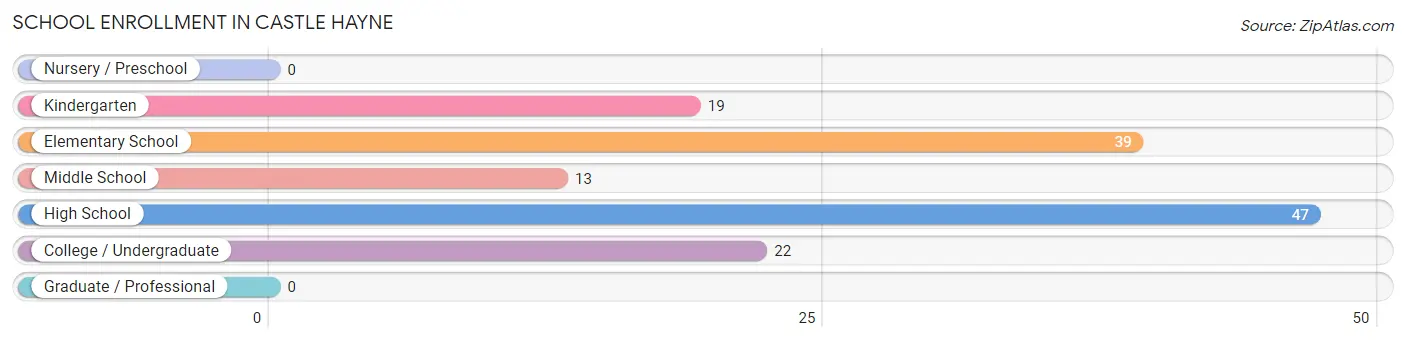
| School Level | # Students | % Students |
| Nursery / Preschool | 0 | 0.0% |
| Kindergarten | 19 | 13.6% |
| Elementary School | 39 | 27.9% |
| Middle School | 13 | 9.3% |
| High School | 47 | 33.6% |
| College / Undergraduate | 22 | 15.7% |
| Graduate / Professional | 0 | 0.0% |
| Total | 140 | 100.0% |
School Enrollment by Age by Funding Source in Castle Hayne
Out of a total of 140 students who are enrolled in schools in Castle Hayne, 38 (27.1%) attend a private institution, while the remaining 102 (72.9%) are enrolled in public schools. The age group of 5 to 9 year old has the highest likelihood of being enrolled in private schools, with 19 (50.0% in the age bracket) enrolled. Conversely, the age group of 15 to 17 year olds has the lowest likelihood of being enrolled in a private school, with 28 (100.0% in the age bracket) attending a public institution.
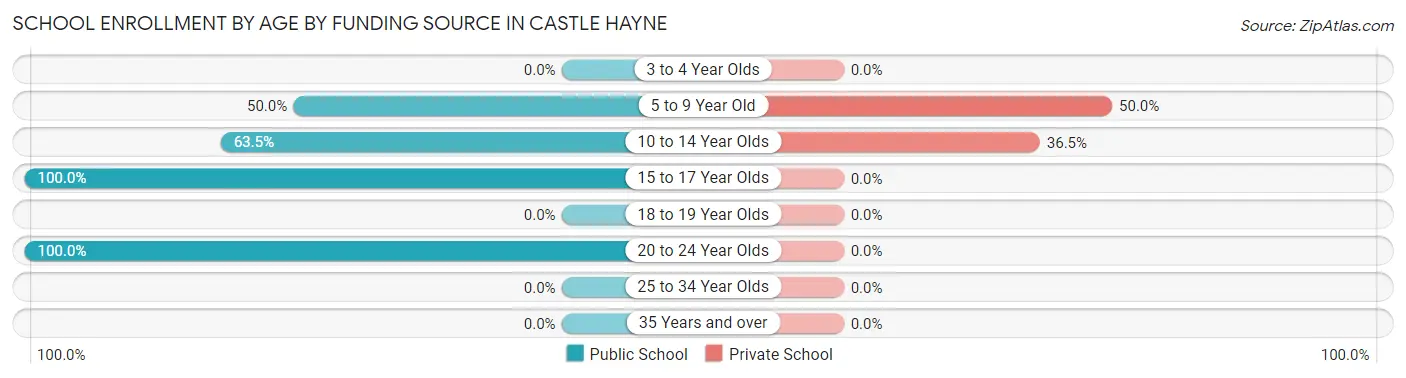
| Age Bracket | Public School | Private School |
| 3 to 4 Year Olds | 0 (0.0%) | 0 (0.0%) |
| 5 to 9 Year Old | 19 (50.0%) | 19 (50.0%) |
| 10 to 14 Year Olds | 33 (63.5%) | 19 (36.5%) |
| 15 to 17 Year Olds | 28 (100.0%) | 0 (0.0%) |
| 18 to 19 Year Olds | 0 (0.0%) | 0 (0.0%) |
| 20 to 24 Year Olds | 22 (100.0%) | 0 (0.0%) |
| 25 to 34 Year Olds | 0 (0.0%) | 0 (0.0%) |
| 35 Years and over | 0 (0.0%) | 0 (0.0%) |
| Total | 102 (72.9%) | 38 (27.1%) |
Educational Attainment by Field of Study in Castle Hayne
Education (72 | 40.7%), visual & performing arts (49 | 27.7%), business (17 | 9.6%), arts & humanities (15 | 8.5%), and bio, nature & agricultural (12 | 6.8%) are the most common fields of study among 177 individuals in Castle Hayne who have obtained a bachelor's degree or higher.
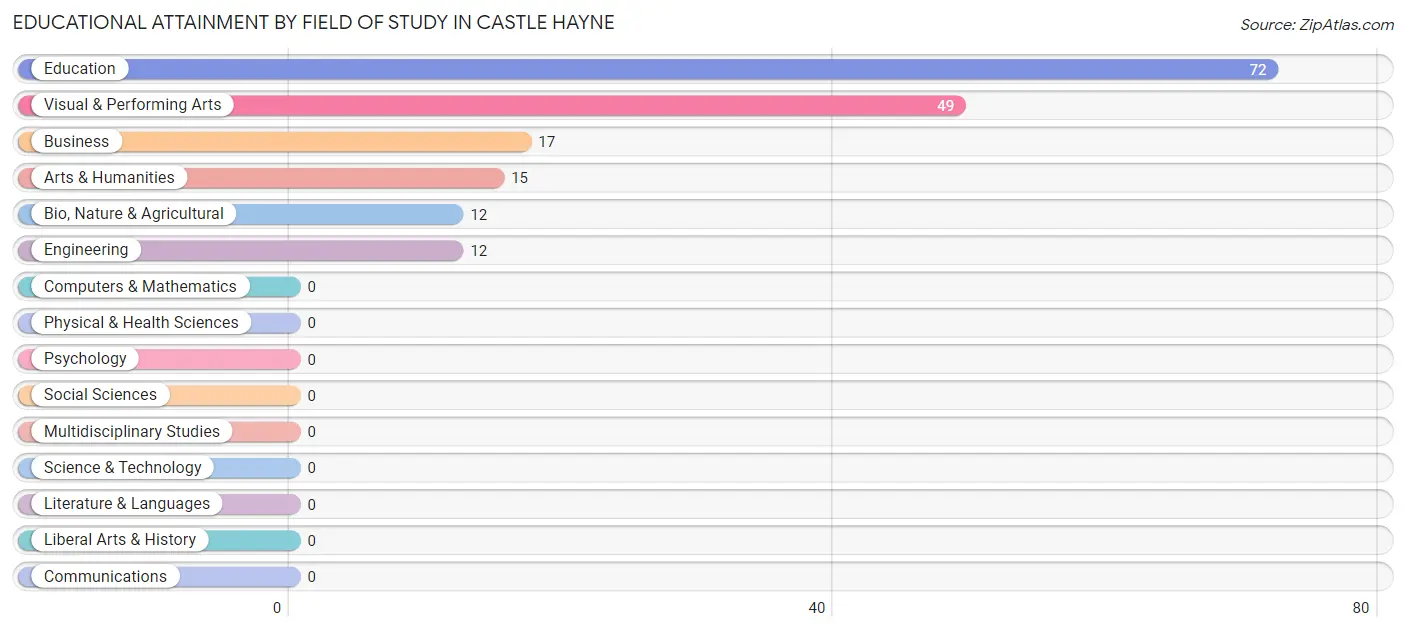
| Field of Study | # Graduates | % Graduates |
| Computers & Mathematics | 0 | 0.0% |
| Bio, Nature & Agricultural | 12 | 6.8% |
| Physical & Health Sciences | 0 | 0.0% |
| Psychology | 0 | 0.0% |
| Social Sciences | 0 | 0.0% |
| Engineering | 12 | 6.8% |
| Multidisciplinary Studies | 0 | 0.0% |
| Science & Technology | 0 | 0.0% |
| Business | 17 | 9.6% |
| Education | 72 | 40.7% |
| Literature & Languages | 0 | 0.0% |
| Liberal Arts & History | 0 | 0.0% |
| Visual & Performing Arts | 49 | 27.7% |
| Communications | 0 | 0.0% |
| Arts & Humanities | 15 | 8.5% |
| Total | 177 | 100.0% |
Transportation & Commute in Castle Hayne
Vehicle Availability by Sex in Castle Hayne
The most prevalent vehicle ownership categories in Castle Hayne are males with 2 vehicles (229, accounting for 71.1%) and females with 2 vehicles (91, making up 180.3%).
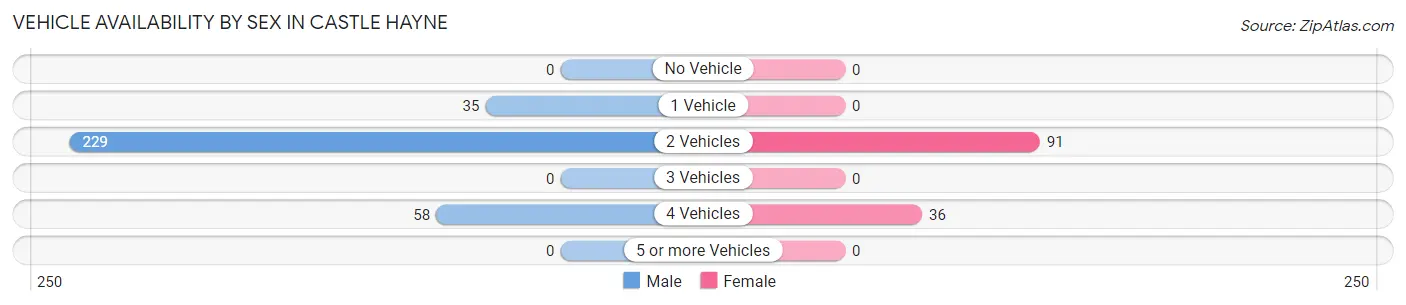
| Vehicles Available | Male | Female |
| No Vehicle | 0 (0.0%) | 0 (0.0%) |
| 1 Vehicle | 35 (10.9%) | 0 (0.0%) |
| 2 Vehicles | 229 (71.1%) | 91 (71.7%) |
| 3 Vehicles | 0 (0.0%) | 0 (0.0%) |
| 4 Vehicles | 58 (18.0%) | 36 (28.3%) |
| 5 or more Vehicles | 0 (0.0%) | 0 (0.0%) |
| Total | 322 (100.0%) | 127 (100.0%) |
Commute Time in Castle Hayne
The most frequently occuring commute durations in Castle Hayne are 25 to 29 minutes (109 commuters, 25.4%), 30 to 34 minutes (102 commuters, 23.7%), and 15 to 19 minutes (95 commuters, 22.1%).
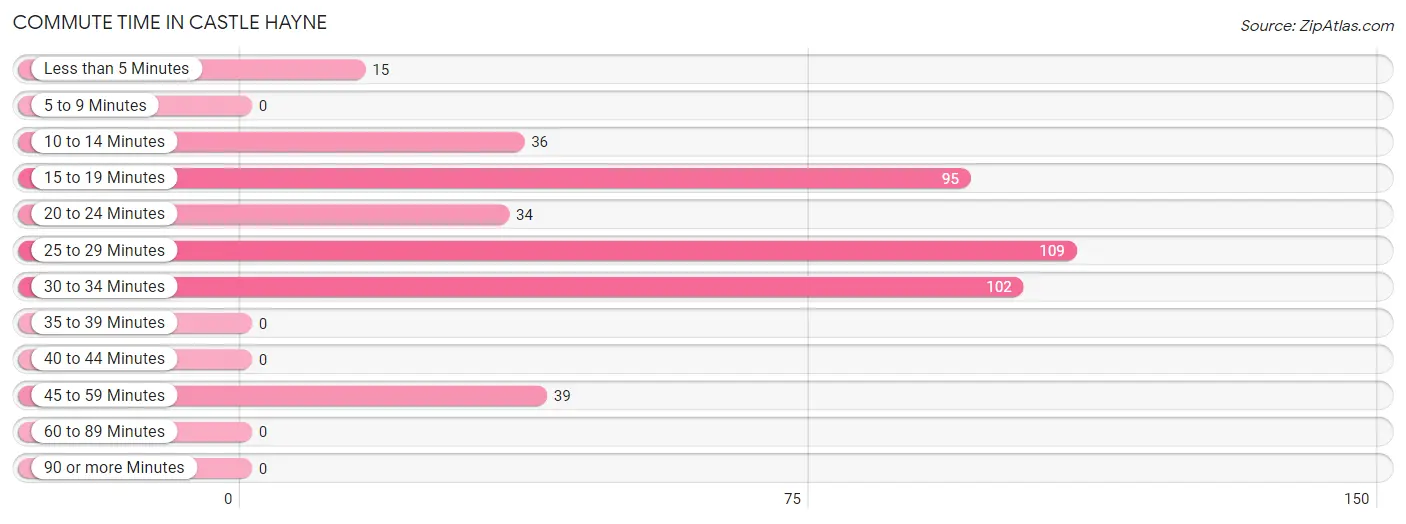
| Commute Time | # Commuters | % Commuters |
| Less than 5 Minutes | 15 | 3.5% |
| 5 to 9 Minutes | 0 | 0.0% |
| 10 to 14 Minutes | 36 | 8.4% |
| 15 to 19 Minutes | 95 | 22.1% |
| 20 to 24 Minutes | 34 | 7.9% |
| 25 to 29 Minutes | 109 | 25.4% |
| 30 to 34 Minutes | 102 | 23.7% |
| 35 to 39 Minutes | 0 | 0.0% |
| 40 to 44 Minutes | 0 | 0.0% |
| 45 to 59 Minutes | 39 | 9.1% |
| 60 to 89 Minutes | 0 | 0.0% |
| 90 or more Minutes | 0 | 0.0% |
Commute Time by Sex in Castle Hayne
The most common commute times in Castle Hayne are 15 to 19 minutes (95 commuters, 31.4%) for males and 30 to 34 minutes (49 commuters, 38.6%) for females.
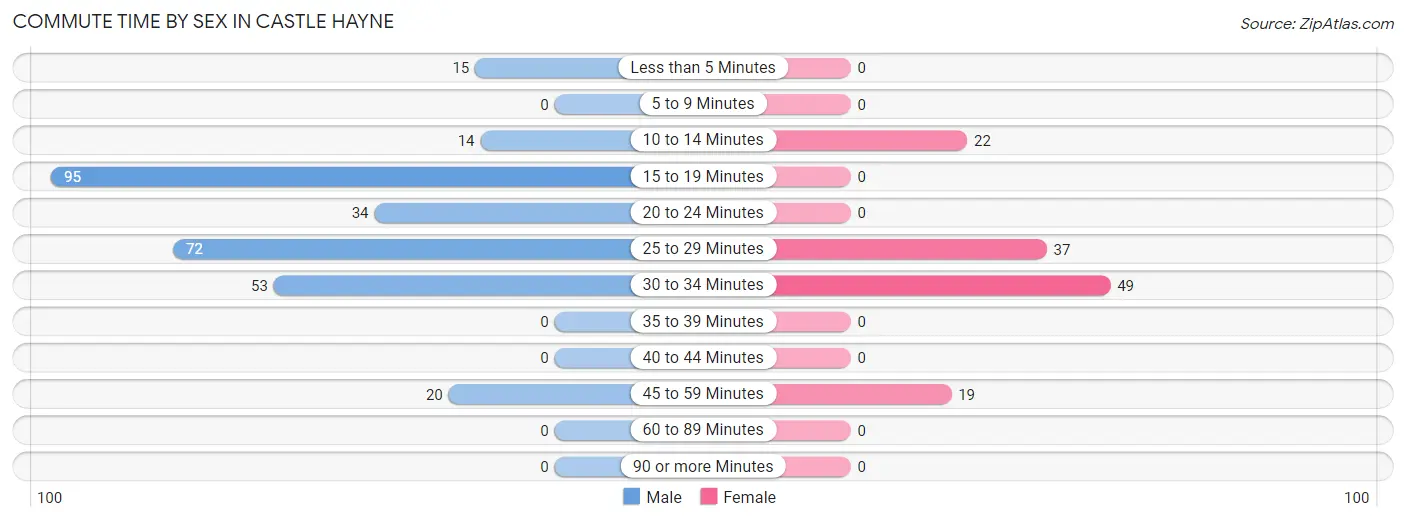
| Commute Time | Male | Female |
| Less than 5 Minutes | 15 (5.0%) | 0 (0.0%) |
| 5 to 9 Minutes | 0 (0.0%) | 0 (0.0%) |
| 10 to 14 Minutes | 14 (4.6%) | 22 (17.3%) |
| 15 to 19 Minutes | 95 (31.4%) | 0 (0.0%) |
| 20 to 24 Minutes | 34 (11.2%) | 0 (0.0%) |
| 25 to 29 Minutes | 72 (23.8%) | 37 (29.1%) |
| 30 to 34 Minutes | 53 (17.5%) | 49 (38.6%) |
| 35 to 39 Minutes | 0 (0.0%) | 0 (0.0%) |
| 40 to 44 Minutes | 0 (0.0%) | 0 (0.0%) |
| 45 to 59 Minutes | 20 (6.6%) | 19 (15.0%) |
| 60 to 89 Minutes | 0 (0.0%) | 0 (0.0%) |
| 90 or more Minutes | 0 (0.0%) | 0 (0.0%) |
Time of Departure to Work by Sex in Castle Hayne
The most frequent times of departure to work in Castle Hayne are 6:30 AM to 6:59 AM (104, 34.3%) for males and 4:00 PM to 11:59 PM (49, 38.6%) for females.
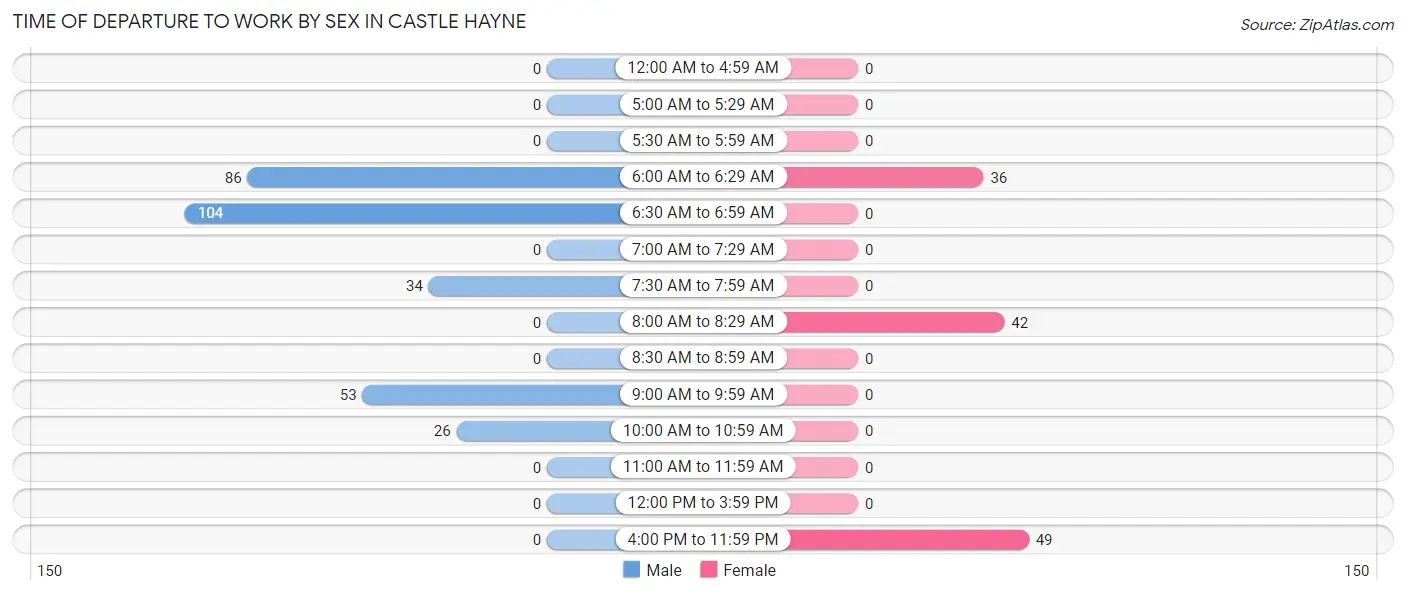
| Time of Departure | Male | Female |
| 12:00 AM to 4:59 AM | 0 (0.0%) | 0 (0.0%) |
| 5:00 AM to 5:29 AM | 0 (0.0%) | 0 (0.0%) |
| 5:30 AM to 5:59 AM | 0 (0.0%) | 0 (0.0%) |
| 6:00 AM to 6:29 AM | 86 (28.4%) | 36 (28.3%) |
| 6:30 AM to 6:59 AM | 104 (34.3%) | 0 (0.0%) |
| 7:00 AM to 7:29 AM | 0 (0.0%) | 0 (0.0%) |
| 7:30 AM to 7:59 AM | 34 (11.2%) | 0 (0.0%) |
| 8:00 AM to 8:29 AM | 0 (0.0%) | 42 (33.1%) |
| 8:30 AM to 8:59 AM | 0 (0.0%) | 0 (0.0%) |
| 9:00 AM to 9:59 AM | 53 (17.5%) | 0 (0.0%) |
| 10:00 AM to 10:59 AM | 26 (8.6%) | 0 (0.0%) |
| 11:00 AM to 11:59 AM | 0 (0.0%) | 0 (0.0%) |
| 12:00 PM to 3:59 PM | 0 (0.0%) | 0 (0.0%) |
| 4:00 PM to 11:59 PM | 0 (0.0%) | 49 (38.6%) |
| Total | 303 (100.0%) | 127 (100.0%) |
Housing Occupancy in Castle Hayne
Occupancy by Ownership in Castle Hayne
Of the total 510 dwellings in Castle Hayne, owner-occupied units account for 353 (69.2%), while renter-occupied units make up 157 (30.8%).
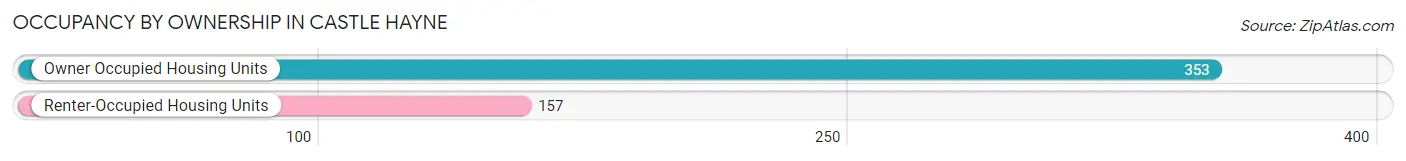
| Occupancy | # Housing Units | % Housing Units |
| Owner Occupied Housing Units | 353 | 69.2% |
| Renter-Occupied Housing Units | 157 | 30.8% |
| Total Occupied Housing Units | 510 | 100.0% |
Occupancy by Household Size in Castle Hayne
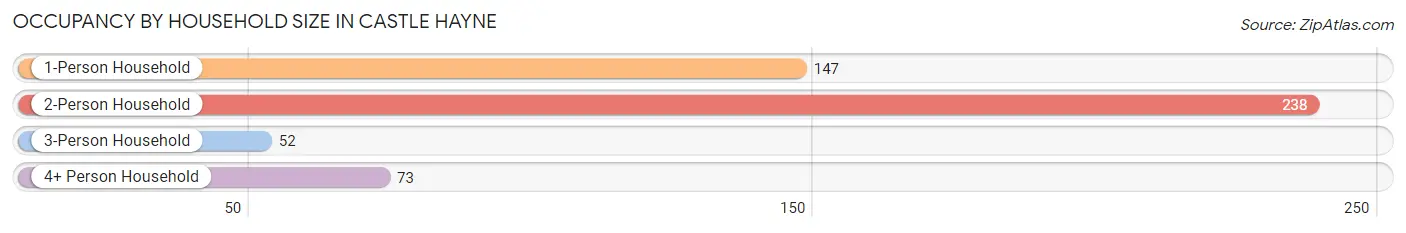
| Household Size | # Housing Units | % Housing Units |
| 1-Person Household | 147 | 28.8% |
| 2-Person Household | 238 | 46.7% |
| 3-Person Household | 52 | 10.2% |
| 4+ Person Household | 73 | 14.3% |
| Total Housing Units | 510 | 100.0% |
Occupancy by Ownership by Household Size in Castle Hayne
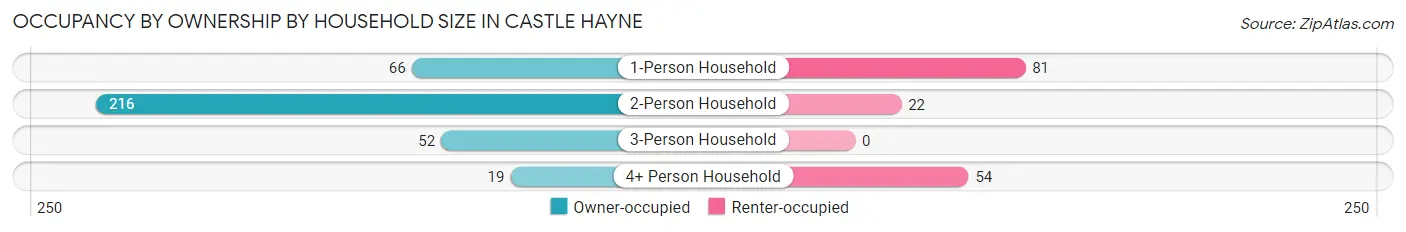
| Household Size | Owner-occupied | Renter-occupied |
| 1-Person Household | 66 (44.9%) | 81 (55.1%) |
| 2-Person Household | 216 (90.8%) | 22 (9.2%) |
| 3-Person Household | 52 (100.0%) | 0 (0.0%) |
| 4+ Person Household | 19 (26.0%) | 54 (74.0%) |
| Total Housing Units | 353 (69.2%) | 157 (30.8%) |
Occupancy by Educational Attainment in Castle Hayne
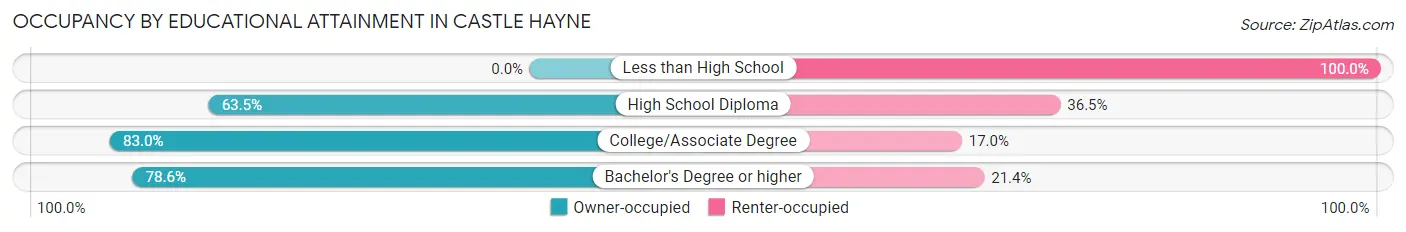
| Household Size | Owner-occupied | Renter-occupied |
| Less than High School | 0 (0.0%) | 54 (100.0%) |
| High School Diploma | 73 (63.5%) | 42 (36.5%) |
| College/Associate Degree | 225 (83.0%) | 46 (17.0%) |
| Bachelor's Degree or higher | 55 (78.6%) | 15 (21.4%) |
Occupancy by Age of Householder in Castle Hayne
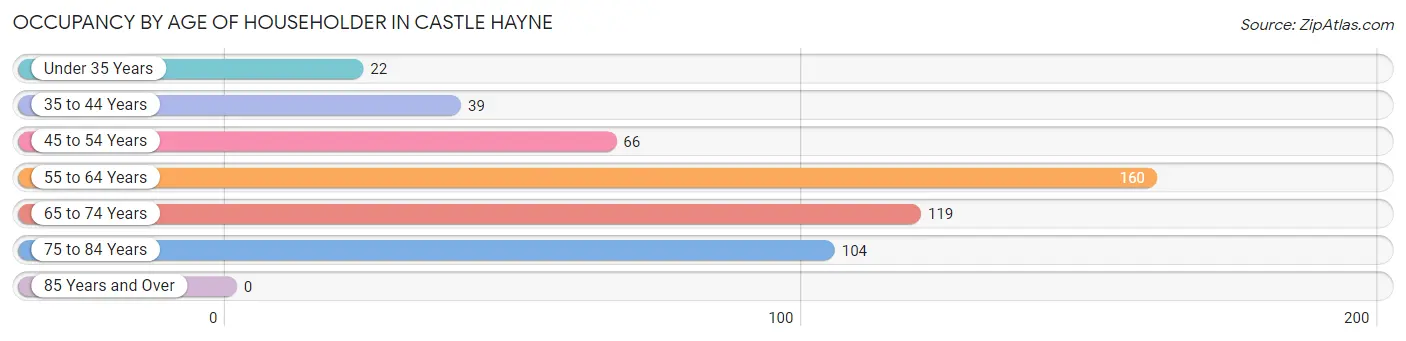
| Age Bracket | # Households | % Households |
| Under 35 Years | 22 | 4.3% |
| 35 to 44 Years | 39 | 7.6% |
| 45 to 54 Years | 66 | 12.9% |
| 55 to 64 Years | 160 | 31.4% |
| 65 to 74 Years | 119 | 23.3% |
| 75 to 84 Years | 104 | 20.4% |
| 85 Years and Over | 0 | 0.0% |
| Total | 510 | 100.0% |
Housing Finances in Castle Hayne
Median Income by Occupancy in Castle Hayne
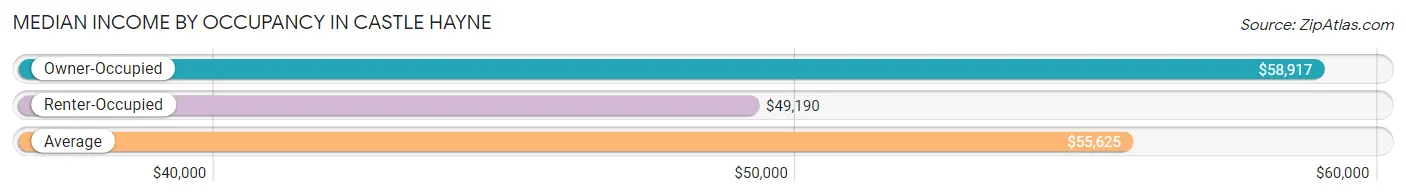
| Occupancy Type | # Households | Median Income |
| Owner-Occupied | 353 (69.2%) | $58,917 |
| Renter-Occupied | 157 (30.8%) | $49,190 |
| Average | 510 (100.0%) | $55,625 |
Occupancy by Householder Income Bracket in Castle Hayne
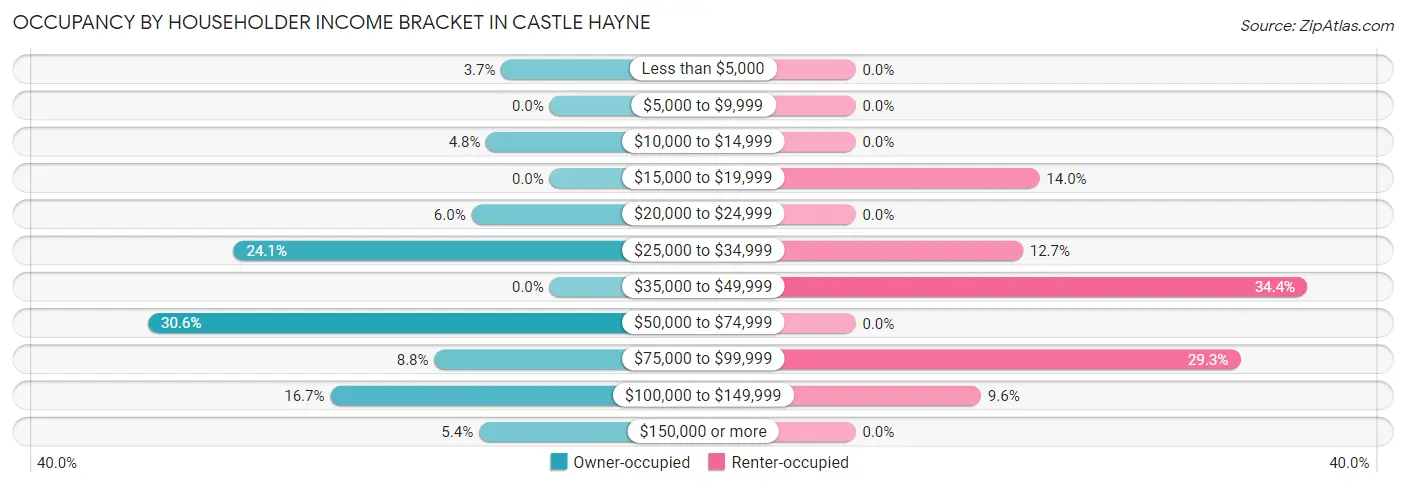
| Income Bracket | Owner-occupied | Renter-occupied |
| Less than $5,000 | 13 (3.7%) | 0 (0.0%) |
| $5,000 to $9,999 | 0 (0.0%) | 0 (0.0%) |
| $10,000 to $14,999 | 17 (4.8%) | 0 (0.0%) |
| $15,000 to $19,999 | 0 (0.0%) | 22 (14.0%) |
| $20,000 to $24,999 | 21 (5.9%) | 0 (0.0%) |
| $25,000 to $34,999 | 85 (24.1%) | 20 (12.7%) |
| $35,000 to $49,999 | 0 (0.0%) | 54 (34.4%) |
| $50,000 to $74,999 | 108 (30.6%) | 0 (0.0%) |
| $75,000 to $99,999 | 31 (8.8%) | 46 (29.3%) |
| $100,000 to $149,999 | 59 (16.7%) | 15 (9.6%) |
| $150,000 or more | 19 (5.4%) | 0 (0.0%) |
| Total | 353 (100.0%) | 157 (100.0%) |
Monthly Housing Cost Tiers in Castle Hayne
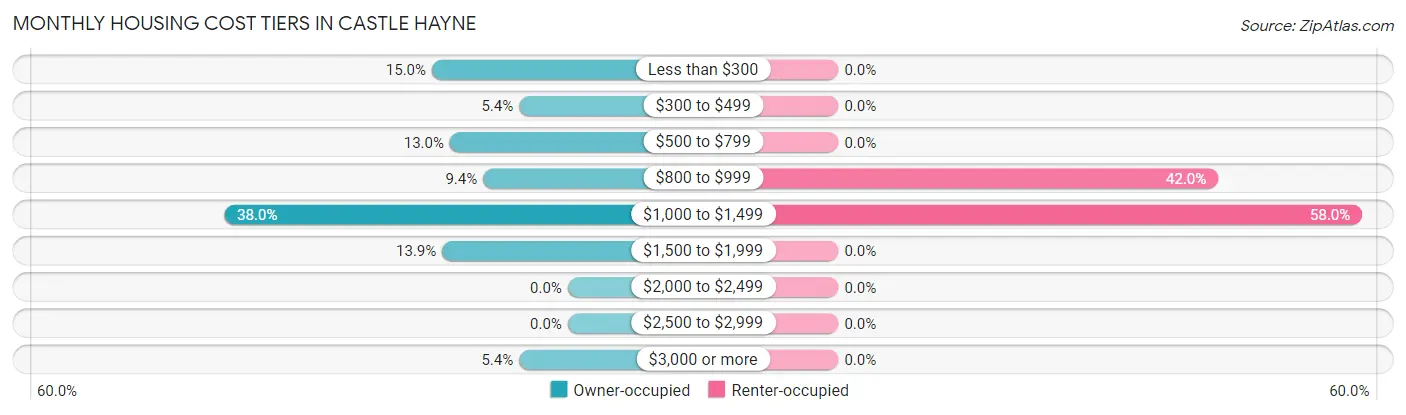
| Monthly Cost | Owner-occupied | Renter-occupied |
| Less than $300 | 53 (15.0%) | 0 (0.0%) |
| $300 to $499 | 19 (5.4%) | 0 (0.0%) |
| $500 to $799 | 46 (13.0%) | 0 (0.0%) |
| $800 to $999 | 33 (9.3%) | 66 (42.0%) |
| $1,000 to $1,499 | 134 (38.0%) | 91 (58.0%) |
| $1,500 to $1,999 | 49 (13.9%) | 0 (0.0%) |
| $2,000 to $2,499 | 0 (0.0%) | 0 (0.0%) |
| $2,500 to $2,999 | 0 (0.0%) | 0 (0.0%) |
| $3,000 or more | 19 (5.4%) | 0 (0.0%) |
| Total | 353 (100.0%) | 157 (100.0%) |
Physical Housing Characteristics in Castle Hayne
Housing Structures in Castle Hayne
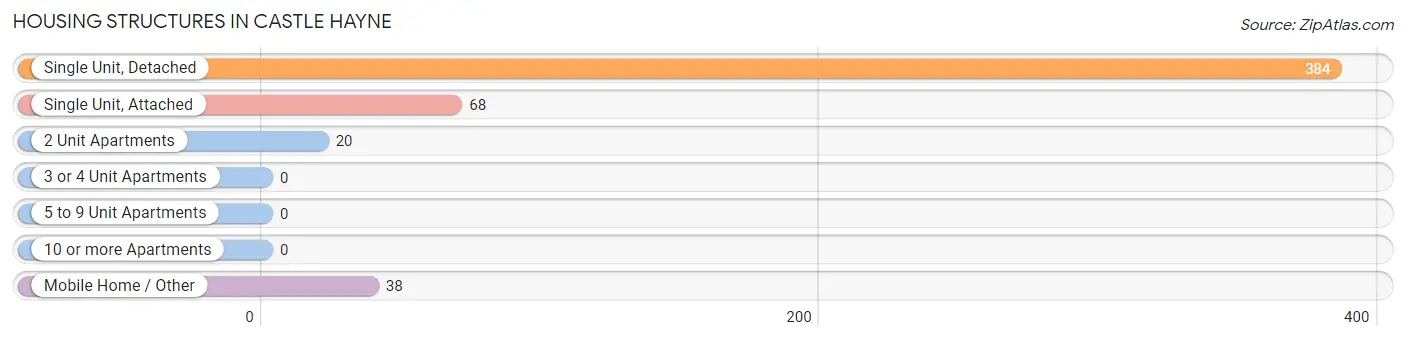
| Structure Type | # Housing Units | % Housing Units |
| Single Unit, Detached | 384 | 75.3% |
| Single Unit, Attached | 68 | 13.3% |
| 2 Unit Apartments | 20 | 3.9% |
| 3 or 4 Unit Apartments | 0 | 0.0% |
| 5 to 9 Unit Apartments | 0 | 0.0% |
| 10 or more Apartments | 0 | 0.0% |
| Mobile Home / Other | 38 | 7.4% |
| Total | 510 | 100.0% |
Housing Structures by Occupancy in Castle Hayne
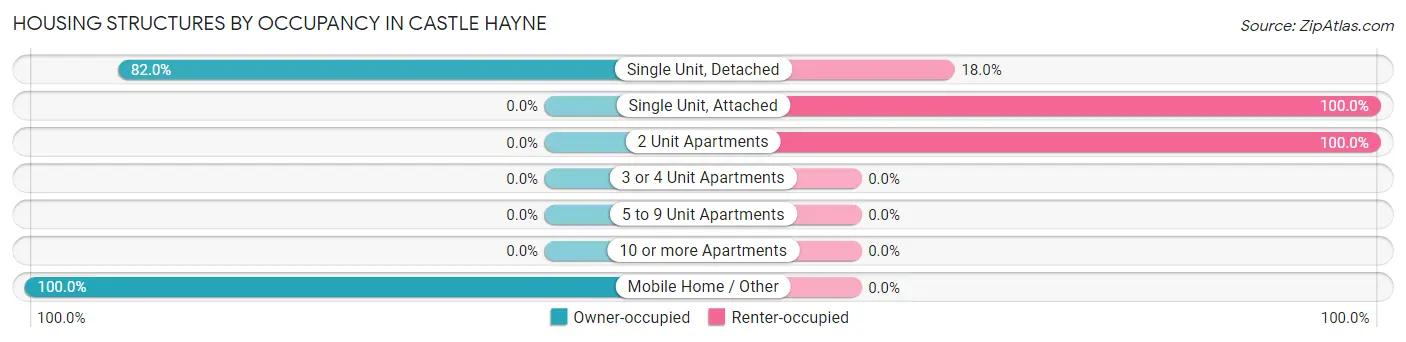
| Structure Type | Owner-occupied | Renter-occupied |
| Single Unit, Detached | 315 (82.0%) | 69 (18.0%) |
| Single Unit, Attached | 0 (0.0%) | 68 (100.0%) |
| 2 Unit Apartments | 0 (0.0%) | 20 (100.0%) |
| 3 or 4 Unit Apartments | 0 (0.0%) | 0 (0.0%) |
| 5 to 9 Unit Apartments | 0 (0.0%) | 0 (0.0%) |
| 10 or more Apartments | 0 (0.0%) | 0 (0.0%) |
| Mobile Home / Other | 38 (100.0%) | 0 (0.0%) |
| Total | 353 (69.2%) | 157 (30.8%) |
Housing Structures by Number of Rooms in Castle Hayne
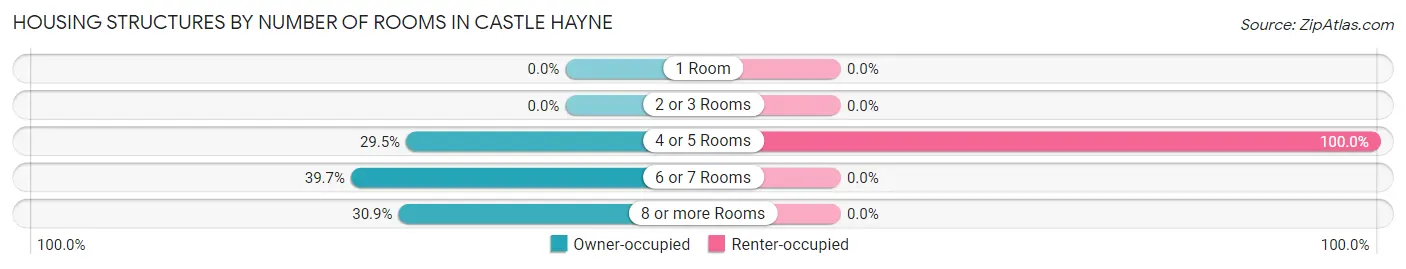
| Number of Rooms | Owner-occupied | Renter-occupied |
| 1 Room | 0 (0.0%) | 0 (0.0%) |
| 2 or 3 Rooms | 0 (0.0%) | 0 (0.0%) |
| 4 or 5 Rooms | 104 (29.5%) | 157 (100.0%) |
| 6 or 7 Rooms | 140 (39.7%) | 0 (0.0%) |
| 8 or more Rooms | 109 (30.9%) | 0 (0.0%) |
| Total | 353 (100.0%) | 157 (100.0%) |
Housing Structure by Heating Type in Castle Hayne
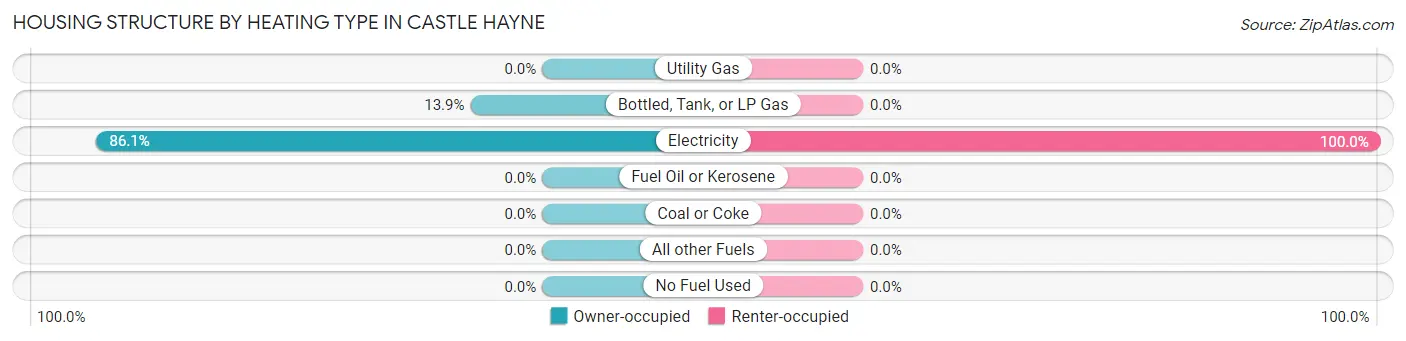
| Heating Type | Owner-occupied | Renter-occupied |
| Utility Gas | 0 (0.0%) | 0 (0.0%) |
| Bottled, Tank, or LP Gas | 49 (13.9%) | 0 (0.0%) |
| Electricity | 304 (86.1%) | 157 (100.0%) |
| Fuel Oil or Kerosene | 0 (0.0%) | 0 (0.0%) |
| Coal or Coke | 0 (0.0%) | 0 (0.0%) |
| All other Fuels | 0 (0.0%) | 0 (0.0%) |
| No Fuel Used | 0 (0.0%) | 0 (0.0%) |
| Total | 353 (100.0%) | 157 (100.0%) |
Household Vehicle Usage in Castle Hayne
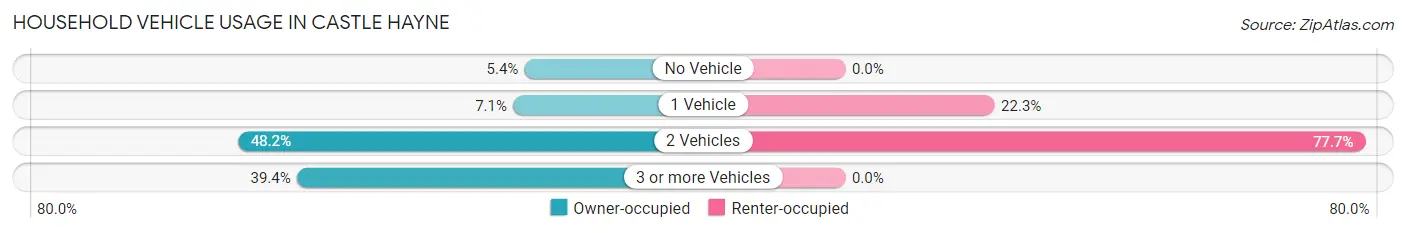
| Vehicles per Household | Owner-occupied | Renter-occupied |
| No Vehicle | 19 (5.4%) | 0 (0.0%) |
| 1 Vehicle | 25 (7.1%) | 35 (22.3%) |
| 2 Vehicles | 170 (48.2%) | 122 (77.7%) |
| 3 or more Vehicles | 139 (39.4%) | 0 (0.0%) |
| Total | 353 (100.0%) | 157 (100.0%) |
Real Estate & Mortgages in Castle Hayne
Real Estate and Mortgage Overview in Castle Hayne
| Characteristic | Without Mortgage | With Mortgage |
| Housing Units | 148 | 205 |
| Median Property Value | $252,800 | $338,900 |
| Median Household Income | - | - |
| Monthly Housing Costs | $507 | $19 |
| Real Estate Taxes | $1,553 | $0 |
Property Value by Mortgage Status in Castle Hayne
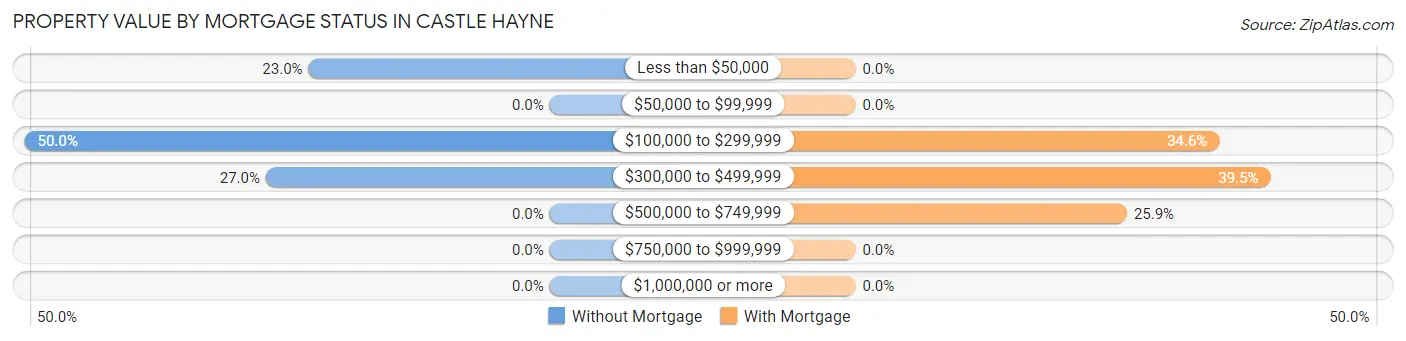
| Property Value | Without Mortgage | With Mortgage |
| Less than $50,000 | 34 (23.0%) | 0 (0.0%) |
| $50,000 to $99,999 | 0 (0.0%) | 0 (0.0%) |
| $100,000 to $299,999 | 74 (50.0%) | 71 (34.6%) |
| $300,000 to $499,999 | 40 (27.0%) | 81 (39.5%) |
| $500,000 to $749,999 | 0 (0.0%) | 53 (25.9%) |
| $750,000 to $999,999 | 0 (0.0%) | 0 (0.0%) |
| $1,000,000 or more | 0 (0.0%) | 0 (0.0%) |
| Total | 148 (100.0%) | 205 (100.0%) |
Household Income by Mortgage Status in Castle Hayne
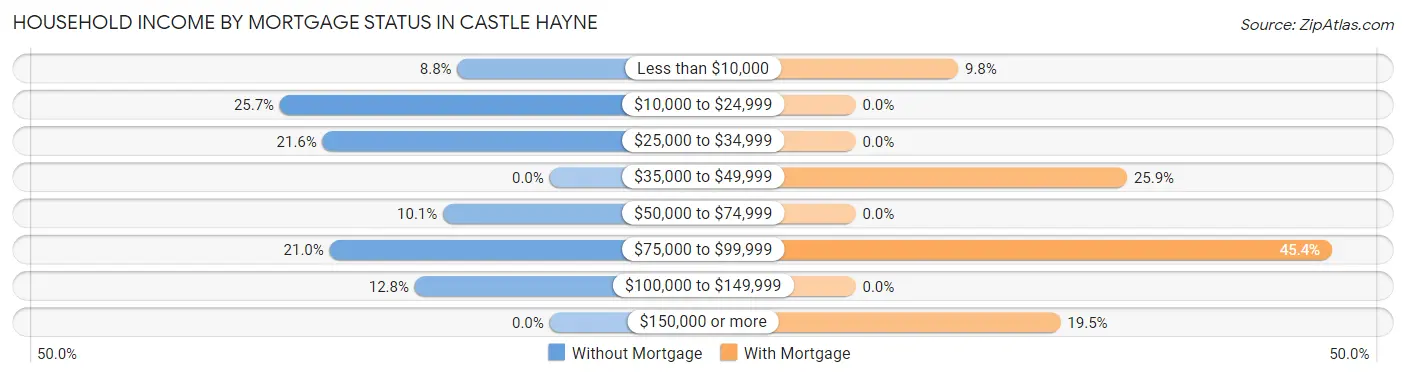
| Household Income | Without Mortgage | With Mortgage |
| Less than $10,000 | 13 (8.8%) | 20 (9.8%) |
| $10,000 to $24,999 | 38 (25.7%) | 0 (0.0%) |
| $25,000 to $34,999 | 32 (21.6%) | 0 (0.0%) |
| $35,000 to $49,999 | 0 (0.0%) | 53 (25.9%) |
| $50,000 to $74,999 | 15 (10.1%) | 0 (0.0%) |
| $75,000 to $99,999 | 31 (20.9%) | 93 (45.4%) |
| $100,000 to $149,999 | 19 (12.8%) | 0 (0.0%) |
| $150,000 or more | 0 (0.0%) | 40 (19.5%) |
| Total | 148 (100.0%) | 205 (100.0%) |
Property Value to Household Income Ratio in Castle Hayne
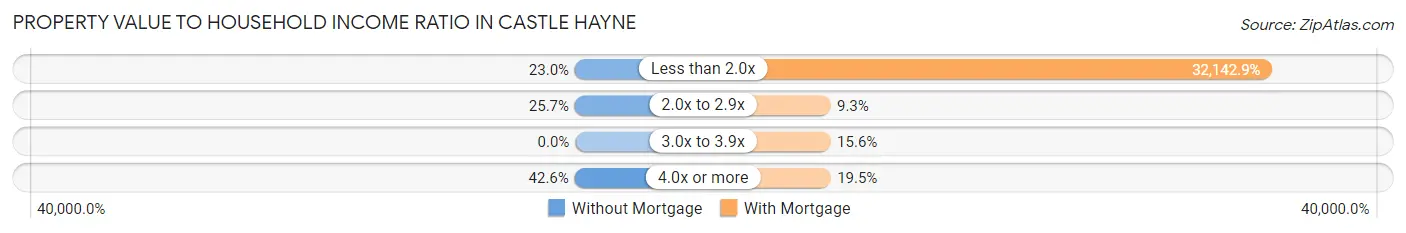
| Value-to-Income Ratio | Without Mortgage | With Mortgage |
| Less than 2.0x | 34 (23.0%) | 65,893 (32,142.9%) |
| 2.0x to 2.9x | 38 (25.7%) | 19 (9.3%) |
| 3.0x to 3.9x | 0 (0.0%) | 32 (15.6%) |
| 4.0x or more | 63 (42.6%) | 40 (19.5%) |
| Total | 148 (100.0%) | 205 (100.0%) |
Real Estate Taxes by Mortgage Status in Castle Hayne
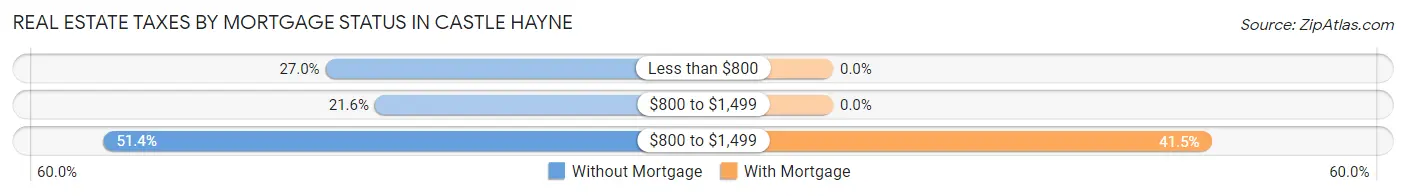
| Property Taxes | Without Mortgage | With Mortgage |
| Less than $800 | 40 (27.0%) | 0 (0.0%) |
| $800 to $1,499 | 32 (21.6%) | 0 (0.0%) |
| $800 to $1,499 | 76 (51.3%) | 85 (41.5%) |
| Total | 148 (100.0%) | 205 (100.0%) |
Health & Disability in Castle Hayne
Health Insurance Coverage by Age in Castle Hayne

| Age Bracket | With Coverage | Without Coverage |
| Under 6 Years | 19 (100.0%) | 0 (0.0%) |
| 6 to 18 Years | 84 (84.9%) | 15 (15.1%) |
| 19 to 25 Years | 37 (72.6%) | 14 (27.5%) |
| 26 to 34 Years | 0 (0.0%) | 26 (100.0%) |
| 35 to 44 Years | 59 (100.0%) | 0 (0.0%) |
| 45 to 54 Years | 78 (51.0%) | 75 (49.0%) |
| 55 to 64 Years | 200 (100.0%) | 0 (0.0%) |
| 65 to 74 Years | 193 (88.5%) | 25 (11.5%) |
| 75 Years and older | 145 (100.0%) | 0 (0.0%) |
| Total | 815 (84.0%) | 155 (16.0%) |
Health Insurance Coverage by Citizenship Status in Castle Hayne
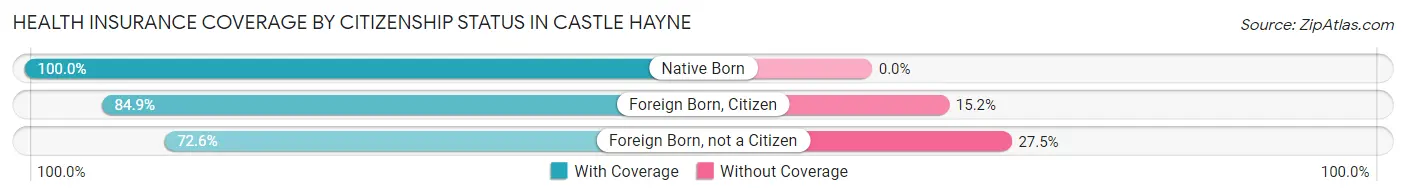
| Citizenship Status | With Coverage | Without Coverage |
| Native Born | 19 (100.0%) | 0 (0.0%) |
| Foreign Born, Citizen | 84 (84.9%) | 15 (15.1%) |
| Foreign Born, not a Citizen | 37 (72.6%) | 14 (27.5%) |
Health Insurance Coverage by Household Income in Castle Hayne
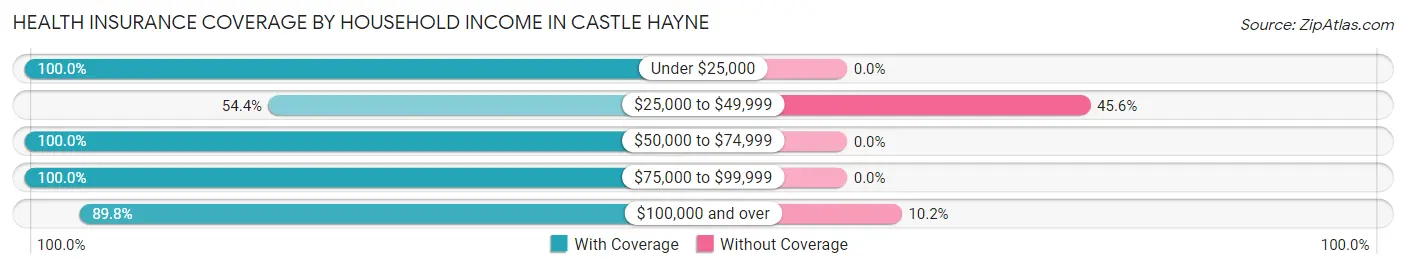
| Household Income | With Coverage | Without Coverage |
| Under $25,000 | 100 (100.0%) | 0 (0.0%) |
| $25,000 to $49,999 | 154 (54.4%) | 129 (45.6%) |
| $50,000 to $74,999 | 224 (100.0%) | 0 (0.0%) |
| $75,000 to $99,999 | 109 (100.0%) | 0 (0.0%) |
| $100,000 and over | 228 (89.8%) | 26 (10.2%) |
Public vs Private Health Insurance Coverage by Age in Castle Hayne
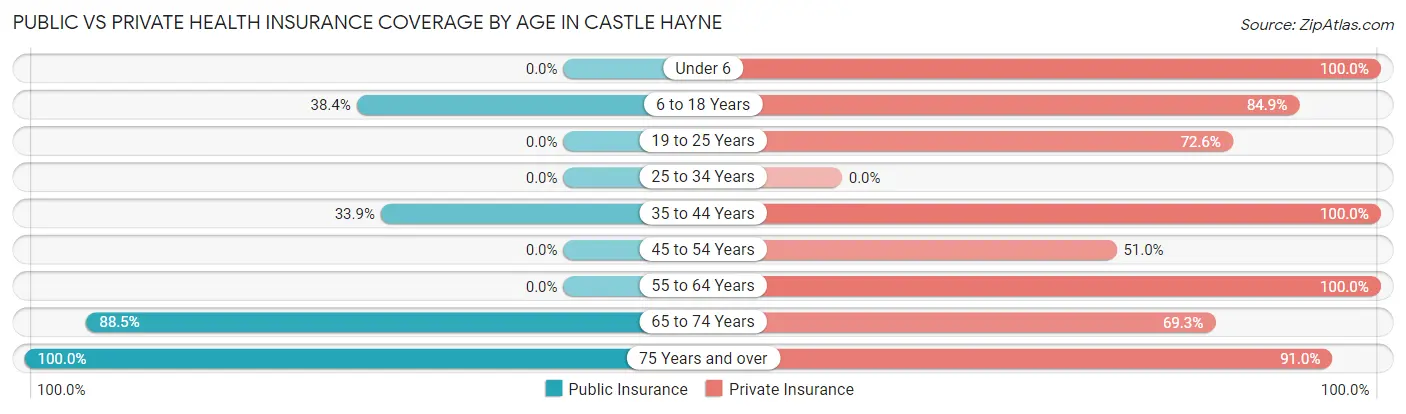
| Age Bracket | Public Insurance | Private Insurance |
| Under 6 | 0 (0.0%) | 19 (100.0%) |
| 6 to 18 Years | 38 (38.4%) | 84 (84.9%) |
| 19 to 25 Years | 0 (0.0%) | 37 (72.6%) |
| 25 to 34 Years | 0 (0.0%) | 0 (0.0%) |
| 35 to 44 Years | 20 (33.9%) | 59 (100.0%) |
| 45 to 54 Years | 0 (0.0%) | 78 (51.0%) |
| 55 to 64 Years | 0 (0.0%) | 200 (100.0%) |
| 65 to 74 Years | 193 (88.5%) | 151 (69.3%) |
| 75 Years and over | 145 (100.0%) | 132 (91.0%) |
| Total | 396 (40.8%) | 760 (78.3%) |
Disability Status by Sex by Age in Castle Hayne
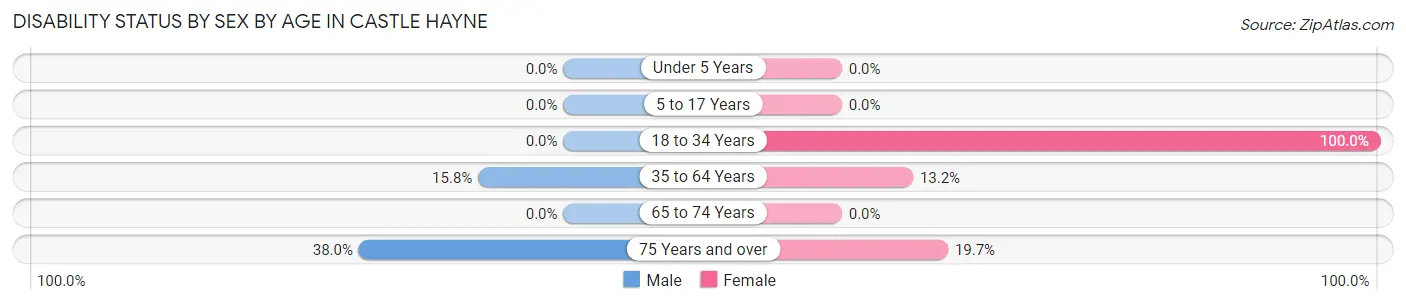
| Age Bracket | Male | Female |
| Under 5 Years | 0 (0.0%) | 0 (0.0%) |
| 5 to 17 Years | 0 (0.0%) | 0 (0.0%) |
| 18 to 34 Years | 0 (0.0%) | 22 (100.0%) |
| 35 to 64 Years | 40 (15.8%) | 21 (13.2%) |
| 65 to 74 Years | 0 (0.0%) | 0 (0.0%) |
| 75 Years and over | 30 (38.0%) | 13 (19.7%) |
Disability Class by Sex by Age in Castle Hayne
Disability Class: Hearing Difficulty
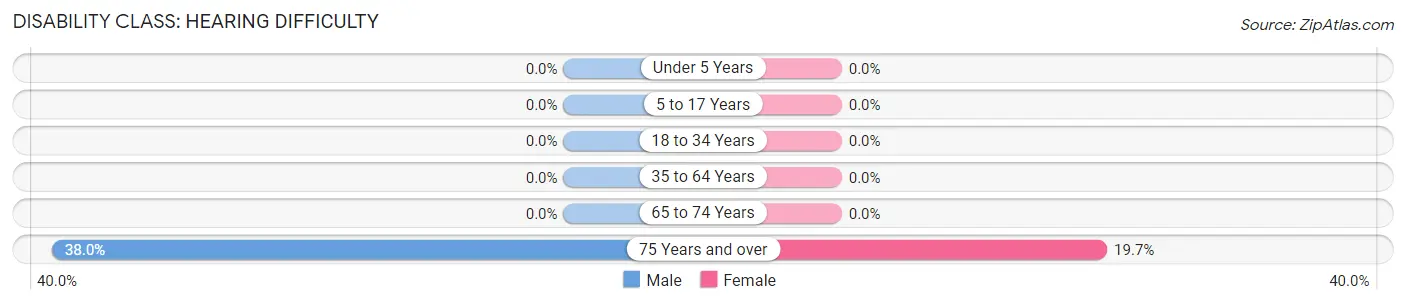
| Age Bracket | Male | Female |
| Under 5 Years | 0 (0.0%) | 0 (0.0%) |
| 5 to 17 Years | 0 (0.0%) | 0 (0.0%) |
| 18 to 34 Years | 0 (0.0%) | 0 (0.0%) |
| 35 to 64 Years | 0 (0.0%) | 0 (0.0%) |
| 65 to 74 Years | 0 (0.0%) | 0 (0.0%) |
| 75 Years and over | 30 (38.0%) | 13 (19.7%) |
Disability Class: Vision Difficulty
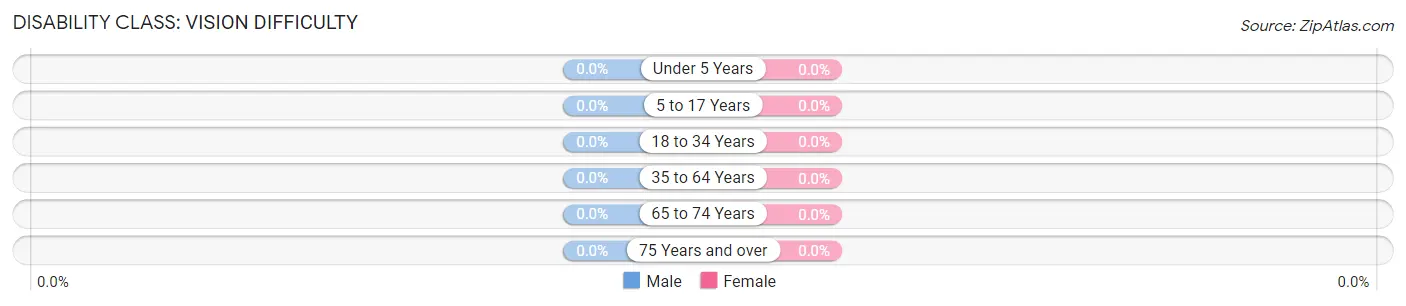
| Age Bracket | Male | Female |
| Under 5 Years | 0 (0.0%) | 0 (0.0%) |
| 5 to 17 Years | 0 (0.0%) | 0 (0.0%) |
| 18 to 34 Years | 0 (0.0%) | 0 (0.0%) |
| 35 to 64 Years | 0 (0.0%) | 0 (0.0%) |
| 65 to 74 Years | 0 (0.0%) | 0 (0.0%) |
| 75 Years and over | 0 (0.0%) | 0 (0.0%) |
Disability Class: Cognitive Difficulty
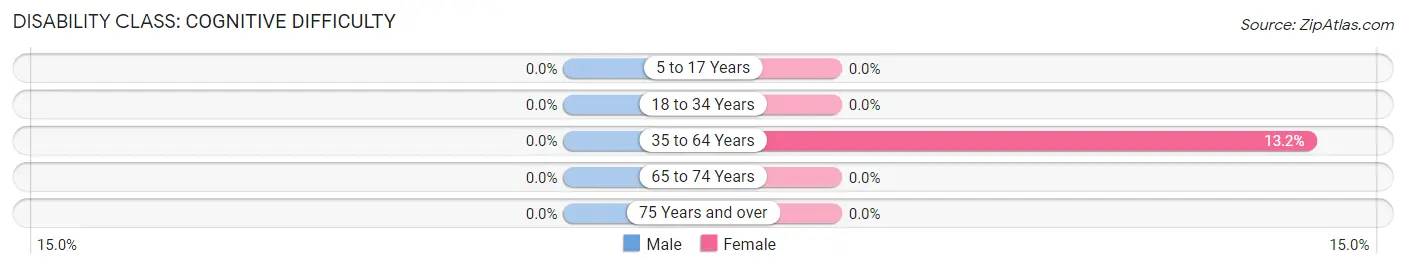
| Age Bracket | Male | Female |
| 5 to 17 Years | 0 (0.0%) | 0 (0.0%) |
| 18 to 34 Years | 0 (0.0%) | 0 (0.0%) |
| 35 to 64 Years | 0 (0.0%) | 21 (13.2%) |
| 65 to 74 Years | 0 (0.0%) | 0 (0.0%) |
| 75 Years and over | 0 (0.0%) | 0 (0.0%) |
Disability Class: Ambulatory Difficulty
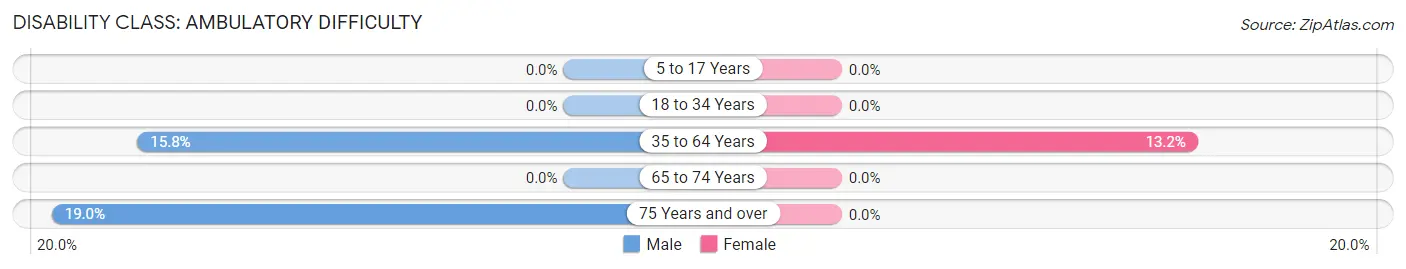
| Age Bracket | Male | Female |
| 5 to 17 Years | 0 (0.0%) | 0 (0.0%) |
| 18 to 34 Years | 0 (0.0%) | 0 (0.0%) |
| 35 to 64 Years | 40 (15.8%) | 21 (13.2%) |
| 65 to 74 Years | 0 (0.0%) | 0 (0.0%) |
| 75 Years and over | 15 (19.0%) | 0 (0.0%) |
Disability Class: Self-Care Difficulty
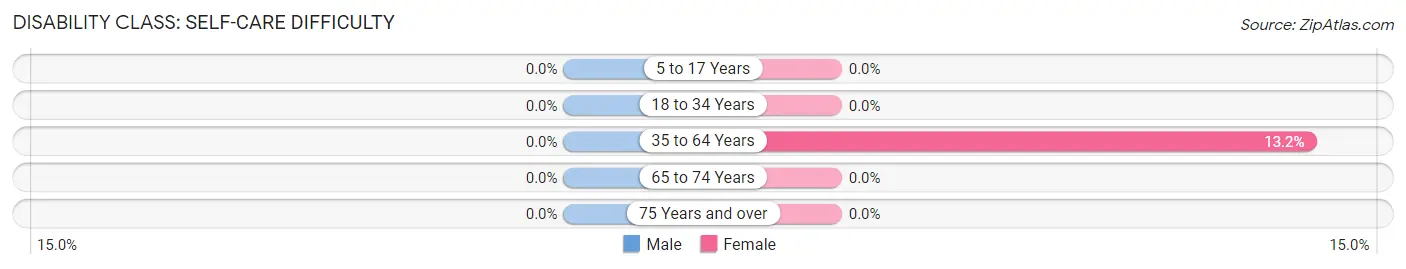
| Age Bracket | Male | Female |
| 5 to 17 Years | 0 (0.0%) | 0 (0.0%) |
| 18 to 34 Years | 0 (0.0%) | 0 (0.0%) |
| 35 to 64 Years | 0 (0.0%) | 21 (13.2%) |
| 65 to 74 Years | 0 (0.0%) | 0 (0.0%) |
| 75 Years and over | 0 (0.0%) | 0 (0.0%) |
Technology Access in Castle Hayne
Computing Device Access in Castle Hayne
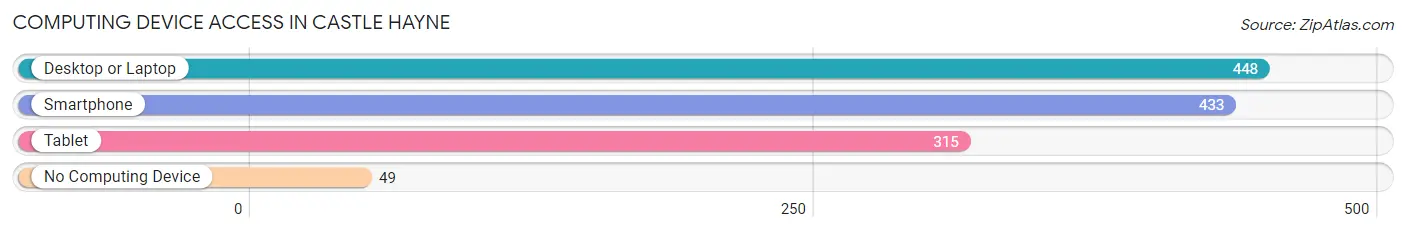
| Device Type | # Households | % Households |
| Desktop or Laptop | 448 | 87.8% |
| Smartphone | 433 | 84.9% |
| Tablet | 315 | 61.8% |
| No Computing Device | 49 | 9.6% |
| Total | 510 | 100.0% |
Internet Access in Castle Hayne
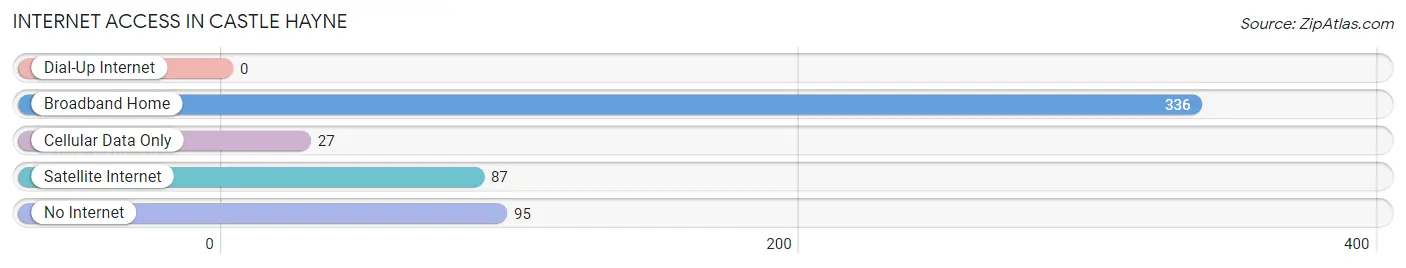
| Internet Type | # Households | % Households |
| Dial-Up Internet | 0 | 0.0% |
| Broadband Home | 336 | 65.9% |
| Cellular Data Only | 27 | 5.3% |
| Satellite Internet | 87 | 17.1% |
| No Internet | 95 | 18.6% |
| Total | 510 | 100.0% |
Castle Hayne Summary
Castle Hayne is a small unincorporated community located in New Hanover County, North Carolina. It is situated approximately 10 miles north of Wilmington and is part of the Wilmington Metropolitan Statistical Area. The population of Castle Hayne was estimated to be 2,845 in 2019.
History
The area now known as Castle Hayne was first settled in the late 1700s by a group of Quakers from Pennsylvania. The community was originally known as Hayne’s Crossroads, named after the Hayne family who owned a large plantation in the area. The name was later changed to Castle Hayne in 1845 when the post office was established.
The community was a major agricultural center in the 19th century, with cotton, corn, and tobacco being the primary crops. The area was also home to several sawmills and gristmills. In the early 20th century, Castle Hayne began to experience a period of growth and development. The community was connected to Wilmington by a trolley line in 1910, and the Castle Hayne Naval Air Station was established in 1941.
Geography
Castle Hayne is located in southeastern North Carolina, approximately 10 miles north of Wilmington. The community is situated on the banks of the Northeast Cape Fear River and is bordered by the towns of Rocky Point and Burgaw to the north and east, respectively. The area is characterized by flat terrain and is mostly covered in pine and hardwood forests.
Economy
The economy of Castle Hayne is largely based on agriculture and manufacturing. The area is home to several large farms that produce cotton, corn, and tobacco. There are also several manufacturing plants in the area, including a paper mill and a plastics factory. In addition, the community is home to several small businesses, including restaurants, retail stores, and service providers.
Demographics
As of 2019, the population of Castle Hayne was estimated to be 2,845. The racial makeup of the community was 79.3% White, 15.2% African American, 0.7% Native American, 0.7% Asian, and 4.1% from other races. The median household income was $45,945, and the median home value was $179,400.
Conclusion
Castle Hayne is a small unincorporated community located in New Hanover County, North Carolina. It is situated approximately 10 miles north of Wilmington and is part of the Wilmington Metropolitan Statistical Area. The population of Castle Hayne was estimated to be 2,845 in 2019. The economy of Castle Hayne is largely based on agriculture and manufacturing, and the racial makeup of the community was 79.3% White, 15.2% African American, 0.7% Native American, 0.7% Asian, and 4.1% from other races. Castle Hayne is a unique community with a rich history and a bright future.
Common Questions
What is Per Capita Income in Castle Hayne?
Per Capita income in Castle Hayne is $32,470.
What is the Median Family Income in Castle Hayne?
Median Family Income in Castle Hayne is $66,327.
What is the Median Household income in Castle Hayne?
Median Household Income in Castle Hayne is $55,625.
What is Inequality or Gini Index in Castle Hayne?
Inequality or Gini Index in Castle Hayne is 0.34.
What is the Total Population of Castle Hayne?
Total Population of Castle Hayne is 970.
What is the Total Male Population of Castle Hayne?
Total Male Population of Castle Hayne is 519.
What is the Total Female Population of Castle Hayne?
Total Female Population of Castle Hayne is 451.
What is the Ratio of Males per 100 Females in Castle Hayne?
There are 115.08 Males per 100 Females in Castle Hayne.
What is the Ratio of Females per 100 Males in Castle Hayne?
There are 86.90 Females per 100 Males in Castle Hayne.
What is the Median Population Age in Castle Hayne?
Median Population Age in Castle Hayne is 57.9 Years.
What is the Average Family Size in Castle Hayne
Average Family Size in Castle Hayne is 2.4 People.
What is the Average Household Size in Castle Hayne
Average Household Size in Castle Hayne is 1.9 People.
How Large is the Labor Force in Castle Hayne?
There are 502 People in the Labor Forcein in Castle Hayne.
What is the Percentage of People in the Labor Force in Castle Hayne?
57.9% of People are in the Labor Force in Castle Hayne.
What is the Unemployment Rate in Castle Hayne?
Unemployment Rate in Castle Hayne is 4.0%.