Carthage, NC Map & Demographics
Carthage Map
Carthage Overview
$31,044
PER CAPITA INCOME
$85,000
AVG FAMILY INCOME
$55,469
AVG HOUSEHOLD INCOME
22.4%
WAGE / INCOME GAP [ % ]
77.6¢/ $1
WAGE / INCOME GAP [ $ ]
0.43
INEQUALITY / GINI INDEX
2,779
TOTAL POPULATION
1,303
MALE POPULATION
1,476
FEMALE POPULATION
88.28
MALES / 100 FEMALES
113.28
FEMALES / 100 MALES
43.4
MEDIAN AGE
3.1
AVG FAMILY SIZE
2.4
AVG HOUSEHOLD SIZE
1,369
LABOR FORCE [ PEOPLE ]
61.5%
PERCENT IN LABOR FORCE
2.0%
UNEMPLOYMENT RATE
Carthage Zip Codes
Carthage Area Codes
Income in Carthage
Income Overview in Carthage
Per Capita Income in Carthage is $31,044, while median incomes of families and households are $85,000 and $55,469 respectively.
| Characteristic | Number | Measure |
| Per Capita Income | 2,779 | $31,044 |
| Median Family Income | 718 | $85,000 |
| Mean Family Income | 718 | $96,321 |
| Median Household Income | 1,124 | $55,469 |
| Mean Household Income | 1,124 | $73,635 |
| Income Deficit | 718 | $0 |
| Wage / Income Gap (%) | 2,779 | 22.35% |
| Wage / Income Gap ($) | 2,779 | 77.65¢ per $1 |
| Gini / Inequality Index | 2,779 | 0.43 |
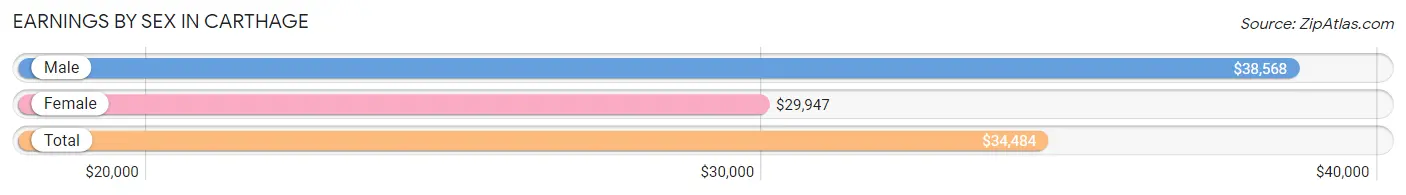
Earnings by Sex in Carthage
Average Earnings in Carthage are $34,484, $38,568 for men and $29,947 for women, a difference of 22.4%.
| Sex | Number | Average Earnings |
| Male | 689 (46.8%) | $38,568 |
| Female | 782 (53.2%) | $29,947 |
| Total | 1,471 (100.0%) | $34,484 |
Earnings by Sex by Income Bracket in Carthage
The most common earnings brackets in Carthage are $75,000 to $99,999 for men (105 | 15.2%) and $55,000 to $64,999 for women (166 | 21.2%).
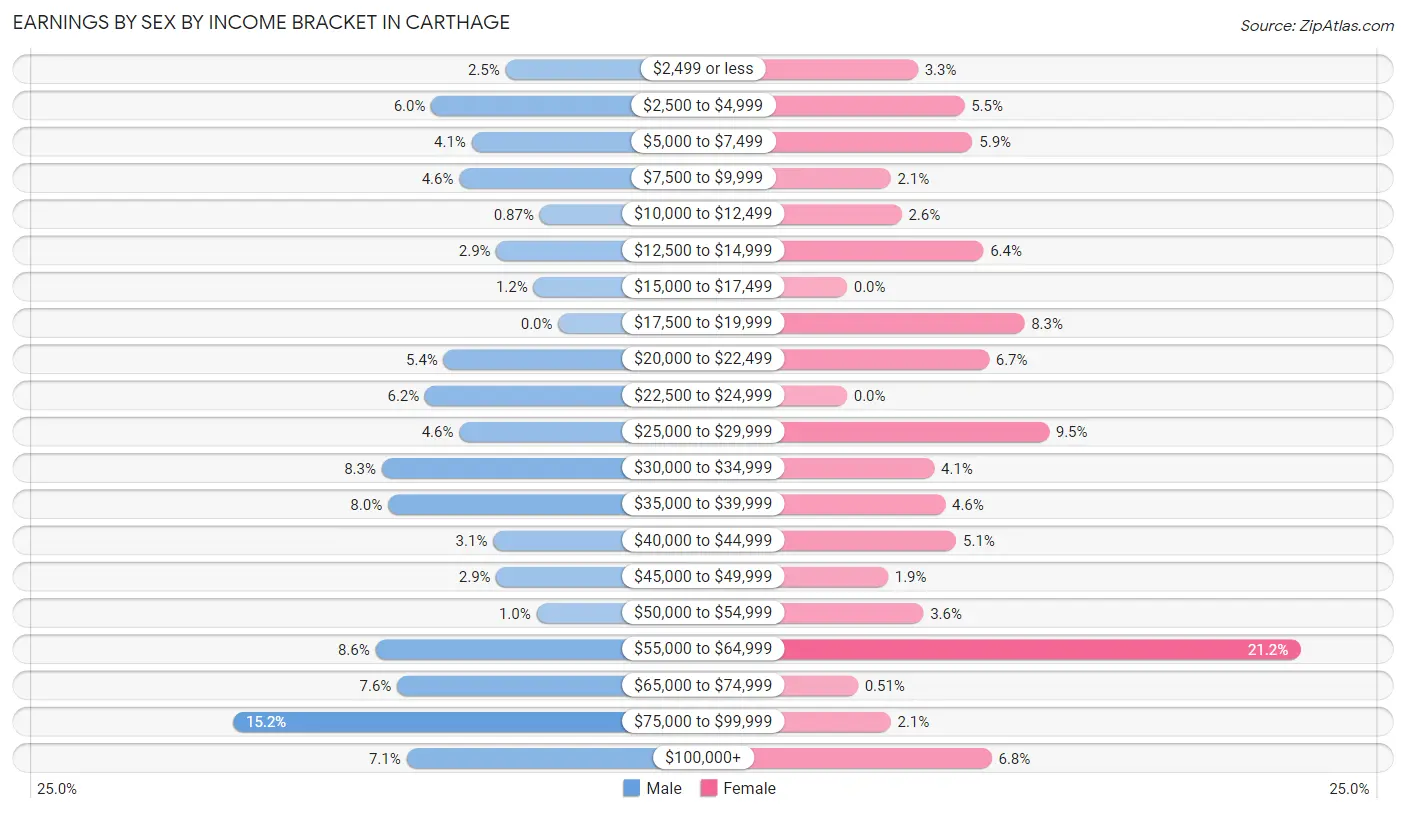
| Income | Male | Female |
| $2,499 or less | 17 (2.5%) | 26 (3.3%) |
| $2,500 to $4,999 | 41 (5.9%) | 43 (5.5%) |
| $5,000 to $7,499 | 28 (4.1%) | 46 (5.9%) |
| $7,500 to $9,999 | 32 (4.6%) | 16 (2.1%) |
| $10,000 to $12,499 | 6 (0.9%) | 20 (2.6%) |
| $12,500 to $14,999 | 20 (2.9%) | 50 (6.4%) |
| $15,000 to $17,499 | 8 (1.2%) | 0 (0.0%) |
| $17,500 to $19,999 | 0 (0.0%) | 65 (8.3%) |
| $20,000 to $22,499 | 37 (5.4%) | 52 (6.7%) |
| $22,500 to $24,999 | 43 (6.2%) | 0 (0.0%) |
| $25,000 to $29,999 | 32 (4.6%) | 74 (9.5%) |
| $30,000 to $34,999 | 57 (8.3%) | 32 (4.1%) |
| $35,000 to $39,999 | 55 (8.0%) | 36 (4.6%) |
| $40,000 to $44,999 | 21 (3.0%) | 40 (5.1%) |
| $45,000 to $49,999 | 20 (2.9%) | 15 (1.9%) |
| $50,000 to $54,999 | 7 (1.0%) | 28 (3.6%) |
| $55,000 to $64,999 | 59 (8.6%) | 166 (21.2%) |
| $65,000 to $74,999 | 52 (7.5%) | 4 (0.5%) |
| $75,000 to $99,999 | 105 (15.2%) | 16 (2.1%) |
| $100,000+ | 49 (7.1%) | 53 (6.8%) |
| Total | 689 (100.0%) | 782 (100.0%) |
Earnings by Sex by Educational Attainment in Carthage
Average earnings in Carthage are $41,750 for men and $38,485 for women, a difference of 7.8%. Men with an educational attainment of high school diploma enjoy the highest average annual earnings of $54,821, while those with college or associate's degree education earn the least with $39,000. Women with an educational attainment of graduate degree earn the most with the average annual earnings of $56,509, while those with high school diploma education have the smallest earnings of $25,357.
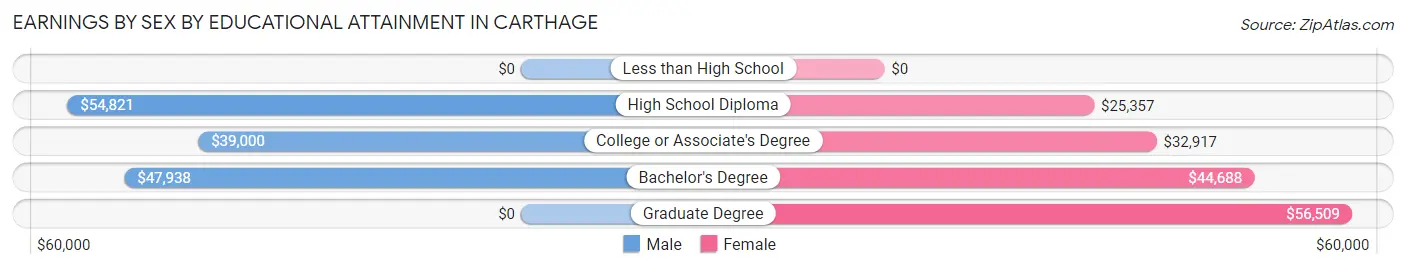
| Educational Attainment | Male Income | Female Income |
| Less than High School | - | - |
| High School Diploma | $54,821 | $25,357 |
| College or Associate's Degree | $39,000 | $32,917 |
| Bachelor's Degree | $47,938 | $44,688 |
| Graduate Degree | - | - |
| Total | $41,750 | $38,485 |
Family Income in Carthage
Family Income Brackets in Carthage
According to the Carthage family income data, there are 180 families falling into the $100,000 to $149,999 income range, which is the most common income bracket and makes up 25.1% of all families. Conversely, the $15,000 to $24,999 income bracket is the least frequent group with only 7 families (1.0%) belonging to this category.
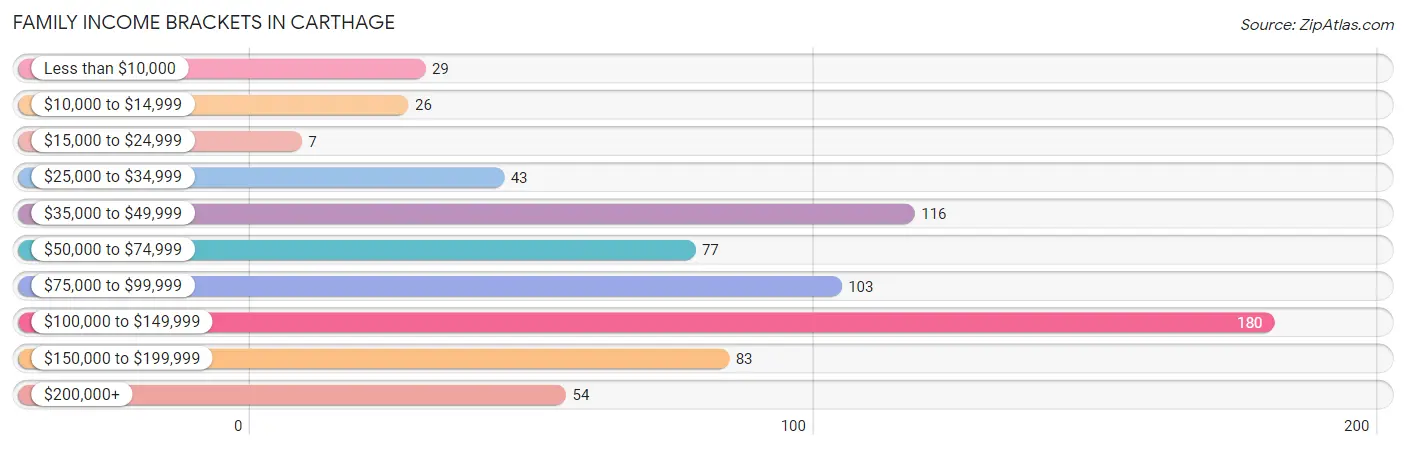
| Income Bracket | # Families | % Families |
| Less than $10,000 | 29 | 4.0% |
| $10,000 to $14,999 | 26 | 3.6% |
| $15,000 to $24,999 | 7 | 1.0% |
| $25,000 to $34,999 | 43 | 6.0% |
| $35,000 to $49,999 | 116 | 16.2% |
| $50,000 to $74,999 | 77 | 10.7% |
| $75,000 to $99,999 | 103 | 14.3% |
| $100,000 to $149,999 | 180 | 25.1% |
| $150,000 to $199,999 | 83 | 11.6% |
| $200,000+ | 54 | 7.5% |
Family Income by Famaliy Size in Carthage
4-person families (122 | 17.0%) account for the highest median family income in Carthage with $124,432 per family, while 2-person families (357 | 49.7%) have the highest median income of $39,186 per family member.
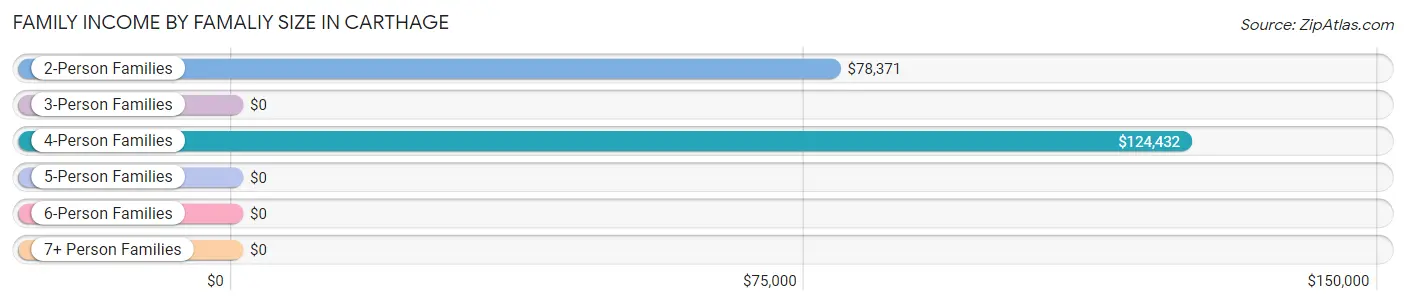
| Income Bracket | # Families | Median Income |
| 2-Person Families | 357 (49.7%) | $78,371 |
| 3-Person Families | 151 (21.0%) | $0 |
| 4-Person Families | 122 (17.0%) | $124,432 |
| 5-Person Families | 49 (6.8%) | $0 |
| 6-Person Families | 29 (4.0%) | $0 |
| 7+ Person Families | 10 (1.4%) | $0 |
| Total | 718 (100.0%) | $85,000 |
Family Income by Number of Earners in Carthage
The median family income in Carthage is $85,000, with families comprising 3+ earners (73) having the highest median family income of $134,107, while families with no earners (76) have the lowest median family income of $37,895, accounting for 10.2% and 10.6% of families, respectively.
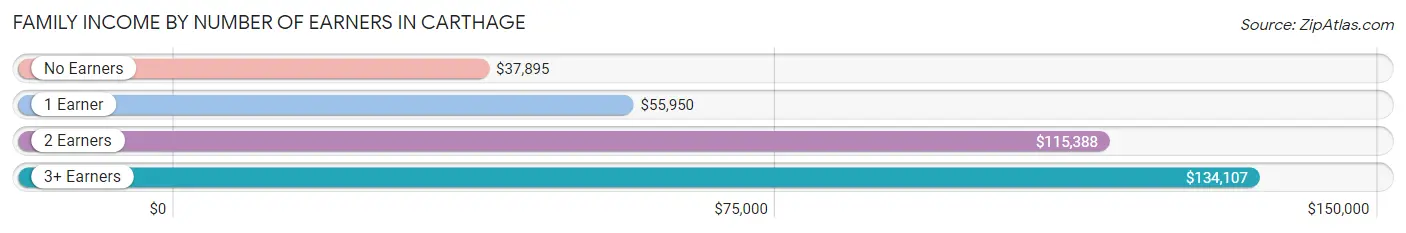
| Number of Earners | # Families | Median Income |
| No Earners | 76 (10.6%) | $37,895 |
| 1 Earner | 215 (29.9%) | $55,950 |
| 2 Earners | 354 (49.3%) | $115,388 |
| 3+ Earners | 73 (10.2%) | $134,107 |
| Total | 718 (100.0%) | $85,000 |
Household Income in Carthage
Household Income Brackets in Carthage
With 187 households falling in the category, the $50,000 to $74,999 income range is the most frequent in Carthage, accounting for 16.6% of all households. In contrast, only 53 households (4.7%) fall into the $10,000 to $14,999 income bracket, making it the least populous group.
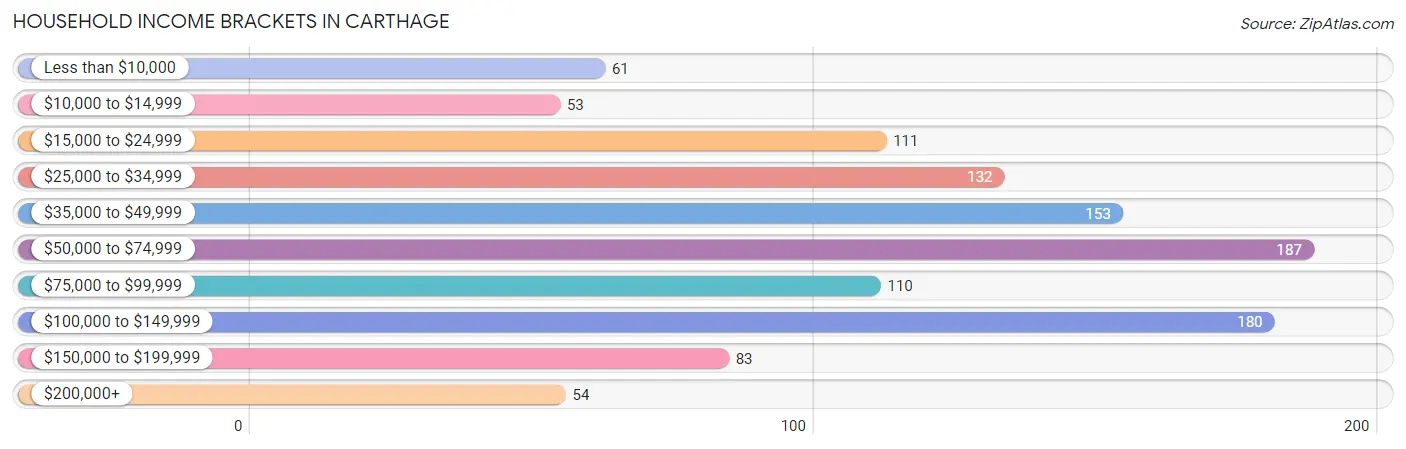
| Income Bracket | # Households | % Households |
| Less than $10,000 | 61 | 5.4% |
| $10,000 to $14,999 | 53 | 4.7% |
| $15,000 to $24,999 | 111 | 9.9% |
| $25,000 to $34,999 | 132 | 11.7% |
| $35,000 to $49,999 | 153 | 13.6% |
| $50,000 to $74,999 | 187 | 16.6% |
| $75,000 to $99,999 | 110 | 9.8% |
| $100,000 to $149,999 | 180 | 16.0% |
| $150,000 to $199,999 | 83 | 7.4% |
| $200,000+ | 54 | 4.8% |
Household Income by Householder Age in Carthage
The median household income in Carthage is $55,469, with the highest median household income of $78,750 found in the 25 to 44 years age bracket for the primary householder. A total of 289 households (25.7%) fall into this category. Meanwhile, the 15 to 24 years age bracket for the primary householder has the lowest median household income of $36,250, with 32 households (2.9%) in this group.
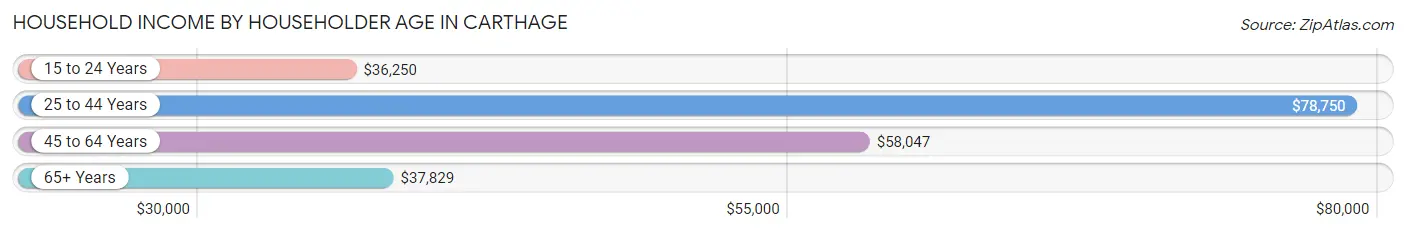
| Income Bracket | # Households | Median Income |
| 15 to 24 Years | 32 (2.9%) | $36,250 |
| 25 to 44 Years | 289 (25.7%) | $78,750 |
| 45 to 64 Years | 454 (40.4%) | $58,047 |
| 65+ Years | 349 (31.0%) | $37,829 |
| Total | 1,124 (100.0%) | $55,469 |
Poverty in Carthage
Income Below Poverty by Sex and Age in Carthage
With 10.6% poverty level for males and 11.8% for females among the residents of Carthage, 45 to 54 year old males and 6 to 11 year old females are the most vulnerable to poverty, with 57 males (29.5%) and 58 females (36.9%) in their respective age groups living below the poverty level.
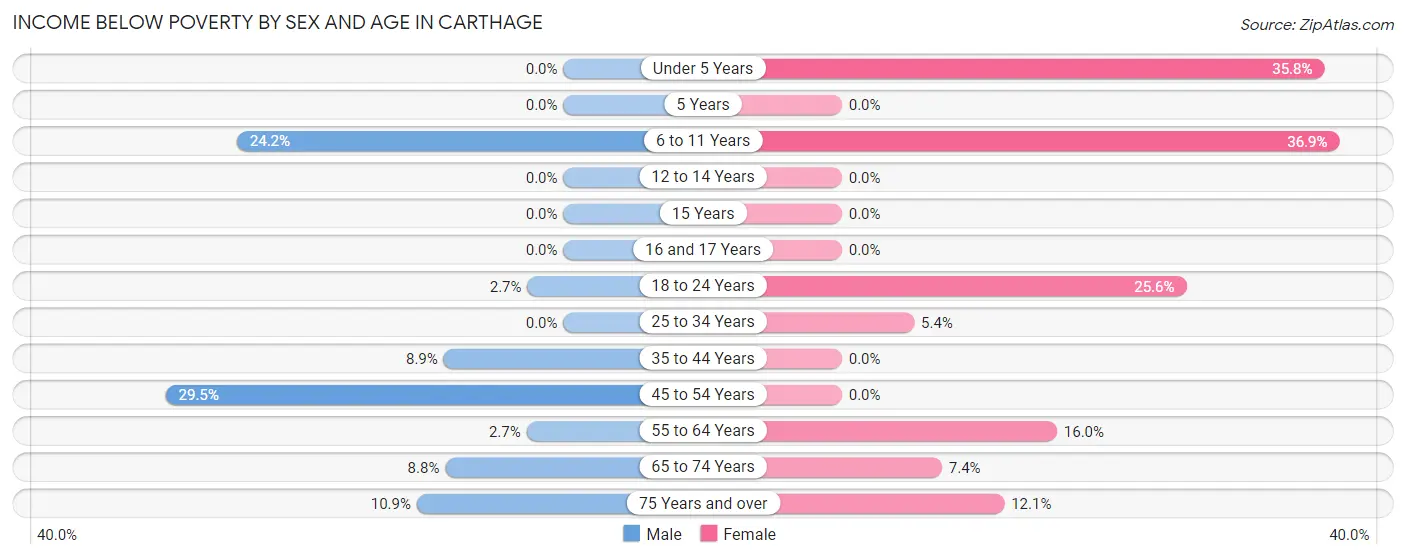
| Age Bracket | Male | Female |
| Under 5 Years | 0 (0.0%) | 24 (35.8%) |
| 5 Years | 0 (0.0%) | 0 (0.0%) |
| 6 to 11 Years | 32 (24.2%) | 58 (36.9%) |
| 12 to 14 Years | 0 (0.0%) | 0 (0.0%) |
| 15 Years | 0 (0.0%) | 0 (0.0%) |
| 16 and 17 Years | 0 (0.0%) | 0 (0.0%) |
| 18 to 24 Years | 2 (2.7%) | 22 (25.6%) |
| 25 to 34 Years | 0 (0.0%) | 8 (5.4%) |
| 35 to 44 Years | 16 (8.9%) | 0 (0.0%) |
| 45 to 54 Years | 57 (29.5%) | 0 (0.0%) |
| 55 to 64 Years | 5 (2.7%) | 23 (16.0%) |
| 65 to 74 Years | 5 (8.8%) | 11 (7.4%) |
| 75 Years and over | 16 (10.9%) | 17 (12.1%) |
| Total | 133 (10.6%) | 163 (11.8%) |
Income Above Poverty by Sex and Age in Carthage
According to the poverty statistics in Carthage, males aged under 5 years and females aged 12 to 14 years are the age groups that are most secure financially, with 100.0% of males and 100.0% of females in these age groups living above the poverty line.
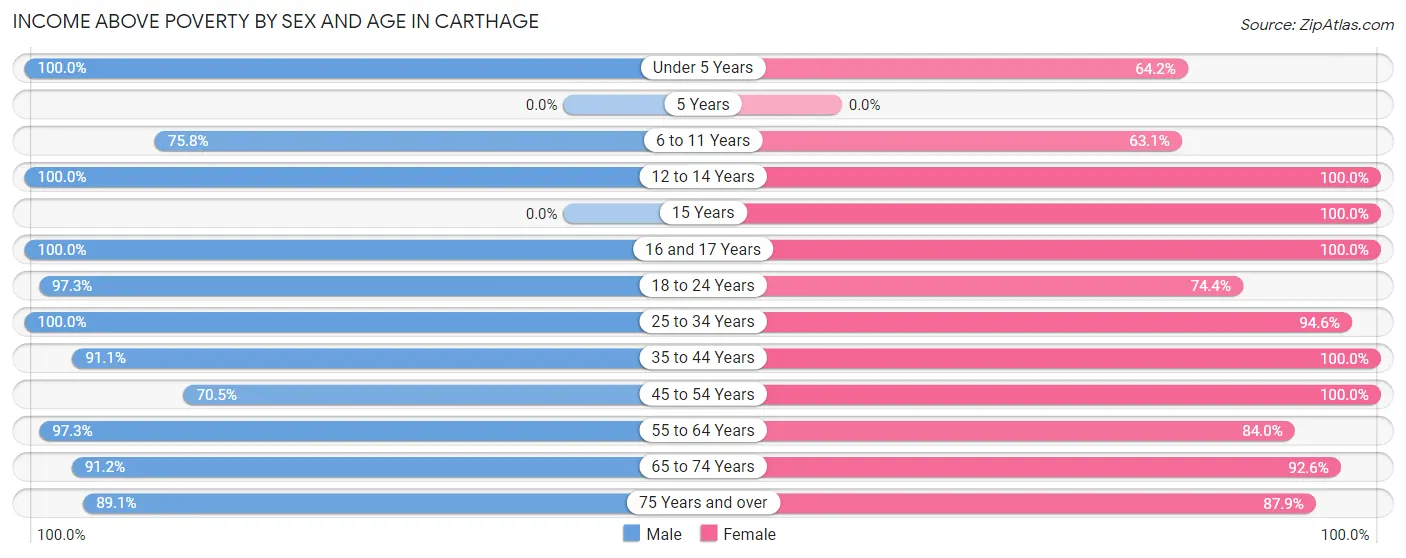
| Age Bracket | Male | Female |
| Under 5 Years | 74 (100.0%) | 43 (64.2%) |
| 5 Years | 0 (0.0%) | 0 (0.0%) |
| 6 to 11 Years | 100 (75.8%) | 99 (63.1%) |
| 12 to 14 Years | 38 (100.0%) | 58 (100.0%) |
| 15 Years | 0 (0.0%) | 27 (100.0%) |
| 16 and 17 Years | 41 (100.0%) | 39 (100.0%) |
| 18 to 24 Years | 73 (97.3%) | 64 (74.4%) |
| 25 to 34 Years | 135 (100.0%) | 141 (94.6%) |
| 35 to 44 Years | 164 (91.1%) | 152 (100.0%) |
| 45 to 54 Years | 136 (70.5%) | 214 (100.0%) |
| 55 to 64 Years | 178 (97.3%) | 121 (84.0%) |
| 65 to 74 Years | 52 (91.2%) | 137 (92.6%) |
| 75 Years and over | 131 (89.1%) | 124 (87.9%) |
| Total | 1,122 (89.4%) | 1,219 (88.2%) |
Income Below Poverty Among Married-Couple Families in Carthage
The poverty statistics for married-couple families in Carthage show that 5.2% or 29 of the total 554 families live below the poverty line. Families with 3 or 4 children have the highest poverty rate of 35.8%, comprising of 29 families. On the other hand, families with no children have the lowest poverty rate of 0.0%, which includes 0 families.
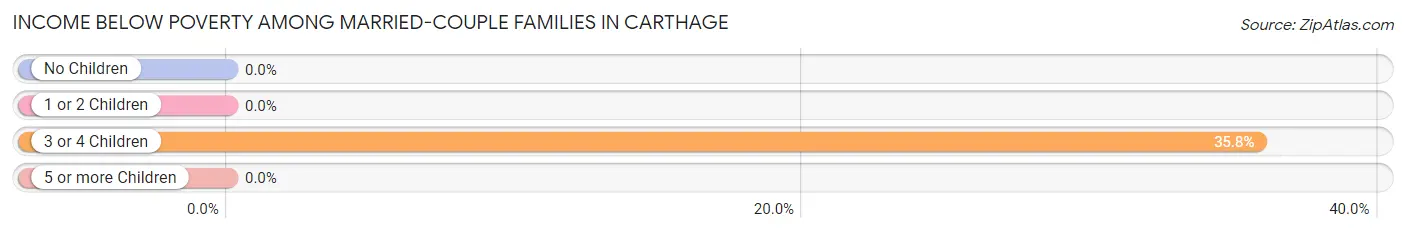
| Children | Above Poverty | Below Poverty |
| No Children | 290 (100.0%) | 0 (0.0%) |
| 1 or 2 Children | 183 (100.0%) | 0 (0.0%) |
| 3 or 4 Children | 52 (64.2%) | 29 (35.8%) |
| 5 or more Children | 0 (0.0%) | 0 (0.0%) |
| Total | 525 (94.8%) | 29 (5.2%) |
Income Below Poverty Among Single-Parent Households in Carthage
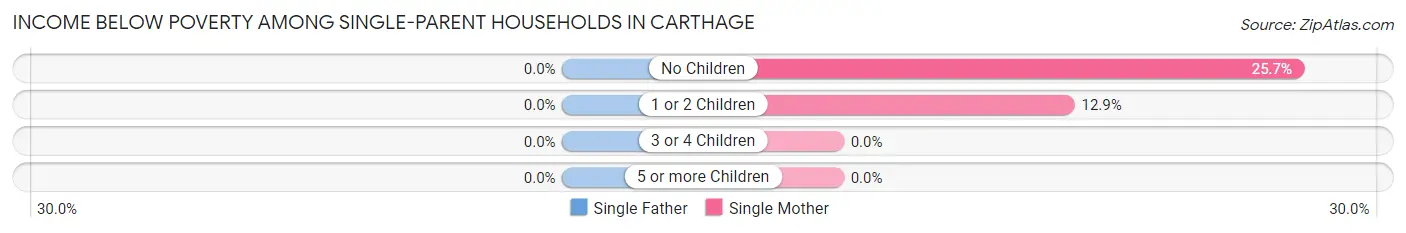
| Children | Single Father | Single Mother |
| No Children | 0 (0.0%) | 18 (25.7%) |
| 1 or 2 Children | 0 (0.0%) | 8 (12.9%) |
| 3 or 4 Children | 0 (0.0%) | 0 (0.0%) |
| 5 or more Children | 0 (0.0%) | 0 (0.0%) |
| Total | 0 (0.0%) | 26 (19.7%) |
Income Below Poverty Among Married-Couple vs Single-Parent Households in Carthage
The poverty data for Carthage shows that 29 of the married-couple family households (5.2%) and 26 of the single-parent households (15.9%) are living below the poverty level. Within the married-couple family households, those with 3 or 4 children have the highest poverty rate, with 29 households (35.8%) falling below the poverty line. Among the single-parent households, those with no children have the highest poverty rate, with 18 household (20.9%) living below poverty.
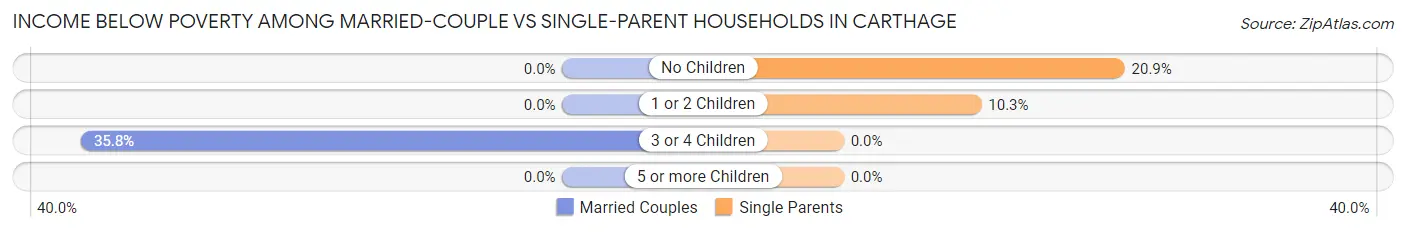
| Children | Married-Couple Families | Single-Parent Households |
| No Children | 0 (0.0%) | 18 (20.9%) |
| 1 or 2 Children | 0 (0.0%) | 8 (10.3%) |
| 3 or 4 Children | 29 (35.8%) | 0 (0.0%) |
| 5 or more Children | 0 (0.0%) | 0 (0.0%) |
| Total | 29 (5.2%) | 26 (15.9%) |
Race in Carthage
The most populous races in Carthage are White / Caucasian (2,155 | 77.5%), Black / African American (430 | 15.5%), and Two or more Races (185 | 6.7%).
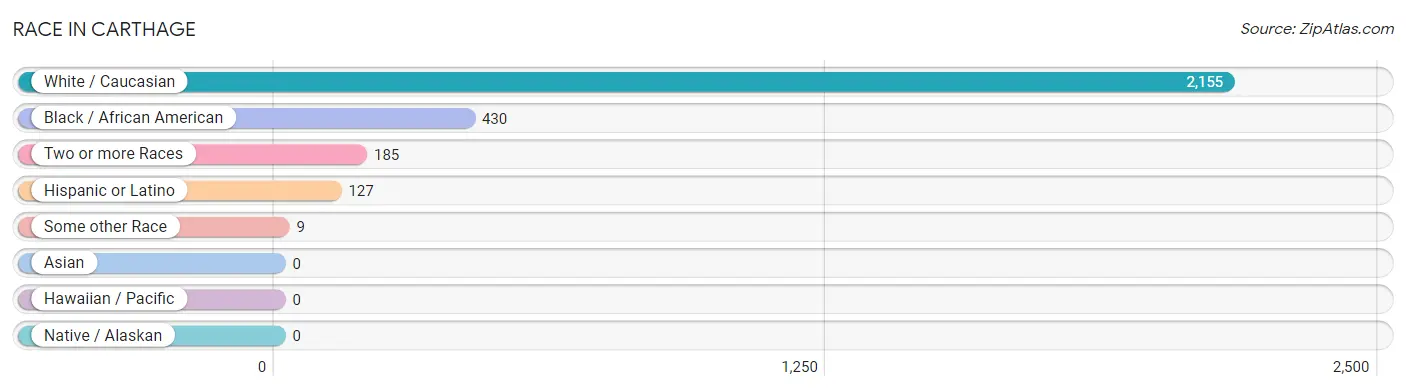
| Race | # Population | % Population |
| Asian | 0 | 0.0% |
| Black / African American | 430 | 15.5% |
| Hawaiian / Pacific | 0 | 0.0% |
| Hispanic or Latino | 127 | 4.6% |
| Native / Alaskan | 0 | 0.0% |
| White / Caucasian | 2,155 | 77.5% |
| Two or more Races | 185 | 6.7% |
| Some other Race | 9 | 0.3% |
| Total | 2,779 | 100.0% |
Ancestry in Carthage
The most populous ancestries reported in Carthage are English (421 | 15.1%), Irish (377 | 13.6%), German (259 | 9.3%), American (211 | 7.6%), and Scottish (142 | 5.1%), together accounting for 50.7% of all Carthage residents.
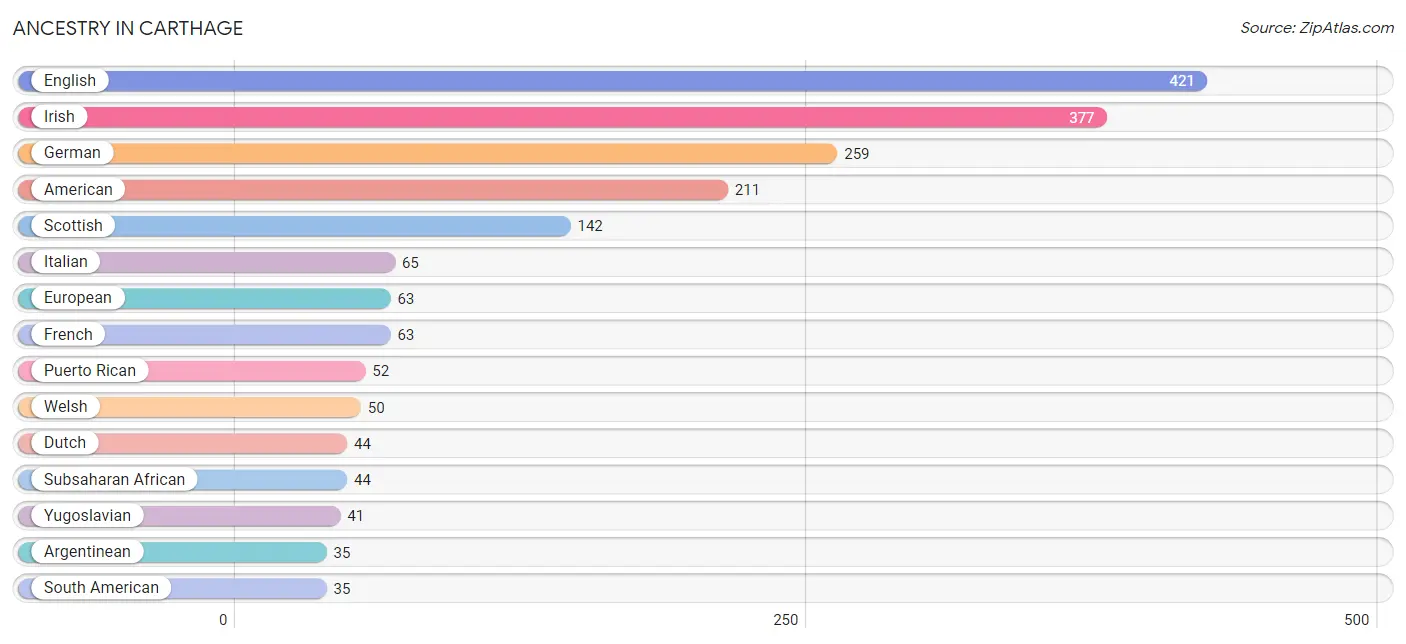
| Ancestry | # Population | % Population |
| African | 24 | 0.9% |
| American | 211 | 7.6% |
| Argentinean | 35 | 1.3% |
| British | 5 | 0.2% |
| Burmese | 7 | 0.3% |
| Cherokee | 2 | 0.1% |
| Cuban | 16 | 0.6% |
| Dutch | 44 | 1.6% |
| English | 421 | 15.1% |
| European | 63 | 2.3% |
| French | 63 | 2.3% |
| French Canadian | 31 | 1.1% |
| German | 259 | 9.3% |
| Greek | 8 | 0.3% |
| Indian (Asian) | 16 | 0.6% |
| Irish | 377 | 13.6% |
| Italian | 65 | 2.3% |
| Lumbee | 9 | 0.3% |
| Mexican | 24 | 0.9% |
| Nigerian | 20 | 0.7% |
| Norwegian | 20 | 0.7% |
| Polish | 4 | 0.1% |
| Portuguese | 19 | 0.7% |
| Puerto Rican | 52 | 1.9% |
| Russian | 5 | 0.2% |
| Scandinavian | 5 | 0.2% |
| Scotch-Irish | 34 | 1.2% |
| Scottish | 142 | 5.1% |
| Slovak | 16 | 0.6% |
| South American | 35 | 1.3% |
| Subsaharan African | 44 | 1.6% |
| Swedish | 28 | 1.0% |
| Welsh | 50 | 1.8% |
| Yugoslavian | 41 | 1.5% | View All 34 Rows |
Immigrants in Carthage
The most numerous immigrant groups reported in Carthage came from Central America (24 | 0.9%), Latin America (24 | 0.9%), Mexico (24 | 0.9%), Asia (16 | 0.6%), and Eastern Asia (16 | 0.6%), together accounting for 3.7% of all Carthage residents.
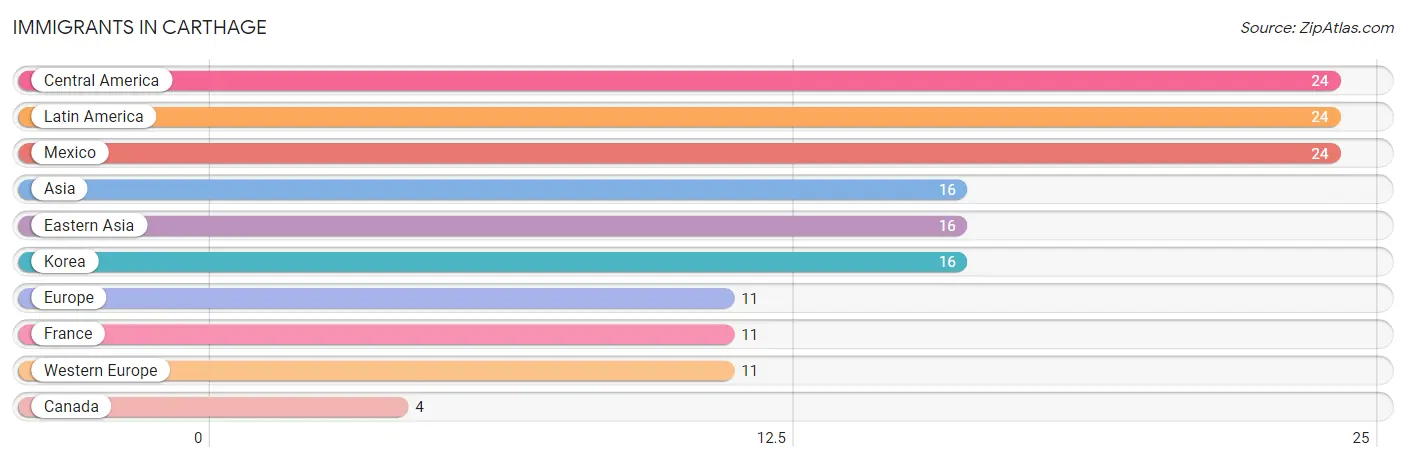
| Immigration Origin | # Population | % Population |
| Asia | 16 | 0.6% |
| Canada | 4 | 0.1% |
| Central America | 24 | 0.9% |
| Eastern Asia | 16 | 0.6% |
| Europe | 11 | 0.4% |
| France | 11 | 0.4% |
| Korea | 16 | 0.6% |
| Latin America | 24 | 0.9% |
| Mexico | 24 | 0.9% |
| Western Europe | 11 | 0.4% | View All 10 Rows |
Sex and Age in Carthage
Sex and Age in Carthage
The most populous age groups in Carthage are 50 to 54 Years (128 | 9.8%) for men and 10 to 14 Years (138 | 9.3%) for women.
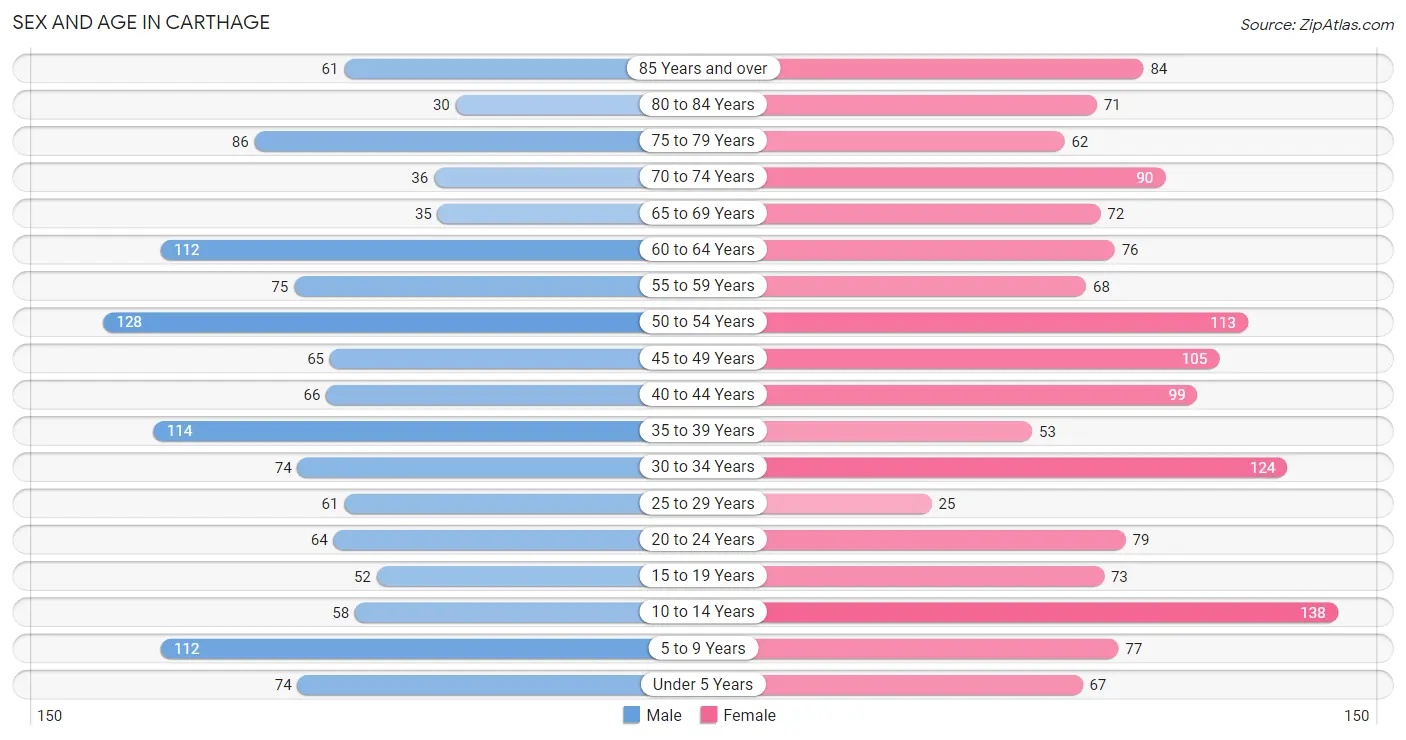
| Age Bracket | Male | Female |
| Under 5 Years | 74 (5.7%) | 67 (4.5%) |
| 5 to 9 Years | 112 (8.6%) | 77 (5.2%) |
| 10 to 14 Years | 58 (4.4%) | 138 (9.3%) |
| 15 to 19 Years | 52 (4.0%) | 73 (5.0%) |
| 20 to 24 Years | 64 (4.9%) | 79 (5.3%) |
| 25 to 29 Years | 61 (4.7%) | 25 (1.7%) |
| 30 to 34 Years | 74 (5.7%) | 124 (8.4%) |
| 35 to 39 Years | 114 (8.7%) | 53 (3.6%) |
| 40 to 44 Years | 66 (5.1%) | 99 (6.7%) |
| 45 to 49 Years | 65 (5.0%) | 105 (7.1%) |
| 50 to 54 Years | 128 (9.8%) | 113 (7.7%) |
| 55 to 59 Years | 75 (5.8%) | 68 (4.6%) |
| 60 to 64 Years | 112 (8.6%) | 76 (5.1%) |
| 65 to 69 Years | 35 (2.7%) | 72 (4.9%) |
| 70 to 74 Years | 36 (2.8%) | 90 (6.1%) |
| 75 to 79 Years | 86 (6.6%) | 62 (4.2%) |
| 80 to 84 Years | 30 (2.3%) | 71 (4.8%) |
| 85 Years and over | 61 (4.7%) | 84 (5.7%) |
| Total | 1,303 (100.0%) | 1,476 (100.0%) |
Families and Households in Carthage
Median Family Size in Carthage
The median family size in Carthage is 3.06 persons per family, with married-couple families (554 | 77.2%) accounting for the largest median family size of 3.22 persons per family. On the other hand, single male/father families (32 | 4.5%) represent the smallest median family size with 2.44 persons per family.
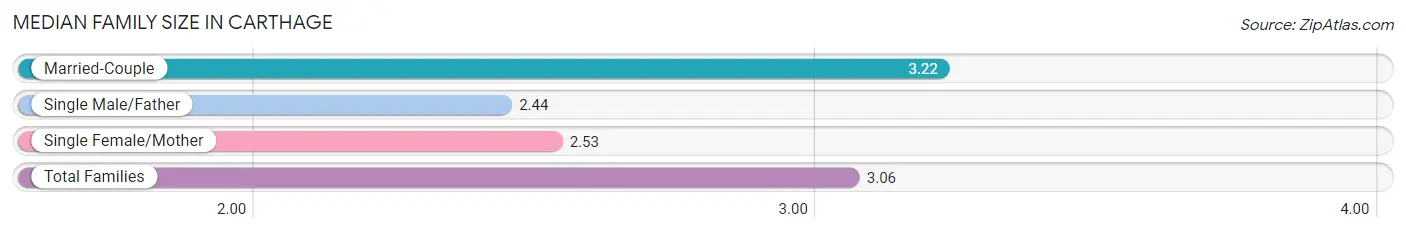
| Family Type | # Families | Family Size |
| Married-Couple | 554 (77.2%) | 3.22 |
| Single Male/Father | 32 (4.5%) | 2.44 |
| Single Female/Mother | 132 (18.4%) | 2.53 |
| Total Families | 718 (100.0%) | 3.06 |
Median Household Size in Carthage
The median household size in Carthage is 2.35 persons per household, with married-couple households (554 | 49.3%) accounting for the largest median household size of 3.22 persons per household. non-family households (406 | 36.1%) represent the smallest median household size with 1.06 persons per household.
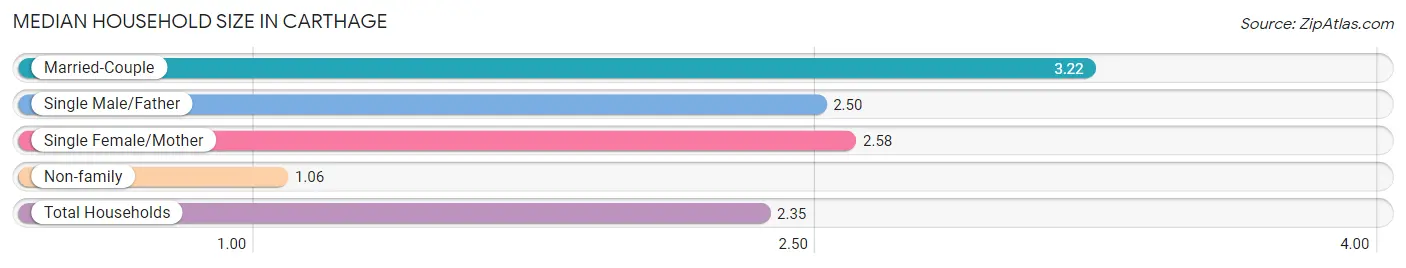
| Household Type | # Households | Household Size |
| Married-Couple | 554 (49.3%) | 3.22 |
| Single Male/Father | 32 (2.9%) | 2.50 |
| Single Female/Mother | 132 (11.7%) | 2.58 |
| Non-family | 406 (36.1%) | 1.06 |
| Total Households | 1,124 (100.0%) | 2.35 |
Household Size by Marriage Status in Carthage
Out of a total of 1,124 households in Carthage, 718 (63.9%) are family households, while 406 (36.1%) are nonfamily households. The most numerous type of family households are 2-person households, comprising 355, and the most common type of nonfamily households are 1-person households, comprising 379.
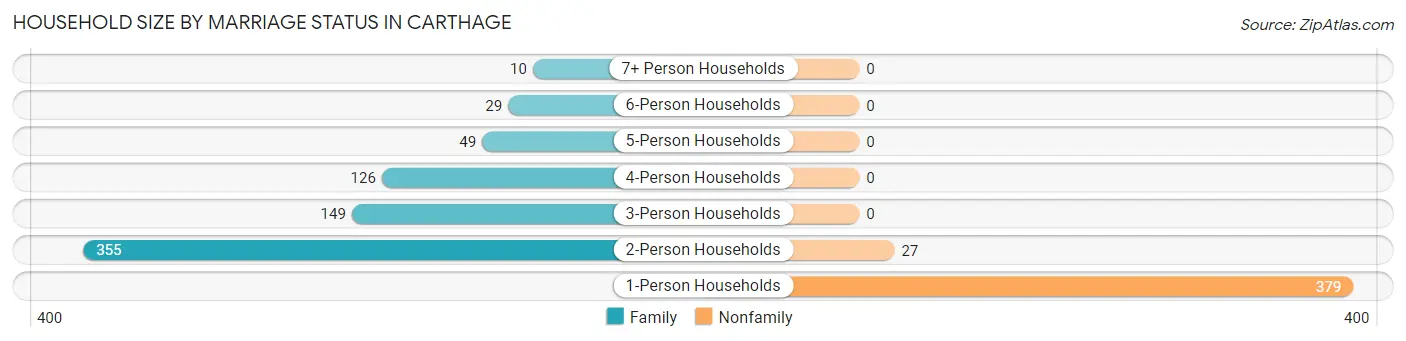
| Household Size | Family Households | Nonfamily Households |
| 1-Person Households | - | 379 (33.7%) |
| 2-Person Households | 355 (31.6%) | 27 (2.4%) |
| 3-Person Households | 149 (13.3%) | 0 (0.0%) |
| 4-Person Households | 126 (11.2%) | 0 (0.0%) |
| 5-Person Households | 49 (4.4%) | 0 (0.0%) |
| 6-Person Households | 29 (2.6%) | 0 (0.0%) |
| 7+ Person Households | 10 (0.9%) | 0 (0.0%) |
| Total | 718 (63.9%) | 406 (36.1%) |
Female Fertility in Carthage
Fertility by Age in Carthage
| Age Bracket | Women with Births | Births / 1,000 Women |
| 15 to 19 years | 0 (0.0%) | 0.0 |
| 20 to 34 years | 0 (0.0%) | 0.0 |
| 35 to 50 years | 0 (0.0%) | 0.0 |
| Total | 0 (0.0%) | 0.0 |
Fertility by Age by Marriage Status in Carthage
| Age Bracket | Married | Unmarried |
| 15 to 19 years | 0 (0.0%) | 0 (0.0%) |
| 20 to 34 years | 0 (0.0%) | 0 (0.0%) |
| 35 to 50 years | 0 (0.0%) | 0 (0.0%) |
| Total | 0 (0.0%) | 0 (0.0%) |
Fertility by Education in Carthage
| Educational Attainment | Women with Births | Births / 1,000 Women |
| Less than High School | 0 (0.0%) | 0.0 |
| High School Diploma | 0 (0.0%) | 0.0 |
| College or Associate's Degree | 0 (0.0%) | 0.0 |
| Bachelor's Degree | 0 (0.0%) | 0.0 |
| Graduate Degree | 0 (0.0%) | 0.0 |
| Total | 0 (0.0%) | 0.0 |
Fertility by Education by Marriage Status in Carthage
| Educational Attainment | Married | Unmarried |
| Less than High School | 0 (0.0%) | 0 (0.0%) |
| High School Diploma | 0 (0.0%) | 0 (0.0%) |
| College or Associate's Degree | 0 (0.0%) | 0 (0.0%) |
| Bachelor's Degree | 0 (0.0%) | 0 (0.0%) |
| Graduate Degree | 0 (0.0%) | 0 (0.0%) |
| Total | 0 (0.0%) | 0 (0.0%) |
Employment Characteristics in Carthage
Employment by Class of Employer in Carthage
Among the 1,237 employed individuals in Carthage, private company employees (729 | 58.9%), local government employees (176 | 14.2%), and federal government employees (83 | 6.7%) make up the most common classes of employment.
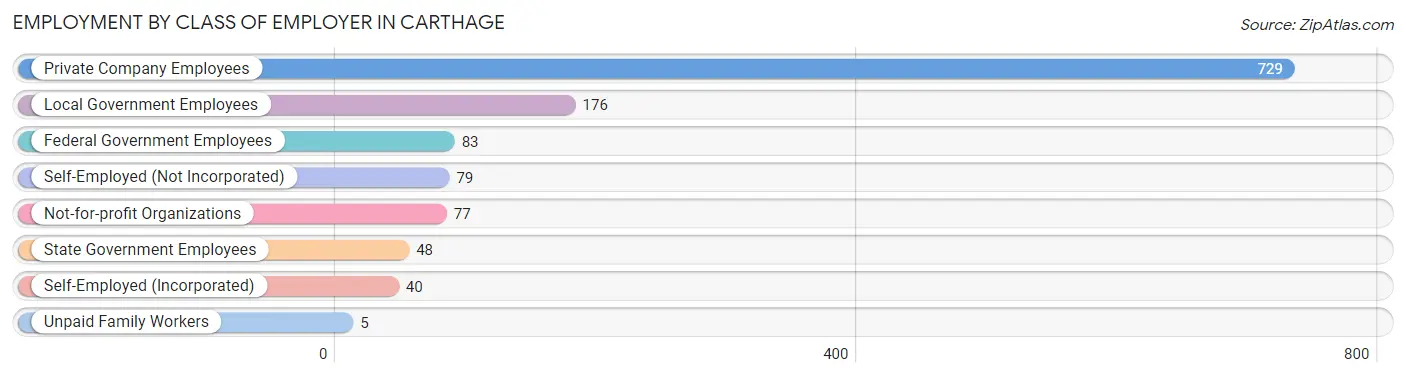
| Employer Class | # Employees | % Employees |
| Private Company Employees | 729 | 58.9% |
| Self-Employed (Incorporated) | 40 | 3.2% |
| Self-Employed (Not Incorporated) | 79 | 6.4% |
| Not-for-profit Organizations | 77 | 6.2% |
| Local Government Employees | 176 | 14.2% |
| State Government Employees | 48 | 3.9% |
| Federal Government Employees | 83 | 6.7% |
| Unpaid Family Workers | 5 | 0.4% |
| Total | 1,237 | 100.0% |
Employment Status by Age in Carthage
According to the labor force statistics for Carthage, out of the total population over 16 years of age (2,226), 61.5% or 1,369 individuals are in the labor force, with 2.0% or 27 of them unemployed. The age group with the highest labor force participation rate is 30 to 34 years, with 98.0% or 194 individuals in the labor force. Within the labor force, the 16 to 19 years age range has the highest percentage of unemployed individuals, with 21.7% or 15 of them being unemployed.
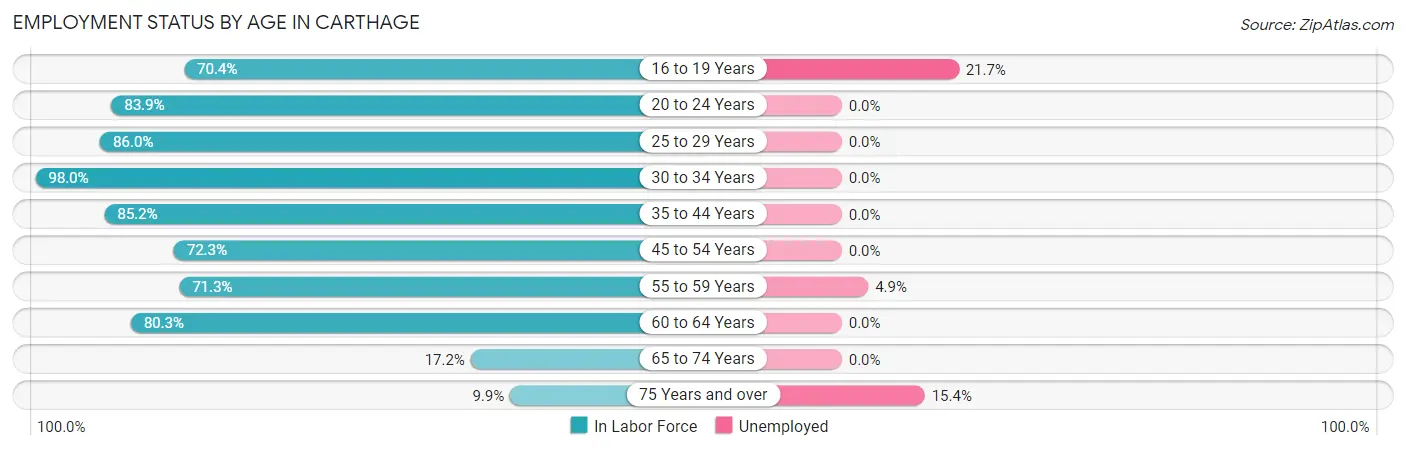
| Age Bracket | In Labor Force | Unemployed |
| 16 to 19 Years | 69 (70.4%) | 15 (21.7%) |
| 20 to 24 Years | 120 (83.9%) | 0 (0.0%) |
| 25 to 29 Years | 74 (86.0%) | 0 (0.0%) |
| 30 to 34 Years | 194 (98.0%) | 0 (0.0%) |
| 35 to 44 Years | 283 (85.2%) | 0 (0.0%) |
| 45 to 54 Years | 297 (72.3%) | 0 (0.0%) |
| 55 to 59 Years | 102 (71.3%) | 5 (4.9%) |
| 60 to 64 Years | 151 (80.3%) | 0 (0.0%) |
| 65 to 74 Years | 40 (17.2%) | 0 (0.0%) |
| 75 Years and over | 39 (9.9%) | 6 (15.4%) |
| Total | 1,369 (61.5%) | 27 (2.0%) |
Employment Status by Educational Attainment in Carthage
According to labor force statistics for Carthage, 81.1% of individuals (1,101) out of the total population between 25 and 64 years of age (1,358) are in the labor force, with 0.5% or 6 of them being unemployed. The group with the highest labor force participation rate are those with the educational attainment of college / associate degree, with 83.9% or 611 individuals in the labor force. Within the labor force, individuals with college / associate degree education have the highest percentage of unemployment, with 0.8% or 5 of them being unemployed.
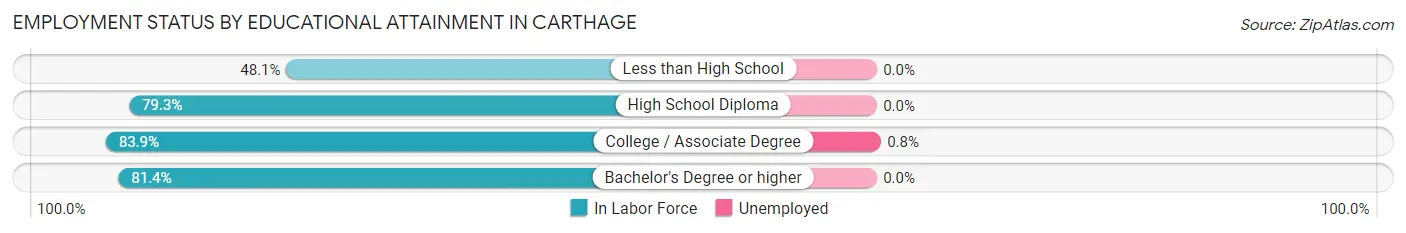
| Educational Attainment | In Labor Force | Unemployed |
| Less than High School | 25 (48.1%) | 0 (0.0%) |
| High School Diploma | 215 (79.3%) | 0 (0.0%) |
| College / Associate Degree | 611 (83.9%) | 6 (0.8%) |
| Bachelor's Degree or higher | 250 (81.4%) | 0 (0.0%) |
| Total | 1,101 (81.1%) | 7 (0.5%) |
Employment Occupations by Sex in Carthage
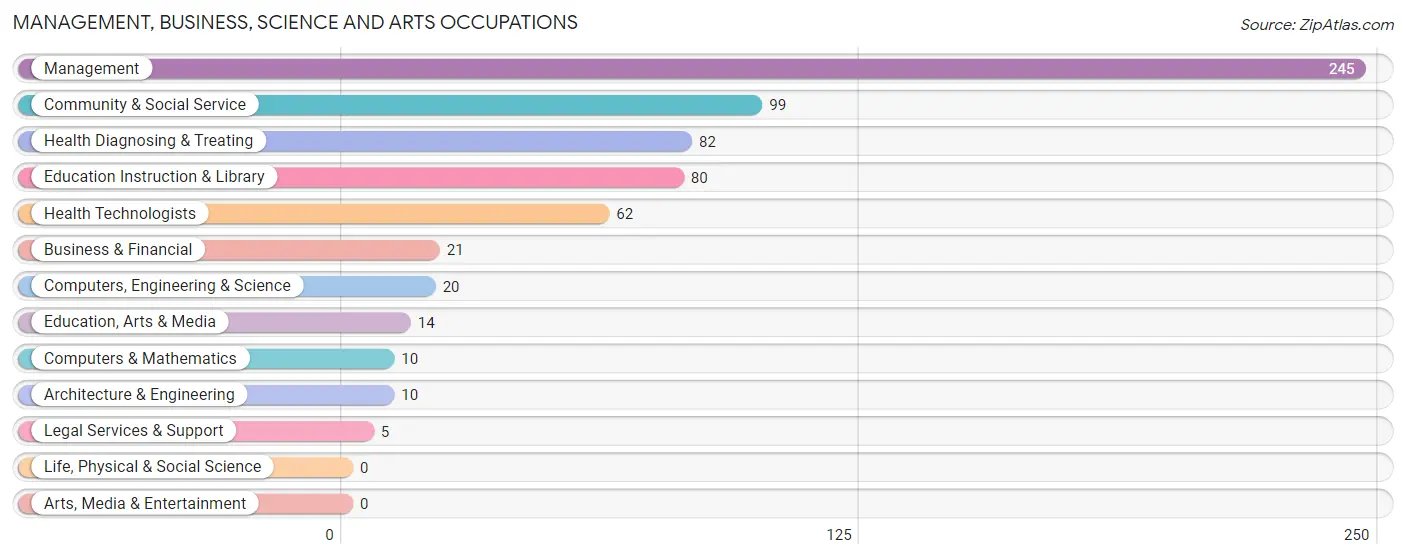
Management, Business, Science and Arts Occupations
The most common Management, Business, Science and Arts occupations in Carthage are Management (245 | 19.2%), Community & Social Service (99 | 7.7%), Health Diagnosing & Treating (82 | 6.4%), Education Instruction & Library (80 | 6.3%), and Health Technologists (62 | 4.9%).
Management, Business, Science and Arts Occupations by Sex
Within the Management, Business, Science and Arts occupations in Carthage, the most male-oriented occupations are Architecture & Engineering (100.0%), Education, Arts & Media (57.1%), and Computers, Engineering & Science (50.0%), while the most female-oriented occupations are Computers & Mathematics (100.0%), Legal Services & Support (100.0%), and Health Technologists (88.7%).
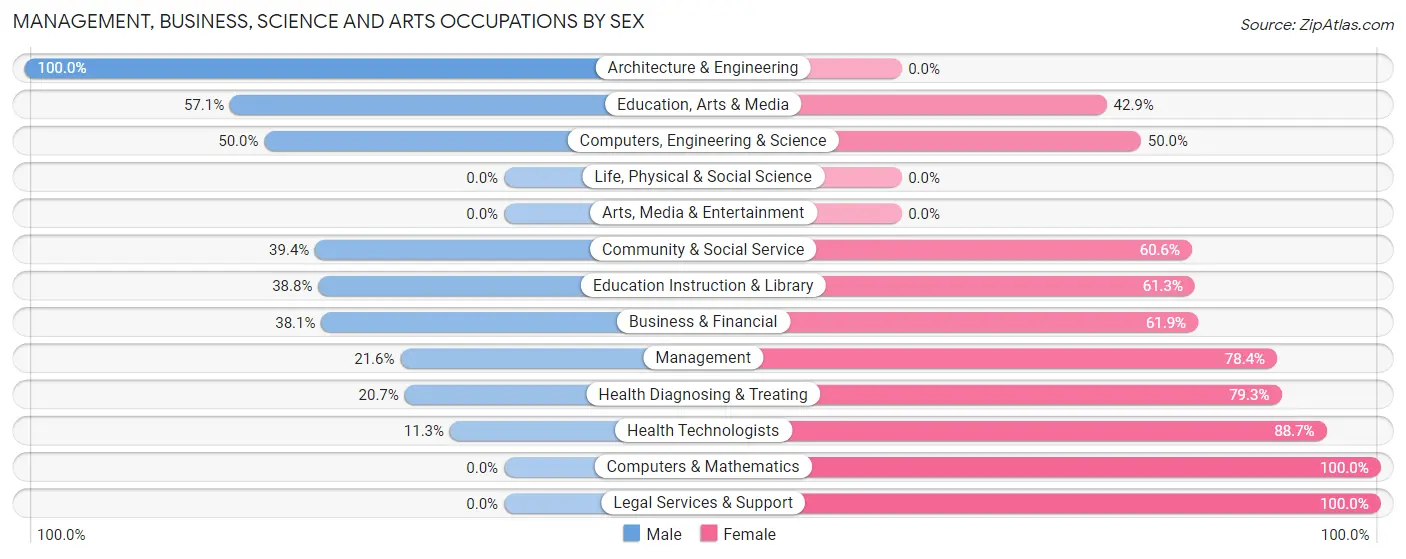
| Occupation | Male | Female |
| Management | 53 (21.6%) | 192 (78.4%) |
| Business & Financial | 8 (38.1%) | 13 (61.9%) |
| Computers, Engineering & Science | 10 (50.0%) | 10 (50.0%) |
| Computers & Mathematics | 0 (0.0%) | 10 (100.0%) |
| Architecture & Engineering | 10 (100.0%) | 0 (0.0%) |
| Life, Physical & Social Science | 0 (0.0%) | 0 (0.0%) |
| Community & Social Service | 39 (39.4%) | 60 (60.6%) |
| Education, Arts & Media | 8 (57.1%) | 6 (42.9%) |
| Legal Services & Support | 0 (0.0%) | 5 (100.0%) |
| Education Instruction & Library | 31 (38.8%) | 49 (61.3%) |
| Arts, Media & Entertainment | 0 (0.0%) | 0 (0.0%) |
| Health Diagnosing & Treating | 17 (20.7%) | 65 (79.3%) |
| Health Technologists | 7 (11.3%) | 55 (88.7%) |
| Total (Category) | 127 (27.2%) | 340 (72.8%) |
| Total (Overall) | 572 (44.8%) | 705 (55.2%) |
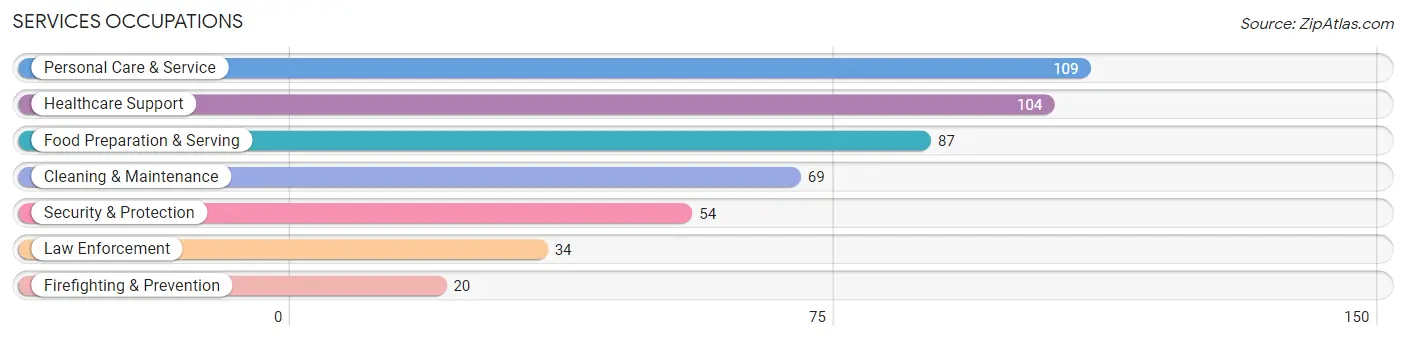
Services Occupations
The most common Services occupations in Carthage are Personal Care & Service (109 | 8.5%), Healthcare Support (104 | 8.1%), Food Preparation & Serving (87 | 6.8%), Cleaning & Maintenance (69 | 5.4%), and Security & Protection (54 | 4.2%).
Services Occupations by Sex
Within the Services occupations in Carthage, the most male-oriented occupations are Firefighting & Prevention (100.0%), Security & Protection (96.3%), and Law Enforcement (94.1%), while the most female-oriented occupations are Healthcare Support (92.3%), Food Preparation & Serving (80.5%), and Personal Care & Service (45.9%).
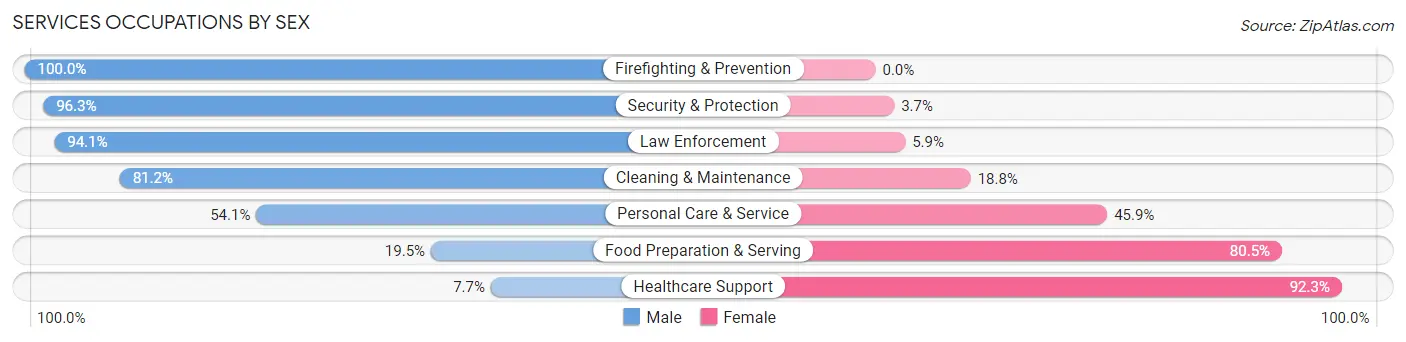
| Occupation | Male | Female |
| Healthcare Support | 8 (7.7%) | 96 (92.3%) |
| Security & Protection | 52 (96.3%) | 2 (3.7%) |
| Firefighting & Prevention | 20 (100.0%) | 0 (0.0%) |
| Law Enforcement | 32 (94.1%) | 2 (5.9%) |
| Food Preparation & Serving | 17 (19.5%) | 70 (80.5%) |
| Cleaning & Maintenance | 56 (81.2%) | 13 (18.8%) |
| Personal Care & Service | 59 (54.1%) | 50 (45.9%) |
| Total (Category) | 192 (45.4%) | 231 (54.6%) |
| Total (Overall) | 572 (44.8%) | 705 (55.2%) |
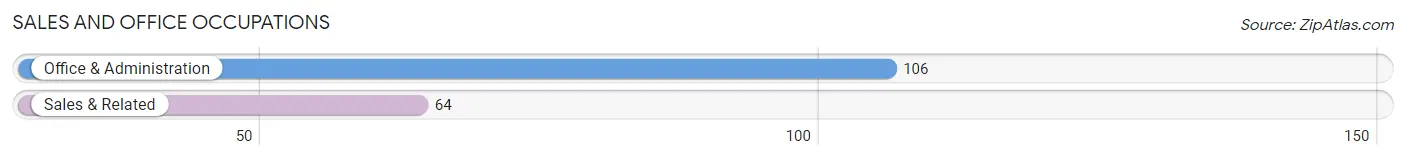
Sales and Office Occupations
The most common Sales and Office occupations in Carthage are Office & Administration (106 | 8.3%), and Sales & Related (64 | 5.0%).
Sales and Office Occupations by Sex
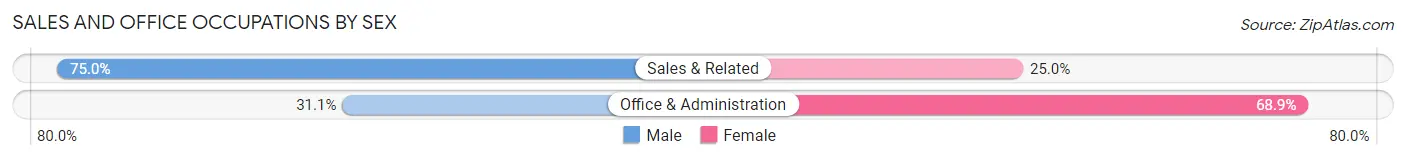
| Occupation | Male | Female |
| Sales & Related | 48 (75.0%) | 16 (25.0%) |
| Office & Administration | 33 (31.1%) | 73 (68.9%) |
| Total (Category) | 81 (47.6%) | 89 (52.3%) |
| Total (Overall) | 572 (44.8%) | 705 (55.2%) |
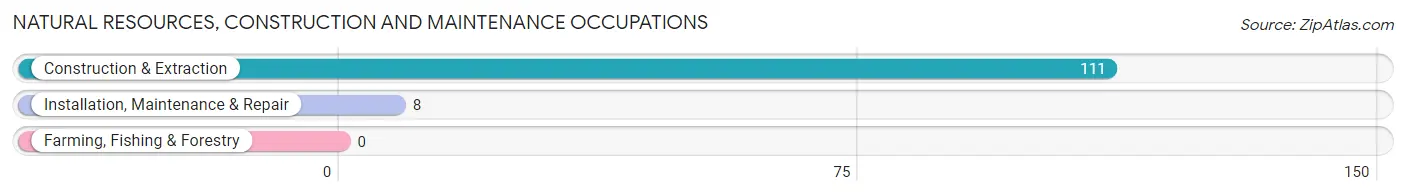
Natural Resources, Construction and Maintenance Occupations
The most common Natural Resources, Construction and Maintenance occupations in Carthage are Construction & Extraction (111 | 8.7%), and Installation, Maintenance & Repair (8 | 0.6%).
Natural Resources, Construction and Maintenance Occupations by Sex
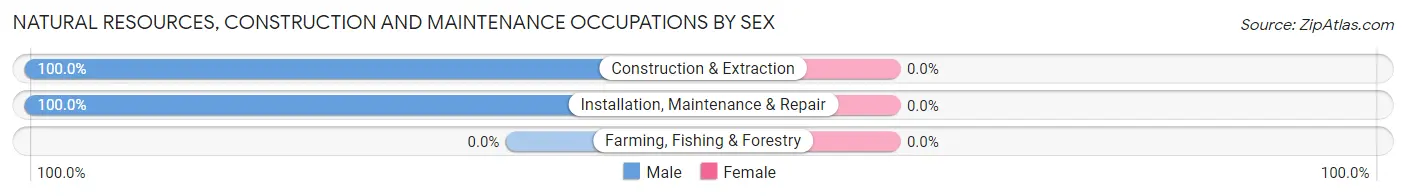
| Occupation | Male | Female |
| Farming, Fishing & Forestry | 0 (0.0%) | 0 (0.0%) |
| Construction & Extraction | 111 (100.0%) | 0 (0.0%) |
| Installation, Maintenance & Repair | 8 (100.0%) | 0 (0.0%) |
| Total (Category) | 119 (100.0%) | 0 (0.0%) |
| Total (Overall) | 572 (44.8%) | 705 (55.2%) |
Production, Transportation and Moving Occupations
The most common Production, Transportation and Moving occupations in Carthage are Production (48 | 3.8%), Material Moving (35 | 2.7%), and Transportation (15 | 1.2%).
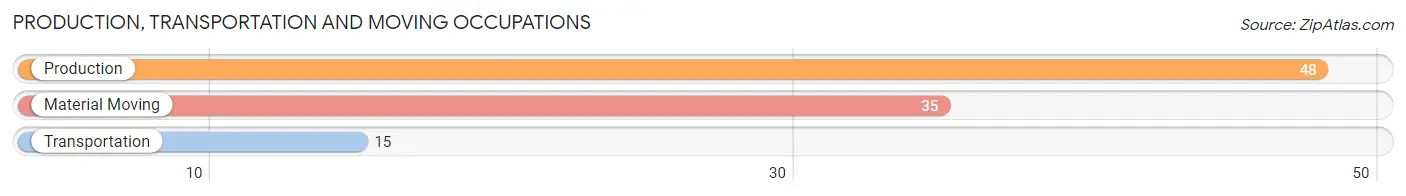
Production, Transportation and Moving Occupations by Sex
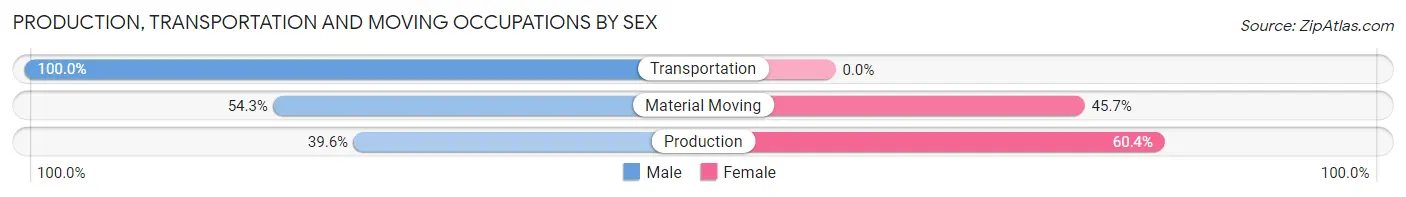
| Occupation | Male | Female |
| Production | 19 (39.6%) | 29 (60.4%) |
| Transportation | 15 (100.0%) | 0 (0.0%) |
| Material Moving | 19 (54.3%) | 16 (45.7%) |
| Total (Category) | 53 (54.1%) | 45 (45.9%) |
| Total (Overall) | 572 (44.8%) | 705 (55.2%) |
Employment Industries by Sex in Carthage
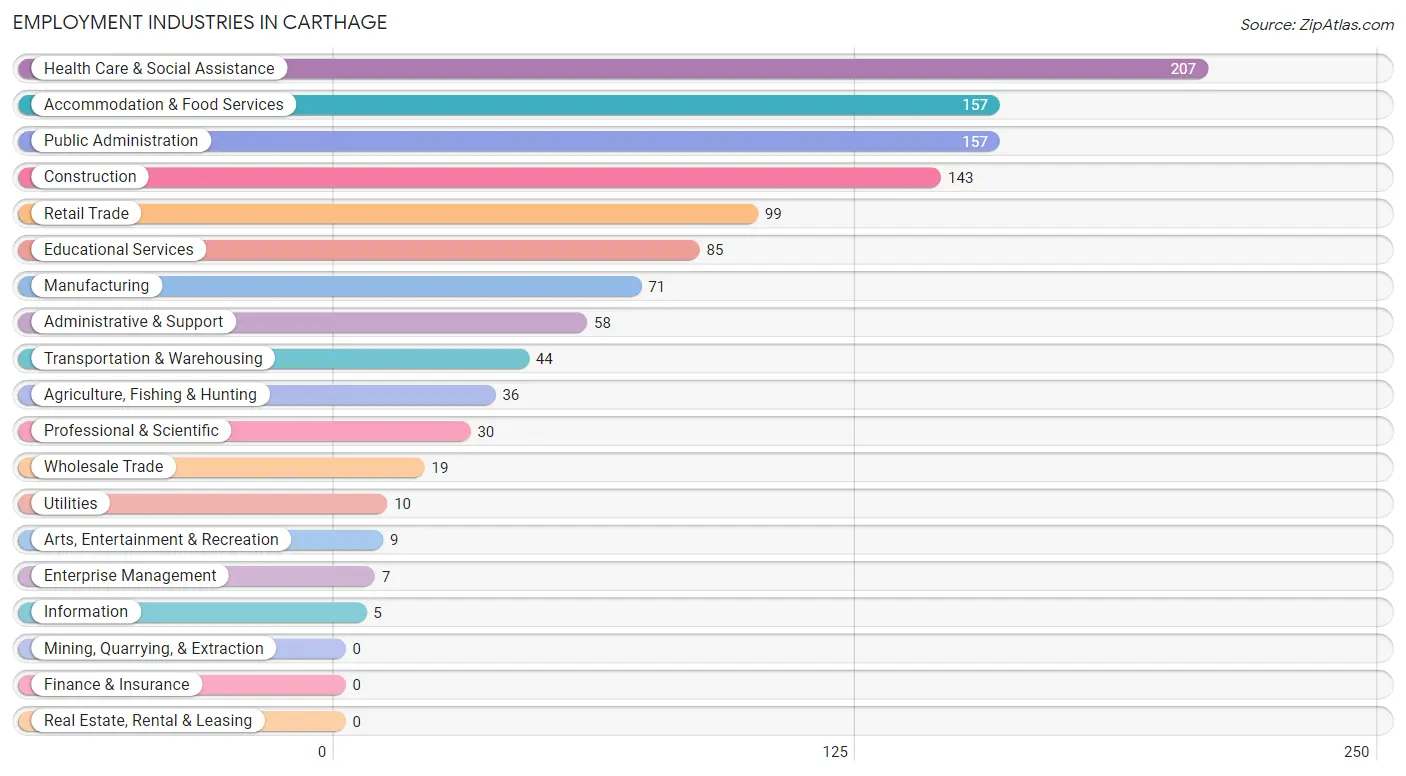
Employment Industries in Carthage
The major employment industries in Carthage include Health Care & Social Assistance (207 | 16.2%), Accommodation & Food Services (157 | 12.3%), Public Administration (157 | 12.3%), Construction (143 | 11.2%), and Retail Trade (99 | 7.7%).
Employment Industries by Sex in Carthage
The Carthage industries that see more men than women are Agriculture, Fishing & Hunting (100.0%), Wholesale Trade (100.0%), and Transportation & Warehousing (100.0%), whereas the industries that tend to have a higher number of women are Information (100.0%), Enterprise Management (100.0%), and Health Care & Social Assistance (95.2%).
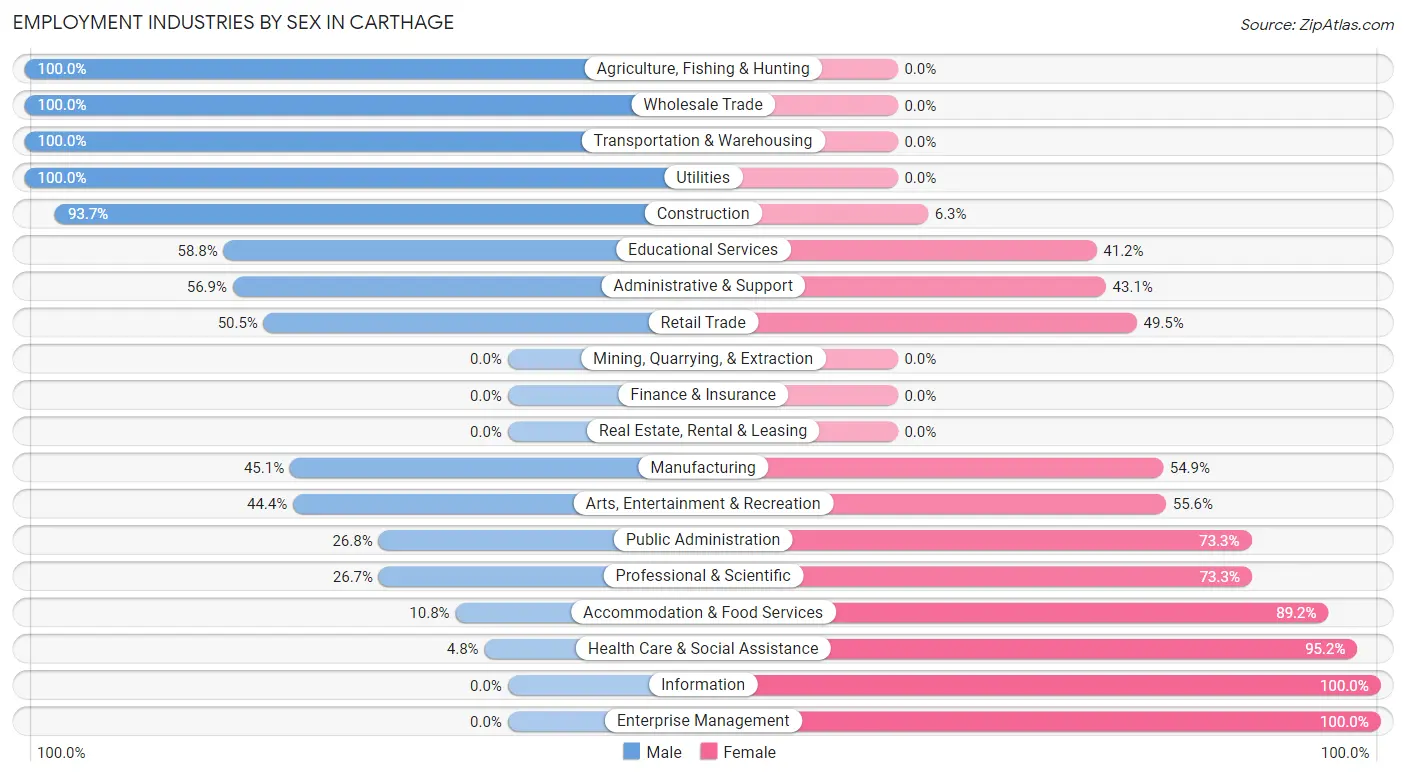
| Industry | Male | Female |
| Agriculture, Fishing & Hunting | 36 (100.0%) | 0 (0.0%) |
| Mining, Quarrying, & Extraction | 0 (0.0%) | 0 (0.0%) |
| Construction | 134 (93.7%) | 9 (6.3%) |
| Manufacturing | 32 (45.1%) | 39 (54.9%) |
| Wholesale Trade | 19 (100.0%) | 0 (0.0%) |
| Retail Trade | 50 (50.5%) | 49 (49.5%) |
| Transportation & Warehousing | 44 (100.0%) | 0 (0.0%) |
| Utilities | 10 (100.0%) | 0 (0.0%) |
| Information | 0 (0.0%) | 5 (100.0%) |
| Finance & Insurance | 0 (0.0%) | 0 (0.0%) |
| Real Estate, Rental & Leasing | 0 (0.0%) | 0 (0.0%) |
| Professional & Scientific | 8 (26.7%) | 22 (73.3%) |
| Enterprise Management | 0 (0.0%) | 7 (100.0%) |
| Administrative & Support | 33 (56.9%) | 25 (43.1%) |
| Educational Services | 50 (58.8%) | 35 (41.2%) |
| Health Care & Social Assistance | 10 (4.8%) | 197 (95.2%) |
| Arts, Entertainment & Recreation | 4 (44.4%) | 5 (55.6%) |
| Accommodation & Food Services | 17 (10.8%) | 140 (89.2%) |
| Public Administration | 42 (26.8%) | 115 (73.3%) |
| Total | 572 (44.8%) | 705 (55.2%) |
Education in Carthage
School Enrollment in Carthage
The most common levels of schooling among the 686 students in Carthage are elementary school (179 | 26.1%), middle school (151 | 22.0%), and college / undergraduate (130 | 19.0%).
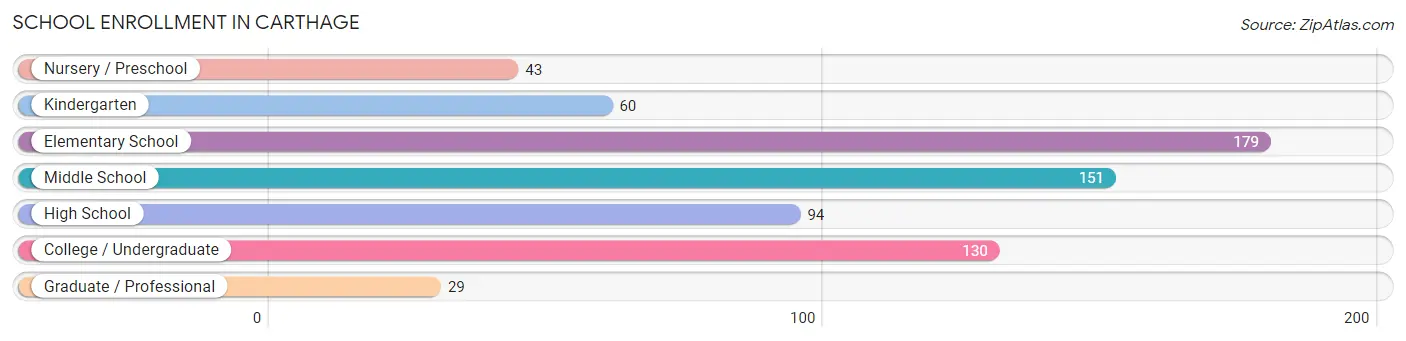
| School Level | # Students | % Students |
| Nursery / Preschool | 43 | 6.3% |
| Kindergarten | 60 | 8.7% |
| Elementary School | 179 | 26.1% |
| Middle School | 151 | 22.0% |
| High School | 94 | 13.7% |
| College / Undergraduate | 130 | 19.0% |
| Graduate / Professional | 29 | 4.2% |
| Total | 686 | 100.0% |
School Enrollment by Age by Funding Source in Carthage
Out of a total of 686 students who are enrolled in schools in Carthage, 89 (13.0%) attend a private institution, while the remaining 597 (87.0%) are enrolled in public schools. The age group of 3 to 4 year olds has the highest likelihood of being enrolled in private schools, with 28 (65.1% in the age bracket) enrolled. Conversely, the age group of 15 to 17 year olds has the lowest likelihood of being enrolled in a private school, with 99 (100.0% in the age bracket) attending a public institution.
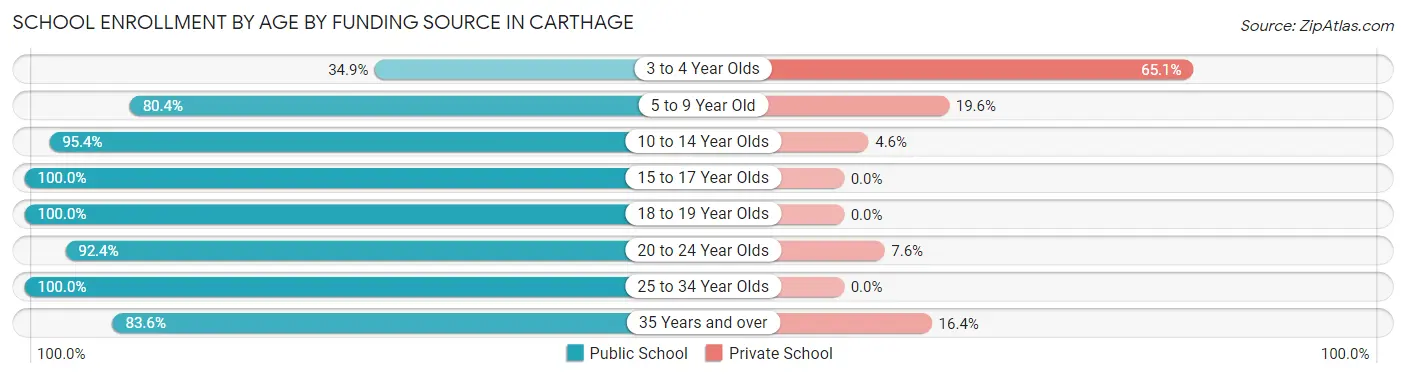
| Age Bracket | Public School | Private School |
| 3 to 4 Year Olds | 15 (34.9%) | 28 (65.1%) |
| 5 to 9 Year Old | 152 (80.4%) | 37 (19.6%) |
| 10 to 14 Year Olds | 187 (95.4%) | 9 (4.6%) |
| 15 to 17 Year Olds | 99 (100.0%) | 0 (0.0%) |
| 18 to 19 Year Olds | 7 (100.0%) | 0 (0.0%) |
| 20 to 24 Year Olds | 61 (92.4%) | 5 (7.6%) |
| 25 to 34 Year Olds | 25 (100.0%) | 0 (0.0%) |
| 35 Years and over | 51 (83.6%) | 10 (16.4%) |
| Total | 597 (87.0%) | 89 (13.0%) |
Educational Attainment by Field of Study in Carthage
Education (103 | 24.6%), business (86 | 20.6%), arts & humanities (69 | 16.5%), liberal arts & history (52 | 12.4%), and science & technology (41 | 9.8%) are the most common fields of study among 418 individuals in Carthage who have obtained a bachelor's degree or higher.
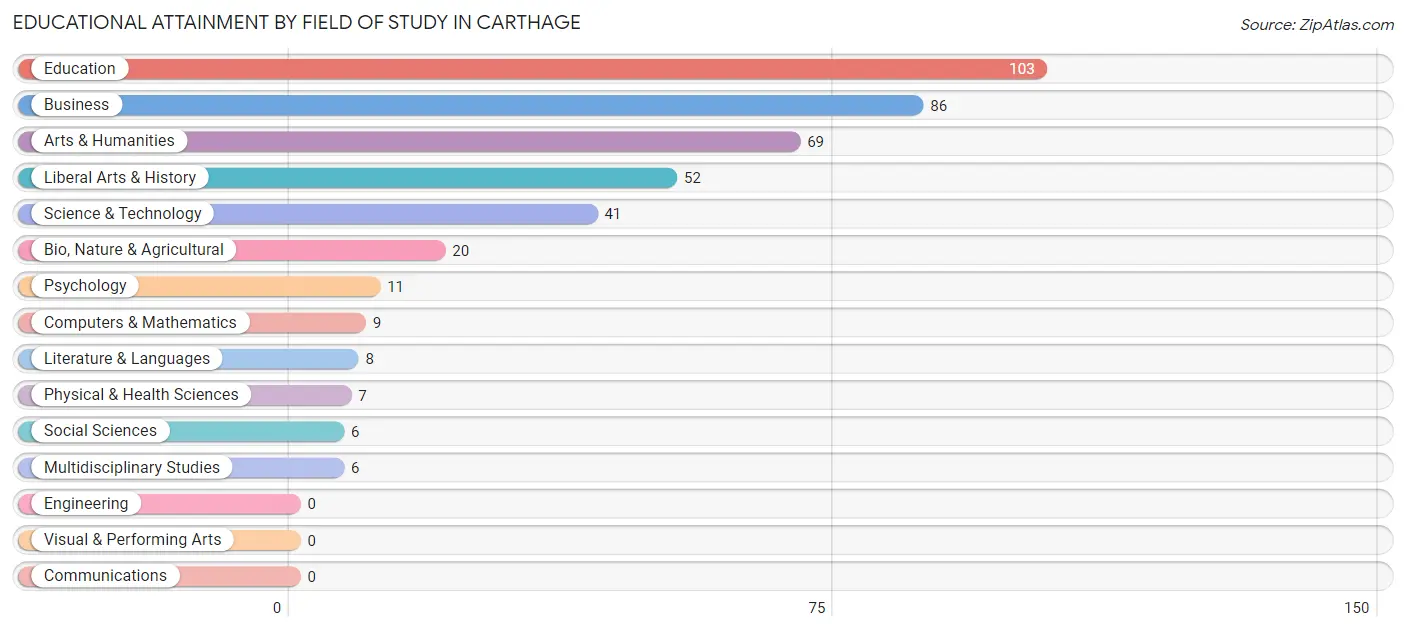
| Field of Study | # Graduates | % Graduates |
| Computers & Mathematics | 9 | 2.1% |
| Bio, Nature & Agricultural | 20 | 4.8% |
| Physical & Health Sciences | 7 | 1.7% |
| Psychology | 11 | 2.6% |
| Social Sciences | 6 | 1.4% |
| Engineering | 0 | 0.0% |
| Multidisciplinary Studies | 6 | 1.4% |
| Science & Technology | 41 | 9.8% |
| Business | 86 | 20.6% |
| Education | 103 | 24.6% |
| Literature & Languages | 8 | 1.9% |
| Liberal Arts & History | 52 | 12.4% |
| Visual & Performing Arts | 0 | 0.0% |
| Communications | 0 | 0.0% |
| Arts & Humanities | 69 | 16.5% |
| Total | 418 | 100.0% |
Transportation & Commute in Carthage
Vehicle Availability by Sex in Carthage
The most prevalent vehicle ownership categories in Carthage are males with 2 vehicles (225, accounting for 40.7%) and females with 2 vehicles (311, making up 32.9%).
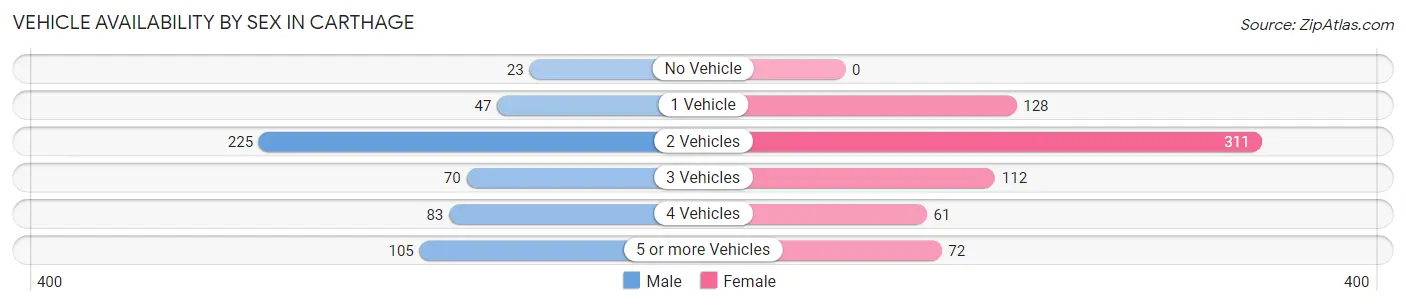
| Vehicles Available | Male | Female |
| No Vehicle | 23 (4.2%) | 0 (0.0%) |
| 1 Vehicle | 47 (8.5%) | 128 (18.7%) |
| 2 Vehicles | 225 (40.7%) | 311 (45.5%) |
| 3 Vehicles | 70 (12.7%) | 112 (16.4%) |
| 4 Vehicles | 83 (15.0%) | 61 (8.9%) |
| 5 or more Vehicles | 105 (19.0%) | 72 (10.5%) |
| Total | 553 (100.0%) | 684 (100.0%) |
Commute Time in Carthage
The most frequently occuring commute durations in Carthage are 20 to 24 minutes (204 commuters, 18.6%), 10 to 14 minutes (162 commuters, 14.7%), and 45 to 59 minutes (149 commuters, 13.6%).
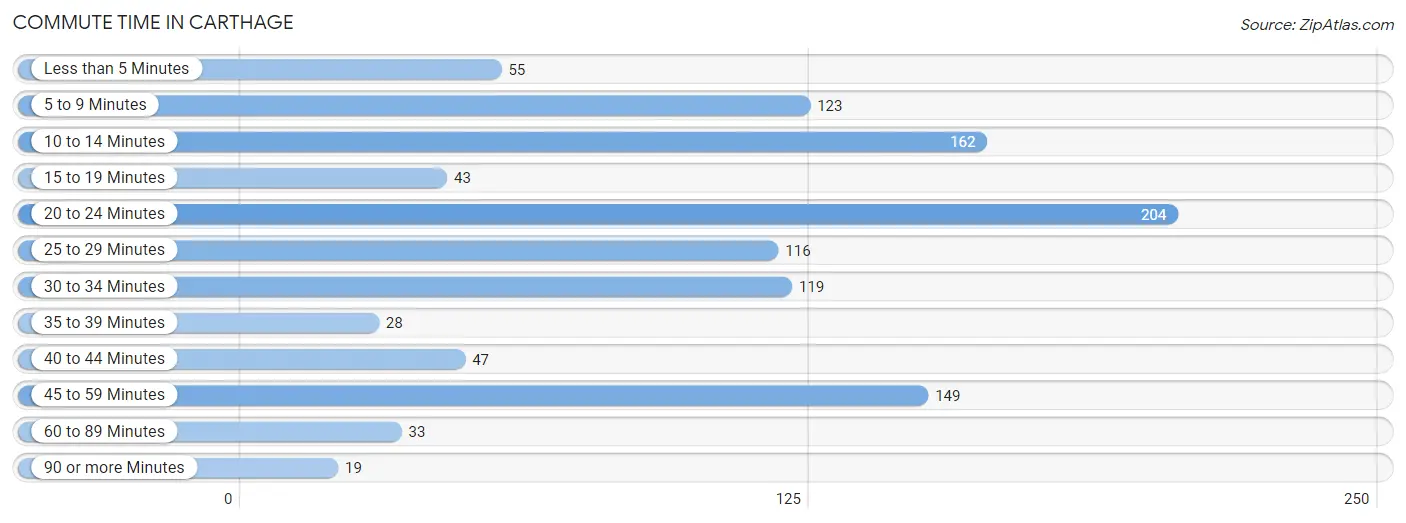
| Commute Time | # Commuters | % Commuters |
| Less than 5 Minutes | 55 | 5.0% |
| 5 to 9 Minutes | 123 | 11.2% |
| 10 to 14 Minutes | 162 | 14.7% |
| 15 to 19 Minutes | 43 | 3.9% |
| 20 to 24 Minutes | 204 | 18.6% |
| 25 to 29 Minutes | 116 | 10.6% |
| 30 to 34 Minutes | 119 | 10.8% |
| 35 to 39 Minutes | 28 | 2.5% |
| 40 to 44 Minutes | 47 | 4.3% |
| 45 to 59 Minutes | 149 | 13.6% |
| 60 to 89 Minutes | 33 | 3.0% |
| 90 or more Minutes | 19 | 1.7% |
Commute Time by Sex in Carthage
The most common commute times in Carthage are 45 to 59 minutes (115 commuters, 23.2%) for males and 20 to 24 minutes (168 commuters, 27.9%) for females.
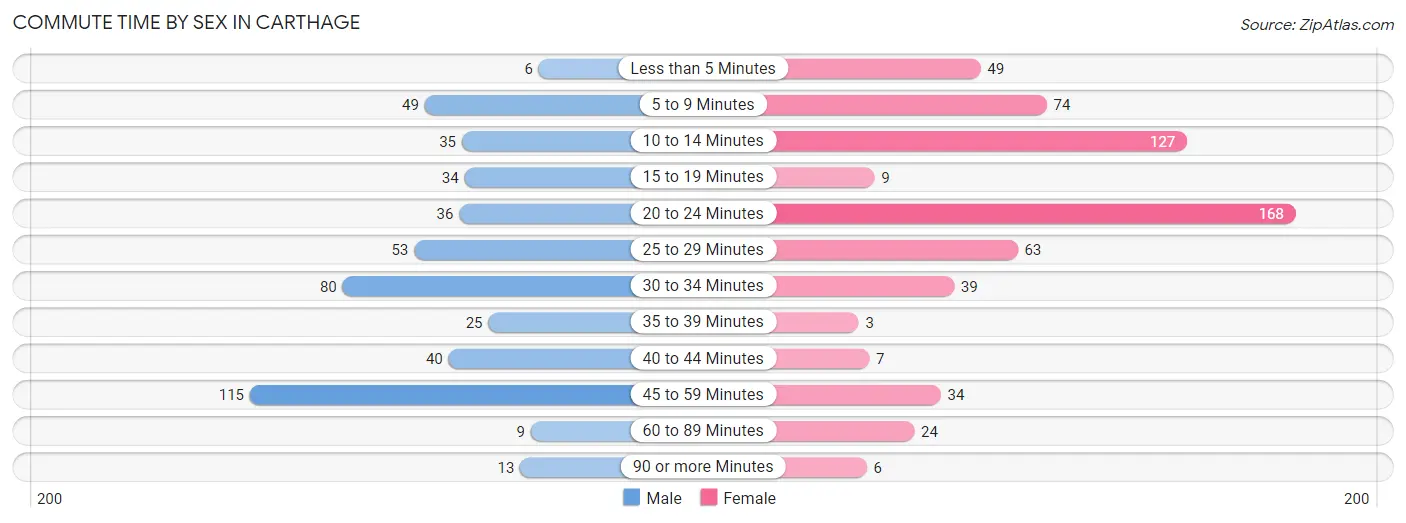
| Commute Time | Male | Female |
| Less than 5 Minutes | 6 (1.2%) | 49 (8.1%) |
| 5 to 9 Minutes | 49 (9.9%) | 74 (12.3%) |
| 10 to 14 Minutes | 35 (7.1%) | 127 (21.1%) |
| 15 to 19 Minutes | 34 (6.9%) | 9 (1.5%) |
| 20 to 24 Minutes | 36 (7.3%) | 168 (27.9%) |
| 25 to 29 Minutes | 53 (10.7%) | 63 (10.4%) |
| 30 to 34 Minutes | 80 (16.2%) | 39 (6.5%) |
| 35 to 39 Minutes | 25 (5.1%) | 3 (0.5%) |
| 40 to 44 Minutes | 40 (8.1%) | 7 (1.2%) |
| 45 to 59 Minutes | 115 (23.2%) | 34 (5.6%) |
| 60 to 89 Minutes | 9 (1.8%) | 24 (4.0%) |
| 90 or more Minutes | 13 (2.6%) | 6 (1.0%) |
Time of Departure to Work by Sex in Carthage
The most frequent times of departure to work in Carthage are 7:00 AM to 7:29 AM (193, 39.0%) for males and 7:30 AM to 7:59 AM (138, 22.9%) for females.
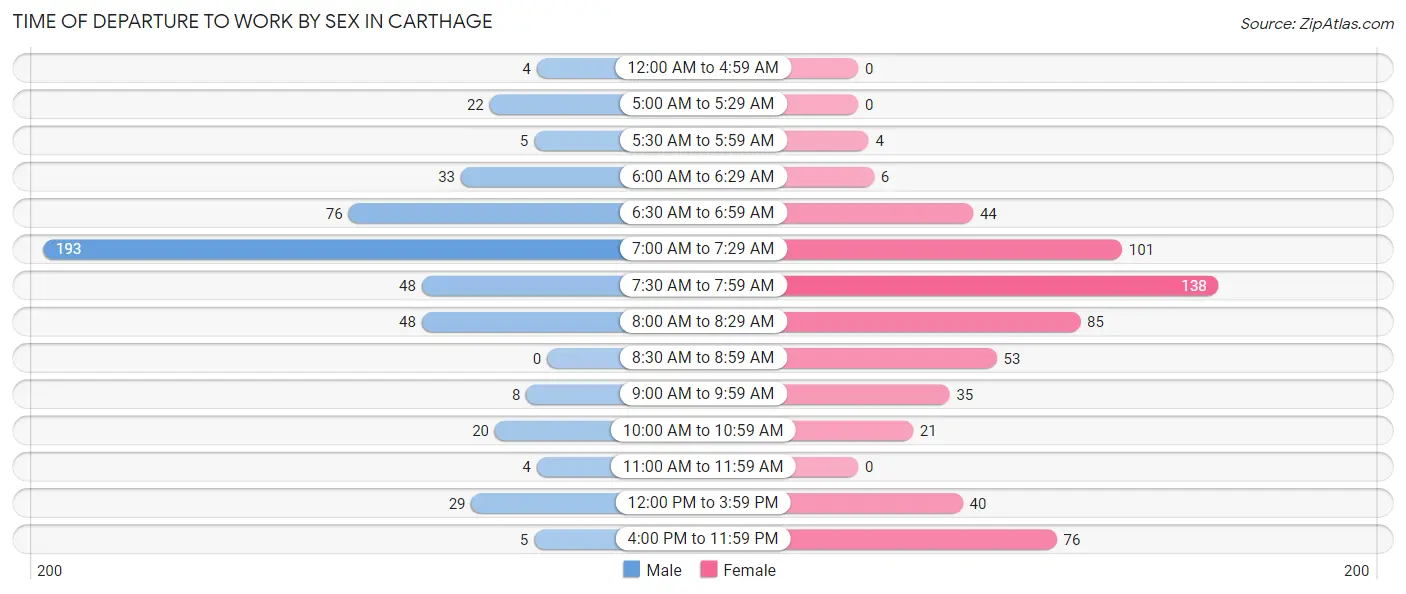
| Time of Departure | Male | Female |
| 12:00 AM to 4:59 AM | 4 (0.8%) | 0 (0.0%) |
| 5:00 AM to 5:29 AM | 22 (4.4%) | 0 (0.0%) |
| 5:30 AM to 5:59 AM | 5 (1.0%) | 4 (0.7%) |
| 6:00 AM to 6:29 AM | 33 (6.7%) | 6 (1.0%) |
| 6:30 AM to 6:59 AM | 76 (15.3%) | 44 (7.3%) |
| 7:00 AM to 7:29 AM | 193 (39.0%) | 101 (16.8%) |
| 7:30 AM to 7:59 AM | 48 (9.7%) | 138 (22.9%) |
| 8:00 AM to 8:29 AM | 48 (9.7%) | 85 (14.1%) |
| 8:30 AM to 8:59 AM | 0 (0.0%) | 53 (8.8%) |
| 9:00 AM to 9:59 AM | 8 (1.6%) | 35 (5.8%) |
| 10:00 AM to 10:59 AM | 20 (4.0%) | 21 (3.5%) |
| 11:00 AM to 11:59 AM | 4 (0.8%) | 0 (0.0%) |
| 12:00 PM to 3:59 PM | 29 (5.9%) | 40 (6.6%) |
| 4:00 PM to 11:59 PM | 5 (1.0%) | 76 (12.6%) |
| Total | 495 (100.0%) | 603 (100.0%) |
Housing Occupancy in Carthage
Occupancy by Ownership in Carthage
Of the total 1,124 dwellings in Carthage, owner-occupied units account for 879 (78.2%), while renter-occupied units make up 245 (21.8%).
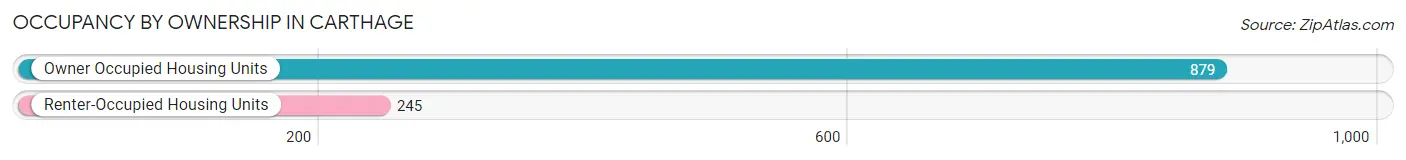
| Occupancy | # Housing Units | % Housing Units |
| Owner Occupied Housing Units | 879 | 78.2% |
| Renter-Occupied Housing Units | 245 | 21.8% |
| Total Occupied Housing Units | 1,124 | 100.0% |
Occupancy by Household Size in Carthage
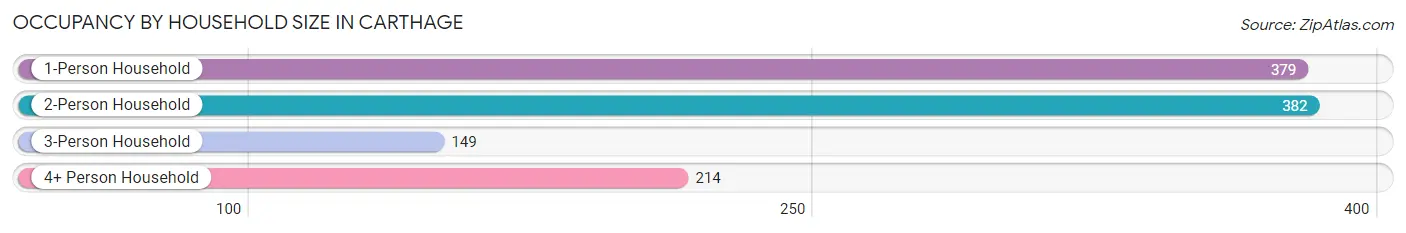
| Household Size | # Housing Units | % Housing Units |
| 1-Person Household | 379 | 33.7% |
| 2-Person Household | 382 | 34.0% |
| 3-Person Household | 149 | 13.3% |
| 4+ Person Household | 214 | 19.0% |
| Total Housing Units | 1,124 | 100.0% |
Occupancy by Ownership by Household Size in Carthage
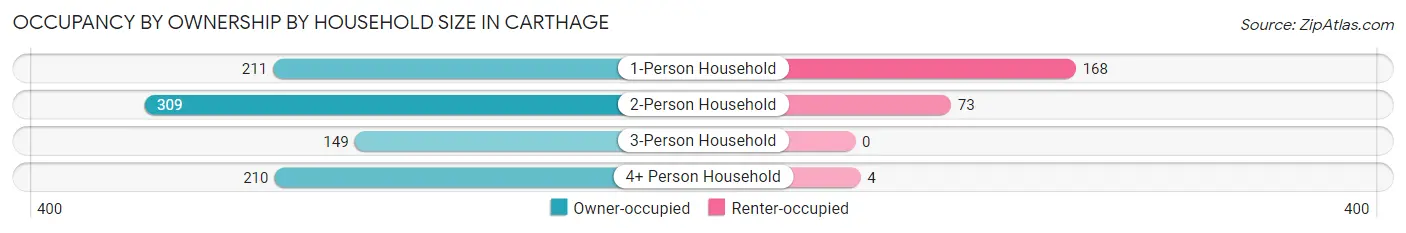
| Household Size | Owner-occupied | Renter-occupied |
| 1-Person Household | 211 (55.7%) | 168 (44.3%) |
| 2-Person Household | 309 (80.9%) | 73 (19.1%) |
| 3-Person Household | 149 (100.0%) | 0 (0.0%) |
| 4+ Person Household | 210 (98.1%) | 4 (1.9%) |
| Total Housing Units | 879 (78.2%) | 245 (21.8%) |
Occupancy by Educational Attainment in Carthage
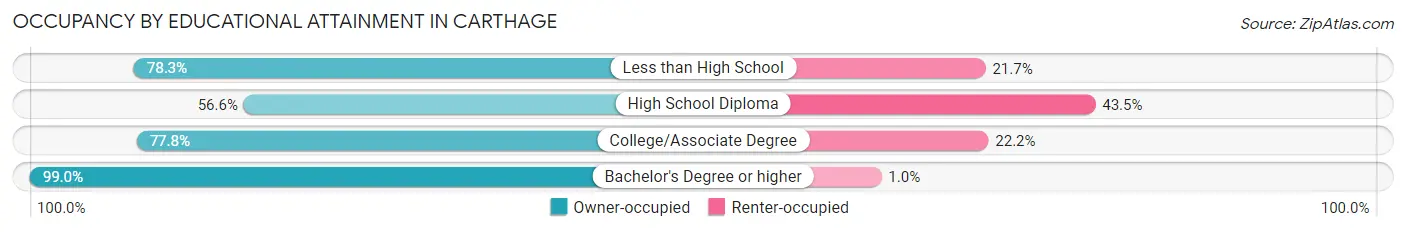
| Household Size | Owner-occupied | Renter-occupied |
| Less than High School | 47 (78.3%) | 13 (21.7%) |
| High School Diploma | 151 (56.6%) | 116 (43.4%) |
| College/Associate Degree | 395 (77.8%) | 113 (22.2%) |
| Bachelor's Degree or higher | 286 (99.0%) | 3 (1.0%) |
Occupancy by Age of Householder in Carthage
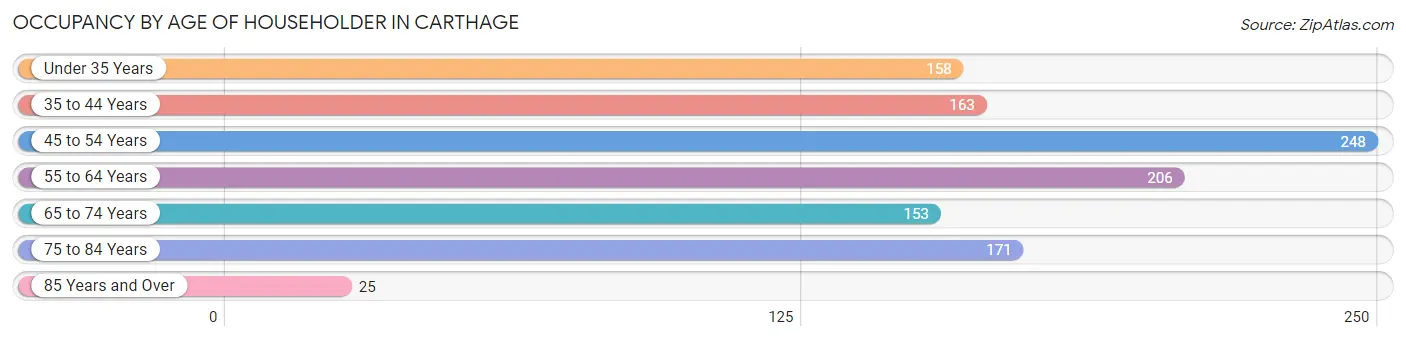
| Age Bracket | # Households | % Households |
| Under 35 Years | 158 | 14.1% |
| 35 to 44 Years | 163 | 14.5% |
| 45 to 54 Years | 248 | 22.1% |
| 55 to 64 Years | 206 | 18.3% |
| 65 to 74 Years | 153 | 13.6% |
| 75 to 84 Years | 171 | 15.2% |
| 85 Years and Over | 25 | 2.2% |
| Total | 1,124 | 100.0% |
Housing Finances in Carthage
Median Income by Occupancy in Carthage
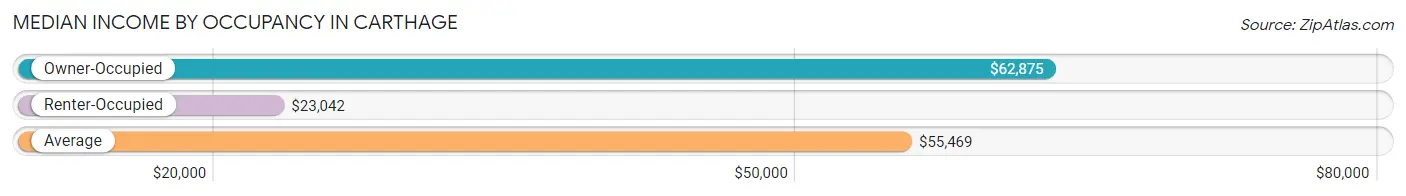
| Occupancy Type | # Households | Median Income |
| Owner-Occupied | 879 (78.2%) | $62,875 |
| Renter-Occupied | 245 (21.8%) | $23,042 |
| Average | 1,124 (100.0%) | $55,469 |
Occupancy by Householder Income Bracket in Carthage
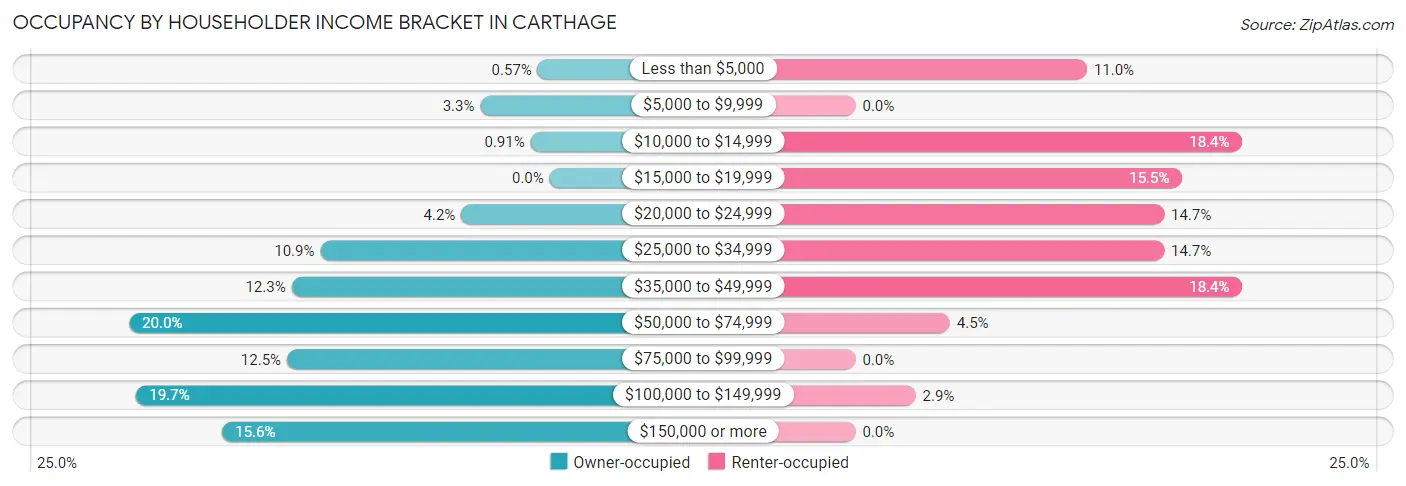
| Income Bracket | Owner-occupied | Renter-occupied |
| Less than $5,000 | 5 (0.6%) | 27 (11.0%) |
| $5,000 to $9,999 | 29 (3.3%) | 0 (0.0%) |
| $10,000 to $14,999 | 8 (0.9%) | 45 (18.4%) |
| $15,000 to $19,999 | 0 (0.0%) | 38 (15.5%) |
| $20,000 to $24,999 | 37 (4.2%) | 36 (14.7%) |
| $25,000 to $34,999 | 96 (10.9%) | 36 (14.7%) |
| $35,000 to $49,999 | 108 (12.3%) | 45 (18.4%) |
| $50,000 to $74,999 | 176 (20.0%) | 11 (4.5%) |
| $75,000 to $99,999 | 110 (12.5%) | 0 (0.0%) |
| $100,000 to $149,999 | 173 (19.7%) | 7 (2.9%) |
| $150,000 or more | 137 (15.6%) | 0 (0.0%) |
| Total | 879 (100.0%) | 245 (100.0%) |
Monthly Housing Cost Tiers in Carthage
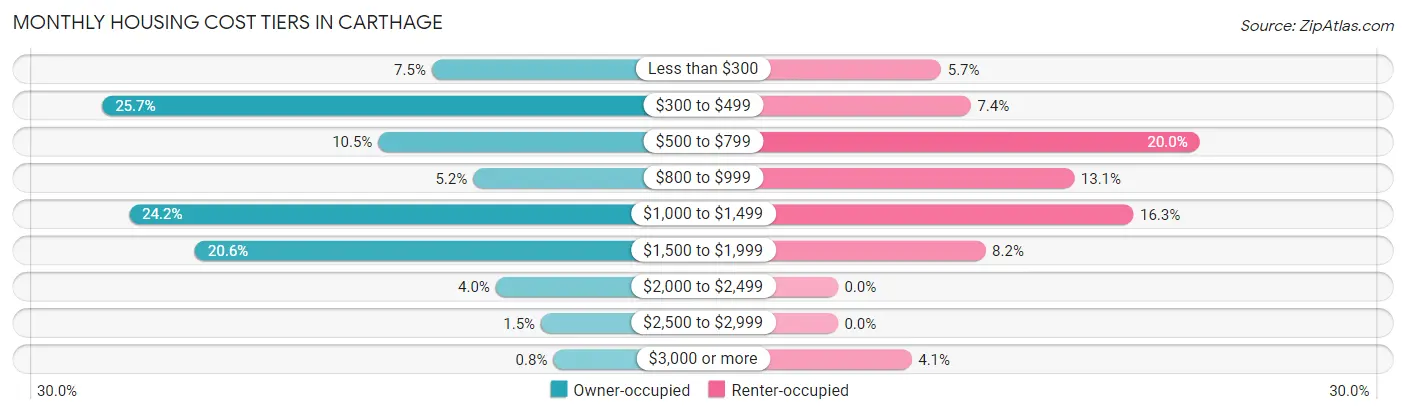
| Monthly Cost | Owner-occupied | Renter-occupied |
| Less than $300 | 66 (7.5%) | 14 (5.7%) |
| $300 to $499 | 226 (25.7%) | 18 (7.3%) |
| $500 to $799 | 92 (10.5%) | 49 (20.0%) |
| $800 to $999 | 46 (5.2%) | 32 (13.1%) |
| $1,000 to $1,499 | 213 (24.2%) | 40 (16.3%) |
| $1,500 to $1,999 | 181 (20.6%) | 20 (8.2%) |
| $2,000 to $2,499 | 35 (4.0%) | 0 (0.0%) |
| $2,500 to $2,999 | 13 (1.5%) | 0 (0.0%) |
| $3,000 or more | 7 (0.8%) | 10 (4.1%) |
| Total | 879 (100.0%) | 245 (100.0%) |
Physical Housing Characteristics in Carthage
Housing Structures in Carthage
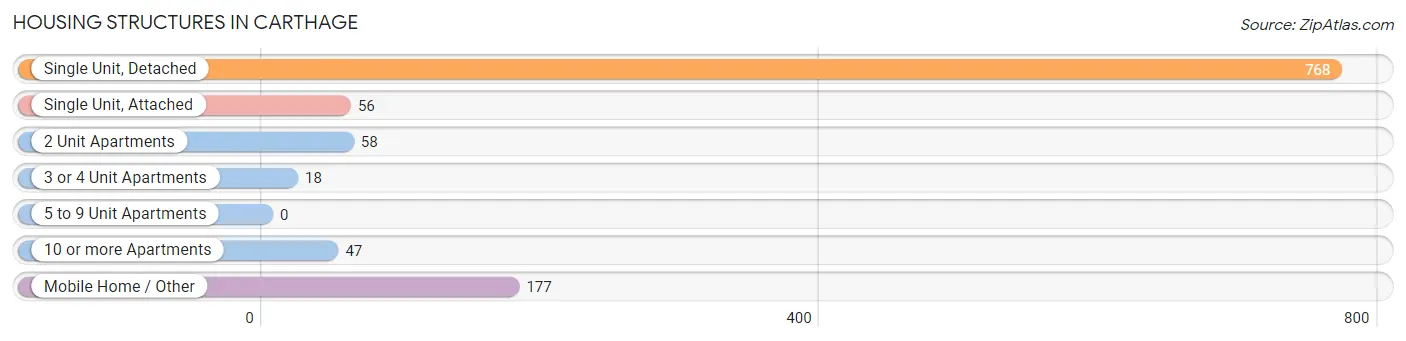
| Structure Type | # Housing Units | % Housing Units |
| Single Unit, Detached | 768 | 68.3% |
| Single Unit, Attached | 56 | 5.0% |
| 2 Unit Apartments | 58 | 5.2% |
| 3 or 4 Unit Apartments | 18 | 1.6% |
| 5 to 9 Unit Apartments | 0 | 0.0% |
| 10 or more Apartments | 47 | 4.2% |
| Mobile Home / Other | 177 | 15.8% |
| Total | 1,124 | 100.0% |
Housing Structures by Occupancy in Carthage
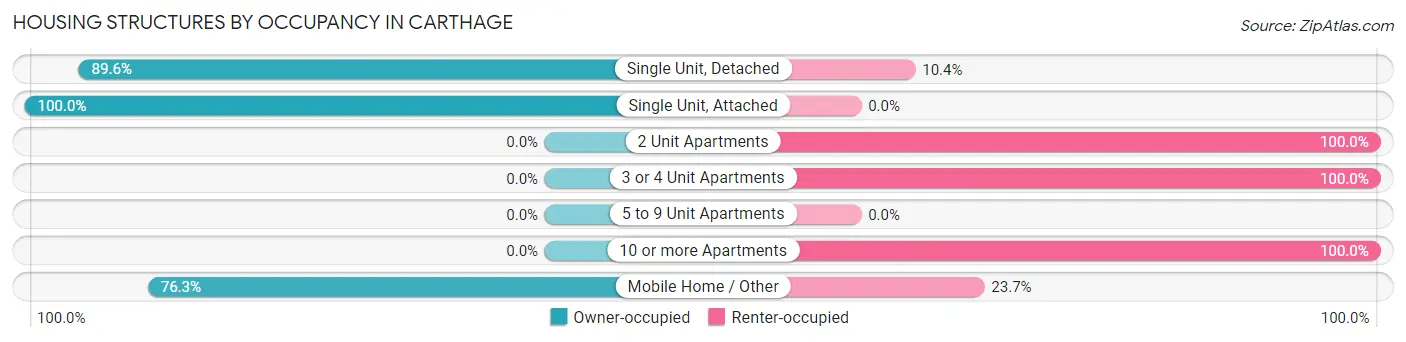
| Structure Type | Owner-occupied | Renter-occupied |
| Single Unit, Detached | 688 (89.6%) | 80 (10.4%) |
| Single Unit, Attached | 56 (100.0%) | 0 (0.0%) |
| 2 Unit Apartments | 0 (0.0%) | 58 (100.0%) |
| 3 or 4 Unit Apartments | 0 (0.0%) | 18 (100.0%) |
| 5 to 9 Unit Apartments | 0 (0.0%) | 0 (0.0%) |
| 10 or more Apartments | 0 (0.0%) | 47 (100.0%) |
| Mobile Home / Other | 135 (76.3%) | 42 (23.7%) |
| Total | 879 (78.2%) | 245 (21.8%) |
Housing Structures by Number of Rooms in Carthage
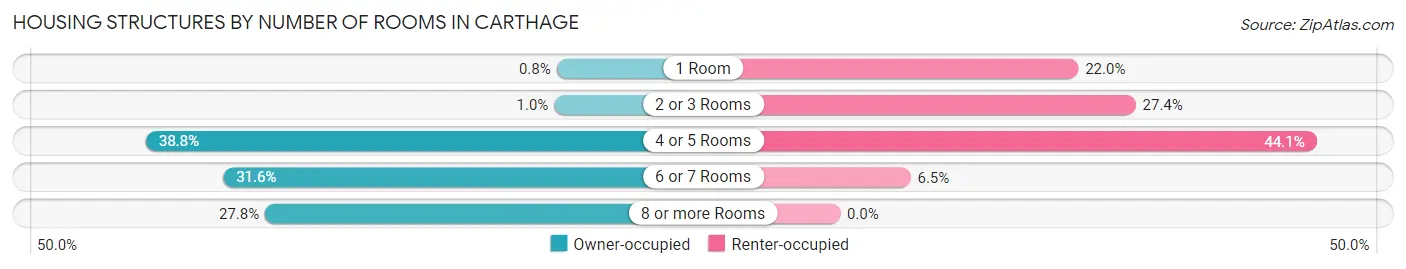
| Number of Rooms | Owner-occupied | Renter-occupied |
| 1 Room | 7 (0.8%) | 54 (22.0%) |
| 2 or 3 Rooms | 9 (1.0%) | 67 (27.4%) |
| 4 or 5 Rooms | 341 (38.8%) | 108 (44.1%) |
| 6 or 7 Rooms | 278 (31.6%) | 16 (6.5%) |
| 8 or more Rooms | 244 (27.8%) | 0 (0.0%) |
| Total | 879 (100.0%) | 245 (100.0%) |
Housing Structure by Heating Type in Carthage
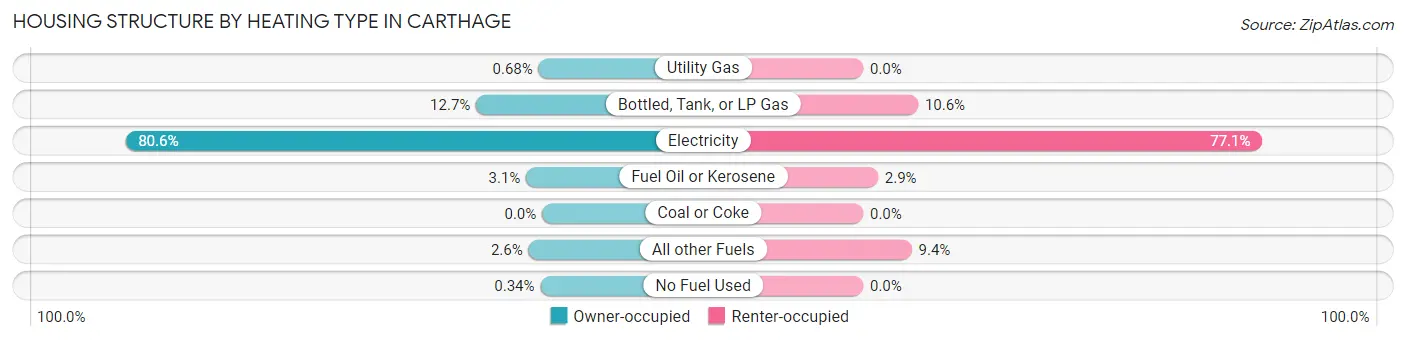
| Heating Type | Owner-occupied | Renter-occupied |
| Utility Gas | 6 (0.7%) | 0 (0.0%) |
| Bottled, Tank, or LP Gas | 112 (12.7%) | 26 (10.6%) |
| Electricity | 708 (80.5%) | 189 (77.1%) |
| Fuel Oil or Kerosene | 27 (3.1%) | 7 (2.9%) |
| Coal or Coke | 0 (0.0%) | 0 (0.0%) |
| All other Fuels | 23 (2.6%) | 23 (9.4%) |
| No Fuel Used | 3 (0.3%) | 0 (0.0%) |
| Total | 879 (100.0%) | 245 (100.0%) |
Household Vehicle Usage in Carthage
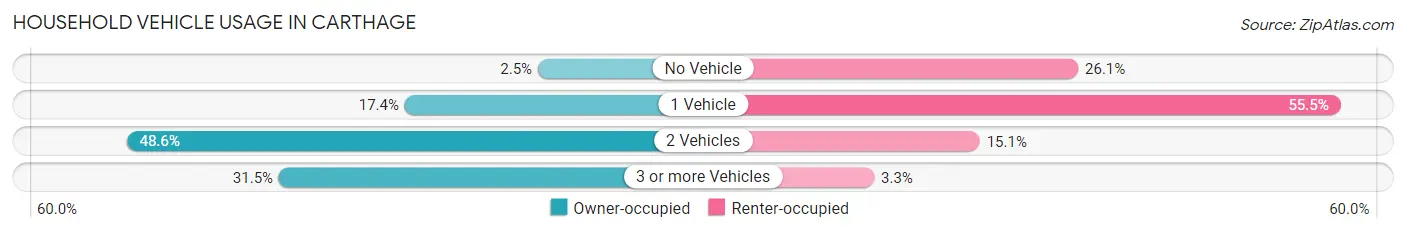
| Vehicles per Household | Owner-occupied | Renter-occupied |
| No Vehicle | 22 (2.5%) | 64 (26.1%) |
| 1 Vehicle | 153 (17.4%) | 136 (55.5%) |
| 2 Vehicles | 427 (48.6%) | 37 (15.1%) |
| 3 or more Vehicles | 277 (31.5%) | 8 (3.3%) |
| Total | 879 (100.0%) | 245 (100.0%) |
Real Estate & Mortgages in Carthage
Real Estate and Mortgage Overview in Carthage
| Characteristic | Without Mortgage | With Mortgage |
| Housing Units | 354 | 525 |
| Median Property Value | $118,600 | $248,300 |
| Median Household Income | $55,435 | $109 |
| Monthly Housing Costs | $443 | $7 |
| Real Estate Taxes | $619 | $0 |
Property Value by Mortgage Status in Carthage
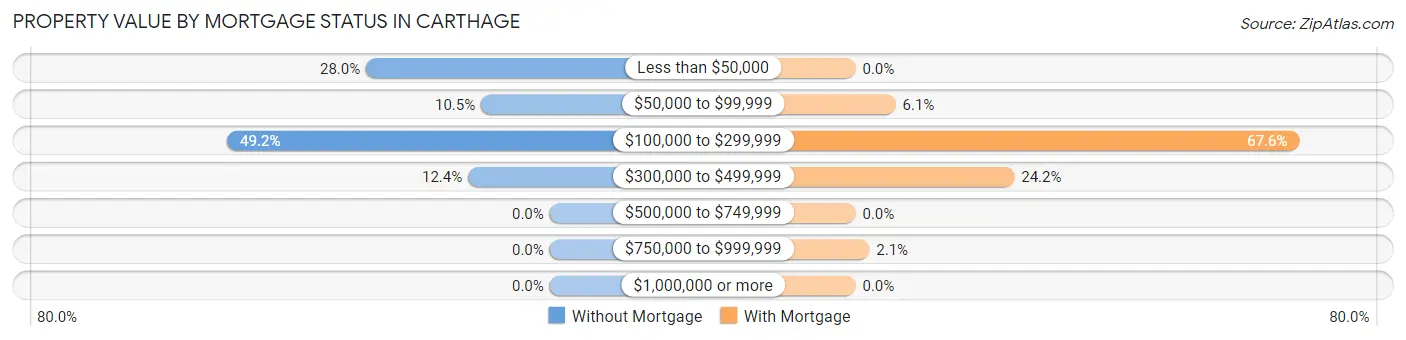
| Property Value | Without Mortgage | With Mortgage |
| Less than $50,000 | 99 (28.0%) | 0 (0.0%) |
| $50,000 to $99,999 | 37 (10.4%) | 32 (6.1%) |
| $100,000 to $299,999 | 174 (49.1%) | 355 (67.6%) |
| $300,000 to $499,999 | 44 (12.4%) | 127 (24.2%) |
| $500,000 to $749,999 | 0 (0.0%) | 0 (0.0%) |
| $750,000 to $999,999 | 0 (0.0%) | 11 (2.1%) |
| $1,000,000 or more | 0 (0.0%) | 0 (0.0%) |
| Total | 354 (100.0%) | 525 (100.0%) |
Household Income by Mortgage Status in Carthage
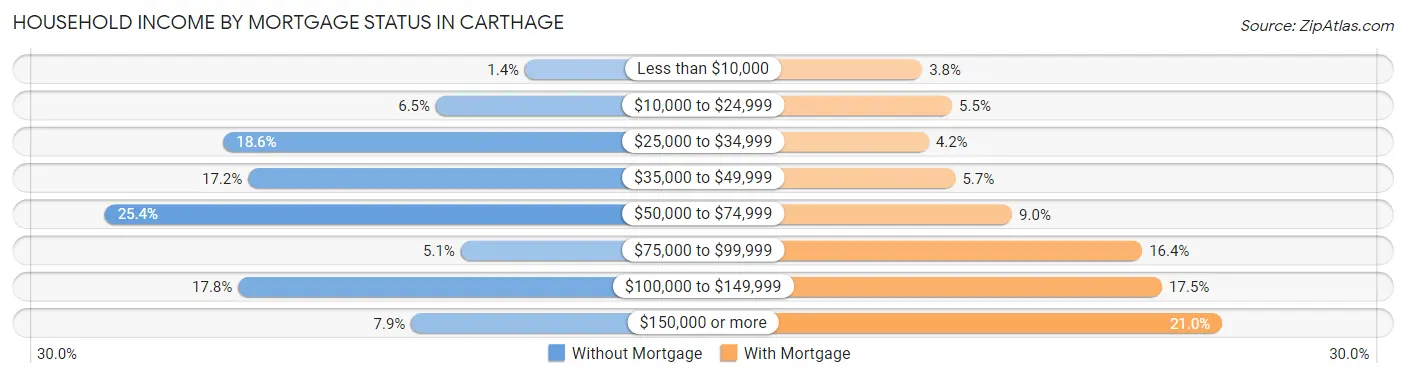
| Household Income | Without Mortgage | With Mortgage |
| Less than $10,000 | 5 (1.4%) | 20 (3.8%) |
| $10,000 to $24,999 | 23 (6.5%) | 29 (5.5%) |
| $25,000 to $34,999 | 66 (18.6%) | 22 (4.2%) |
| $35,000 to $49,999 | 61 (17.2%) | 30 (5.7%) |
| $50,000 to $74,999 | 90 (25.4%) | 47 (8.9%) |
| $75,000 to $99,999 | 18 (5.1%) | 86 (16.4%) |
| $100,000 to $149,999 | 63 (17.8%) | 92 (17.5%) |
| $150,000 or more | 28 (7.9%) | 110 (20.9%) |
| Total | 354 (100.0%) | 525 (100.0%) |
Property Value to Household Income Ratio in Carthage
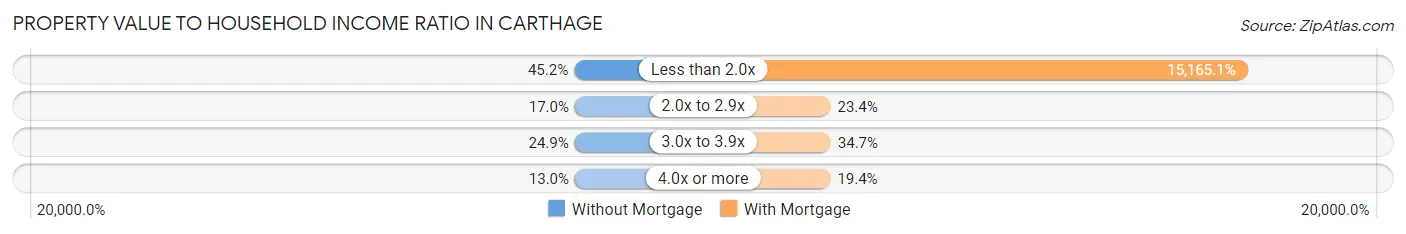
| Value-to-Income Ratio | Without Mortgage | With Mortgage |
| Less than 2.0x | 160 (45.2%) | 79,617 (15,165.1%) |
| 2.0x to 2.9x | 60 (17.0%) | 123 (23.4%) |
| 3.0x to 3.9x | 88 (24.9%) | 182 (34.7%) |
| 4.0x or more | 46 (13.0%) | 102 (19.4%) |
| Total | 354 (100.0%) | 525 (100.0%) |
Real Estate Taxes by Mortgage Status in Carthage
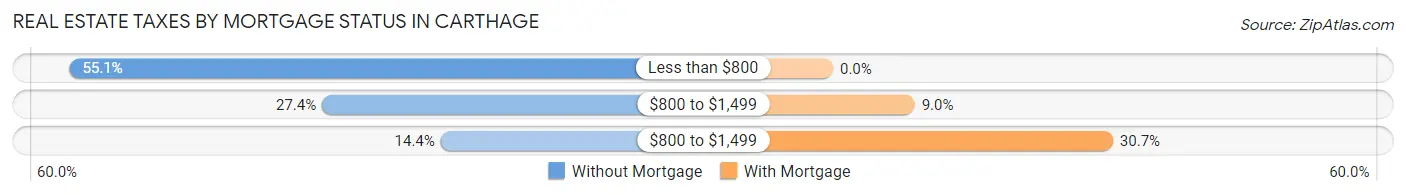
| Property Taxes | Without Mortgage | With Mortgage |
| Less than $800 | 195 (55.1%) | 0 (0.0%) |
| $800 to $1,499 | 97 (27.4%) | 47 (8.9%) |
| $800 to $1,499 | 51 (14.4%) | 161 (30.7%) |
| Total | 354 (100.0%) | 525 (100.0%) |
Health & Disability in Carthage
Health Insurance Coverage by Age in Carthage
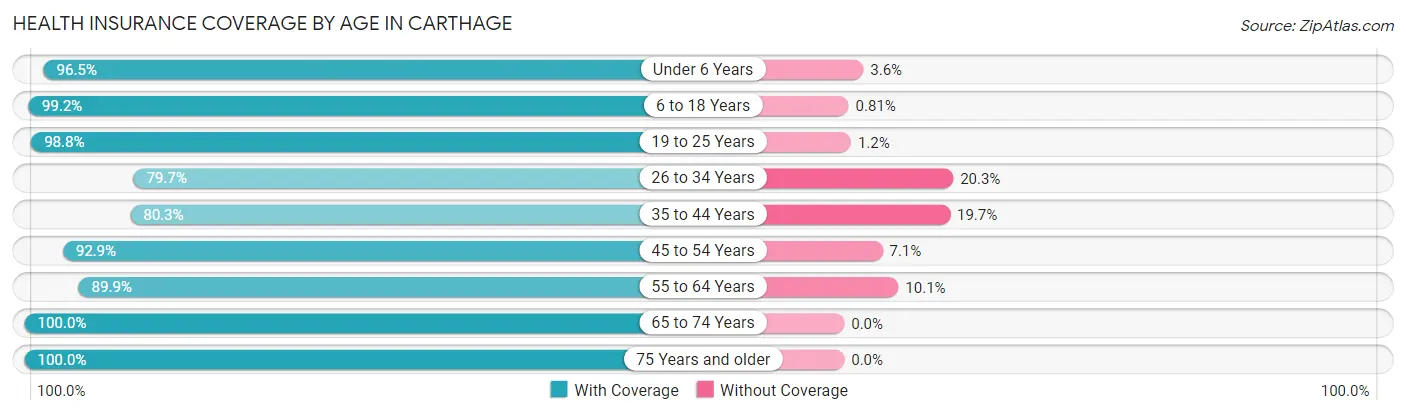
| Age Bracket | With Coverage | Without Coverage |
| Under 6 Years | 136 (96.5%) | 5 (3.5%) |
| 6 to 18 Years | 488 (99.2%) | 4 (0.8%) |
| 19 to 25 Years | 159 (98.8%) | 2 (1.2%) |
| 26 to 34 Years | 208 (79.7%) | 53 (20.3%) |
| 35 to 44 Years | 232 (80.3%) | 57 (19.7%) |
| 45 to 54 Years | 378 (92.9%) | 29 (7.1%) |
| 55 to 64 Years | 294 (89.9%) | 33 (10.1%) |
| 65 to 74 Years | 205 (100.0%) | 0 (0.0%) |
| 75 Years and older | 288 (100.0%) | 0 (0.0%) |
| Total | 2,388 (92.9%) | 183 (7.1%) |
Health Insurance Coverage by Citizenship Status in Carthage
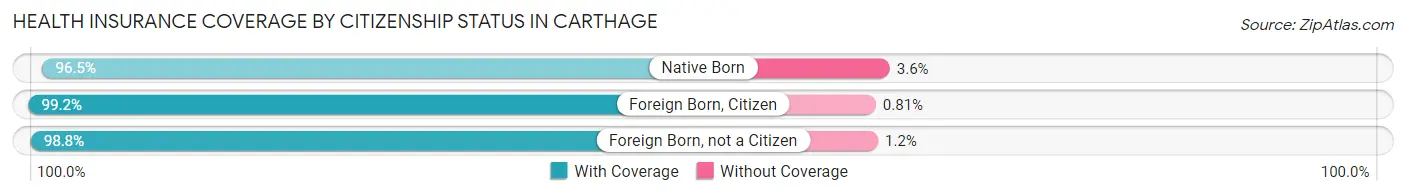
| Citizenship Status | With Coverage | Without Coverage |
| Native Born | 136 (96.5%) | 5 (3.5%) |
| Foreign Born, Citizen | 488 (99.2%) | 4 (0.8%) |
| Foreign Born, not a Citizen | 159 (98.8%) | 2 (1.2%) |
Health Insurance Coverage by Household Income in Carthage
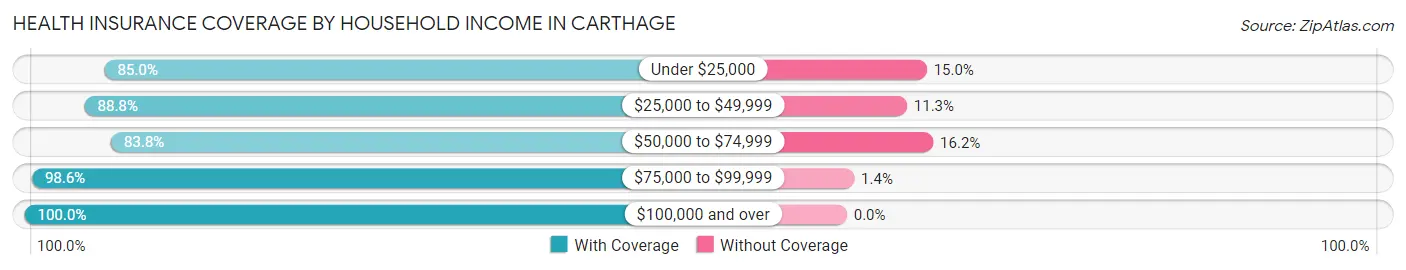
| Household Income | With Coverage | Without Coverage |
| Under $25,000 | 335 (85.0%) | 59 (15.0%) |
| $25,000 to $49,999 | 552 (88.7%) | 70 (11.3%) |
| $50,000 to $74,999 | 259 (83.8%) | 50 (16.2%) |
| $75,000 to $99,999 | 286 (98.6%) | 4 (1.4%) |
| $100,000 and over | 956 (100.0%) | 0 (0.0%) |
Public vs Private Health Insurance Coverage by Age in Carthage
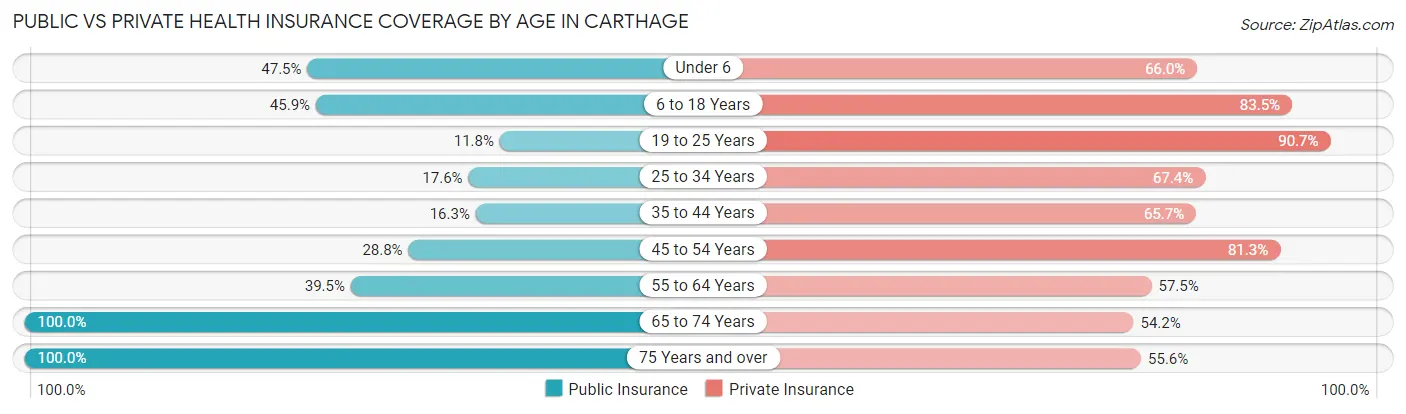
| Age Bracket | Public Insurance | Private Insurance |
| Under 6 | 67 (47.5%) | 93 (66.0%) |
| 6 to 18 Years | 226 (45.9%) | 411 (83.5%) |
| 19 to 25 Years | 19 (11.8%) | 146 (90.7%) |
| 25 to 34 Years | 46 (17.6%) | 176 (67.4%) |
| 35 to 44 Years | 47 (16.3%) | 190 (65.7%) |
| 45 to 54 Years | 117 (28.7%) | 331 (81.3%) |
| 55 to 64 Years | 129 (39.5%) | 188 (57.5%) |
| 65 to 74 Years | 205 (100.0%) | 111 (54.1%) |
| 75 Years and over | 288 (100.0%) | 160 (55.6%) |
| Total | 1,144 (44.5%) | 1,806 (70.3%) |
Disability Status by Sex by Age in Carthage
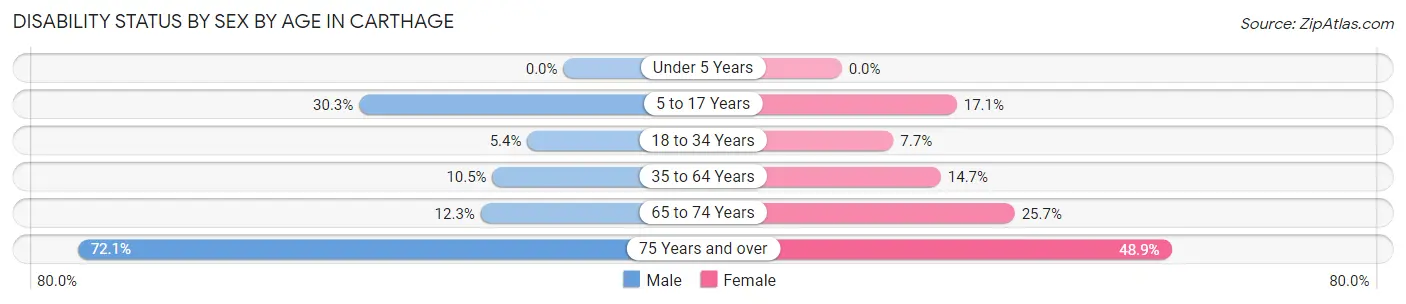
| Age Bracket | Male | Female |
| Under 5 Years | 0 (0.0%) | 0 (0.0%) |
| 5 to 17 Years | 64 (30.3%) | 48 (17.1%) |
| 18 to 34 Years | 10 (5.3%) | 18 (7.7%) |
| 35 to 64 Years | 54 (10.5%) | 75 (14.7%) |
| 65 to 74 Years | 7 (12.3%) | 38 (25.7%) |
| 75 Years and over | 106 (72.1%) | 69 (48.9%) |
Disability Class by Sex by Age in Carthage
Disability Class: Hearing Difficulty
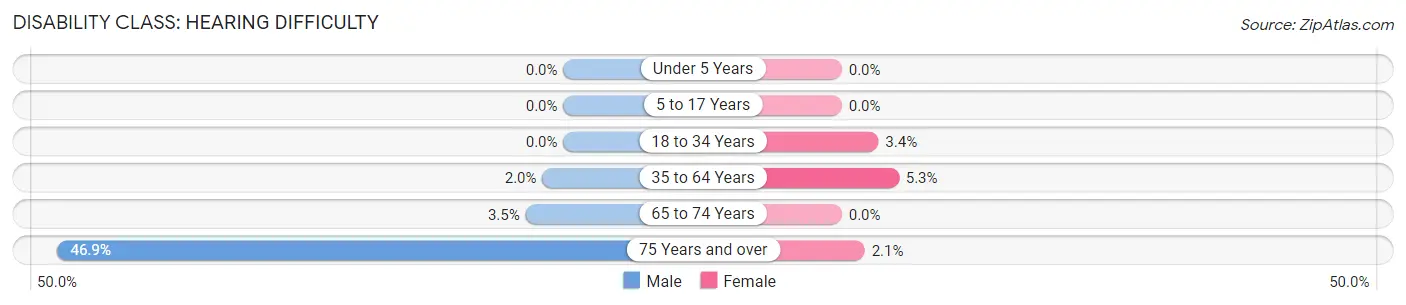
| Age Bracket | Male | Female |
| Under 5 Years | 0 (0.0%) | 0 (0.0%) |
| 5 to 17 Years | 0 (0.0%) | 0 (0.0%) |
| 18 to 34 Years | 0 (0.0%) | 8 (3.4%) |
| 35 to 64 Years | 10 (1.9%) | 27 (5.3%) |
| 65 to 74 Years | 2 (3.5%) | 0 (0.0%) |
| 75 Years and over | 69 (46.9%) | 3 (2.1%) |
Disability Class: Vision Difficulty
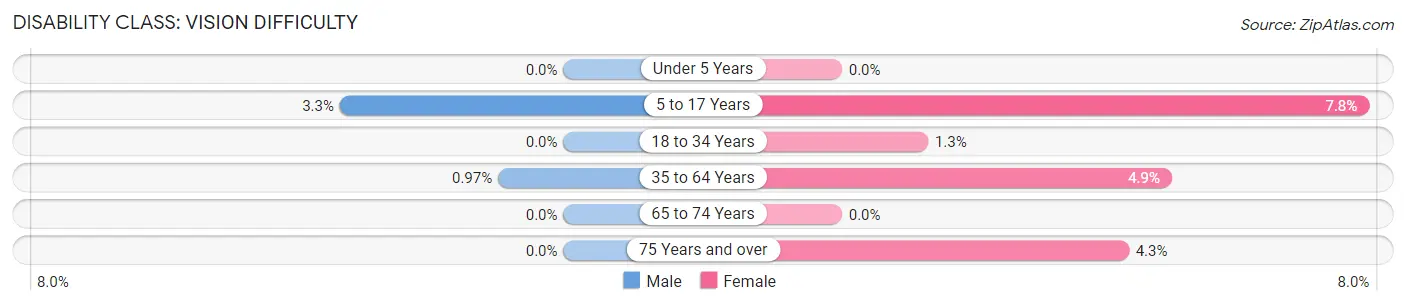
| Age Bracket | Male | Female |
| Under 5 Years | 0 (0.0%) | 0 (0.0%) |
| 5 to 17 Years | 7 (3.3%) | 22 (7.8%) |
| 18 to 34 Years | 0 (0.0%) | 3 (1.3%) |
| 35 to 64 Years | 5 (1.0%) | 25 (4.9%) |
| 65 to 74 Years | 0 (0.0%) | 0 (0.0%) |
| 75 Years and over | 0 (0.0%) | 6 (4.3%) |
Disability Class: Cognitive Difficulty
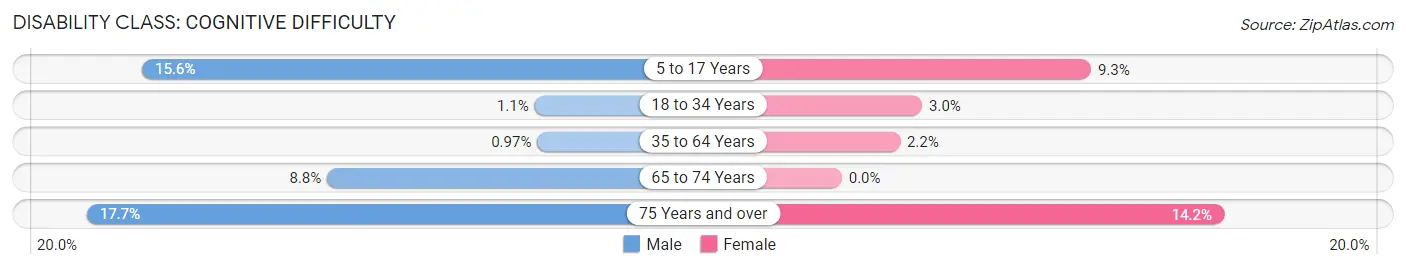
| Age Bracket | Male | Female |
| 5 to 17 Years | 33 (15.6%) | 26 (9.2%) |
| 18 to 34 Years | 2 (1.1%) | 7 (3.0%) |
| 35 to 64 Years | 5 (1.0%) | 11 (2.2%) |
| 65 to 74 Years | 5 (8.8%) | 0 (0.0%) |
| 75 Years and over | 26 (17.7%) | 20 (14.2%) |
Disability Class: Ambulatory Difficulty
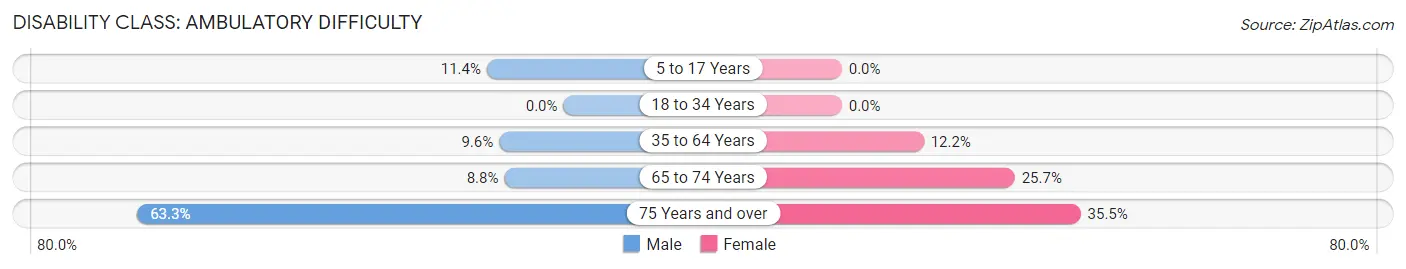
| Age Bracket | Male | Female |
| 5 to 17 Years | 24 (11.4%) | 0 (0.0%) |
| 18 to 34 Years | 0 (0.0%) | 0 (0.0%) |
| 35 to 64 Years | 49 (9.6%) | 62 (12.2%) |
| 65 to 74 Years | 5 (8.8%) | 38 (25.7%) |
| 75 Years and over | 93 (63.3%) | 50 (35.5%) |
Disability Class: Self-Care Difficulty
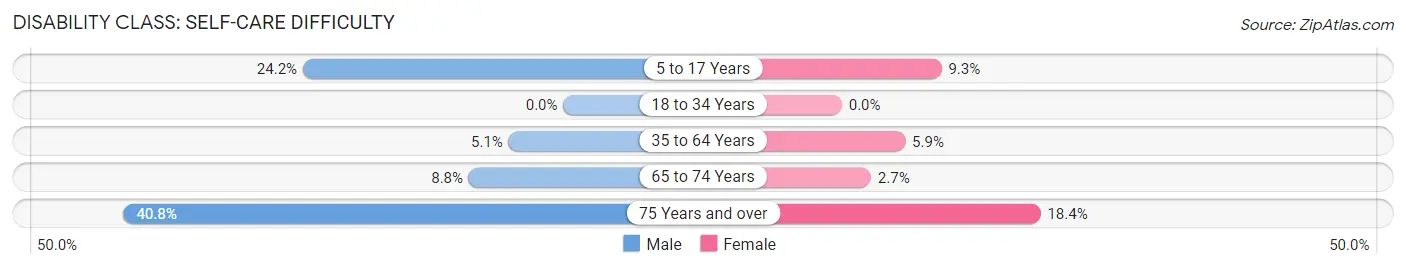
| Age Bracket | Male | Female |
| 5 to 17 Years | 51 (24.2%) | 26 (9.2%) |
| 18 to 34 Years | 0 (0.0%) | 0 (0.0%) |
| 35 to 64 Years | 26 (5.1%) | 30 (5.9%) |
| 65 to 74 Years | 5 (8.8%) | 4 (2.7%) |
| 75 Years and over | 60 (40.8%) | 26 (18.4%) |
Technology Access in Carthage
Computing Device Access in Carthage
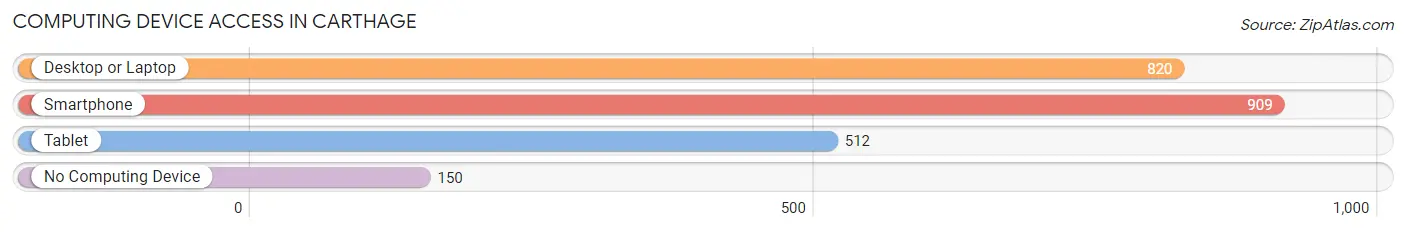
| Device Type | # Households | % Households |
| Desktop or Laptop | 820 | 73.0% |
| Smartphone | 909 | 80.9% |
| Tablet | 512 | 45.6% |
| No Computing Device | 150 | 13.4% |
| Total | 1,124 | 100.0% |
Internet Access in Carthage
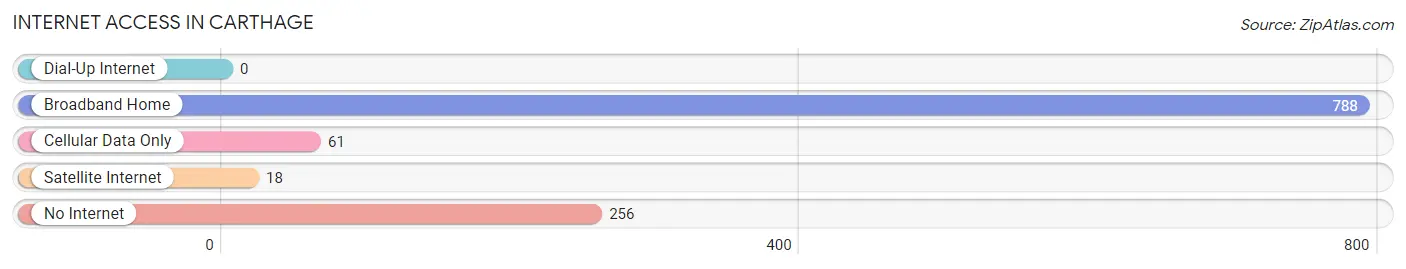
| Internet Type | # Households | % Households |
| Dial-Up Internet | 0 | 0.0% |
| Broadband Home | 788 | 70.1% |
| Cellular Data Only | 61 | 5.4% |
| Satellite Internet | 18 | 1.6% |
| No Internet | 256 | 22.8% |
| Total | 1,124 | 100.0% |
Carthage Summary
Carthage is a small town located in Moore County, North Carolina. It is situated in the Sandhills region of the state, about 25 miles south of Pinehurst and 30 miles west of Fayetteville. The town was founded in 1795 and is the county seat of Moore County. As of the 2010 census, the population of Carthage was 2,205.
Geography
Carthage is located at 35°22'N 79°30'W. It is situated in the Sandhills region of North Carolina, which is characterized by rolling hills and sandy soils. The town is located on the banks of the Deep River, which flows through the center of town. The town is surrounded by the towns of Robbins, Vass, Cameron, and Southern Pines.
The town has a total area of 2.2 square miles, all of which is land. The terrain is mostly flat, with some rolling hills. The climate is humid subtropical, with hot, humid summers and mild winters.
History
Carthage was founded in 1795 by a group of settlers from Scotland. The town was named after the ancient city of Carthage in Tunisia. The town was originally a trading post and was the first county seat of Moore County.
In the early 19th century, the town became a center for the production of cotton and tobacco. The town was also home to several mills, including a cotton mill, a grist mill, and a sawmill.
In the late 19th century, the town became a center for the production of furniture. The town was home to several furniture factories, including the Carthage Chair Company, which was founded in 1887.
In the early 20th century, the town became a center for the production of textiles. The town was home to several textile mills, including the Carthage Textile Company, which was founded in 1910.
Economy
The economy of Carthage is largely based on manufacturing. The town is home to several furniture factories, including the Carthage Chair Company, which produces chairs, tables, and other furniture. The town is also home to several textile mills, including the Carthage Textile Company, which produces fabrics and other textiles.
The town is also home to several retail stores, including a Walmart Supercenter, a Lowe's Home Improvement store, and several restaurants.
Demographics
As of the 2010 census, the population of Carthage was 2,205. The racial makeup of the town was 79.2% White, 16.2% African American, 0.7% Native American, 0.7% Asian, 0.1% Pacific Islander, 1.3% from other races, and 1.9% from two or more races. Hispanic or Latino of any race were 3.2% of the population.
The median income for a household in the town was $37,917, and the median income for a family was $45,938. The per capita income for the town was $19,945. About 15.2% of families and 18.2% of the population were below the poverty line, including 25.2% of those under age 18 and 11.2% of those age 65 or over.
Common Questions
What is Per Capita Income in Carthage?
Per Capita income in Carthage is $31,044.
What is the Median Family Income in Carthage?
Median Family Income in Carthage is $85,000.
What is the Median Household income in Carthage?
Median Household Income in Carthage is $55,469.
What is Income or Wage Gap in Carthage?
Income or Wage Gap in Carthage is 22.4%.
Women in Carthage earn 77.6 cents for every dollar earned by a man.
What is Inequality or Gini Index in Carthage?
Inequality or Gini Index in Carthage is 0.43.
What is the Total Population of Carthage?
Total Population of Carthage is 2,779.
What is the Total Male Population of Carthage?
Total Male Population of Carthage is 1,303.
What is the Total Female Population of Carthage?
Total Female Population of Carthage is 1,476.
What is the Ratio of Males per 100 Females in Carthage?
There are 88.28 Males per 100 Females in Carthage.
What is the Ratio of Females per 100 Males in Carthage?
There are 113.28 Females per 100 Males in Carthage.
What is the Median Population Age in Carthage?
Median Population Age in Carthage is 43.4 Years.
What is the Average Family Size in Carthage
Average Family Size in Carthage is 3.1 People.
What is the Average Household Size in Carthage
Average Household Size in Carthage is 2.4 People.
How Large is the Labor Force in Carthage?
There are 1,369 People in the Labor Forcein in Carthage.
What is the Percentage of People in the Labor Force in Carthage?
61.5% of People are in the Labor Force in Carthage.
What is the Unemployment Rate in Carthage?
Unemployment Rate in Carthage is 2.0%.