Caroleen, NC Map & Demographics
Caroleen Map
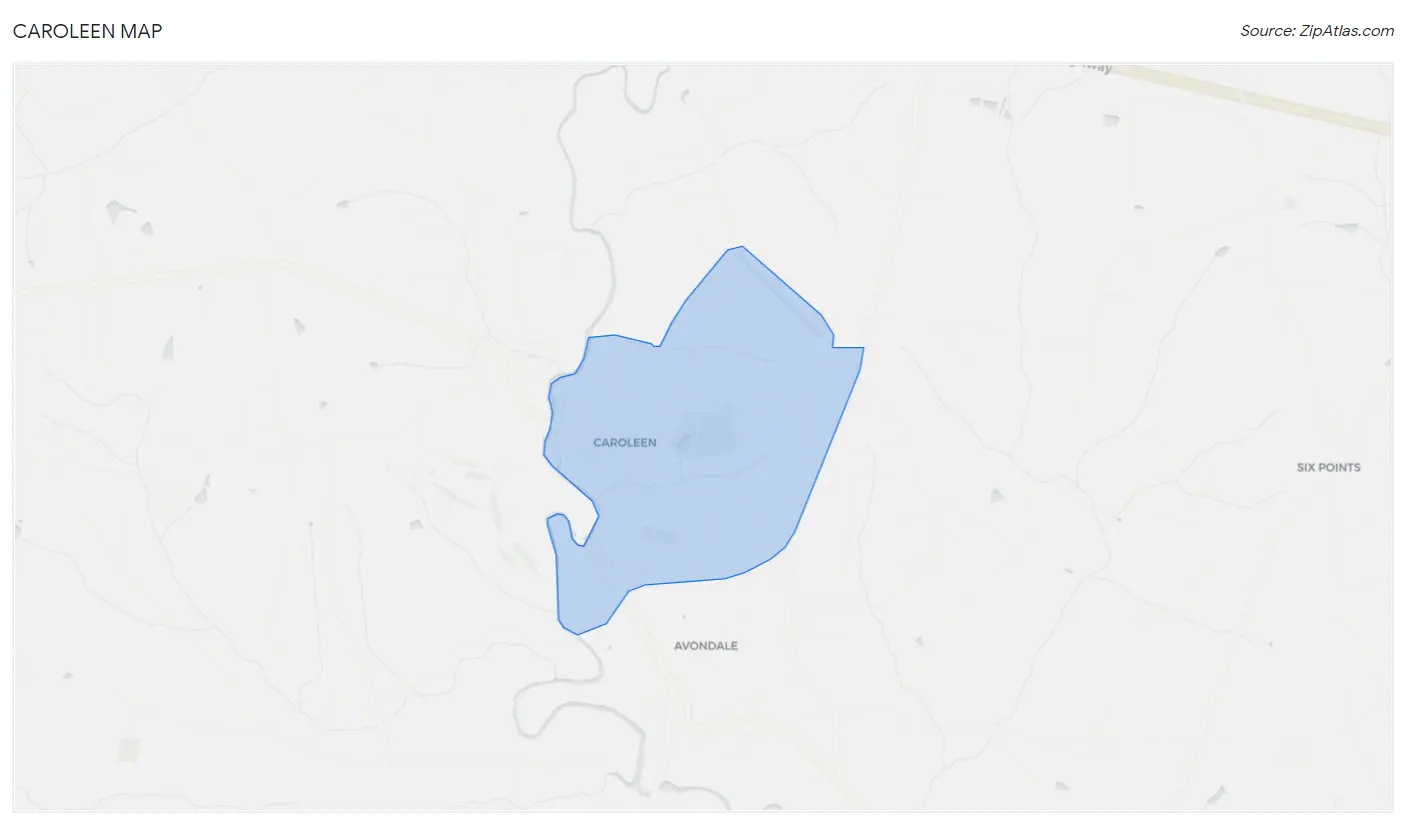
Caroleen Overview
$29,038
PER CAPITA INCOME
$73,721
AVG FAMILY INCOME
$73,198
AVG HOUSEHOLD INCOME
31.5%
WAGE / INCOME GAP [ % ]
68.5¢/ $1
WAGE / INCOME GAP [ $ ]
0.28
INEQUALITY / GINI INDEX
377
TOTAL POPULATION
150
MALE POPULATION
227
FEMALE POPULATION
66.08
MALES / 100 FEMALES
151.33
FEMALES / 100 MALES
53.5
MEDIAN AGE
3.0
AVG FAMILY SIZE
2.4
AVG HOUSEHOLD SIZE
183
LABOR FORCE [ PEOPLE ]
51.0%
PERCENT IN LABOR FORCE
Caroleen Area Codes
Income in Caroleen
Income Overview in Caroleen
Per Capita Income in Caroleen is $29,038, while median incomes of families and households are $73,721 and $73,198 respectively.
| Characteristic | Number | Measure |
| Per Capita Income | 377 | $29,038 |
| Median Family Income | 100 | $73,721 |
| Mean Family Income | 100 | $69,607 |
| Median Household Income | 160 | $73,198 |
| Mean Household Income | 160 | $61,902 |
| Income Deficit | 100 | $0 |
| Wage / Income Gap (%) | 377 | 31.49% |
| Wage / Income Gap ($) | 377 | 68.51¢ per $1 |
| Gini / Inequality Index | 377 | 0.28 |
Earnings by Sex in Caroleen
Average Earnings in Caroleen are $35,679, $36,854 for men and $25,250 for women, a difference of 31.5%.
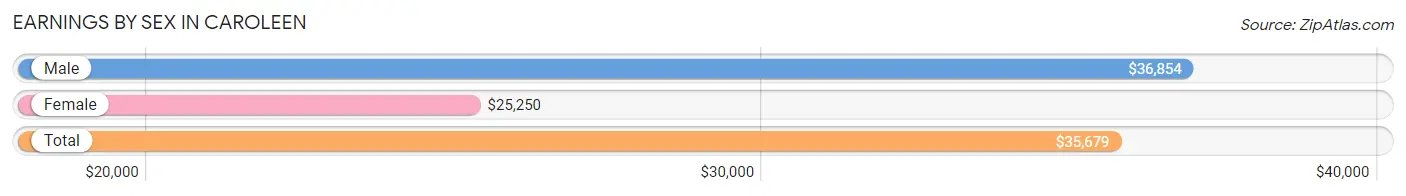
| Sex | Number | Average Earnings |
| Male | 89 (43.6%) | $36,854 |
| Female | 115 (56.4%) | $25,250 |
| Total | 204 (100.0%) | $35,679 |
Earnings by Sex by Income Bracket in Caroleen
The most common earnings brackets in Caroleen are $35,000 to $39,999 for men (60 | 67.4%) and $22,500 to $24,999 for women (55 | 47.8%).
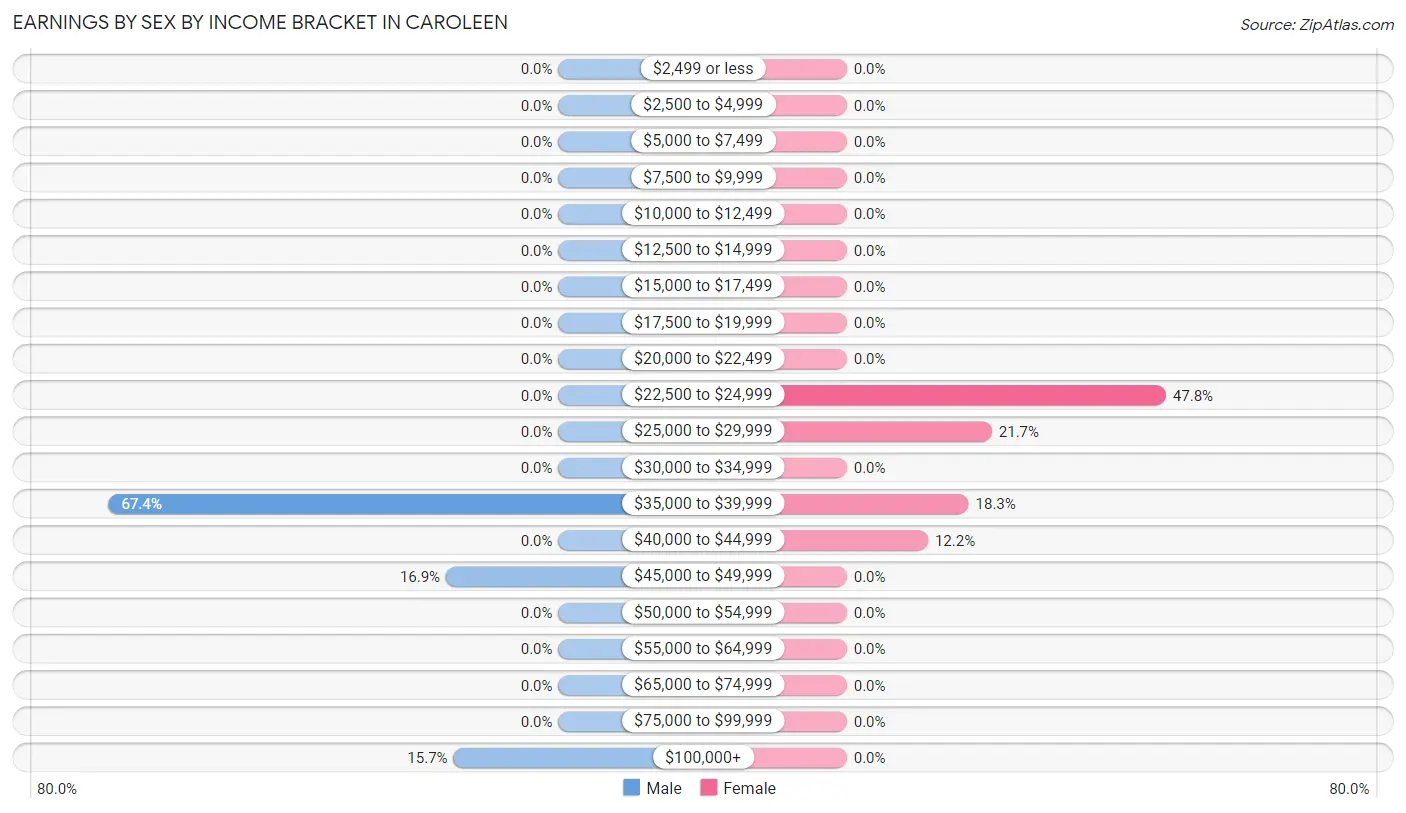
| Income | Male | Female |
| $2,499 or less | 0 (0.0%) | 0 (0.0%) |
| $2,500 to $4,999 | 0 (0.0%) | 0 (0.0%) |
| $5,000 to $7,499 | 0 (0.0%) | 0 (0.0%) |
| $7,500 to $9,999 | 0 (0.0%) | 0 (0.0%) |
| $10,000 to $12,499 | 0 (0.0%) | 0 (0.0%) |
| $12,500 to $14,999 | 0 (0.0%) | 0 (0.0%) |
| $15,000 to $17,499 | 0 (0.0%) | 0 (0.0%) |
| $17,500 to $19,999 | 0 (0.0%) | 0 (0.0%) |
| $20,000 to $22,499 | 0 (0.0%) | 0 (0.0%) |
| $22,500 to $24,999 | 0 (0.0%) | 55 (47.8%) |
| $25,000 to $29,999 | 0 (0.0%) | 25 (21.7%) |
| $30,000 to $34,999 | 0 (0.0%) | 0 (0.0%) |
| $35,000 to $39,999 | 60 (67.4%) | 21 (18.3%) |
| $40,000 to $44,999 | 0 (0.0%) | 14 (12.2%) |
| $45,000 to $49,999 | 15 (16.9%) | 0 (0.0%) |
| $50,000 to $54,999 | 0 (0.0%) | 0 (0.0%) |
| $55,000 to $64,999 | 0 (0.0%) | 0 (0.0%) |
| $65,000 to $74,999 | 0 (0.0%) | 0 (0.0%) |
| $75,000 to $99,999 | 0 (0.0%) | 0 (0.0%) |
| $100,000+ | 14 (15.7%) | 0 (0.0%) |
| Total | 89 (100.0%) | 115 (100.0%) |
Earnings by Sex by Educational Attainment in Caroleen
| Educational Attainment | Male Income | Female Income |
| Less than High School | - | - |
| High School Diploma | - | - |
| College or Associate's Degree | - | - |
| Bachelor's Degree | - | - |
| Graduate Degree | - | - |
| Total | $36,854 | $25,250 |
Family Income in Caroleen
Family Income Brackets in Caroleen
According to the Caroleen family income data, there are 43 families falling into the $50,000 to $74,999 income range, which is the most common income bracket and makes up 43.0% of all families.
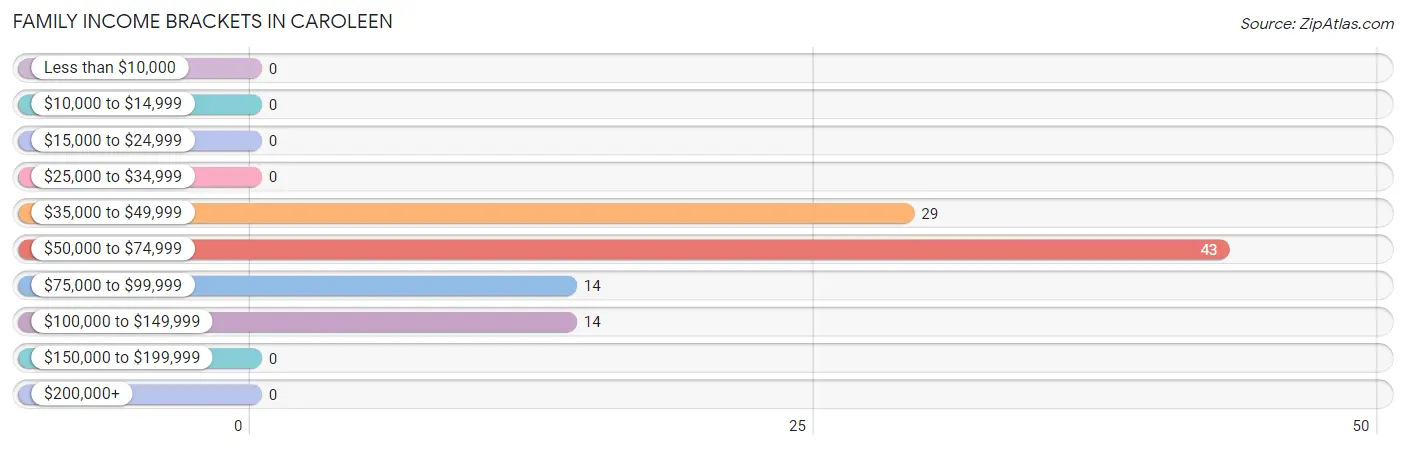
| Income Bracket | # Families | % Families |
| Less than $10,000 | 0 | 0.0% |
| $10,000 to $14,999 | 0 | 0.0% |
| $15,000 to $24,999 | 0 | 0.0% |
| $25,000 to $34,999 | 0 | 0.0% |
| $35,000 to $49,999 | 29 | 29.0% |
| $50,000 to $74,999 | 43 | 43.0% |
| $75,000 to $99,999 | 14 | 14.0% |
| $100,000 to $149,999 | 14 | 14.0% |
| $150,000 to $199,999 | 0 | 0.0% |
| $200,000+ | 0 | 0.0% |
Family Income by Famaliy Size in Caroleen
| Income Bracket | # Families | Median Income |
| 2-Person Families | 43 (43.0%) | $0 |
| 3-Person Families | 57 (57.0%) | $0 |
| 4-Person Families | 0 (0.0%) | $0 |
| 5-Person Families | 0 (0.0%) | $0 |
| 6-Person Families | 0 (0.0%) | $0 |
| 7+ Person Families | 0 (0.0%) | $0 |
| Total | 100 (100.0%) | $73,721 |
Family Income by Number of Earners in Caroleen
| Number of Earners | # Families | Median Income |
| No Earners | 29 (29.0%) | $0 |
| 1 Earner | 14 (14.0%) | $0 |
| 2 Earners | 57 (57.0%) | $0 |
| 3+ Earners | 0 (0.0%) | $0 |
| Total | 100 (100.0%) | $73,721 |
Household Income in Caroleen
Household Income Brackets in Caroleen
With 43 households falling in the category, the $50,000 to $74,999 income range is the most frequent in Caroleen, accounting for 26.9% of all households.
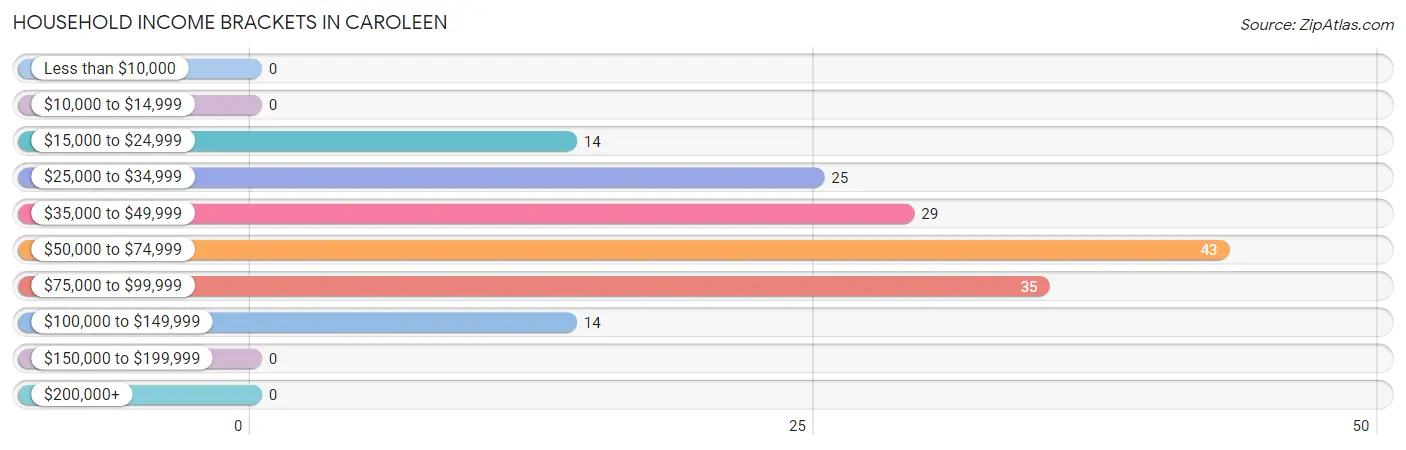
| Income Bracket | # Households | % Households |
| Less than $10,000 | 0 | 0.0% |
| $10,000 to $14,999 | 0 | 0.0% |
| $15,000 to $24,999 | 14 | 8.8% |
| $25,000 to $34,999 | 25 | 15.6% |
| $35,000 to $49,999 | 29 | 18.1% |
| $50,000 to $74,999 | 43 | 26.9% |
| $75,000 to $99,999 | 35 | 21.9% |
| $100,000 to $149,999 | 14 | 8.8% |
| $150,000 to $199,999 | 0 | 0.0% |
| $200,000+ | 0 | 0.0% |
Household Income by Householder Age in Caroleen
The median household income in Caroleen is $73,198, with the highest median household income of $89,643 found in the 45 to 64 years age bracket for the primary householder. A total of 74 households (46.3%) fall into this category.
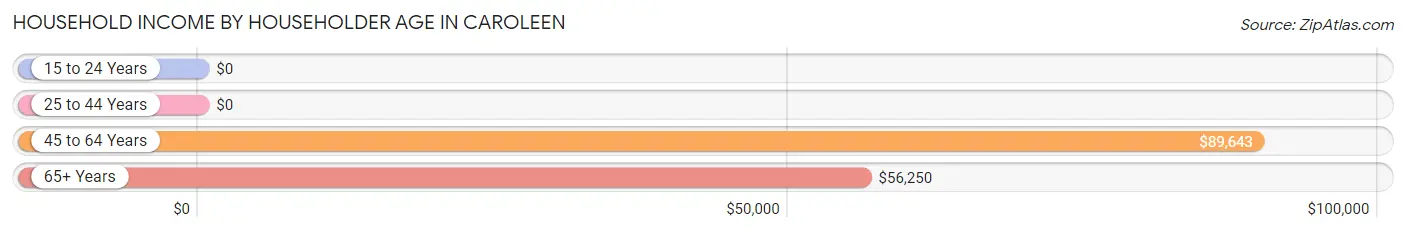
| Income Bracket | # Households | Median Income |
| 15 to 24 Years | 0 (0.0%) | $0 |
| 25 to 44 Years | 0 (0.0%) | $0 |
| 45 to 64 Years | 74 (46.3%) | $89,643 |
| 65+ Years | 86 (53.7%) | $56,250 |
| Total | 160 (100.0%) | $73,198 |
Poverty in Caroleen
Income Below Poverty by Sex and Age in Caroleen
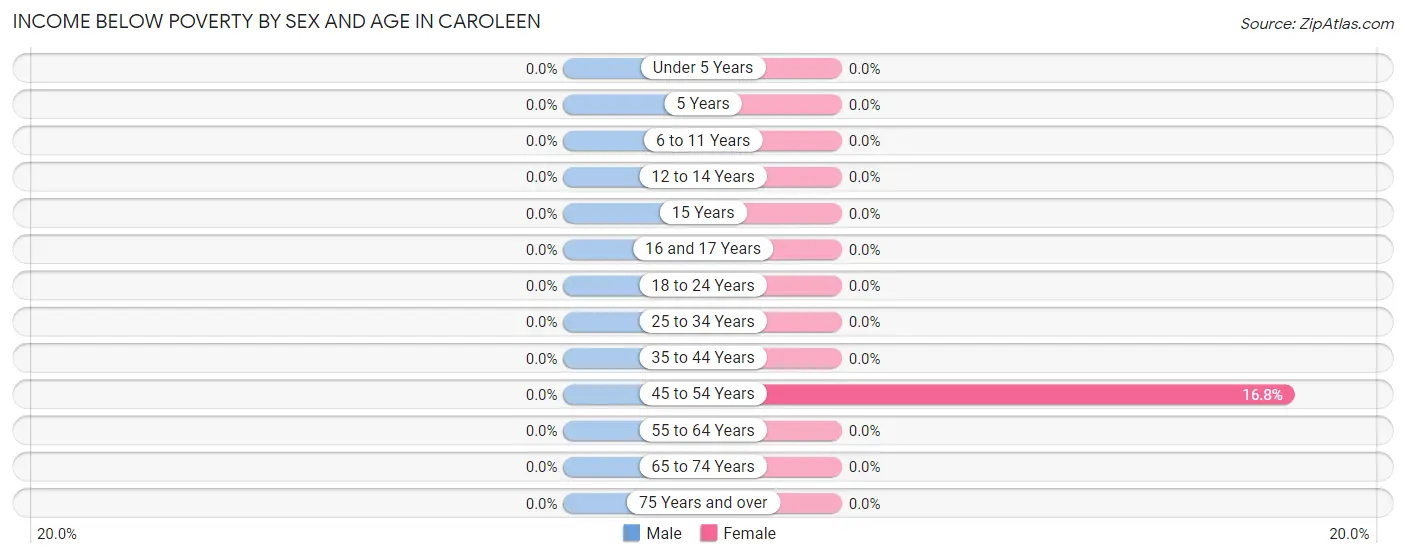
| Age Bracket | Male | Female |
| Under 5 Years | 0 (0.0%) | 0 (0.0%) |
| 5 Years | 0 (0.0%) | 0 (0.0%) |
| 6 to 11 Years | 0 (0.0%) | 0 (0.0%) |
| 12 to 14 Years | 0 (0.0%) | 0 (0.0%) |
| 15 Years | 0 (0.0%) | 0 (0.0%) |
| 16 and 17 Years | 0 (0.0%) | 0 (0.0%) |
| 18 to 24 Years | 0 (0.0%) | 0 (0.0%) |
| 25 to 34 Years | 0 (0.0%) | 0 (0.0%) |
| 35 to 44 Years | 0 (0.0%) | 0 (0.0%) |
| 45 to 54 Years | 0 (0.0%) | 19 (16.8%) |
| 55 to 64 Years | 0 (0.0%) | 0 (0.0%) |
| 65 to 74 Years | 0 (0.0%) | 0 (0.0%) |
| 75 Years and over | 0 (0.0%) | 0 (0.0%) |
| Total | 0 (0.0%) | 19 (8.4%) |
Income Above Poverty by Sex and Age in Caroleen
According to the poverty statistics in Caroleen, males aged 12 to 14 years and females aged 18 to 24 years are the age groups that are most secure financially, with 100.0% of males and 100.0% of females in these age groups living above the poverty line.
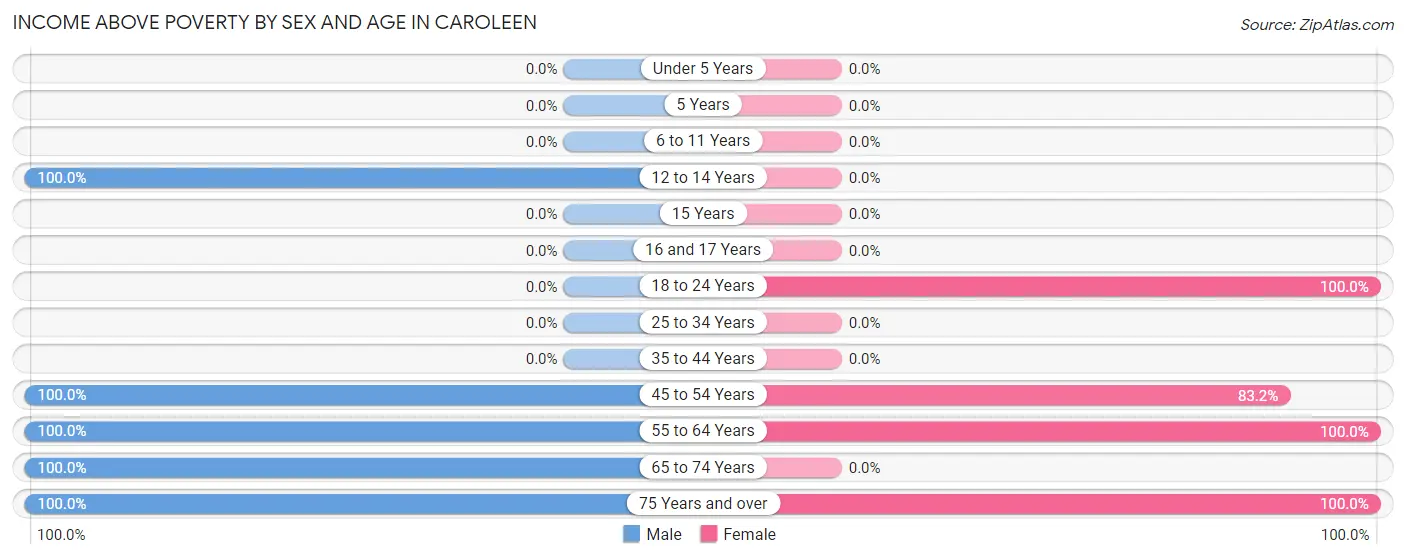
| Age Bracket | Male | Female |
| Under 5 Years | 0 (0.0%) | 0 (0.0%) |
| 5 Years | 0 (0.0%) | 0 (0.0%) |
| 6 to 11 Years | 0 (0.0%) | 0 (0.0%) |
| 12 to 14 Years | 18 (100.0%) | 0 (0.0%) |
| 15 Years | 0 (0.0%) | 0 (0.0%) |
| 16 and 17 Years | 0 (0.0%) | 0 (0.0%) |
| 18 to 24 Years | 0 (0.0%) | 16 (100.0%) |
| 25 to 34 Years | 0 (0.0%) | 0 (0.0%) |
| 35 to 44 Years | 0 (0.0%) | 0 (0.0%) |
| 45 to 54 Years | 75 (100.0%) | 94 (83.2%) |
| 55 to 64 Years | 14 (100.0%) | 55 (100.0%) |
| 65 to 74 Years | 14 (100.0%) | 0 (0.0%) |
| 75 Years and over | 29 (100.0%) | 43 (100.0%) |
| Total | 150 (100.0%) | 208 (91.6%) |
Income Below Poverty Among Married-Couple Families in Caroleen
| Children | Above Poverty | Below Poverty |
| No Children | 43 (100.0%) | 0 (0.0%) |
| 1 or 2 Children | 0 (0.0%) | 0 (0.0%) |
| 3 or 4 Children | 0 (0.0%) | 0 (0.0%) |
| 5 or more Children | 0 (0.0%) | 0 (0.0%) |
| Total | 43 (100.0%) | 0 (0.0%) |
Income Below Poverty Among Single-Parent Households in Caroleen
| Children | Single Father | Single Mother |
| No Children | 0 (0.0%) | 0 (0.0%) |
| 1 or 2 Children | 0 (0.0%) | 0 (0.0%) |
| 3 or 4 Children | 0 (0.0%) | 0 (0.0%) |
| 5 or more Children | 0 (0.0%) | 0 (0.0%) |
| Total | 0 (0.0%) | 0 (0.0%) |
Income Below Poverty Among Married-Couple vs Single-Parent Households in Caroleen
| Children | Married-Couple Families | Single-Parent Households |
| No Children | 0 (0.0%) | 0 (0.0%) |
| 1 or 2 Children | 0 (0.0%) | 0 (0.0%) |
| 3 or 4 Children | 0 (0.0%) | 0 (0.0%) |
| 5 or more Children | 0 (0.0%) | 0 (0.0%) |
| Total | 0 (0.0%) | 0 (0.0%) |
Race in Caroleen
The most populous races in Caroleen are White / Caucasian (314 | 83.3%), and Black / African American (63 | 16.7%).
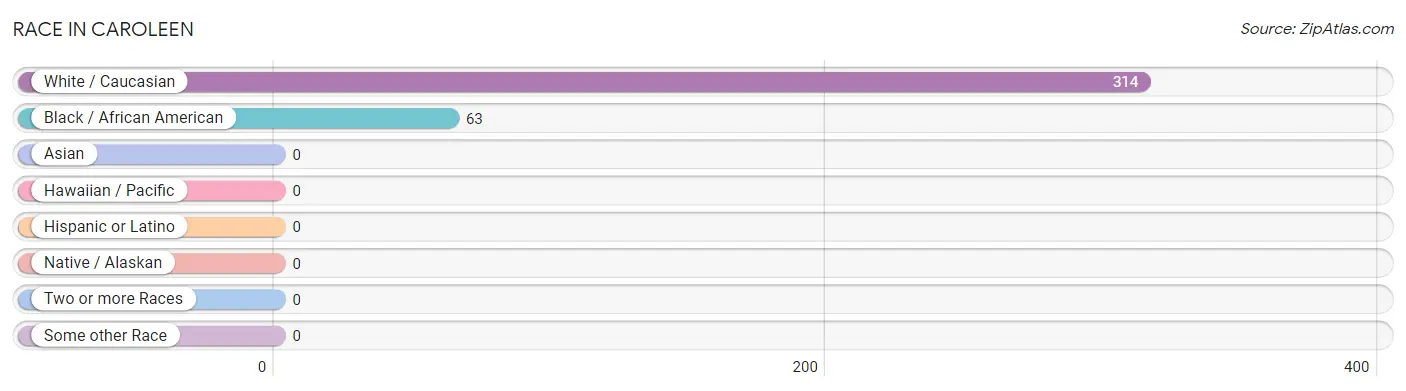
| Race | # Population | % Population |
| Asian | 0 | 0.0% |
| Black / African American | 63 | 16.7% |
| Hawaiian / Pacific | 0 | 0.0% |
| Hispanic or Latino | 0 | 0.0% |
| Native / Alaskan | 0 | 0.0% |
| White / Caucasian | 314 | 83.3% |
| Two or more Races | 0 | 0.0% |
| Some other Race | 0 | 0.0% |
| Total | 377 | 100.0% |
Ancestry in Caroleen
The most populous ancestries reported in Caroleen are English (98 | 26.0%), and American (25 | 6.6%), together accounting for 32.6% of all Caroleen residents.
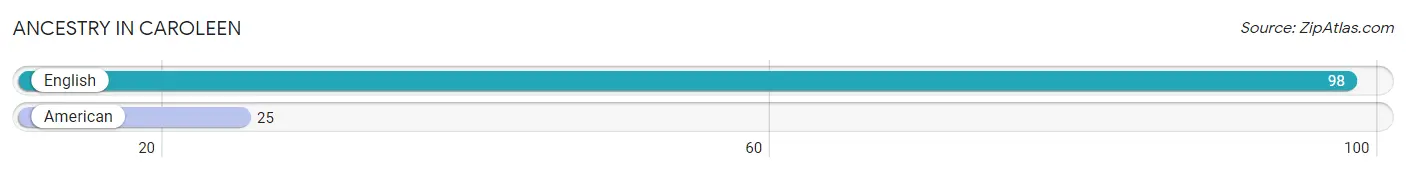
| Ancestry | # Population | % Population |
| American | 25 | 6.6% |
| English | 98 | 26.0% | View All 2 Rows |
Immigrants in Caroleen

| Immigration Origin | # Population | % Population | View All 0 Rows |
Sex and Age in Caroleen
Sex and Age in Caroleen
The most populous age groups in Caroleen are 50 to 54 Years (75 | 50.0%) for men and 50 to 54 Years (94 | 41.4%) for women.
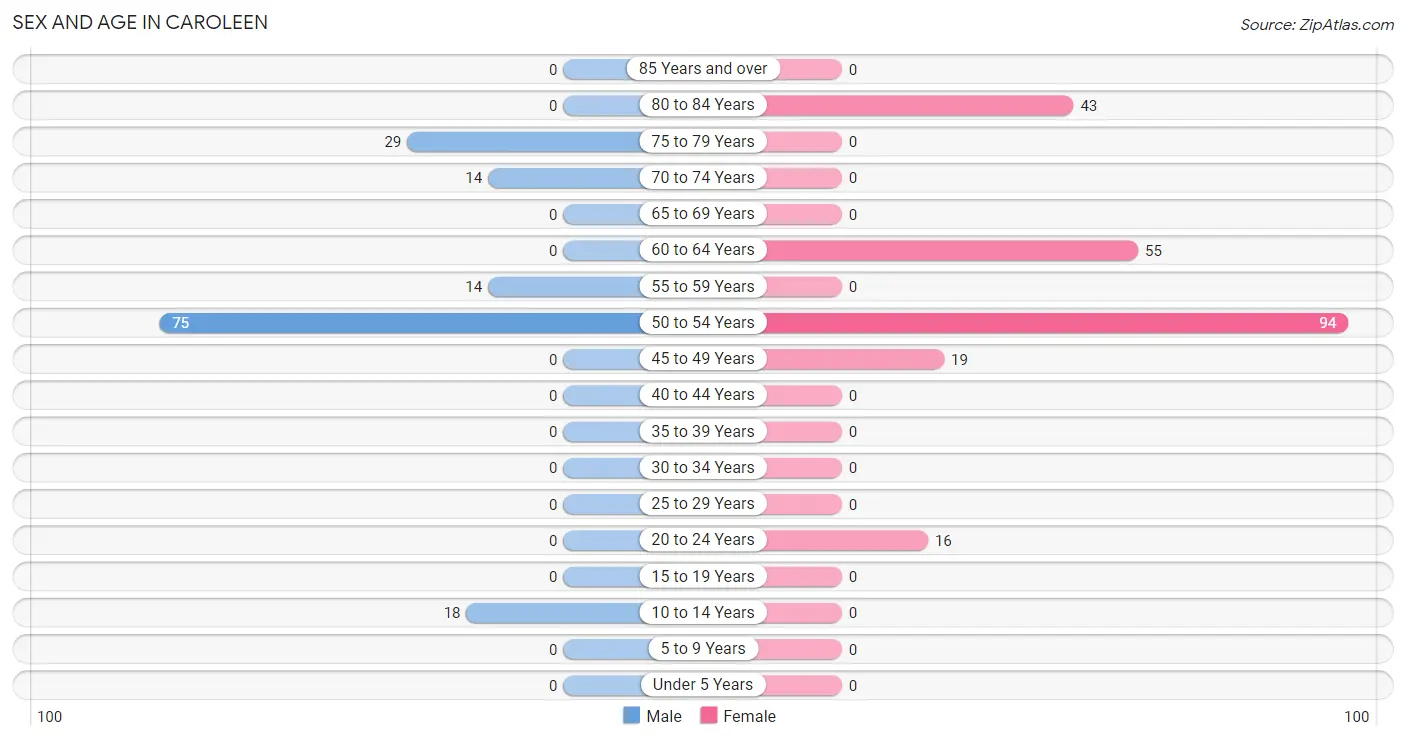
| Age Bracket | Male | Female |
| Under 5 Years | 0 (0.0%) | 0 (0.0%) |
| 5 to 9 Years | 0 (0.0%) | 0 (0.0%) |
| 10 to 14 Years | 18 (12.0%) | 0 (0.0%) |
| 15 to 19 Years | 0 (0.0%) | 0 (0.0%) |
| 20 to 24 Years | 0 (0.0%) | 16 (7.0%) |
| 25 to 29 Years | 0 (0.0%) | 0 (0.0%) |
| 30 to 34 Years | 0 (0.0%) | 0 (0.0%) |
| 35 to 39 Years | 0 (0.0%) | 0 (0.0%) |
| 40 to 44 Years | 0 (0.0%) | 0 (0.0%) |
| 45 to 49 Years | 0 (0.0%) | 19 (8.4%) |
| 50 to 54 Years | 75 (50.0%) | 94 (41.4%) |
| 55 to 59 Years | 14 (9.3%) | 0 (0.0%) |
| 60 to 64 Years | 0 (0.0%) | 55 (24.2%) |
| 65 to 69 Years | 0 (0.0%) | 0 (0.0%) |
| 70 to 74 Years | 14 (9.3%) | 0 (0.0%) |
| 75 to 79 Years | 29 (19.3%) | 0 (0.0%) |
| 80 to 84 Years | 0 (0.0%) | 43 (18.9%) |
| 85 Years and over | 0 (0.0%) | 0 (0.0%) |
| Total | 150 (100.0%) | 227 (100.0%) |
Families and Households in Caroleen
Median Family Size in Caroleen
The median family size in Caroleen is 2.98 persons per family, with single female/mother families (43 | 43.0%) accounting for the largest median family size of 3.67 persons per family. On the other hand, single male/father families (14 | 14.0%) represent the smallest median family size with 2.29 persons per family.
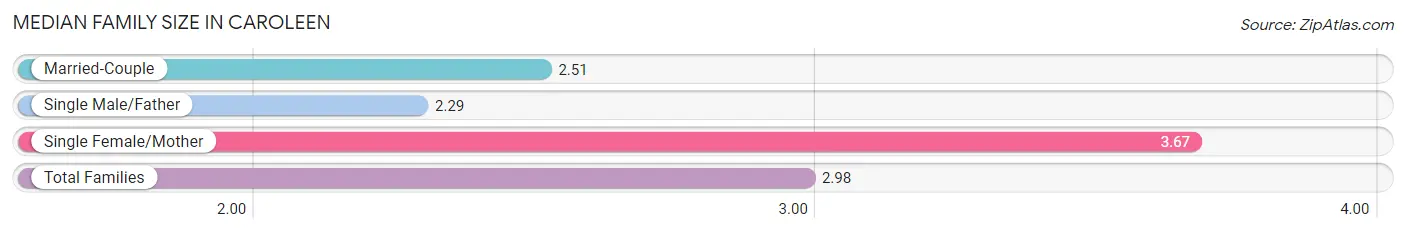
| Family Type | # Families | Family Size |
| Married-Couple | 43 (43.0%) | 2.51 |
| Single Male/Father | 14 (14.0%) | 2.29 |
| Single Female/Mother | 43 (43.0%) | 3.67 |
| Total Families | 100 (100.0%) | 2.98 |
Median Household Size in Caroleen
The median household size in Caroleen is 2.36 persons per household, with single female/mother households (43 | 26.9%) accounting for the largest median household size of 3.67 persons per household. non-family households (60 | 37.5%) represent the smallest median household size with 1.32 persons per household.
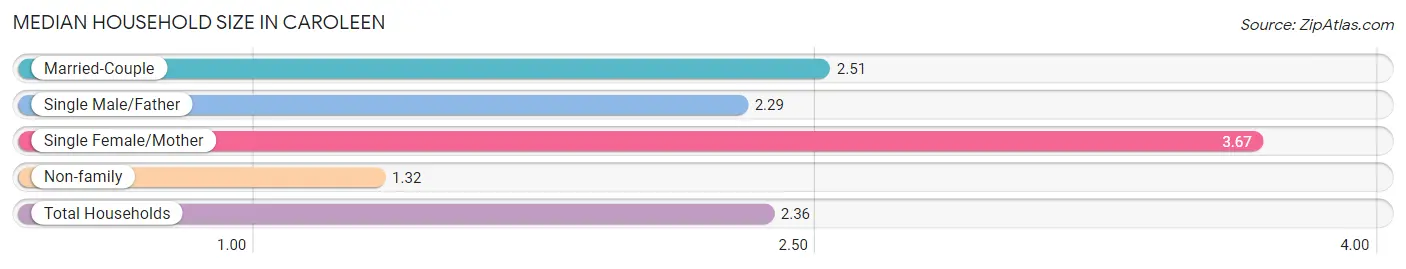
| Household Type | # Households | Household Size |
| Married-Couple | 43 (26.9%) | 2.51 |
| Single Male/Father | 14 (8.7%) | 2.29 |
| Single Female/Mother | 43 (26.9%) | 3.67 |
| Non-family | 60 (37.5%) | 1.32 |
| Total Households | 160 (100.0%) | 2.36 |
Household Size by Marriage Status in Caroleen
Out of a total of 160 households in Caroleen, 100 (62.5%) are family households, while 60 (37.5%) are nonfamily households. The most numerous type of family households are 3-person households, comprising 57, and the most common type of nonfamily households are 1-person households, comprising 46.
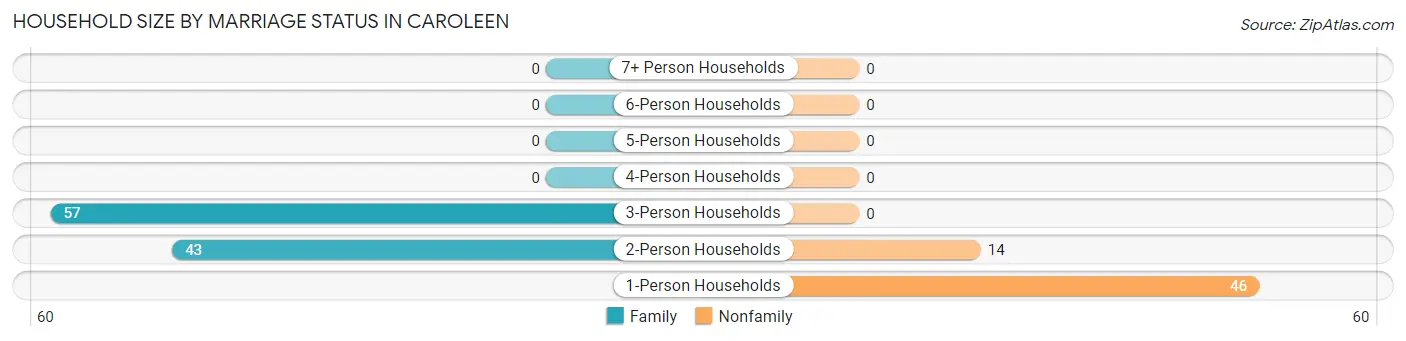
| Household Size | Family Households | Nonfamily Households |
| 1-Person Households | - | 46 (28.7%) |
| 2-Person Households | 43 (26.9%) | 14 (8.7%) |
| 3-Person Households | 57 (35.6%) | 0 (0.0%) |
| 4-Person Households | 0 (0.0%) | 0 (0.0%) |
| 5-Person Households | 0 (0.0%) | 0 (0.0%) |
| 6-Person Households | 0 (0.0%) | 0 (0.0%) |
| 7+ Person Households | 0 (0.0%) | 0 (0.0%) |
| Total | 100 (62.5%) | 60 (37.5%) |
Female Fertility in Caroleen
Fertility by Age in Caroleen
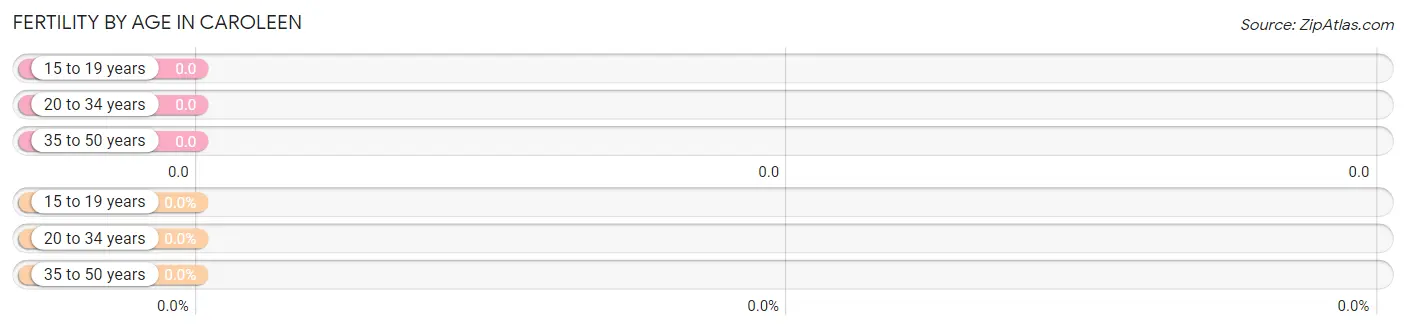
| Age Bracket | Women with Births | Births / 1,000 Women |
| 15 to 19 years | 0 (0.0%) | 0.0 |
| 20 to 34 years | 0 (0.0%) | 0.0 |
| 35 to 50 years | 0 (0.0%) | 0.0 |
| Total | 0 (0.0%) | 0.0 |
Fertility by Age by Marriage Status in Caroleen
| Age Bracket | Married | Unmarried |
| 15 to 19 years | 0 (0.0%) | 0 (0.0%) |
| 20 to 34 years | 0 (0.0%) | 0 (0.0%) |
| 35 to 50 years | 0 (0.0%) | 0 (0.0%) |
| Total | 0 (0.0%) | 0 (0.0%) |
Fertility by Education in Caroleen
| Educational Attainment | Women with Births | Births / 1,000 Women |
| Less than High School | 0 (0.0%) | 0.0 |
| High School Diploma | 0 (0.0%) | 0.0 |
| College or Associate's Degree | 0 (0.0%) | 0.0 |
| Bachelor's Degree | 0 (0.0%) | 0.0 |
| Graduate Degree | 0 (0.0%) | 0.0 |
| Total | 0 (0.0%) | 0.0 |
Fertility by Education by Marriage Status in Caroleen
| Educational Attainment | Married | Unmarried |
| Less than High School | 0 (0.0%) | 0 (0.0%) |
| High School Diploma | 0 (0.0%) | 0 (0.0%) |
| College or Associate's Degree | 0 (0.0%) | 0 (0.0%) |
| Bachelor's Degree | 0 (0.0%) | 0 (0.0%) |
| Graduate Degree | 0 (0.0%) | 0 (0.0%) |
| Total | 0 (0.0%) | 0 (0.0%) |
Employment Characteristics in Caroleen
Employment by Class of Employer in Caroleen
Among the 183 employed individuals in Caroleen, private company employees (114 | 62.3%), and not-for-profit organizations (69 | 37.7%) make up the most common classes of employment.
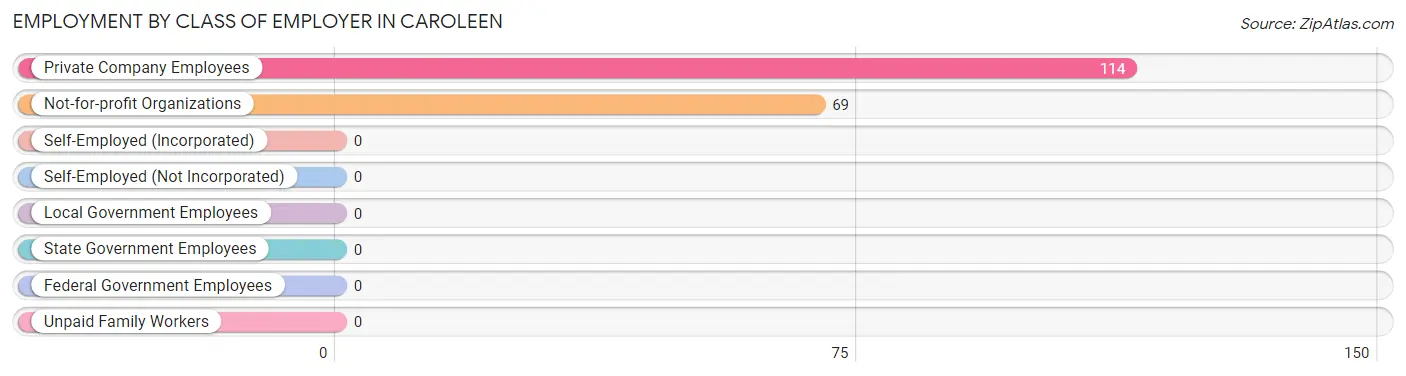
| Employer Class | # Employees | % Employees |
| Private Company Employees | 114 | 62.3% |
| Self-Employed (Incorporated) | 0 | 0.0% |
| Self-Employed (Not Incorporated) | 0 | 0.0% |
| Not-for-profit Organizations | 69 | 37.7% |
| Local Government Employees | 0 | 0.0% |
| State Government Employees | 0 | 0.0% |
| Federal Government Employees | 0 | 0.0% |
| Unpaid Family Workers | 0 | 0.0% |
| Total | 183 | 100.0% |
Employment Status by Age in Caroleen
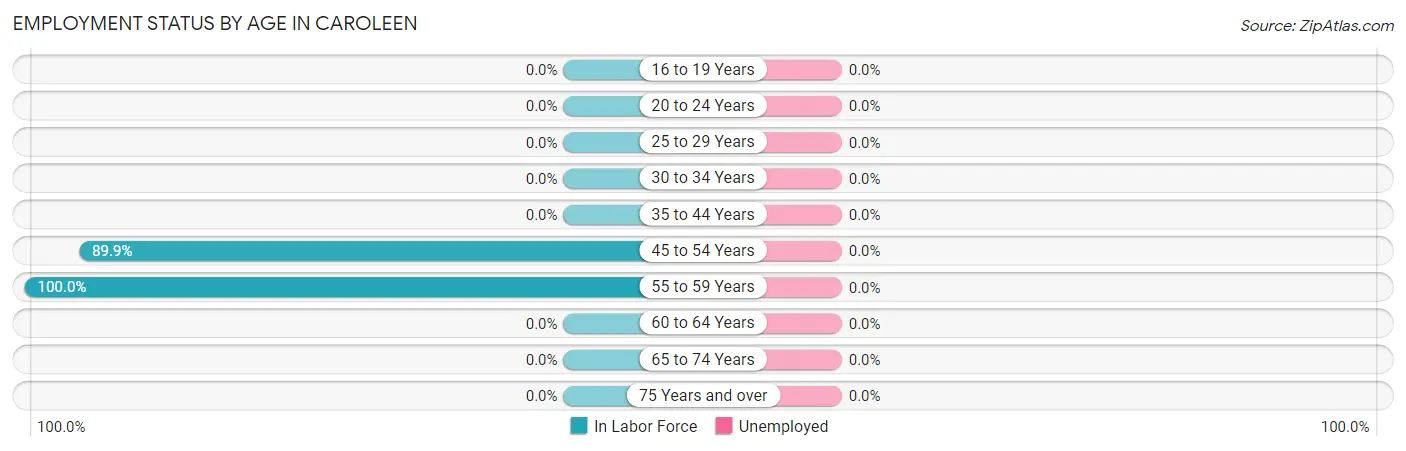
| Age Bracket | In Labor Force | Unemployed |
| 16 to 19 Years | 0 (0.0%) | 0 (0.0%) |
| 20 to 24 Years | 0 (0.0%) | 0 (0.0%) |
| 25 to 29 Years | 0 (0.0%) | 0 (0.0%) |
| 30 to 34 Years | 0 (0.0%) | 0 (0.0%) |
| 35 to 44 Years | 0 (0.0%) | 0 (0.0%) |
| 45 to 54 Years | 169 (89.9%) | 0 (0.0%) |
| 55 to 59 Years | 14 (100.0%) | 0 (0.0%) |
| 60 to 64 Years | 0 (0.0%) | 0 (0.0%) |
| 65 to 74 Years | 0 (0.0%) | 0 (0.0%) |
| 75 Years and over | 0 (0.0%) | 0 (0.0%) |
| Total | 183 (51.0%) | 0 (0.0%) |
Employment Status by Educational Attainment in Caroleen
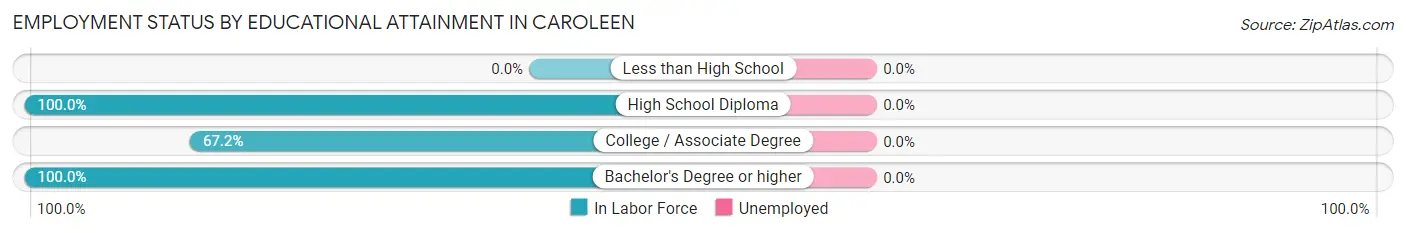
| Educational Attainment | In Labor Force | Unemployed |
| Less than High School | 0 (0.0%) | 0 (0.0%) |
| High School Diploma | 85 (100.0%) | 0 (0.0%) |
| College / Associate Degree | 43 (67.2%) | 0 (0.0%) |
| Bachelor's Degree or higher | 55 (100.0%) | 0 (0.0%) |
| Total | 183 (71.2%) | 0 (0.0%) |
Employment Occupations by Sex in Caroleen
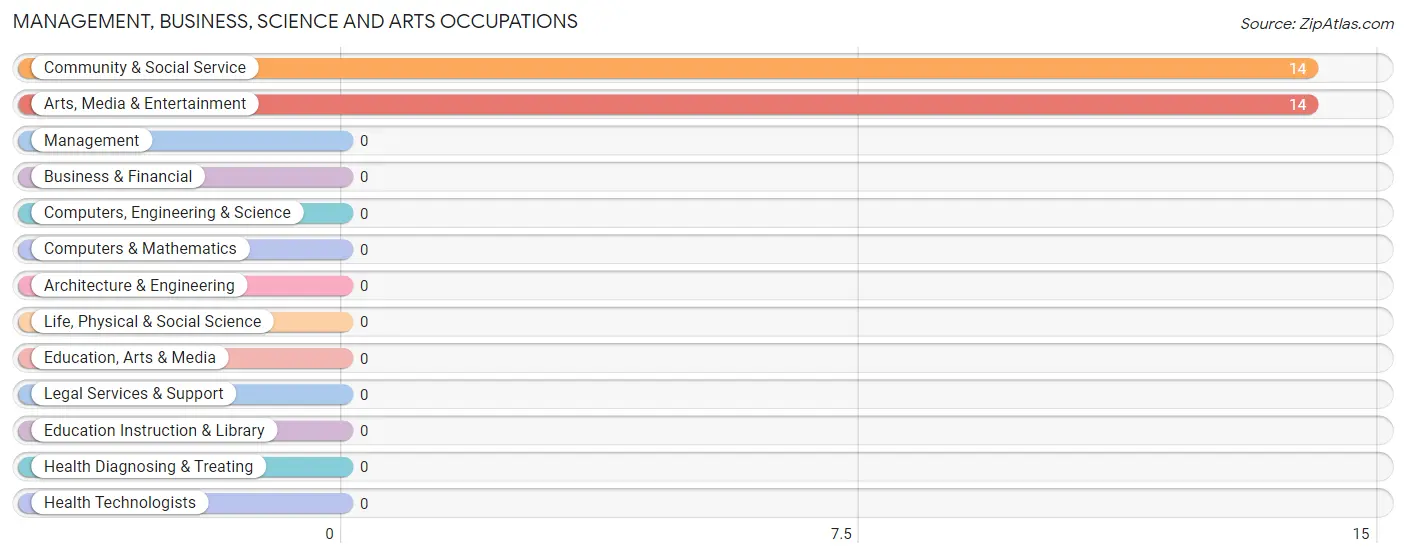
Management, Business, Science and Arts Occupations
The most common Management, Business, Science and Arts occupations in Caroleen are Community & Social Service (14 | 7.6%), and Arts, Media & Entertainment (14 | 7.6%).
Management, Business, Science and Arts Occupations by Sex
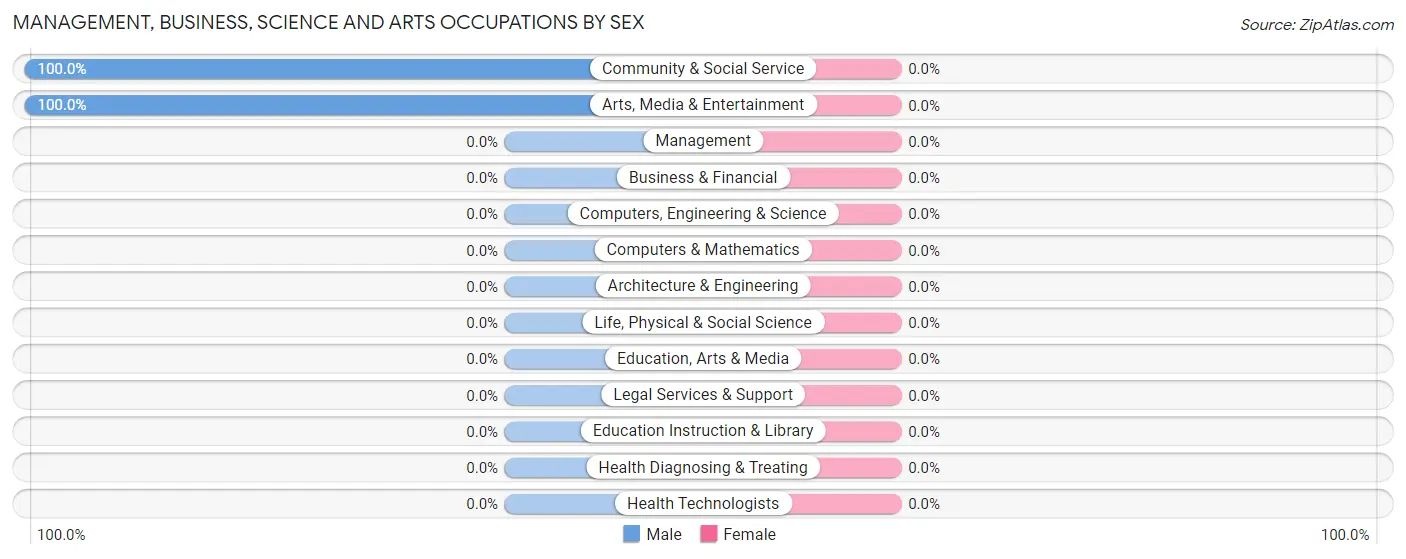
| Occupation | Male | Female |
| Management | 0 (0.0%) | 0 (0.0%) |
| Business & Financial | 0 (0.0%) | 0 (0.0%) |
| Computers, Engineering & Science | 0 (0.0%) | 0 (0.0%) |
| Computers & Mathematics | 0 (0.0%) | 0 (0.0%) |
| Architecture & Engineering | 0 (0.0%) | 0 (0.0%) |
| Life, Physical & Social Science | 0 (0.0%) | 0 (0.0%) |
| Community & Social Service | 14 (100.0%) | 0 (0.0%) |
| Education, Arts & Media | 0 (0.0%) | 0 (0.0%) |
| Legal Services & Support | 0 (0.0%) | 0 (0.0%) |
| Education Instruction & Library | 0 (0.0%) | 0 (0.0%) |
| Arts, Media & Entertainment | 14 (100.0%) | 0 (0.0%) |
| Health Diagnosing & Treating | 0 (0.0%) | 0 (0.0%) |
| Health Technologists | 0 (0.0%) | 0 (0.0%) |
| Total (Category) | 14 (100.0%) | 0 (0.0%) |
| Total (Overall) | 89 (48.6%) | 94 (51.4%) |
Services Occupations
Services Occupations by Sex
| Occupation | Male | Female |
| Healthcare Support | 0 (0.0%) | 0 (0.0%) |
| Security & Protection | 0 (0.0%) | 0 (0.0%) |
| Firefighting & Prevention | 0 (0.0%) | 0 (0.0%) |
| Law Enforcement | 0 (0.0%) | 0 (0.0%) |
| Food Preparation & Serving | 0 (0.0%) | 0 (0.0%) |
| Cleaning & Maintenance | 0 (0.0%) | 0 (0.0%) |
| Personal Care & Service | 0 (0.0%) | 0 (0.0%) |
| Total (Category) | 0 (0.0%) | 0 (0.0%) |
| Total (Overall) | 89 (48.6%) | 94 (51.4%) |
Sales and Office Occupations
The most common Sales and Office occupations in Caroleen are , and Office & Administration (84 | 45.9%).
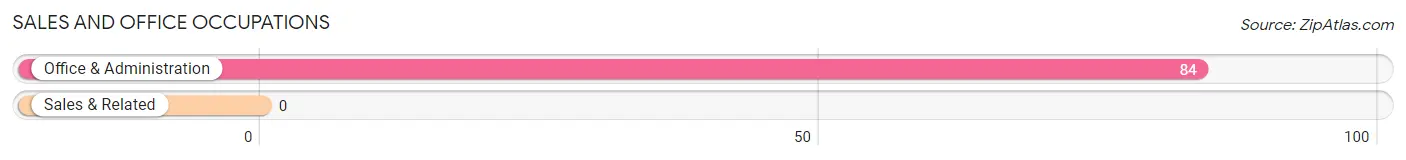
Sales and Office Occupations by Sex
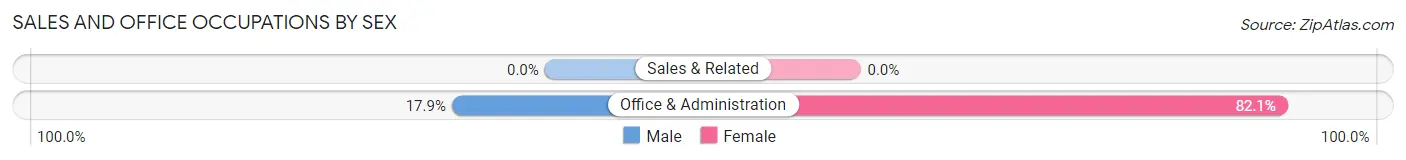
| Occupation | Male | Female |
| Sales & Related | 0 (0.0%) | 0 (0.0%) |
| Office & Administration | 15 (17.9%) | 69 (82.1%) |
| Total (Category) | 15 (17.9%) | 69 (82.1%) |
| Total (Overall) | 89 (48.6%) | 94 (51.4%) |
Natural Resources, Construction and Maintenance Occupations
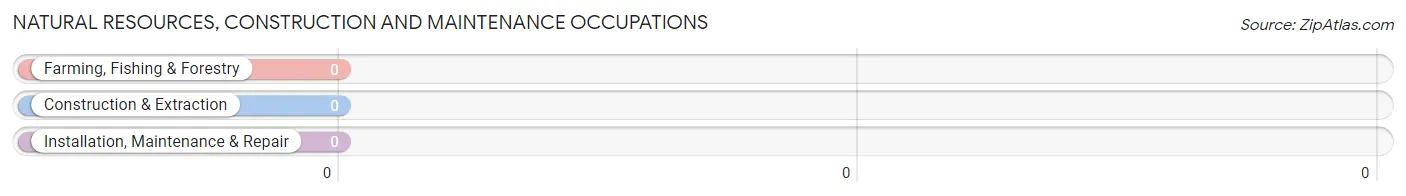
Natural Resources, Construction and Maintenance Occupations by Sex
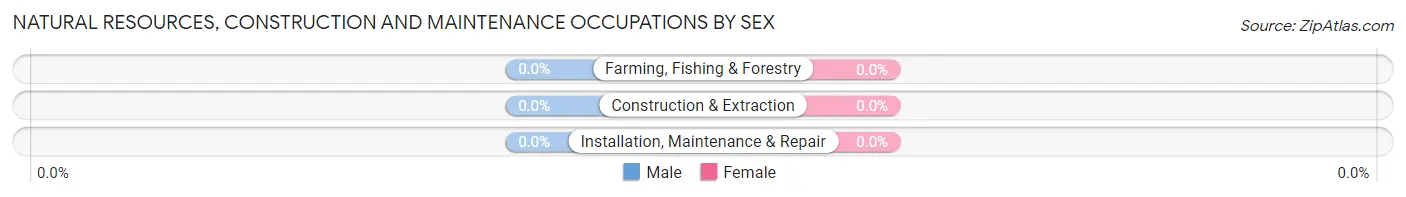
| Occupation | Male | Female |
| Farming, Fishing & Forestry | 0 (0.0%) | 0 (0.0%) |
| Construction & Extraction | 0 (0.0%) | 0 (0.0%) |
| Installation, Maintenance & Repair | 0 (0.0%) | 0 (0.0%) |
| Total (Category) | 0 (0.0%) | 0 (0.0%) |
| Total (Overall) | 89 (48.6%) | 94 (51.4%) |
Production, Transportation and Moving Occupations
The most common Production, Transportation and Moving occupations in Caroleen are , and Production (85 | 46.5%).
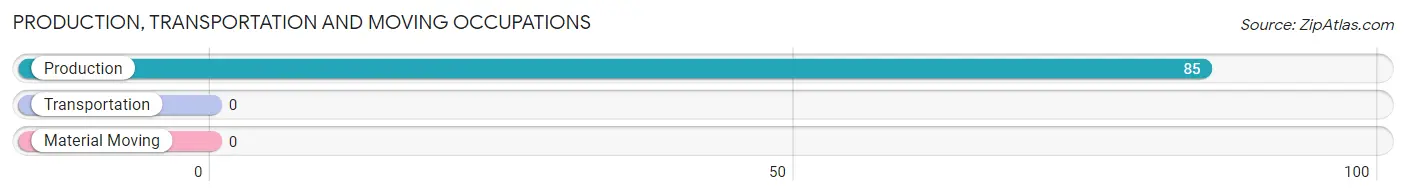
Production, Transportation and Moving Occupations by Sex
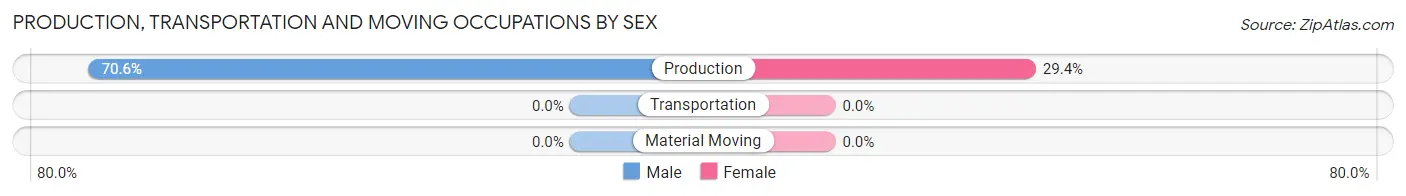
| Occupation | Male | Female |
| Production | 60 (70.6%) | 25 (29.4%) |
| Transportation | 0 (0.0%) | 0 (0.0%) |
| Material Moving | 0 (0.0%) | 0 (0.0%) |
| Total (Category) | 60 (70.6%) | 25 (29.4%) |
| Total (Overall) | 89 (48.6%) | 94 (51.4%) |
Employment Industries by Sex in Caroleen
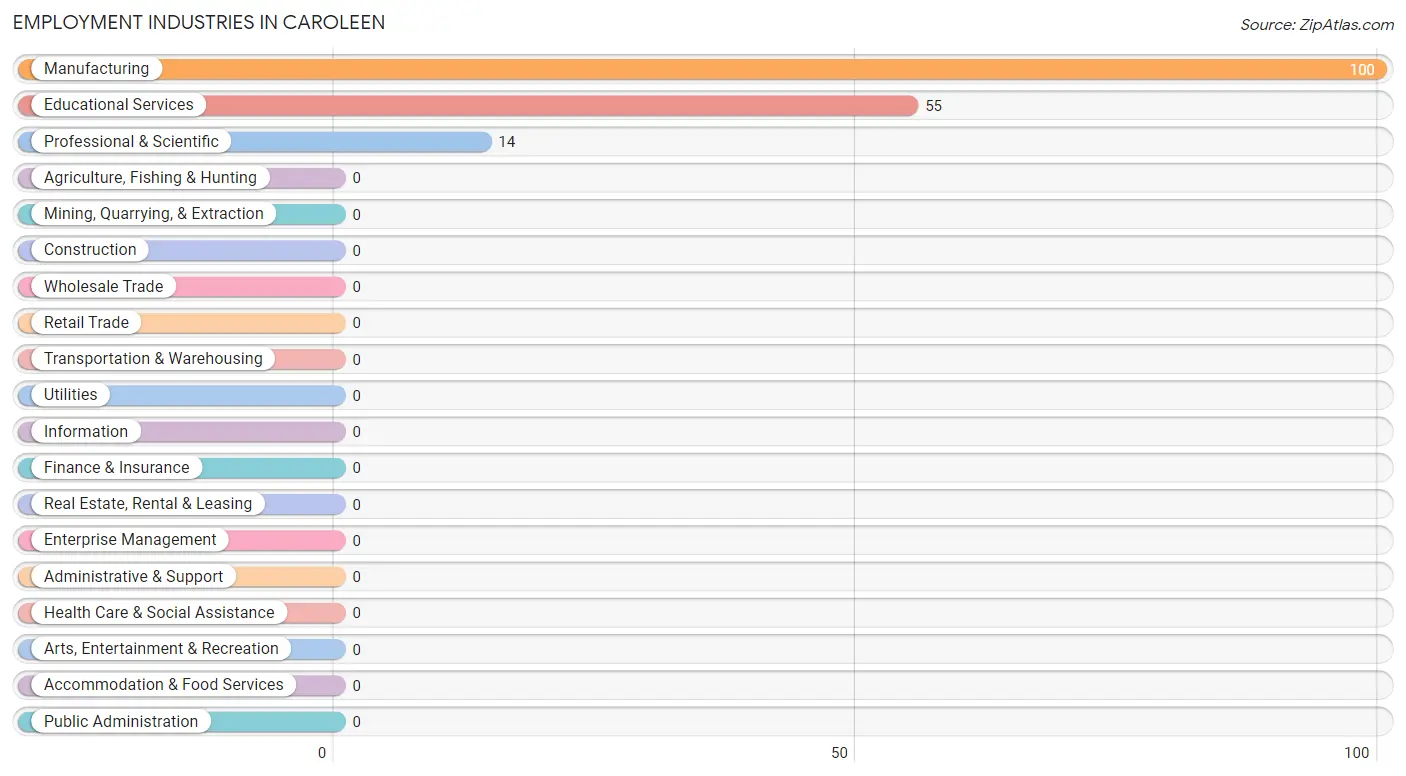
Employment Industries in Caroleen
The major employment industries in Caroleen include Manufacturing (100 | 54.6%), Educational Services (55 | 30.0%), and Professional & Scientific (14 | 7.6%).
Employment Industries by Sex in Caroleen
The Caroleen industries that see more men than women are Professional & Scientific (100.0%), and Manufacturing (75.0%), whereas the industries that tend to have a higher number of women are Educational Services (100.0%), and Manufacturing (25.0%).
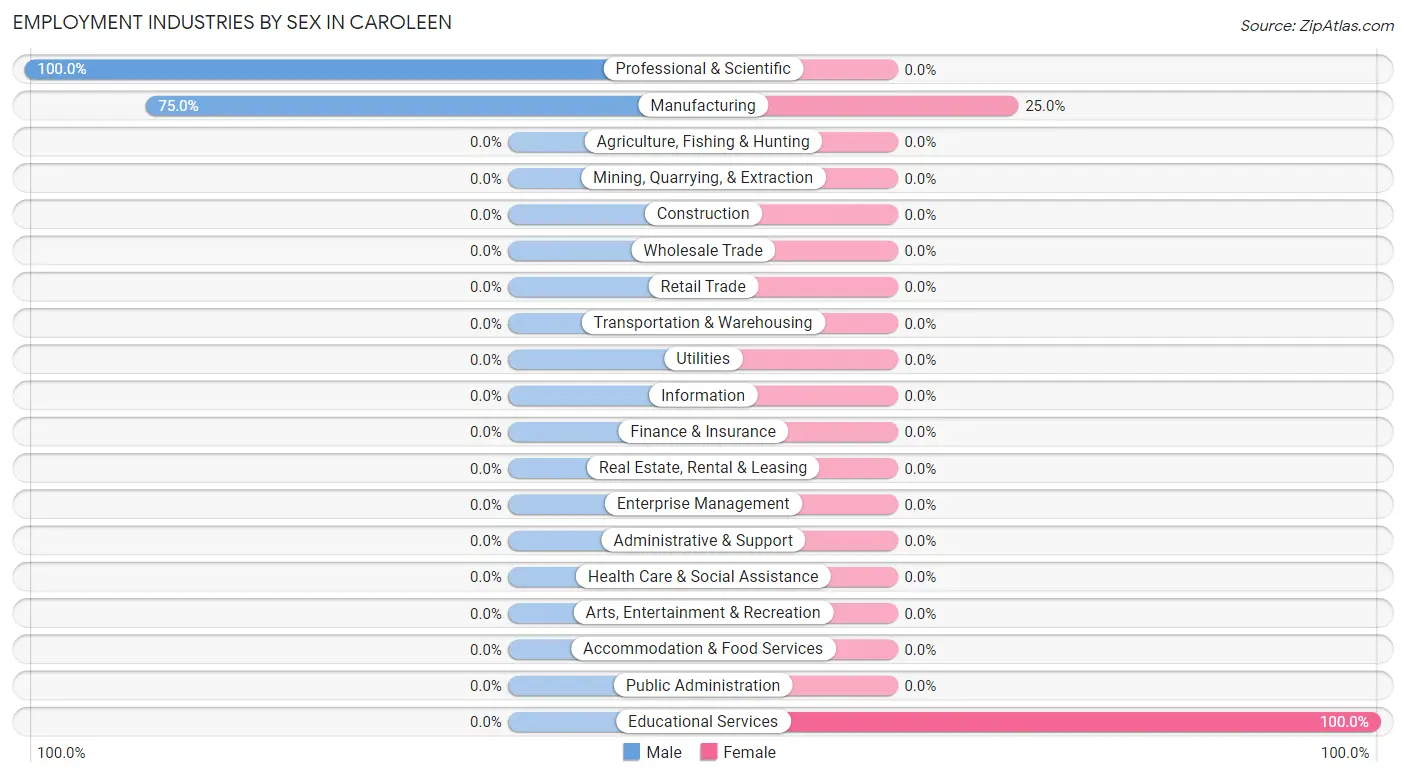
| Industry | Male | Female |
| Agriculture, Fishing & Hunting | 0 (0.0%) | 0 (0.0%) |
| Mining, Quarrying, & Extraction | 0 (0.0%) | 0 (0.0%) |
| Construction | 0 (0.0%) | 0 (0.0%) |
| Manufacturing | 75 (75.0%) | 25 (25.0%) |
| Wholesale Trade | 0 (0.0%) | 0 (0.0%) |
| Retail Trade | 0 (0.0%) | 0 (0.0%) |
| Transportation & Warehousing | 0 (0.0%) | 0 (0.0%) |
| Utilities | 0 (0.0%) | 0 (0.0%) |
| Information | 0 (0.0%) | 0 (0.0%) |
| Finance & Insurance | 0 (0.0%) | 0 (0.0%) |
| Real Estate, Rental & Leasing | 0 (0.0%) | 0 (0.0%) |
| Professional & Scientific | 14 (100.0%) | 0 (0.0%) |
| Enterprise Management | 0 (0.0%) | 0 (0.0%) |
| Administrative & Support | 0 (0.0%) | 0 (0.0%) |
| Educational Services | 0 (0.0%) | 55 (100.0%) |
| Health Care & Social Assistance | 0 (0.0%) | 0 (0.0%) |
| Arts, Entertainment & Recreation | 0 (0.0%) | 0 (0.0%) |
| Accommodation & Food Services | 0 (0.0%) | 0 (0.0%) |
| Public Administration | 0 (0.0%) | 0 (0.0%) |
| Total | 89 (48.6%) | 94 (51.4%) |
Education in Caroleen
School Enrollment in Caroleen
The most common levels of schooling among the 34 students in Caroleen are middle school (18 | 52.9%), and college / undergraduate (16 | 47.1%).
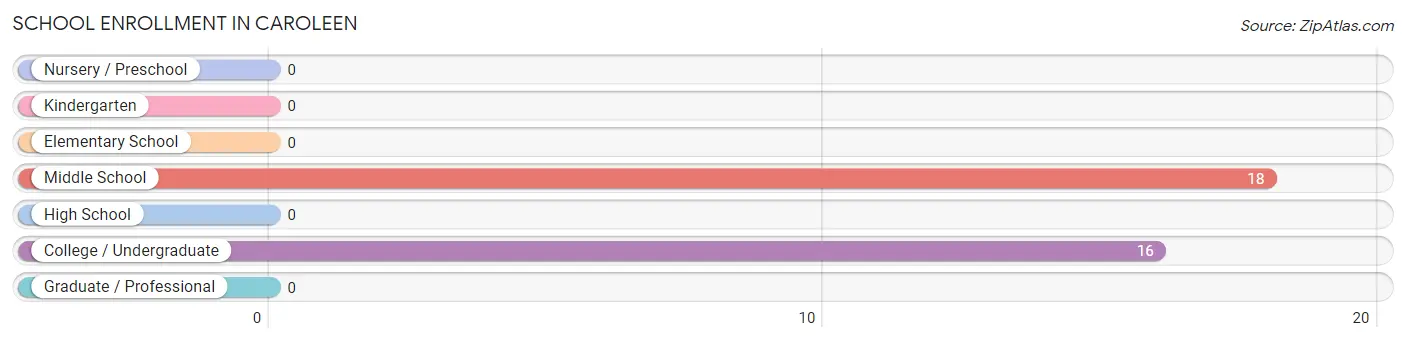
| School Level | # Students | % Students |
| Nursery / Preschool | 0 | 0.0% |
| Kindergarten | 0 | 0.0% |
| Elementary School | 0 | 0.0% |
| Middle School | 18 | 52.9% |
| High School | 0 | 0.0% |
| College / Undergraduate | 16 | 47.1% |
| Graduate / Professional | 0 | 0.0% |
| Total | 34 | 100.0% |
School Enrollment by Age by Funding Source in Caroleen
| Age Bracket | Public School | Private School |
| 3 to 4 Year Olds | 0 (0.0%) | 0 (0.0%) |
| 5 to 9 Year Old | 0 (0.0%) | 0 (0.0%) |
| 10 to 14 Year Olds | 18 (100.0%) | 0 (0.0%) |
| 15 to 17 Year Olds | 0 (0.0%) | 0 (0.0%) |
| 18 to 19 Year Olds | 0 (0.0%) | 0 (0.0%) |
| 20 to 24 Year Olds | 16 (100.0%) | 0 (0.0%) |
| 25 to 34 Year Olds | 0 (0.0%) | 0 (0.0%) |
| 35 Years and over | 0 (0.0%) | 0 (0.0%) |
| Total | 34 (100.0%) | 0 (0.0%) |
Educational Attainment by Field of Study in Caroleen
, and business (55 | 100.0%) are the most common fields of study among 55 individuals in Caroleen who have obtained a bachelor's degree or higher.
| Field of Study | # Graduates | % Graduates |
| Computers & Mathematics | 0 | 0.0% |
| Bio, Nature & Agricultural | 0 | 0.0% |
| Physical & Health Sciences | 0 | 0.0% |
| Psychology | 0 | 0.0% |
| Social Sciences | 0 | 0.0% |
| Engineering | 0 | 0.0% |
| Multidisciplinary Studies | 0 | 0.0% |
| Science & Technology | 0 | 0.0% |
| Business | 55 | 100.0% |
| Education | 0 | 0.0% |
| Literature & Languages | 0 | 0.0% |
| Liberal Arts & History | 0 | 0.0% |
| Visual & Performing Arts | 0 | 0.0% |
| Communications | 0 | 0.0% |
| Arts & Humanities | 0 | 0.0% |
| Total | 55 | 100.0% |
Transportation & Commute in Caroleen
Vehicle Availability by Sex in Caroleen
The most prevalent vehicle ownership categories in Caroleen are males with 2 vehicles (74, accounting for 83.2%) and females with 2 vehicles (55, making up 78.7%).
| Vehicles Available | Male | Female |
| No Vehicle | 0 (0.0%) | 0 (0.0%) |
| 1 Vehicle | 0 (0.0%) | 25 (26.6%) |
| 2 Vehicles | 74 (83.2%) | 55 (58.5%) |
| 3 Vehicles | 0 (0.0%) | 0 (0.0%) |
| 4 Vehicles | 0 (0.0%) | 0 (0.0%) |
| 5 or more Vehicles | 15 (16.9%) | 14 (14.9%) |
| Total | 89 (100.0%) | 94 (100.0%) |
Commute Time in Caroleen
The most frequently occuring commute durations in Caroleen are 10 to 14 minutes (115 commuters, 62.8%), 20 to 24 minutes (54 commuters, 29.5%), and 90 or more minutes (14 commuters, 7.6%).
| Commute Time | # Commuters | % Commuters |
| Less than 5 Minutes | 0 | 0.0% |
| 5 to 9 Minutes | 0 | 0.0% |
| 10 to 14 Minutes | 115 | 62.8% |
| 15 to 19 Minutes | 0 | 0.0% |
| 20 to 24 Minutes | 54 | 29.5% |
| 25 to 29 Minutes | 0 | 0.0% |
| 30 to 34 Minutes | 0 | 0.0% |
| 35 to 39 Minutes | 0 | 0.0% |
| 40 to 44 Minutes | 0 | 0.0% |
| 45 to 59 Minutes | 0 | 0.0% |
| 60 to 89 Minutes | 0 | 0.0% |
| 90 or more Minutes | 14 | 7.6% |
Commute Time by Sex in Caroleen
The most common commute times in Caroleen are 10 to 14 minutes (60 commuters, 67.4%) for males and 10 to 14 minutes (55 commuters, 58.5%) for females.
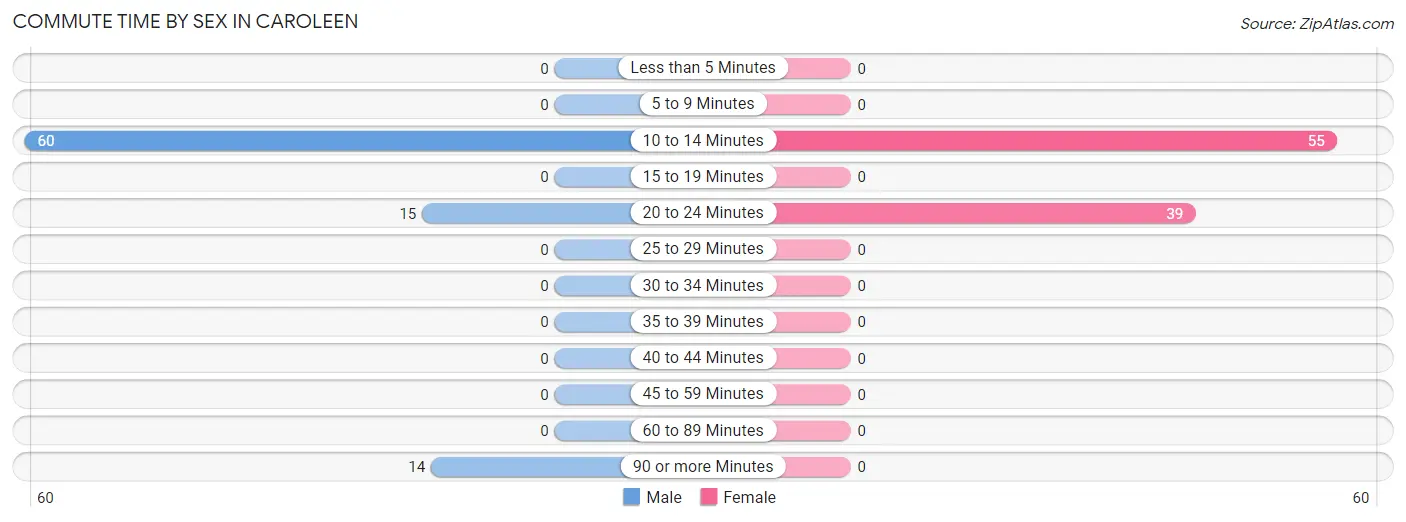
| Commute Time | Male | Female |
| Less than 5 Minutes | 0 (0.0%) | 0 (0.0%) |
| 5 to 9 Minutes | 0 (0.0%) | 0 (0.0%) |
| 10 to 14 Minutes | 60 (67.4%) | 55 (58.5%) |
| 15 to 19 Minutes | 0 (0.0%) | 0 (0.0%) |
| 20 to 24 Minutes | 15 (16.9%) | 39 (41.5%) |
| 25 to 29 Minutes | 0 (0.0%) | 0 (0.0%) |
| 30 to 34 Minutes | 0 (0.0%) | 0 (0.0%) |
| 35 to 39 Minutes | 0 (0.0%) | 0 (0.0%) |
| 40 to 44 Minutes | 0 (0.0%) | 0 (0.0%) |
| 45 to 59 Minutes | 0 (0.0%) | 0 (0.0%) |
| 60 to 89 Minutes | 0 (0.0%) | 0 (0.0%) |
| 90 or more Minutes | 14 (15.7%) | 0 (0.0%) |
Time of Departure to Work by Sex in Caroleen
The most frequent times of departure to work in Caroleen are 6:00 AM to 6:29 AM (74, 83.2%) for males and 7:00 AM to 7:29 AM (55, 58.5%) for females.
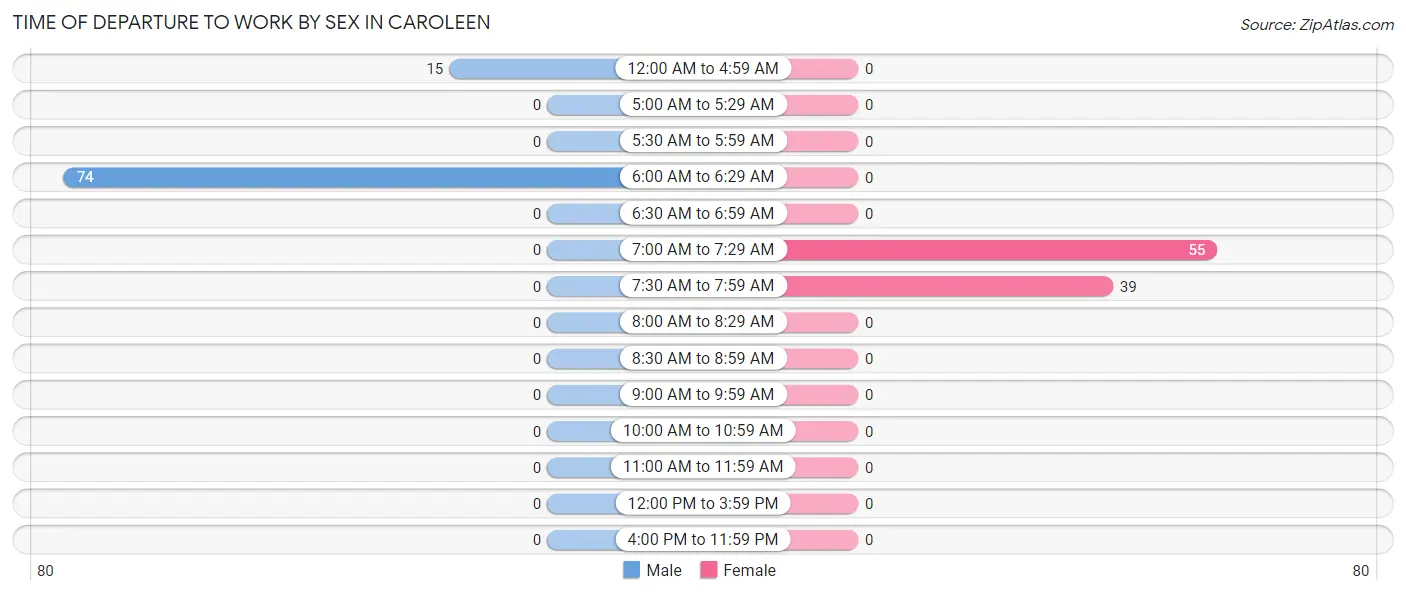
| Time of Departure | Male | Female |
| 12:00 AM to 4:59 AM | 15 (16.9%) | 0 (0.0%) |
| 5:00 AM to 5:29 AM | 0 (0.0%) | 0 (0.0%) |
| 5:30 AM to 5:59 AM | 0 (0.0%) | 0 (0.0%) |
| 6:00 AM to 6:29 AM | 74 (83.2%) | 0 (0.0%) |
| 6:30 AM to 6:59 AM | 0 (0.0%) | 0 (0.0%) |
| 7:00 AM to 7:29 AM | 0 (0.0%) | 55 (58.5%) |
| 7:30 AM to 7:59 AM | 0 (0.0%) | 39 (41.5%) |
| 8:00 AM to 8:29 AM | 0 (0.0%) | 0 (0.0%) |
| 8:30 AM to 8:59 AM | 0 (0.0%) | 0 (0.0%) |
| 9:00 AM to 9:59 AM | 0 (0.0%) | 0 (0.0%) |
| 10:00 AM to 10:59 AM | 0 (0.0%) | 0 (0.0%) |
| 11:00 AM to 11:59 AM | 0 (0.0%) | 0 (0.0%) |
| 12:00 PM to 3:59 PM | 0 (0.0%) | 0 (0.0%) |
| 4:00 PM to 11:59 PM | 0 (0.0%) | 0 (0.0%) |
| Total | 89 (100.0%) | 94 (100.0%) |
Housing Occupancy in Caroleen
Occupancy by Ownership in Caroleen
Of the total 160 dwellings in Caroleen, owner-occupied units account for 135 (84.4%), while renter-occupied units make up 25 (15.6%).
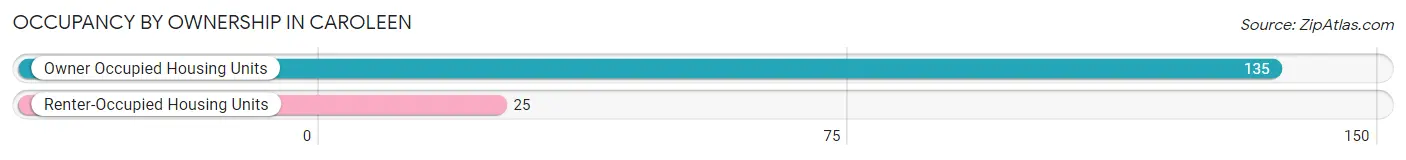
| Occupancy | # Housing Units | % Housing Units |
| Owner Occupied Housing Units | 135 | 84.4% |
| Renter-Occupied Housing Units | 25 | 15.6% |
| Total Occupied Housing Units | 160 | 100.0% |
Occupancy by Household Size in Caroleen
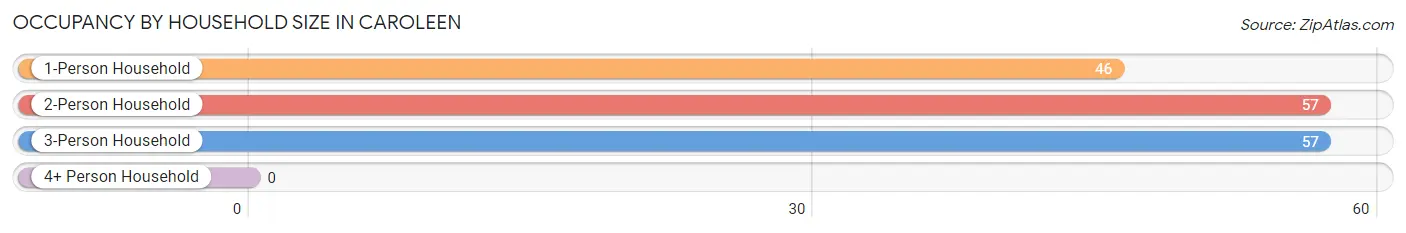
| Household Size | # Housing Units | % Housing Units |
| 1-Person Household | 46 | 28.7% |
| 2-Person Household | 57 | 35.6% |
| 3-Person Household | 57 | 35.6% |
| 4+ Person Household | 0 | 0.0% |
| Total Housing Units | 160 | 100.0% |
Occupancy by Ownership by Household Size in Caroleen
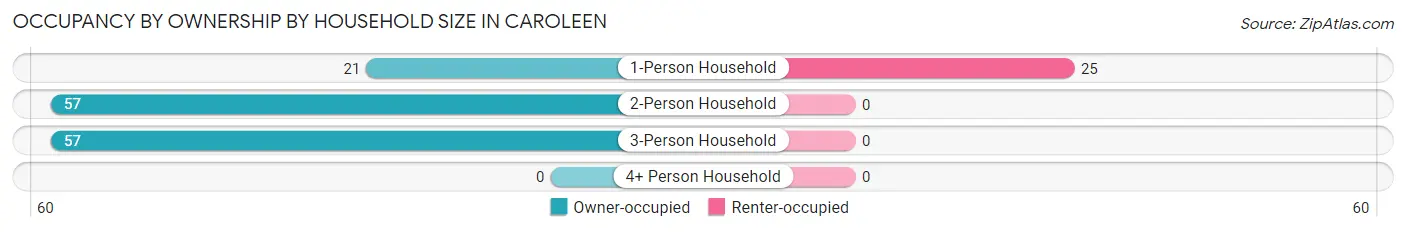
| Household Size | Owner-occupied | Renter-occupied |
| 1-Person Household | 21 (45.7%) | 25 (54.3%) |
| 2-Person Household | 57 (100.0%) | 0 (0.0%) |
| 3-Person Household | 57 (100.0%) | 0 (0.0%) |
| 4+ Person Household | 0 (0.0%) | 0 (0.0%) |
| Total Housing Units | 135 (84.4%) | 25 (15.6%) |
Occupancy by Educational Attainment in Caroleen
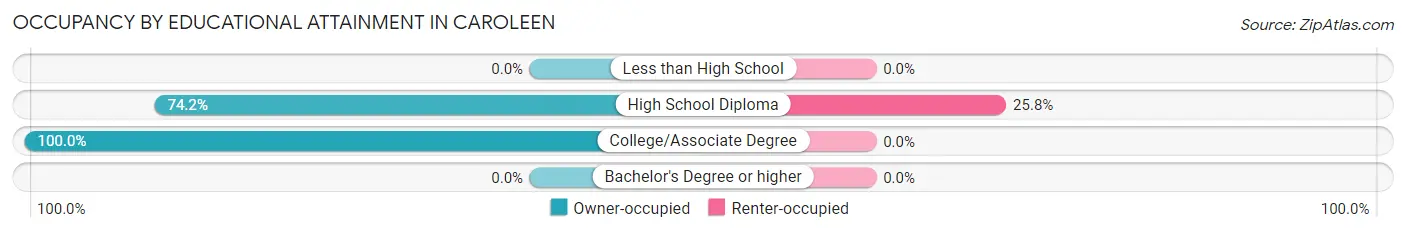
| Household Size | Owner-occupied | Renter-occupied |
| Less than High School | 0 (0.0%) | 0 (0.0%) |
| High School Diploma | 72 (74.2%) | 25 (25.8%) |
| College/Associate Degree | 63 (100.0%) | 0 (0.0%) |
| Bachelor's Degree or higher | 0 (0.0%) | 0 (0.0%) |
Occupancy by Age of Householder in Caroleen
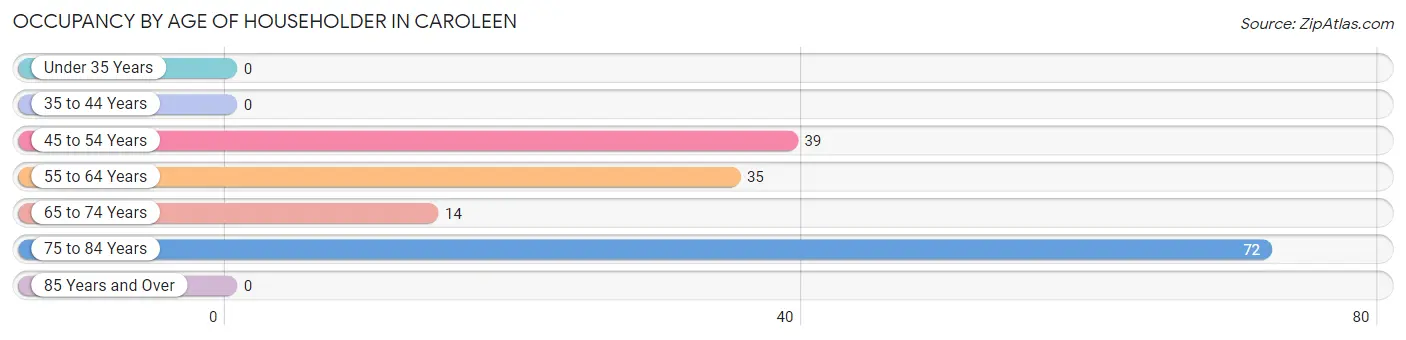
| Age Bracket | # Households | % Households |
| Under 35 Years | 0 | 0.0% |
| 35 to 44 Years | 0 | 0.0% |
| 45 to 54 Years | 39 | 24.4% |
| 55 to 64 Years | 35 | 21.9% |
| 65 to 74 Years | 14 | 8.7% |
| 75 to 84 Years | 72 | 45.0% |
| 85 Years and Over | 0 | 0.0% |
| Total | 160 | 100.0% |
Housing Finances in Caroleen
Median Income by Occupancy in Caroleen
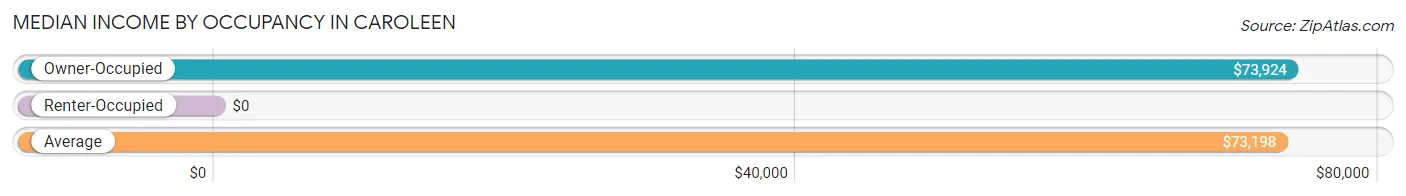
| Occupancy Type | # Households | Median Income |
| Owner-Occupied | 135 (84.4%) | $73,924 |
| Renter-Occupied | 25 (15.6%) | $0 |
| Average | 160 (100.0%) | $73,198 |
Occupancy by Householder Income Bracket in Caroleen
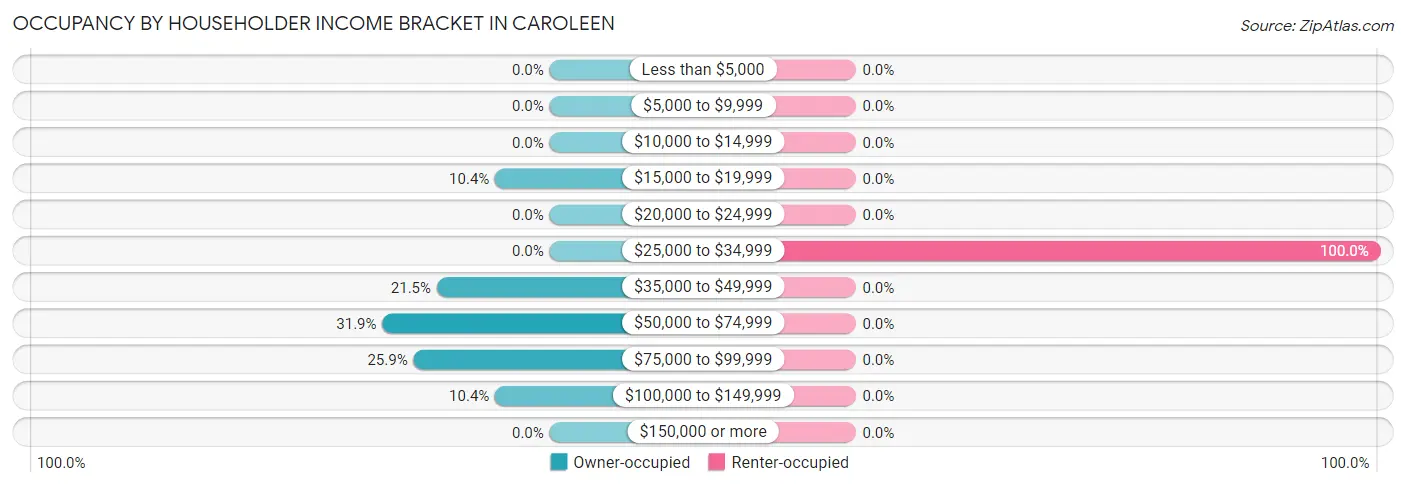
| Income Bracket | Owner-occupied | Renter-occupied |
| Less than $5,000 | 0 (0.0%) | 0 (0.0%) |
| $5,000 to $9,999 | 0 (0.0%) | 0 (0.0%) |
| $10,000 to $14,999 | 0 (0.0%) | 0 (0.0%) |
| $15,000 to $19,999 | 14 (10.4%) | 0 (0.0%) |
| $20,000 to $24,999 | 0 (0.0%) | 0 (0.0%) |
| $25,000 to $34,999 | 0 (0.0%) | 25 (100.0%) |
| $35,000 to $49,999 | 29 (21.5%) | 0 (0.0%) |
| $50,000 to $74,999 | 43 (31.9%) | 0 (0.0%) |
| $75,000 to $99,999 | 35 (25.9%) | 0 (0.0%) |
| $100,000 to $149,999 | 14 (10.4%) | 0 (0.0%) |
| $150,000 or more | 0 (0.0%) | 0 (0.0%) |
| Total | 135 (100.0%) | 25 (100.0%) |
Monthly Housing Cost Tiers in Caroleen
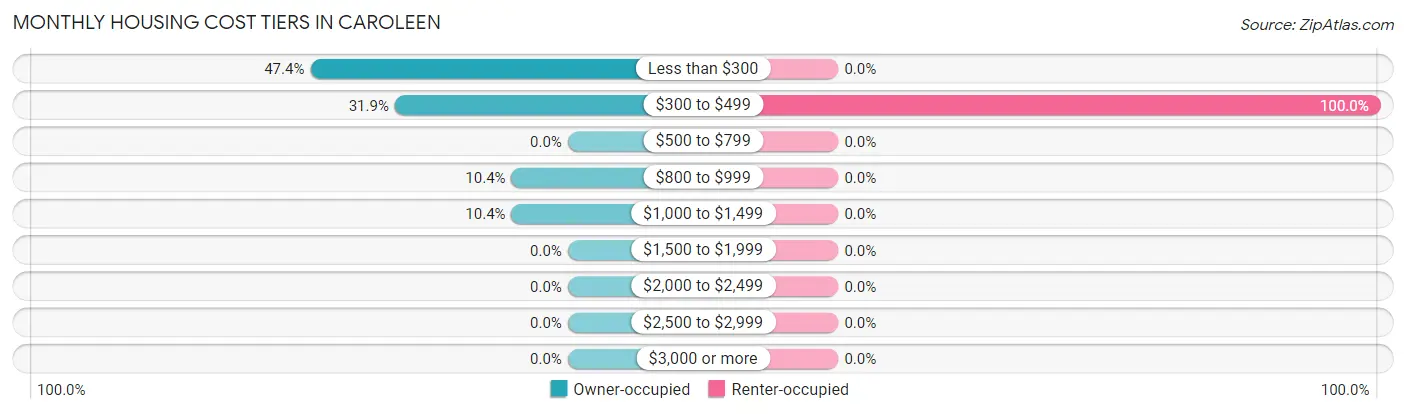
| Monthly Cost | Owner-occupied | Renter-occupied |
| Less than $300 | 64 (47.4%) | 0 (0.0%) |
| $300 to $499 | 43 (31.9%) | 25 (100.0%) |
| $500 to $799 | 0 (0.0%) | 0 (0.0%) |
| $800 to $999 | 14 (10.4%) | 0 (0.0%) |
| $1,000 to $1,499 | 14 (10.4%) | 0 (0.0%) |
| $1,500 to $1,999 | 0 (0.0%) | 0 (0.0%) |
| $2,000 to $2,499 | 0 (0.0%) | 0 (0.0%) |
| $2,500 to $2,999 | 0 (0.0%) | 0 (0.0%) |
| $3,000 or more | 0 (0.0%) | 0 (0.0%) |
| Total | 135 (100.0%) | 25 (100.0%) |
Physical Housing Characteristics in Caroleen
Housing Structures in Caroleen
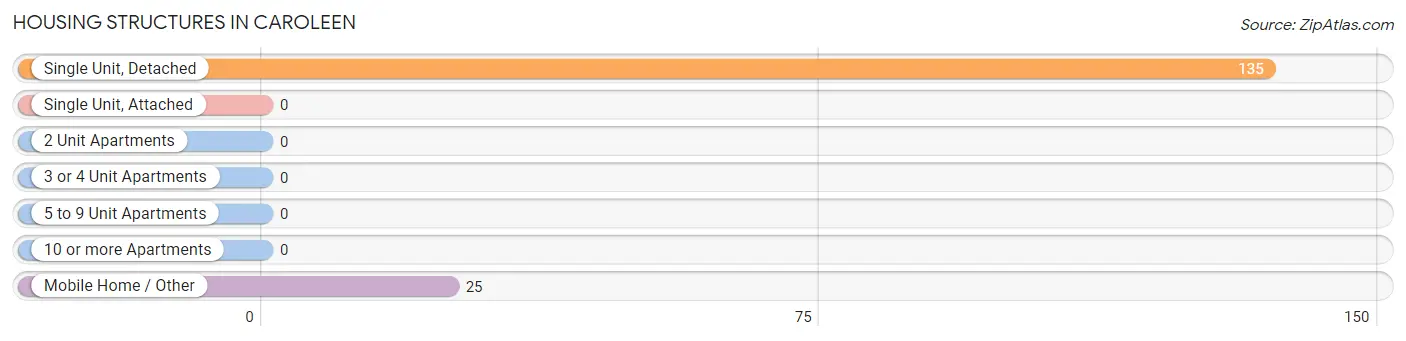
| Structure Type | # Housing Units | % Housing Units |
| Single Unit, Detached | 135 | 84.4% |
| Single Unit, Attached | 0 | 0.0% |
| 2 Unit Apartments | 0 | 0.0% |
| 3 or 4 Unit Apartments | 0 | 0.0% |
| 5 to 9 Unit Apartments | 0 | 0.0% |
| 10 or more Apartments | 0 | 0.0% |
| Mobile Home / Other | 25 | 15.6% |
| Total | 160 | 100.0% |
Housing Structures by Occupancy in Caroleen
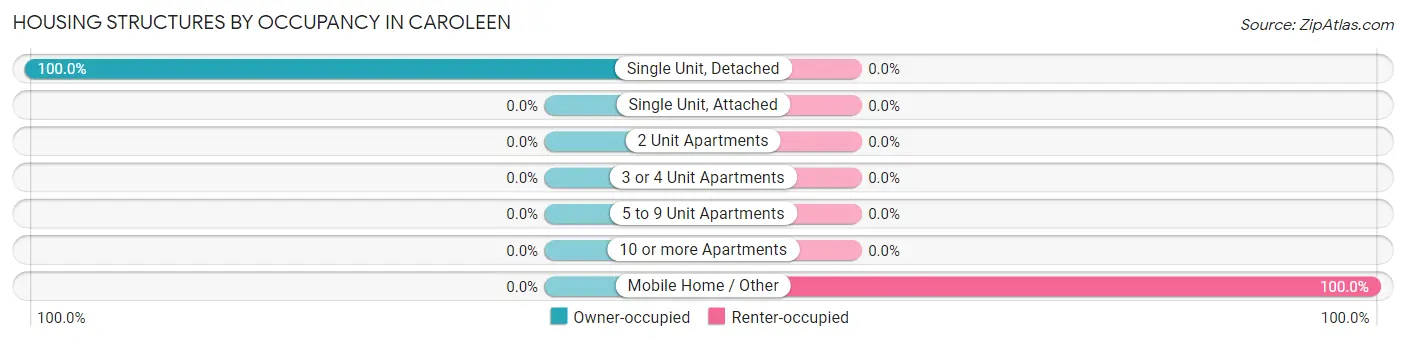
| Structure Type | Owner-occupied | Renter-occupied |
| Single Unit, Detached | 135 (100.0%) | 0 (0.0%) |
| Single Unit, Attached | 0 (0.0%) | 0 (0.0%) |
| 2 Unit Apartments | 0 (0.0%) | 0 (0.0%) |
| 3 or 4 Unit Apartments | 0 (0.0%) | 0 (0.0%) |
| 5 to 9 Unit Apartments | 0 (0.0%) | 0 (0.0%) |
| 10 or more Apartments | 0 (0.0%) | 0 (0.0%) |
| Mobile Home / Other | 0 (0.0%) | 25 (100.0%) |
| Total | 135 (84.4%) | 25 (15.6%) |
Housing Structures by Number of Rooms in Caroleen
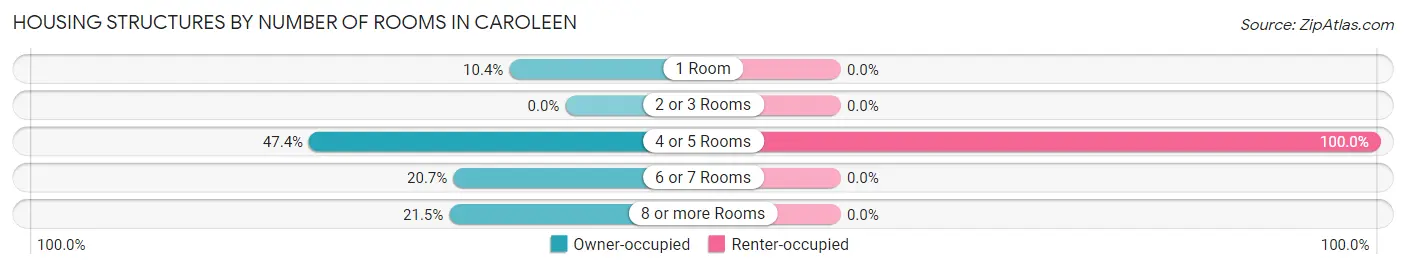
| Number of Rooms | Owner-occupied | Renter-occupied |
| 1 Room | 14 (10.4%) | 0 (0.0%) |
| 2 or 3 Rooms | 0 (0.0%) | 0 (0.0%) |
| 4 or 5 Rooms | 64 (47.4%) | 25 (100.0%) |
| 6 or 7 Rooms | 28 (20.7%) | 0 (0.0%) |
| 8 or more Rooms | 29 (21.5%) | 0 (0.0%) |
| Total | 135 (100.0%) | 25 (100.0%) |
Housing Structure by Heating Type in Caroleen
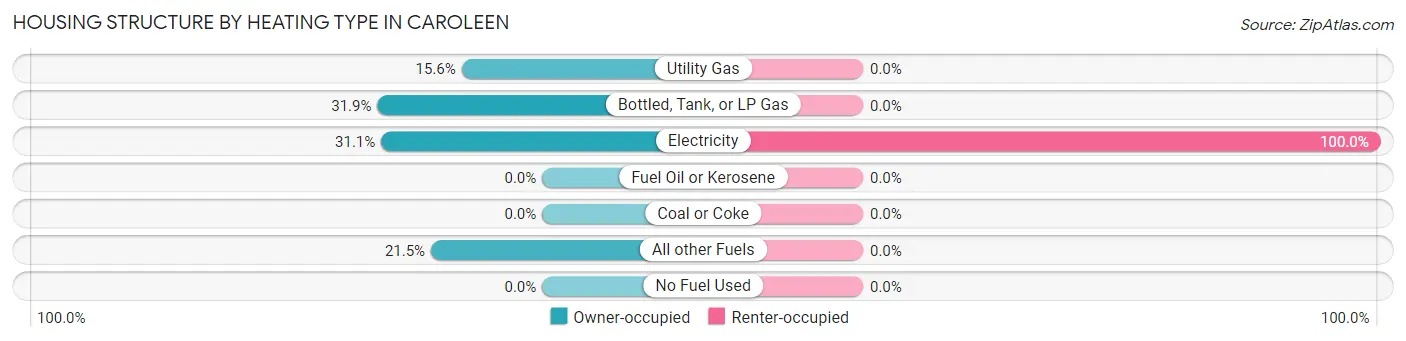
| Heating Type | Owner-occupied | Renter-occupied |
| Utility Gas | 21 (15.6%) | 0 (0.0%) |
| Bottled, Tank, or LP Gas | 43 (31.9%) | 0 (0.0%) |
| Electricity | 42 (31.1%) | 25 (100.0%) |
| Fuel Oil or Kerosene | 0 (0.0%) | 0 (0.0%) |
| Coal or Coke | 0 (0.0%) | 0 (0.0%) |
| All other Fuels | 29 (21.5%) | 0 (0.0%) |
| No Fuel Used | 0 (0.0%) | 0 (0.0%) |
| Total | 135 (100.0%) | 25 (100.0%) |
Household Vehicle Usage in Caroleen
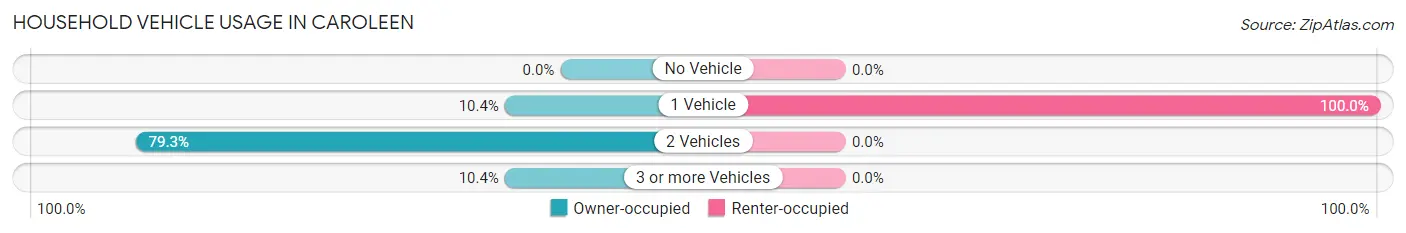
| Vehicles per Household | Owner-occupied | Renter-occupied |
| No Vehicle | 0 (0.0%) | 0 (0.0%) |
| 1 Vehicle | 14 (10.4%) | 25 (100.0%) |
| 2 Vehicles | 107 (79.3%) | 0 (0.0%) |
| 3 or more Vehicles | 14 (10.4%) | 0 (0.0%) |
| Total | 135 (100.0%) | 25 (100.0%) |
Real Estate & Mortgages in Caroleen
Real Estate and Mortgage Overview in Caroleen
| Characteristic | Without Mortgage | With Mortgage |
| Housing Units | 107 | 28 |
| Median Property Value | $106,400 | $0 |
| Median Household Income | $73,110 | $0 |
| Monthly Housing Costs | $275 | $0 |
| Real Estate Taxes | $758 | $0 |
Property Value by Mortgage Status in Caroleen
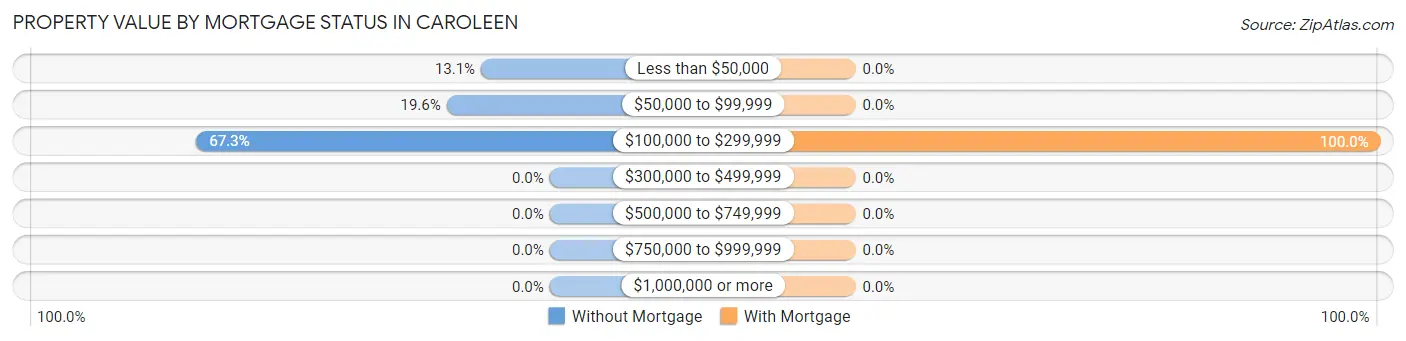
| Property Value | Without Mortgage | With Mortgage |
| Less than $50,000 | 14 (13.1%) | 0 (0.0%) |
| $50,000 to $99,999 | 21 (19.6%) | 0 (0.0%) |
| $100,000 to $299,999 | 72 (67.3%) | 28 (100.0%) |
| $300,000 to $499,999 | 0 (0.0%) | 0 (0.0%) |
| $500,000 to $749,999 | 0 (0.0%) | 0 (0.0%) |
| $750,000 to $999,999 | 0 (0.0%) | 0 (0.0%) |
| $1,000,000 or more | 0 (0.0%) | 0 (0.0%) |
| Total | 107 (100.0%) | 28 (100.0%) |
Household Income by Mortgage Status in Caroleen
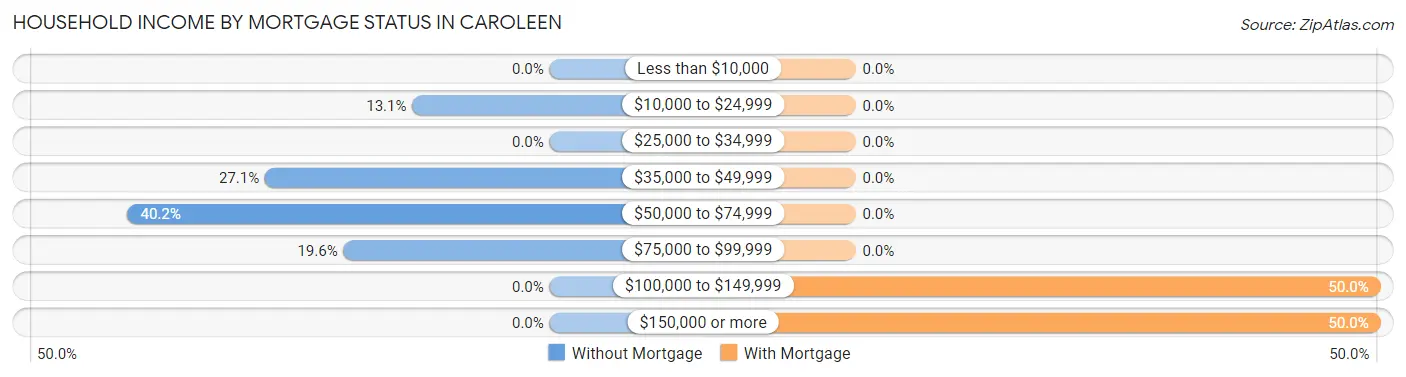
| Household Income | Without Mortgage | With Mortgage |
| Less than $10,000 | 0 (0.0%) | 0 (0.0%) |
| $10,000 to $24,999 | 14 (13.1%) | 0 (0.0%) |
| $25,000 to $34,999 | 0 (0.0%) | 0 (0.0%) |
| $35,000 to $49,999 | 29 (27.1%) | 0 (0.0%) |
| $50,000 to $74,999 | 43 (40.2%) | 0 (0.0%) |
| $75,000 to $99,999 | 21 (19.6%) | 0 (0.0%) |
| $100,000 to $149,999 | 0 (0.0%) | 14 (50.0%) |
| $150,000 or more | 0 (0.0%) | 14 (50.0%) |
| Total | 107 (100.0%) | 28 (100.0%) |
Property Value to Household Income Ratio in Caroleen
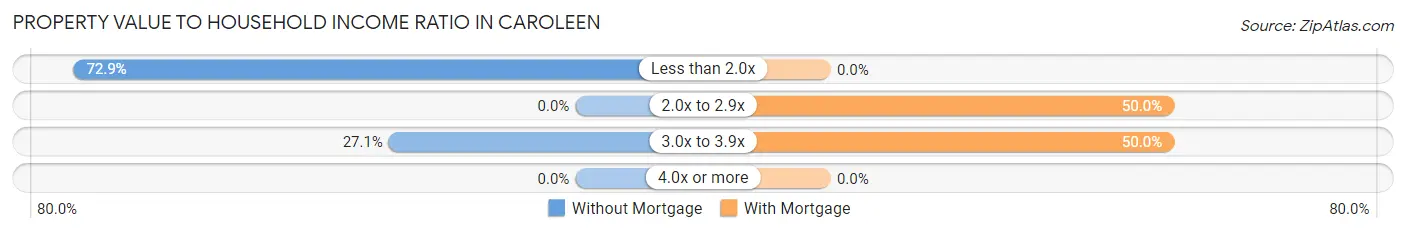
| Value-to-Income Ratio | Without Mortgage | With Mortgage |
| Less than 2.0x | 78 (72.9%) | 0 (0.0%) |
| 2.0x to 2.9x | 0 (0.0%) | 14 (50.0%) |
| 3.0x to 3.9x | 29 (27.1%) | 14 (50.0%) |
| 4.0x or more | 0 (0.0%) | 0 (0.0%) |
| Total | 107 (100.0%) | 28 (100.0%) |
Real Estate Taxes by Mortgage Status in Caroleen
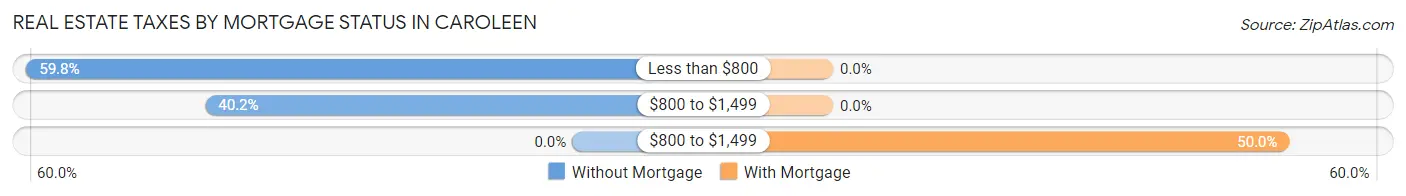
| Property Taxes | Without Mortgage | With Mortgage |
| Less than $800 | 64 (59.8%) | 0 (0.0%) |
| $800 to $1,499 | 43 (40.2%) | 0 (0.0%) |
| $800 to $1,499 | 0 (0.0%) | 14 (50.0%) |
| Total | 107 (100.0%) | 28 (100.0%) |
Health & Disability in Caroleen
Health Insurance Coverage by Age in Caroleen
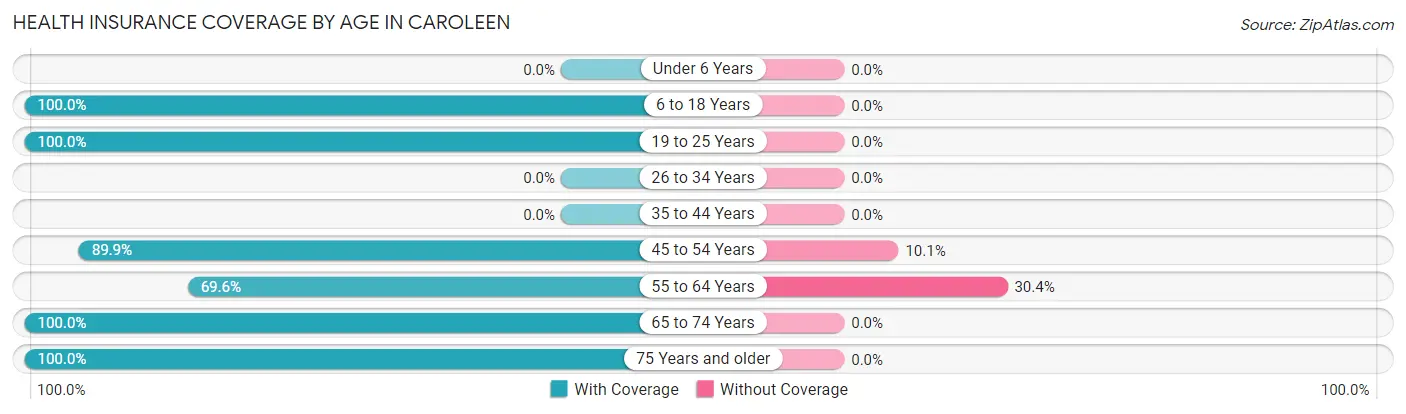
| Age Bracket | With Coverage | Without Coverage |
| Under 6 Years | 0 (0.0%) | 0 (0.0%) |
| 6 to 18 Years | 18 (100.0%) | 0 (0.0%) |
| 19 to 25 Years | 16 (100.0%) | 0 (0.0%) |
| 26 to 34 Years | 0 (0.0%) | 0 (0.0%) |
| 35 to 44 Years | 0 (0.0%) | 0 (0.0%) |
| 45 to 54 Years | 169 (89.9%) | 19 (10.1%) |
| 55 to 64 Years | 48 (69.6%) | 21 (30.4%) |
| 65 to 74 Years | 14 (100.0%) | 0 (0.0%) |
| 75 Years and older | 72 (100.0%) | 0 (0.0%) |
| Total | 337 (89.4%) | 40 (10.6%) |
Health Insurance Coverage by Citizenship Status in Caroleen
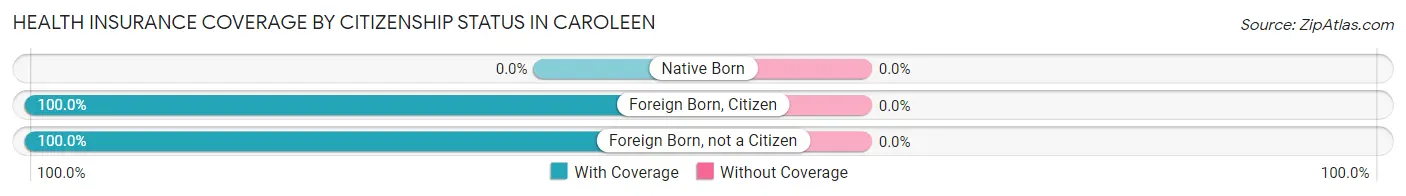
| Citizenship Status | With Coverage | Without Coverage |
| Native Born | 0 (0.0%) | 0 (0.0%) |
| Foreign Born, Citizen | 18 (100.0%) | 0 (0.0%) |
| Foreign Born, not a Citizen | 16 (100.0%) | 0 (0.0%) |
Health Insurance Coverage by Household Income in Caroleen
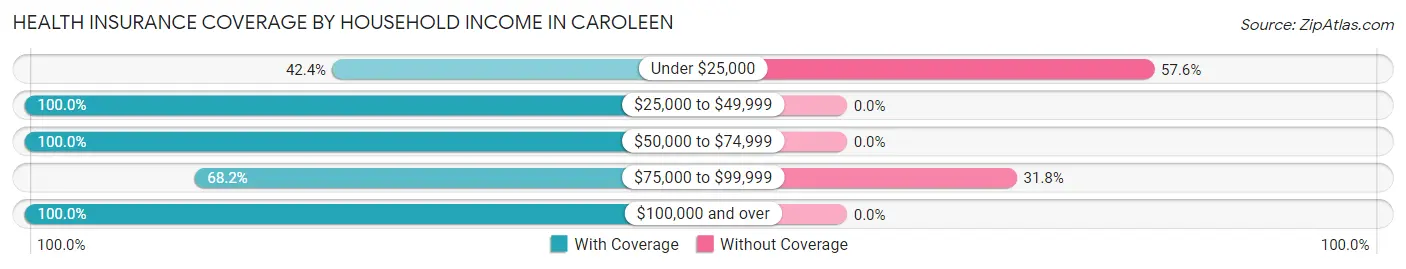
| Household Income | With Coverage | Without Coverage |
| Under $25,000 | 14 (42.4%) | 19 (57.6%) |
| $25,000 to $49,999 | 88 (100.0%) | 0 (0.0%) |
| $50,000 to $74,999 | 158 (100.0%) | 0 (0.0%) |
| $75,000 to $99,999 | 45 (68.2%) | 21 (31.8%) |
| $100,000 and over | 32 (100.0%) | 0 (0.0%) |
Public vs Private Health Insurance Coverage by Age in Caroleen
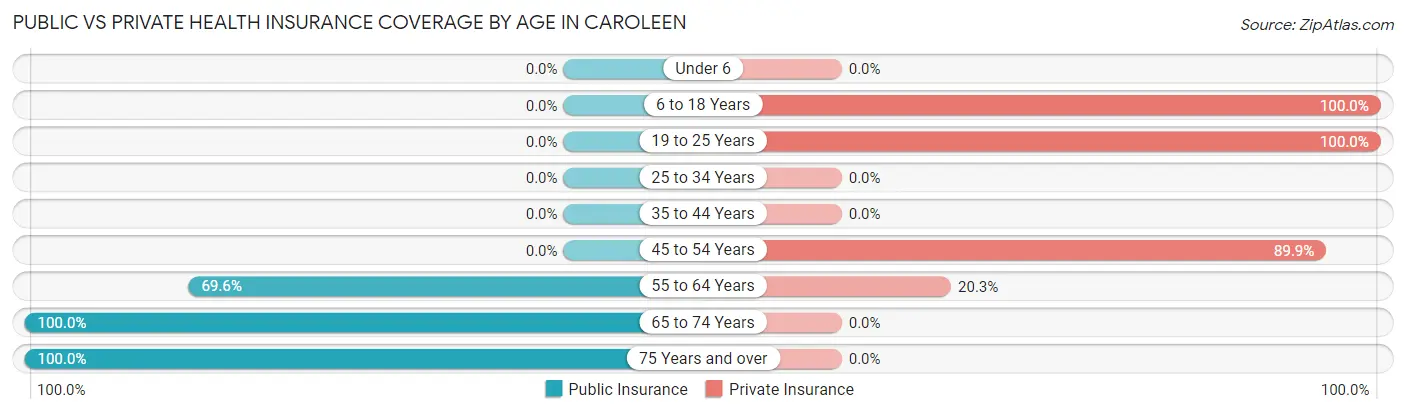
| Age Bracket | Public Insurance | Private Insurance |
| Under 6 | 0 (0.0%) | 0 (0.0%) |
| 6 to 18 Years | 0 (0.0%) | 18 (100.0%) |
| 19 to 25 Years | 0 (0.0%) | 16 (100.0%) |
| 25 to 34 Years | 0 (0.0%) | 0 (0.0%) |
| 35 to 44 Years | 0 (0.0%) | 0 (0.0%) |
| 45 to 54 Years | 0 (0.0%) | 169 (89.9%) |
| 55 to 64 Years | 48 (69.6%) | 14 (20.3%) |
| 65 to 74 Years | 14 (100.0%) | 0 (0.0%) |
| 75 Years and over | 72 (100.0%) | 0 (0.0%) |
| Total | 134 (35.5%) | 217 (57.6%) |
Disability Status by Sex by Age in Caroleen
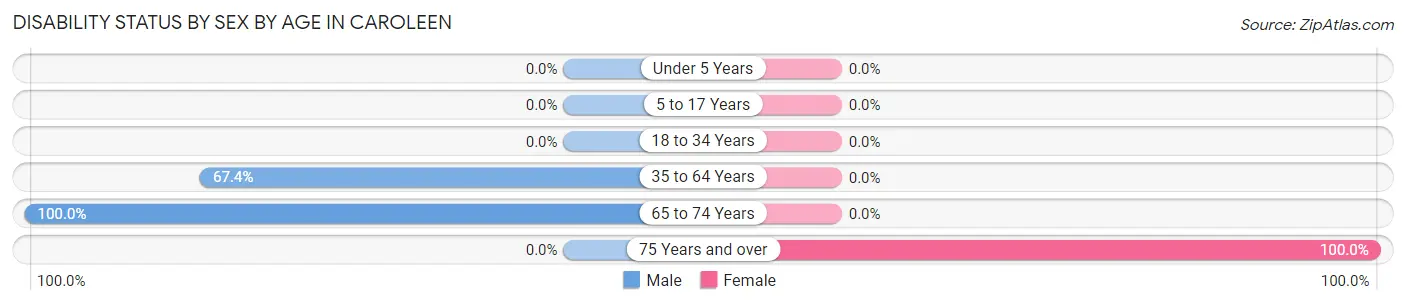
| Age Bracket | Male | Female |
| Under 5 Years | 0 (0.0%) | 0 (0.0%) |
| 5 to 17 Years | 0 (0.0%) | 0 (0.0%) |
| 18 to 34 Years | 0 (0.0%) | 0 (0.0%) |
| 35 to 64 Years | 60 (67.4%) | 0 (0.0%) |
| 65 to 74 Years | 14 (100.0%) | 0 (0.0%) |
| 75 Years and over | 0 (0.0%) | 43 (100.0%) |
Disability Class by Sex by Age in Caroleen
Disability Class: Hearing Difficulty
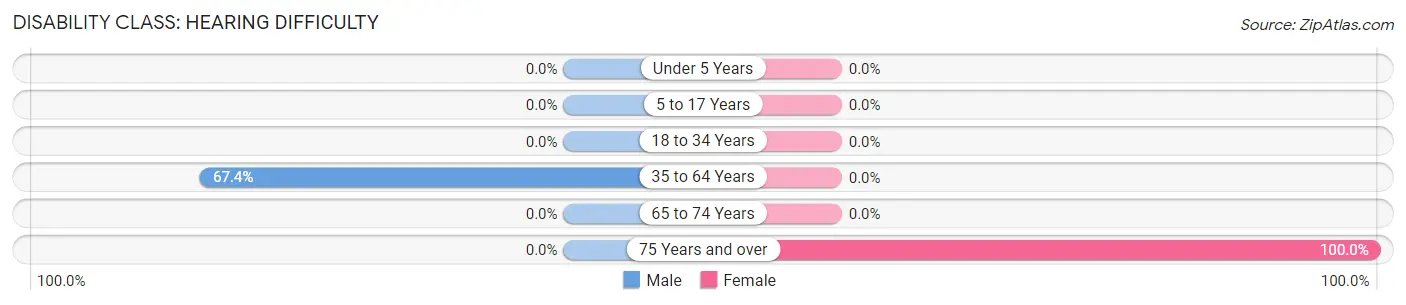
| Age Bracket | Male | Female |
| Under 5 Years | 0 (0.0%) | 0 (0.0%) |
| 5 to 17 Years | 0 (0.0%) | 0 (0.0%) |
| 18 to 34 Years | 0 (0.0%) | 0 (0.0%) |
| 35 to 64 Years | 60 (67.4%) | 0 (0.0%) |
| 65 to 74 Years | 0 (0.0%) | 0 (0.0%) |
| 75 Years and over | 0 (0.0%) | 43 (100.0%) |
Disability Class: Vision Difficulty
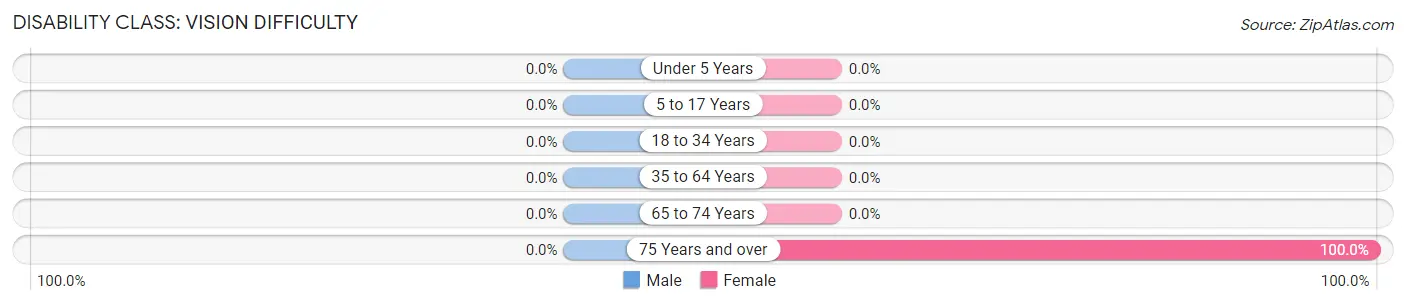
| Age Bracket | Male | Female |
| Under 5 Years | 0 (0.0%) | 0 (0.0%) |
| 5 to 17 Years | 0 (0.0%) | 0 (0.0%) |
| 18 to 34 Years | 0 (0.0%) | 0 (0.0%) |
| 35 to 64 Years | 0 (0.0%) | 0 (0.0%) |
| 65 to 74 Years | 0 (0.0%) | 0 (0.0%) |
| 75 Years and over | 0 (0.0%) | 43 (100.0%) |
Disability Class: Cognitive Difficulty
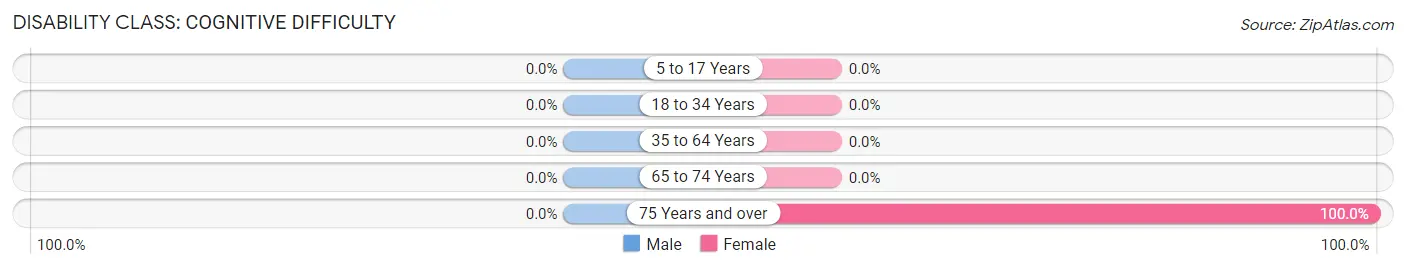
| Age Bracket | Male | Female |
| 5 to 17 Years | 0 (0.0%) | 0 (0.0%) |
| 18 to 34 Years | 0 (0.0%) | 0 (0.0%) |
| 35 to 64 Years | 0 (0.0%) | 0 (0.0%) |
| 65 to 74 Years | 0 (0.0%) | 0 (0.0%) |
| 75 Years and over | 0 (0.0%) | 43 (100.0%) |
Disability Class: Ambulatory Difficulty
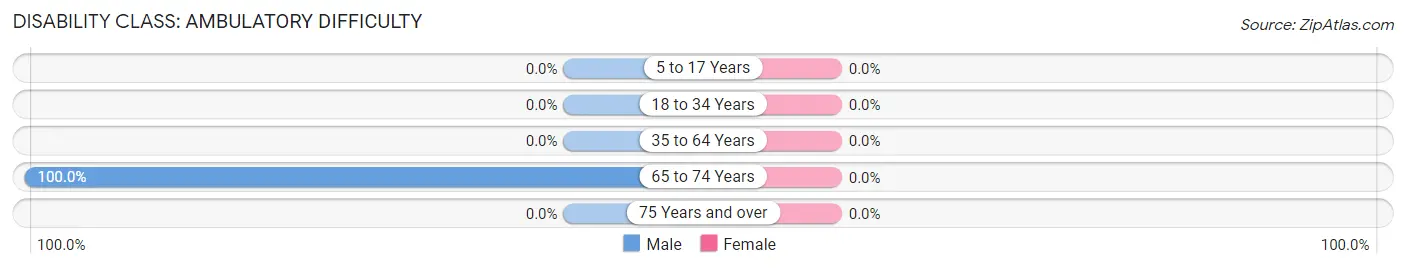
| Age Bracket | Male | Female |
| 5 to 17 Years | 0 (0.0%) | 0 (0.0%) |
| 18 to 34 Years | 0 (0.0%) | 0 (0.0%) |
| 35 to 64 Years | 0 (0.0%) | 0 (0.0%) |
| 65 to 74 Years | 14 (100.0%) | 0 (0.0%) |
| 75 Years and over | 0 (0.0%) | 0 (0.0%) |
Disability Class: Self-Care Difficulty
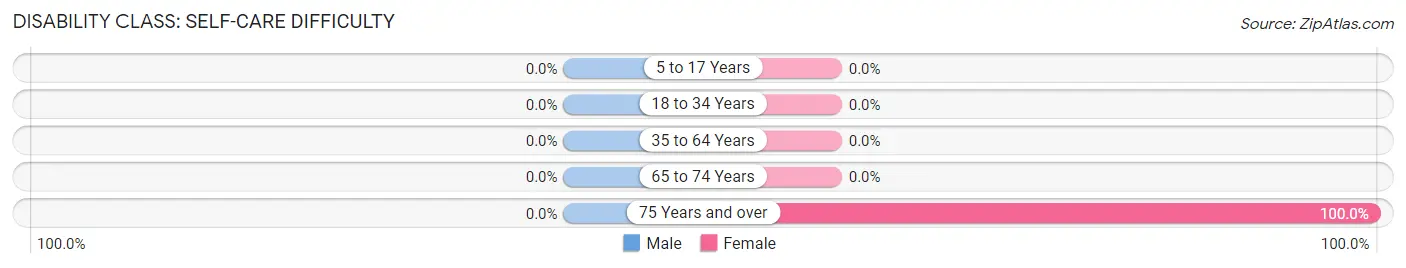
| Age Bracket | Male | Female |
| 5 to 17 Years | 0 (0.0%) | 0 (0.0%) |
| 18 to 34 Years | 0 (0.0%) | 0 (0.0%) |
| 35 to 64 Years | 0 (0.0%) | 0 (0.0%) |
| 65 to 74 Years | 0 (0.0%) | 0 (0.0%) |
| 75 Years and over | 0 (0.0%) | 43 (100.0%) |
Technology Access in Caroleen
Computing Device Access in Caroleen
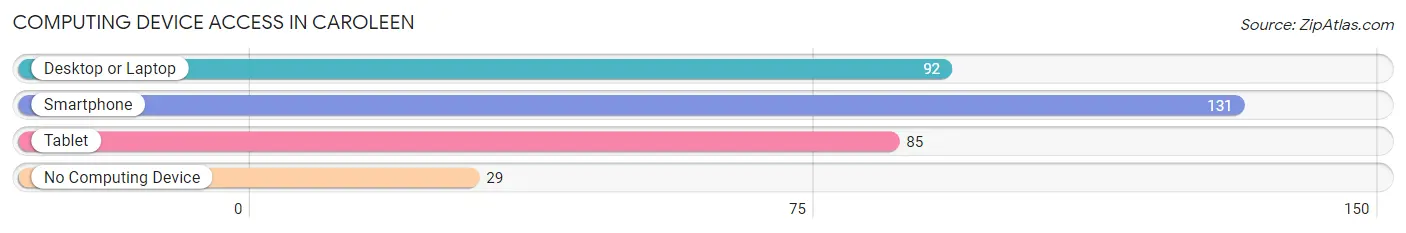
| Device Type | # Households | % Households |
| Desktop or Laptop | 92 | 57.5% |
| Smartphone | 131 | 81.9% |
| Tablet | 85 | 53.1% |
| No Computing Device | 29 | 18.1% |
| Total | 160 | 100.0% |
Internet Access in Caroleen
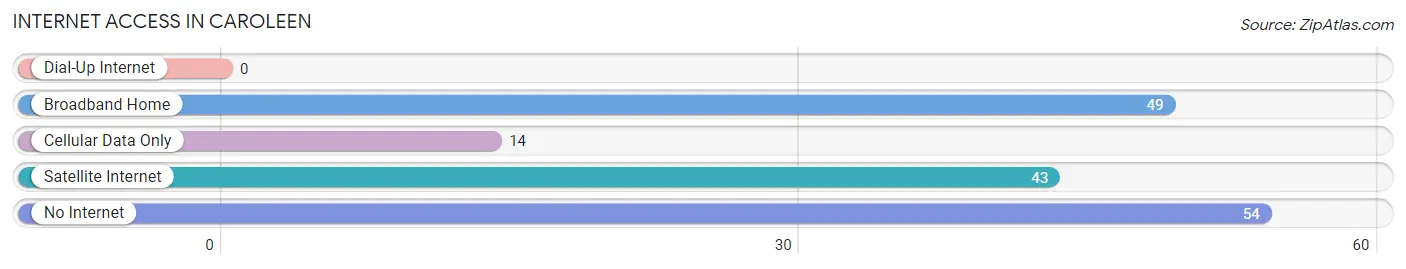
| Internet Type | # Households | % Households |
| Dial-Up Internet | 0 | 0.0% |
| Broadband Home | 49 | 30.6% |
| Cellular Data Only | 14 | 8.7% |
| Satellite Internet | 43 | 26.9% |
| No Internet | 54 | 33.8% |
| Total | 160 | 100.0% |
Caroleen Summary
Caroleen is a small town located in Rutherford County, North Carolina. It is situated in the foothills of the Blue Ridge Mountains, about 25 miles west of Asheville. The town was founded in 1887 and has a population of approximately 1,000 people.
Geography
Caroleen is located in the foothills of the Blue Ridge Mountains, about 25 miles west of Asheville. The town is situated in a valley surrounded by mountains, with the highest peak being Mount Mitchell, which is the highest peak in the eastern United States. The town is located in a temperate climate, with mild winters and hot summers. The average annual temperature is around 60 degrees Fahrenheit.
The town is located near the Catawba River, which is a major source of water for the area. The river is also a popular destination for fishing, canoeing, and kayaking. The town is also located near the Pisgah National Forest, which is a popular destination for hiking, camping, and other outdoor activities.
History
Caroleen was founded in 1887 by a group of settlers from the nearby town of Rutherfordton. The town was named after the daughter of one of the settlers, Caroleen. The town was originally a farming community, and the main crops grown were corn, wheat, and tobacco.
In the early 1900s, the town began to grow and develop. The first school was built in 1910, and the first post office was established in 1911. The town also had a general store, a blacksmith shop, and a grist mill.
In the 1920s, the town began to experience a period of growth and prosperity. The population increased from around 500 to over 1,000 people. The town also had a movie theater, a bank, and a hotel.
In the 1950s, the town began to decline. The population decreased and many businesses closed. The town was also affected by the Great Depression and World War II.
Economy
The economy of Caroleen is largely based on agriculture. The main crops grown in the area are corn, wheat, and tobacco. The town also has a few small businesses, such as a general store, a gas station, and a restaurant.
The town is also home to a few manufacturing companies, such as a furniture factory and a textile mill. The town is also home to a few small businesses, such as a bakery, a barber shop, and a hardware store.
Demographics
As of the 2010 census, the population of Caroleen was 1,000 people. The racial makeup of the town was 97.2% White, 0.7% African American, 0.3% Native American, 0.2% Asian, and 1.6% from other races. The median household income was $30,000, and the median age was 40 years.
Conclusion
Caroleen is a small town located in the foothills of the Blue Ridge Mountains in North Carolina. The town was founded in 1887 and has a population of approximately 1,000 people. The economy of the town is largely based on agriculture, and the main crops grown are corn, wheat, and tobacco. The town also has a few small businesses, such as a general store, a gas station, and a restaurant. The racial makeup of the town is 97.2% White, 0.7% African American, 0.3% Native American, 0.2% Asian, and 1.6% from other races. The median household income was $30,000, and the median age was 40 years.
Common Questions
What is Per Capita Income in Caroleen?
Per Capita income in Caroleen is $29,038.
What is the Median Family Income in Caroleen?
Median Family Income in Caroleen is $73,721.
What is the Median Household income in Caroleen?
Median Household Income in Caroleen is $73,198.
What is Income or Wage Gap in Caroleen?
Income or Wage Gap in Caroleen is 31.5%.
Women in Caroleen earn 68.5 cents for every dollar earned by a man.
What is Inequality or Gini Index in Caroleen?
Inequality or Gini Index in Caroleen is 0.28.
What is the Total Population of Caroleen?
Total Population of Caroleen is 377.
What is the Total Male Population of Caroleen?
Total Male Population of Caroleen is 150.
What is the Total Female Population of Caroleen?
Total Female Population of Caroleen is 227.
What is the Ratio of Males per 100 Females in Caroleen?
There are 66.08 Males per 100 Females in Caroleen.
What is the Ratio of Females per 100 Males in Caroleen?
There are 151.33 Females per 100 Males in Caroleen.
What is the Median Population Age in Caroleen?
Median Population Age in Caroleen is 53.5 Years.
What is the Average Family Size in Caroleen
Average Family Size in Caroleen is 3.0 People.
What is the Average Household Size in Caroleen
Average Household Size in Caroleen is 2.4 People.
How Large is the Labor Force in Caroleen?
There are 183 People in the Labor Forcein in Caroleen.
What is the Percentage of People in the Labor Force in Caroleen?
51.0% of People are in the Labor Force in Caroleen.