Cameron, NC Map & Demographics
Cameron Map
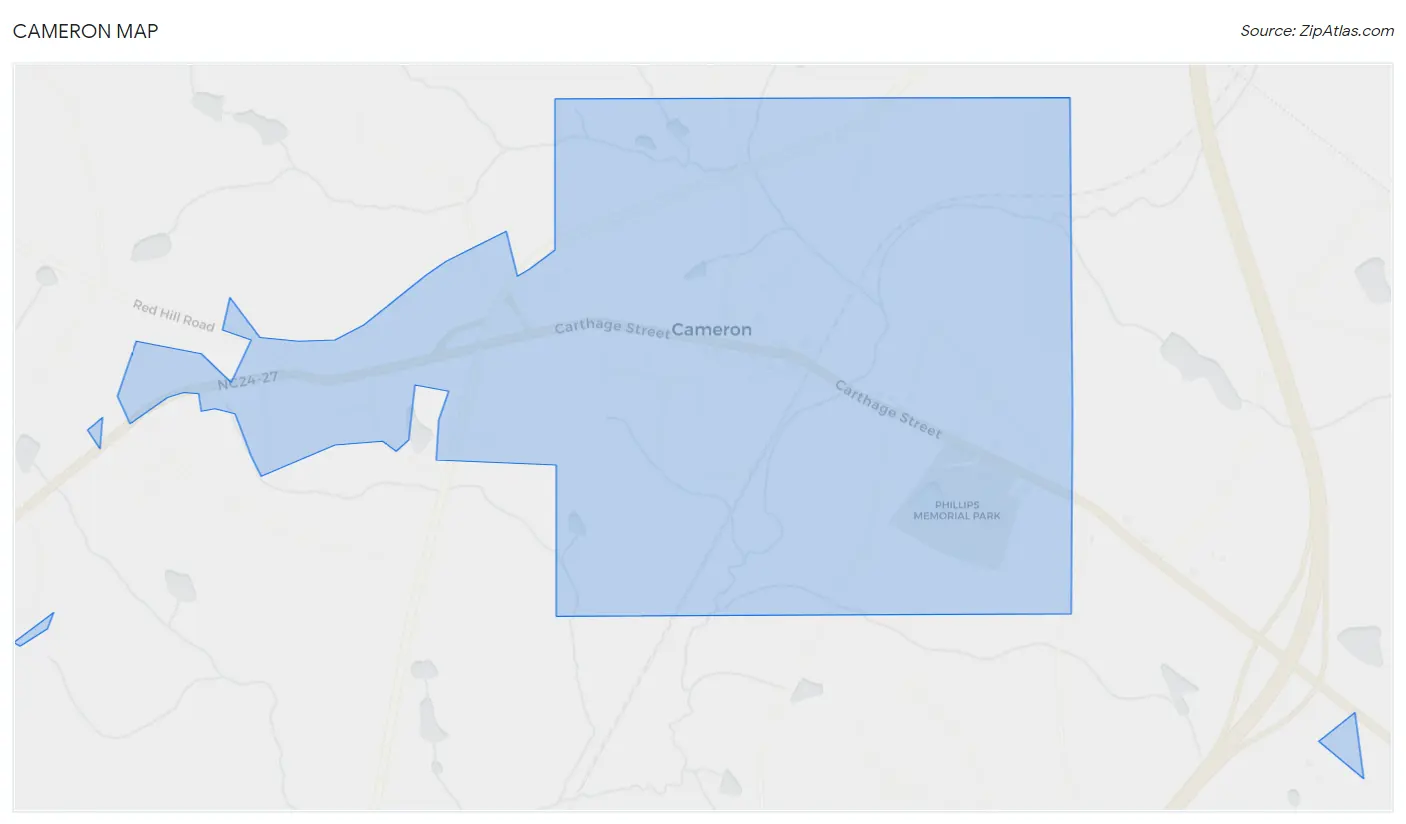
Cameron Overview
$27,321
PER CAPITA INCOME
$75,000
AVG FAMILY INCOME
$71,696
AVG HOUSEHOLD INCOME
0.29
INEQUALITY / GINI INDEX
427
TOTAL POPULATION
181
MALE POPULATION
246
FEMALE POPULATION
73.58
MALES / 100 FEMALES
135.91
FEMALES / 100 MALES
36.9
MEDIAN AGE
3.0
AVG FAMILY SIZE
2.8
AVG HOUSEHOLD SIZE
260
LABOR FORCE [ PEOPLE ]
73.2%
PERCENT IN LABOR FORCE
1.9%
UNEMPLOYMENT RATE
Cameron Zip Codes
Cameron Area Codes
Income in Cameron
Income Overview in Cameron
Per Capita Income in Cameron is $27,321, while median incomes of families and households are $75,000 and $71,696 respectively.
| Characteristic | Number | Measure |
| Per Capita Income | 427 | $27,321 |
| Median Family Income | 136 | $75,000 |
| Mean Family Income | 136 | $78,608 |
| Median Household Income | 153 | $71,696 |
| Mean Household Income | 153 | $76,226 |
| Income Deficit | 136 | $0 |
| Wage / Income Gap (%) | 427 | 0.00% |
| Wage / Income Gap ($) | 427 | 100.00¢ per $1 |
| Gini / Inequality Index | 427 | 0.29 |
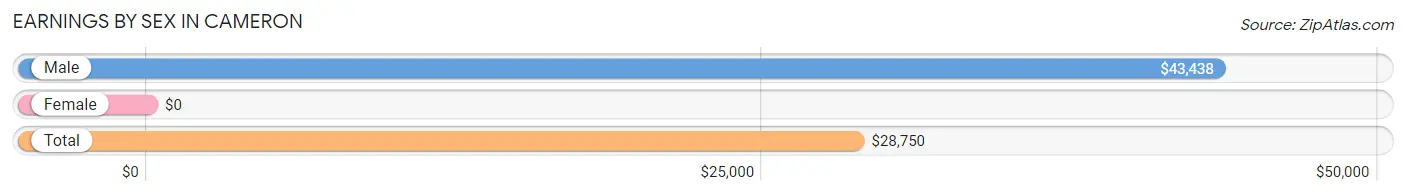
Earnings by Sex in Cameron
| Sex | Number | Average Earnings |
| Male | 110 (42.6%) | $43,438 |
| Female | 148 (57.4%) | $0 |
| Total | 258 (100.0%) | $28,750 |
Earnings by Sex by Income Bracket in Cameron
The most common earnings brackets in Cameron are $40,000 to $44,999 for men (22 | 20.0%) and $5,000 to $7,499 for women (34 | 23.0%).

| Income | Male | Female |
| $2,499 or less | 3 (2.7%) | 26 (17.6%) |
| $2,500 to $4,999 | 19 (17.3%) | 4 (2.7%) |
| $5,000 to $7,499 | 0 (0.0%) | 34 (23.0%) |
| $7,500 to $9,999 | 0 (0.0%) | 2 (1.3%) |
| $10,000 to $12,499 | 0 (0.0%) | 2 (1.3%) |
| $12,500 to $14,999 | 0 (0.0%) | 0 (0.0%) |
| $15,000 to $17,499 | 0 (0.0%) | 0 (0.0%) |
| $17,500 to $19,999 | 5 (4.5%) | 7 (4.7%) |
| $20,000 to $22,499 | 0 (0.0%) | 2 (1.3%) |
| $22,500 to $24,999 | 2 (1.8%) | 12 (8.1%) |
| $25,000 to $29,999 | 5 (4.5%) | 16 (10.8%) |
| $30,000 to $34,999 | 6 (5.4%) | 18 (12.2%) |
| $35,000 to $39,999 | 3 (2.7%) | 0 (0.0%) |
| $40,000 to $44,999 | 22 (20.0%) | 1 (0.7%) |
| $45,000 to $49,999 | 10 (9.1%) | 0 (0.0%) |
| $50,000 to $54,999 | 2 (1.8%) | 0 (0.0%) |
| $55,000 to $64,999 | 11 (10.0%) | 17 (11.5%) |
| $65,000 to $74,999 | 11 (10.0%) | 7 (4.7%) |
| $75,000 to $99,999 | 0 (0.0%) | 0 (0.0%) |
| $100,000+ | 11 (10.0%) | 0 (0.0%) |
| Total | 110 (100.0%) | 148 (100.0%) |
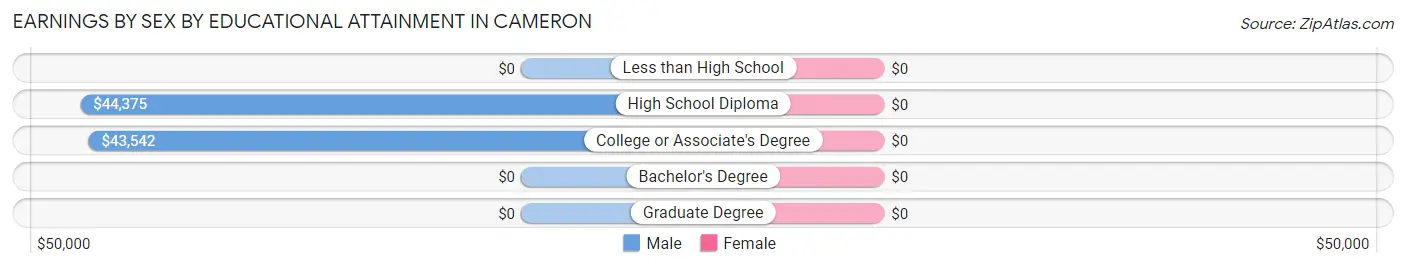
Earnings by Sex by Educational Attainment in Cameron
| Educational Attainment | Male Income | Female Income |
| Less than High School | - | - |
| High School Diploma | $44,375 | $0 |
| College or Associate's Degree | $43,542 | $0 |
| Bachelor's Degree | - | - |
| Graduate Degree | - | - |
| Total | $44,922 | $23,854 |
Family Income in Cameron
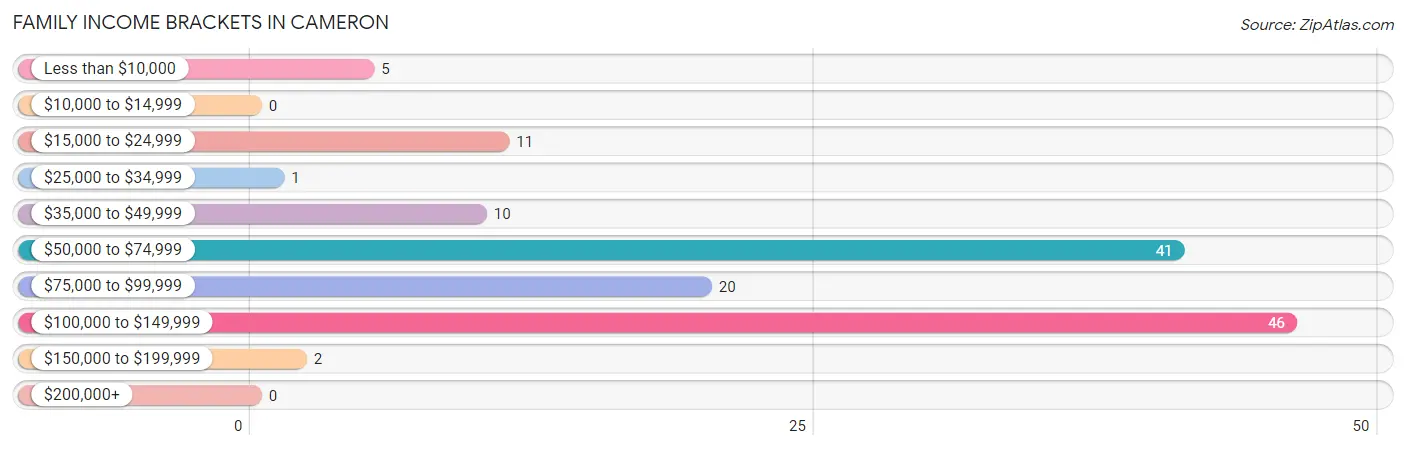
Family Income Brackets in Cameron
According to the Cameron family income data, there are 46 families falling into the $100,000 to $149,999 income range, which is the most common income bracket and makes up 33.8% of all families.
| Income Bracket | # Families | % Families |
| Less than $10,000 | 5 | 3.7% |
| $10,000 to $14,999 | 0 | 0.0% |
| $15,000 to $24,999 | 11 | 8.1% |
| $25,000 to $34,999 | 1 | 0.7% |
| $35,000 to $49,999 | 10 | 7.4% |
| $50,000 to $74,999 | 41 | 30.1% |
| $75,000 to $99,999 | 20 | 14.7% |
| $100,000 to $149,999 | 46 | 33.8% |
| $150,000 to $199,999 | 2 | 1.5% |
| $200,000+ | 0 | 0.0% |
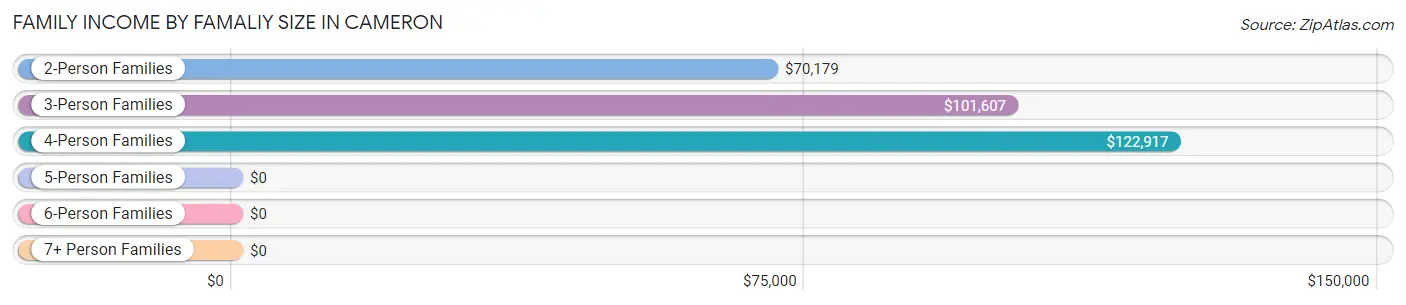
Family Income by Famaliy Size in Cameron
4-person families (10 | 7.3%) account for the highest median family income in Cameron with $122,917 per family, while 2-person families (88 | 64.7%) have the highest median income of $35,090 per family member.
| Income Bracket | # Families | Median Income |
| 2-Person Families | 88 (64.7%) | $70,179 |
| 3-Person Families | 25 (18.4%) | $101,607 |
| 4-Person Families | 10 (7.3%) | $122,917 |
| 5-Person Families | 3 (2.2%) | $0 |
| 6-Person Families | 10 (7.3%) | $0 |
| 7+ Person Families | 0 (0.0%) | $0 |
| Total | 136 (100.0%) | $75,000 |
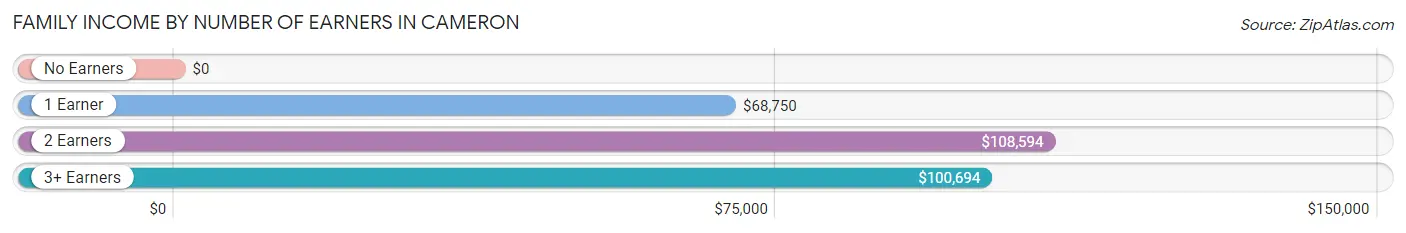
Family Income by Number of Earners in Cameron
| Number of Earners | # Families | Median Income |
| No Earners | 26 (19.1%) | $0 |
| 1 Earner | 42 (30.9%) | $68,750 |
| 2 Earners | 55 (40.4%) | $108,594 |
| 3+ Earners | 13 (9.6%) | $100,694 |
| Total | 136 (100.0%) | $75,000 |
Household Income in Cameron
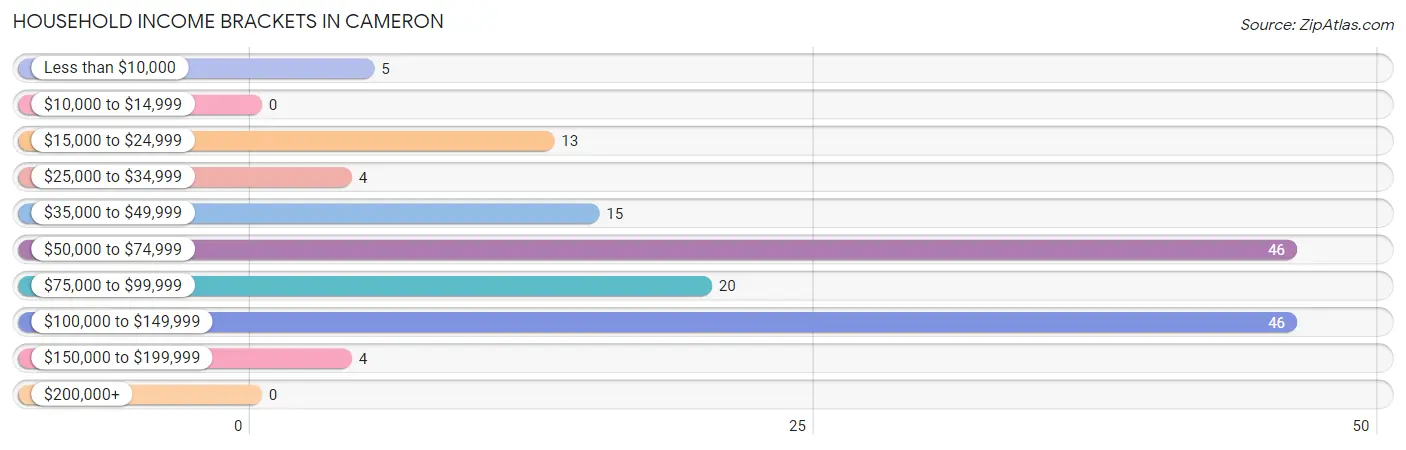
Household Income Brackets in Cameron
With 46 households falling in the category, the $50,000 to $74,999 income range is the most frequent in Cameron, accounting for 30.1% of all households.
| Income Bracket | # Households | % Households |
| Less than $10,000 | 5 | 3.3% |
| $10,000 to $14,999 | 0 | 0.0% |
| $15,000 to $24,999 | 13 | 8.5% |
| $25,000 to $34,999 | 4 | 2.6% |
| $35,000 to $49,999 | 15 | 9.8% |
| $50,000 to $74,999 | 46 | 30.1% |
| $75,000 to $99,999 | 20 | 13.1% |
| $100,000 to $149,999 | 46 | 30.1% |
| $150,000 to $199,999 | 4 | 2.6% |
| $200,000+ | 0 | 0.0% |
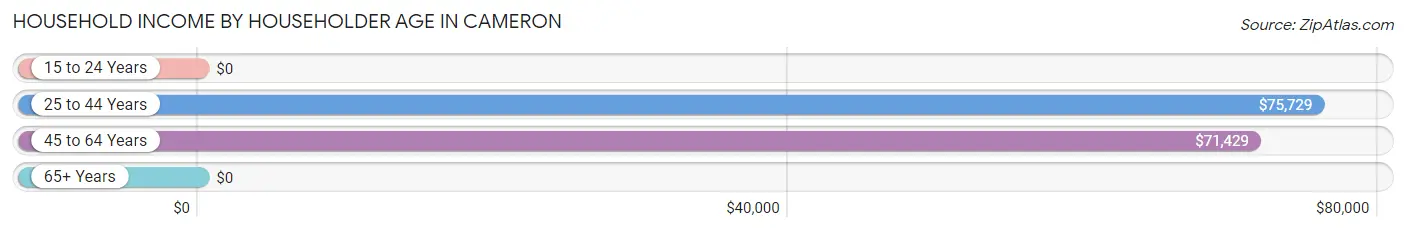
Household Income by Householder Age in Cameron
The median household income in Cameron is $71,696, with the highest median household income of $75,729 found in the 25 to 44 years age bracket for the primary householder. A total of 55 households (35.9%) fall into this category. Meanwhile, the 15 to 24 years age bracket for the primary householder has the lowest median household income of $0, with 8 households (5.2%) in this group.
| Income Bracket | # Households | Median Income |
| 15 to 24 Years | 8 (5.2%) | $0 |
| 25 to 44 Years | 55 (35.9%) | $75,729 |
| 45 to 64 Years | 50 (32.7%) | $71,429 |
| 65+ Years | 40 (26.1%) | $0 |
| Total | 153 (100.0%) | $71,696 |
Poverty in Cameron
Income Below Poverty by Sex and Age in Cameron
With 8.8% poverty level for males and 5.3% for females among the residents of Cameron, under 5 year old males and 5 year old females are the most vulnerable to poverty, with 12 males (41.4%) and 1 females (33.3%) in their respective age groups living below the poverty level.
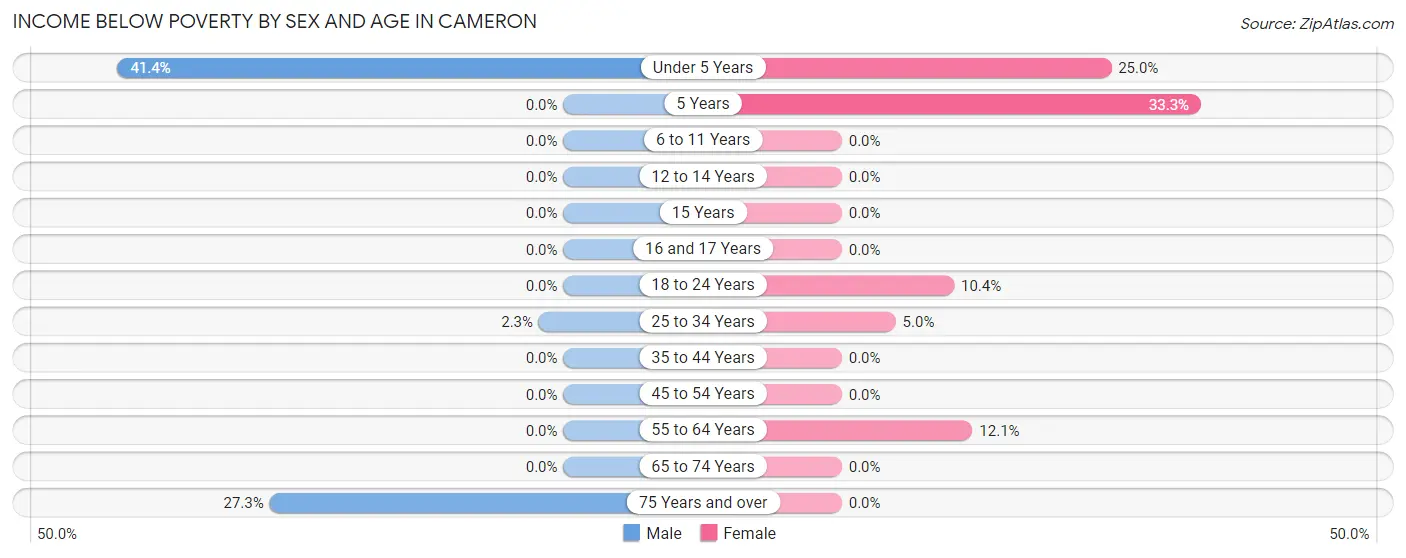
| Age Bracket | Male | Female |
| Under 5 Years | 12 (41.4%) | 2 (25.0%) |
| 5 Years | 0 (0.0%) | 1 (33.3%) |
| 6 to 11 Years | 0 (0.0%) | 0 (0.0%) |
| 12 to 14 Years | 0 (0.0%) | 0 (0.0%) |
| 15 Years | 0 (0.0%) | 0 (0.0%) |
| 16 and 17 Years | 0 (0.0%) | 0 (0.0%) |
| 18 to 24 Years | 0 (0.0%) | 5 (10.4%) |
| 25 to 34 Years | 1 (2.3%) | 1 (5.0%) |
| 35 to 44 Years | 0 (0.0%) | 0 (0.0%) |
| 45 to 54 Years | 0 (0.0%) | 0 (0.0%) |
| 55 to 64 Years | 0 (0.0%) | 4 (12.1%) |
| 65 to 74 Years | 0 (0.0%) | 0 (0.0%) |
| 75 Years and over | 3 (27.3%) | 0 (0.0%) |
| Total | 16 (8.8%) | 13 (5.3%) |
Income Above Poverty by Sex and Age in Cameron
According to the poverty statistics in Cameron, males aged 5 years and females aged 6 to 11 years are the age groups that are most secure financially, with 100.0% of males and 100.0% of females in these age groups living above the poverty line.
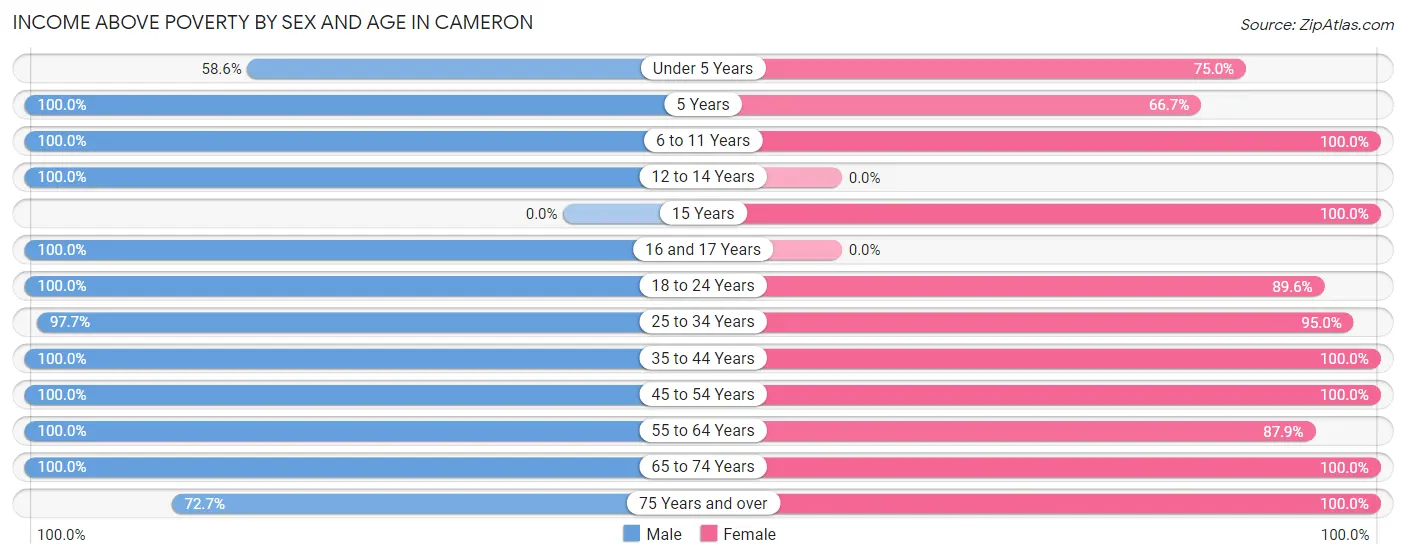
| Age Bracket | Male | Female |
| Under 5 Years | 17 (58.6%) | 6 (75.0%) |
| 5 Years | 2 (100.0%) | 2 (66.7%) |
| 6 to 11 Years | 8 (100.0%) | 18 (100.0%) |
| 12 to 14 Years | 1 (100.0%) | 0 (0.0%) |
| 15 Years | 0 (0.0%) | 3 (100.0%) |
| 16 and 17 Years | 7 (100.0%) | 0 (0.0%) |
| 18 to 24 Years | 18 (100.0%) | 43 (89.6%) |
| 25 to 34 Years | 43 (97.7%) | 19 (95.0%) |
| 35 to 44 Years | 8 (100.0%) | 40 (100.0%) |
| 45 to 54 Years | 11 (100.0%) | 22 (100.0%) |
| 55 to 64 Years | 26 (100.0%) | 29 (87.9%) |
| 65 to 74 Years | 16 (100.0%) | 18 (100.0%) |
| 75 Years and over | 8 (72.7%) | 33 (100.0%) |
| Total | 165 (91.2%) | 233 (94.7%) |
Income Below Poverty Among Married-Couple Families in Cameron
The poverty statistics for married-couple families in Cameron show that 5.1% or 5 of the total 98 families live below the poverty line. Families with no children have the highest poverty rate of 6.6%, comprising of 4 families. On the other hand, families with 3 or 4 children have the lowest poverty rate of 0.0%, which includes 0 families.
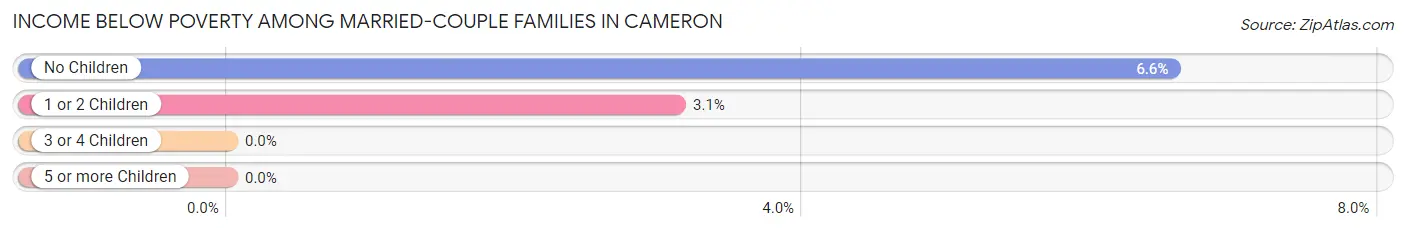
| Children | Above Poverty | Below Poverty |
| No Children | 57 (93.4%) | 4 (6.6%) |
| 1 or 2 Children | 31 (96.9%) | 1 (3.1%) |
| 3 or 4 Children | 5 (100.0%) | 0 (0.0%) |
| 5 or more Children | 0 (0.0%) | 0 (0.0%) |
| Total | 93 (94.9%) | 5 (5.1%) |
Income Below Poverty Among Single-Parent Households in Cameron
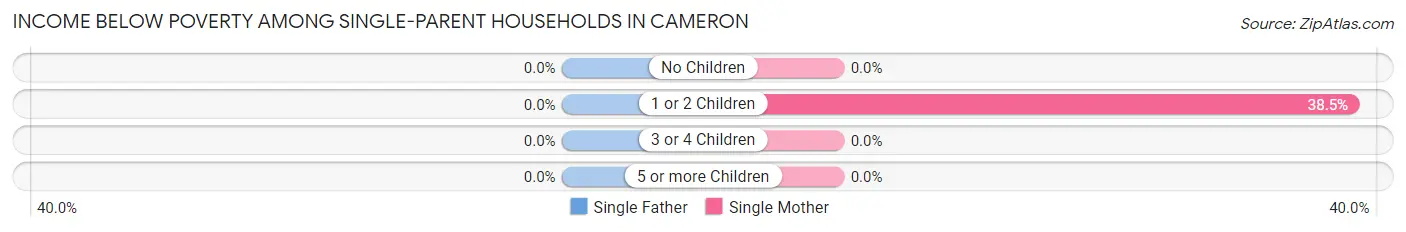
| Children | Single Father | Single Mother |
| No Children | 0 (0.0%) | 0 (0.0%) |
| 1 or 2 Children | 0 (0.0%) | 5 (38.5%) |
| 3 or 4 Children | 0 (0.0%) | 0 (0.0%) |
| 5 or more Children | 0 (0.0%) | 0 (0.0%) |
| Total | 0 (0.0%) | 5 (13.2%) |
Income Below Poverty Among Married-Couple vs Single-Parent Households in Cameron
The poverty data for Cameron shows that 5 of the married-couple family households (5.1%) and 5 of the single-parent households (13.2%) are living below the poverty level. Within the married-couple family households, those with no children have the highest poverty rate, with 4 households (6.6%) falling below the poverty line. Among the single-parent households, those with 1 or 2 children have the highest poverty rate, with 5 household (38.5%) living below poverty.
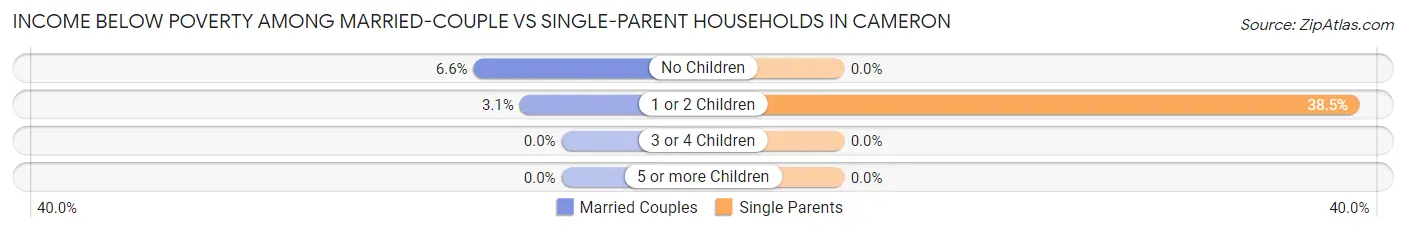
| Children | Married-Couple Families | Single-Parent Households |
| No Children | 4 (6.6%) | 0 (0.0%) |
| 1 or 2 Children | 1 (3.1%) | 5 (38.5%) |
| 3 or 4 Children | 0 (0.0%) | 0 (0.0%) |
| 5 or more Children | 0 (0.0%) | 0 (0.0%) |
| Total | 5 (5.1%) | 5 (13.2%) |
Race in Cameron
The most populous races in Cameron are White / Caucasian (247 | 57.9%), Black / African American (165 | 38.6%), and Two or more Races (13 | 3.0%).
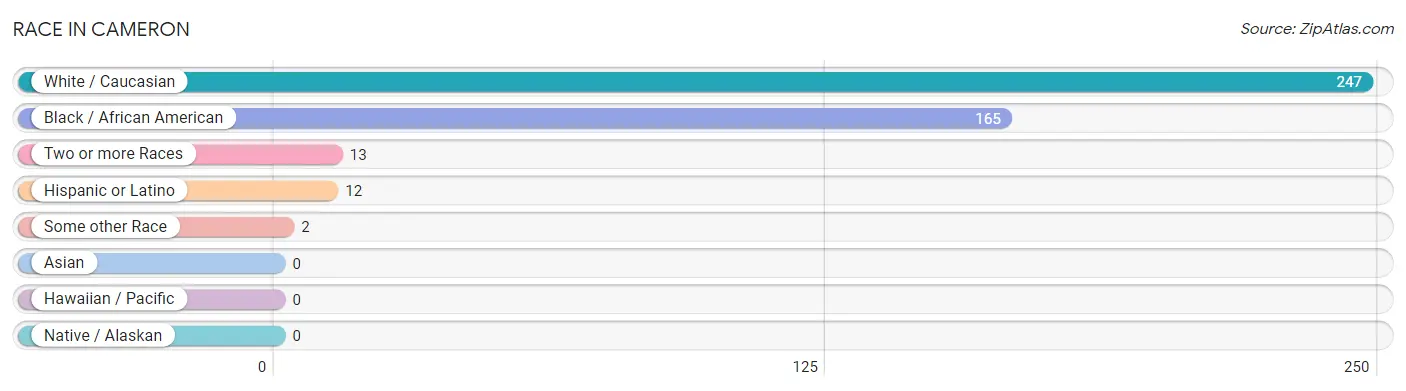
| Race | # Population | % Population |
| Asian | 0 | 0.0% |
| Black / African American | 165 | 38.6% |
| Hawaiian / Pacific | 0 | 0.0% |
| Hispanic or Latino | 12 | 2.8% |
| Native / Alaskan | 0 | 0.0% |
| White / Caucasian | 247 | 57.9% |
| Two or more Races | 13 | 3.0% |
| Some other Race | 2 | 0.5% |
| Total | 427 | 100.0% |
Ancestry in Cameron
The most populous ancestries reported in Cameron are German (61 | 14.3%), English (54 | 12.7%), Scottish (45 | 10.5%), American (17 | 4.0%), and Irish (15 | 3.5%), together accounting for 45.0% of all Cameron residents.
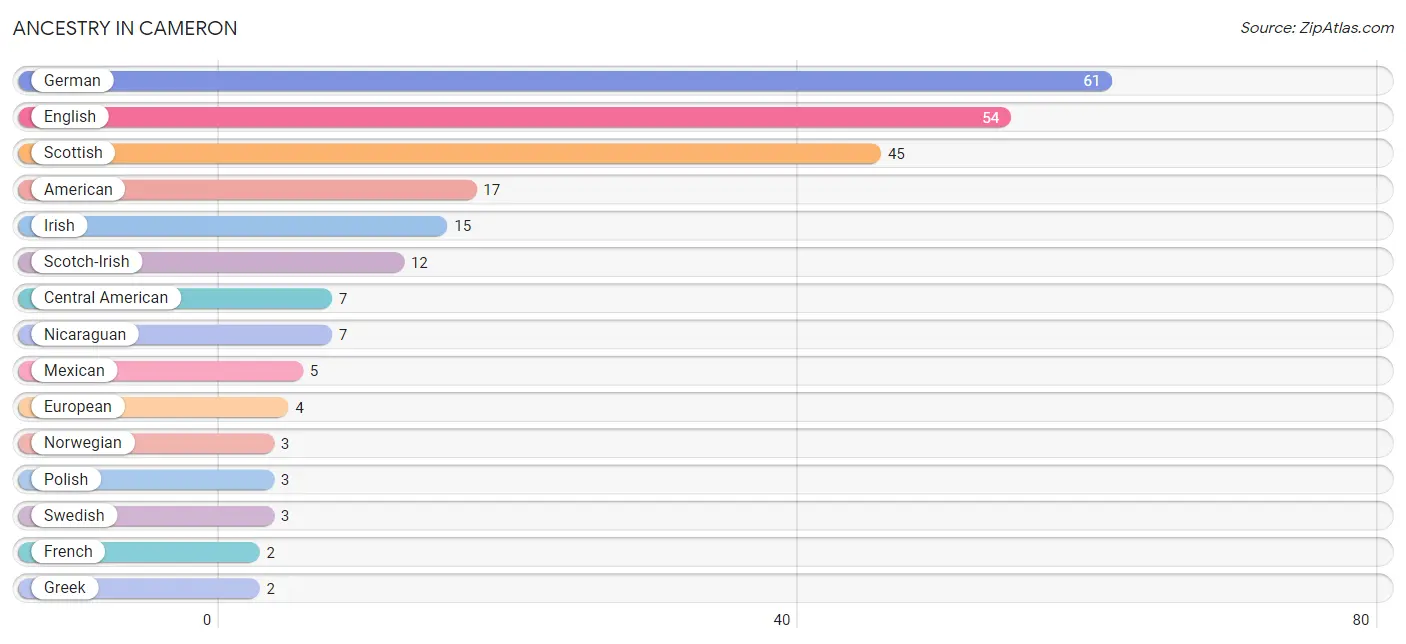
| Ancestry | # Population | % Population |
| American | 17 | 4.0% |
| Central American | 7 | 1.6% |
| Cherokee | 1 | 0.2% |
| Dutch | 1 | 0.2% |
| English | 54 | 12.7% |
| European | 4 | 0.9% |
| French | 2 | 0.5% |
| German | 61 | 14.3% |
| Greek | 2 | 0.5% |
| Hungarian | 1 | 0.2% |
| Irish | 15 | 3.5% |
| Mexican | 5 | 1.2% |
| Nicaraguan | 7 | 1.6% |
| Norwegian | 3 | 0.7% |
| Polish | 3 | 0.7% |
| Scotch-Irish | 12 | 2.8% |
| Scottish | 45 | 10.5% |
| Swedish | 3 | 0.7% | View All 18 Rows |
Immigrants in Cameron
The most numerous immigrant groups reported in Cameron came from Central America (2 | 0.5%), Latin America (2 | 0.5%), and Mexico (2 | 0.5%), together accounting for 1.4% of all Cameron residents.
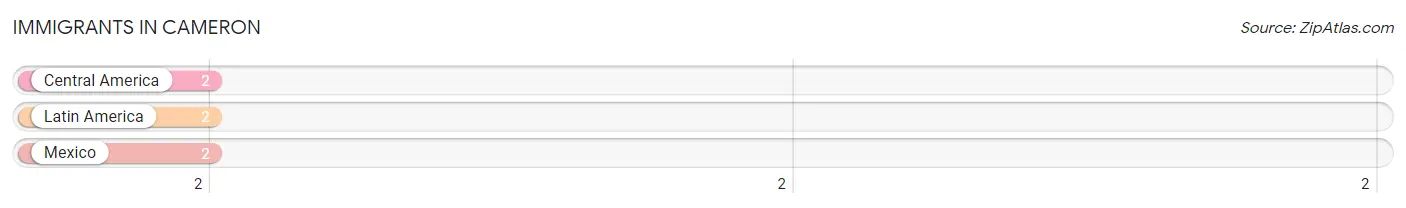
| Immigration Origin | # Population | % Population |
| Central America | 2 | 0.5% |
| Latin America | 2 | 0.5% |
| Mexico | 2 | 0.5% | View All 3 Rows |
Sex and Age in Cameron
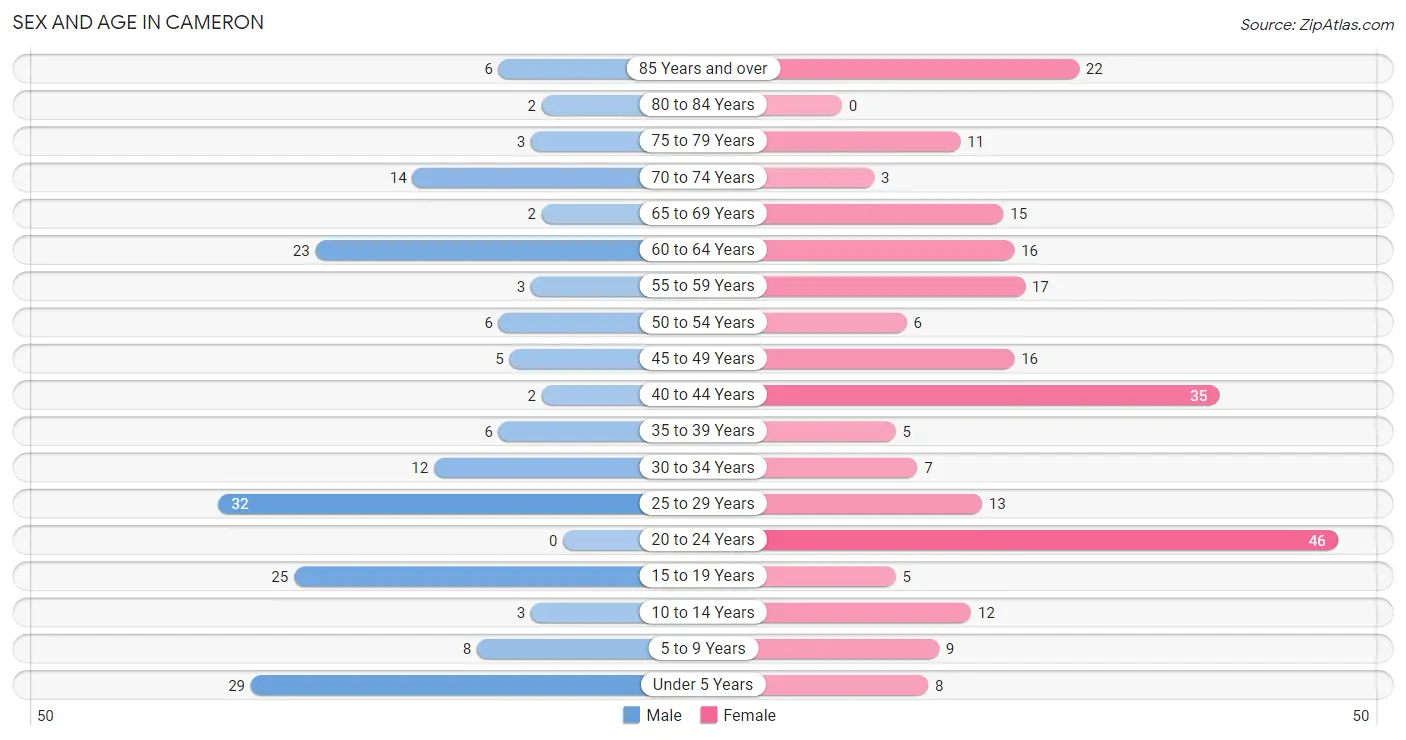
Sex and Age in Cameron
The most populous age groups in Cameron are 25 to 29 Years (32 | 17.7%) for men and 20 to 24 Years (46 | 18.7%) for women.
| Age Bracket | Male | Female |
| Under 5 Years | 29 (16.0%) | 8 (3.3%) |
| 5 to 9 Years | 8 (4.4%) | 9 (3.7%) |
| 10 to 14 Years | 3 (1.7%) | 12 (4.9%) |
| 15 to 19 Years | 25 (13.8%) | 5 (2.0%) |
| 20 to 24 Years | 0 (0.0%) | 46 (18.7%) |
| 25 to 29 Years | 32 (17.7%) | 13 (5.3%) |
| 30 to 34 Years | 12 (6.6%) | 7 (2.9%) |
| 35 to 39 Years | 6 (3.3%) | 5 (2.0%) |
| 40 to 44 Years | 2 (1.1%) | 35 (14.2%) |
| 45 to 49 Years | 5 (2.8%) | 16 (6.5%) |
| 50 to 54 Years | 6 (3.3%) | 6 (2.4%) |
| 55 to 59 Years | 3 (1.7%) | 17 (6.9%) |
| 60 to 64 Years | 23 (12.7%) | 16 (6.5%) |
| 65 to 69 Years | 2 (1.1%) | 15 (6.1%) |
| 70 to 74 Years | 14 (7.7%) | 3 (1.2%) |
| 75 to 79 Years | 3 (1.7%) | 11 (4.5%) |
| 80 to 84 Years | 2 (1.1%) | 0 (0.0%) |
| 85 Years and over | 6 (3.3%) | 22 (8.9%) |
| Total | 181 (100.0%) | 246 (100.0%) |
Families and Households in Cameron
Median Family Size in Cameron
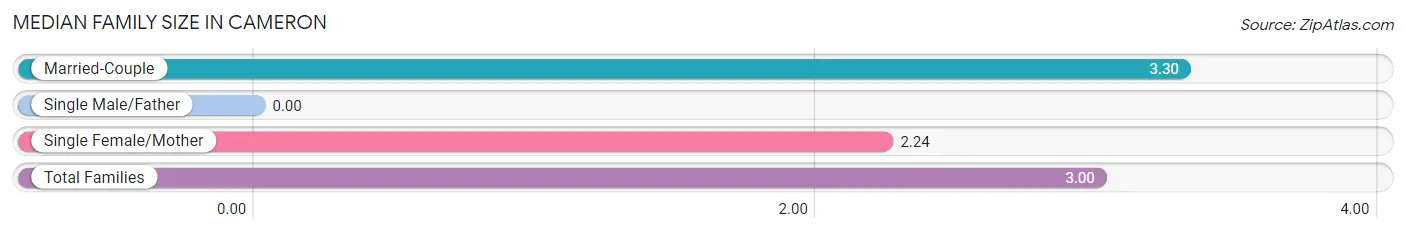
| Family Type | # Families | Family Size |
| Married-Couple | 98 (72.1%) | 3.30 |
| Single Male/Father | 0 (0.0%) | - |
| Single Female/Mother | 38 (27.9%) | 2.24 |
| Total Families | 136 (100.0%) | 3.00 |
Median Household Size in Cameron
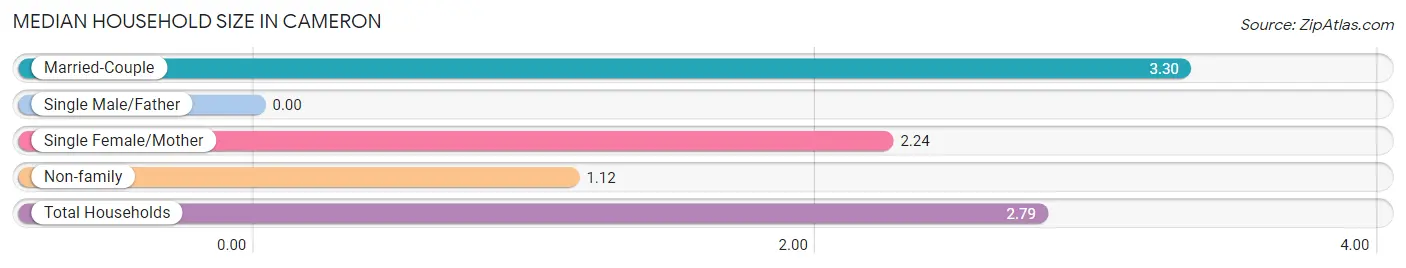
| Household Type | # Households | Household Size |
| Married-Couple | 98 (64.0%) | 3.30 |
| Single Male/Father | 0 (0.0%) | - |
| Single Female/Mother | 38 (24.8%) | 2.24 |
| Non-family | 17 (11.1%) | 1.12 |
| Total Households | 153 (100.0%) | 2.79 |
Household Size by Marriage Status in Cameron
Out of a total of 153 households in Cameron, 136 (88.9%) are family households, while 17 (11.1%) are nonfamily households. The most numerous type of family households are 2-person households, comprising 88, and the most common type of nonfamily households are 1-person households, comprising 15.
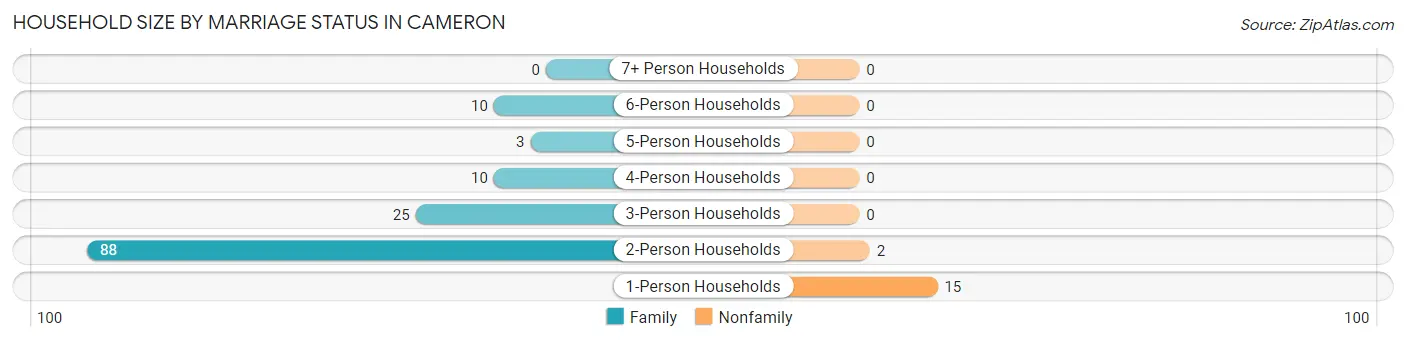
| Household Size | Family Households | Nonfamily Households |
| 1-Person Households | - | 15 (9.8%) |
| 2-Person Households | 88 (57.5%) | 2 (1.3%) |
| 3-Person Households | 25 (16.3%) | 0 (0.0%) |
| 4-Person Households | 10 (6.5%) | 0 (0.0%) |
| 5-Person Households | 3 (2.0%) | 0 (0.0%) |
| 6-Person Households | 10 (6.5%) | 0 (0.0%) |
| 7+ Person Households | 0 (0.0%) | 0 (0.0%) |
| Total | 136 (88.9%) | 17 (11.1%) |
Female Fertility in Cameron
Fertility by Age in Cameron
Average fertility rate in Cameron is 31.0 births per 1,000 women. Women in the age bracket of 35 to 50 years have the highest fertility rate with 36.0 births per 1,000 women. Women in the age bracket of 20 to 34 years acount for 50.0% of all women with births.
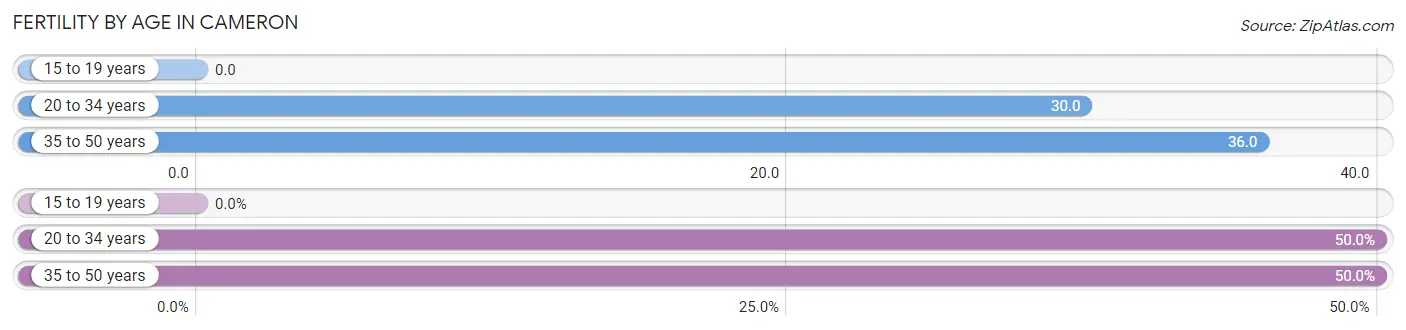
| Age Bracket | Women with Births | Births / 1,000 Women |
| 15 to 19 years | 0 (0.0%) | 0.0 |
| 20 to 34 years | 2 (50.0%) | 30.0 |
| 35 to 50 years | 2 (50.0%) | 36.0 |
| Total | 4 (100.0%) | 31.0 |
Fertility by Age by Marriage Status in Cameron
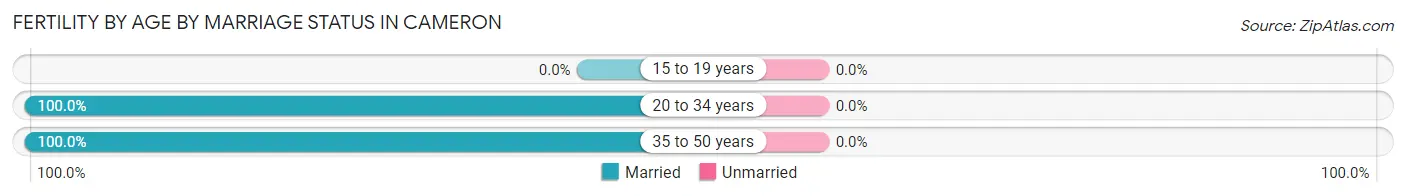
| Age Bracket | Married | Unmarried |
| 15 to 19 years | 0 (0.0%) | 0 (0.0%) |
| 20 to 34 years | 2 (100.0%) | 0 (0.0%) |
| 35 to 50 years | 2 (100.0%) | 0 (0.0%) |
| Total | 4 (100.0%) | 0 (0.0%) |
Fertility by Education in Cameron
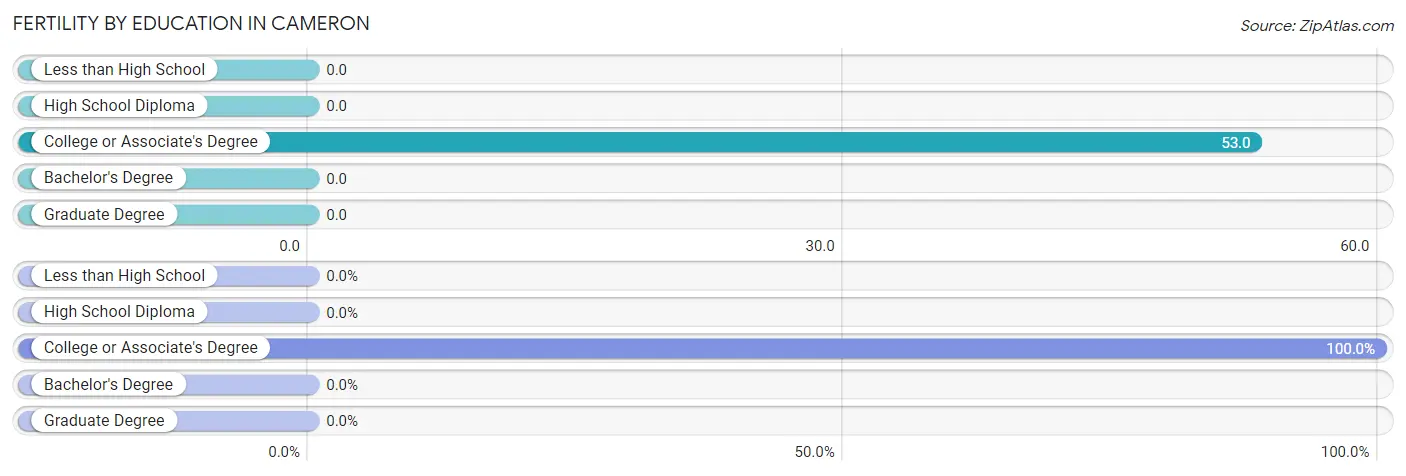
| Educational Attainment | Women with Births | Births / 1,000 Women |
| Less than High School | 0 (0.0%) | 0.0 |
| High School Diploma | 0 (0.0%) | 0.0 |
| College or Associate's Degree | 4 (100.0%) | 53.0 |
| Bachelor's Degree | 0 (0.0%) | 0.0 |
| Graduate Degree | 0 (0.0%) | 0.0 |
| Total | 4 (100.0%) | 31.0 |
Fertility by Education by Marriage Status in Cameron
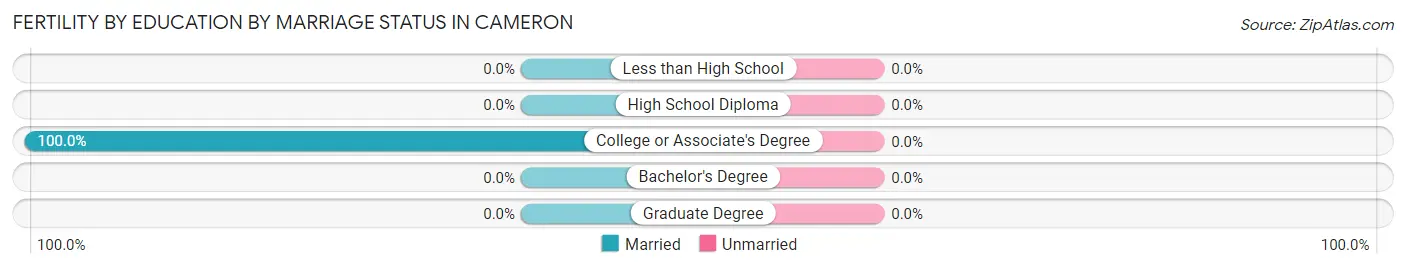
| Educational Attainment | Married | Unmarried |
| Less than High School | 0 (0.0%) | 0 (0.0%) |
| High School Diploma | 0 (0.0%) | 0 (0.0%) |
| College or Associate's Degree | 4 (100.0%) | 0 (0.0%) |
| Bachelor's Degree | 0 (0.0%) | 0 (0.0%) |
| Graduate Degree | 0 (0.0%) | 0 (0.0%) |
| Total | 4 (100.0%) | 0 (0.0%) |
Employment Characteristics in Cameron
Employment by Class of Employer in Cameron
Among the 243 employed individuals in Cameron, private company employees (163 | 67.1%), not-for-profit organizations (25 | 10.3%), and self-employed (incorporated) (22 | 9.0%) make up the most common classes of employment.
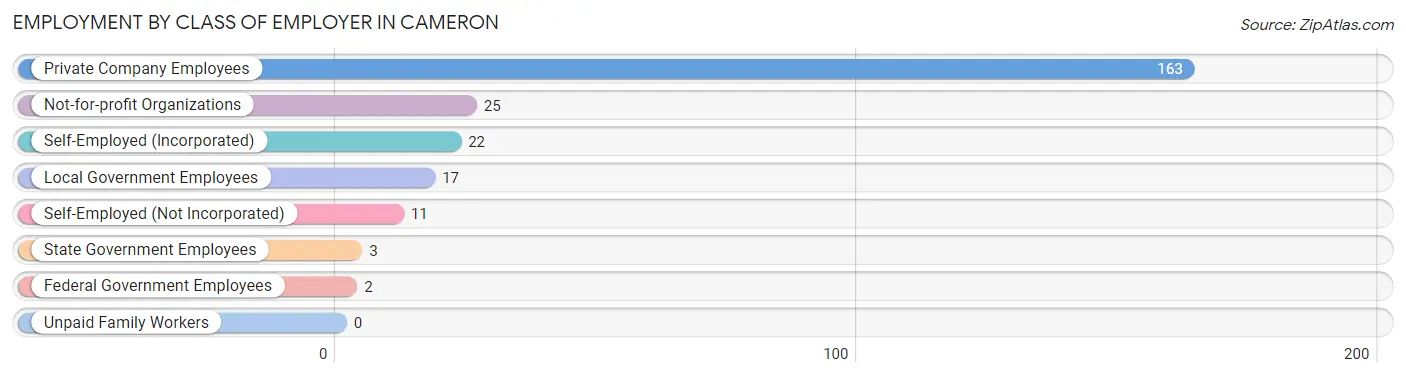
| Employer Class | # Employees | % Employees |
| Private Company Employees | 163 | 67.1% |
| Self-Employed (Incorporated) | 22 | 9.0% |
| Self-Employed (Not Incorporated) | 11 | 4.5% |
| Not-for-profit Organizations | 25 | 10.3% |
| Local Government Employees | 17 | 7.0% |
| State Government Employees | 3 | 1.2% |
| Federal Government Employees | 2 | 0.8% |
| Unpaid Family Workers | 0 | 0.0% |
| Total | 243 | 100.0% |
Employment Status by Age in Cameron
According to the labor force statistics for Cameron, out of the total population over 16 years of age (355), 73.2% or 260 individuals are in the labor force, with 1.9% or 5 of them unemployed. The age group with the highest labor force participation rate is 20 to 24 years, with 100.0% or 46 individuals in the labor force. Within the labor force, the 20 to 24 years age range has the highest percentage of unemployed individuals, with 10.9% or 5 of them being unemployed.
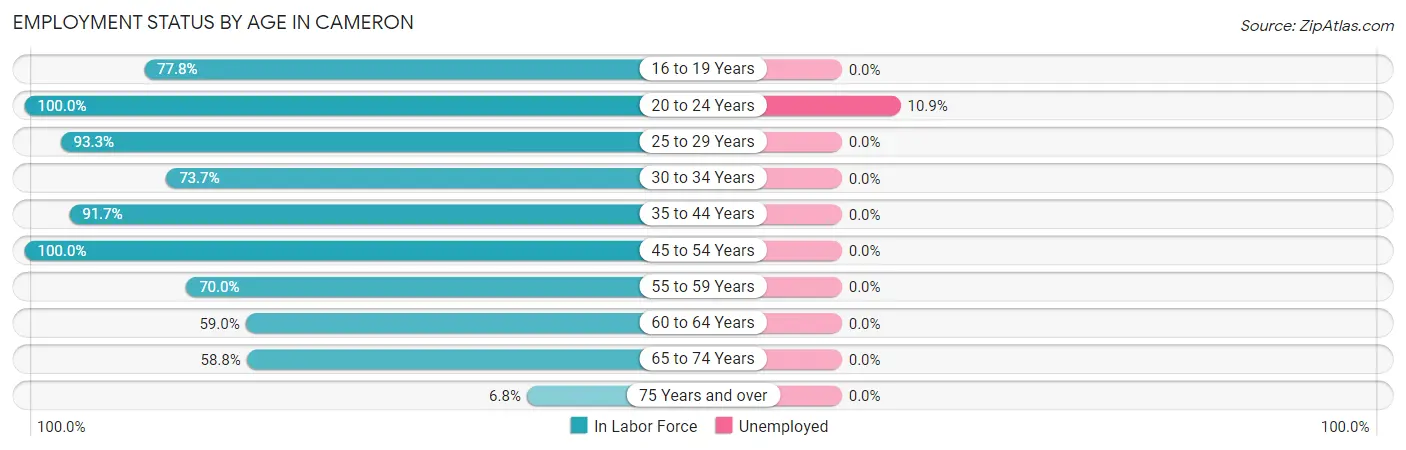
| Age Bracket | In Labor Force | Unemployed |
| 16 to 19 Years | 21 (77.8%) | 0 (0.0%) |
| 20 to 24 Years | 46 (100.0%) | 5 (10.9%) |
| 25 to 29 Years | 42 (93.3%) | 0 (0.0%) |
| 30 to 34 Years | 14 (73.7%) | 0 (0.0%) |
| 35 to 44 Years | 44 (91.7%) | 0 (0.0%) |
| 45 to 54 Years | 33 (100.0%) | 0 (0.0%) |
| 55 to 59 Years | 14 (70.0%) | 0 (0.0%) |
| 60 to 64 Years | 23 (59.0%) | 0 (0.0%) |
| 65 to 74 Years | 20 (58.8%) | 0 (0.0%) |
| 75 Years and over | 3 (6.8%) | 0 (0.0%) |
| Total | 260 (73.2%) | 5 (1.9%) |
Employment Status by Educational Attainment in Cameron
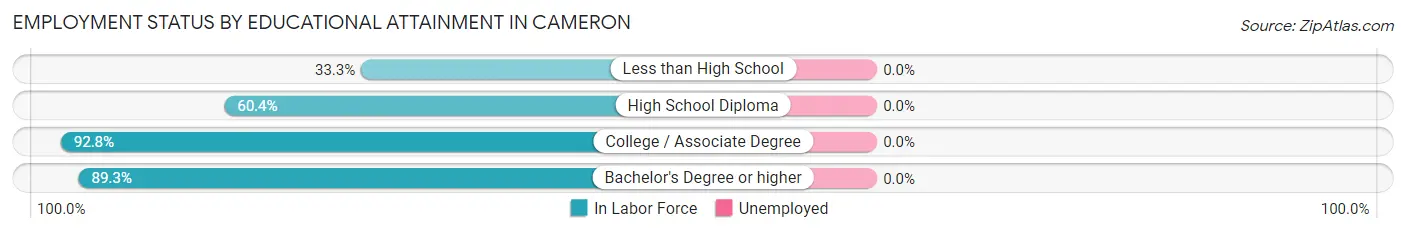
| Educational Attainment | In Labor Force | Unemployed |
| Less than High School | 1 (33.3%) | 0 (0.0%) |
| High School Diploma | 29 (60.4%) | 0 (0.0%) |
| College / Associate Degree | 90 (92.8%) | 0 (0.0%) |
| Bachelor's Degree or higher | 50 (89.3%) | 0 (0.0%) |
| Total | 170 (83.3%) | 0 (0.0%) |
Employment Occupations by Sex in Cameron
Management, Business, Science and Arts Occupations
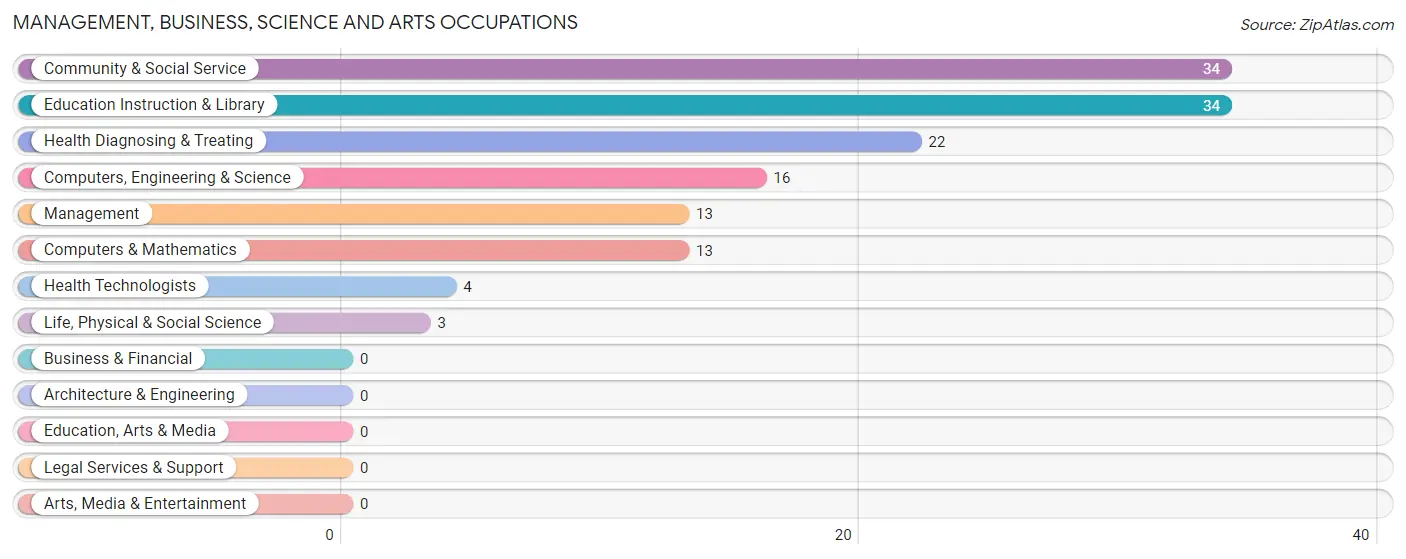
The most common Management, Business, Science and Arts occupations in Cameron are Community & Social Service (34 | 13.3%), Education Instruction & Library (34 | 13.3%), Health Diagnosing & Treating (22 | 8.6%), Computers, Engineering & Science (16 | 6.3%), and Management (13 | 5.1%).
Management, Business, Science and Arts Occupations by Sex
Within the Management, Business, Science and Arts occupations in Cameron, the most male-oriented occupations are Life, Physical & Social Science (100.0%), Health Technologists (100.0%), and Management (92.3%), while the most female-oriented occupations are Health Diagnosing & Treating (72.7%), Community & Social Service (67.6%), and Education Instruction & Library (67.6%).
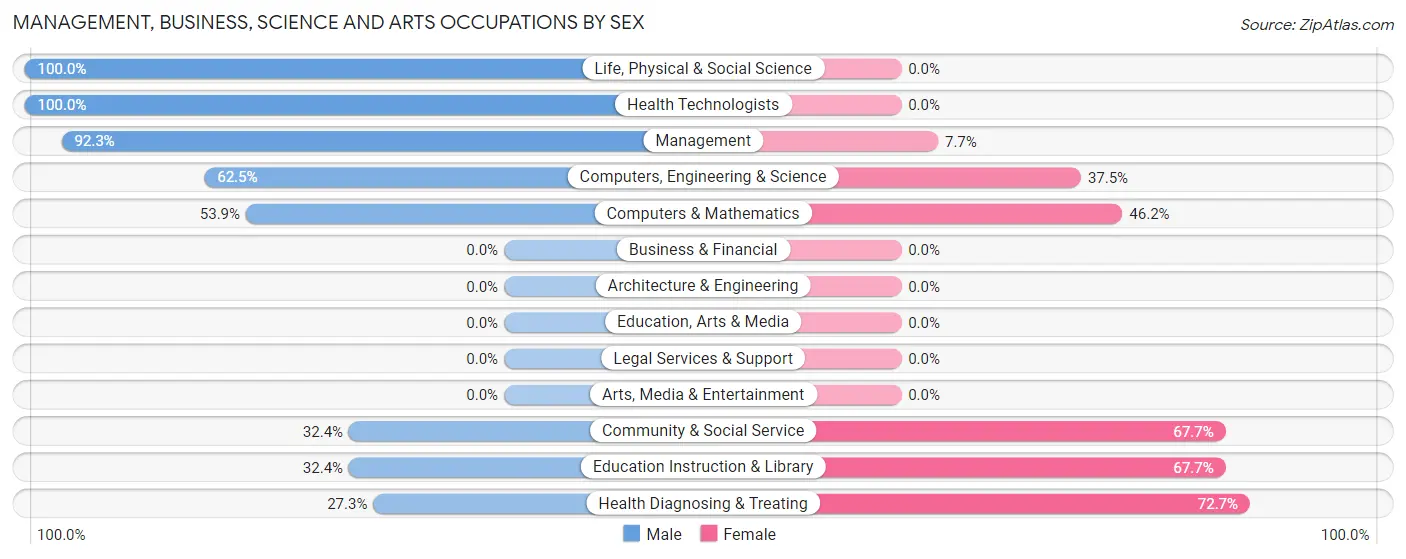
| Occupation | Male | Female |
| Management | 12 (92.3%) | 1 (7.7%) |
| Business & Financial | 0 (0.0%) | 0 (0.0%) |
| Computers, Engineering & Science | 10 (62.5%) | 6 (37.5%) |
| Computers & Mathematics | 7 (53.8%) | 6 (46.2%) |
| Architecture & Engineering | 0 (0.0%) | 0 (0.0%) |
| Life, Physical & Social Science | 3 (100.0%) | 0 (0.0%) |
| Community & Social Service | 11 (32.4%) | 23 (67.6%) |
| Education, Arts & Media | 0 (0.0%) | 0 (0.0%) |
| Legal Services & Support | 0 (0.0%) | 0 (0.0%) |
| Education Instruction & Library | 11 (32.4%) | 23 (67.6%) |
| Arts, Media & Entertainment | 0 (0.0%) | 0 (0.0%) |
| Health Diagnosing & Treating | 6 (27.3%) | 16 (72.7%) |
| Health Technologists | 4 (100.0%) | 0 (0.0%) |
| Total (Category) | 39 (45.9%) | 46 (54.1%) |
| Total (Overall) | 110 (43.1%) | 145 (56.9%) |
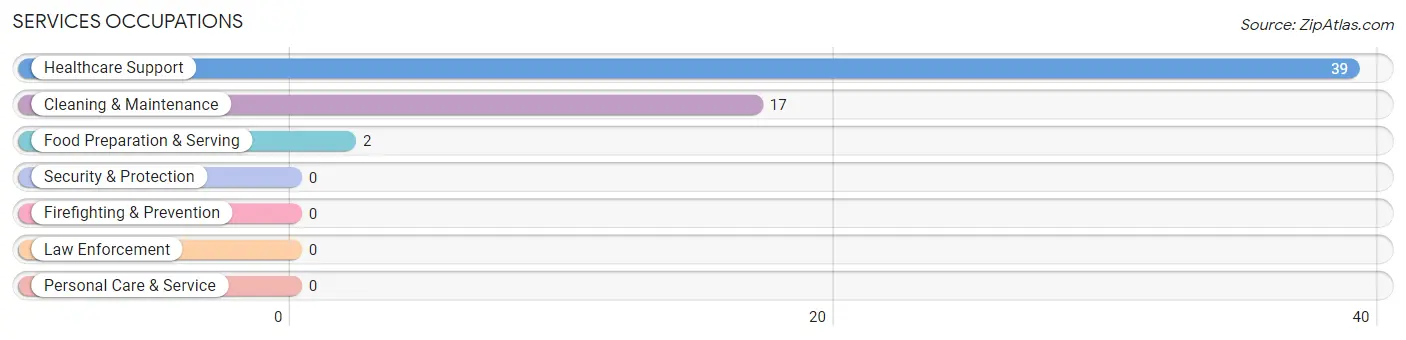
Services Occupations
The most common Services occupations in Cameron are Healthcare Support (39 | 15.3%), Cleaning & Maintenance (17 | 6.7%), and Food Preparation & Serving (2 | 0.8%).
Services Occupations by Sex
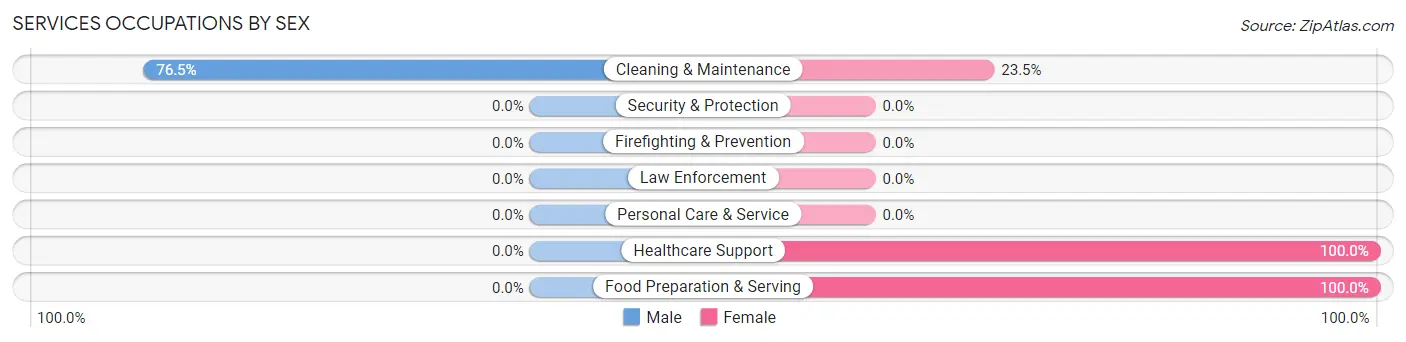
| Occupation | Male | Female |
| Healthcare Support | 0 (0.0%) | 39 (100.0%) |
| Security & Protection | 0 (0.0%) | 0 (0.0%) |
| Firefighting & Prevention | 0 (0.0%) | 0 (0.0%) |
| Law Enforcement | 0 (0.0%) | 0 (0.0%) |
| Food Preparation & Serving | 0 (0.0%) | 2 (100.0%) |
| Cleaning & Maintenance | 13 (76.5%) | 4 (23.5%) |
| Personal Care & Service | 0 (0.0%) | 0 (0.0%) |
| Total (Category) | 13 (22.4%) | 45 (77.6%) |
| Total (Overall) | 110 (43.1%) | 145 (56.9%) |
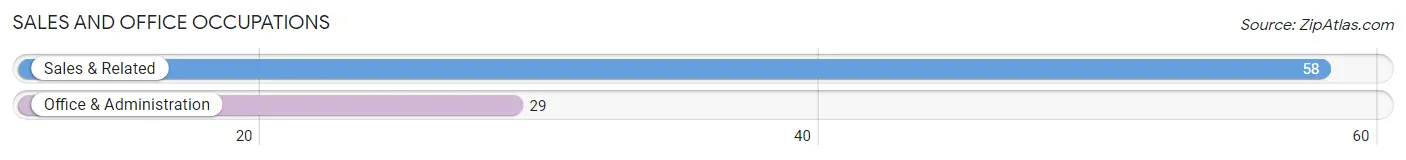
Sales and Office Occupations
The most common Sales and Office occupations in Cameron are Sales & Related (58 | 22.8%), and Office & Administration (29 | 11.4%).
Sales and Office Occupations by Sex
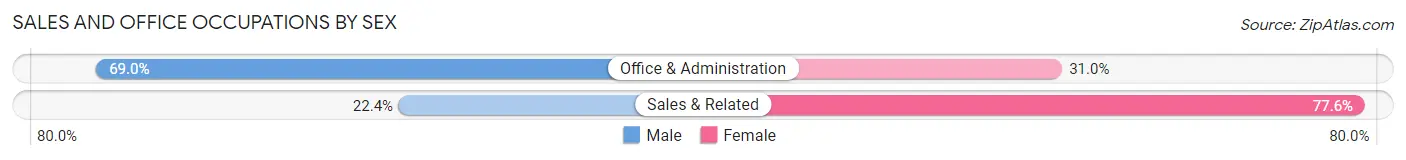
| Occupation | Male | Female |
| Sales & Related | 13 (22.4%) | 45 (77.6%) |
| Office & Administration | 20 (69.0%) | 9 (31.0%) |
| Total (Category) | 33 (37.9%) | 54 (62.1%) |
| Total (Overall) | 110 (43.1%) | 145 (56.9%) |
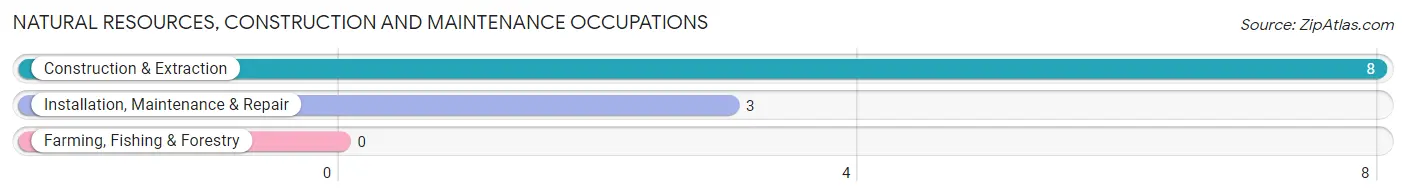
Natural Resources, Construction and Maintenance Occupations
The most common Natural Resources, Construction and Maintenance occupations in Cameron are Construction & Extraction (8 | 3.1%), and Installation, Maintenance & Repair (3 | 1.2%).
Natural Resources, Construction and Maintenance Occupations by Sex
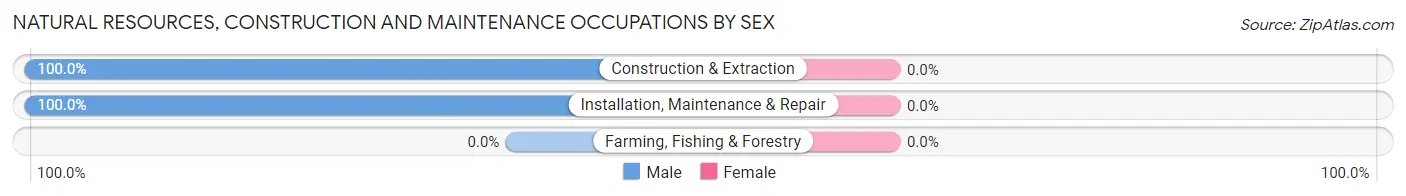
| Occupation | Male | Female |
| Farming, Fishing & Forestry | 0 (0.0%) | 0 (0.0%) |
| Construction & Extraction | 8 (100.0%) | 0 (0.0%) |
| Installation, Maintenance & Repair | 3 (100.0%) | 0 (0.0%) |
| Total (Category) | 11 (100.0%) | 0 (0.0%) |
| Total (Overall) | 110 (43.1%) | 145 (56.9%) |
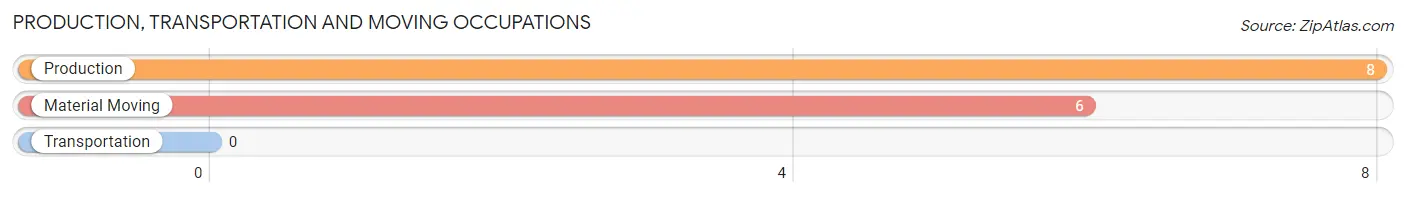
Production, Transportation and Moving Occupations
The most common Production, Transportation and Moving occupations in Cameron are Production (8 | 3.1%), and Material Moving (6 | 2.4%).
Production, Transportation and Moving Occupations by Sex
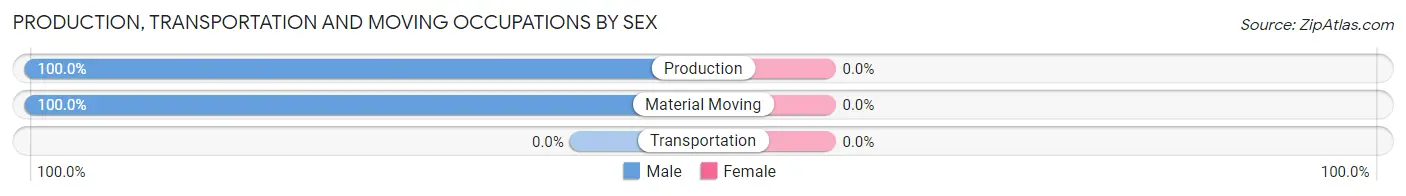
| Occupation | Male | Female |
| Production | 8 (100.0%) | 0 (0.0%) |
| Transportation | 0 (0.0%) | 0 (0.0%) |
| Material Moving | 6 (100.0%) | 0 (0.0%) |
| Total (Category) | 14 (100.0%) | 0 (0.0%) |
| Total (Overall) | 110 (43.1%) | 145 (56.9%) |
Employment Industries by Sex in Cameron
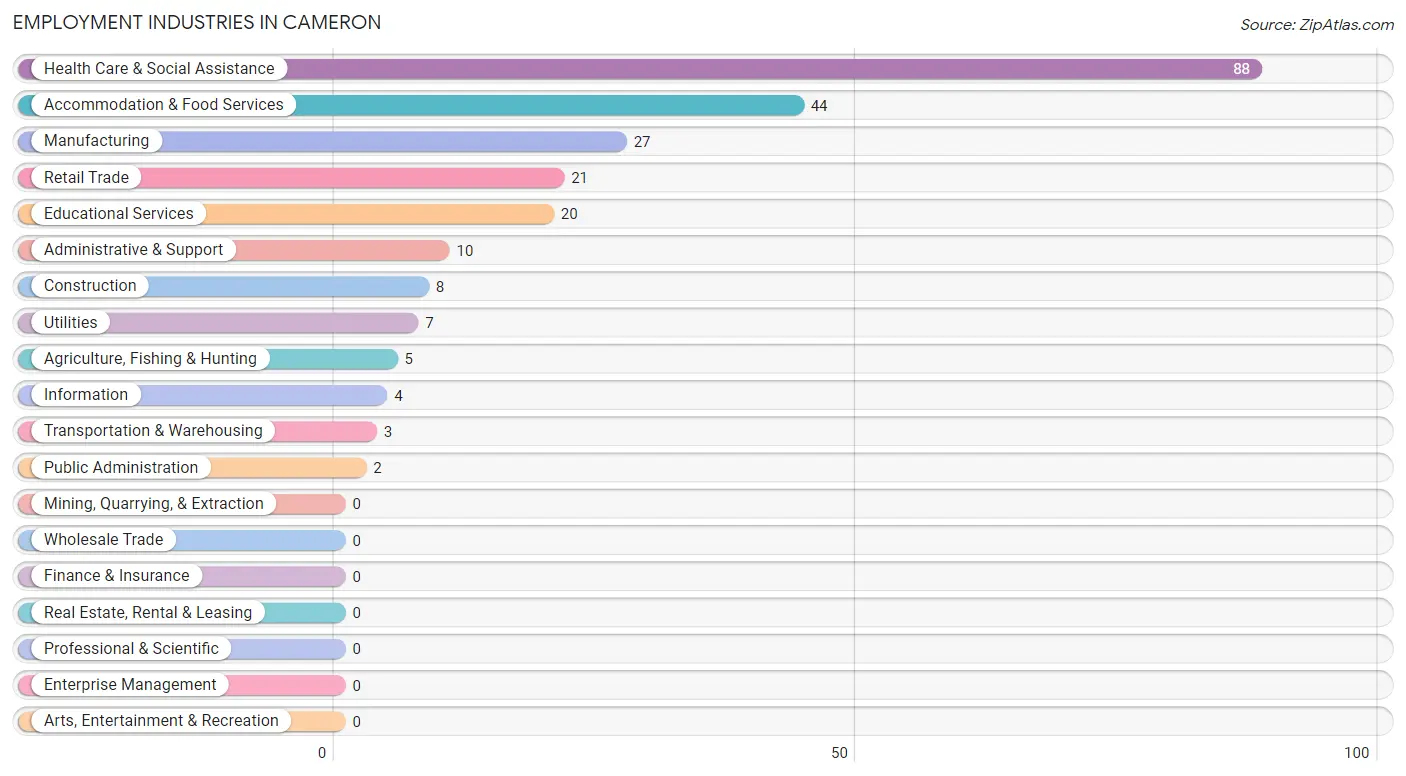
Employment Industries in Cameron
The major employment industries in Cameron include Health Care & Social Assistance (88 | 34.5%), Accommodation & Food Services (44 | 17.2%), Manufacturing (27 | 10.6%), Retail Trade (21 | 8.2%), and Educational Services (20 | 7.8%).
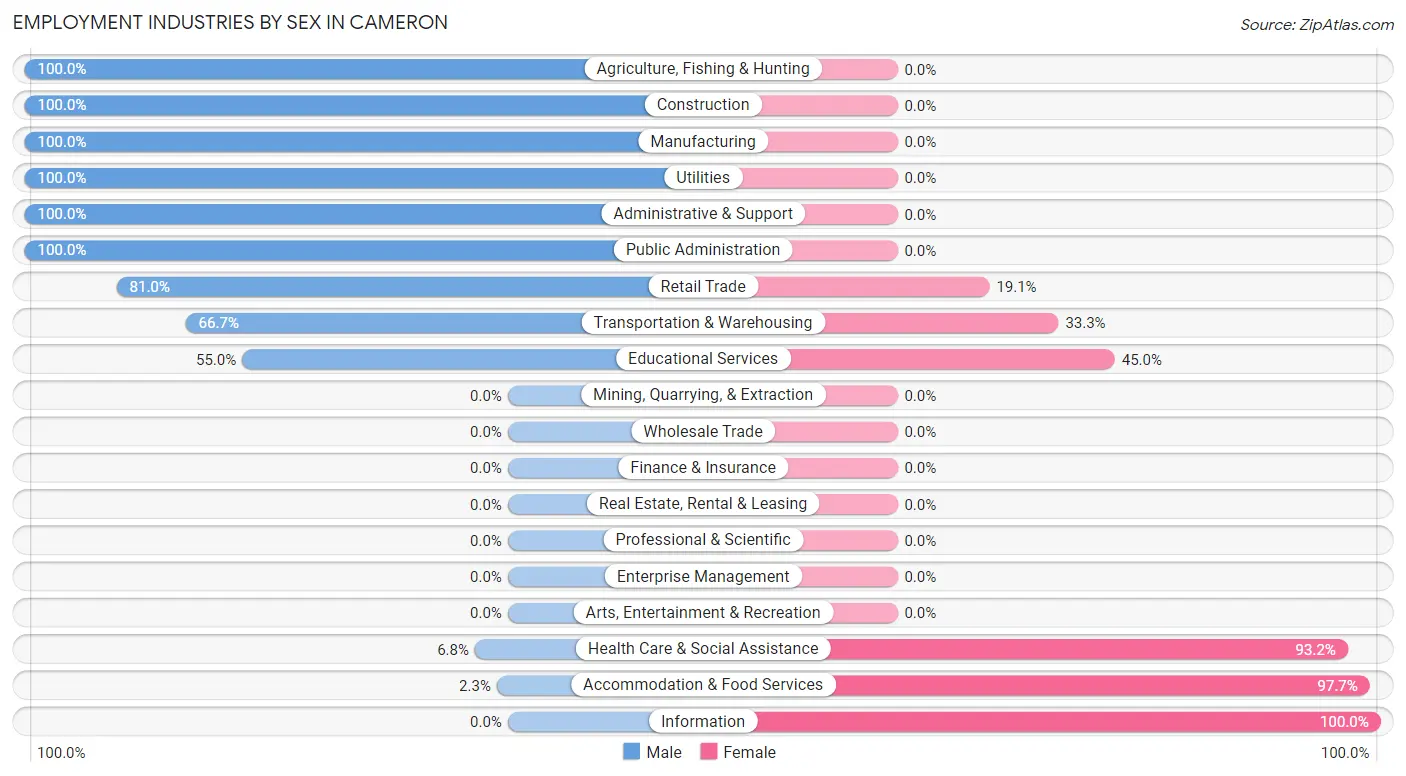
Employment Industries by Sex in Cameron
The Cameron industries that see more men than women are Agriculture, Fishing & Hunting (100.0%), Construction (100.0%), and Manufacturing (100.0%), whereas the industries that tend to have a higher number of women are Information (100.0%), Accommodation & Food Services (97.7%), and Health Care & Social Assistance (93.2%).
| Industry | Male | Female |
| Agriculture, Fishing & Hunting | 5 (100.0%) | 0 (0.0%) |
| Mining, Quarrying, & Extraction | 0 (0.0%) | 0 (0.0%) |
| Construction | 8 (100.0%) | 0 (0.0%) |
| Manufacturing | 27 (100.0%) | 0 (0.0%) |
| Wholesale Trade | 0 (0.0%) | 0 (0.0%) |
| Retail Trade | 17 (80.9%) | 4 (19.1%) |
| Transportation & Warehousing | 2 (66.7%) | 1 (33.3%) |
| Utilities | 7 (100.0%) | 0 (0.0%) |
| Information | 0 (0.0%) | 4 (100.0%) |
| Finance & Insurance | 0 (0.0%) | 0 (0.0%) |
| Real Estate, Rental & Leasing | 0 (0.0%) | 0 (0.0%) |
| Professional & Scientific | 0 (0.0%) | 0 (0.0%) |
| Enterprise Management | 0 (0.0%) | 0 (0.0%) |
| Administrative & Support | 10 (100.0%) | 0 (0.0%) |
| Educational Services | 11 (55.0%) | 9 (45.0%) |
| Health Care & Social Assistance | 6 (6.8%) | 82 (93.2%) |
| Arts, Entertainment & Recreation | 0 (0.0%) | 0 (0.0%) |
| Accommodation & Food Services | 1 (2.3%) | 43 (97.7%) |
| Public Administration | 2 (100.0%) | 0 (0.0%) |
| Total | 110 (43.1%) | 145 (56.9%) |
Education in Cameron
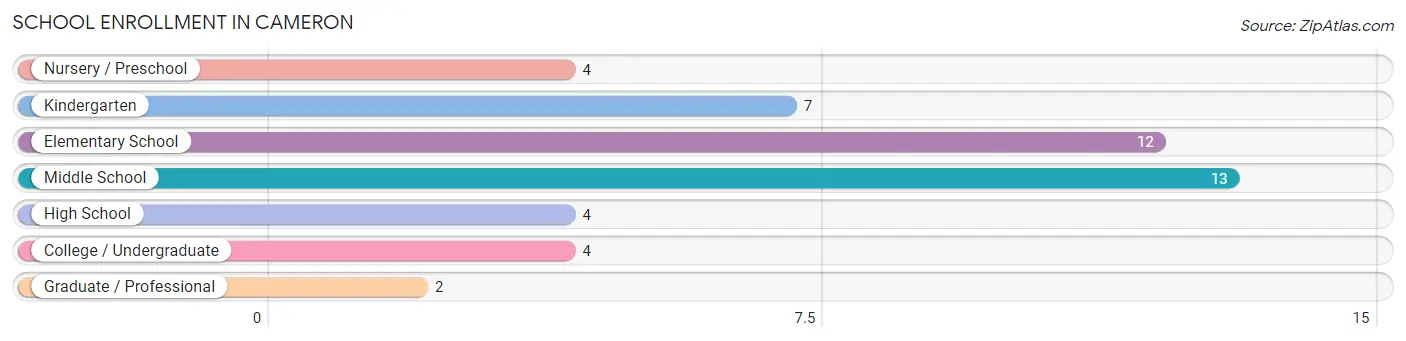
School Enrollment in Cameron
The most common levels of schooling among the 46 students in Cameron are middle school (13 | 28.3%), elementary school (12 | 26.1%), and kindergarten (7 | 15.2%).
| School Level | # Students | % Students |
| Nursery / Preschool | 4 | 8.7% |
| Kindergarten | 7 | 15.2% |
| Elementary School | 12 | 26.1% |
| Middle School | 13 | 28.3% |
| High School | 4 | 8.7% |
| College / Undergraduate | 4 | 8.7% |
| Graduate / Professional | 2 | 4.3% |
| Total | 46 | 100.0% |
School Enrollment by Age by Funding Source in Cameron
Out of a total of 46 students who are enrolled in schools in Cameron, 15 (32.6%) attend a private institution, while the remaining 31 (67.4%) are enrolled in public schools. The age group of 25 to 34 year olds has the highest likelihood of being enrolled in private schools, with 2 (50.0% in the age bracket) enrolled. Conversely, the age group of 3 to 4 year olds has the lowest likelihood of being enrolled in a private school, with 4 (100.0% in the age bracket) attending a public institution.
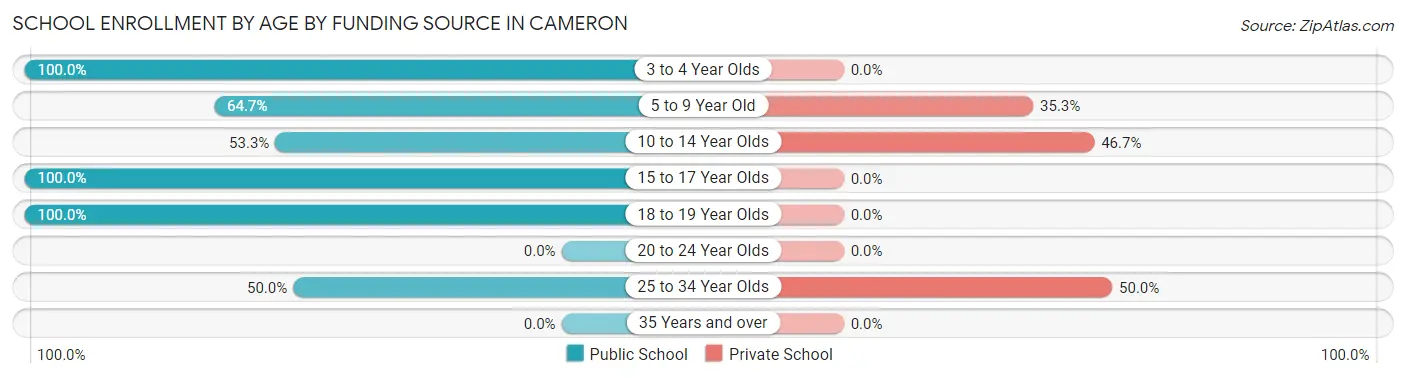
| Age Bracket | Public School | Private School |
| 3 to 4 Year Olds | 4 (100.0%) | 0 (0.0%) |
| 5 to 9 Year Old | 11 (64.7%) | 6 (35.3%) |
| 10 to 14 Year Olds | 8 (53.3%) | 7 (46.7%) |
| 15 to 17 Year Olds | 4 (100.0%) | 0 (0.0%) |
| 18 to 19 Year Olds | 2 (100.0%) | 0 (0.0%) |
| 20 to 24 Year Olds | 0 (0.0%) | 0 (0.0%) |
| 25 to 34 Year Olds | 2 (50.0%) | 2 (50.0%) |
| 35 Years and over | 0 (0.0%) | 0 (0.0%) |
| Total | 31 (67.4%) | 15 (32.6%) |
Educational Attainment by Field of Study in Cameron
Visual & performing arts (15 | 19.2%), arts & humanities (13 | 16.7%), liberal arts & history (11 | 14.1%), science & technology (8 | 10.3%), and engineering (7 | 9.0%) are the most common fields of study among 78 individuals in Cameron who have obtained a bachelor's degree or higher.
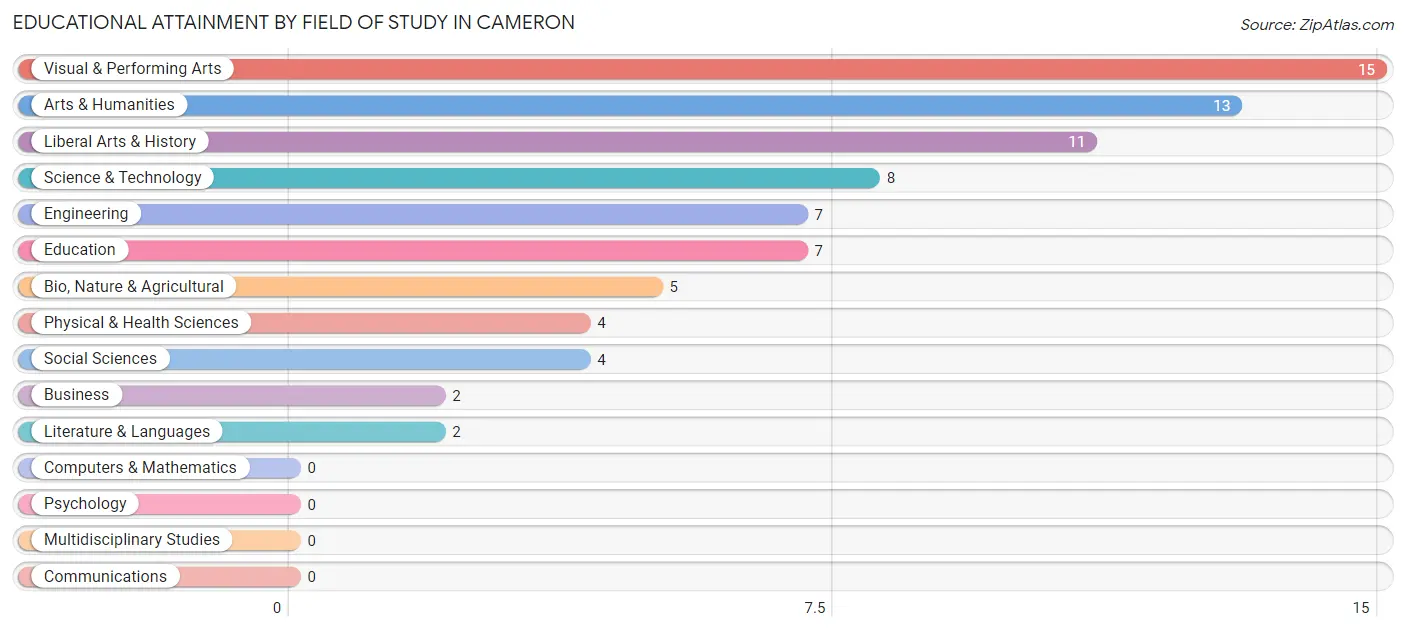
| Field of Study | # Graduates | % Graduates |
| Computers & Mathematics | 0 | 0.0% |
| Bio, Nature & Agricultural | 5 | 6.4% |
| Physical & Health Sciences | 4 | 5.1% |
| Psychology | 0 | 0.0% |
| Social Sciences | 4 | 5.1% |
| Engineering | 7 | 9.0% |
| Multidisciplinary Studies | 0 | 0.0% |
| Science & Technology | 8 | 10.3% |
| Business | 2 | 2.6% |
| Education | 7 | 9.0% |
| Literature & Languages | 2 | 2.6% |
| Liberal Arts & History | 11 | 14.1% |
| Visual & Performing Arts | 15 | 19.2% |
| Communications | 0 | 0.0% |
| Arts & Humanities | 13 | 16.7% |
| Total | 78 | 100.0% |
Transportation & Commute in Cameron
Vehicle Availability by Sex in Cameron
The most prevalent vehicle ownership categories in Cameron are males with 2 vehicles (34, accounting for 30.9%) and females with 2 vehicles (25, making up 25.6%).
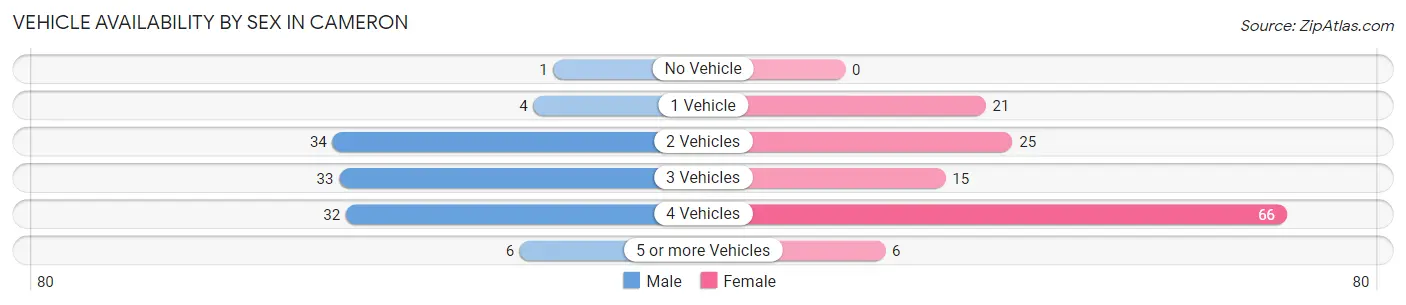
| Vehicles Available | Male | Female |
| No Vehicle | 1 (0.9%) | 0 (0.0%) |
| 1 Vehicle | 4 (3.6%) | 21 (15.8%) |
| 2 Vehicles | 34 (30.9%) | 25 (18.8%) |
| 3 Vehicles | 33 (30.0%) | 15 (11.3%) |
| 4 Vehicles | 32 (29.1%) | 66 (49.6%) |
| 5 or more Vehicles | 6 (5.4%) | 6 (4.5%) |
| Total | 110 (100.0%) | 133 (100.0%) |
Commute Time in Cameron
The most frequently occuring commute durations in Cameron are 20 to 24 minutes (79 commuters, 35.0%), 15 to 19 minutes (44 commuters, 19.5%), and 30 to 34 minutes (36 commuters, 15.9%).
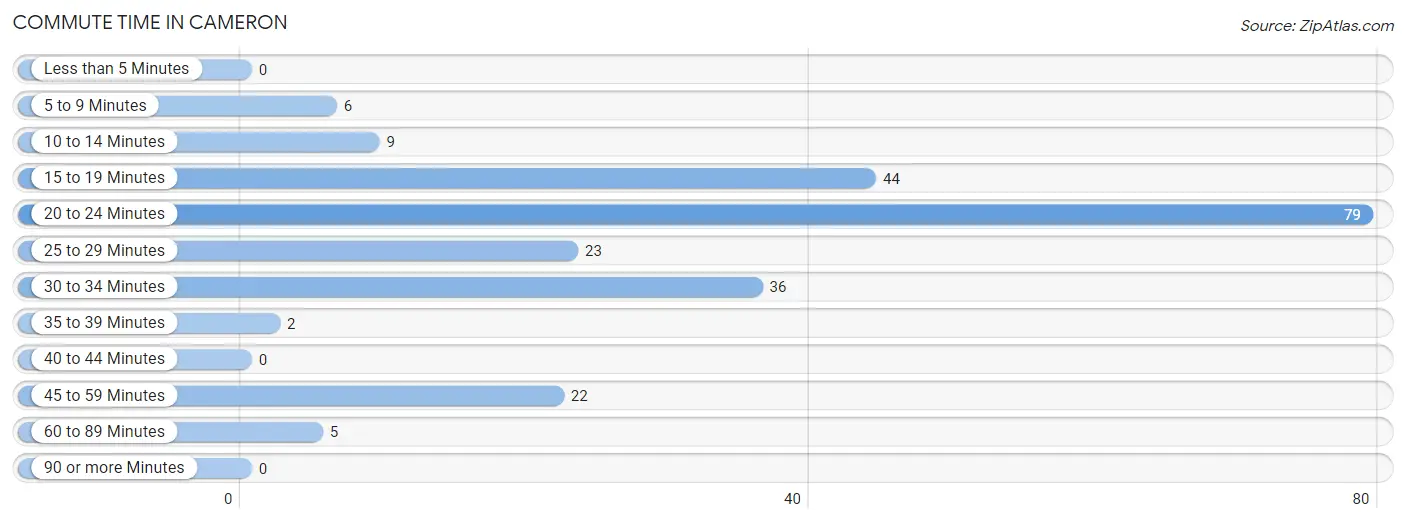
| Commute Time | # Commuters | % Commuters |
| Less than 5 Minutes | 0 | 0.0% |
| 5 to 9 Minutes | 6 | 2.6% |
| 10 to 14 Minutes | 9 | 4.0% |
| 15 to 19 Minutes | 44 | 19.5% |
| 20 to 24 Minutes | 79 | 35.0% |
| 25 to 29 Minutes | 23 | 10.2% |
| 30 to 34 Minutes | 36 | 15.9% |
| 35 to 39 Minutes | 2 | 0.9% |
| 40 to 44 Minutes | 0 | 0.0% |
| 45 to 59 Minutes | 22 | 9.7% |
| 60 to 89 Minutes | 5 | 2.2% |
| 90 or more Minutes | 0 | 0.0% |
Commute Time by Sex in Cameron
The most common commute times in Cameron are 15 to 19 minutes (25 commuters, 24.5%) for males and 20 to 24 minutes (65 commuters, 52.4%) for females.
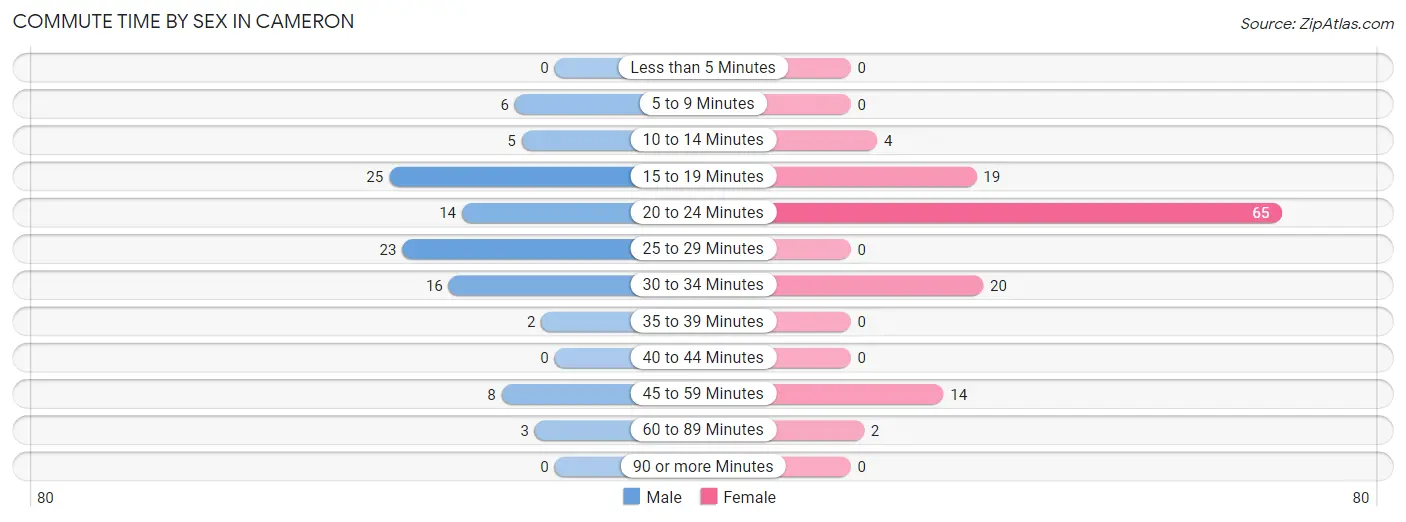
| Commute Time | Male | Female |
| Less than 5 Minutes | 0 (0.0%) | 0 (0.0%) |
| 5 to 9 Minutes | 6 (5.9%) | 0 (0.0%) |
| 10 to 14 Minutes | 5 (4.9%) | 4 (3.2%) |
| 15 to 19 Minutes | 25 (24.5%) | 19 (15.3%) |
| 20 to 24 Minutes | 14 (13.7%) | 65 (52.4%) |
| 25 to 29 Minutes | 23 (22.6%) | 0 (0.0%) |
| 30 to 34 Minutes | 16 (15.7%) | 20 (16.1%) |
| 35 to 39 Minutes | 2 (2.0%) | 0 (0.0%) |
| 40 to 44 Minutes | 0 (0.0%) | 0 (0.0%) |
| 45 to 59 Minutes | 8 (7.8%) | 14 (11.3%) |
| 60 to 89 Minutes | 3 (2.9%) | 2 (1.6%) |
| 90 or more Minutes | 0 (0.0%) | 0 (0.0%) |
Time of Departure to Work by Sex in Cameron
The most frequent times of departure to work in Cameron are 12:00 PM to 3:59 PM (23, 22.6%) for males and 12:00 PM to 3:59 PM (27, 21.8%) for females.
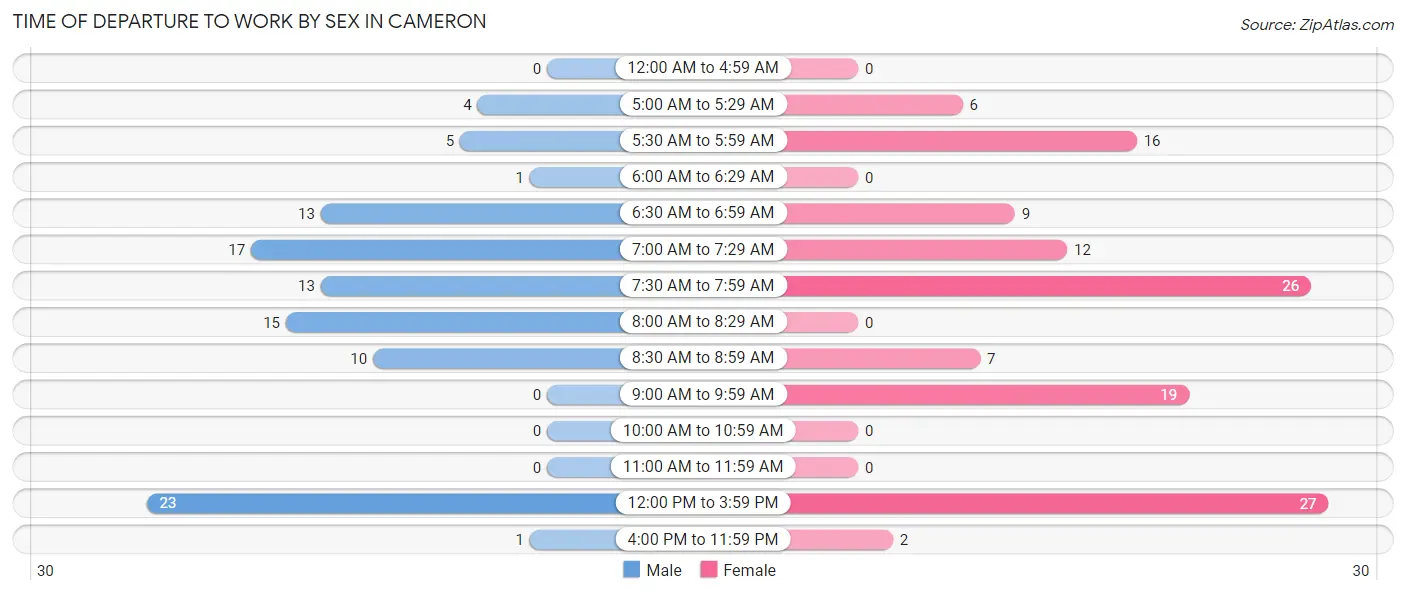
| Time of Departure | Male | Female |
| 12:00 AM to 4:59 AM | 0 (0.0%) | 0 (0.0%) |
| 5:00 AM to 5:29 AM | 4 (3.9%) | 6 (4.8%) |
| 5:30 AM to 5:59 AM | 5 (4.9%) | 16 (12.9%) |
| 6:00 AM to 6:29 AM | 1 (1.0%) | 0 (0.0%) |
| 6:30 AM to 6:59 AM | 13 (12.8%) | 9 (7.3%) |
| 7:00 AM to 7:29 AM | 17 (16.7%) | 12 (9.7%) |
| 7:30 AM to 7:59 AM | 13 (12.8%) | 26 (21.0%) |
| 8:00 AM to 8:29 AM | 15 (14.7%) | 0 (0.0%) |
| 8:30 AM to 8:59 AM | 10 (9.8%) | 7 (5.7%) |
| 9:00 AM to 9:59 AM | 0 (0.0%) | 19 (15.3%) |
| 10:00 AM to 10:59 AM | 0 (0.0%) | 0 (0.0%) |
| 11:00 AM to 11:59 AM | 0 (0.0%) | 0 (0.0%) |
| 12:00 PM to 3:59 PM | 23 (22.6%) | 27 (21.8%) |
| 4:00 PM to 11:59 PM | 1 (1.0%) | 2 (1.6%) |
| Total | 102 (100.0%) | 124 (100.0%) |
Housing Occupancy in Cameron
Occupancy by Ownership in Cameron
Of the total 153 dwellings in Cameron, owner-occupied units account for 127 (83.0%), while renter-occupied units make up 26 (17.0%).
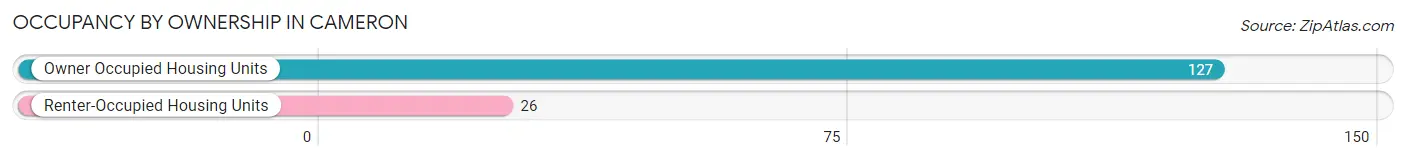
| Occupancy | # Housing Units | % Housing Units |
| Owner Occupied Housing Units | 127 | 83.0% |
| Renter-Occupied Housing Units | 26 | 17.0% |
| Total Occupied Housing Units | 153 | 100.0% |
Occupancy by Household Size in Cameron
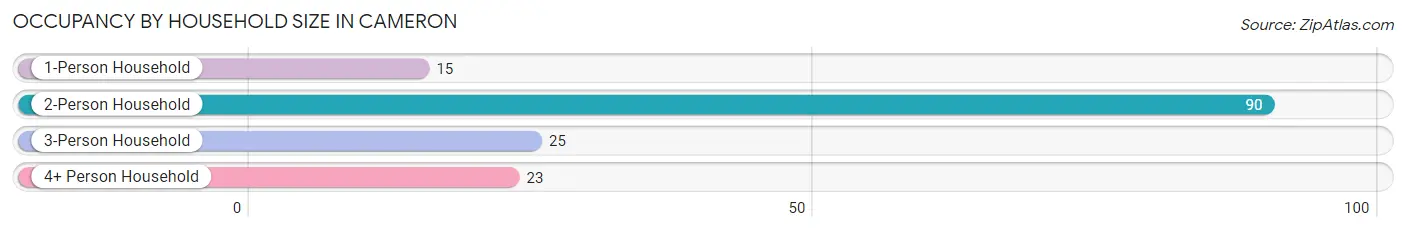
| Household Size | # Housing Units | % Housing Units |
| 1-Person Household | 15 | 9.8% |
| 2-Person Household | 90 | 58.8% |
| 3-Person Household | 25 | 16.3% |
| 4+ Person Household | 23 | 15.0% |
| Total Housing Units | 153 | 100.0% |
Occupancy by Ownership by Household Size in Cameron
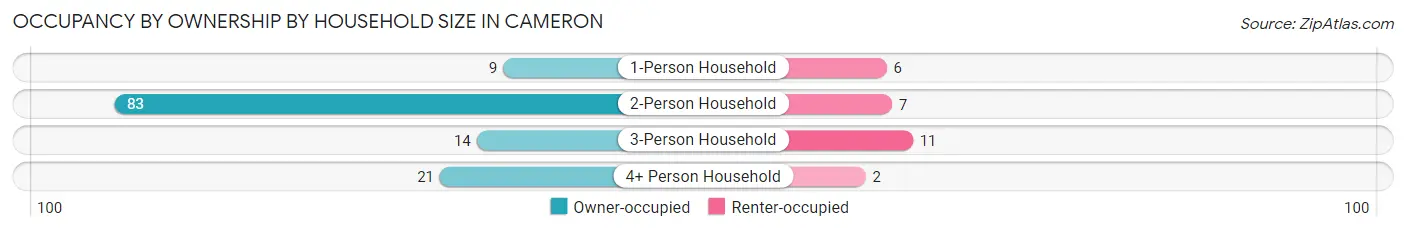
| Household Size | Owner-occupied | Renter-occupied |
| 1-Person Household | 9 (60.0%) | 6 (40.0%) |
| 2-Person Household | 83 (92.2%) | 7 (7.8%) |
| 3-Person Household | 14 (56.0%) | 11 (44.0%) |
| 4+ Person Household | 21 (91.3%) | 2 (8.7%) |
| Total Housing Units | 127 (83.0%) | 26 (17.0%) |
Occupancy by Educational Attainment in Cameron
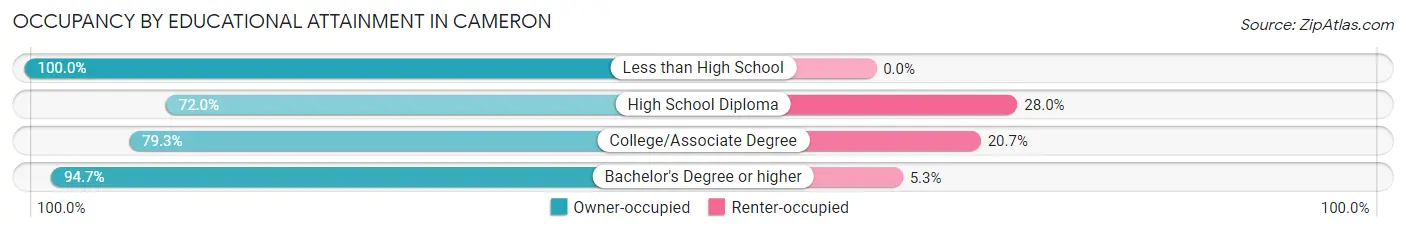
| Household Size | Owner-occupied | Renter-occupied |
| Less than High School | 8 (100.0%) | 0 (0.0%) |
| High School Diploma | 18 (72.0%) | 7 (28.0%) |
| College/Associate Degree | 65 (79.3%) | 17 (20.7%) |
| Bachelor's Degree or higher | 36 (94.7%) | 2 (5.3%) |
Occupancy by Age of Householder in Cameron
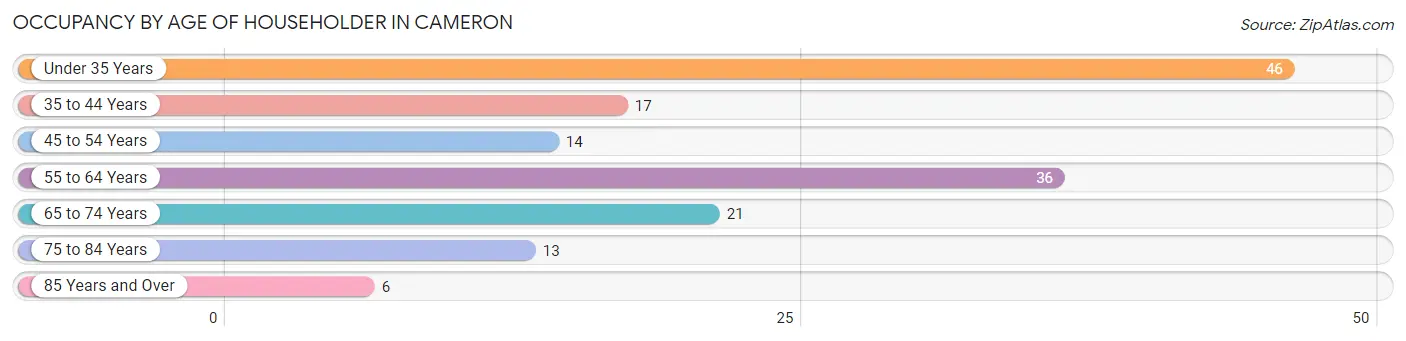
| Age Bracket | # Households | % Households |
| Under 35 Years | 46 | 30.1% |
| 35 to 44 Years | 17 | 11.1% |
| 45 to 54 Years | 14 | 9.1% |
| 55 to 64 Years | 36 | 23.5% |
| 65 to 74 Years | 21 | 13.7% |
| 75 to 84 Years | 13 | 8.5% |
| 85 Years and Over | 6 | 3.9% |
| Total | 153 | 100.0% |
Housing Finances in Cameron
Median Income by Occupancy in Cameron
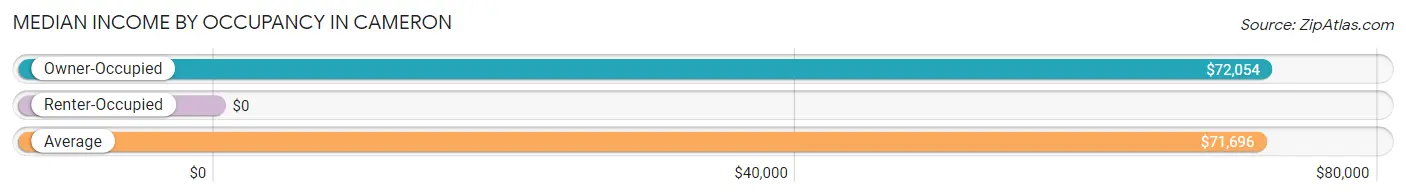
| Occupancy Type | # Households | Median Income |
| Owner-Occupied | 127 (83.0%) | $72,054 |
| Renter-Occupied | 26 (17.0%) | $0 |
| Average | 153 (100.0%) | $71,696 |
Occupancy by Householder Income Bracket in Cameron
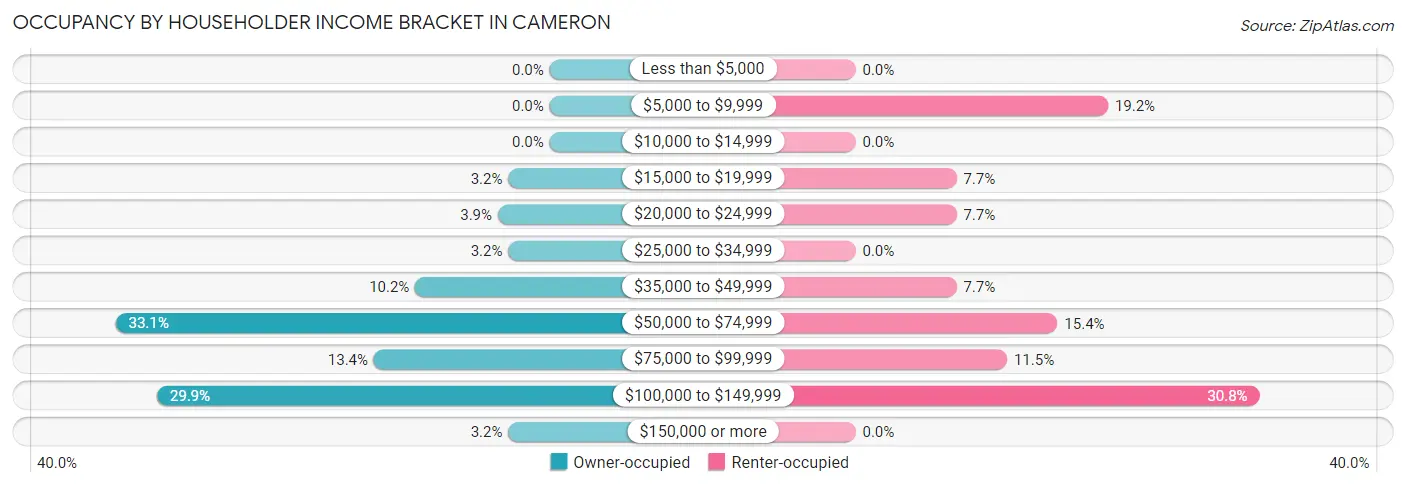
| Income Bracket | Owner-occupied | Renter-occupied |
| Less than $5,000 | 0 (0.0%) | 0 (0.0%) |
| $5,000 to $9,999 | 0 (0.0%) | 5 (19.2%) |
| $10,000 to $14,999 | 0 (0.0%) | 0 (0.0%) |
| $15,000 to $19,999 | 4 (3.2%) | 2 (7.7%) |
| $20,000 to $24,999 | 5 (3.9%) | 2 (7.7%) |
| $25,000 to $34,999 | 4 (3.2%) | 0 (0.0%) |
| $35,000 to $49,999 | 13 (10.2%) | 2 (7.7%) |
| $50,000 to $74,999 | 42 (33.1%) | 4 (15.4%) |
| $75,000 to $99,999 | 17 (13.4%) | 3 (11.5%) |
| $100,000 to $149,999 | 38 (29.9%) | 8 (30.8%) |
| $150,000 or more | 4 (3.2%) | 0 (0.0%) |
| Total | 127 (100.0%) | 26 (100.0%) |
Monthly Housing Cost Tiers in Cameron
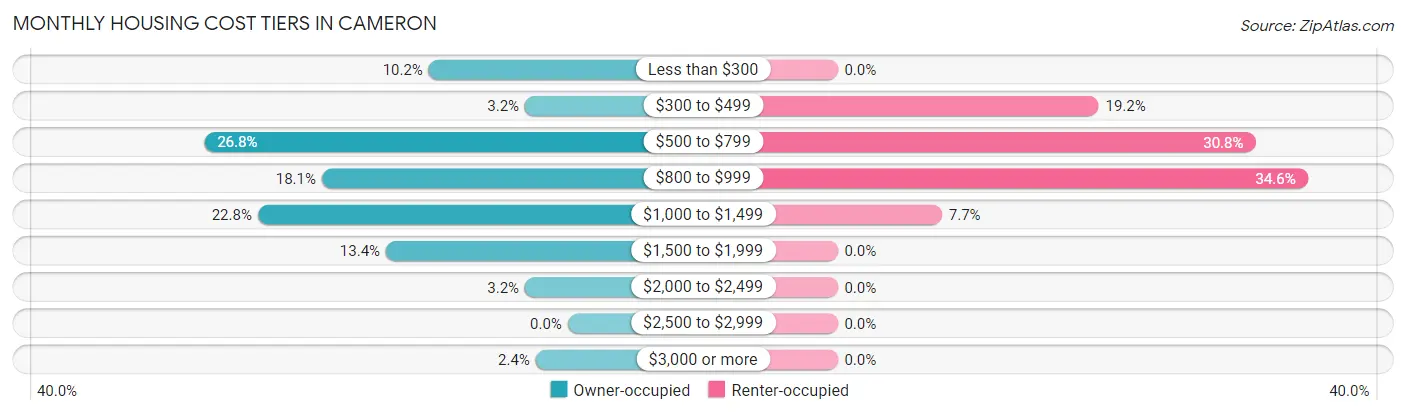
| Monthly Cost | Owner-occupied | Renter-occupied |
| Less than $300 | 13 (10.2%) | 0 (0.0%) |
| $300 to $499 | 4 (3.2%) | 5 (19.2%) |
| $500 to $799 | 34 (26.8%) | 8 (30.8%) |
| $800 to $999 | 23 (18.1%) | 9 (34.6%) |
| $1,000 to $1,499 | 29 (22.8%) | 2 (7.7%) |
| $1,500 to $1,999 | 17 (13.4%) | 0 (0.0%) |
| $2,000 to $2,499 | 4 (3.2%) | 0 (0.0%) |
| $2,500 to $2,999 | 0 (0.0%) | 0 (0.0%) |
| $3,000 or more | 3 (2.4%) | 0 (0.0%) |
| Total | 127 (100.0%) | 26 (100.0%) |
Physical Housing Characteristics in Cameron
Housing Structures in Cameron
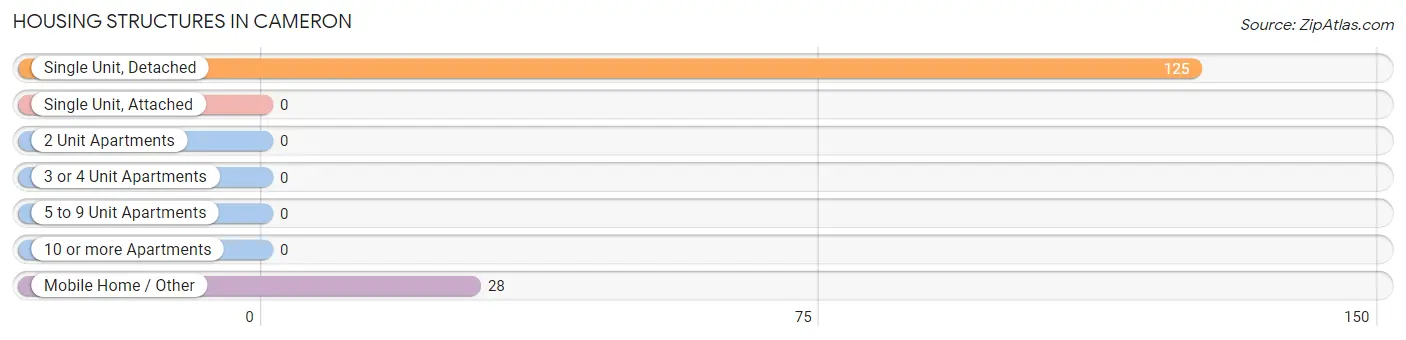
| Structure Type | # Housing Units | % Housing Units |
| Single Unit, Detached | 125 | 81.7% |
| Single Unit, Attached | 0 | 0.0% |
| 2 Unit Apartments | 0 | 0.0% |
| 3 or 4 Unit Apartments | 0 | 0.0% |
| 5 to 9 Unit Apartments | 0 | 0.0% |
| 10 or more Apartments | 0 | 0.0% |
| Mobile Home / Other | 28 | 18.3% |
| Total | 153 | 100.0% |
Housing Structures by Occupancy in Cameron
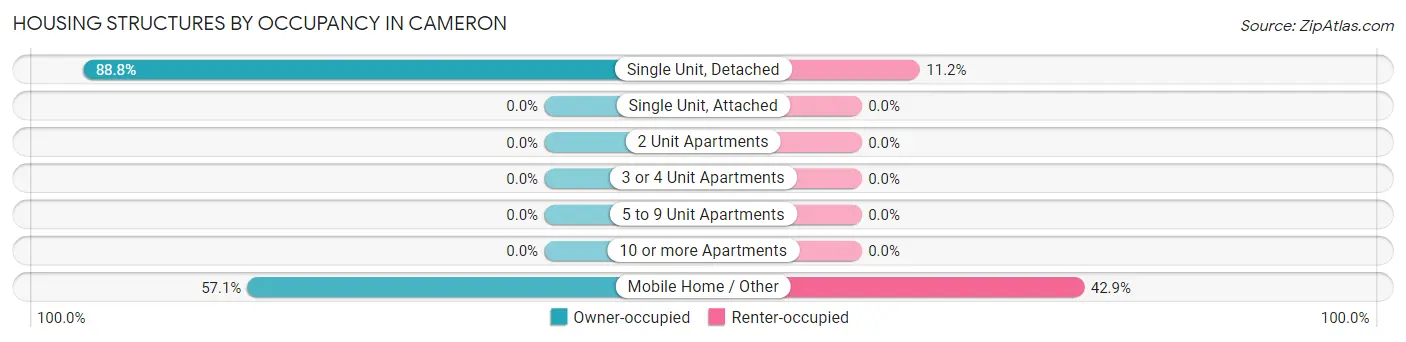
| Structure Type | Owner-occupied | Renter-occupied |
| Single Unit, Detached | 111 (88.8%) | 14 (11.2%) |
| Single Unit, Attached | 0 (0.0%) | 0 (0.0%) |
| 2 Unit Apartments | 0 (0.0%) | 0 (0.0%) |
| 3 or 4 Unit Apartments | 0 (0.0%) | 0 (0.0%) |
| 5 to 9 Unit Apartments | 0 (0.0%) | 0 (0.0%) |
| 10 or more Apartments | 0 (0.0%) | 0 (0.0%) |
| Mobile Home / Other | 16 (57.1%) | 12 (42.9%) |
| Total | 127 (83.0%) | 26 (17.0%) |
Housing Structures by Number of Rooms in Cameron
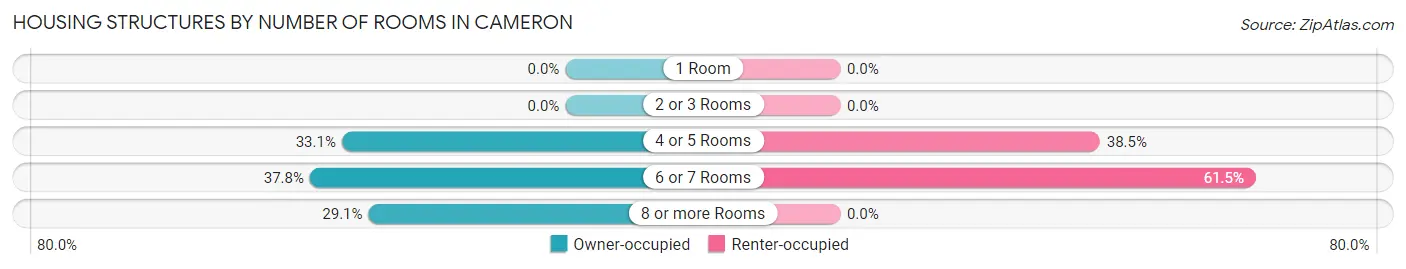
| Number of Rooms | Owner-occupied | Renter-occupied |
| 1 Room | 0 (0.0%) | 0 (0.0%) |
| 2 or 3 Rooms | 0 (0.0%) | 0 (0.0%) |
| 4 or 5 Rooms | 42 (33.1%) | 10 (38.5%) |
| 6 or 7 Rooms | 48 (37.8%) | 16 (61.5%) |
| 8 or more Rooms | 37 (29.1%) | 0 (0.0%) |
| Total | 127 (100.0%) | 26 (100.0%) |
Housing Structure by Heating Type in Cameron
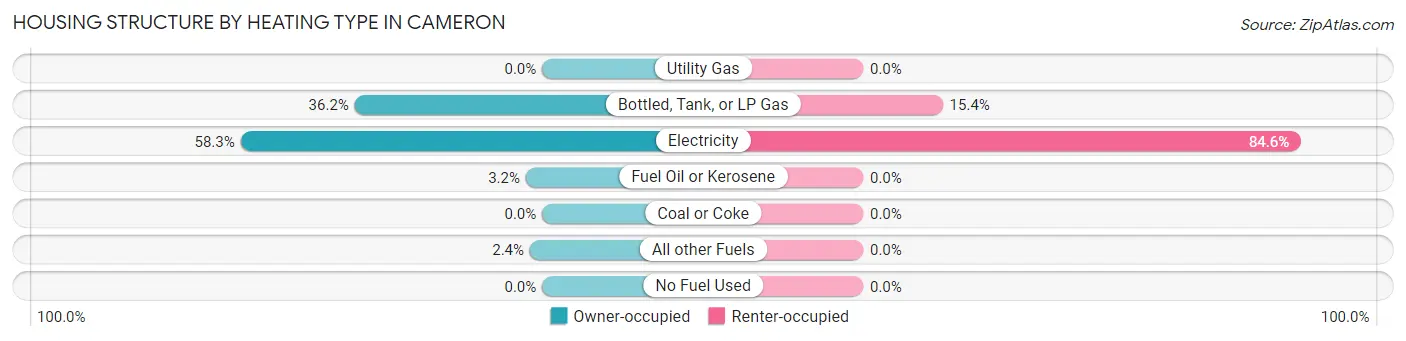
| Heating Type | Owner-occupied | Renter-occupied |
| Utility Gas | 0 (0.0%) | 0 (0.0%) |
| Bottled, Tank, or LP Gas | 46 (36.2%) | 4 (15.4%) |
| Electricity | 74 (58.3%) | 22 (84.6%) |
| Fuel Oil or Kerosene | 4 (3.2%) | 0 (0.0%) |
| Coal or Coke | 0 (0.0%) | 0 (0.0%) |
| All other Fuels | 3 (2.4%) | 0 (0.0%) |
| No Fuel Used | 0 (0.0%) | 0 (0.0%) |
| Total | 127 (100.0%) | 26 (100.0%) |
Household Vehicle Usage in Cameron
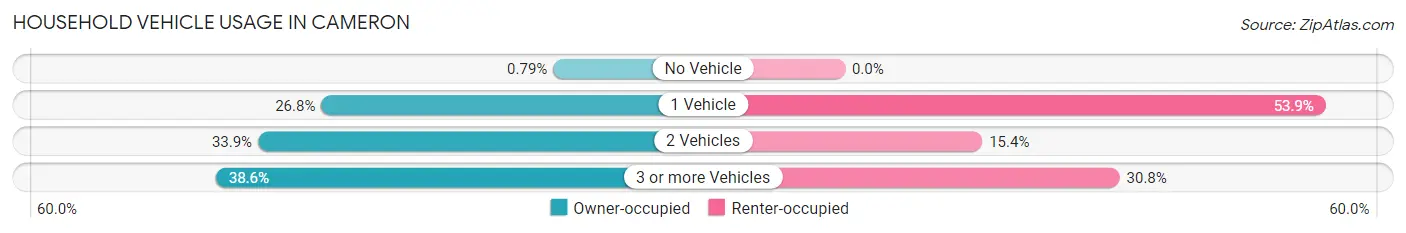
| Vehicles per Household | Owner-occupied | Renter-occupied |
| No Vehicle | 1 (0.8%) | 0 (0.0%) |
| 1 Vehicle | 34 (26.8%) | 14 (53.8%) |
| 2 Vehicles | 43 (33.9%) | 4 (15.4%) |
| 3 or more Vehicles | 49 (38.6%) | 8 (30.8%) |
| Total | 127 (100.0%) | 26 (100.0%) |
Real Estate & Mortgages in Cameron
Real Estate and Mortgage Overview in Cameron
| Characteristic | Without Mortgage | With Mortgage |
| Housing Units | 58 | 69 |
| Median Property Value | $110,900 | $198,400 |
| Median Household Income | $70,357 | $4 |
| Monthly Housing Costs | $575 | $2 |
| Real Estate Taxes | - | - |
Property Value by Mortgage Status in Cameron
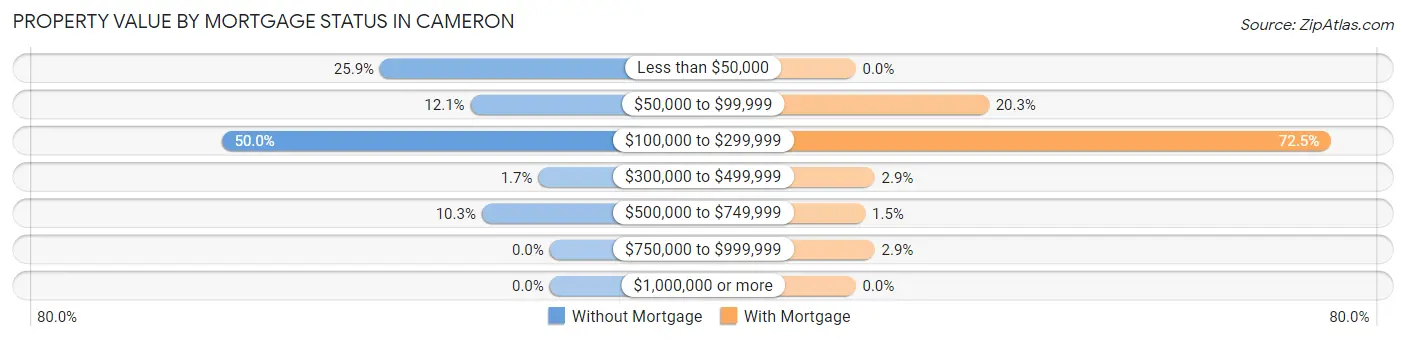
| Property Value | Without Mortgage | With Mortgage |
| Less than $50,000 | 15 (25.9%) | 0 (0.0%) |
| $50,000 to $99,999 | 7 (12.1%) | 14 (20.3%) |
| $100,000 to $299,999 | 29 (50.0%) | 50 (72.5%) |
| $300,000 to $499,999 | 1 (1.7%) | 2 (2.9%) |
| $500,000 to $749,999 | 6 (10.3%) | 1 (1.5%) |
| $750,000 to $999,999 | 0 (0.0%) | 2 (2.9%) |
| $1,000,000 or more | 0 (0.0%) | 0 (0.0%) |
| Total | 58 (100.0%) | 69 (100.0%) |
Household Income by Mortgage Status in Cameron
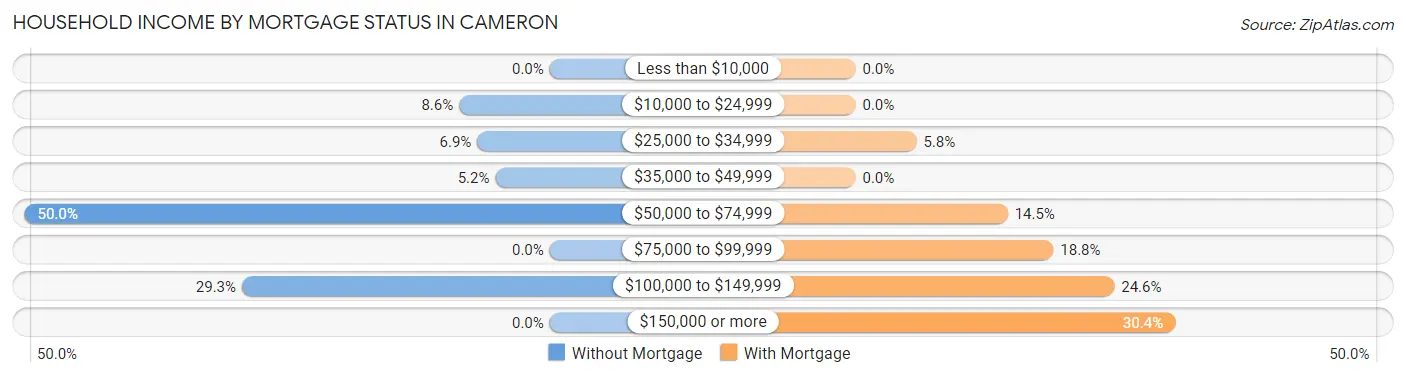
| Household Income | Without Mortgage | With Mortgage |
| Less than $10,000 | 0 (0.0%) | 0 (0.0%) |
| $10,000 to $24,999 | 5 (8.6%) | 0 (0.0%) |
| $25,000 to $34,999 | 4 (6.9%) | 4 (5.8%) |
| $35,000 to $49,999 | 3 (5.2%) | 0 (0.0%) |
| $50,000 to $74,999 | 29 (50.0%) | 10 (14.5%) |
| $75,000 to $99,999 | 0 (0.0%) | 13 (18.8%) |
| $100,000 to $149,999 | 17 (29.3%) | 17 (24.6%) |
| $150,000 or more | 0 (0.0%) | 21 (30.4%) |
| Total | 58 (100.0%) | 69 (100.0%) |
Property Value to Household Income Ratio in Cameron
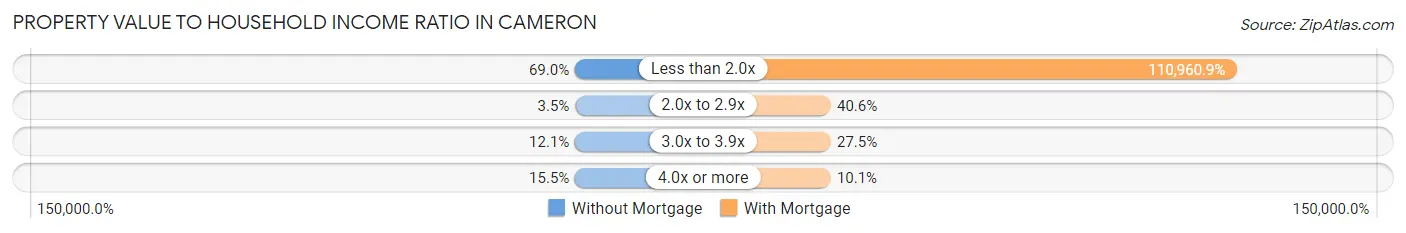
| Value-to-Income Ratio | Without Mortgage | With Mortgage |
| Less than 2.0x | 40 (69.0%) | 76,563 (110,960.9%) |
| 2.0x to 2.9x | 2 (3.5%) | 28 (40.6%) |
| 3.0x to 3.9x | 7 (12.1%) | 19 (27.5%) |
| 4.0x or more | 9 (15.5%) | 7 (10.1%) |
| Total | 58 (100.0%) | 69 (100.0%) |
Real Estate Taxes by Mortgage Status in Cameron
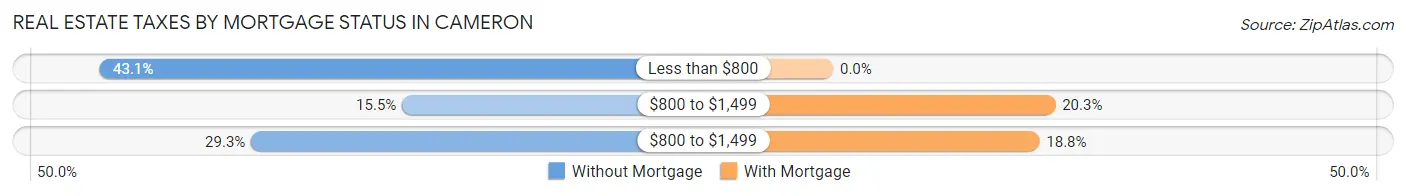
| Property Taxes | Without Mortgage | With Mortgage |
| Less than $800 | 25 (43.1%) | 0 (0.0%) |
| $800 to $1,499 | 9 (15.5%) | 14 (20.3%) |
| $800 to $1,499 | 17 (29.3%) | 13 (18.8%) |
| Total | 58 (100.0%) | 69 (100.0%) |
Health & Disability in Cameron
Health Insurance Coverage by Age in Cameron
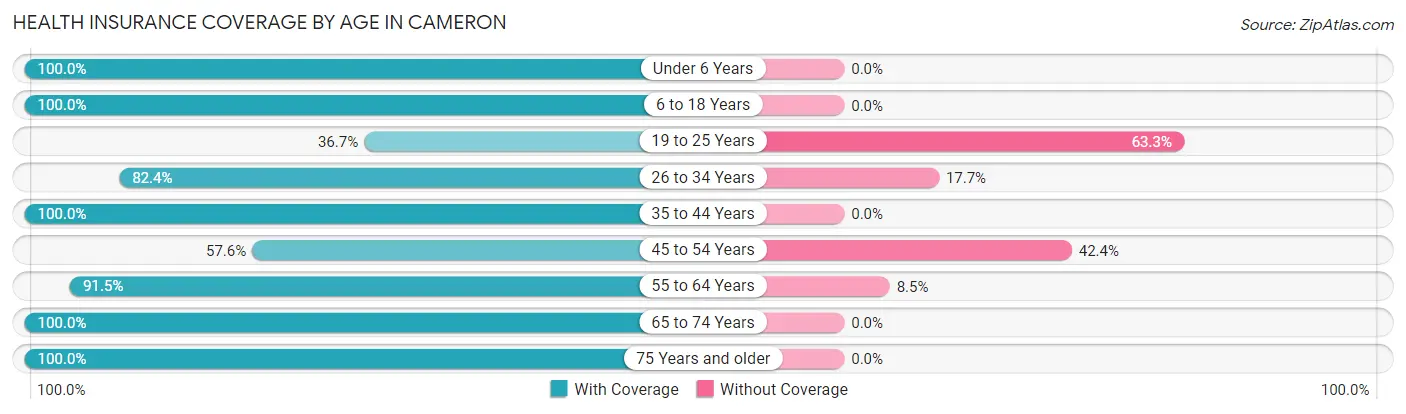
| Age Bracket | With Coverage | Without Coverage |
| Under 6 Years | 42 (100.0%) | 0 (0.0%) |
| 6 to 18 Years | 37 (100.0%) | 0 (0.0%) |
| 19 to 25 Years | 29 (36.7%) | 50 (63.3%) |
| 26 to 34 Years | 42 (82.4%) | 9 (17.6%) |
| 35 to 44 Years | 48 (100.0%) | 0 (0.0%) |
| 45 to 54 Years | 19 (57.6%) | 14 (42.4%) |
| 55 to 64 Years | 54 (91.5%) | 5 (8.5%) |
| 65 to 74 Years | 34 (100.0%) | 0 (0.0%) |
| 75 Years and older | 44 (100.0%) | 0 (0.0%) |
| Total | 349 (81.7%) | 78 (18.3%) |
Health Insurance Coverage by Citizenship Status in Cameron
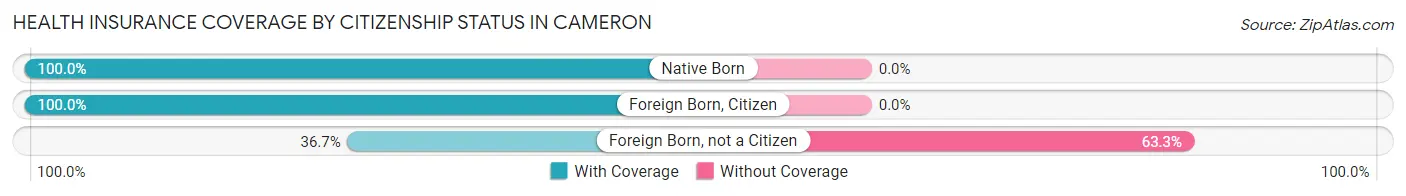
| Citizenship Status | With Coverage | Without Coverage |
| Native Born | 42 (100.0%) | 0 (0.0%) |
| Foreign Born, Citizen | 37 (100.0%) | 0 (0.0%) |
| Foreign Born, not a Citizen | 29 (36.7%) | 50 (63.3%) |
Health Insurance Coverage by Household Income in Cameron
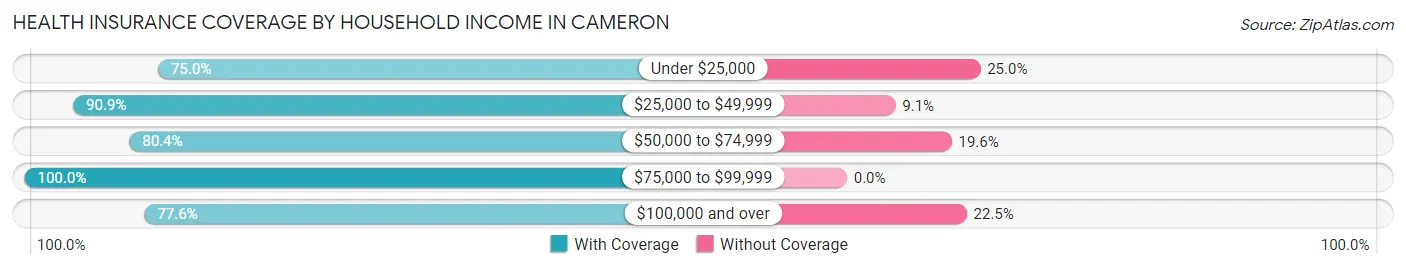
| Household Income | With Coverage | Without Coverage |
| Under $25,000 | 30 (75.0%) | 10 (25.0%) |
| $25,000 to $49,999 | 30 (90.9%) | 3 (9.1%) |
| $50,000 to $74,999 | 86 (80.4%) | 21 (19.6%) |
| $75,000 to $99,999 | 51 (100.0%) | 0 (0.0%) |
| $100,000 and over | 152 (77.5%) | 44 (22.5%) |
Public vs Private Health Insurance Coverage by Age in Cameron
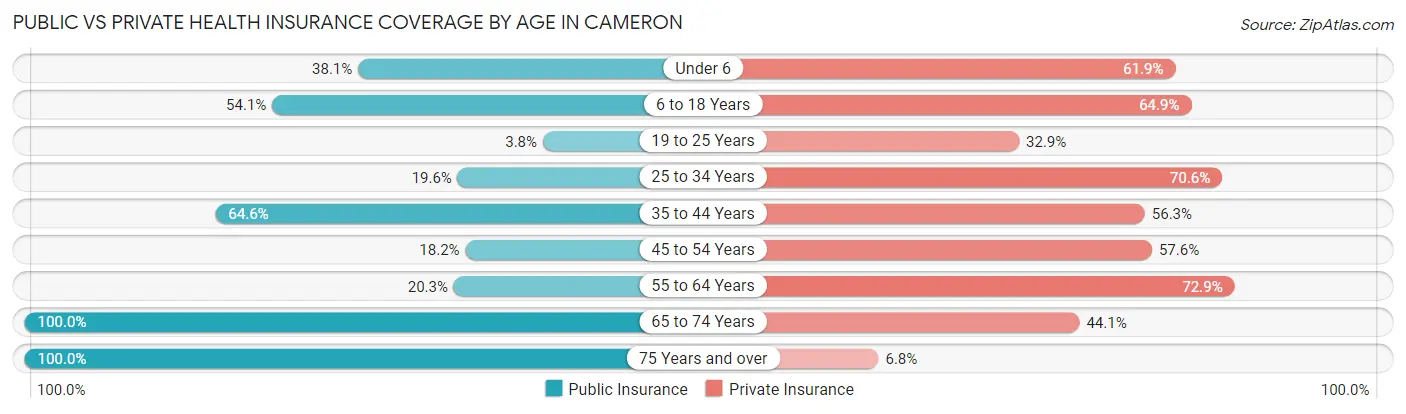
| Age Bracket | Public Insurance | Private Insurance |
| Under 6 | 16 (38.1%) | 26 (61.9%) |
| 6 to 18 Years | 20 (54.0%) | 24 (64.9%) |
| 19 to 25 Years | 3 (3.8%) | 26 (32.9%) |
| 25 to 34 Years | 10 (19.6%) | 36 (70.6%) |
| 35 to 44 Years | 31 (64.6%) | 27 (56.2%) |
| 45 to 54 Years | 6 (18.2%) | 19 (57.6%) |
| 55 to 64 Years | 12 (20.3%) | 43 (72.9%) |
| 65 to 74 Years | 34 (100.0%) | 15 (44.1%) |
| 75 Years and over | 44 (100.0%) | 3 (6.8%) |
| Total | 176 (41.2%) | 219 (51.3%) |
Disability Status by Sex by Age in Cameron
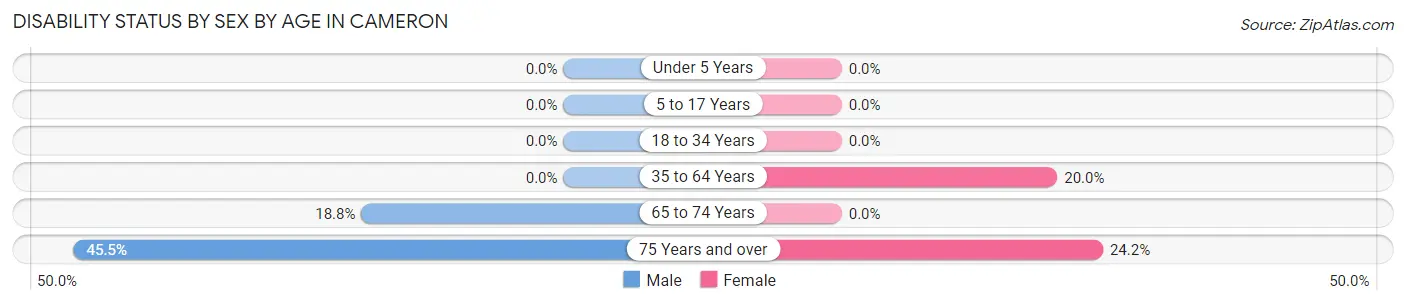
| Age Bracket | Male | Female |
| Under 5 Years | 0 (0.0%) | 0 (0.0%) |
| 5 to 17 Years | 0 (0.0%) | 0 (0.0%) |
| 18 to 34 Years | 0 (0.0%) | 0 (0.0%) |
| 35 to 64 Years | 0 (0.0%) | 19 (20.0%) |
| 65 to 74 Years | 3 (18.8%) | 0 (0.0%) |
| 75 Years and over | 5 (45.5%) | 8 (24.2%) |
Disability Class by Sex by Age in Cameron
Disability Class: Hearing Difficulty
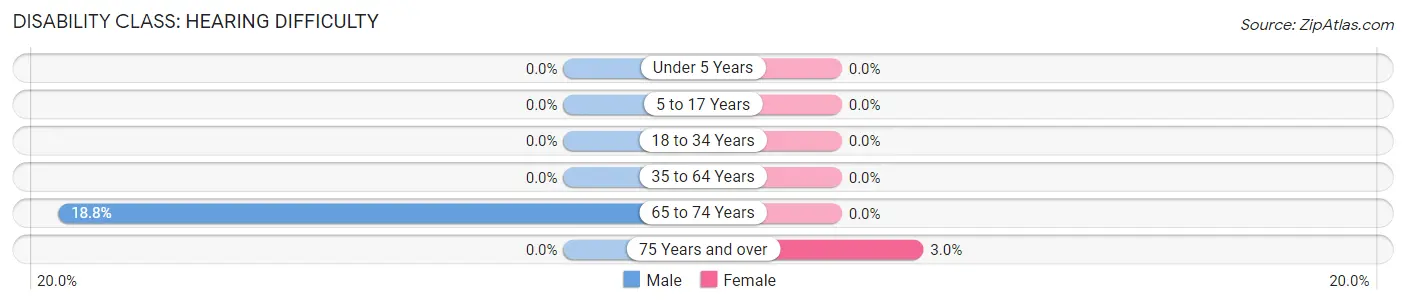
| Age Bracket | Male | Female |
| Under 5 Years | 0 (0.0%) | 0 (0.0%) |
| 5 to 17 Years | 0 (0.0%) | 0 (0.0%) |
| 18 to 34 Years | 0 (0.0%) | 0 (0.0%) |
| 35 to 64 Years | 0 (0.0%) | 0 (0.0%) |
| 65 to 74 Years | 3 (18.8%) | 0 (0.0%) |
| 75 Years and over | 0 (0.0%) | 1 (3.0%) |
Disability Class: Vision Difficulty
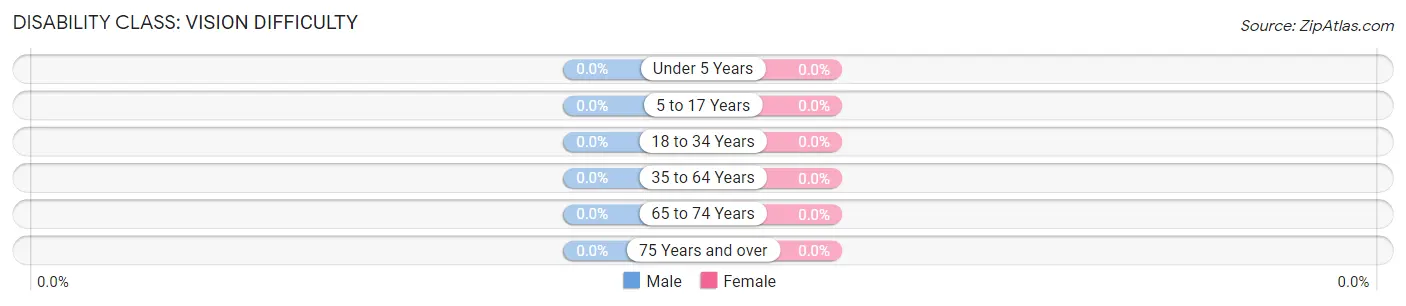
| Age Bracket | Male | Female |
| Under 5 Years | 0 (0.0%) | 0 (0.0%) |
| 5 to 17 Years | 0 (0.0%) | 0 (0.0%) |
| 18 to 34 Years | 0 (0.0%) | 0 (0.0%) |
| 35 to 64 Years | 0 (0.0%) | 0 (0.0%) |
| 65 to 74 Years | 0 (0.0%) | 0 (0.0%) |
| 75 Years and over | 0 (0.0%) | 0 (0.0%) |
Disability Class: Cognitive Difficulty
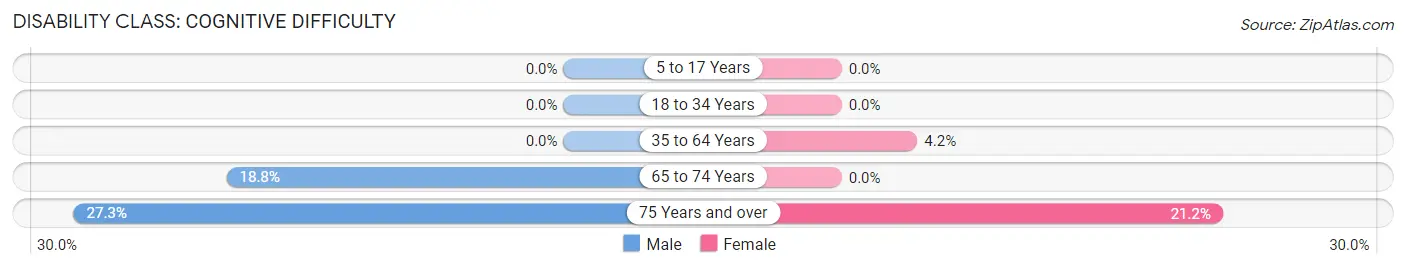
| Age Bracket | Male | Female |
| 5 to 17 Years | 0 (0.0%) | 0 (0.0%) |
| 18 to 34 Years | 0 (0.0%) | 0 (0.0%) |
| 35 to 64 Years | 0 (0.0%) | 4 (4.2%) |
| 65 to 74 Years | 3 (18.8%) | 0 (0.0%) |
| 75 Years and over | 3 (27.3%) | 7 (21.2%) |
Disability Class: Ambulatory Difficulty
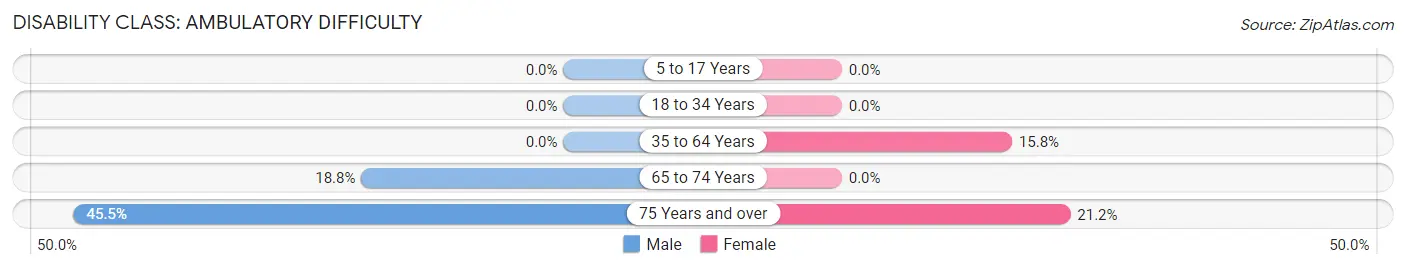
| Age Bracket | Male | Female |
| 5 to 17 Years | 0 (0.0%) | 0 (0.0%) |
| 18 to 34 Years | 0 (0.0%) | 0 (0.0%) |
| 35 to 64 Years | 0 (0.0%) | 15 (15.8%) |
| 65 to 74 Years | 3 (18.8%) | 0 (0.0%) |
| 75 Years and over | 5 (45.5%) | 7 (21.2%) |
Disability Class: Self-Care Difficulty
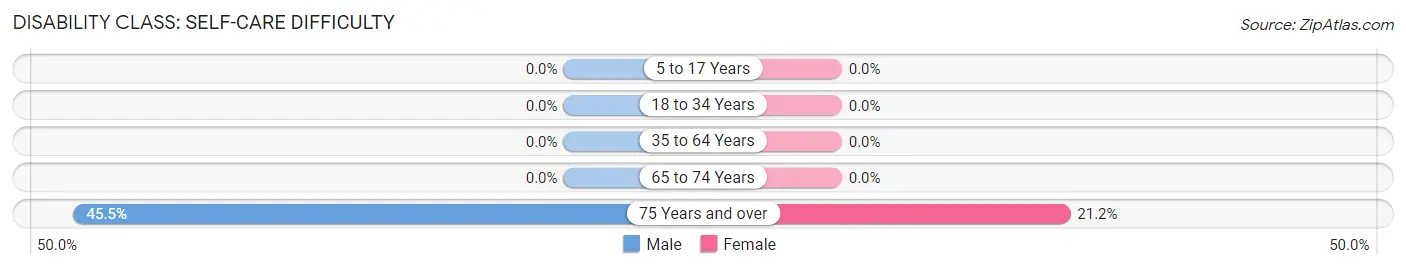
| Age Bracket | Male | Female |
| 5 to 17 Years | 0 (0.0%) | 0 (0.0%) |
| 18 to 34 Years | 0 (0.0%) | 0 (0.0%) |
| 35 to 64 Years | 0 (0.0%) | 0 (0.0%) |
| 65 to 74 Years | 0 (0.0%) | 0 (0.0%) |
| 75 Years and over | 5 (45.5%) | 7 (21.2%) |
Technology Access in Cameron
Computing Device Access in Cameron
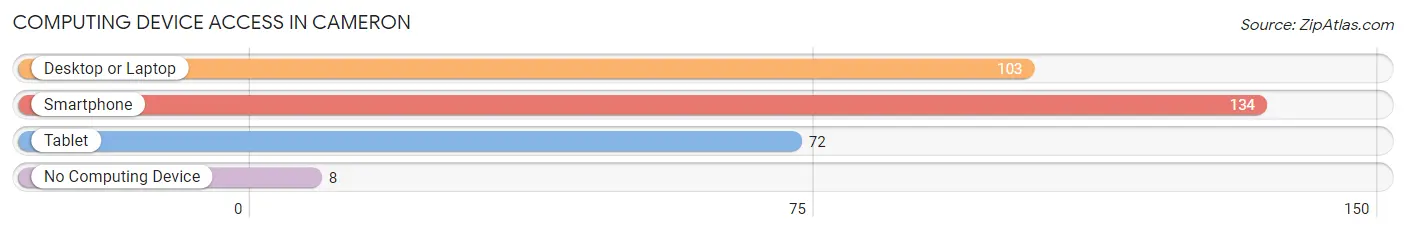
| Device Type | # Households | % Households |
| Desktop or Laptop | 103 | 67.3% |
| Smartphone | 134 | 87.6% |
| Tablet | 72 | 47.1% |
| No Computing Device | 8 | 5.2% |
| Total | 153 | 100.0% |
Internet Access in Cameron
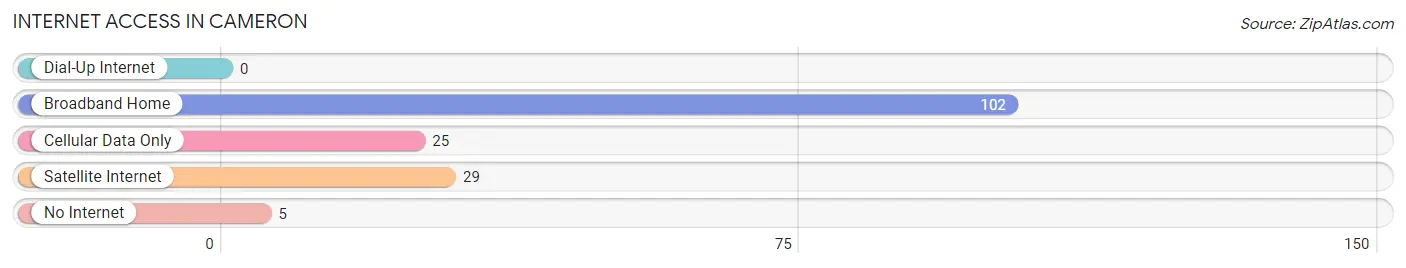
| Internet Type | # Households | % Households |
| Dial-Up Internet | 0 | 0.0% |
| Broadband Home | 102 | 66.7% |
| Cellular Data Only | 25 | 16.3% |
| Satellite Internet | 29 | 19.0% |
| No Internet | 5 | 3.3% |
| Total | 153 | 100.0% |
Cameron Summary
Cameron, North Carolina is a small town located in Moore County, North Carolina. It is situated in the Sandhills region of the state, and is part of the Fayetteville metropolitan area. The town has a population of approximately 1,500 people, and is known for its rural charm and friendly atmosphere.
Geography
Cameron is located in the Sandhills region of North Carolina, which is characterized by rolling hills and sandy soils. The town is situated in the northern part of Moore County, and is bordered by the towns of Carthage, Robbins, and Vass. The town is located approximately 25 miles south of Fayetteville, and is accessible via US Highway 1 and NC Highway 24.
The town is situated on the banks of the Little River, which is a tributary of the Cape Fear River. The Little River is a popular destination for fishing, canoeing, and kayaking. The town is also home to several parks, including the Cameron Community Park, which features a playground, picnic areas, and a walking trail.
Economy
Cameron’s economy is largely based on agriculture and tourism. The town is home to several farms, which produce a variety of crops, including corn, soybeans, and cotton. The town is also home to several small businesses, including restaurants, retail stores, and service providers.
The town is also a popular destination for tourists, who come to enjoy the rural charm and natural beauty of the area. The town is home to several historic sites, including the Cameron Historic District, which is listed on the National Register of Historic Places. The town is also home to several festivals and events, including the Cameron Festival, which is held each year in October.
Demographics
As of the 2010 census, the population of Cameron was 1,500 people. The racial makeup of the town was 94.7% White, 2.7% African American, 0.7% Native American, 0.3% Asian, and 1.6% from other races. The median household income was $37,500, and the median family income was $45,000.
The town is served by the Moore County School District, which includes two elementary schools, one middle school, and one high school. The town is also home to several churches, including the Cameron United Methodist Church, the Cameron Presbyterian Church, and the Cameron Baptist Church.
Conclusion
Cameron, North Carolina is a small town located in Moore County, North Carolina. It is situated in the Sandhills region of the state, and is part of the Fayetteville metropolitan area. The town has a population of approximately 1,500 people, and is known for its rural charm and friendly atmosphere. The town’s economy is largely based on agriculture and tourism, and the town is home to several historic sites and festivals. The town is served by the Moore County School District, and is home to several churches.
Common Questions
What is Per Capita Income in Cameron?
Per Capita income in Cameron is $27,321.
What is the Median Family Income in Cameron?
Median Family Income in Cameron is $75,000.
What is the Median Household income in Cameron?
Median Household Income in Cameron is $71,696.
What is Inequality or Gini Index in Cameron?
Inequality or Gini Index in Cameron is 0.29.
What is the Total Population of Cameron?
Total Population of Cameron is 427.
What is the Total Male Population of Cameron?
Total Male Population of Cameron is 181.
What is the Total Female Population of Cameron?
Total Female Population of Cameron is 246.
What is the Ratio of Males per 100 Females in Cameron?
There are 73.58 Males per 100 Females in Cameron.
What is the Ratio of Females per 100 Males in Cameron?
There are 135.91 Females per 100 Males in Cameron.
What is the Median Population Age in Cameron?
Median Population Age in Cameron is 36.9 Years.
What is the Average Family Size in Cameron
Average Family Size in Cameron is 3.0 People.
What is the Average Household Size in Cameron
Average Household Size in Cameron is 2.8 People.
How Large is the Labor Force in Cameron?
There are 260 People in the Labor Forcein in Cameron.
What is the Percentage of People in the Labor Force in Cameron?
73.2% of People are in the Labor Force in Cameron.
What is the Unemployment Rate in Cameron?
Unemployment Rate in Cameron is 1.9%.