Calabash, NC Map & Demographics
Calabash Map
Calabash Overview
$27,818
PER CAPITA INCOME
$61,087
AVG FAMILY INCOME
$46,607
AVG HOUSEHOLD INCOME
10.5%
WAGE / INCOME GAP [ % ]
89.5¢/ $1
WAGE / INCOME GAP [ $ ]
0.40
INEQUALITY / GINI INDEX
2,570
TOTAL POPULATION
1,069
MALE POPULATION
1,501
FEMALE POPULATION
71.22
MALES / 100 FEMALES
140.41
FEMALES / 100 MALES
53.9
MEDIAN AGE
3.0
AVG FAMILY SIZE
2.2
AVG HOUSEHOLD SIZE
1,187
LABOR FORCE [ PEOPLE ]
54.7%
PERCENT IN LABOR FORCE
8.1%
UNEMPLOYMENT RATE
Calabash Zip Codes
Calabash Area Codes
Income in Calabash
Income Overview in Calabash
Per Capita Income in Calabash is $27,818, while median incomes of families and households are $61,087 and $46,607 respectively.
| Characteristic | Number | Measure |
| Per Capita Income | 2,570 | $27,818 |
| Median Family Income | 650 | $61,087 |
| Mean Family Income | 650 | $71,240 |
| Median Household Income | 1,140 | $46,607 |
| Mean Household Income | 1,140 | $60,384 |
| Income Deficit | 650 | $0 |
| Wage / Income Gap (%) | 2,570 | 10.54% |
| Wage / Income Gap ($) | 2,570 | 89.46¢ per $1 |
| Gini / Inequality Index | 2,570 | 0.40 |
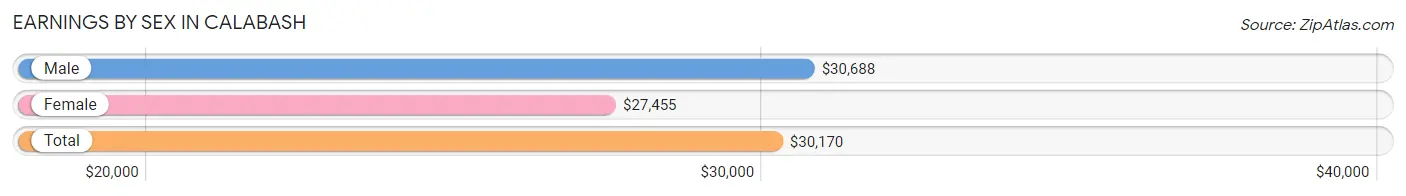
Earnings by Sex in Calabash
Average Earnings in Calabash are $30,170, $30,688 for men and $27,455 for women, a difference of 10.5%.
| Sex | Number | Average Earnings |
| Male | 440 (37.2%) | $30,688 |
| Female | 744 (62.8%) | $27,455 |
| Total | 1,184 (100.0%) | $30,170 |
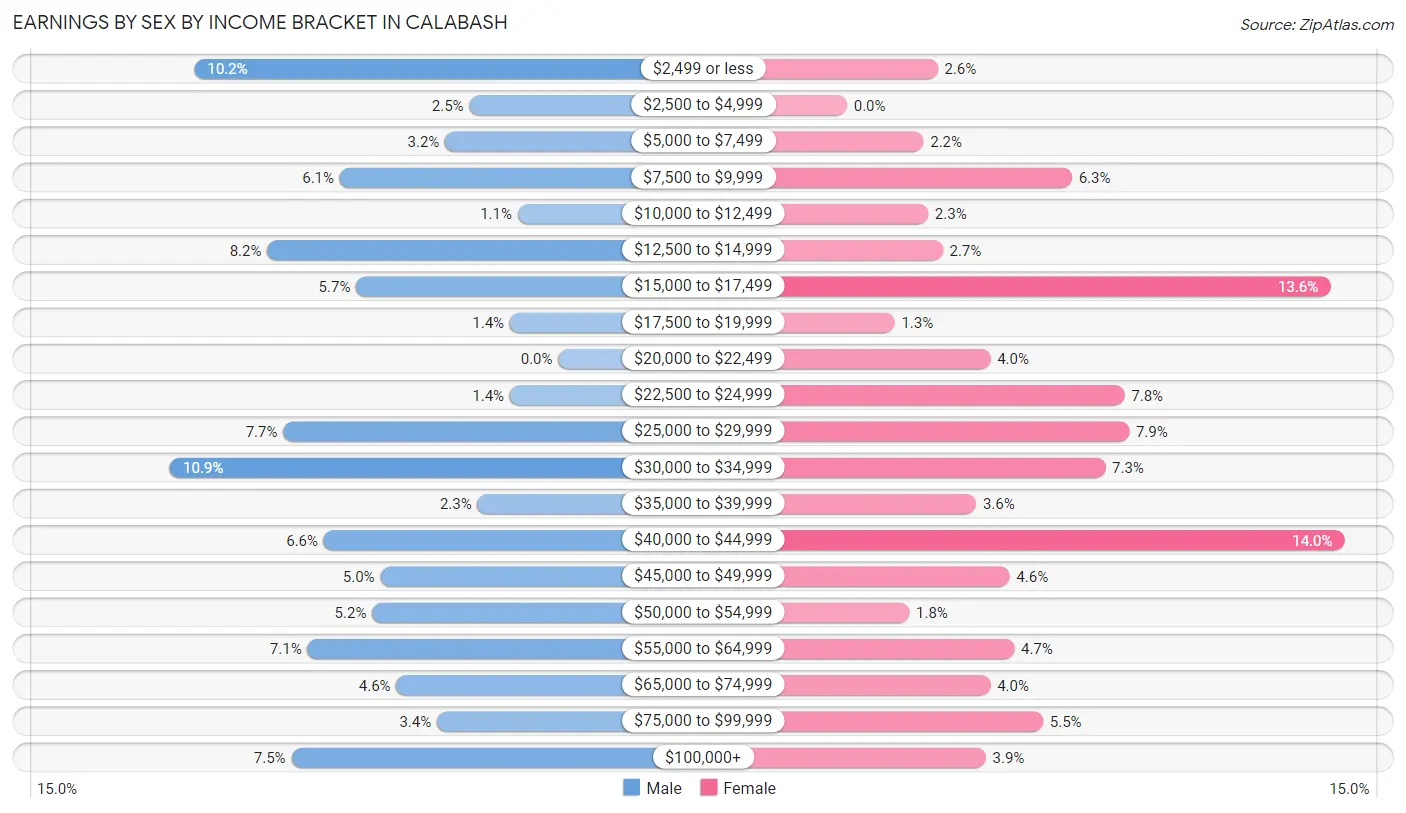
Earnings by Sex by Income Bracket in Calabash
The most common earnings brackets in Calabash are $30,000 to $34,999 for men (48 | 10.9%) and $40,000 to $44,999 for women (104 | 14.0%).
| Income | Male | Female |
| $2,499 or less | 45 (10.2%) | 19 (2.5%) |
| $2,500 to $4,999 | 11 (2.5%) | 0 (0.0%) |
| $5,000 to $7,499 | 14 (3.2%) | 16 (2.1%) |
| $7,500 to $9,999 | 27 (6.1%) | 47 (6.3%) |
| $10,000 to $12,499 | 5 (1.1%) | 17 (2.3%) |
| $12,500 to $14,999 | 36 (8.2%) | 20 (2.7%) |
| $15,000 to $17,499 | 25 (5.7%) | 101 (13.6%) |
| $17,500 to $19,999 | 6 (1.4%) | 10 (1.3%) |
| $20,000 to $22,499 | 0 (0.0%) | 30 (4.0%) |
| $22,500 to $24,999 | 6 (1.4%) | 58 (7.8%) |
| $25,000 to $29,999 | 34 (7.7%) | 59 (7.9%) |
| $30,000 to $34,999 | 48 (10.9%) | 54 (7.3%) |
| $35,000 to $39,999 | 10 (2.3%) | 27 (3.6%) |
| $40,000 to $44,999 | 29 (6.6%) | 104 (14.0%) |
| $45,000 to $49,999 | 22 (5.0%) | 34 (4.6%) |
| $50,000 to $54,999 | 23 (5.2%) | 13 (1.8%) |
| $55,000 to $64,999 | 31 (7.0%) | 35 (4.7%) |
| $65,000 to $74,999 | 20 (4.5%) | 30 (4.0%) |
| $75,000 to $99,999 | 15 (3.4%) | 41 (5.5%) |
| $100,000+ | 33 (7.5%) | 29 (3.9%) |
| Total | 440 (100.0%) | 744 (100.0%) |
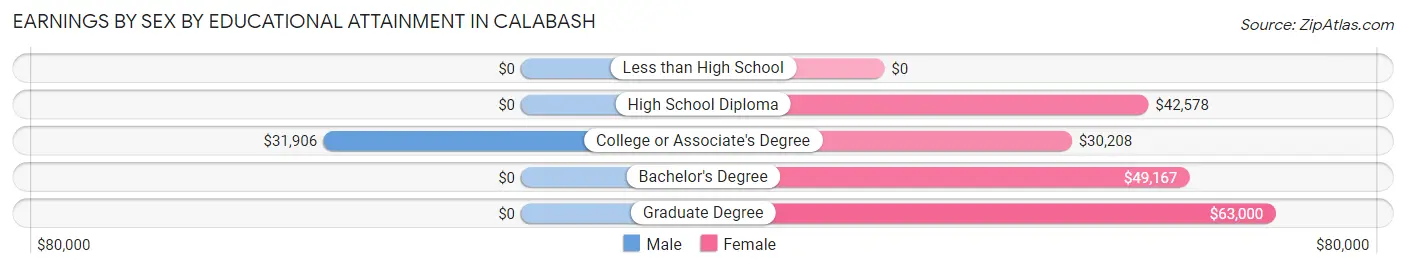
Earnings by Sex by Educational Attainment in Calabash
Average earnings in Calabash are $31,875 for men and $42,536 for women, a difference of 25.1%. Men with an educational attainment of college or associate's degree enjoy the highest average annual earnings of $31,906, while those with college or associate's degree education earn the least with $31,906. Women with an educational attainment of graduate degree earn the most with the average annual earnings of $63,000, while those with college or associate's degree education have the smallest earnings of $30,208.
| Educational Attainment | Male Income | Female Income |
| Less than High School | - | - |
| High School Diploma | - | - |
| College or Associate's Degree | $31,906 | $30,208 |
| Bachelor's Degree | - | - |
| Graduate Degree | - | - |
| Total | $31,875 | $42,536 |
Family Income in Calabash
Family Income Brackets in Calabash
According to the Calabash family income data, there are 211 families falling into the $50,000 to $74,999 income range, which is the most common income bracket and makes up 32.5% of all families.
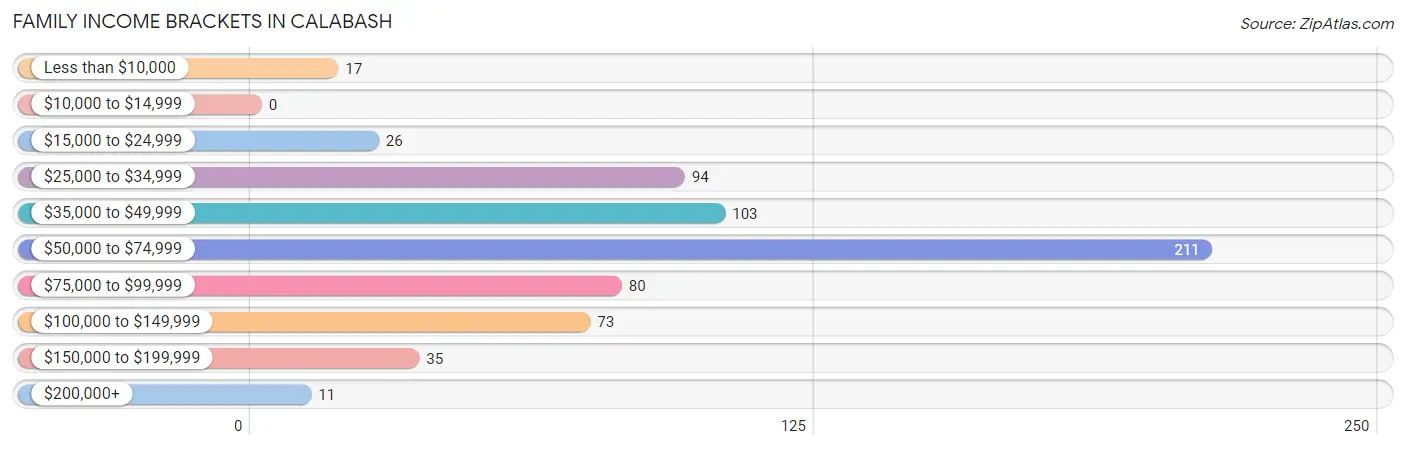
| Income Bracket | # Families | % Families |
| Less than $10,000 | 17 | 2.6% |
| $10,000 to $14,999 | 0 | 0.0% |
| $15,000 to $24,999 | 26 | 4.0% |
| $25,000 to $34,999 | 94 | 14.5% |
| $35,000 to $49,999 | 103 | 15.8% |
| $50,000 to $74,999 | 211 | 32.5% |
| $75,000 to $99,999 | 80 | 12.3% |
| $100,000 to $149,999 | 73 | 11.2% |
| $150,000 to $199,999 | 35 | 5.4% |
| $200,000+ | 11 | 1.7% |
Family Income by Famaliy Size in Calabash
3-person families (45 | 6.9%) account for the highest median family income in Calabash with $67,292 per family, while 2-person families (463 | 71.2%) have the highest median income of $30,808 per family member.
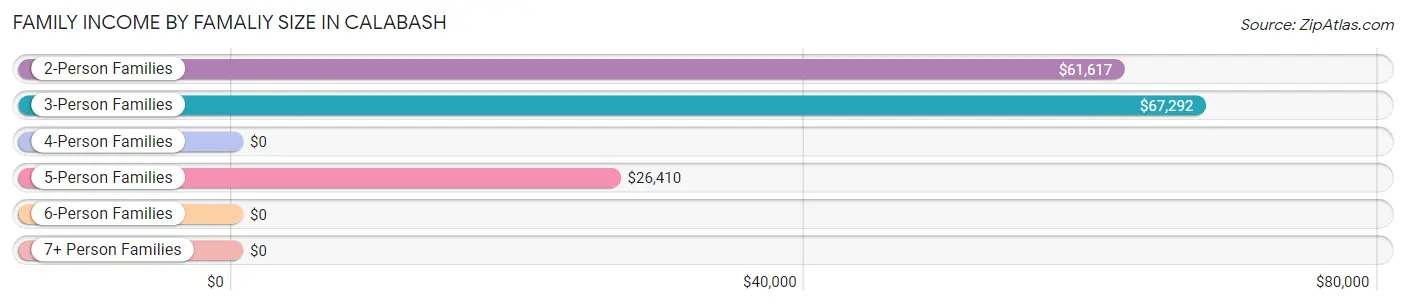
| Income Bracket | # Families | Median Income |
| 2-Person Families | 463 (71.2%) | $61,617 |
| 3-Person Families | 45 (6.9%) | $67,292 |
| 4-Person Families | 76 (11.7%) | $0 |
| 5-Person Families | 53 (8.2%) | $26,410 |
| 6-Person Families | 5 (0.8%) | $0 |
| 7+ Person Families | 8 (1.2%) | $0 |
| Total | 650 (100.0%) | $61,087 |
Family Income by Number of Earners in Calabash
The median family income in Calabash is $61,087, with families comprising 3+ earners (28) having the highest median family income of $150,962, while families with 1 earner (204) have the lowest median family income of $38,529, accounting for 4.3% and 31.4% of families, respectively.
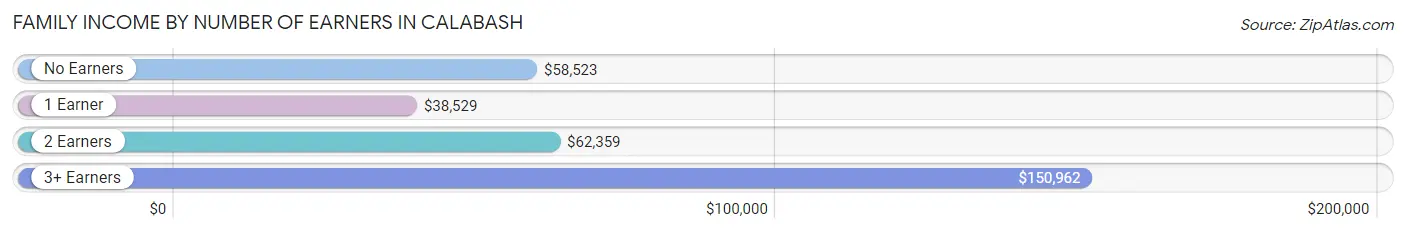
| Number of Earners | # Families | Median Income |
| No Earners | 167 (25.7%) | $58,523 |
| 1 Earner | 204 (31.4%) | $38,529 |
| 2 Earners | 251 (38.6%) | $62,359 |
| 3+ Earners | 28 (4.3%) | $150,962 |
| Total | 650 (100.0%) | $61,087 |
Household Income in Calabash
Household Income Brackets in Calabash
With 241 households falling in the category, the $25,000 to $34,999 income range is the most frequent in Calabash, accounting for 21.1% of all households. In contrast, only 22 households (1.9%) fall into the $200,000+ income bracket, making it the least populous group.
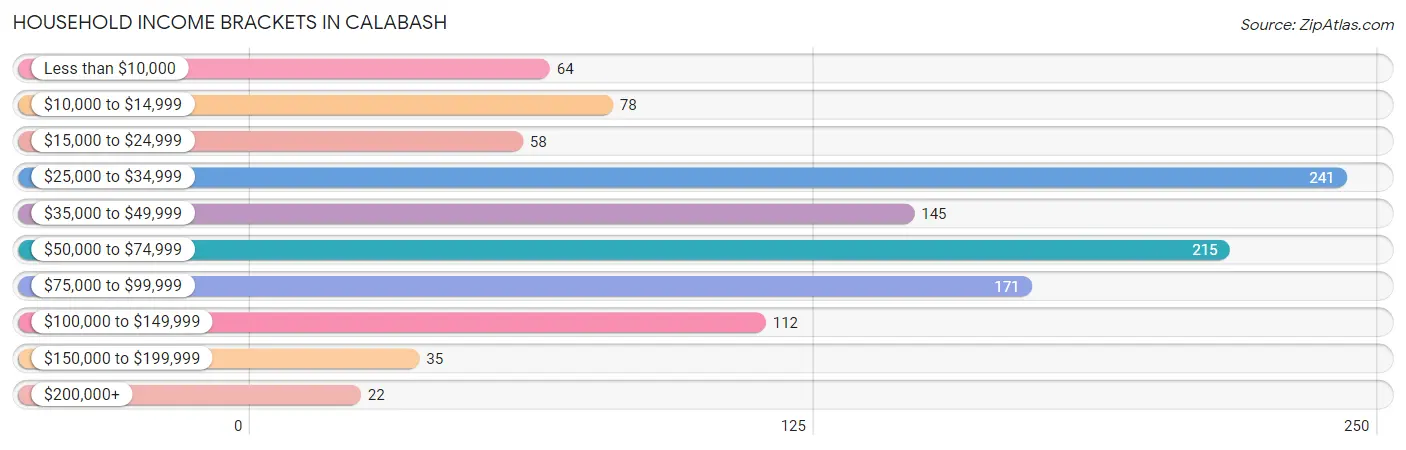
| Income Bracket | # Households | % Households |
| Less than $10,000 | 64 | 5.6% |
| $10,000 to $14,999 | 78 | 6.8% |
| $15,000 to $24,999 | 58 | 5.1% |
| $25,000 to $34,999 | 241 | 21.1% |
| $35,000 to $49,999 | 145 | 12.7% |
| $50,000 to $74,999 | 215 | 18.9% |
| $75,000 to $99,999 | 171 | 15.0% |
| $100,000 to $149,999 | 112 | 9.8% |
| $150,000 to $199,999 | 35 | 3.1% |
| $200,000+ | 22 | 1.9% |
Household Income by Householder Age in Calabash
The median household income in Calabash is $46,607, with the highest median household income of $61,163 found in the 45 to 64 years age bracket for the primary householder. A total of 558 households (48.9%) fall into this category. Meanwhile, the 15 to 24 years age bracket for the primary householder has the lowest median household income of $26,667, with 20 households (1.8%) in this group.
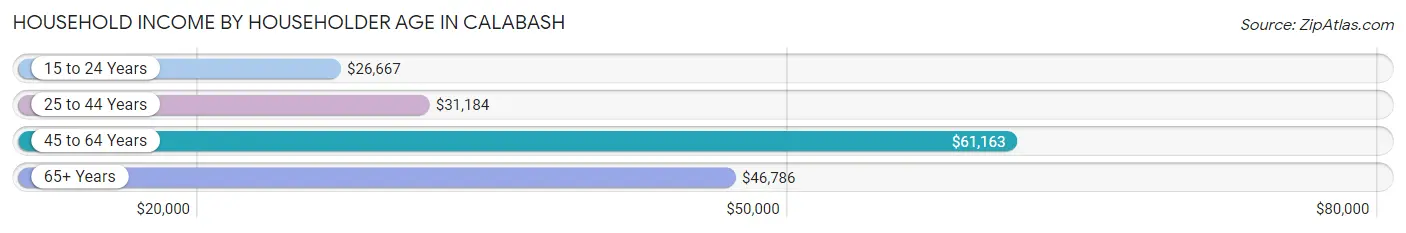
| Income Bracket | # Households | Median Income |
| 15 to 24 Years | 20 (1.8%) | $26,667 |
| 25 to 44 Years | 162 (14.2%) | $31,184 |
| 45 to 64 Years | 558 (48.9%) | $61,163 |
| 65+ Years | 400 (35.1%) | $46,786 |
| Total | 1,140 (100.0%) | $46,607 |
Poverty in Calabash
Income Below Poverty by Sex and Age in Calabash
With 26.4% poverty level for males and 28.0% for females among the residents of Calabash, under 5 year old males and 15 year old females are the most vulnerable to poverty, with 39 males (100.0%) and 45 females (100.0%) in their respective age groups living below the poverty level.
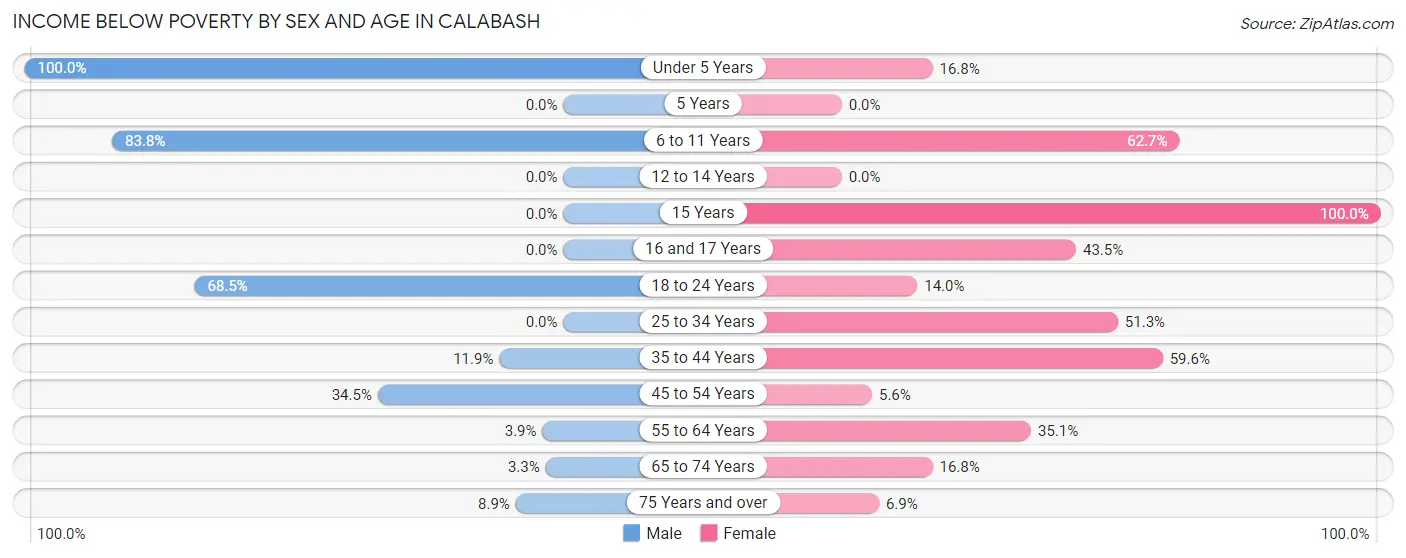
| Age Bracket | Male | Female |
| Under 5 Years | 39 (100.0%) | 16 (16.8%) |
| 5 Years | 0 (0.0%) | 0 (0.0%) |
| 6 to 11 Years | 67 (83.8%) | 52 (62.6%) |
| 12 to 14 Years | 0 (0.0%) | 0 (0.0%) |
| 15 Years | 0 (0.0%) | 45 (100.0%) |
| 16 and 17 Years | 0 (0.0%) | 10 (43.5%) |
| 18 to 24 Years | 76 (68.5%) | 23 (14.0%) |
| 25 to 34 Years | 0 (0.0%) | 41 (51.2%) |
| 35 to 44 Years | 5 (11.9%) | 56 (59.6%) |
| 45 to 54 Years | 72 (34.4%) | 11 (5.6%) |
| 55 to 64 Years | 7 (3.9%) | 123 (35.1%) |
| 65 to 74 Years | 6 (3.3%) | 33 (16.8%) |
| 75 Years and over | 10 (8.8%) | 10 (6.9%) |
| Total | 282 (26.4%) | 420 (28.0%) |
Income Above Poverty by Sex and Age in Calabash
According to the poverty statistics in Calabash, males aged 12 to 14 years and females aged 5 years are the age groups that are most secure financially, with 100.0% of males and 100.0% of females in these age groups living above the poverty line.
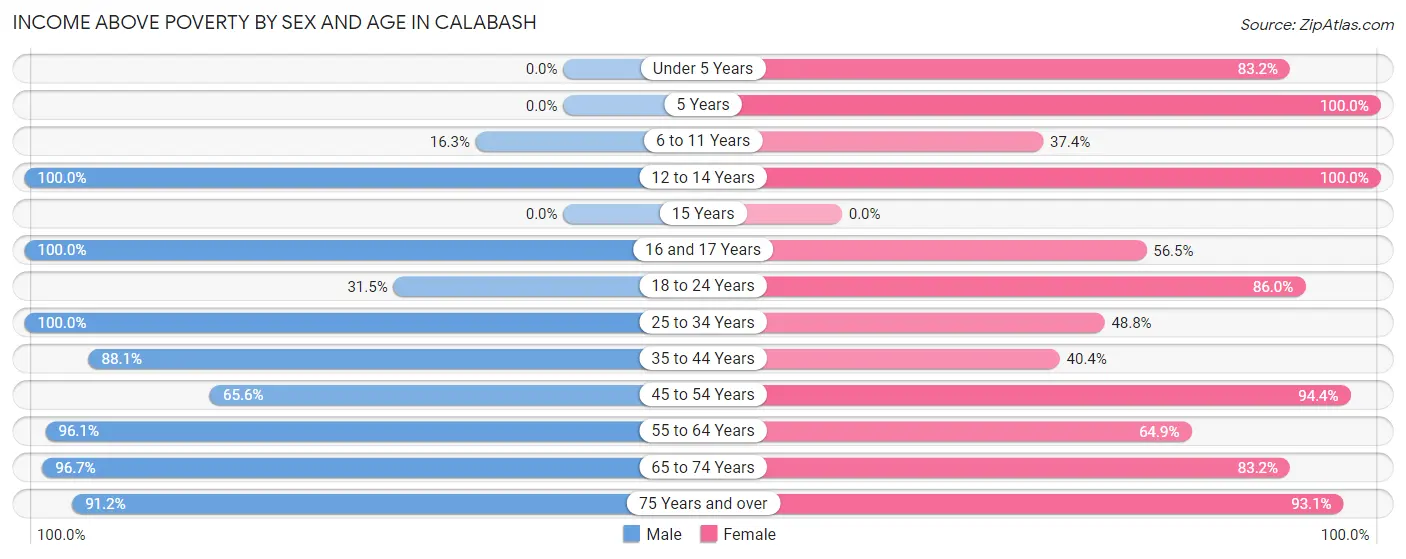
| Age Bracket | Male | Female |
| Under 5 Years | 0 (0.0%) | 79 (83.2%) |
| 5 Years | 0 (0.0%) | 6 (100.0%) |
| 6 to 11 Years | 13 (16.3%) | 31 (37.3%) |
| 12 to 14 Years | 28 (100.0%) | 24 (100.0%) |
| 15 Years | 0 (0.0%) | 0 (0.0%) |
| 16 and 17 Years | 2 (100.0%) | 13 (56.5%) |
| 18 to 24 Years | 35 (31.5%) | 141 (86.0%) |
| 25 to 34 Years | 83 (100.0%) | 39 (48.7%) |
| 35 to 44 Years | 37 (88.1%) | 38 (40.4%) |
| 45 to 54 Years | 137 (65.5%) | 185 (94.4%) |
| 55 to 64 Years | 173 (96.1%) | 227 (64.9%) |
| 65 to 74 Years | 176 (96.7%) | 163 (83.2%) |
| 75 Years and over | 103 (91.1%) | 135 (93.1%) |
| Total | 787 (73.6%) | 1,081 (72.0%) |
Income Below Poverty Among Married-Couple Families in Calabash
The poverty statistics for married-couple families in Calabash show that 4.6% or 18 of the total 388 families live below the poverty line. Families with 3 or 4 children have the highest poverty rate of 68.8%, comprising of 11 families. On the other hand, families with 1 or 2 children have the lowest poverty rate of 0.0%, which includes 0 families.
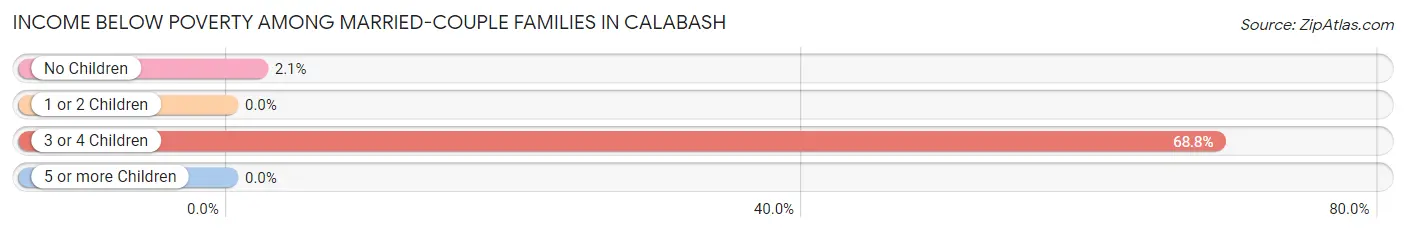
| Children | Above Poverty | Below Poverty |
| No Children | 331 (97.9%) | 7 (2.1%) |
| 1 or 2 Children | 34 (100.0%) | 0 (0.0%) |
| 3 or 4 Children | 5 (31.2%) | 11 (68.8%) |
| 5 or more Children | 0 (0.0%) | 0 (0.0%) |
| Total | 370 (95.4%) | 18 (4.6%) |
Income Below Poverty Among Single-Parent Households in Calabash
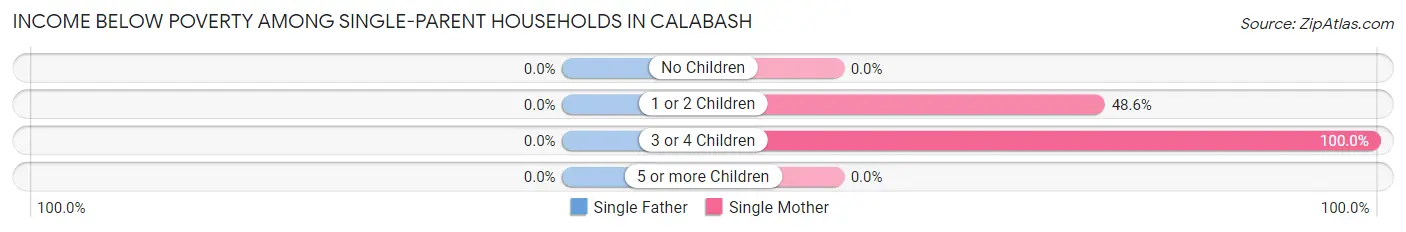
| Children | Single Father | Single Mother |
| No Children | 0 (0.0%) | 0 (0.0%) |
| 1 or 2 Children | 0 (0.0%) | 53 (48.6%) |
| 3 or 4 Children | 0 (0.0%) | 13 (100.0%) |
| 5 or more Children | 0 (0.0%) | 0 (0.0%) |
| Total | 0 (0.0%) | 66 (27.3%) |
Income Below Poverty Among Married-Couple vs Single-Parent Households in Calabash
The poverty data for Calabash shows that 18 of the married-couple family households (4.6%) and 66 of the single-parent households (25.2%) are living below the poverty level. Within the married-couple family households, those with 3 or 4 children have the highest poverty rate, with 11 households (68.8%) falling below the poverty line. Among the single-parent households, those with 3 or 4 children have the highest poverty rate, with 13 household (100.0%) living below poverty.
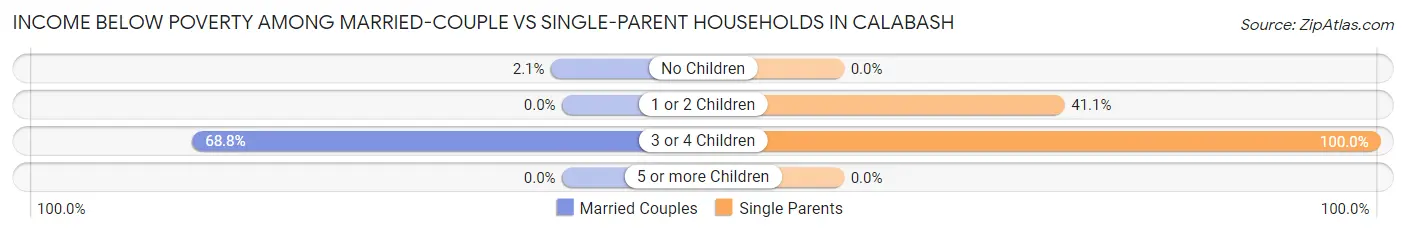
| Children | Married-Couple Families | Single-Parent Households |
| No Children | 7 (2.1%) | 0 (0.0%) |
| 1 or 2 Children | 0 (0.0%) | 53 (41.1%) |
| 3 or 4 Children | 11 (68.8%) | 13 (100.0%) |
| 5 or more Children | 0 (0.0%) | 0 (0.0%) |
| Total | 18 (4.6%) | 66 (25.2%) |
Race in Calabash
The most populous races in Calabash are White / Caucasian (1,893 | 73.7%), Two or more Races (392 | 15.2%), and Hispanic or Latino (294 | 11.4%).
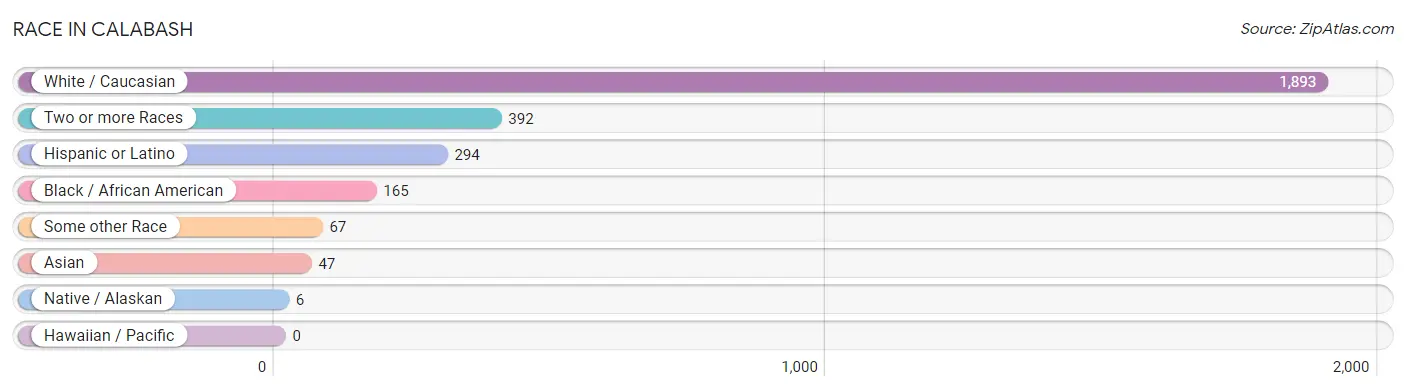
| Race | # Population | % Population |
| Asian | 47 | 1.8% |
| Black / African American | 165 | 6.4% |
| Hawaiian / Pacific | 0 | 0.0% |
| Hispanic or Latino | 294 | 11.4% |
| Native / Alaskan | 6 | 0.2% |
| White / Caucasian | 1,893 | 73.7% |
| Two or more Races | 392 | 15.2% |
| Some other Race | 67 | 2.6% |
| Total | 2,570 | 100.0% |
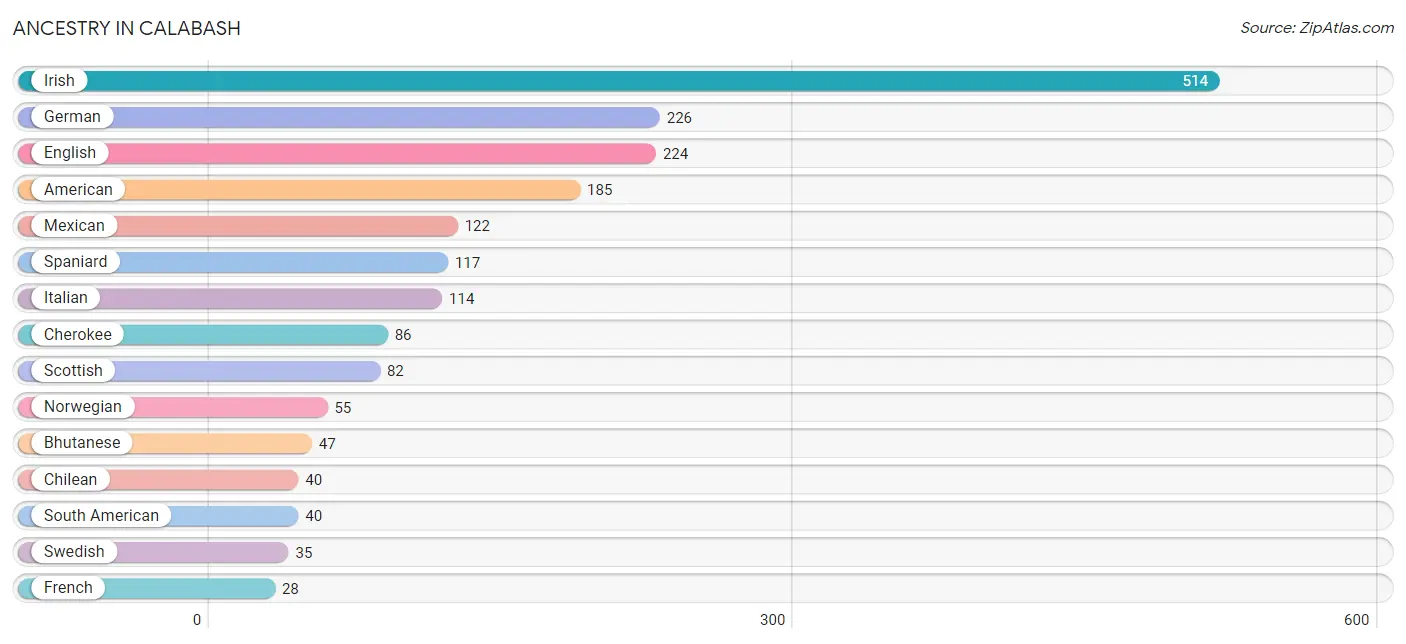
Ancestry in Calabash
The most populous ancestries reported in Calabash are Irish (514 | 20.0%), German (226 | 8.8%), English (224 | 8.7%), American (185 | 7.2%), and Mexican (122 | 4.8%), together accounting for 49.5% of all Calabash residents.
| Ancestry | # Population | % Population |
| American | 185 | 7.2% |
| Arab | 4 | 0.2% |
| Bhutanese | 47 | 1.8% |
| Blackfeet | 11 | 0.4% |
| British | 12 | 0.5% |
| Cherokee | 86 | 3.4% |
| Chilean | 40 | 1.6% |
| Cuban | 4 | 0.2% |
| Czech | 5 | 0.2% |
| Danish | 5 | 0.2% |
| Dutch | 11 | 0.4% |
| English | 224 | 8.7% |
| European | 16 | 0.6% |
| French | 28 | 1.1% |
| French Canadian | 5 | 0.2% |
| German | 226 | 8.8% |
| Hungarian | 6 | 0.2% |
| Irish | 514 | 20.0% |
| Italian | 114 | 4.4% |
| Lithuanian | 6 | 0.2% |
| Mexican | 122 | 4.8% |
| Norwegian | 55 | 2.1% |
| Polish | 20 | 0.8% |
| Puerto Rican | 11 | 0.4% |
| Russian | 5 | 0.2% |
| Scotch-Irish | 25 | 1.0% |
| Scottish | 82 | 3.2% |
| South American | 40 | 1.6% |
| Spaniard | 117 | 4.5% |
| Swedish | 35 | 1.4% |
| Syrian | 4 | 0.2% |
| Welsh | 5 | 0.2% |
| Yugoslavian | 22 | 0.9% | View All 33 Rows |
Immigrants in Calabash
The most numerous immigrant groups reported in Calabash came from Latin America (103 | 4.0%), Central America (99 | 3.8%), Honduras (56 | 2.2%), Mexico (43 | 1.7%), and Eastern Europe (11 | 0.4%), together accounting for 12.1% of all Calabash residents.
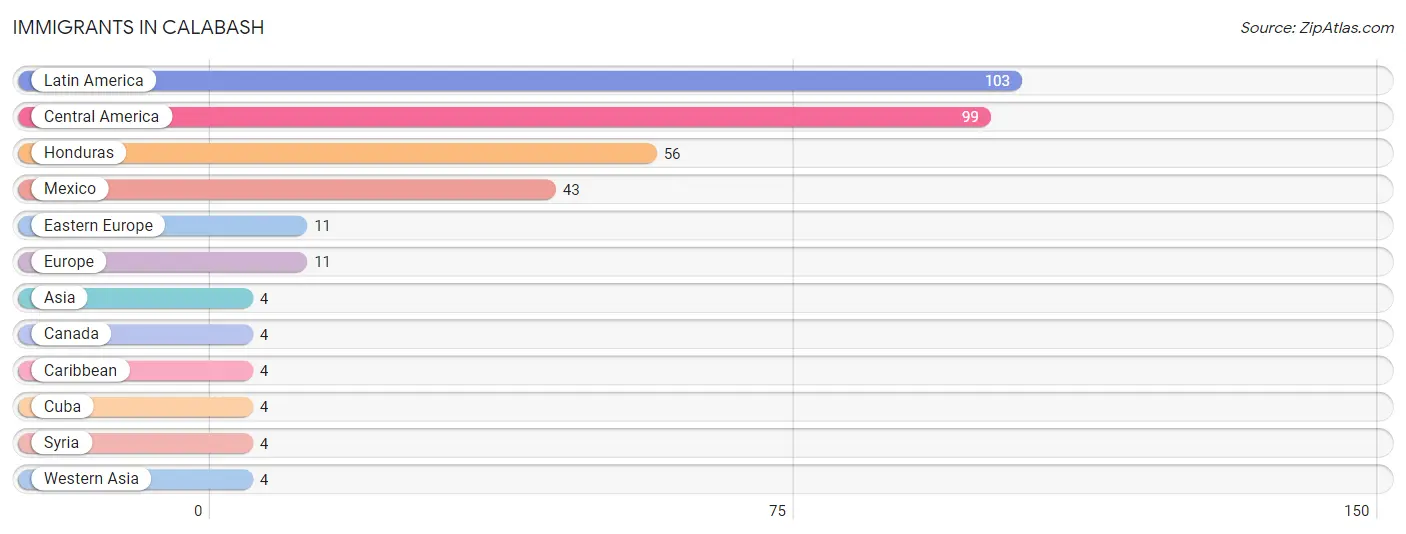
| Immigration Origin | # Population | % Population |
| Asia | 4 | 0.2% |
| Canada | 4 | 0.2% |
| Caribbean | 4 | 0.2% |
| Central America | 99 | 3.8% |
| Cuba | 4 | 0.2% |
| Eastern Europe | 11 | 0.4% |
| Europe | 11 | 0.4% |
| Honduras | 56 | 2.2% |
| Latin America | 103 | 4.0% |
| Mexico | 43 | 1.7% |
| Syria | 4 | 0.2% |
| Western Asia | 4 | 0.2% | View All 12 Rows |
Sex and Age in Calabash
Sex and Age in Calabash
The most populous age groups in Calabash are 50 to 54 Years (156 | 14.6%) for men and 55 to 59 Years (244 | 16.3%) for women.
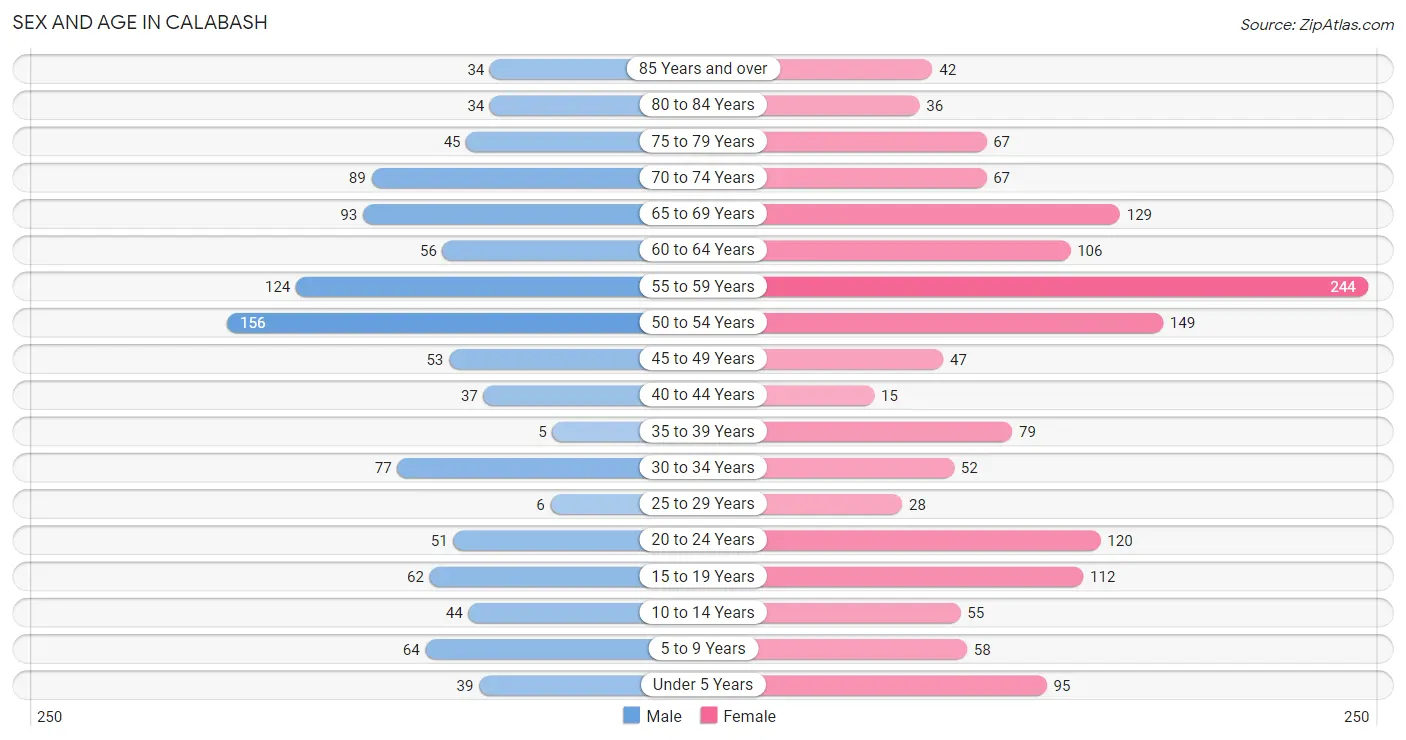
| Age Bracket | Male | Female |
| Under 5 Years | 39 (3.6%) | 95 (6.3%) |
| 5 to 9 Years | 64 (6.0%) | 58 (3.9%) |
| 10 to 14 Years | 44 (4.1%) | 55 (3.7%) |
| 15 to 19 Years | 62 (5.8%) | 112 (7.5%) |
| 20 to 24 Years | 51 (4.8%) | 120 (8.0%) |
| 25 to 29 Years | 6 (0.6%) | 28 (1.9%) |
| 30 to 34 Years | 77 (7.2%) | 52 (3.5%) |
| 35 to 39 Years | 5 (0.5%) | 79 (5.3%) |
| 40 to 44 Years | 37 (3.5%) | 15 (1.0%) |
| 45 to 49 Years | 53 (5.0%) | 47 (3.1%) |
| 50 to 54 Years | 156 (14.6%) | 149 (9.9%) |
| 55 to 59 Years | 124 (11.6%) | 244 (16.3%) |
| 60 to 64 Years | 56 (5.2%) | 106 (7.1%) |
| 65 to 69 Years | 93 (8.7%) | 129 (8.6%) |
| 70 to 74 Years | 89 (8.3%) | 67 (4.5%) |
| 75 to 79 Years | 45 (4.2%) | 67 (4.5%) |
| 80 to 84 Years | 34 (3.2%) | 36 (2.4%) |
| 85 Years and over | 34 (3.2%) | 42 (2.8%) |
| Total | 1,069 (100.0%) | 1,501 (100.0%) |
Families and Households in Calabash
Median Family Size in Calabash
The median family size in Calabash is 3.02 persons per family, with single female/mother families (242 | 37.2%) accounting for the largest median family size of 3.71 persons per family. On the other hand, single male/father families (20 | 3.1%) represent the smallest median family size with 1.80 persons per family.
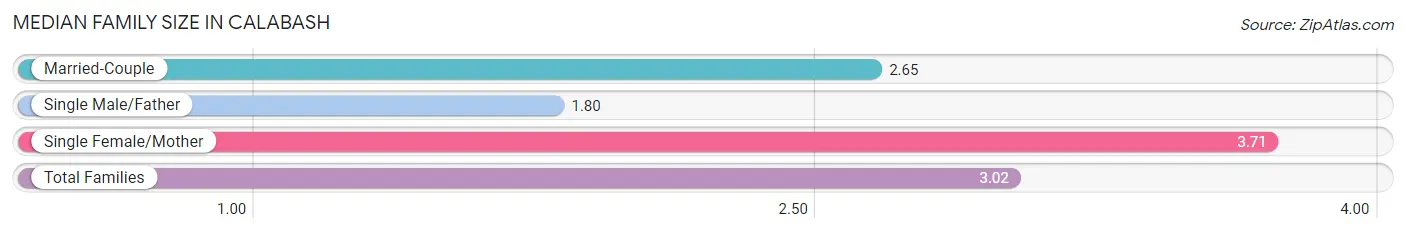
| Family Type | # Families | Family Size |
| Married-Couple | 388 (59.7%) | 2.65 |
| Single Male/Father | 20 (3.1%) | 1.80 |
| Single Female/Mother | 242 (37.2%) | 3.71 |
| Total Families | 650 (100.0%) | 3.02 |
Median Household Size in Calabash
The median household size in Calabash is 2.25 persons per household, with single female/mother households (242 | 21.2%) accounting for the largest median household size of 3.76 persons per household. non-family households (490 | 43.0%) represent the smallest median household size with 1.21 persons per household.
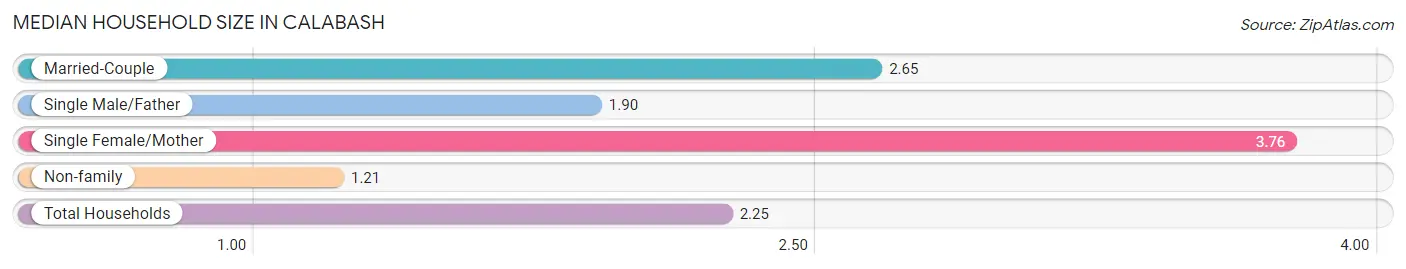
| Household Type | # Households | Household Size |
| Married-Couple | 388 (34.0%) | 2.65 |
| Single Male/Father | 20 (1.8%) | 1.90 |
| Single Female/Mother | 242 (21.2%) | 3.76 |
| Non-family | 490 (43.0%) | 1.21 |
| Total Households | 1,140 (100.0%) | 2.25 |
Household Size by Marriage Status in Calabash
Out of a total of 1,140 households in Calabash, 650 (57.0%) are family households, while 490 (43.0%) are nonfamily households. The most numerous type of family households are 2-person households, comprising 435, and the most common type of nonfamily households are 1-person households, comprising 373.
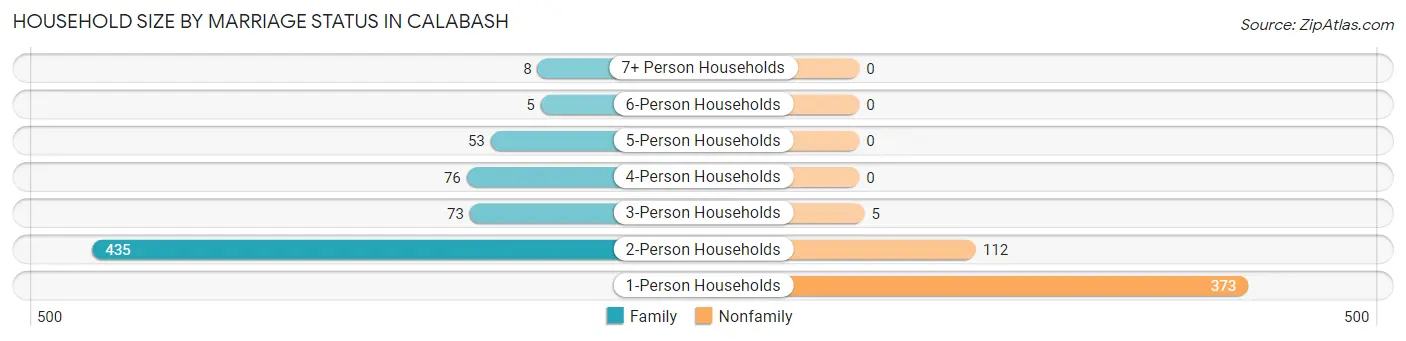
| Household Size | Family Households | Nonfamily Households |
| 1-Person Households | - | 373 (32.7%) |
| 2-Person Households | 435 (38.2%) | 112 (9.8%) |
| 3-Person Households | 73 (6.4%) | 5 (0.4%) |
| 4-Person Households | 76 (6.7%) | 0 (0.0%) |
| 5-Person Households | 53 (4.6%) | 0 (0.0%) |
| 6-Person Households | 5 (0.4%) | 0 (0.0%) |
| 7+ Person Households | 8 (0.7%) | 0 (0.0%) |
| Total | 650 (57.0%) | 490 (43.0%) |
Female Fertility in Calabash
Fertility by Age in Calabash
Average fertility rate in Calabash is 147.0 births per 1,000 women. Women in the age bracket of 35 to 50 years have the highest fertility rate with 368.0 births per 1,000 women. Women in the age bracket of 35 to 50 years acount for 82.4% of all women with births.
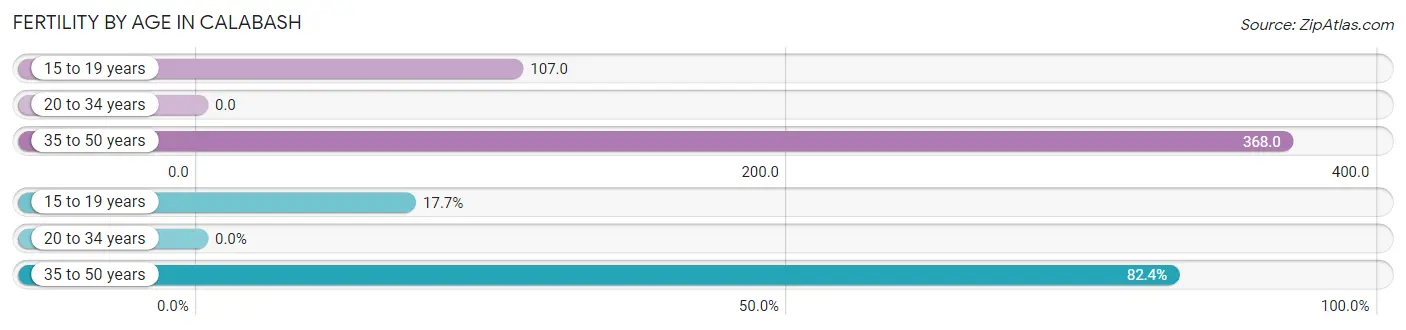
| Age Bracket | Women with Births | Births / 1,000 Women |
| 15 to 19 years | 12 (17.6%) | 107.0 |
| 20 to 34 years | 0 (0.0%) | 0.0 |
| 35 to 50 years | 56 (82.4%) | 368.0 |
| Total | 68 (100.0%) | 147.0 |
Fertility by Age by Marriage Status in Calabash
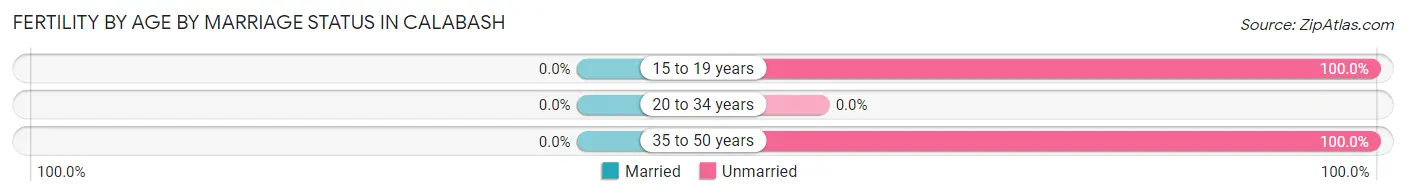
| Age Bracket | Married | Unmarried |
| 15 to 19 years | 0 (0.0%) | 12 (100.0%) |
| 20 to 34 years | 0 (0.0%) | 0 (0.0%) |
| 35 to 50 years | 0 (0.0%) | 56 (100.0%) |
| Total | 0 (0.0%) | 68 (100.0%) |
Fertility by Education in Calabash
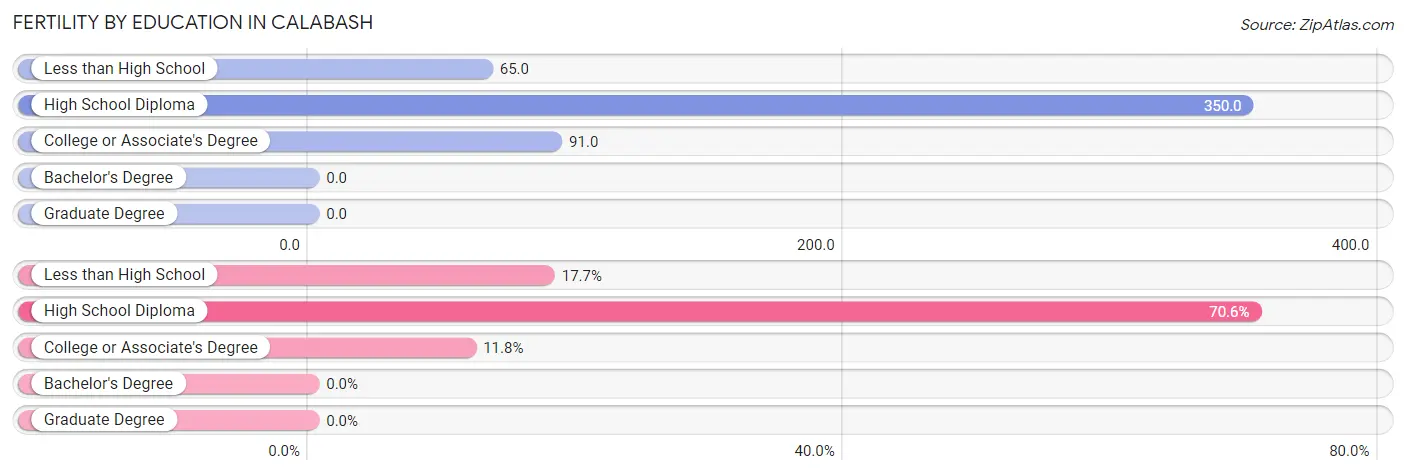
| Educational Attainment | Women with Births | Births / 1,000 Women |
| Less than High School | 12 (17.6%) | 65.0 |
| High School Diploma | 48 (70.6%) | 350.0 |
| College or Associate's Degree | 8 (11.8%) | 91.0 |
| Bachelor's Degree | 0 (0.0%) | 0.0 |
| Graduate Degree | 0 (0.0%) | 0.0 |
| Total | 68 (100.0%) | 147.0 |
Fertility by Education by Marriage Status in Calabash
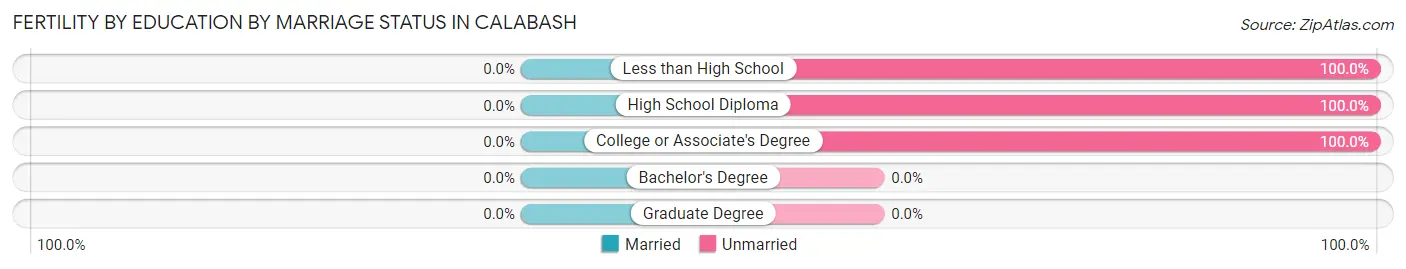
| Educational Attainment | Married | Unmarried |
| Less than High School | 0 (0.0%) | 12 (100.0%) |
| High School Diploma | 0 (0.0%) | 48 (100.0%) |
| College or Associate's Degree | 0 (0.0%) | 8 (100.0%) |
| Bachelor's Degree | 0 (0.0%) | 0 (0.0%) |
| Graduate Degree | 0 (0.0%) | 0 (0.0%) |
| Total | 0 (0.0%) | 68 (100.0%) |
Employment Characteristics in Calabash
Employment by Class of Employer in Calabash
Among the 1,053 employed individuals in Calabash, private company employees (819 | 77.8%), self-employed (not incorporated) (64 | 6.1%), and not-for-profit organizations (57 | 5.4%) make up the most common classes of employment.
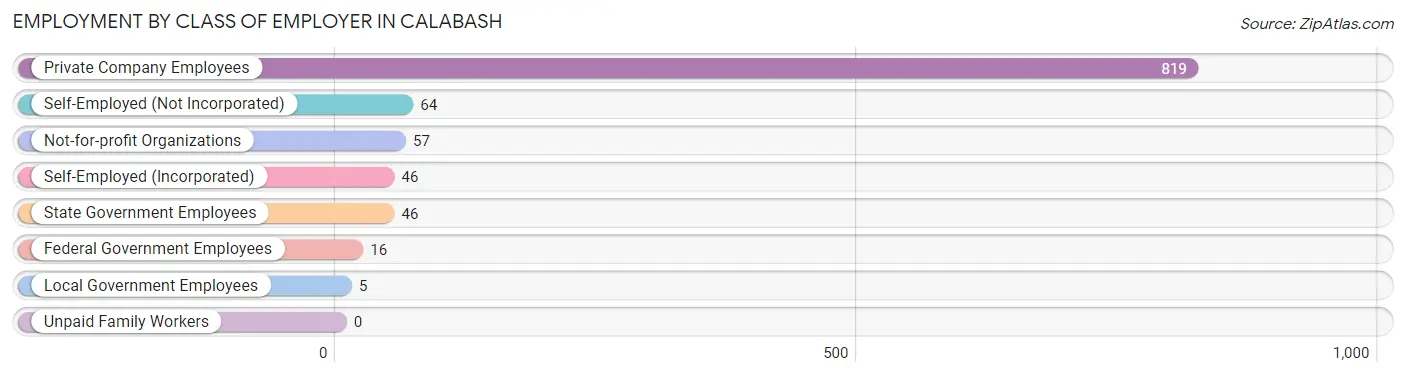
| Employer Class | # Employees | % Employees |
| Private Company Employees | 819 | 77.8% |
| Self-Employed (Incorporated) | 46 | 4.4% |
| Self-Employed (Not Incorporated) | 64 | 6.1% |
| Not-for-profit Organizations | 57 | 5.4% |
| Local Government Employees | 5 | 0.5% |
| State Government Employees | 46 | 4.4% |
| Federal Government Employees | 16 | 1.5% |
| Unpaid Family Workers | 0 | 0.0% |
| Total | 1,053 | 100.0% |
Employment Status by Age in Calabash
According to the labor force statistics for Calabash, out of the total population over 16 years of age (2,170), 54.7% or 1,187 individuals are in the labor force, with 8.1% or 96 of them unemployed. The age group with the highest labor force participation rate is 20 to 24 years, with 100.0% or 171 individuals in the labor force. Within the labor force, the 65 to 74 years age range has the highest percentage of unemployed individuals, with 21.7% or 15 of them being unemployed.
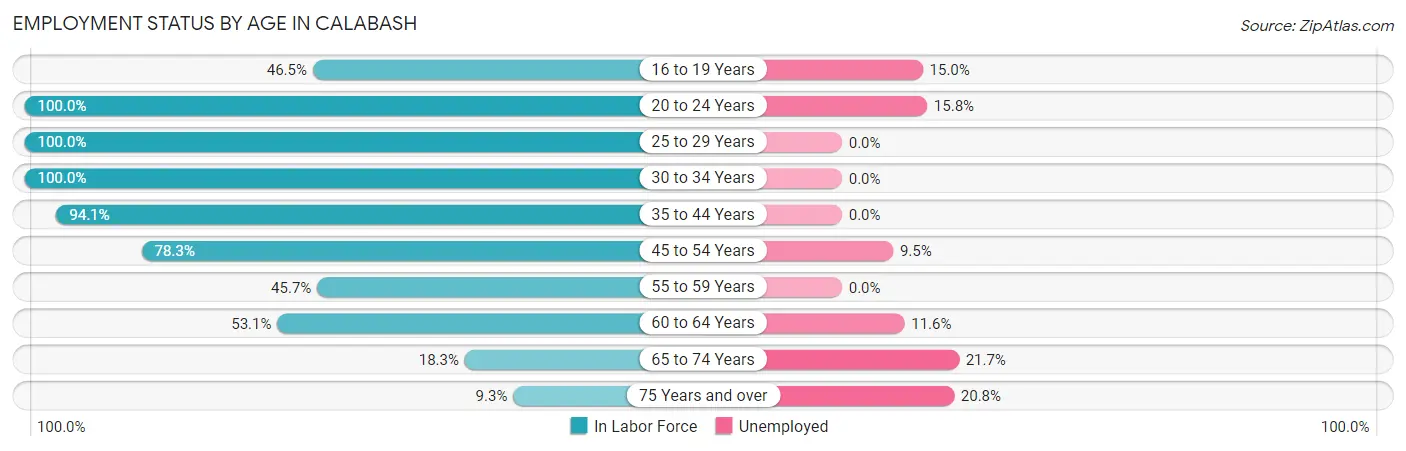
| Age Bracket | In Labor Force | Unemployed |
| 16 to 19 Years | 60 (46.5%) | 9 (15.0%) |
| 20 to 24 Years | 171 (100.0%) | 27 (15.8%) |
| 25 to 29 Years | 34 (100.0%) | 0 (0.0%) |
| 30 to 34 Years | 129 (100.0%) | 0 (0.0%) |
| 35 to 44 Years | 128 (94.1%) | 0 (0.0%) |
| 45 to 54 Years | 317 (78.3%) | 30 (9.5%) |
| 55 to 59 Years | 168 (45.7%) | 0 (0.0%) |
| 60 to 64 Years | 86 (53.1%) | 10 (11.6%) |
| 65 to 74 Years | 69 (18.3%) | 15 (21.7%) |
| 75 Years and over | 24 (9.3%) | 5 (20.8%) |
| Total | 1,187 (54.7%) | 96 (8.1%) |
Employment Status by Educational Attainment in Calabash
According to labor force statistics for Calabash, 69.9% of individuals (863) out of the total population between 25 and 64 years of age (1,234) are in the labor force, with 4.6% or 40 of them being unemployed. The group with the highest labor force participation rate are those with the educational attainment of bachelor's degree or higher, with 84.6% or 143 individuals in the labor force. Within the labor force, individuals with less than high school education have the highest percentage of unemployment, with 12.1% or 11 of them being unemployed.
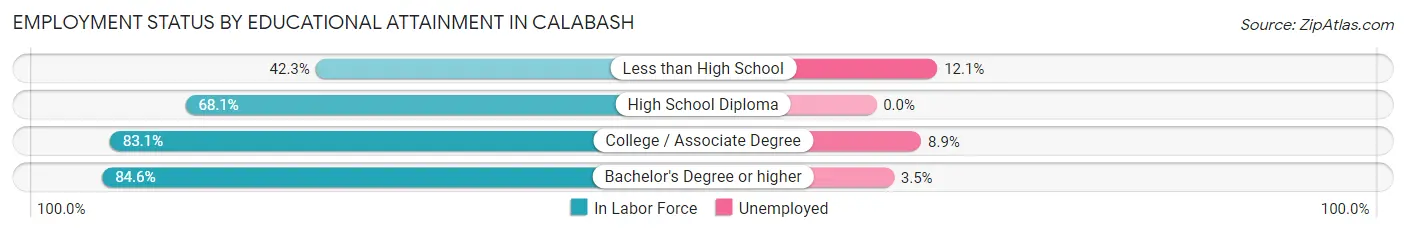
| Educational Attainment | In Labor Force | Unemployed |
| Less than High School | 91 (42.3%) | 26 (12.1%) |
| High School Diploma | 357 (68.1%) | 0 (0.0%) |
| College / Associate Degree | 271 (83.1%) | 29 (8.9%) |
| Bachelor's Degree or higher | 143 (84.6%) | 6 (3.5%) |
| Total | 863 (69.9%) | 57 (4.6%) |
Employment Occupations by Sex in Calabash
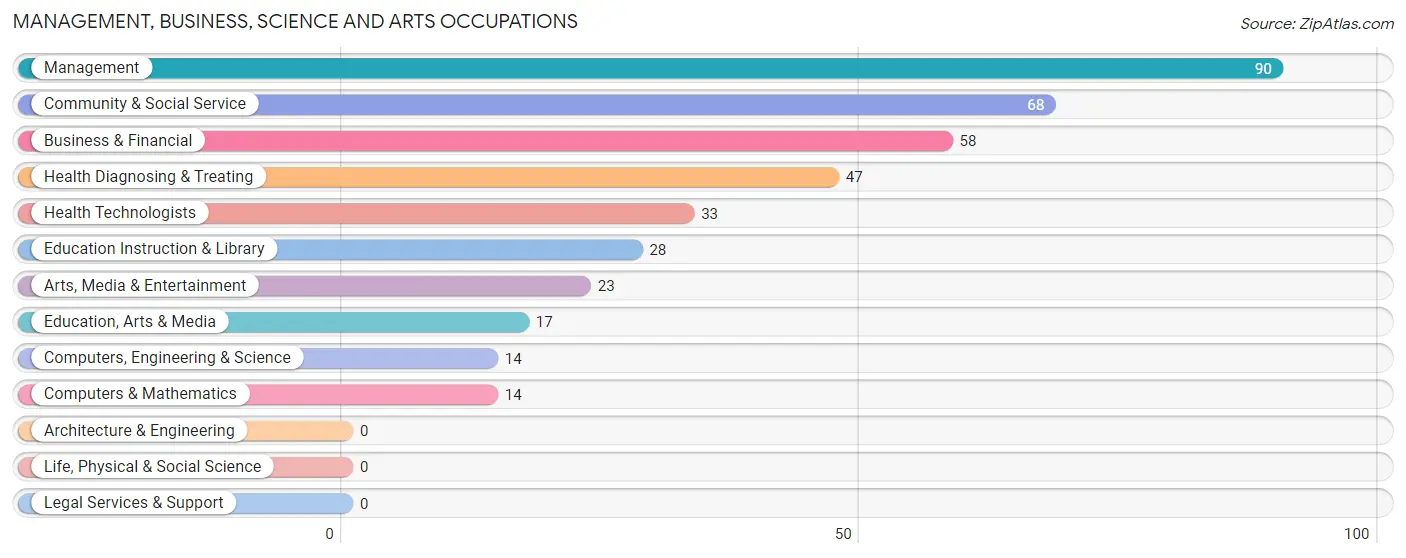
Management, Business, Science and Arts Occupations
The most common Management, Business, Science and Arts occupations in Calabash are Management (90 | 8.3%), Community & Social Service (68 | 6.2%), Business & Financial (58 | 5.3%), Health Diagnosing & Treating (47 | 4.3%), and Health Technologists (33 | 3.0%).
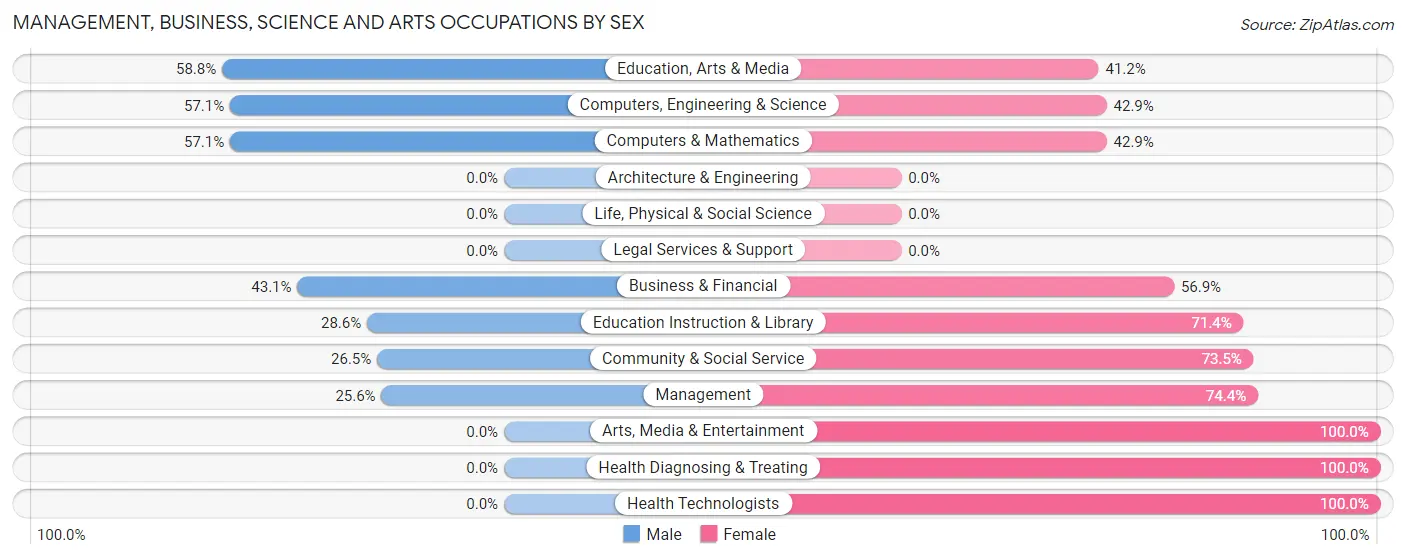
Management, Business, Science and Arts Occupations by Sex
Within the Management, Business, Science and Arts occupations in Calabash, the most male-oriented occupations are Education, Arts & Media (58.8%), Computers, Engineering & Science (57.1%), and Computers & Mathematics (57.1%), while the most female-oriented occupations are Arts, Media & Entertainment (100.0%), Health Diagnosing & Treating (100.0%), and Health Technologists (100.0%).
| Occupation | Male | Female |
| Management | 23 (25.6%) | 67 (74.4%) |
| Business & Financial | 25 (43.1%) | 33 (56.9%) |
| Computers, Engineering & Science | 8 (57.1%) | 6 (42.9%) |
| Computers & Mathematics | 8 (57.1%) | 6 (42.9%) |
| Architecture & Engineering | 0 (0.0%) | 0 (0.0%) |
| Life, Physical & Social Science | 0 (0.0%) | 0 (0.0%) |
| Community & Social Service | 18 (26.5%) | 50 (73.5%) |
| Education, Arts & Media | 10 (58.8%) | 7 (41.2%) |
| Legal Services & Support | 0 (0.0%) | 0 (0.0%) |
| Education Instruction & Library | 8 (28.6%) | 20 (71.4%) |
| Arts, Media & Entertainment | 0 (0.0%) | 23 (100.0%) |
| Health Diagnosing & Treating | 0 (0.0%) | 47 (100.0%) |
| Health Technologists | 0 (0.0%) | 33 (100.0%) |
| Total (Category) | 74 (26.7%) | 203 (73.3%) |
| Total (Overall) | 375 (34.4%) | 715 (65.6%) |
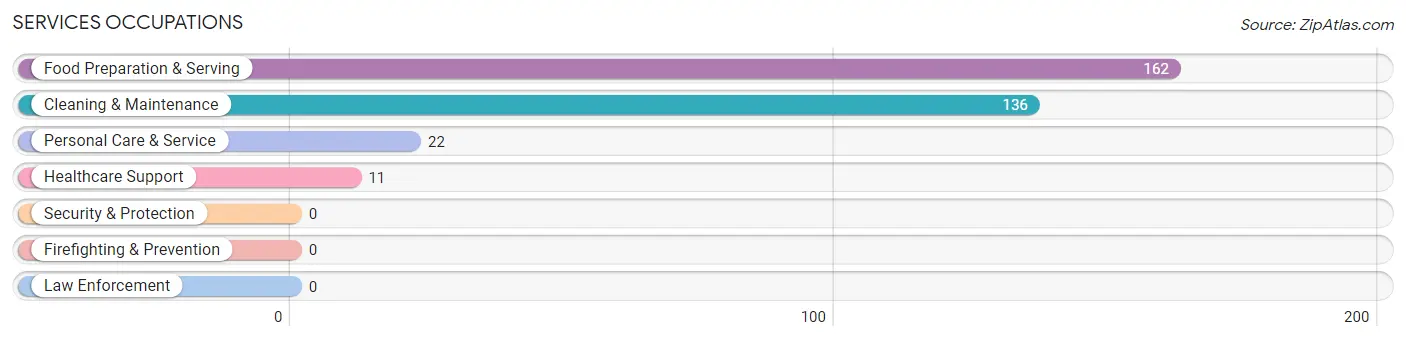
Services Occupations
The most common Services occupations in Calabash are Food Preparation & Serving (162 | 14.9%), Cleaning & Maintenance (136 | 12.5%), Personal Care & Service (22 | 2.0%), and Healthcare Support (11 | 1.0%).
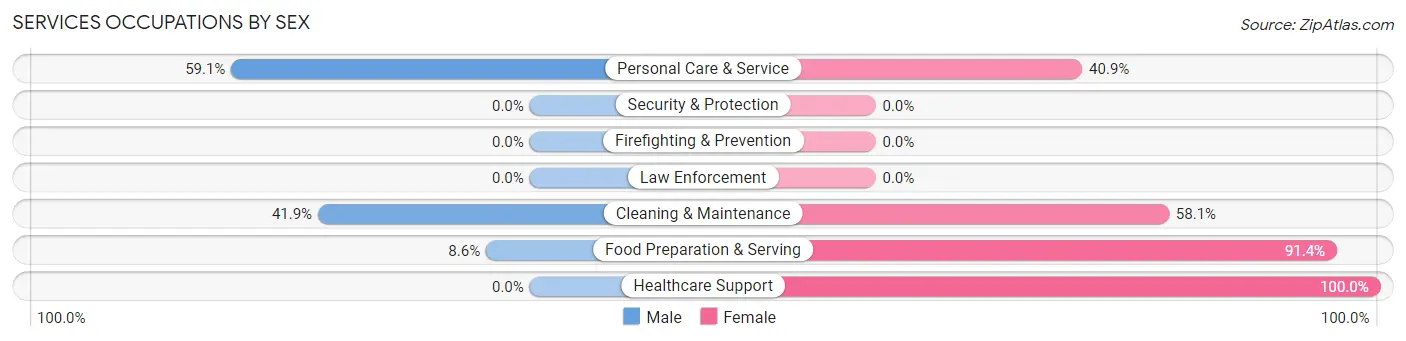
Services Occupations by Sex
Within the Services occupations in Calabash, the most male-oriented occupations are Personal Care & Service (59.1%), Cleaning & Maintenance (41.9%), and Food Preparation & Serving (8.6%), while the most female-oriented occupations are Healthcare Support (100.0%), Food Preparation & Serving (91.4%), and Cleaning & Maintenance (58.1%).
| Occupation | Male | Female |
| Healthcare Support | 0 (0.0%) | 11 (100.0%) |
| Security & Protection | 0 (0.0%) | 0 (0.0%) |
| Firefighting & Prevention | 0 (0.0%) | 0 (0.0%) |
| Law Enforcement | 0 (0.0%) | 0 (0.0%) |
| Food Preparation & Serving | 14 (8.6%) | 148 (91.4%) |
| Cleaning & Maintenance | 57 (41.9%) | 79 (58.1%) |
| Personal Care & Service | 13 (59.1%) | 9 (40.9%) |
| Total (Category) | 84 (25.4%) | 247 (74.6%) |
| Total (Overall) | 375 (34.4%) | 715 (65.6%) |
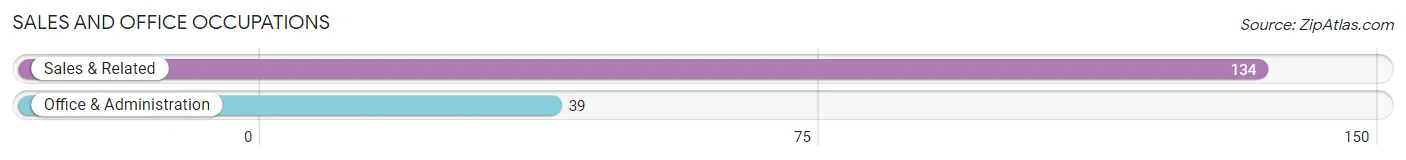
Sales and Office Occupations
The most common Sales and Office occupations in Calabash are Sales & Related (134 | 12.3%), and Office & Administration (39 | 3.6%).
Sales and Office Occupations by Sex
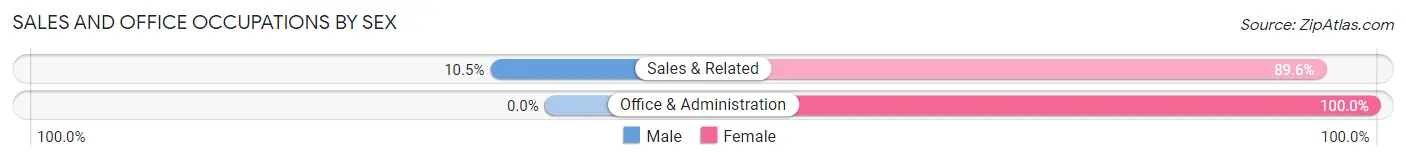
| Occupation | Male | Female |
| Sales & Related | 14 (10.4%) | 120 (89.5%) |
| Office & Administration | 0 (0.0%) | 39 (100.0%) |
| Total (Category) | 14 (8.1%) | 159 (91.9%) |
| Total (Overall) | 375 (34.4%) | 715 (65.6%) |
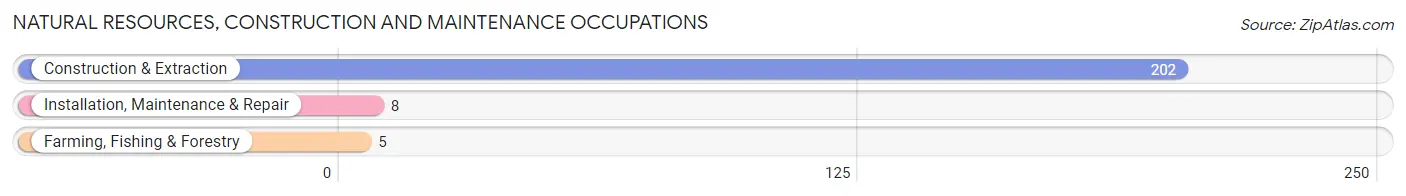
Natural Resources, Construction and Maintenance Occupations
The most common Natural Resources, Construction and Maintenance occupations in Calabash are Construction & Extraction (202 | 18.5%), Installation, Maintenance & Repair (8 | 0.7%), and Farming, Fishing & Forestry (5 | 0.5%).
Natural Resources, Construction and Maintenance Occupations by Sex
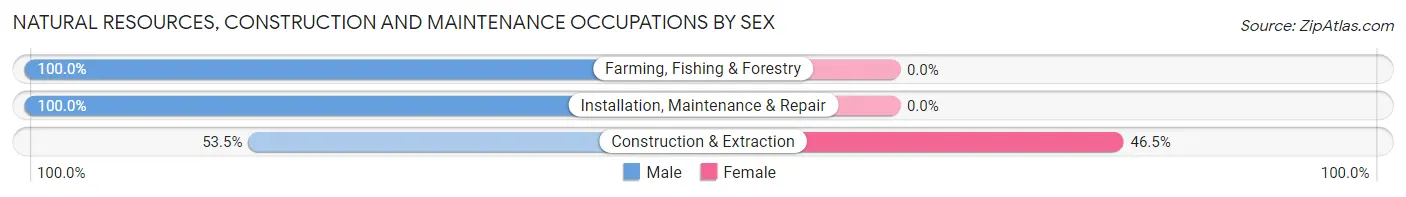
| Occupation | Male | Female |
| Farming, Fishing & Forestry | 5 (100.0%) | 0 (0.0%) |
| Construction & Extraction | 108 (53.5%) | 94 (46.5%) |
| Installation, Maintenance & Repair | 8 (100.0%) | 0 (0.0%) |
| Total (Category) | 121 (56.3%) | 94 (43.7%) |
| Total (Overall) | 375 (34.4%) | 715 (65.6%) |
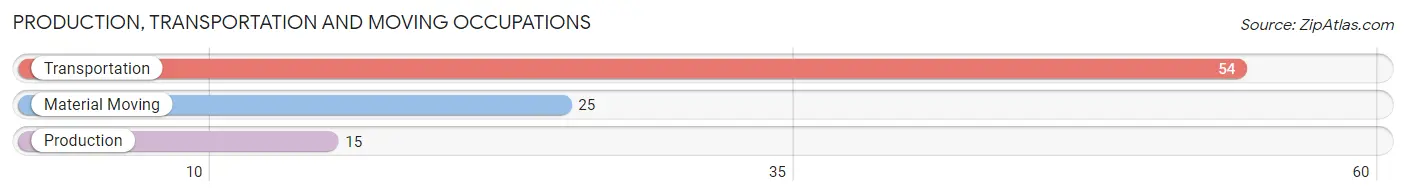
Production, Transportation and Moving Occupations
The most common Production, Transportation and Moving occupations in Calabash are Transportation (54 | 5.0%), Material Moving (25 | 2.3%), and Production (15 | 1.4%).
Production, Transportation and Moving Occupations by Sex
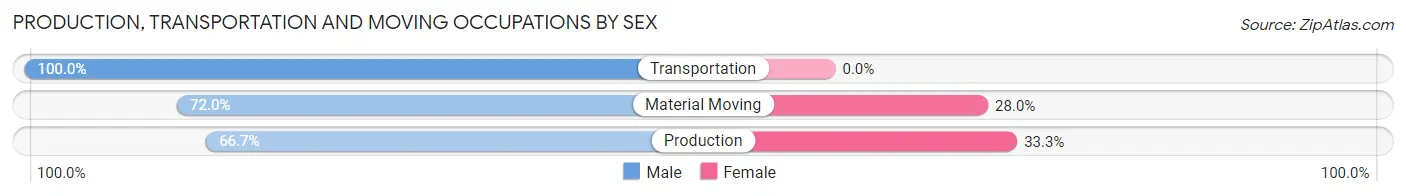
| Occupation | Male | Female |
| Production | 10 (66.7%) | 5 (33.3%) |
| Transportation | 54 (100.0%) | 0 (0.0%) |
| Material Moving | 18 (72.0%) | 7 (28.0%) |
| Total (Category) | 82 (87.2%) | 12 (12.8%) |
| Total (Overall) | 375 (34.4%) | 715 (65.6%) |
Employment Industries by Sex in Calabash
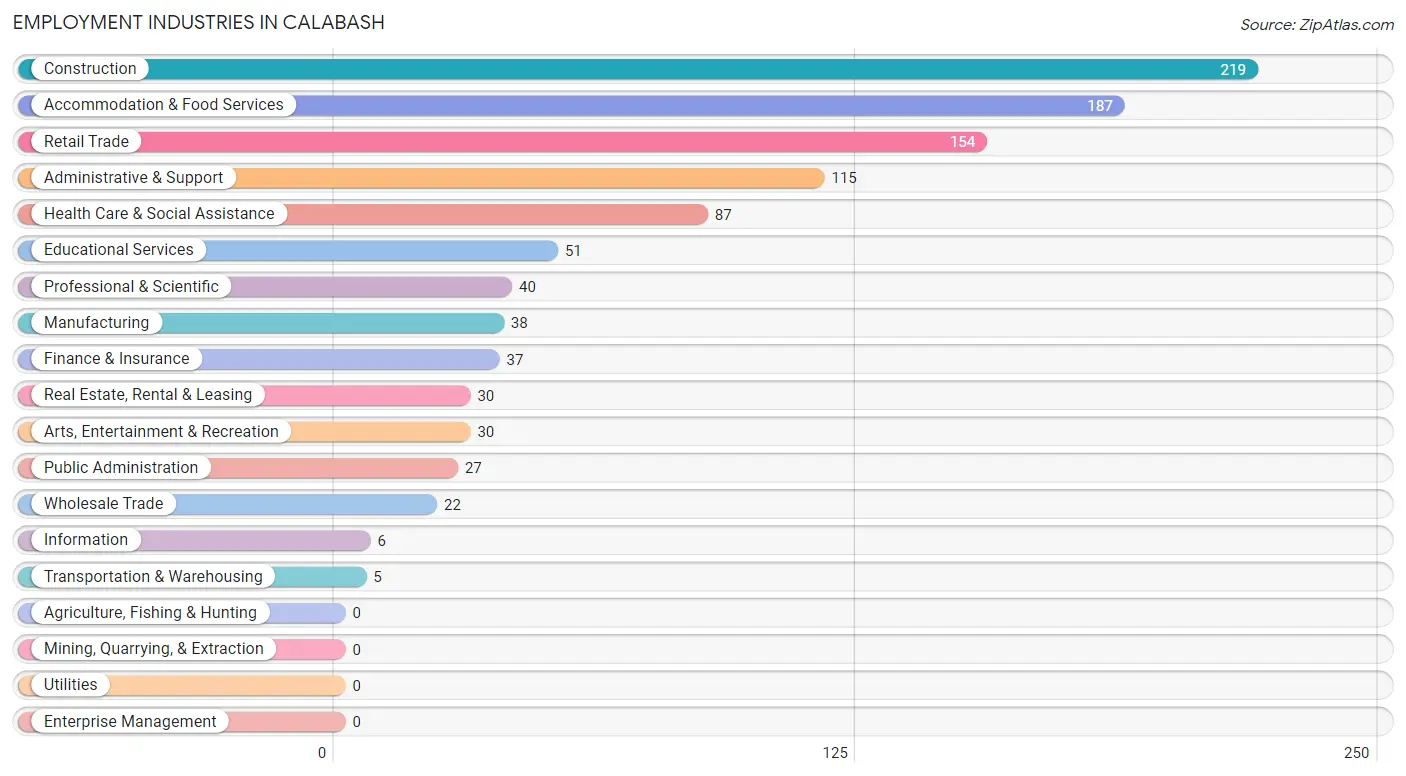
Employment Industries in Calabash
The major employment industries in Calabash include Construction (219 | 20.1%), Accommodation & Food Services (187 | 17.2%), Retail Trade (154 | 14.1%), Administrative & Support (115 | 10.5%), and Health Care & Social Assistance (87 | 8.0%).
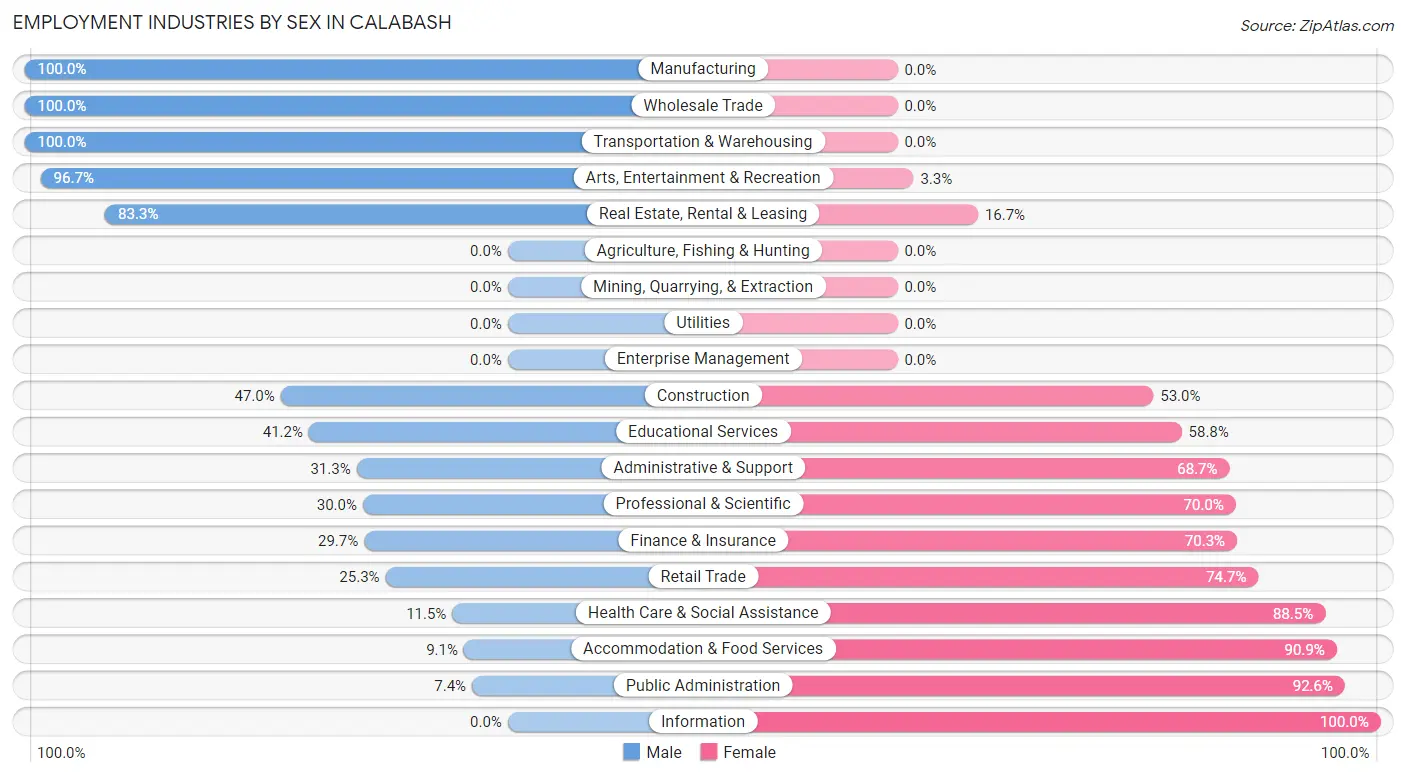
Employment Industries by Sex in Calabash
The Calabash industries that see more men than women are Manufacturing (100.0%), Wholesale Trade (100.0%), and Transportation & Warehousing (100.0%), whereas the industries that tend to have a higher number of women are Information (100.0%), Public Administration (92.6%), and Accommodation & Food Services (90.9%).
| Industry | Male | Female |
| Agriculture, Fishing & Hunting | 0 (0.0%) | 0 (0.0%) |
| Mining, Quarrying, & Extraction | 0 (0.0%) | 0 (0.0%) |
| Construction | 103 (47.0%) | 116 (53.0%) |
| Manufacturing | 38 (100.0%) | 0 (0.0%) |
| Wholesale Trade | 22 (100.0%) | 0 (0.0%) |
| Retail Trade | 39 (25.3%) | 115 (74.7%) |
| Transportation & Warehousing | 5 (100.0%) | 0 (0.0%) |
| Utilities | 0 (0.0%) | 0 (0.0%) |
| Information | 0 (0.0%) | 6 (100.0%) |
| Finance & Insurance | 11 (29.7%) | 26 (70.3%) |
| Real Estate, Rental & Leasing | 25 (83.3%) | 5 (16.7%) |
| Professional & Scientific | 12 (30.0%) | 28 (70.0%) |
| Enterprise Management | 0 (0.0%) | 0 (0.0%) |
| Administrative & Support | 36 (31.3%) | 79 (68.7%) |
| Educational Services | 21 (41.2%) | 30 (58.8%) |
| Health Care & Social Assistance | 10 (11.5%) | 77 (88.5%) |
| Arts, Entertainment & Recreation | 29 (96.7%) | 1 (3.3%) |
| Accommodation & Food Services | 17 (9.1%) | 170 (90.9%) |
| Public Administration | 2 (7.4%) | 25 (92.6%) |
| Total | 375 (34.4%) | 715 (65.6%) |
Education in Calabash
School Enrollment in Calabash
The most common levels of schooling among the 336 students in Calabash are elementary school (101 | 30.1%), middle school (75 | 22.3%), and high school (72 | 21.4%).
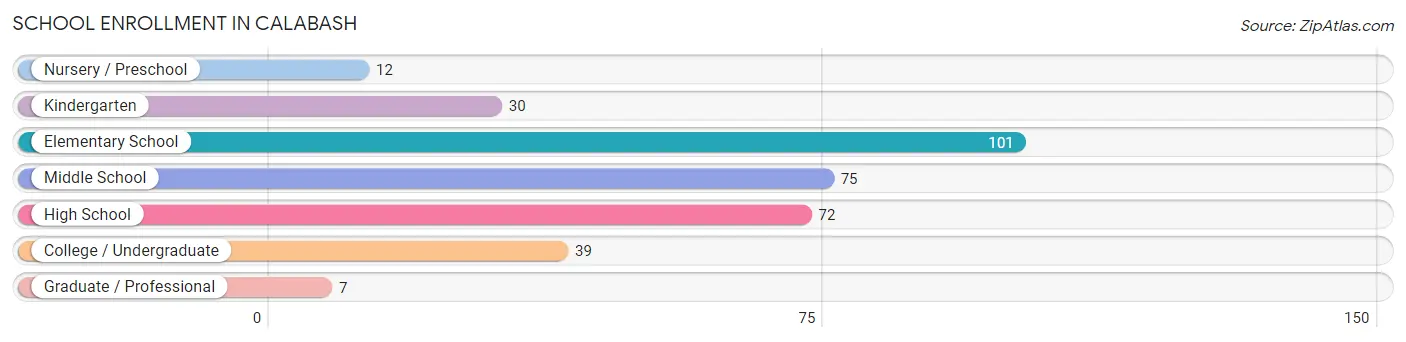
| School Level | # Students | % Students |
| Nursery / Preschool | 12 | 3.6% |
| Kindergarten | 30 | 8.9% |
| Elementary School | 101 | 30.1% |
| Middle School | 75 | 22.3% |
| High School | 72 | 21.4% |
| College / Undergraduate | 39 | 11.6% |
| Graduate / Professional | 7 | 2.1% |
| Total | 336 | 100.0% |
School Enrollment by Age by Funding Source in Calabash
Out of a total of 336 students who are enrolled in schools in Calabash, 11 (3.3%) attend a private institution, while the remaining 325 (96.7%) are enrolled in public schools. The age group of 35 years and over has the highest likelihood of being enrolled in private schools, with 9 (40.9% in the age bracket) enrolled. Conversely, the age group of 3 to 4 year olds has the lowest likelihood of being enrolled in a private school, with 6 (100.0% in the age bracket) attending a public institution.
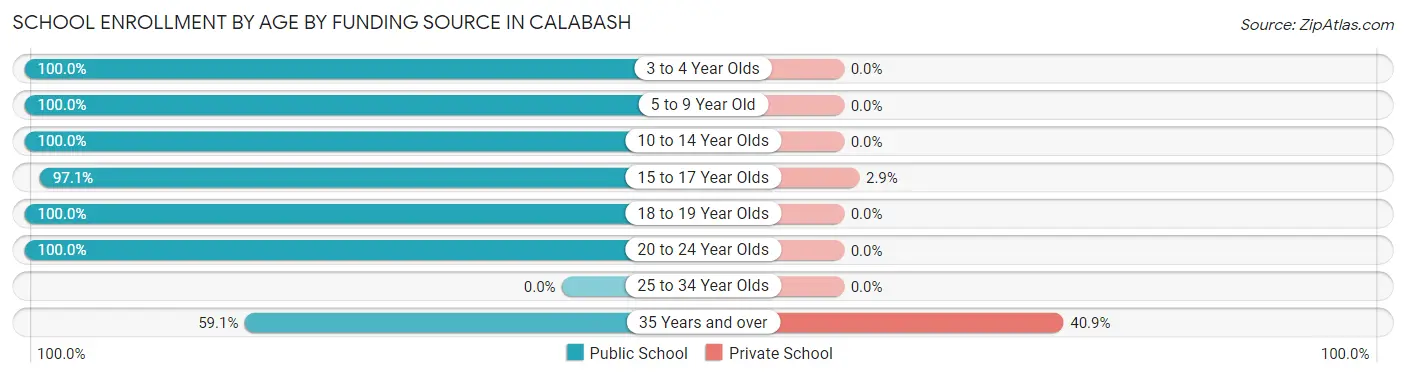
| Age Bracket | Public School | Private School |
| 3 to 4 Year Olds | 6 (100.0%) | 0 (0.0%) |
| 5 to 9 Year Old | 122 (100.0%) | 0 (0.0%) |
| 10 to 14 Year Olds | 90 (100.0%) | 0 (0.0%) |
| 15 to 17 Year Olds | 68 (97.1%) | 2 (2.9%) |
| 18 to 19 Year Olds | 9 (100.0%) | 0 (0.0%) |
| 20 to 24 Year Olds | 17 (100.0%) | 0 (0.0%) |
| 25 to 34 Year Olds | 0 (0.0%) | 0 (0.0%) |
| 35 Years and over | 13 (59.1%) | 9 (40.9%) |
| Total | 325 (96.7%) | 11 (3.3%) |
Educational Attainment by Field of Study in Calabash
Business (99 | 27.8%), engineering (41 | 11.5%), social sciences (40 | 11.2%), education (40 | 11.2%), and arts & humanities (36 | 10.1%) are the most common fields of study among 356 individuals in Calabash who have obtained a bachelor's degree or higher.
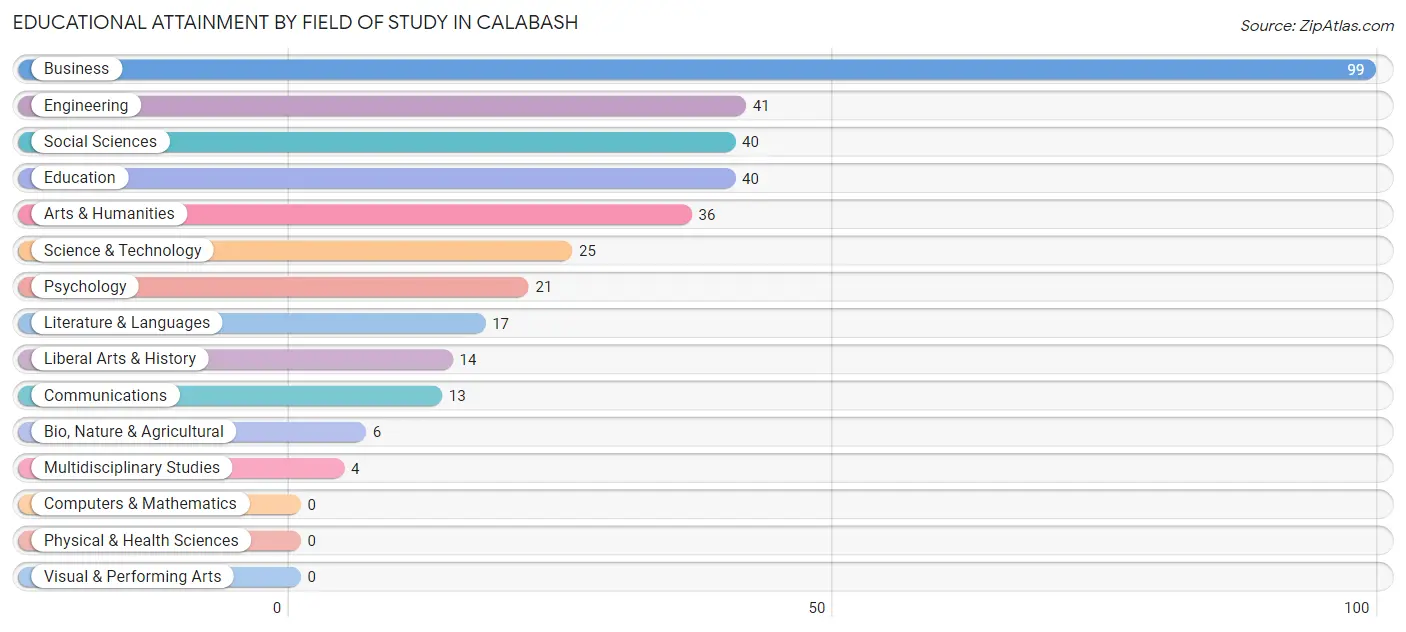
| Field of Study | # Graduates | % Graduates |
| Computers & Mathematics | 0 | 0.0% |
| Bio, Nature & Agricultural | 6 | 1.7% |
| Physical & Health Sciences | 0 | 0.0% |
| Psychology | 21 | 5.9% |
| Social Sciences | 40 | 11.2% |
| Engineering | 41 | 11.5% |
| Multidisciplinary Studies | 4 | 1.1% |
| Science & Technology | 25 | 7.0% |
| Business | 99 | 27.8% |
| Education | 40 | 11.2% |
| Literature & Languages | 17 | 4.8% |
| Liberal Arts & History | 14 | 3.9% |
| Visual & Performing Arts | 0 | 0.0% |
| Communications | 13 | 3.6% |
| Arts & Humanities | 36 | 10.1% |
| Total | 356 | 100.0% |
Transportation & Commute in Calabash
Vehicle Availability by Sex in Calabash
The most prevalent vehicle ownership categories in Calabash are males with 2 vehicles (151, accounting for 40.3%) and females with 2 vehicles (345, making up 22.3%).
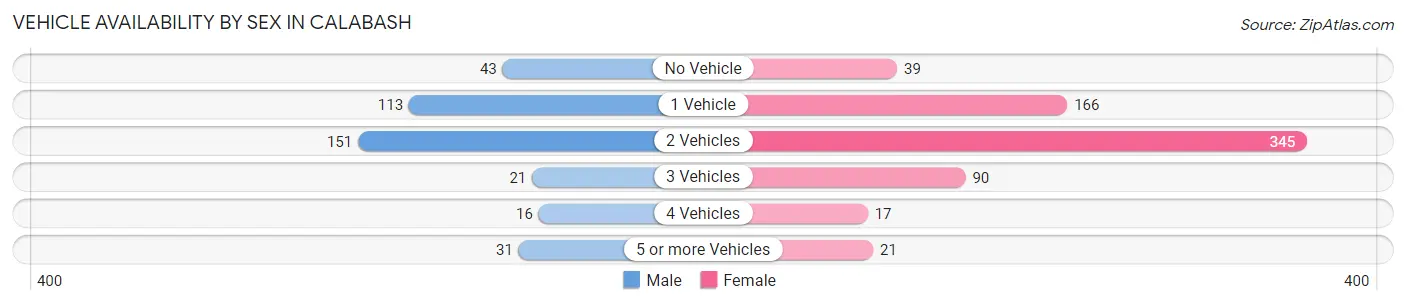
| Vehicles Available | Male | Female |
| No Vehicle | 43 (11.5%) | 39 (5.8%) |
| 1 Vehicle | 113 (30.1%) | 166 (24.5%) |
| 2 Vehicles | 151 (40.3%) | 345 (50.9%) |
| 3 Vehicles | 21 (5.6%) | 90 (13.3%) |
| 4 Vehicles | 16 (4.3%) | 17 (2.5%) |
| 5 or more Vehicles | 31 (8.3%) | 21 (3.1%) |
| Total | 375 (100.0%) | 678 (100.0%) |
Commute Time in Calabash
The most frequently occuring commute durations in Calabash are 15 to 19 minutes (227 commuters, 23.3%), less than 5 minutes (175 commuters, 17.9%), and 10 to 14 minutes (129 commuters, 13.2%).
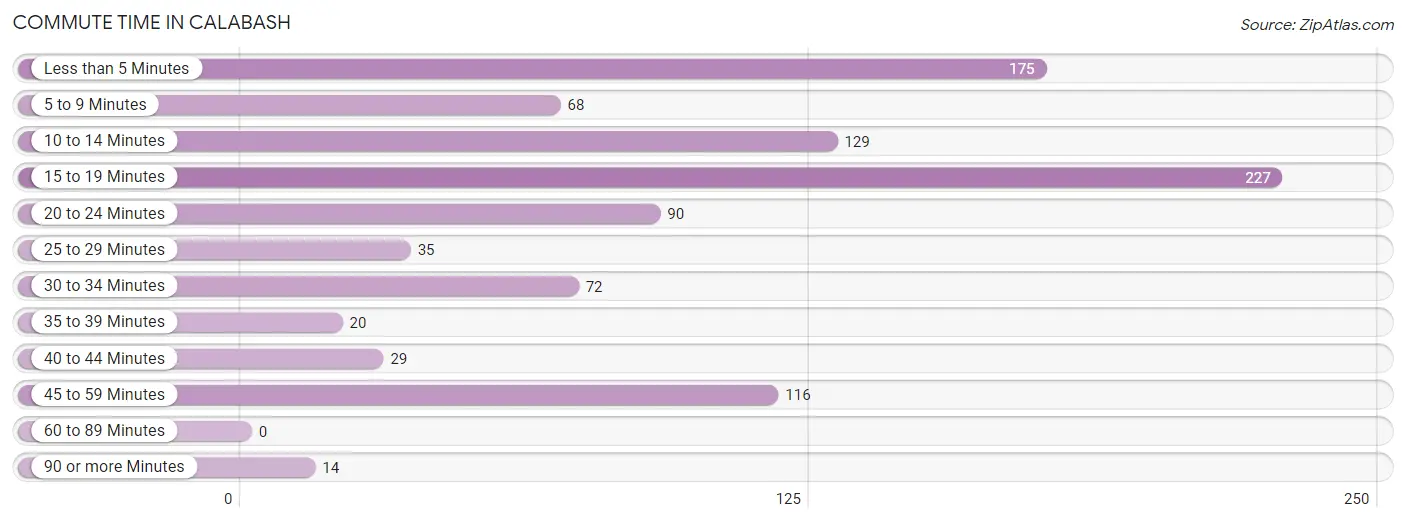
| Commute Time | # Commuters | % Commuters |
| Less than 5 Minutes | 175 | 17.9% |
| 5 to 9 Minutes | 68 | 7.0% |
| 10 to 14 Minutes | 129 | 13.2% |
| 15 to 19 Minutes | 227 | 23.3% |
| 20 to 24 Minutes | 90 | 9.2% |
| 25 to 29 Minutes | 35 | 3.6% |
| 30 to 34 Minutes | 72 | 7.4% |
| 35 to 39 Minutes | 20 | 2.1% |
| 40 to 44 Minutes | 29 | 3.0% |
| 45 to 59 Minutes | 116 | 11.9% |
| 60 to 89 Minutes | 0 | 0.0% |
| 90 or more Minutes | 14 | 1.4% |
Commute Time by Sex in Calabash
The most common commute times in Calabash are 15 to 19 minutes (81 commuters, 23.8%) for males and less than 5 minutes (175 commuters, 27.6%) for females.
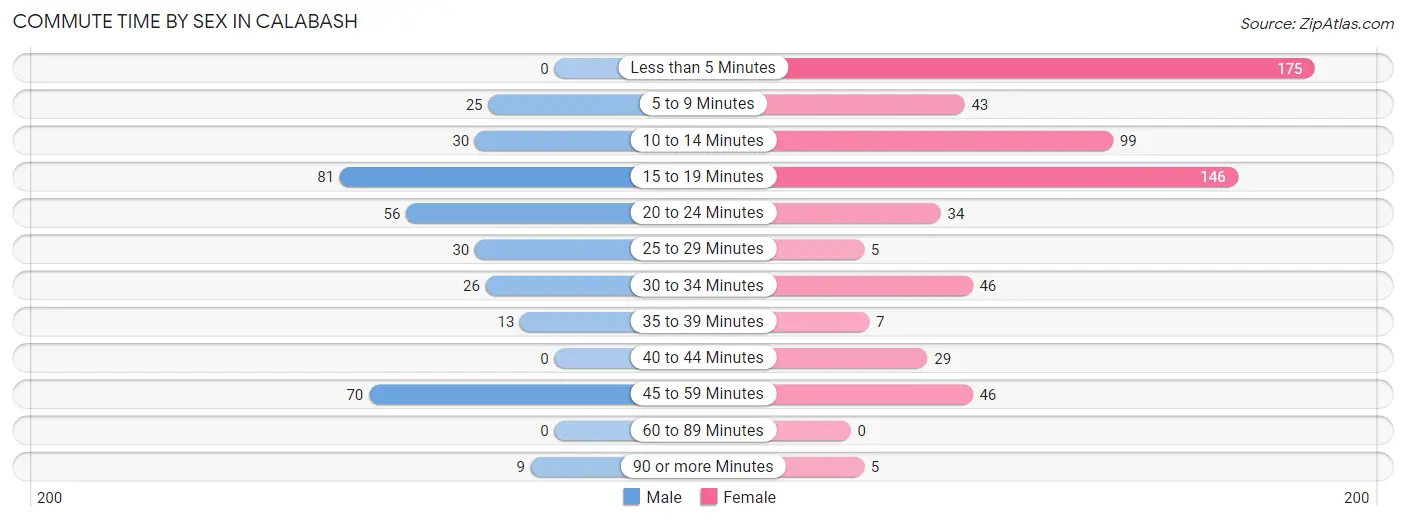
| Commute Time | Male | Female |
| Less than 5 Minutes | 0 (0.0%) | 175 (27.6%) |
| 5 to 9 Minutes | 25 (7.3%) | 43 (6.8%) |
| 10 to 14 Minutes | 30 (8.8%) | 99 (15.6%) |
| 15 to 19 Minutes | 81 (23.8%) | 146 (23.0%) |
| 20 to 24 Minutes | 56 (16.5%) | 34 (5.3%) |
| 25 to 29 Minutes | 30 (8.8%) | 5 (0.8%) |
| 30 to 34 Minutes | 26 (7.6%) | 46 (7.2%) |
| 35 to 39 Minutes | 13 (3.8%) | 7 (1.1%) |
| 40 to 44 Minutes | 0 (0.0%) | 29 (4.6%) |
| 45 to 59 Minutes | 70 (20.6%) | 46 (7.2%) |
| 60 to 89 Minutes | 0 (0.0%) | 0 (0.0%) |
| 90 or more Minutes | 9 (2.6%) | 5 (0.8%) |
Time of Departure to Work by Sex in Calabash
The most frequent times of departure to work in Calabash are 7:00 AM to 7:29 AM (67, 19.7%) for males and 12:00 AM to 4:59 AM (180, 28.3%) for females.
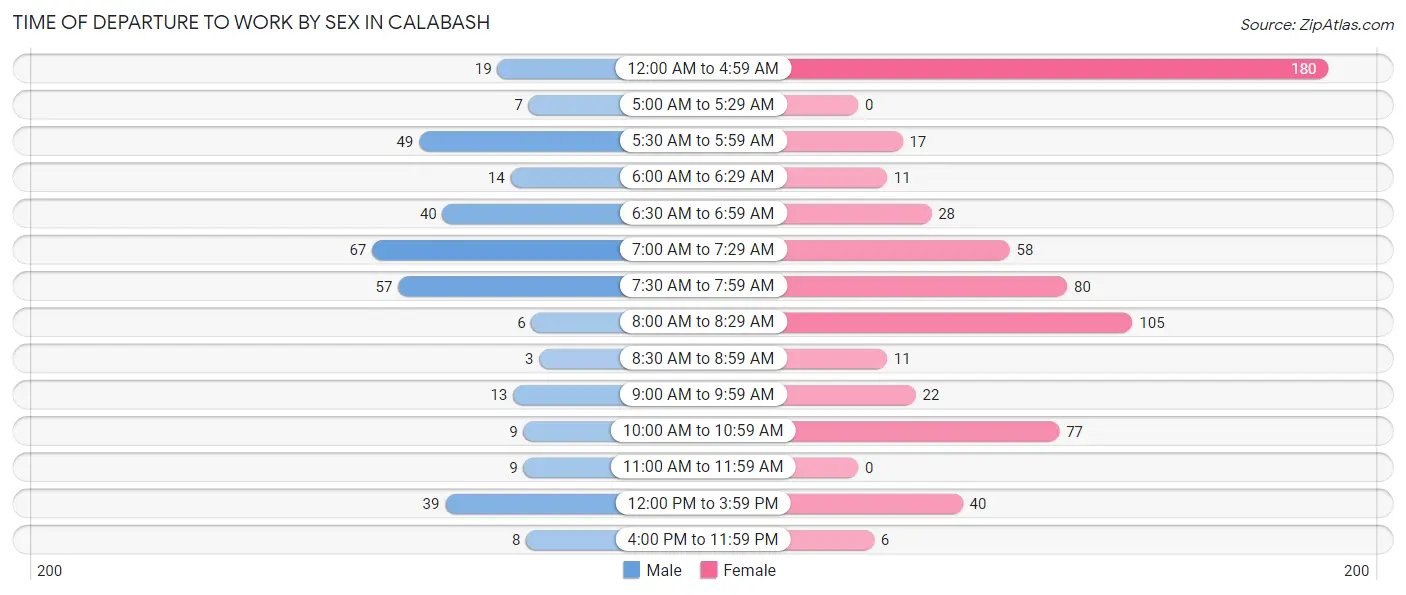
| Time of Departure | Male | Female |
| 12:00 AM to 4:59 AM | 19 (5.6%) | 180 (28.3%) |
| 5:00 AM to 5:29 AM | 7 (2.1%) | 0 (0.0%) |
| 5:30 AM to 5:59 AM | 49 (14.4%) | 17 (2.7%) |
| 6:00 AM to 6:29 AM | 14 (4.1%) | 11 (1.7%) |
| 6:30 AM to 6:59 AM | 40 (11.8%) | 28 (4.4%) |
| 7:00 AM to 7:29 AM | 67 (19.7%) | 58 (9.1%) |
| 7:30 AM to 7:59 AM | 57 (16.8%) | 80 (12.6%) |
| 8:00 AM to 8:29 AM | 6 (1.8%) | 105 (16.5%) |
| 8:30 AM to 8:59 AM | 3 (0.9%) | 11 (1.7%) |
| 9:00 AM to 9:59 AM | 13 (3.8%) | 22 (3.5%) |
| 10:00 AM to 10:59 AM | 9 (2.6%) | 77 (12.1%) |
| 11:00 AM to 11:59 AM | 9 (2.6%) | 0 (0.0%) |
| 12:00 PM to 3:59 PM | 39 (11.5%) | 40 (6.3%) |
| 4:00 PM to 11:59 PM | 8 (2.4%) | 6 (0.9%) |
| Total | 340 (100.0%) | 635 (100.0%) |
Housing Occupancy in Calabash
Occupancy by Ownership in Calabash
Of the total 1,140 dwellings in Calabash, owner-occupied units account for 727 (63.8%), while renter-occupied units make up 413 (36.2%).
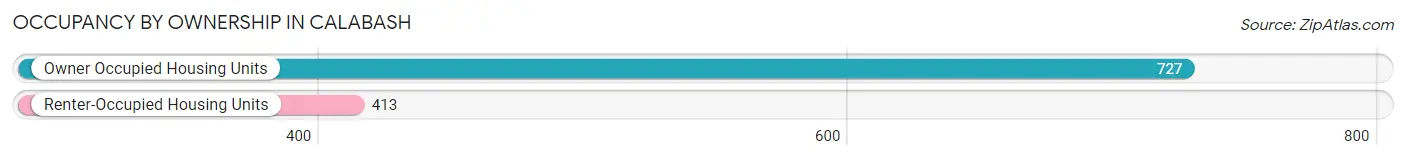
| Occupancy | # Housing Units | % Housing Units |
| Owner Occupied Housing Units | 727 | 63.8% |
| Renter-Occupied Housing Units | 413 | 36.2% |
| Total Occupied Housing Units | 1,140 | 100.0% |
Occupancy by Household Size in Calabash
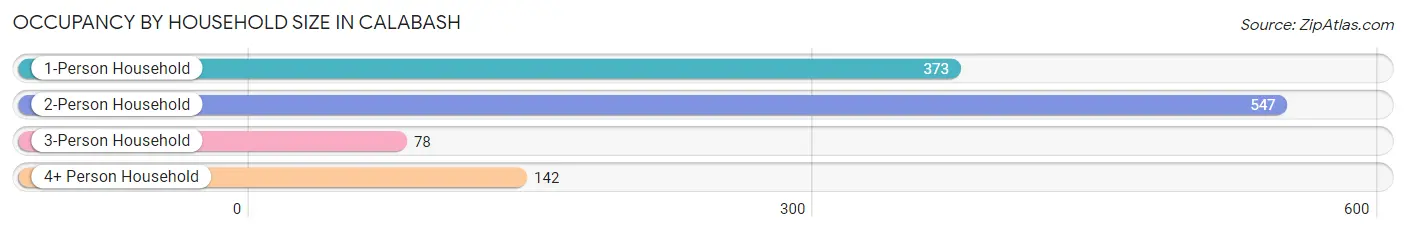
| Household Size | # Housing Units | % Housing Units |
| 1-Person Household | 373 | 32.7% |
| 2-Person Household | 547 | 48.0% |
| 3-Person Household | 78 | 6.8% |
| 4+ Person Household | 142 | 12.5% |
| Total Housing Units | 1,140 | 100.0% |
Occupancy by Ownership by Household Size in Calabash

| Household Size | Owner-occupied | Renter-occupied |
| 1-Person Household | 188 (50.4%) | 185 (49.6%) |
| 2-Person Household | 387 (70.8%) | 160 (29.2%) |
| 3-Person Household | 32 (41.0%) | 46 (59.0%) |
| 4+ Person Household | 120 (84.5%) | 22 (15.5%) |
| Total Housing Units | 727 (63.8%) | 413 (36.2%) |
Occupancy by Educational Attainment in Calabash
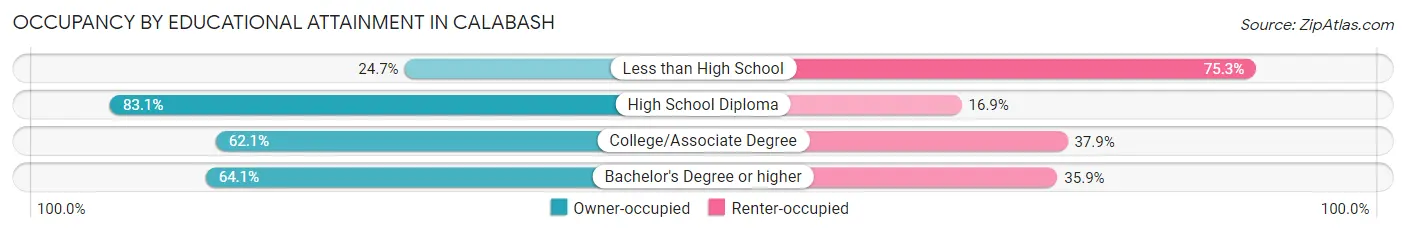
| Household Size | Owner-occupied | Renter-occupied |
| Less than High School | 41 (24.7%) | 125 (75.3%) |
| High School Diploma | 304 (83.1%) | 62 (16.9%) |
| College/Associate Degree | 234 (62.1%) | 143 (37.9%) |
| Bachelor's Degree or higher | 148 (64.1%) | 83 (35.9%) |
Occupancy by Age of Householder in Calabash
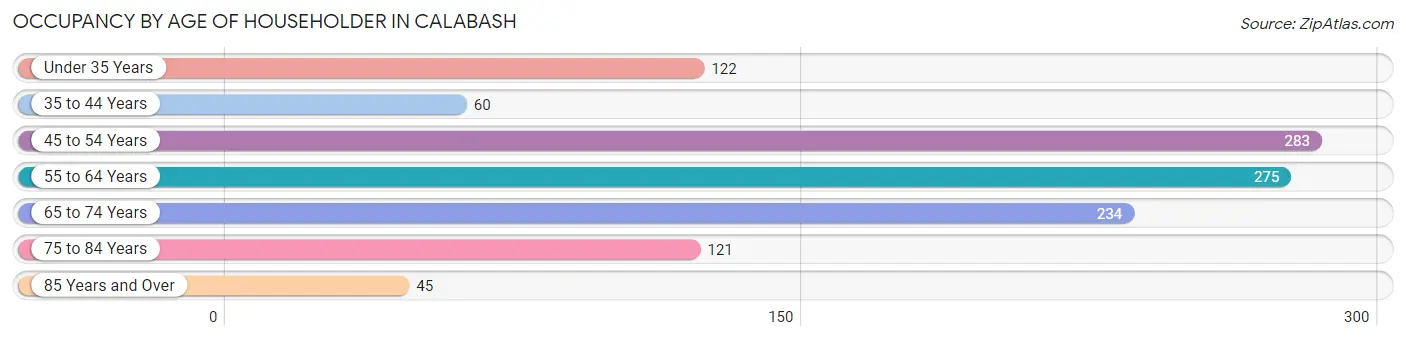
| Age Bracket | # Households | % Households |
| Under 35 Years | 122 | 10.7% |
| 35 to 44 Years | 60 | 5.3% |
| 45 to 54 Years | 283 | 24.8% |
| 55 to 64 Years | 275 | 24.1% |
| 65 to 74 Years | 234 | 20.5% |
| 75 to 84 Years | 121 | 10.6% |
| 85 Years and Over | 45 | 4.0% |
| Total | 1,140 | 100.0% |
Housing Finances in Calabash
Median Income by Occupancy in Calabash
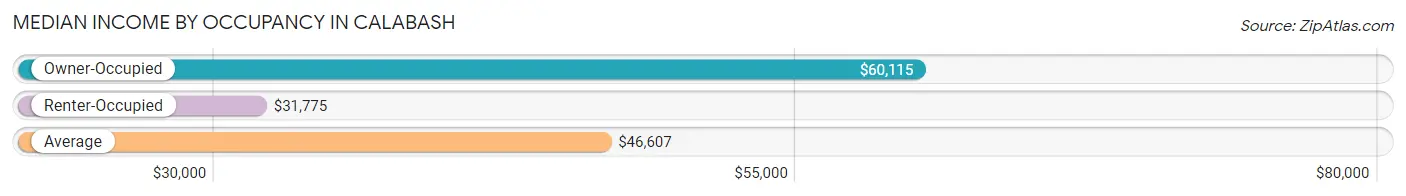
| Occupancy Type | # Households | Median Income |
| Owner-Occupied | 727 (63.8%) | $60,115 |
| Renter-Occupied | 413 (36.2%) | $31,775 |
| Average | 1,140 (100.0%) | $46,607 |
Occupancy by Householder Income Bracket in Calabash
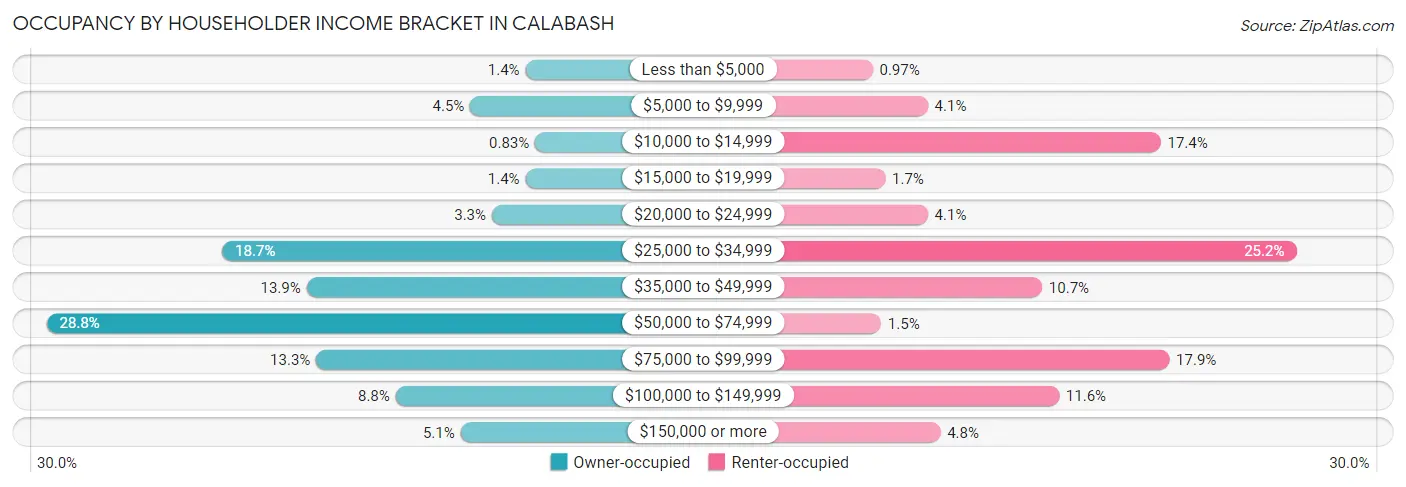
| Income Bracket | Owner-occupied | Renter-occupied |
| Less than $5,000 | 10 (1.4%) | 4 (1.0%) |
| $5,000 to $9,999 | 33 (4.5%) | 17 (4.1%) |
| $10,000 to $14,999 | 6 (0.8%) | 72 (17.4%) |
| $15,000 to $19,999 | 10 (1.4%) | 7 (1.7%) |
| $20,000 to $24,999 | 24 (3.3%) | 17 (4.1%) |
| $25,000 to $34,999 | 136 (18.7%) | 104 (25.2%) |
| $35,000 to $49,999 | 101 (13.9%) | 44 (10.6%) |
| $50,000 to $74,999 | 209 (28.7%) | 6 (1.5%) |
| $75,000 to $99,999 | 97 (13.3%) | 74 (17.9%) |
| $100,000 to $149,999 | 64 (8.8%) | 48 (11.6%) |
| $150,000 or more | 37 (5.1%) | 20 (4.8%) |
| Total | 727 (100.0%) | 413 (100.0%) |
Monthly Housing Cost Tiers in Calabash
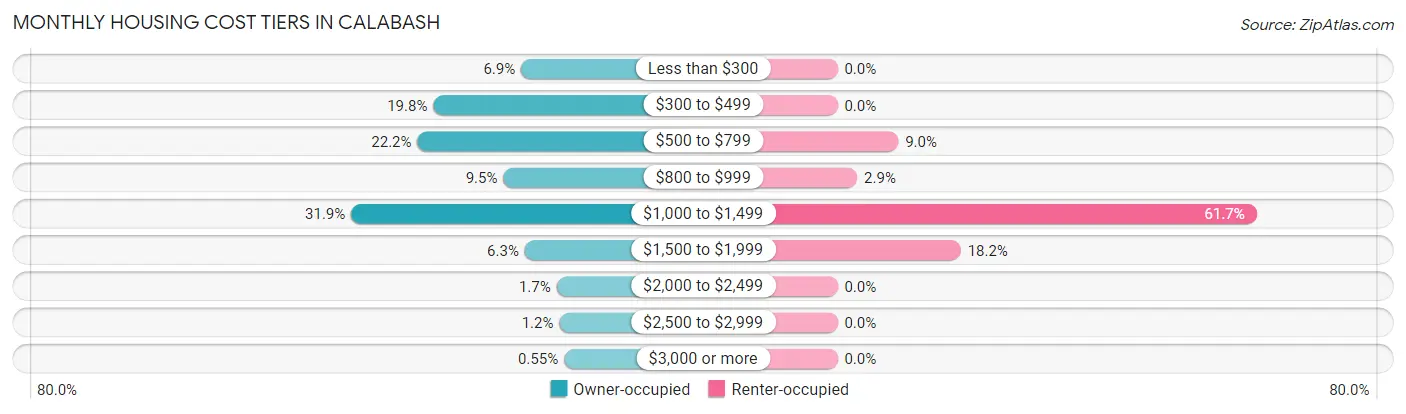
| Monthly Cost | Owner-occupied | Renter-occupied |
| Less than $300 | 50 (6.9%) | 0 (0.0%) |
| $300 to $499 | 144 (19.8%) | 0 (0.0%) |
| $500 to $799 | 161 (22.2%) | 37 (9.0%) |
| $800 to $999 | 69 (9.5%) | 12 (2.9%) |
| $1,000 to $1,499 | 232 (31.9%) | 255 (61.7%) |
| $1,500 to $1,999 | 46 (6.3%) | 75 (18.2%) |
| $2,000 to $2,499 | 12 (1.7%) | 0 (0.0%) |
| $2,500 to $2,999 | 9 (1.2%) | 0 (0.0%) |
| $3,000 or more | 4 (0.5%) | 0 (0.0%) |
| Total | 727 (100.0%) | 413 (100.0%) |
Physical Housing Characteristics in Calabash
Housing Structures in Calabash
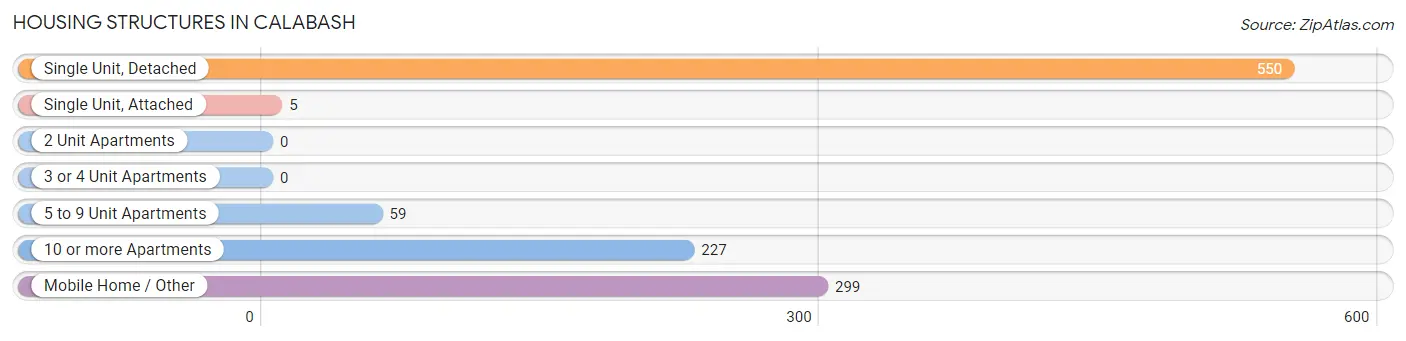
| Structure Type | # Housing Units | % Housing Units |
| Single Unit, Detached | 550 | 48.2% |
| Single Unit, Attached | 5 | 0.4% |
| 2 Unit Apartments | 0 | 0.0% |
| 3 or 4 Unit Apartments | 0 | 0.0% |
| 5 to 9 Unit Apartments | 59 | 5.2% |
| 10 or more Apartments | 227 | 19.9% |
| Mobile Home / Other | 299 | 26.2% |
| Total | 1,140 | 100.0% |
Housing Structures by Occupancy in Calabash
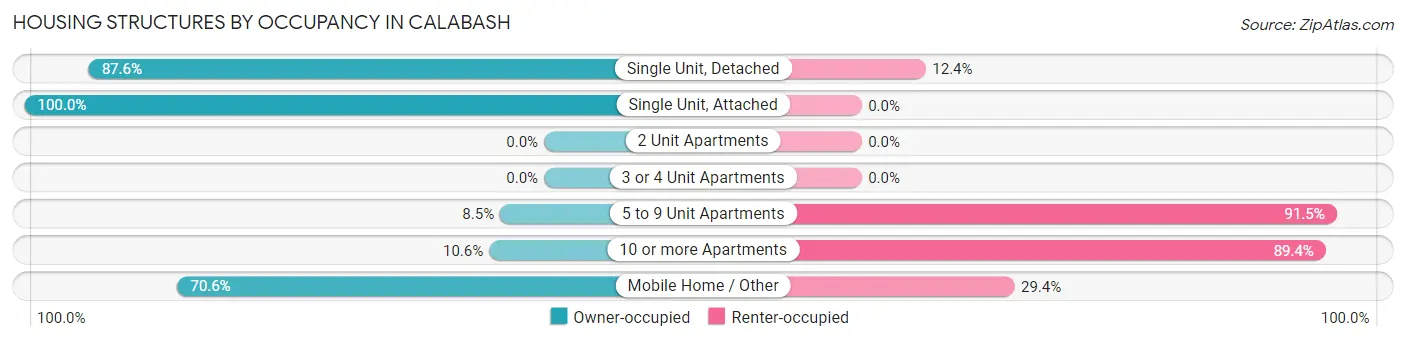
| Structure Type | Owner-occupied | Renter-occupied |
| Single Unit, Detached | 482 (87.6%) | 68 (12.4%) |
| Single Unit, Attached | 5 (100.0%) | 0 (0.0%) |
| 2 Unit Apartments | 0 (0.0%) | 0 (0.0%) |
| 3 or 4 Unit Apartments | 0 (0.0%) | 0 (0.0%) |
| 5 to 9 Unit Apartments | 5 (8.5%) | 54 (91.5%) |
| 10 or more Apartments | 24 (10.6%) | 203 (89.4%) |
| Mobile Home / Other | 211 (70.6%) | 88 (29.4%) |
| Total | 727 (63.8%) | 413 (36.2%) |
Housing Structures by Number of Rooms in Calabash
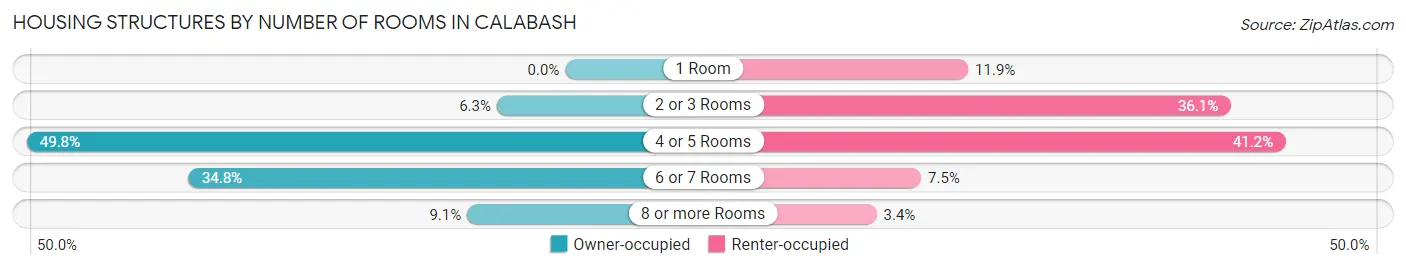
| Number of Rooms | Owner-occupied | Renter-occupied |
| 1 Room | 0 (0.0%) | 49 (11.9%) |
| 2 or 3 Rooms | 46 (6.3%) | 149 (36.1%) |
| 4 or 5 Rooms | 362 (49.8%) | 170 (41.2%) |
| 6 or 7 Rooms | 253 (34.8%) | 31 (7.5%) |
| 8 or more Rooms | 66 (9.1%) | 14 (3.4%) |
| Total | 727 (100.0%) | 413 (100.0%) |
Housing Structure by Heating Type in Calabash
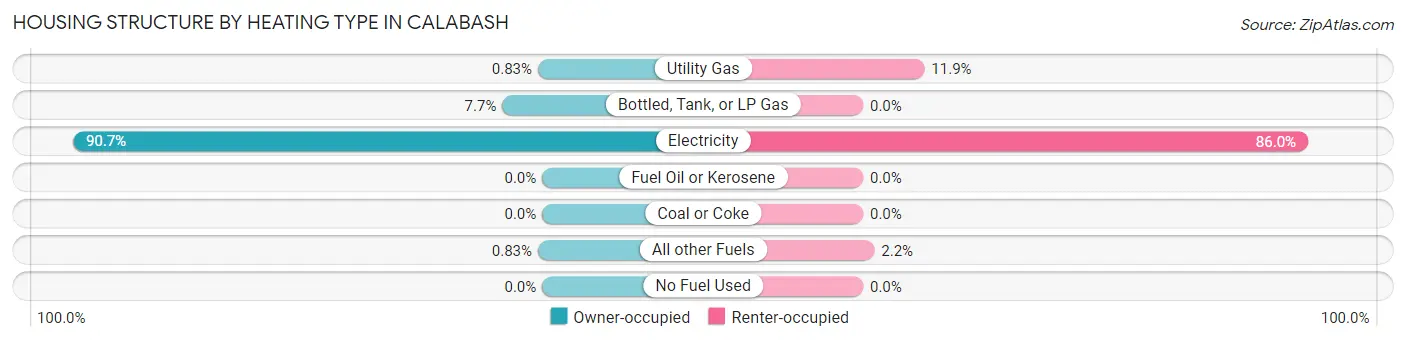
| Heating Type | Owner-occupied | Renter-occupied |
| Utility Gas | 6 (0.8%) | 49 (11.9%) |
| Bottled, Tank, or LP Gas | 56 (7.7%) | 0 (0.0%) |
| Electricity | 659 (90.6%) | 355 (86.0%) |
| Fuel Oil or Kerosene | 0 (0.0%) | 0 (0.0%) |
| Coal or Coke | 0 (0.0%) | 0 (0.0%) |
| All other Fuels | 6 (0.8%) | 9 (2.2%) |
| No Fuel Used | 0 (0.0%) | 0 (0.0%) |
| Total | 727 (100.0%) | 413 (100.0%) |
Household Vehicle Usage in Calabash
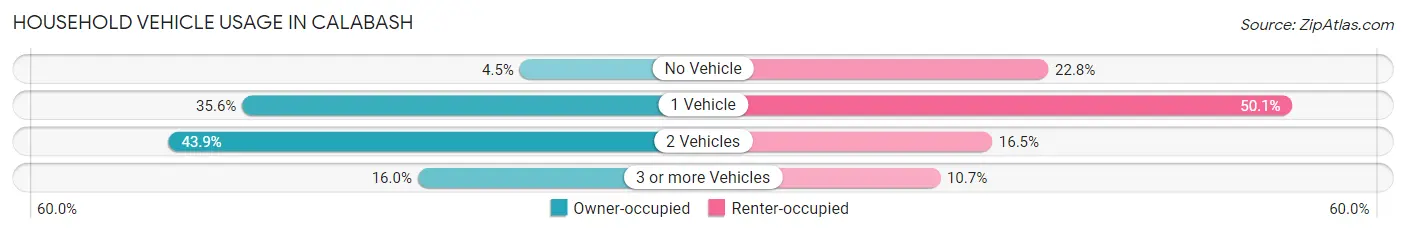
| Vehicles per Household | Owner-occupied | Renter-occupied |
| No Vehicle | 33 (4.5%) | 94 (22.8%) |
| 1 Vehicle | 259 (35.6%) | 207 (50.1%) |
| 2 Vehicles | 319 (43.9%) | 68 (16.5%) |
| 3 or more Vehicles | 116 (16.0%) | 44 (10.6%) |
| Total | 727 (100.0%) | 413 (100.0%) |
Real Estate & Mortgages in Calabash
Real Estate and Mortgage Overview in Calabash
| Characteristic | Without Mortgage | With Mortgage |
| Housing Units | 349 | 378 |
| Median Property Value | $123,900 | $190,400 |
| Median Household Income | $59,191 | $17 |
| Monthly Housing Costs | $477 | $4 |
| Real Estate Taxes | $838 | $0 |
Property Value by Mortgage Status in Calabash
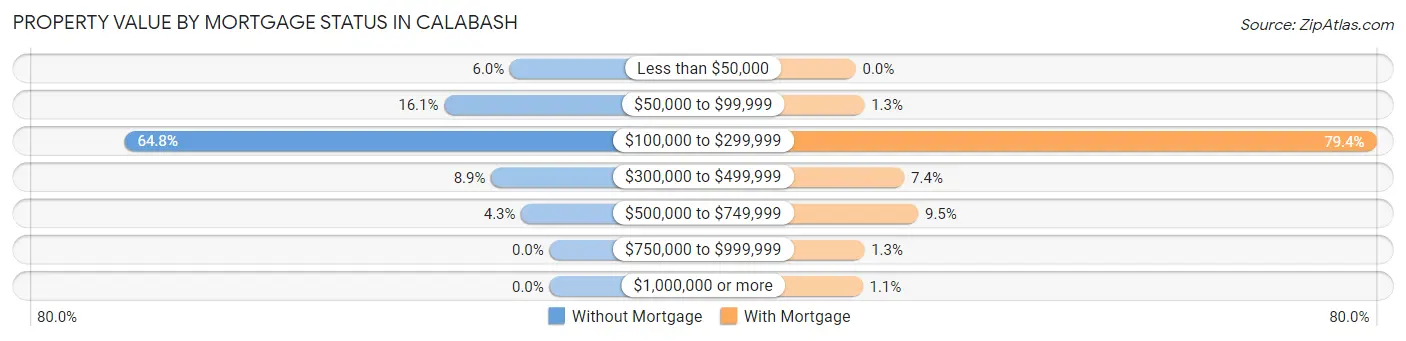
| Property Value | Without Mortgage | With Mortgage |
| Less than $50,000 | 21 (6.0%) | 0 (0.0%) |
| $50,000 to $99,999 | 56 (16.1%) | 5 (1.3%) |
| $100,000 to $299,999 | 226 (64.8%) | 300 (79.4%) |
| $300,000 to $499,999 | 31 (8.9%) | 28 (7.4%) |
| $500,000 to $749,999 | 15 (4.3%) | 36 (9.5%) |
| $750,000 to $999,999 | 0 (0.0%) | 5 (1.3%) |
| $1,000,000 or more | 0 (0.0%) | 4 (1.1%) |
| Total | 349 (100.0%) | 378 (100.0%) |
Household Income by Mortgage Status in Calabash
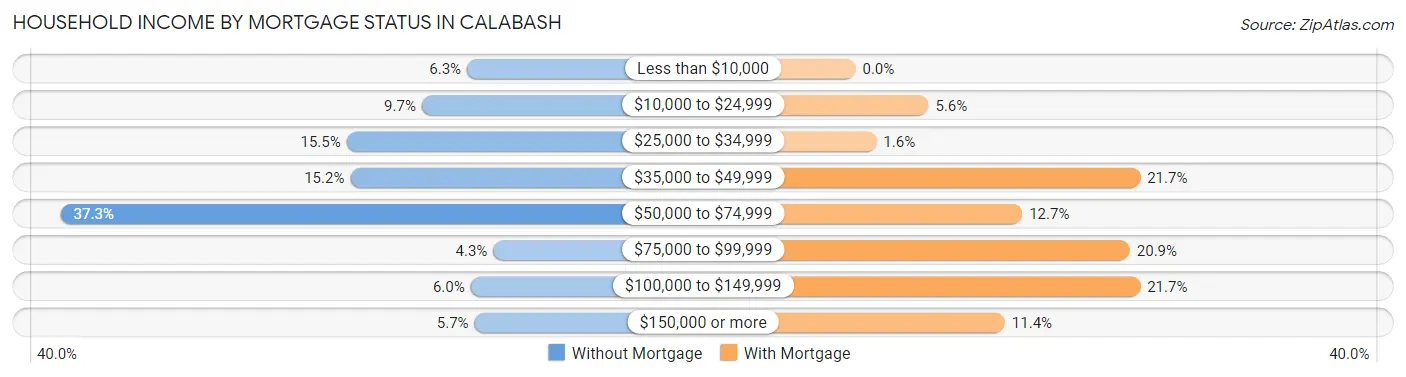
| Household Income | Without Mortgage | With Mortgage |
| Less than $10,000 | 22 (6.3%) | 0 (0.0%) |
| $10,000 to $24,999 | 34 (9.7%) | 21 (5.6%) |
| $25,000 to $34,999 | 54 (15.5%) | 6 (1.6%) |
| $35,000 to $49,999 | 53 (15.2%) | 82 (21.7%) |
| $50,000 to $74,999 | 130 (37.2%) | 48 (12.7%) |
| $75,000 to $99,999 | 15 (4.3%) | 79 (20.9%) |
| $100,000 to $149,999 | 21 (6.0%) | 82 (21.7%) |
| $150,000 or more | 20 (5.7%) | 43 (11.4%) |
| Total | 349 (100.0%) | 378 (100.0%) |
Property Value to Household Income Ratio in Calabash
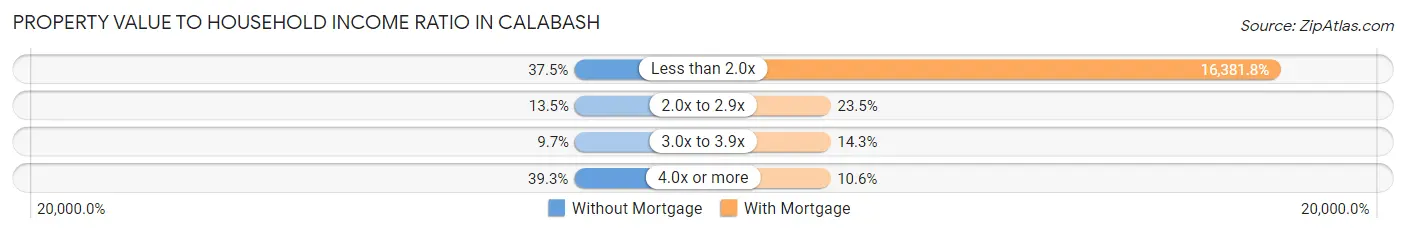
| Value-to-Income Ratio | Without Mortgage | With Mortgage |
| Less than 2.0x | 131 (37.5%) | 61,923 (16,381.7%) |
| 2.0x to 2.9x | 47 (13.5%) | 89 (23.5%) |
| 3.0x to 3.9x | 34 (9.7%) | 54 (14.3%) |
| 4.0x or more | 137 (39.3%) | 40 (10.6%) |
| Total | 349 (100.0%) | 378 (100.0%) |
Real Estate Taxes by Mortgage Status in Calabash
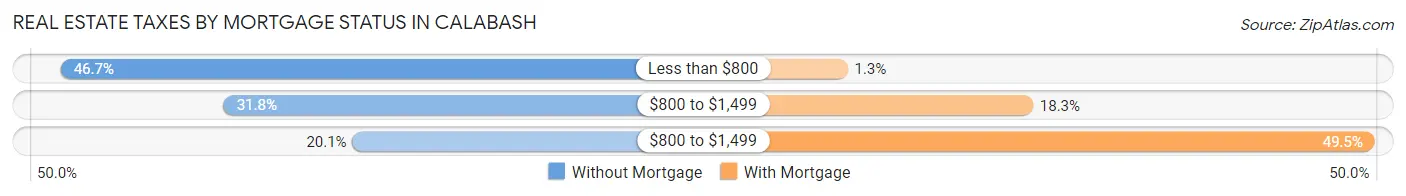
| Property Taxes | Without Mortgage | With Mortgage |
| Less than $800 | 163 (46.7%) | 5 (1.3%) |
| $800 to $1,499 | 111 (31.8%) | 69 (18.2%) |
| $800 to $1,499 | 70 (20.1%) | 187 (49.5%) |
| Total | 349 (100.0%) | 378 (100.0%) |
Health & Disability in Calabash
Health Insurance Coverage by Age in Calabash
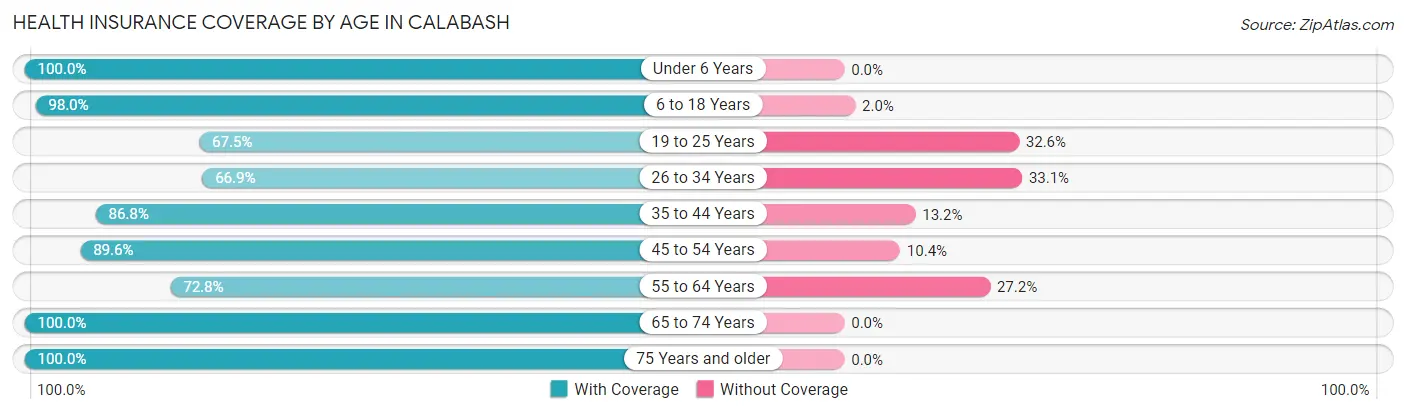
| Age Bracket | With Coverage | Without Coverage |
| Under 6 Years | 140 (100.0%) | 0 (0.0%) |
| 6 to 18 Years | 341 (98.0%) | 7 (2.0%) |
| 19 to 25 Years | 143 (67.4%) | 69 (32.6%) |
| 26 to 34 Years | 109 (66.9%) | 54 (33.1%) |
| 35 to 44 Years | 118 (86.8%) | 18 (13.2%) |
| 45 to 54 Years | 363 (89.6%) | 42 (10.4%) |
| 55 to 64 Years | 386 (72.8%) | 144 (27.2%) |
| 65 to 74 Years | 378 (100.0%) | 0 (0.0%) |
| 75 Years and older | 258 (100.0%) | 0 (0.0%) |
| Total | 2,236 (87.0%) | 334 (13.0%) |
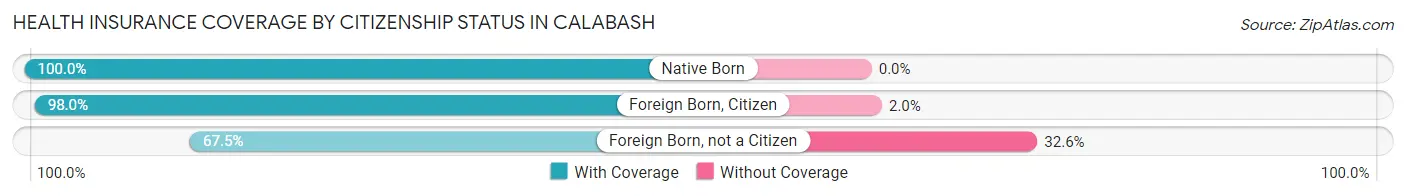
Health Insurance Coverage by Citizenship Status in Calabash
| Citizenship Status | With Coverage | Without Coverage |
| Native Born | 140 (100.0%) | 0 (0.0%) |
| Foreign Born, Citizen | 341 (98.0%) | 7 (2.0%) |
| Foreign Born, not a Citizen | 143 (67.4%) | 69 (32.6%) |
Health Insurance Coverage by Household Income in Calabash
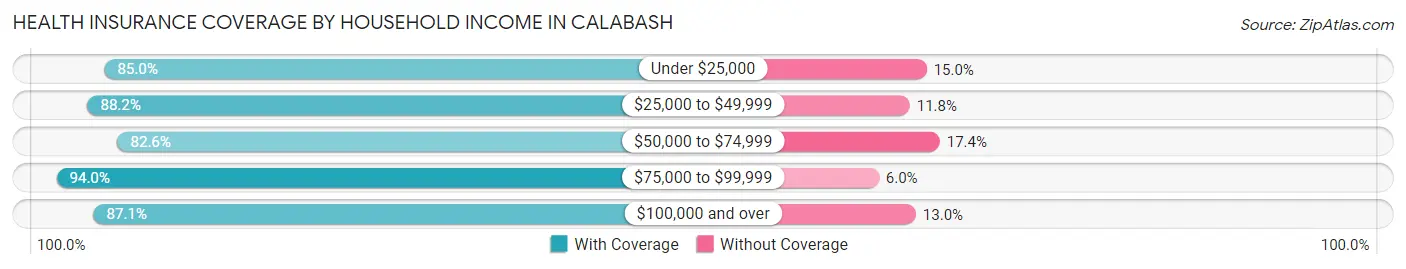
| Household Income | With Coverage | Without Coverage |
| Under $25,000 | 375 (85.0%) | 66 (15.0%) |
| $25,000 to $49,999 | 785 (88.2%) | 105 (11.8%) |
| $50,000 to $74,999 | 431 (82.6%) | 91 (17.4%) |
| $75,000 to $99,999 | 282 (94.0%) | 18 (6.0%) |
| $100,000 and over | 363 (87.1%) | 54 (13.0%) |
Public vs Private Health Insurance Coverage by Age in Calabash
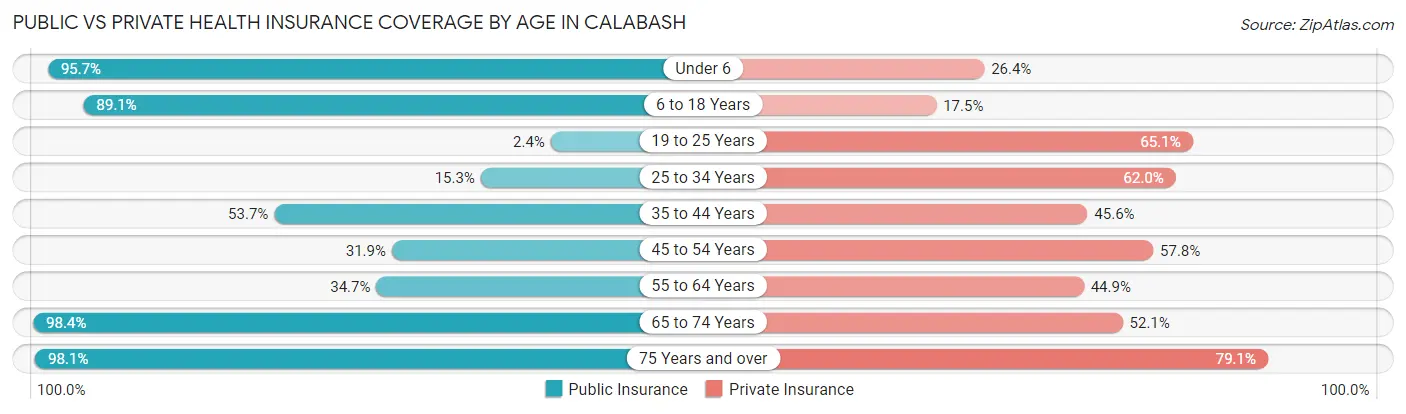
| Age Bracket | Public Insurance | Private Insurance |
| Under 6 | 134 (95.7%) | 37 (26.4%) |
| 6 to 18 Years | 310 (89.1%) | 61 (17.5%) |
| 19 to 25 Years | 5 (2.4%) | 138 (65.1%) |
| 25 to 34 Years | 25 (15.3%) | 101 (62.0%) |
| 35 to 44 Years | 73 (53.7%) | 62 (45.6%) |
| 45 to 54 Years | 129 (31.9%) | 234 (57.8%) |
| 55 to 64 Years | 184 (34.7%) | 238 (44.9%) |
| 65 to 74 Years | 372 (98.4%) | 197 (52.1%) |
| 75 Years and over | 253 (98.1%) | 204 (79.1%) |
| Total | 1,485 (57.8%) | 1,272 (49.5%) |
Disability Status by Sex by Age in Calabash
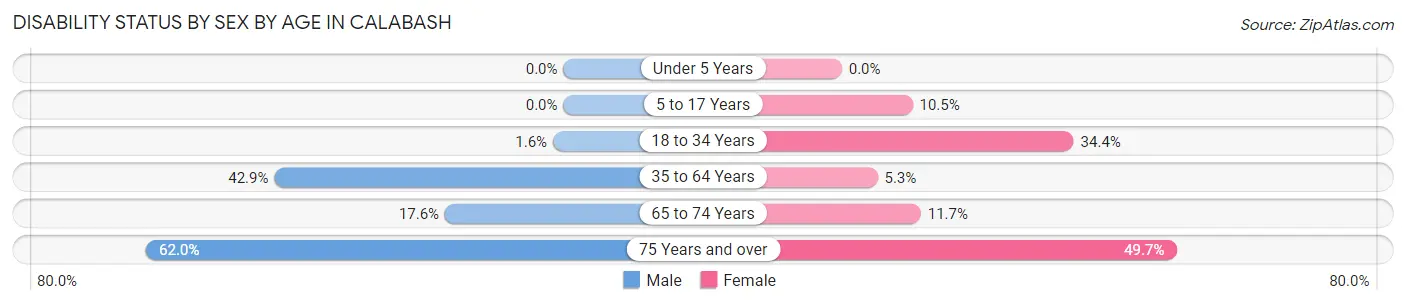
| Age Bracket | Male | Female |
| Under 5 Years | 0 (0.0%) | 0 (0.0%) |
| 5 to 17 Years | 0 (0.0%) | 19 (10.5%) |
| 18 to 34 Years | 3 (1.5%) | 84 (34.4%) |
| 35 to 64 Years | 185 (42.9%) | 34 (5.3%) |
| 65 to 74 Years | 32 (17.6%) | 23 (11.7%) |
| 75 Years and over | 70 (62.0%) | 72 (49.7%) |
Disability Class by Sex by Age in Calabash
Disability Class: Hearing Difficulty
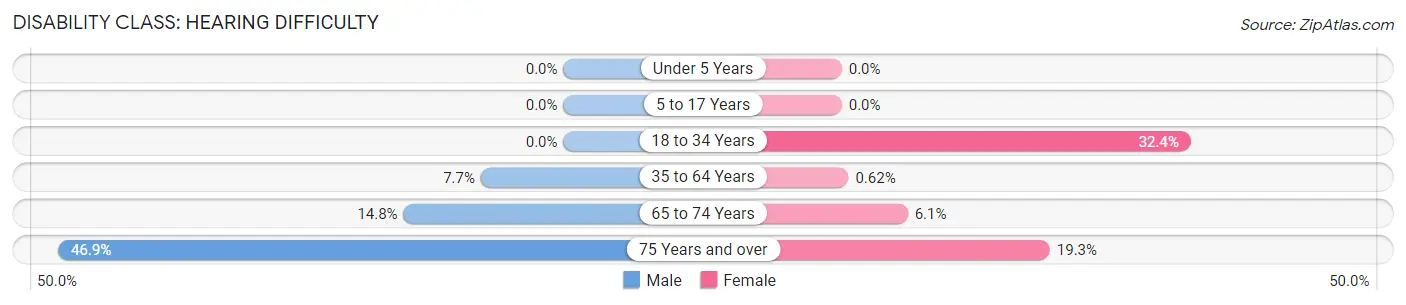
| Age Bracket | Male | Female |
| Under 5 Years | 0 (0.0%) | 0 (0.0%) |
| 5 to 17 Years | 0 (0.0%) | 0 (0.0%) |
| 18 to 34 Years | 0 (0.0%) | 79 (32.4%) |
| 35 to 64 Years | 33 (7.7%) | 4 (0.6%) |
| 65 to 74 Years | 27 (14.8%) | 12 (6.1%) |
| 75 Years and over | 53 (46.9%) | 28 (19.3%) |
Disability Class: Vision Difficulty
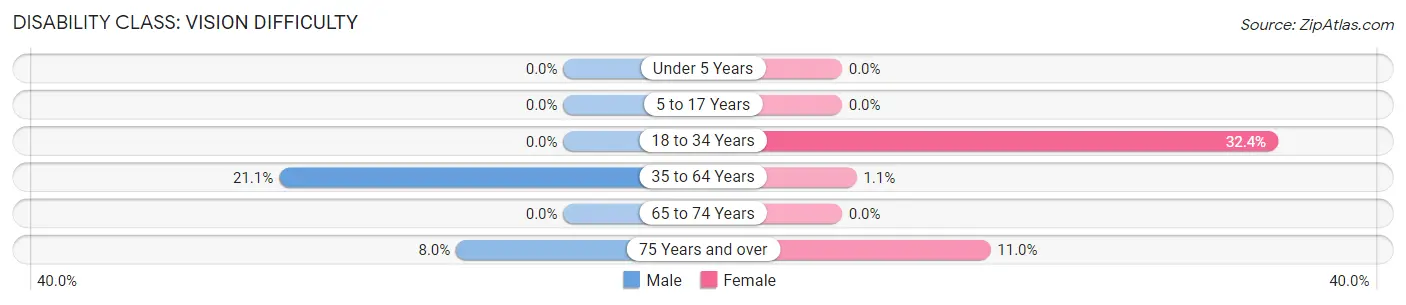
| Age Bracket | Male | Female |
| Under 5 Years | 0 (0.0%) | 0 (0.0%) |
| 5 to 17 Years | 0 (0.0%) | 0 (0.0%) |
| 18 to 34 Years | 0 (0.0%) | 79 (32.4%) |
| 35 to 64 Years | 91 (21.1%) | 7 (1.1%) |
| 65 to 74 Years | 0 (0.0%) | 0 (0.0%) |
| 75 Years and over | 9 (8.0%) | 16 (11.0%) |
Disability Class: Cognitive Difficulty
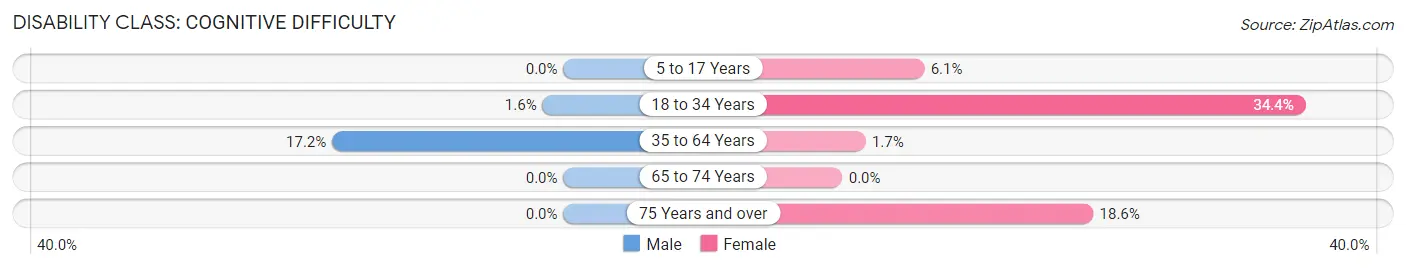
| Age Bracket | Male | Female |
| 5 to 17 Years | 0 (0.0%) | 11 (6.1%) |
| 18 to 34 Years | 3 (1.5%) | 84 (34.4%) |
| 35 to 64 Years | 74 (17.2%) | 11 (1.7%) |
| 65 to 74 Years | 0 (0.0%) | 0 (0.0%) |
| 75 Years and over | 0 (0.0%) | 27 (18.6%) |
Disability Class: Ambulatory Difficulty
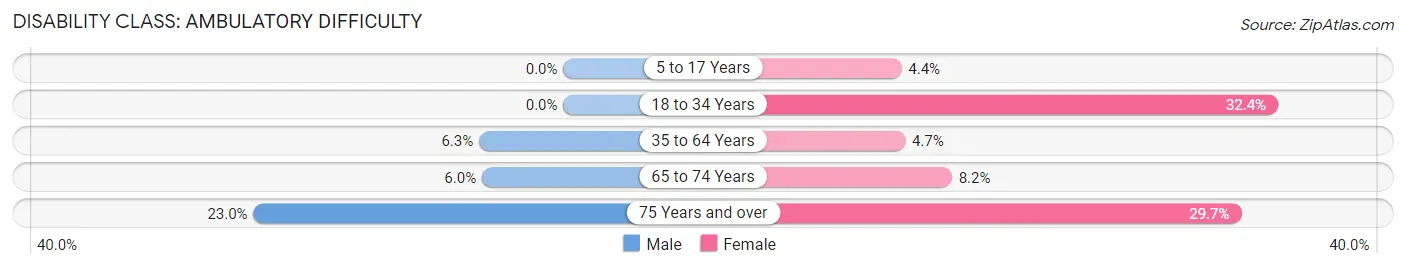
| Age Bracket | Male | Female |
| 5 to 17 Years | 0 (0.0%) | 8 (4.4%) |
| 18 to 34 Years | 0 (0.0%) | 79 (32.4%) |
| 35 to 64 Years | 27 (6.3%) | 30 (4.7%) |
| 65 to 74 Years | 11 (6.0%) | 16 (8.2%) |
| 75 Years and over | 26 (23.0%) | 43 (29.7%) |
Disability Class: Self-Care Difficulty
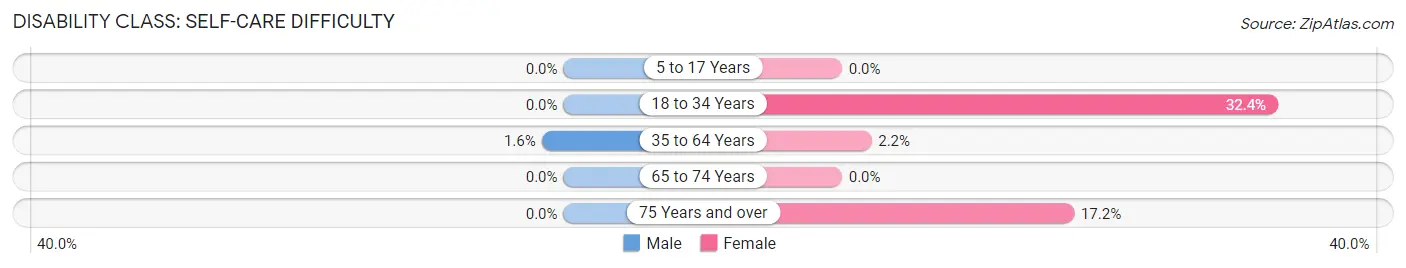
| Age Bracket | Male | Female |
| 5 to 17 Years | 0 (0.0%) | 0 (0.0%) |
| 18 to 34 Years | 0 (0.0%) | 79 (32.4%) |
| 35 to 64 Years | 7 (1.6%) | 14 (2.2%) |
| 65 to 74 Years | 0 (0.0%) | 0 (0.0%) |
| 75 Years and over | 0 (0.0%) | 25 (17.2%) |
Technology Access in Calabash
Computing Device Access in Calabash
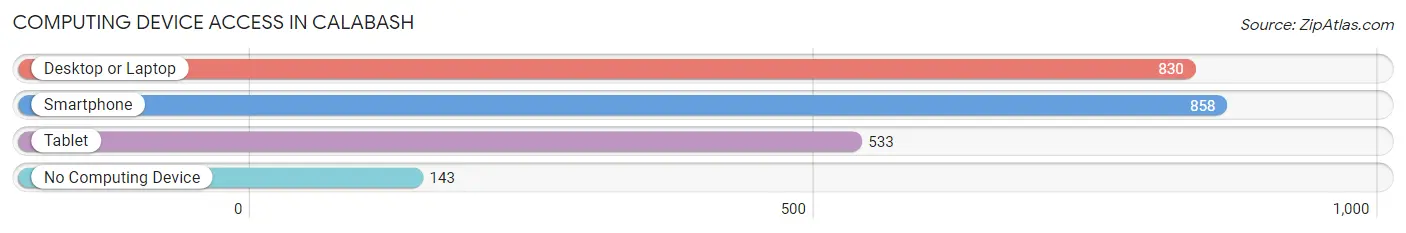
| Device Type | # Households | % Households |
| Desktop or Laptop | 830 | 72.8% |
| Smartphone | 858 | 75.3% |
| Tablet | 533 | 46.8% |
| No Computing Device | 143 | 12.5% |
| Total | 1,140 | 100.0% |
Internet Access in Calabash
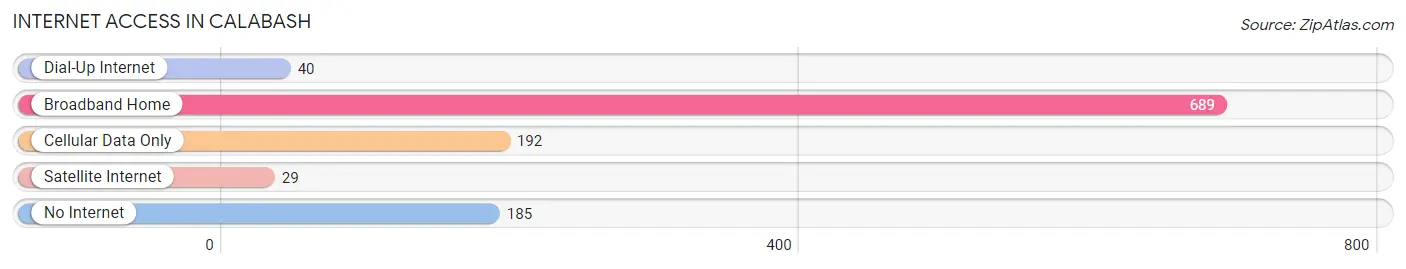
| Internet Type | # Households | % Households |
| Dial-Up Internet | 40 | 3.5% |
| Broadband Home | 689 | 60.4% |
| Cellular Data Only | 192 | 16.8% |
| Satellite Internet | 29 | 2.5% |
| No Internet | 185 | 16.2% |
| Total | 1,140 | 100.0% |
Calabash Summary
Calabash, North Carolina is a small town located in Brunswick County, North Carolina. It is situated on the Atlantic coast, just south of the North Carolina-South Carolina border. The town is known for its seafood restaurants, which serve up some of the freshest seafood in the area.
Geography
Calabash is located in the southeastern corner of Brunswick County, North Carolina. It is situated on the Atlantic coast, just south of the North Carolina-South Carolina border. The town is bordered by the towns of Sunset Beach, Ocean Isle Beach, and Shallotte. The town is located on the Intracoastal Waterway, which provides access to the Atlantic Ocean. The town is also located near the Waccamaw River, which provides access to the Intracoastal Waterway.
The town is located in a humid subtropical climate zone, with hot, humid summers and mild winters. The average annual temperature is around 70 degrees Fahrenheit. The average annual precipitation is around 50 inches.
Economy
Calabash is a small town with a population of just over 2,000 people. The town is known for its seafood restaurants, which serve up some of the freshest seafood in the area. The town is also home to a number of small businesses, including a grocery store, a hardware store, and a few other small shops.
The town is also home to a number of tourist attractions, including the Calabash Fishing Fleet, which offers fishing charters and sightseeing tours. The town is also home to the Calabash Waterfront Park, which offers a variety of recreational activities, including fishing, swimming, and kayaking.
Demographics
As of the 2010 census, the population of Calabash was 2,053. The racial makeup of the town was 94.3% White, 2.2% African American, 0.3% Native American, 0.7% Asian, 0.1% Pacific Islander, 0.7% from other races, and 1.9% from two or more races. Hispanic or Latino of any race were 2.2% of the population.
The median income for a household in the town was $37,500, and the median income for a family was $45,000. The per capita income for the town was $20,845. About 11.2% of families and 14.2% of the population were below the poverty line, including 18.2% of those under age 18 and 8.3% of those age 65 or over.
Conclusion
Calabash, North Carolina is a small town located in Brunswick County, North Carolina. It is situated on the Atlantic coast, just south of the North Carolina-South Carolina border. The town is known for its seafood restaurants, which serve up some of the freshest seafood in the area. The town is also home to a number of small businesses, tourist attractions, and recreational activities. As of the 2010 census, the population of Calabash was 2,053. The median income for a household in the town was $37,500, and the median income for a family was $45,000. The town is a great place to live and visit, with its beautiful scenery, friendly people, and delicious seafood.
Common Questions
What is Per Capita Income in Calabash?
Per Capita income in Calabash is $27,818.
What is the Median Family Income in Calabash?
Median Family Income in Calabash is $61,087.
What is the Median Household income in Calabash?
Median Household Income in Calabash is $46,607.
What is Income or Wage Gap in Calabash?
Income or Wage Gap in Calabash is 10.5%.
Women in Calabash earn 89.5 cents for every dollar earned by a man.
What is Inequality or Gini Index in Calabash?
Inequality or Gini Index in Calabash is 0.40.
What is the Total Population of Calabash?
Total Population of Calabash is 2,570.
What is the Total Male Population of Calabash?
Total Male Population of Calabash is 1,069.
What is the Total Female Population of Calabash?
Total Female Population of Calabash is 1,501.
What is the Ratio of Males per 100 Females in Calabash?
There are 71.22 Males per 100 Females in Calabash.
What is the Ratio of Females per 100 Males in Calabash?
There are 140.41 Females per 100 Males in Calabash.
What is the Median Population Age in Calabash?
Median Population Age in Calabash is 53.9 Years.
What is the Average Family Size in Calabash
Average Family Size in Calabash is 3.0 People.
What is the Average Household Size in Calabash
Average Household Size in Calabash is 2.2 People.
How Large is the Labor Force in Calabash?
There are 1,187 People in the Labor Forcein in Calabash.
What is the Percentage of People in the Labor Force in Calabash?
54.7% of People are in the Labor Force in Calabash.
What is the Unemployment Rate in Calabash?
Unemployment Rate in Calabash is 8.1%.