Bostic, NC Map & Demographics
Bostic Map
Bostic Overview
$31,917
PER CAPITA INCOME
$68,125
AVG FAMILY INCOME
$53,438
AVG HOUSEHOLD INCOME
6.6%
WAGE / INCOME GAP [ % ]
93.4¢/ $1
WAGE / INCOME GAP [ $ ]
0.42
INEQUALITY / GINI INDEX
304
TOTAL POPULATION
142
MALE POPULATION
162
FEMALE POPULATION
87.65
MALES / 100 FEMALES
114.08
FEMALES / 100 MALES
49.9
MEDIAN AGE
2.6
AVG FAMILY SIZE
2.1
AVG HOUSEHOLD SIZE
153
LABOR FORCE [ PEOPLE ]
60.5%
PERCENT IN LABOR FORCE
7.2%
UNEMPLOYMENT RATE
Bostic Zip Codes
Bostic Area Codes
Income in Bostic
Income Overview in Bostic
Per Capita Income in Bostic is $31,917, while median incomes of families and households are $68,125 and $53,438 respectively.
| Characteristic | Number | Measure |
| Per Capita Income | 304 | $31,917 |
| Median Family Income | 95 | $68,125 |
| Mean Family Income | 95 | $77,211 |
| Median Household Income | 144 | $53,438 |
| Mean Household Income | 144 | $68,717 |
| Income Deficit | 95 | $0 |
| Wage / Income Gap (%) | 304 | 6.56% |
| Wage / Income Gap ($) | 304 | 93.44¢ per $1 |
| Gini / Inequality Index | 304 | 0.42 |
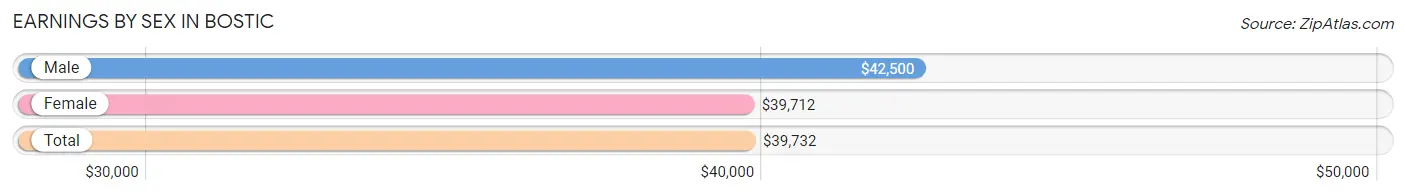
Earnings by Sex in Bostic
Average Earnings in Bostic are $39,732, $42,500 for men and $39,712 for women, a difference of 6.6%.
| Sex | Number | Average Earnings |
| Male | 68 (43.3%) | $42,500 |
| Female | 89 (56.7%) | $39,712 |
| Total | 157 (100.0%) | $39,732 |
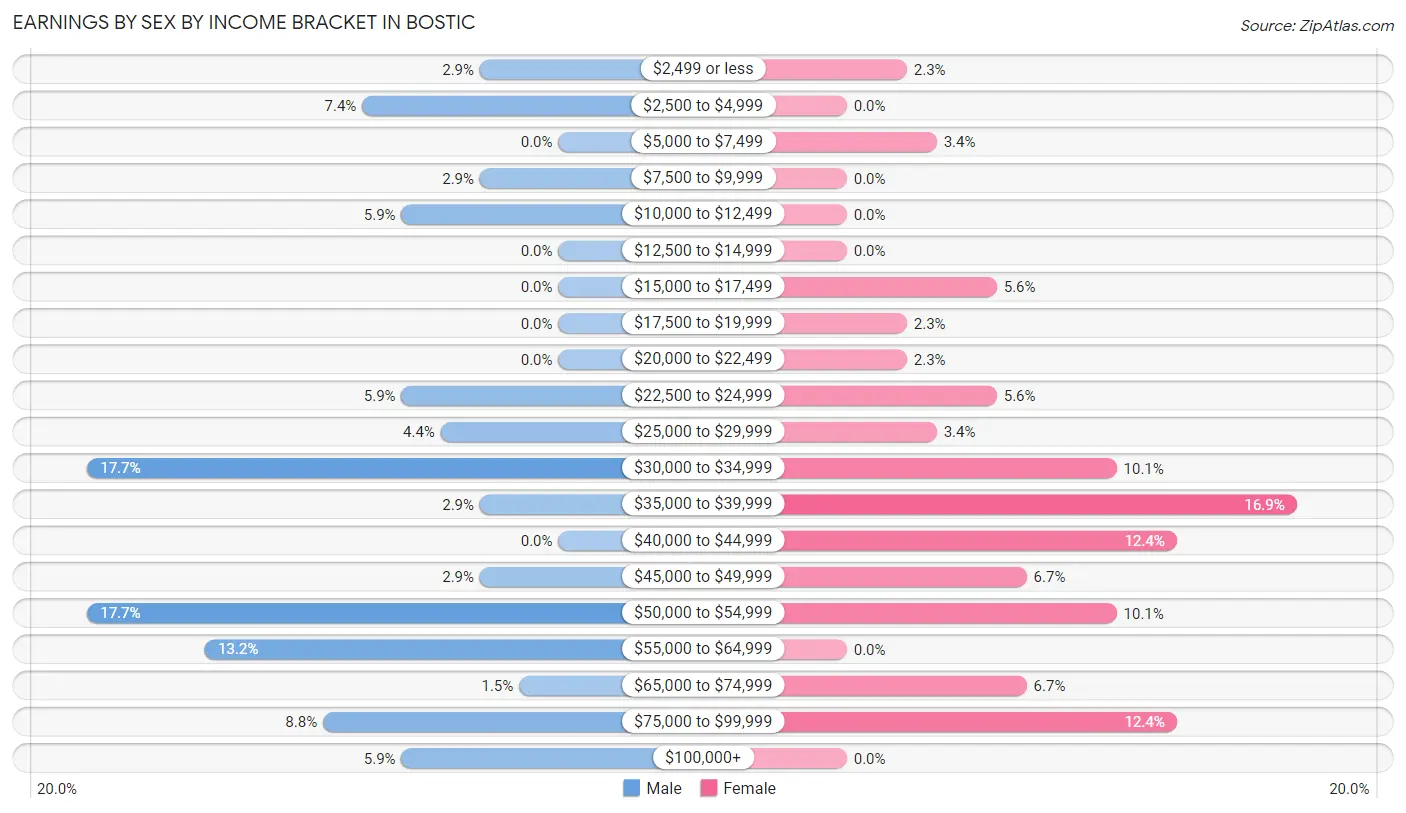
Earnings by Sex by Income Bracket in Bostic
The most common earnings brackets in Bostic are $30,000 to $34,999 for men (12 | 17.6%) and $35,000 to $39,999 for women (15 | 16.9%).
| Income | Male | Female |
| $2,499 or less | 2 (2.9%) | 2 (2.2%) |
| $2,500 to $4,999 | 5 (7.3%) | 0 (0.0%) |
| $5,000 to $7,499 | 0 (0.0%) | 3 (3.4%) |
| $7,500 to $9,999 | 2 (2.9%) | 0 (0.0%) |
| $10,000 to $12,499 | 4 (5.9%) | 0 (0.0%) |
| $12,500 to $14,999 | 0 (0.0%) | 0 (0.0%) |
| $15,000 to $17,499 | 0 (0.0%) | 5 (5.6%) |
| $17,500 to $19,999 | 0 (0.0%) | 2 (2.2%) |
| $20,000 to $22,499 | 0 (0.0%) | 2 (2.2%) |
| $22,500 to $24,999 | 4 (5.9%) | 5 (5.6%) |
| $25,000 to $29,999 | 3 (4.4%) | 3 (3.4%) |
| $30,000 to $34,999 | 12 (17.6%) | 9 (10.1%) |
| $35,000 to $39,999 | 2 (2.9%) | 15 (16.9%) |
| $40,000 to $44,999 | 0 (0.0%) | 11 (12.4%) |
| $45,000 to $49,999 | 2 (2.9%) | 6 (6.7%) |
| $50,000 to $54,999 | 12 (17.6%) | 9 (10.1%) |
| $55,000 to $64,999 | 9 (13.2%) | 0 (0.0%) |
| $65,000 to $74,999 | 1 (1.5%) | 6 (6.7%) |
| $75,000 to $99,999 | 6 (8.8%) | 11 (12.4%) |
| $100,000+ | 4 (5.9%) | 0 (0.0%) |
| Total | 68 (100.0%) | 89 (100.0%) |
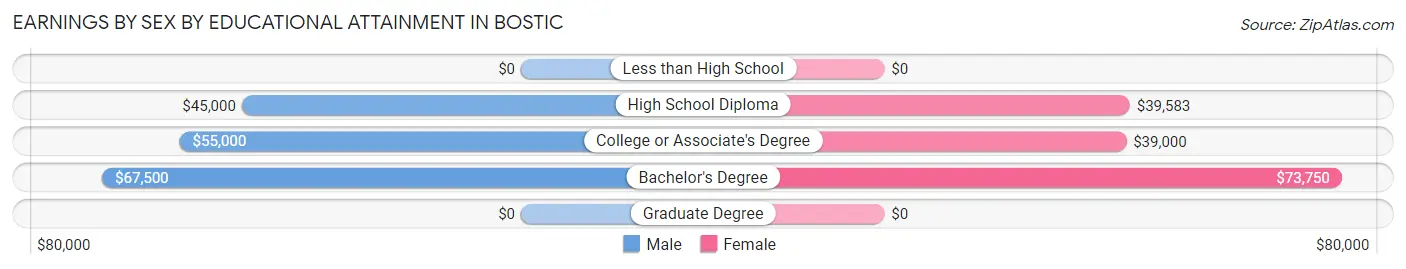
Earnings by Sex by Educational Attainment in Bostic
Average earnings in Bostic are $50,000 for men and $42,679 for women, a difference of 14.6%. Men with an educational attainment of bachelor's degree enjoy the highest average annual earnings of $67,500, while those with high school diploma education earn the least with $45,000. Women with an educational attainment of bachelor's degree earn the most with the average annual earnings of $73,750, while those with college or associate's degree education have the smallest earnings of $39,000.
| Educational Attainment | Male Income | Female Income |
| Less than High School | - | - |
| High School Diploma | $45,000 | $39,583 |
| College or Associate's Degree | $55,000 | $39,000 |
| Bachelor's Degree | $67,500 | $73,750 |
| Graduate Degree | - | - |
| Total | $50,000 | $42,679 |
Family Income in Bostic
Family Income Brackets in Bostic
According to the Bostic family income data, there are 26 families falling into the $100,000 to $149,999 income range, which is the most common income bracket and makes up 27.4% of all families.
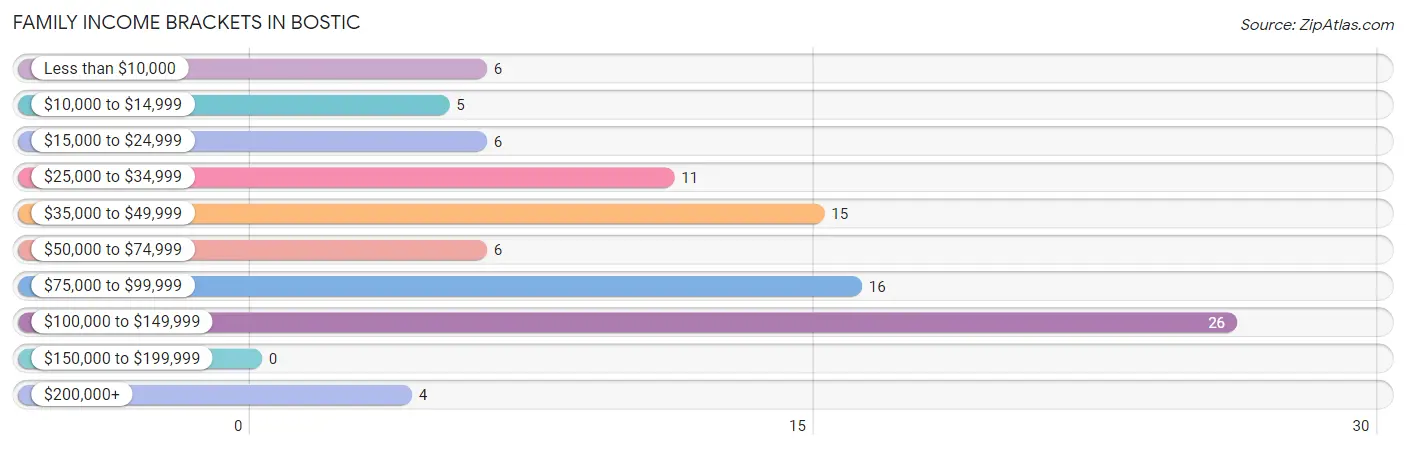
| Income Bracket | # Families | % Families |
| Less than $10,000 | 6 | 6.3% |
| $10,000 to $14,999 | 5 | 5.3% |
| $15,000 to $24,999 | 6 | 6.3% |
| $25,000 to $34,999 | 11 | 11.6% |
| $35,000 to $49,999 | 15 | 15.8% |
| $50,000 to $74,999 | 6 | 6.3% |
| $75,000 to $99,999 | 16 | 16.8% |
| $100,000 to $149,999 | 26 | 27.4% |
| $150,000 to $199,999 | 0 | 0.0% |
| $200,000+ | 4 | 4.2% |
Family Income by Famaliy Size in Bostic
3-person families (17 | 17.9%) account for the highest median family income in Bostic with $113,125 per family, while 3-person families (17 | 17.9%) have the highest median income of $37,708 per family member.
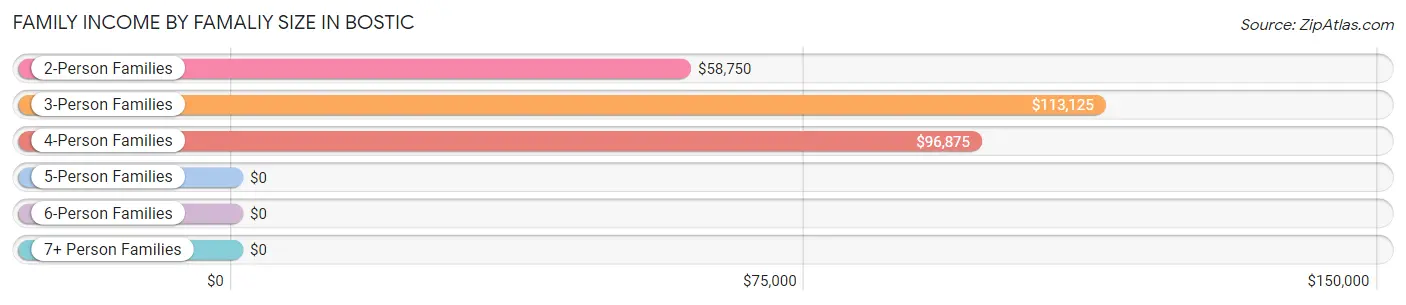
| Income Bracket | # Families | Median Income |
| 2-Person Families | 64 (67.4%) | $58,750 |
| 3-Person Families | 17 (17.9%) | $113,125 |
| 4-Person Families | 9 (9.5%) | $96,875 |
| 5-Person Families | 5 (5.3%) | $0 |
| 6-Person Families | 0 (0.0%) | $0 |
| 7+ Person Families | 0 (0.0%) | $0 |
| Total | 95 (100.0%) | $68,125 |
Family Income by Number of Earners in Bostic
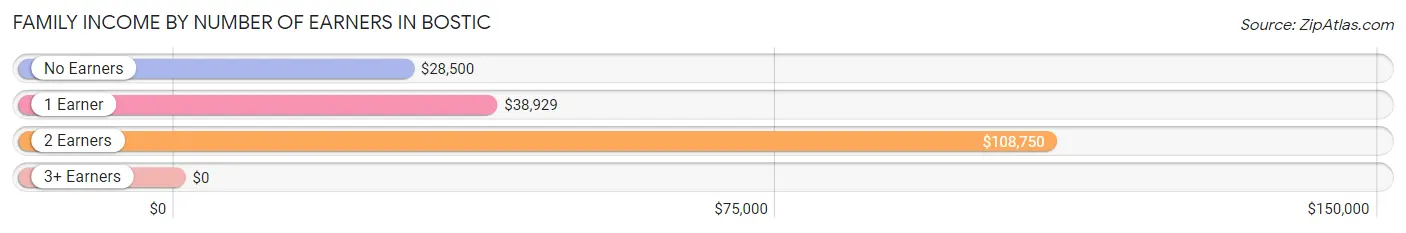
| Number of Earners | # Families | Median Income |
| No Earners | 24 (25.3%) | $28,500 |
| 1 Earner | 30 (31.6%) | $38,929 |
| 2 Earners | 36 (37.9%) | $108,750 |
| 3+ Earners | 5 (5.3%) | $0 |
| Total | 95 (100.0%) | $68,125 |
Household Income in Bostic
Household Income Brackets in Bostic
With 30 households falling in the category, the $100,000 to $149,999 income range is the most frequent in Bostic, accounting for 20.8% of all households.
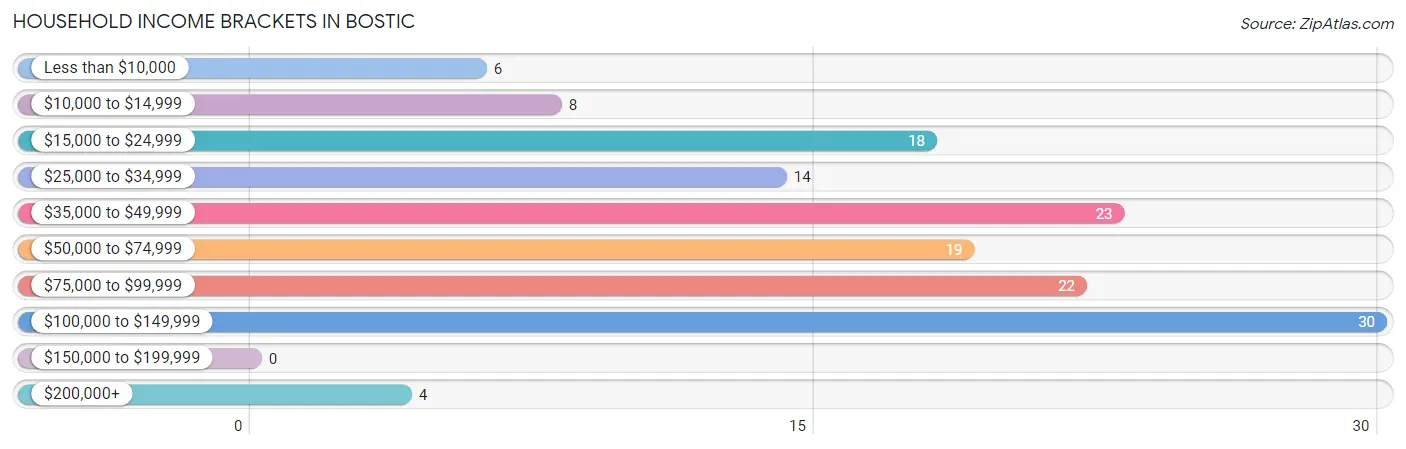
| Income Bracket | # Households | % Households |
| Less than $10,000 | 6 | 4.2% |
| $10,000 to $14,999 | 8 | 5.6% |
| $15,000 to $24,999 | 18 | 12.5% |
| $25,000 to $34,999 | 14 | 9.7% |
| $35,000 to $49,999 | 23 | 16.0% |
| $50,000 to $74,999 | 19 | 13.2% |
| $75,000 to $99,999 | 22 | 15.3% |
| $100,000 to $149,999 | 30 | 20.8% |
| $150,000 to $199,999 | 0 | 0.0% |
| $200,000+ | 4 | 2.8% |
Household Income by Householder Age in Bostic
The median household income in Bostic is $53,438, with the highest median household income of $54,844 found in the 45 to 64 years age bracket for the primary householder. A total of 75 households (52.1%) fall into this category. Meanwhile, the 15 to 24 years age bracket for the primary householder has the lowest median household income of $0, with 3 households (2.1%) in this group.
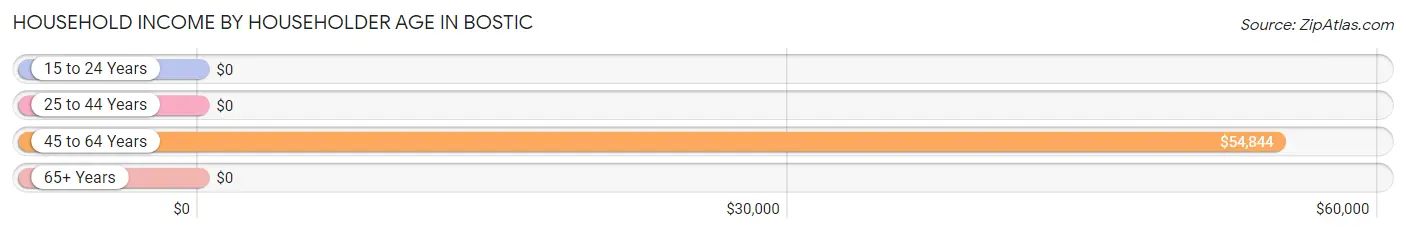
| Income Bracket | # Households | Median Income |
| 15 to 24 Years | 3 (2.1%) | $0 |
| 25 to 44 Years | 25 (17.4%) | $0 |
| 45 to 64 Years | 75 (52.1%) | $54,844 |
| 65+ Years | 41 (28.5%) | $0 |
| Total | 144 (100.0%) | $53,438 |
Poverty in Bostic
Income Below Poverty by Sex and Age in Bostic
With 23.2% poverty level for males and 10.5% for females among the residents of Bostic, 16 and 17 year old males and 45 to 54 year old females are the most vulnerable to poverty, with 1 males (100.0%) and 10 females (27.0%) in their respective age groups living below the poverty level.
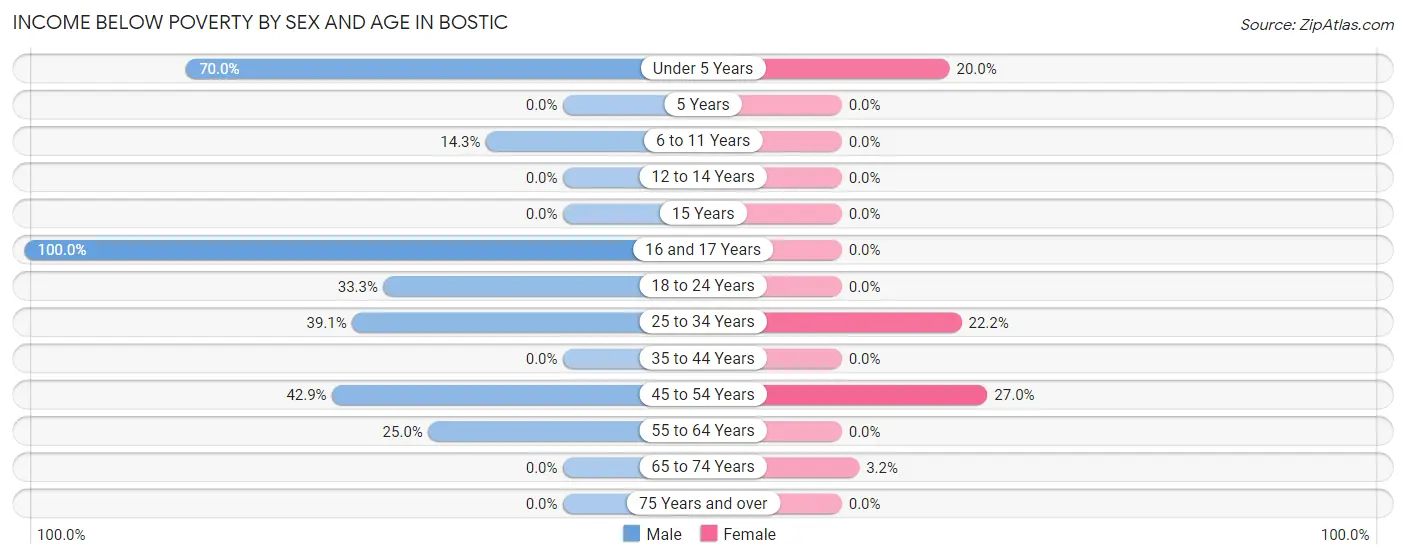
| Age Bracket | Male | Female |
| Under 5 Years | 7 (70.0%) | 2 (20.0%) |
| 5 Years | 0 (0.0%) | 0 (0.0%) |
| 6 to 11 Years | 2 (14.3%) | 0 (0.0%) |
| 12 to 14 Years | 0 (0.0%) | 0 (0.0%) |
| 15 Years | 0 (0.0%) | 0 (0.0%) |
| 16 and 17 Years | 1 (100.0%) | 0 (0.0%) |
| 18 to 24 Years | 2 (33.3%) | 0 (0.0%) |
| 25 to 34 Years | 9 (39.1%) | 4 (22.2%) |
| 35 to 44 Years | 0 (0.0%) | 0 (0.0%) |
| 45 to 54 Years | 6 (42.9%) | 10 (27.0%) |
| 55 to 64 Years | 6 (25.0%) | 0 (0.0%) |
| 65 to 74 Years | 0 (0.0%) | 1 (3.2%) |
| 75 Years and over | 0 (0.0%) | 0 (0.0%) |
| Total | 33 (23.2%) | 17 (10.5%) |
Income Above Poverty by Sex and Age in Bostic
According to the poverty statistics in Bostic, males aged 5 years and females aged 6 to 11 years are the age groups that are most secure financially, with 100.0% of males and 100.0% of females in these age groups living above the poverty line.
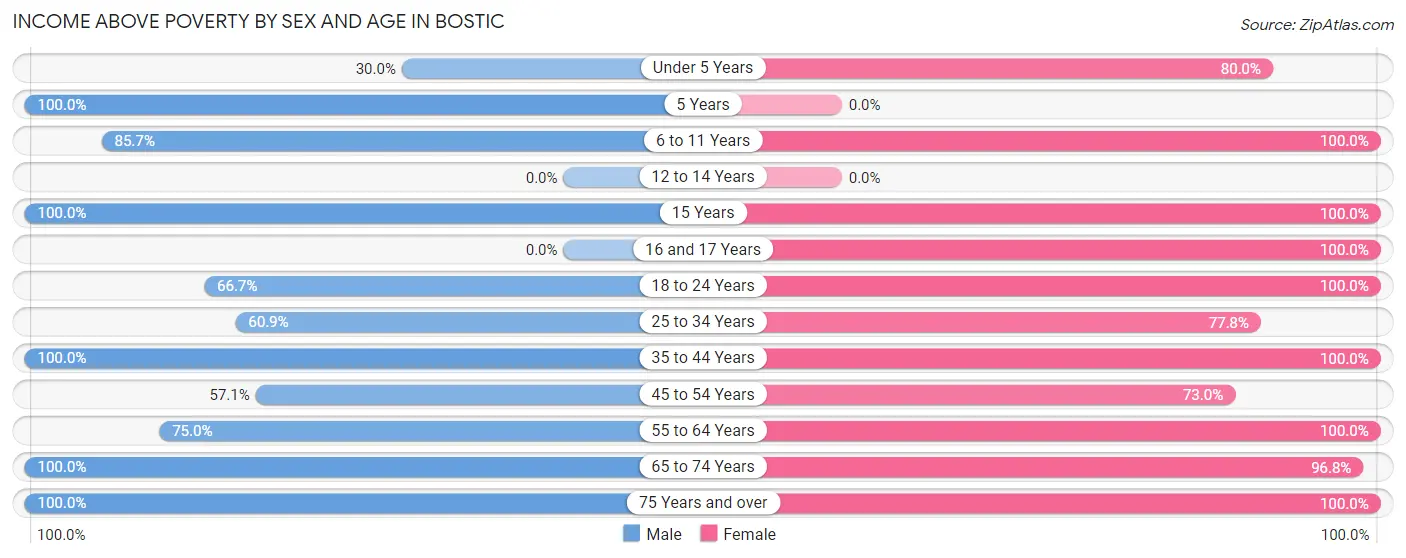
| Age Bracket | Male | Female |
| Under 5 Years | 3 (30.0%) | 8 (80.0%) |
| 5 Years | 2 (100.0%) | 0 (0.0%) |
| 6 to 11 Years | 12 (85.7%) | 12 (100.0%) |
| 12 to 14 Years | 0 (0.0%) | 0 (0.0%) |
| 15 Years | 1 (100.0%) | 2 (100.0%) |
| 16 and 17 Years | 0 (0.0%) | 2 (100.0%) |
| 18 to 24 Years | 4 (66.7%) | 12 (100.0%) |
| 25 to 34 Years | 14 (60.9%) | 14 (77.8%) |
| 35 to 44 Years | 16 (100.0%) | 5 (100.0%) |
| 45 to 54 Years | 8 (57.1%) | 27 (73.0%) |
| 55 to 64 Years | 18 (75.0%) | 32 (100.0%) |
| 65 to 74 Years | 19 (100.0%) | 30 (96.8%) |
| 75 Years and over | 12 (100.0%) | 1 (100.0%) |
| Total | 109 (76.8%) | 145 (89.5%) |
Income Below Poverty Among Married-Couple Families in Bostic
The poverty statistics for married-couple families in Bostic show that 8.7% or 6 of the total 69 families live below the poverty line. Families with no children have the highest poverty rate of 12.2%, comprising of 6 families. On the other hand, families with 1 or 2 children have the lowest poverty rate of 0.0%, which includes 0 families.
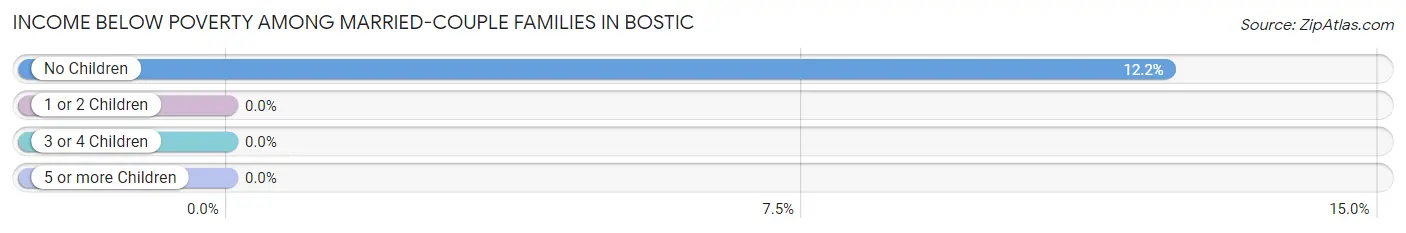
| Children | Above Poverty | Below Poverty |
| No Children | 43 (87.8%) | 6 (12.2%) |
| 1 or 2 Children | 15 (100.0%) | 0 (0.0%) |
| 3 or 4 Children | 5 (100.0%) | 0 (0.0%) |
| 5 or more Children | 0 (0.0%) | 0 (0.0%) |
| Total | 63 (91.3%) | 6 (8.7%) |
Income Below Poverty Among Single-Parent Households in Bostic
According to the poverty data in Bostic, 28.6% or 2 single-father households and 31.6% or 6 single-mother households are living below the poverty line. Among single-father households, those with 1 or 2 children have the highest poverty rate, with 2 households (66.7%) experiencing poverty. Likewise, among single-mother households, those with 1 or 2 children have the highest poverty rate, with 3 households (50.0%) falling below the poverty line.
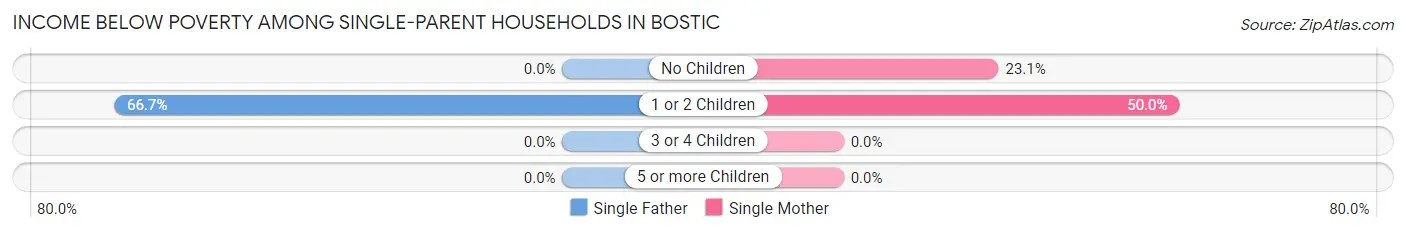
| Children | Single Father | Single Mother |
| No Children | 0 (0.0%) | 3 (23.1%) |
| 1 or 2 Children | 2 (66.7%) | 3 (50.0%) |
| 3 or 4 Children | 0 (0.0%) | 0 (0.0%) |
| 5 or more Children | 0 (0.0%) | 0 (0.0%) |
| Total | 2 (28.6%) | 6 (31.6%) |
Income Below Poverty Among Married-Couple vs Single-Parent Households in Bostic
The poverty data for Bostic shows that 6 of the married-couple family households (8.7%) and 8 of the single-parent households (30.8%) are living below the poverty level. Within the married-couple family households, those with no children have the highest poverty rate, with 6 households (12.2%) falling below the poverty line. Among the single-parent households, those with 1 or 2 children have the highest poverty rate, with 5 household (55.6%) living below poverty.
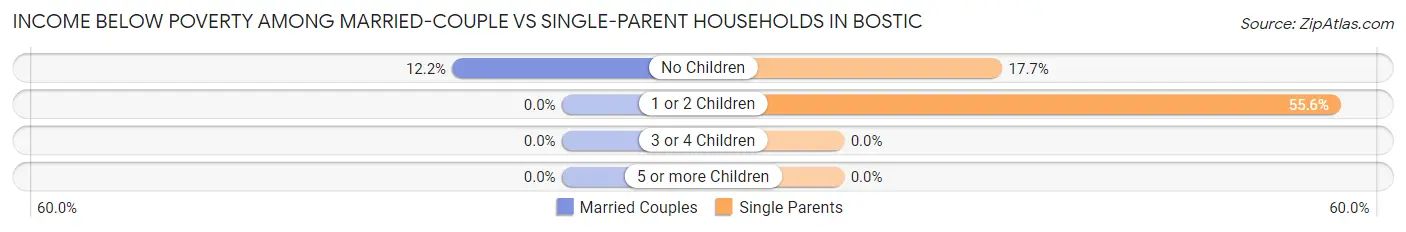
| Children | Married-Couple Families | Single-Parent Households |
| No Children | 6 (12.2%) | 3 (17.6%) |
| 1 or 2 Children | 0 (0.0%) | 5 (55.6%) |
| 3 or 4 Children | 0 (0.0%) | 0 (0.0%) |
| 5 or more Children | 0 (0.0%) | 0 (0.0%) |
| Total | 6 (8.7%) | 8 (30.8%) |
Race in Bostic
The most populous races in Bostic are White / Caucasian (270 | 88.8%), Black / African American (19 | 6.2%), and Two or more Races (9 | 3.0%).
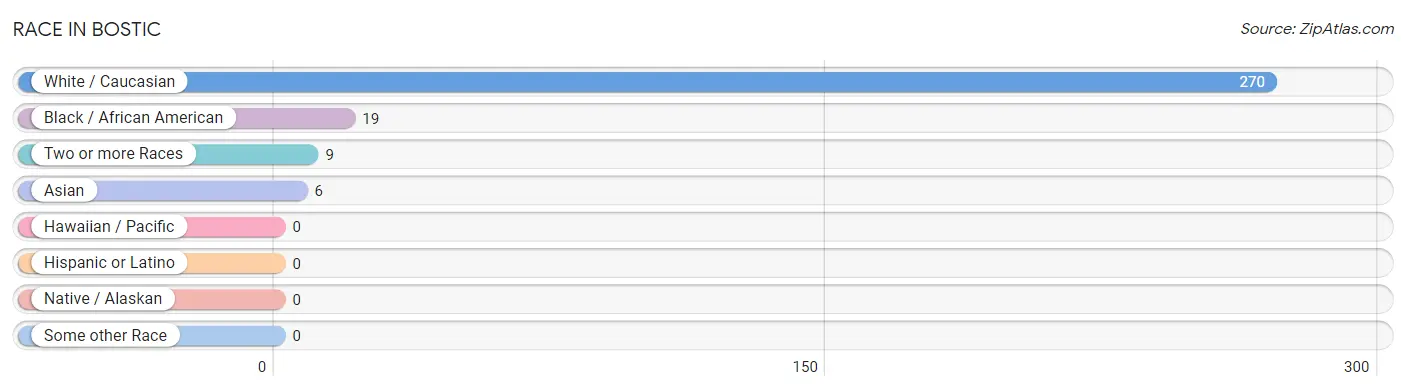
| Race | # Population | % Population |
| Asian | 6 | 2.0% |
| Black / African American | 19 | 6.2% |
| Hawaiian / Pacific | 0 | 0.0% |
| Hispanic or Latino | 0 | 0.0% |
| Native / Alaskan | 0 | 0.0% |
| White / Caucasian | 270 | 88.8% |
| Two or more Races | 9 | 3.0% |
| Some other Race | 0 | 0.0% |
| Total | 304 | 100.0% |
Ancestry in Bostic
The most populous ancestries reported in Bostic are American (56 | 18.4%), English (38 | 12.5%), Irish (38 | 12.5%), German (24 | 7.9%), and Scotch-Irish (8 | 2.6%), together accounting for 53.9% of all Bostic residents.
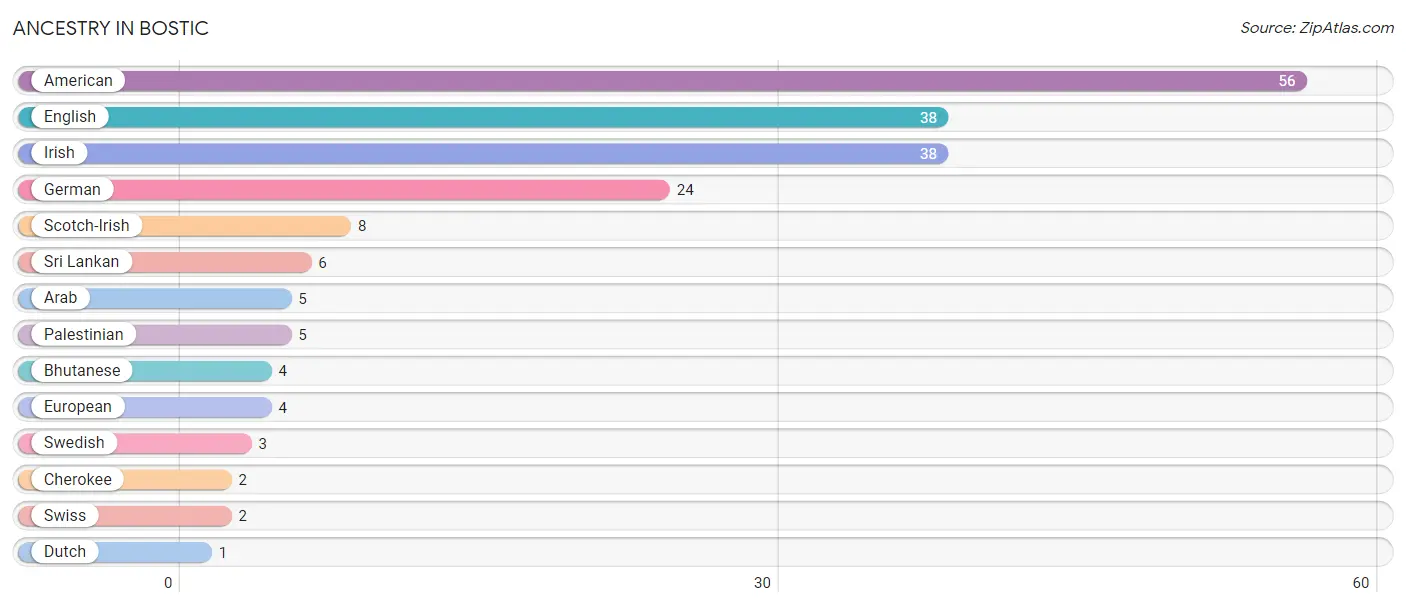
| Ancestry | # Population | % Population |
| American | 56 | 18.4% |
| Arab | 5 | 1.6% |
| Bhutanese | 4 | 1.3% |
| Cherokee | 2 | 0.7% |
| Dutch | 1 | 0.3% |
| English | 38 | 12.5% |
| European | 4 | 1.3% |
| German | 24 | 7.9% |
| Irish | 38 | 12.5% |
| Palestinian | 5 | 1.6% |
| Scotch-Irish | 8 | 2.6% |
| Sri Lankan | 6 | 2.0% |
| Swedish | 3 | 1.0% |
| Swiss | 2 | 0.7% | View All 14 Rows |
Immigrants in Bostic
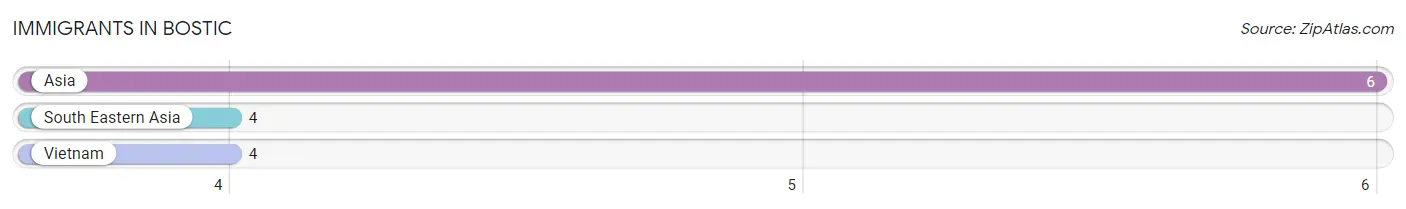
The most numerous immigrant groups reported in Bostic came from Asia (6 | 2.0%), South Eastern Asia (4 | 1.3%), and Vietnam (4 | 1.3%), together accounting for 4.6% of all Bostic residents.
| Immigration Origin | # Population | % Population |
| Asia | 6 | 2.0% |
| South Eastern Asia | 4 | 1.3% |
| Vietnam | 4 | 1.3% | View All 3 Rows |
Sex and Age in Bostic
Sex and Age in Bostic
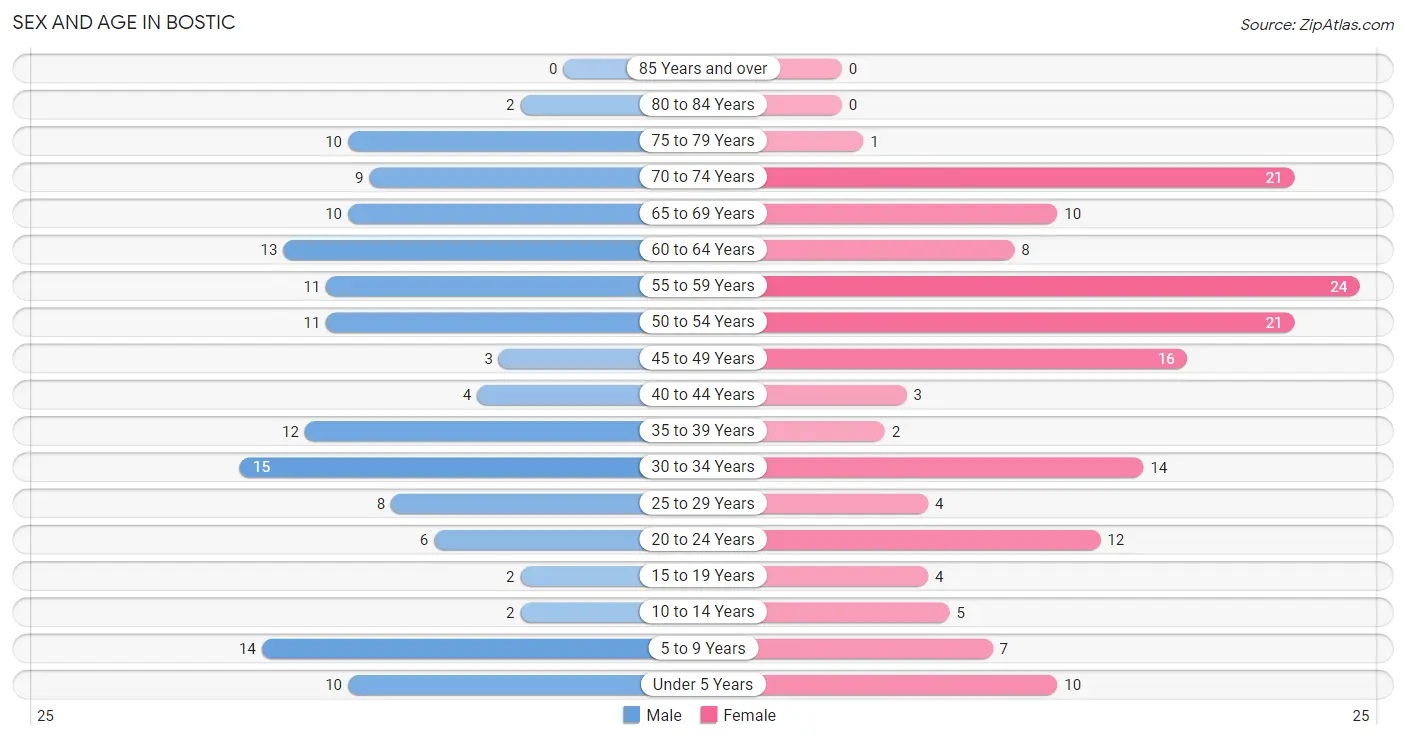
The most populous age groups in Bostic are 30 to 34 Years (15 | 10.6%) for men and 55 to 59 Years (24 | 14.8%) for women.
| Age Bracket | Male | Female |
| Under 5 Years | 10 (7.0%) | 10 (6.2%) |
| 5 to 9 Years | 14 (9.9%) | 7 (4.3%) |
| 10 to 14 Years | 2 (1.4%) | 5 (3.1%) |
| 15 to 19 Years | 2 (1.4%) | 4 (2.5%) |
| 20 to 24 Years | 6 (4.2%) | 12 (7.4%) |
| 25 to 29 Years | 8 (5.6%) | 4 (2.5%) |
| 30 to 34 Years | 15 (10.6%) | 14 (8.6%) |
| 35 to 39 Years | 12 (8.5%) | 2 (1.2%) |
| 40 to 44 Years | 4 (2.8%) | 3 (1.8%) |
| 45 to 49 Years | 3 (2.1%) | 16 (9.9%) |
| 50 to 54 Years | 11 (7.7%) | 21 (13.0%) |
| 55 to 59 Years | 11 (7.7%) | 24 (14.8%) |
| 60 to 64 Years | 13 (9.1%) | 8 (4.9%) |
| 65 to 69 Years | 10 (7.0%) | 10 (6.2%) |
| 70 to 74 Years | 9 (6.3%) | 21 (13.0%) |
| 75 to 79 Years | 10 (7.0%) | 1 (0.6%) |
| 80 to 84 Years | 2 (1.4%) | 0 (0.0%) |
| 85 Years and over | 0 (0.0%) | 0 (0.0%) |
| Total | 142 (100.0%) | 162 (100.0%) |
Families and Households in Bostic
Median Family Size in Bostic
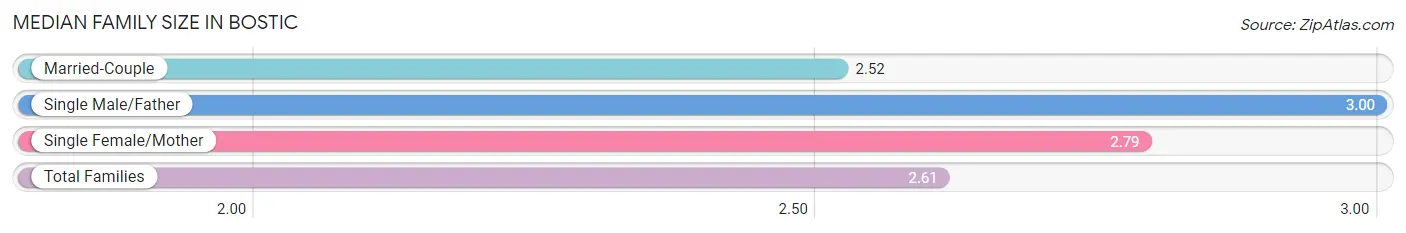
The median family size in Bostic is 2.61 persons per family, with single male/father families (7 | 7.4%) accounting for the largest median family size of 3 persons per family. On the other hand, married-couple families (69 | 72.6%) represent the smallest median family size with 2.52 persons per family.
| Family Type | # Families | Family Size |
| Married-Couple | 69 (72.6%) | 2.52 |
| Single Male/Father | 7 (7.4%) | 3.00 |
| Single Female/Mother | 19 (20.0%) | 2.79 |
| Total Families | 95 (100.0%) | 2.61 |
Median Household Size in Bostic
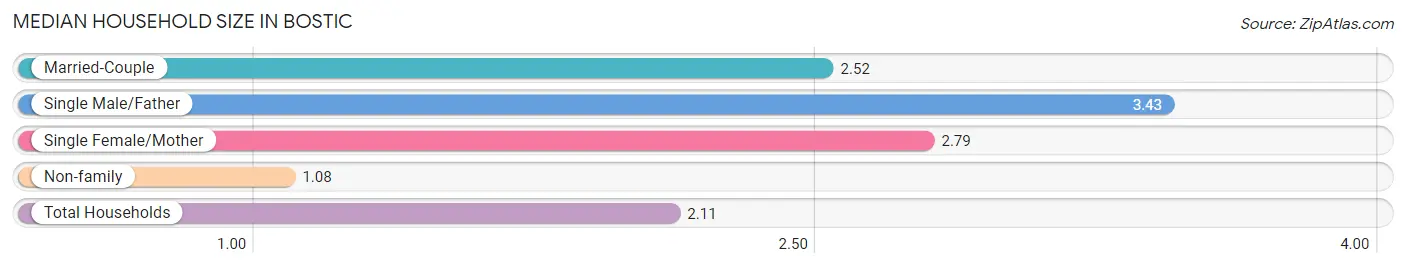
The median household size in Bostic is 2.11 persons per household, with single male/father households (7 | 4.9%) accounting for the largest median household size of 3.43 persons per household. non-family households (49 | 34.0%) represent the smallest median household size with 1.08 persons per household.
| Household Type | # Households | Household Size |
| Married-Couple | 69 (47.9%) | 2.52 |
| Single Male/Father | 7 (4.9%) | 3.43 |
| Single Female/Mother | 19 (13.2%) | 2.79 |
| Non-family | 49 (34.0%) | 1.08 |
| Total Households | 144 (100.0%) | 2.11 |
Household Size by Marriage Status in Bostic
Out of a total of 144 households in Bostic, 95 (66.0%) are family households, while 49 (34.0%) are nonfamily households. The most numerous type of family households are 2-person households, comprising 62, and the most common type of nonfamily households are 1-person households, comprising 46.
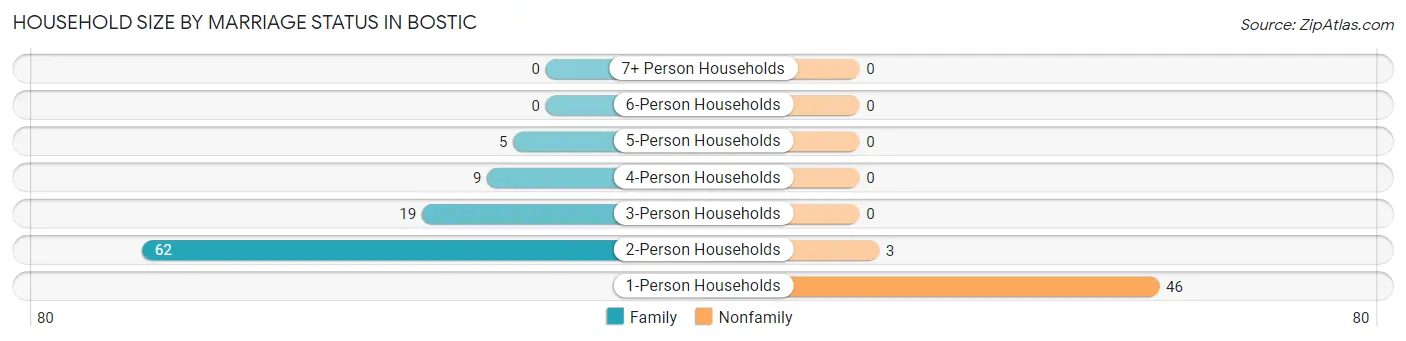
| Household Size | Family Households | Nonfamily Households |
| 1-Person Households | - | 46 (31.9%) |
| 2-Person Households | 62 (43.1%) | 3 (2.1%) |
| 3-Person Households | 19 (13.2%) | 0 (0.0%) |
| 4-Person Households | 9 (6.2%) | 0 (0.0%) |
| 5-Person Households | 5 (3.5%) | 0 (0.0%) |
| 6-Person Households | 0 (0.0%) | 0 (0.0%) |
| 7+ Person Households | 0 (0.0%) | 0 (0.0%) |
| Total | 95 (66.0%) | 49 (34.0%) |
Female Fertility in Bostic
Fertility by Age in Bostic
Average fertility rate in Bostic is 33.0 births per 1,000 women. Women in the age bracket of 20 to 34 years have the highest fertility rate with 67.0 births per 1,000 women. Women in the age bracket of 20 to 34 years acount for 100.0% of all women with births.
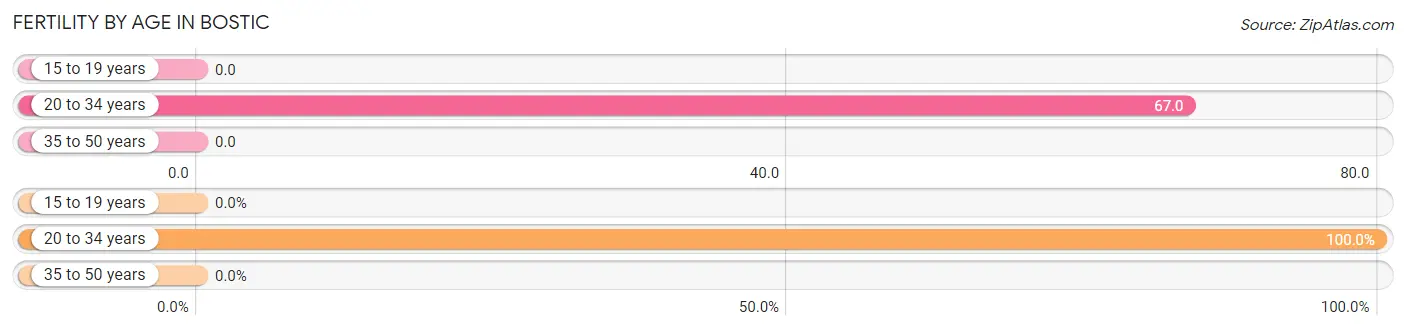
| Age Bracket | Women with Births | Births / 1,000 Women |
| 15 to 19 years | 0 (0.0%) | 0.0 |
| 20 to 34 years | 2 (100.0%) | 67.0 |
| 35 to 50 years | 0 (0.0%) | 0.0 |
| Total | 2 (100.0%) | 33.0 |
Fertility by Age by Marriage Status in Bostic
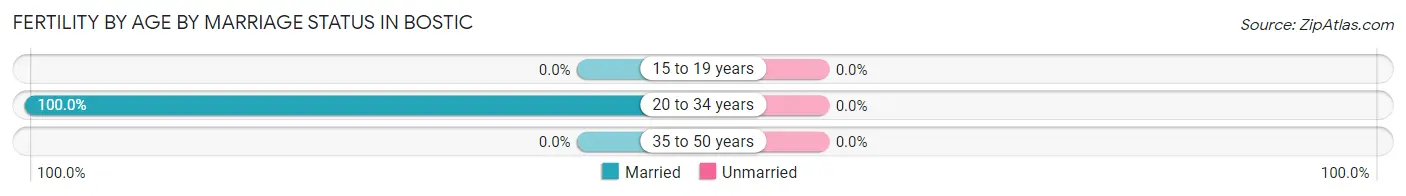
| Age Bracket | Married | Unmarried |
| 15 to 19 years | 0 (0.0%) | 0 (0.0%) |
| 20 to 34 years | 2 (100.0%) | 0 (0.0%) |
| 35 to 50 years | 0 (0.0%) | 0 (0.0%) |
| Total | 2 (100.0%) | 0 (0.0%) |
Fertility by Education in Bostic
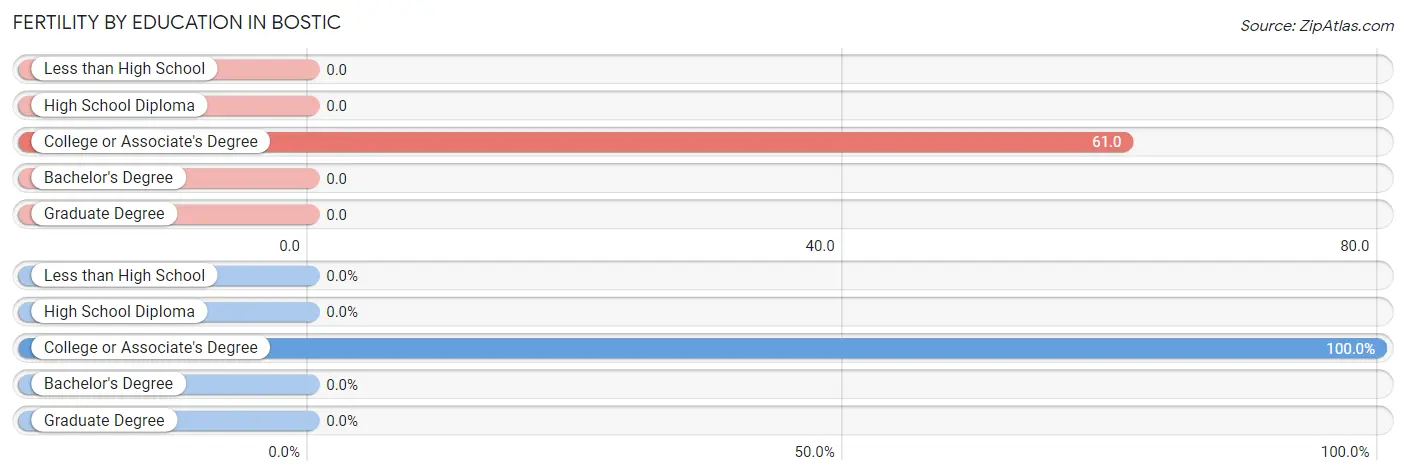
| Educational Attainment | Women with Births | Births / 1,000 Women |
| Less than High School | 0 (0.0%) | 0.0 |
| High School Diploma | 0 (0.0%) | 0.0 |
| College or Associate's Degree | 2 (100.0%) | 61.0 |
| Bachelor's Degree | 0 (0.0%) | 0.0 |
| Graduate Degree | 0 (0.0%) | 0.0 |
| Total | 2 (100.0%) | 33.0 |
Fertility by Education by Marriage Status in Bostic
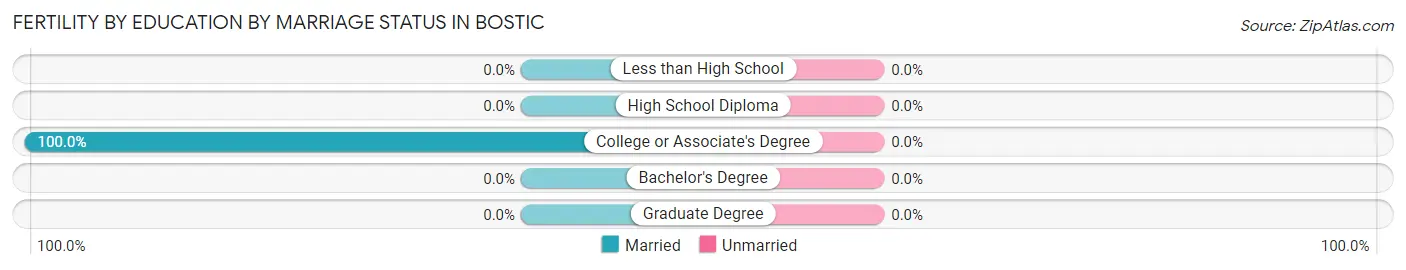
| Educational Attainment | Married | Unmarried |
| Less than High School | 0 (0.0%) | 0 (0.0%) |
| High School Diploma | 0 (0.0%) | 0 (0.0%) |
| College or Associate's Degree | 2 (100.0%) | 0 (0.0%) |
| Bachelor's Degree | 0 (0.0%) | 0 (0.0%) |
| Graduate Degree | 0 (0.0%) | 0 (0.0%) |
| Total | 2 (100.0%) | 0 (0.0%) |
Employment Characteristics in Bostic
Employment by Class of Employer in Bostic
Among the 133 employed individuals in Bostic, private company employees (93 | 69.9%), local government employees (19 | 14.3%), and state government employees (10 | 7.5%) make up the most common classes of employment.
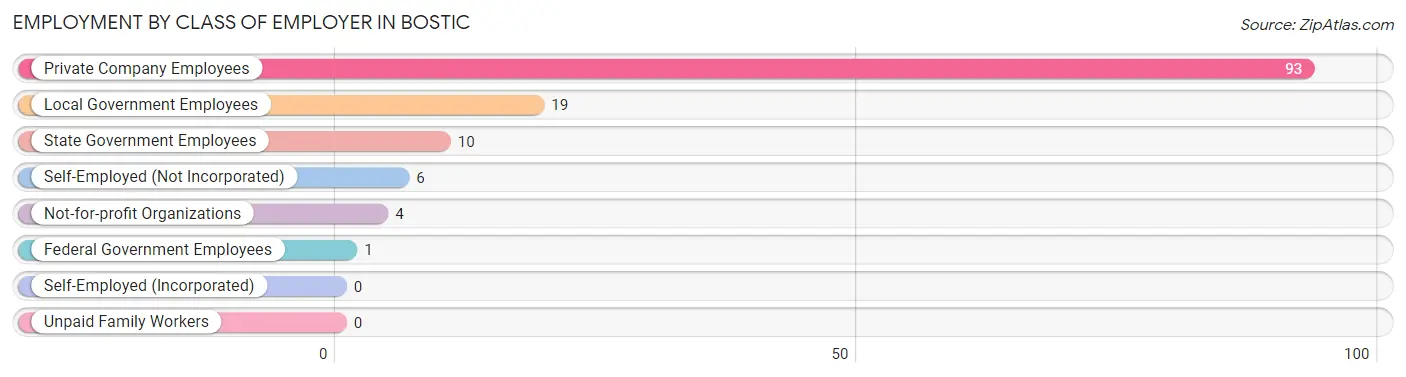
| Employer Class | # Employees | % Employees |
| Private Company Employees | 93 | 69.9% |
| Self-Employed (Incorporated) | 0 | 0.0% |
| Self-Employed (Not Incorporated) | 6 | 4.5% |
| Not-for-profit Organizations | 4 | 3.0% |
| Local Government Employees | 19 | 14.3% |
| State Government Employees | 10 | 7.5% |
| Federal Government Employees | 1 | 0.7% |
| Unpaid Family Workers | 0 | 0.0% |
| Total | 133 | 100.0% |
Employment Status by Age in Bostic
According to the labor force statistics for Bostic, out of the total population over 16 years of age (253), 60.5% or 153 individuals are in the labor force, with 7.2% or 11 of them unemployed. The age group with the highest labor force participation rate is 25 to 29 years, with 100.0% or 12 individuals in the labor force. Within the labor force, the 25 to 29 years age range has the highest percentage of unemployed individuals, with 33.3% or 4 of them being unemployed.
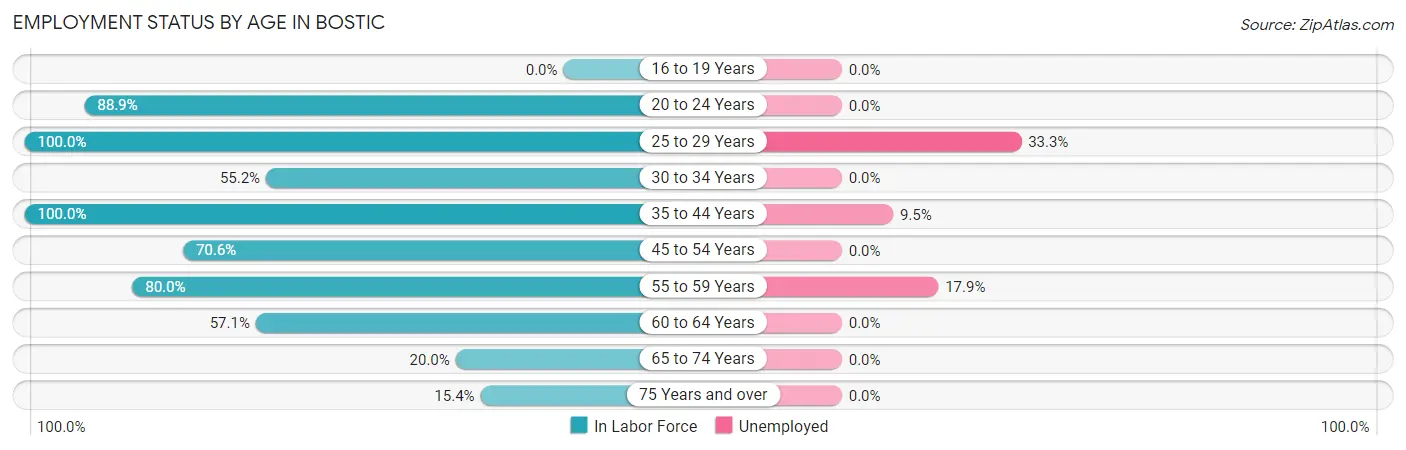
| Age Bracket | In Labor Force | Unemployed |
| 16 to 19 Years | 0 (0.0%) | 0 (0.0%) |
| 20 to 24 Years | 16 (88.9%) | 0 (0.0%) |
| 25 to 29 Years | 12 (100.0%) | 4 (33.3%) |
| 30 to 34 Years | 16 (55.2%) | 0 (0.0%) |
| 35 to 44 Years | 21 (100.0%) | 2 (9.5%) |
| 45 to 54 Years | 36 (70.6%) | 0 (0.0%) |
| 55 to 59 Years | 28 (80.0%) | 5 (17.9%) |
| 60 to 64 Years | 12 (57.1%) | 0 (0.0%) |
| 65 to 74 Years | 10 (20.0%) | 0 (0.0%) |
| 75 Years and over | 2 (15.4%) | 0 (0.0%) |
| Total | 153 (60.5%) | 11 (7.2%) |
Employment Status by Educational Attainment in Bostic
According to labor force statistics for Bostic, 74.0% of individuals (125) out of the total population between 25 and 64 years of age (169) are in the labor force, with 8.8% or 11 of them being unemployed. The group with the highest labor force participation rate are those with the educational attainment of bachelor's degree or higher, with 83.3% or 25 individuals in the labor force. Within the labor force, individuals with less than high school education have the highest percentage of unemployment, with 66.7% or 6 of them being unemployed.
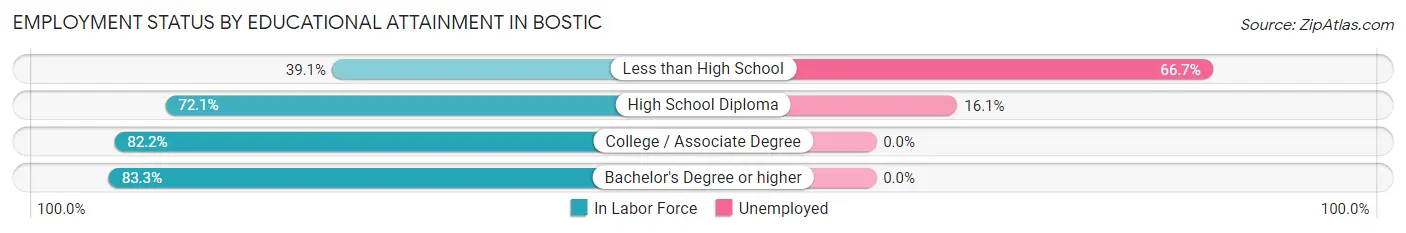
| Educational Attainment | In Labor Force | Unemployed |
| Less than High School | 9 (39.1%) | 15 (66.7%) |
| High School Diploma | 31 (72.1%) | 7 (16.1%) |
| College / Associate Degree | 60 (82.2%) | 0 (0.0%) |
| Bachelor's Degree or higher | 25 (83.3%) | 0 (0.0%) |
| Total | 125 (74.0%) | 15 (8.8%) |
Employment Occupations by Sex in Bostic
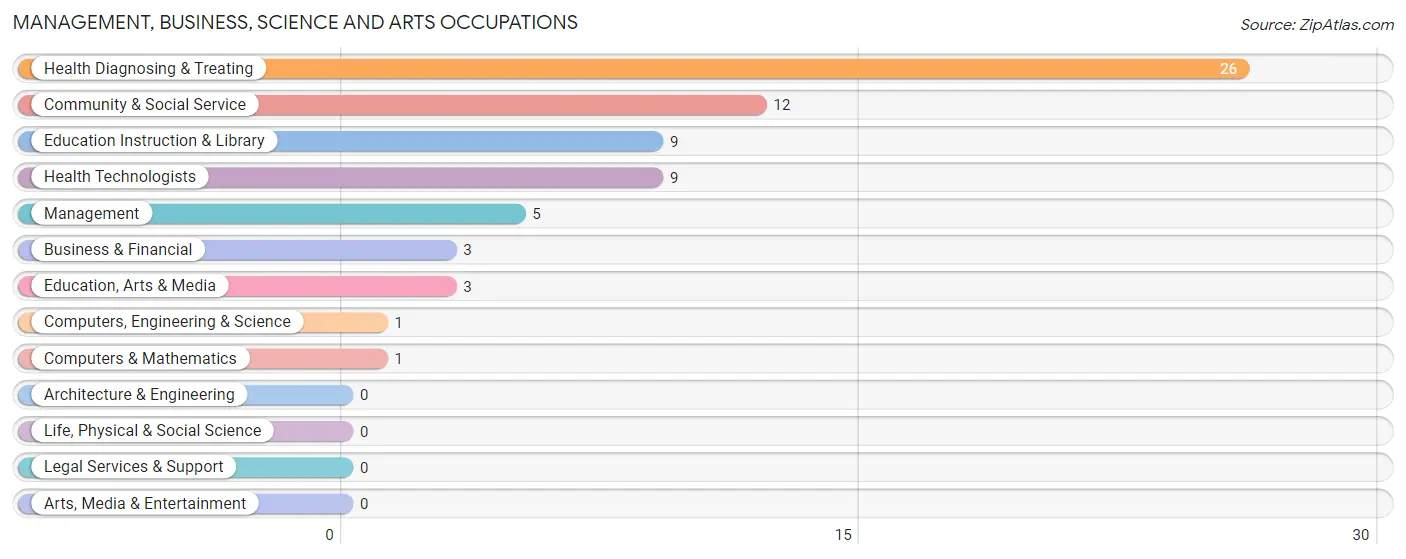
Management, Business, Science and Arts Occupations
The most common Management, Business, Science and Arts occupations in Bostic are Health Diagnosing & Treating (26 | 18.3%), Community & Social Service (12 | 8.5%), Education Instruction & Library (9 | 6.3%), Health Technologists (9 | 6.3%), and Management (5 | 3.5%).
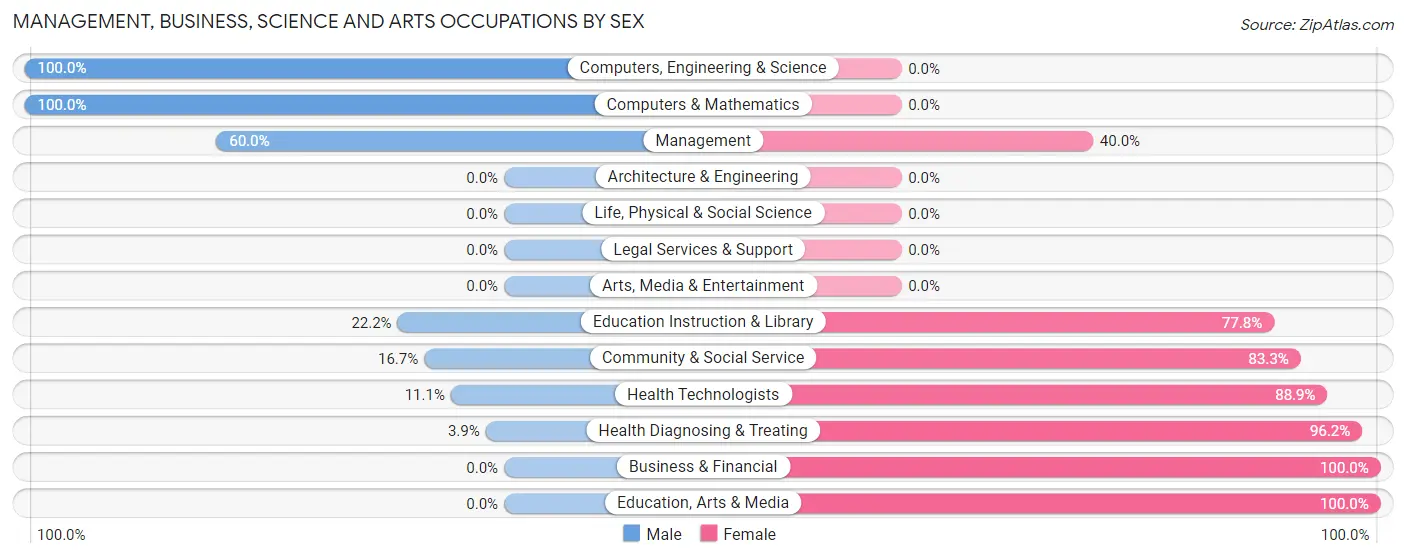
Management, Business, Science and Arts Occupations by Sex
Within the Management, Business, Science and Arts occupations in Bostic, the most male-oriented occupations are Computers, Engineering & Science (100.0%), Computers & Mathematics (100.0%), and Management (60.0%), while the most female-oriented occupations are Business & Financial (100.0%), Education, Arts & Media (100.0%), and Health Diagnosing & Treating (96.2%).
| Occupation | Male | Female |
| Management | 3 (60.0%) | 2 (40.0%) |
| Business & Financial | 0 (0.0%) | 3 (100.0%) |
| Computers, Engineering & Science | 1 (100.0%) | 0 (0.0%) |
| Computers & Mathematics | 1 (100.0%) | 0 (0.0%) |
| Architecture & Engineering | 0 (0.0%) | 0 (0.0%) |
| Life, Physical & Social Science | 0 (0.0%) | 0 (0.0%) |
| Community & Social Service | 2 (16.7%) | 10 (83.3%) |
| Education, Arts & Media | 0 (0.0%) | 3 (100.0%) |
| Legal Services & Support | 0 (0.0%) | 0 (0.0%) |
| Education Instruction & Library | 2 (22.2%) | 7 (77.8%) |
| Arts, Media & Entertainment | 0 (0.0%) | 0 (0.0%) |
| Health Diagnosing & Treating | 1 (3.8%) | 25 (96.2%) |
| Health Technologists | 1 (11.1%) | 8 (88.9%) |
| Total (Category) | 7 (14.9%) | 40 (85.1%) |
| Total (Overall) | 53 (37.3%) | 89 (62.7%) |
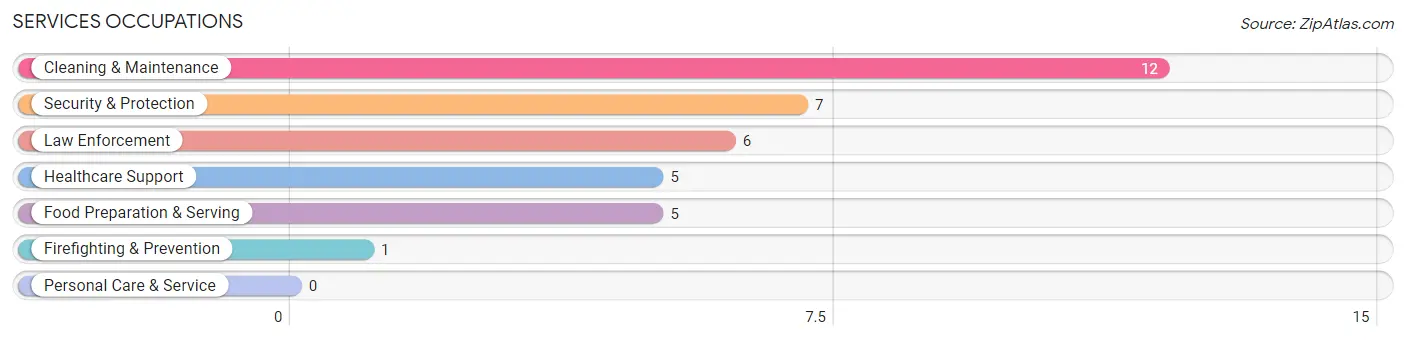
Services Occupations
The most common Services occupations in Bostic are Cleaning & Maintenance (12 | 8.5%), Security & Protection (7 | 4.9%), Law Enforcement (6 | 4.2%), Healthcare Support (5 | 3.5%), and Food Preparation & Serving (5 | 3.5%).
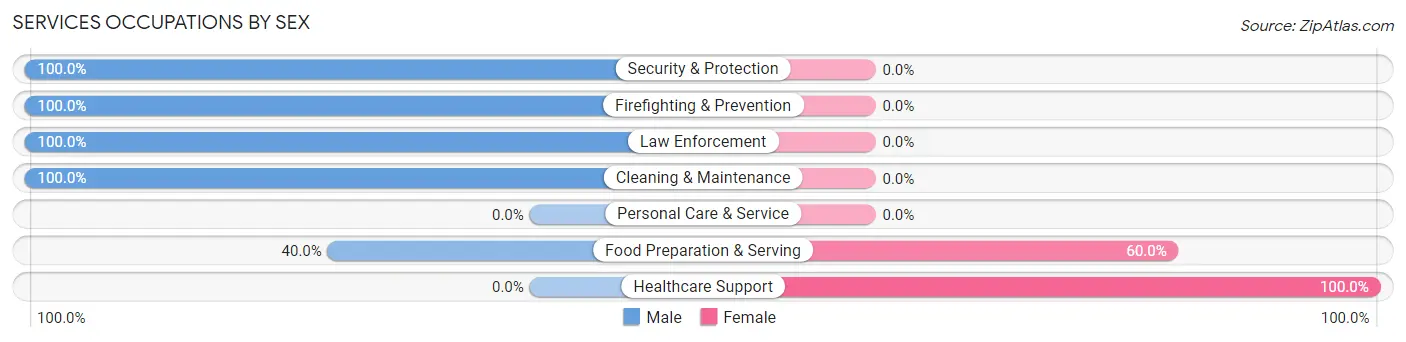
Services Occupations by Sex
Within the Services occupations in Bostic, the most male-oriented occupations are Security & Protection (100.0%), Firefighting & Prevention (100.0%), and Law Enforcement (100.0%), while the most female-oriented occupations are Healthcare Support (100.0%), and Food Preparation & Serving (60.0%).
| Occupation | Male | Female |
| Healthcare Support | 0 (0.0%) | 5 (100.0%) |
| Security & Protection | 7 (100.0%) | 0 (0.0%) |
| Firefighting & Prevention | 1 (100.0%) | 0 (0.0%) |
| Law Enforcement | 6 (100.0%) | 0 (0.0%) |
| Food Preparation & Serving | 2 (40.0%) | 3 (60.0%) |
| Cleaning & Maintenance | 12 (100.0%) | 0 (0.0%) |
| Personal Care & Service | 0 (0.0%) | 0 (0.0%) |
| Total (Category) | 21 (72.4%) | 8 (27.6%) |
| Total (Overall) | 53 (37.3%) | 89 (62.7%) |
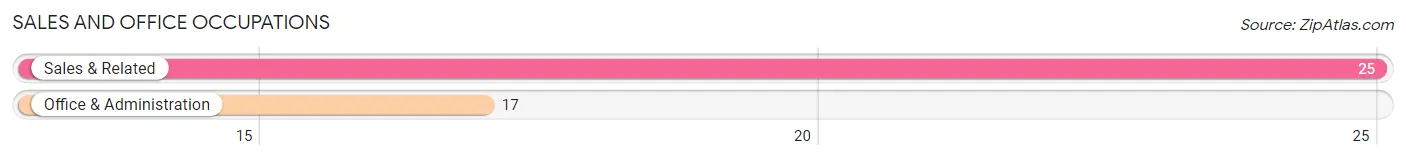
Sales and Office Occupations
The most common Sales and Office occupations in Bostic are Sales & Related (25 | 17.6%), and Office & Administration (17 | 12.0%).
Sales and Office Occupations by Sex
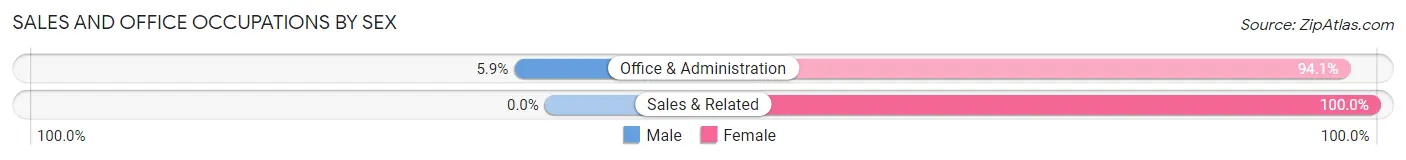
| Occupation | Male | Female |
| Sales & Related | 0 (0.0%) | 25 (100.0%) |
| Office & Administration | 1 (5.9%) | 16 (94.1%) |
| Total (Category) | 1 (2.4%) | 41 (97.6%) |
| Total (Overall) | 53 (37.3%) | 89 (62.7%) |
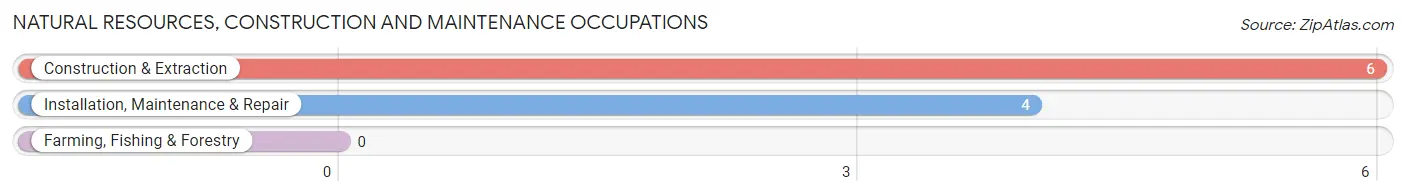
Natural Resources, Construction and Maintenance Occupations
The most common Natural Resources, Construction and Maintenance occupations in Bostic are Construction & Extraction (6 | 4.2%), and Installation, Maintenance & Repair (4 | 2.8%).
Natural Resources, Construction and Maintenance Occupations by Sex
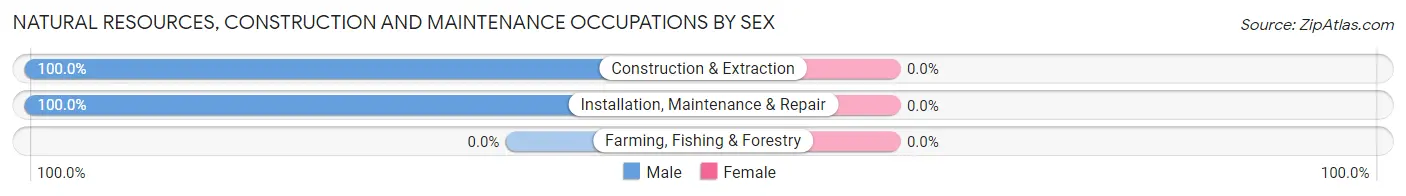
| Occupation | Male | Female |
| Farming, Fishing & Forestry | 0 (0.0%) | 0 (0.0%) |
| Construction & Extraction | 6 (100.0%) | 0 (0.0%) |
| Installation, Maintenance & Repair | 4 (100.0%) | 0 (0.0%) |
| Total (Category) | 10 (100.0%) | 0 (0.0%) |
| Total (Overall) | 53 (37.3%) | 89 (62.7%) |
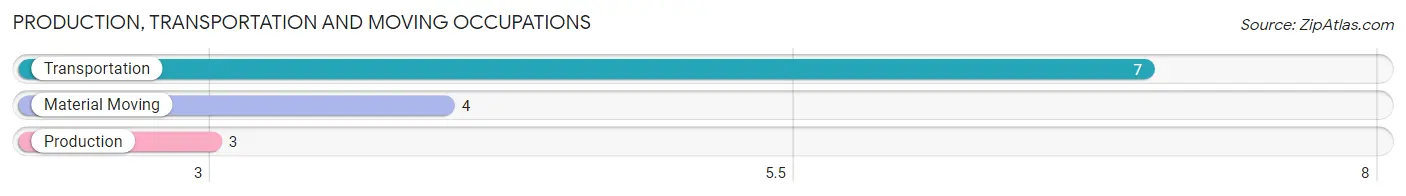
Production, Transportation and Moving Occupations
The most common Production, Transportation and Moving occupations in Bostic are Transportation (7 | 4.9%), Material Moving (4 | 2.8%), and Production (3 | 2.1%).
Production, Transportation and Moving Occupations by Sex
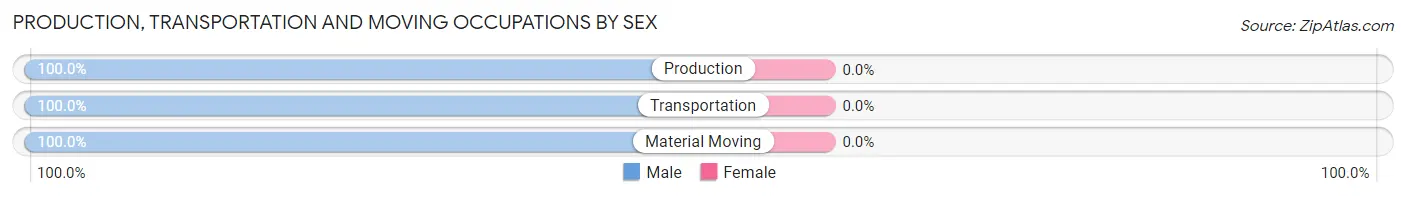
| Occupation | Male | Female |
| Production | 3 (100.0%) | 0 (0.0%) |
| Transportation | 7 (100.0%) | 0 (0.0%) |
| Material Moving | 4 (100.0%) | 0 (0.0%) |
| Total (Category) | 14 (100.0%) | 0 (0.0%) |
| Total (Overall) | 53 (37.3%) | 89 (62.7%) |
Employment Industries by Sex in Bostic
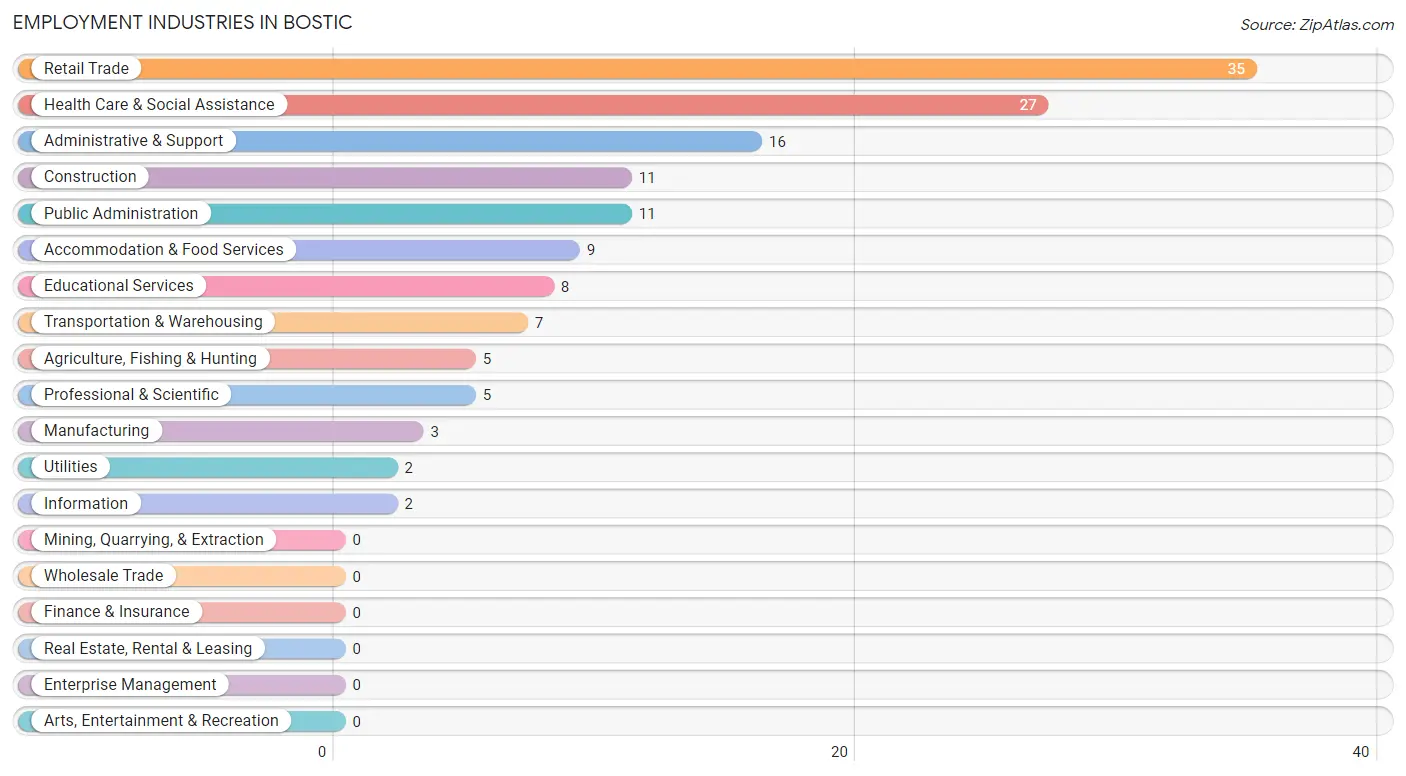
Employment Industries in Bostic
The major employment industries in Bostic include Retail Trade (35 | 24.6%), Health Care & Social Assistance (27 | 19.0%), Administrative & Support (16 | 11.3%), Construction (11 | 7.7%), and Public Administration (11 | 7.7%).
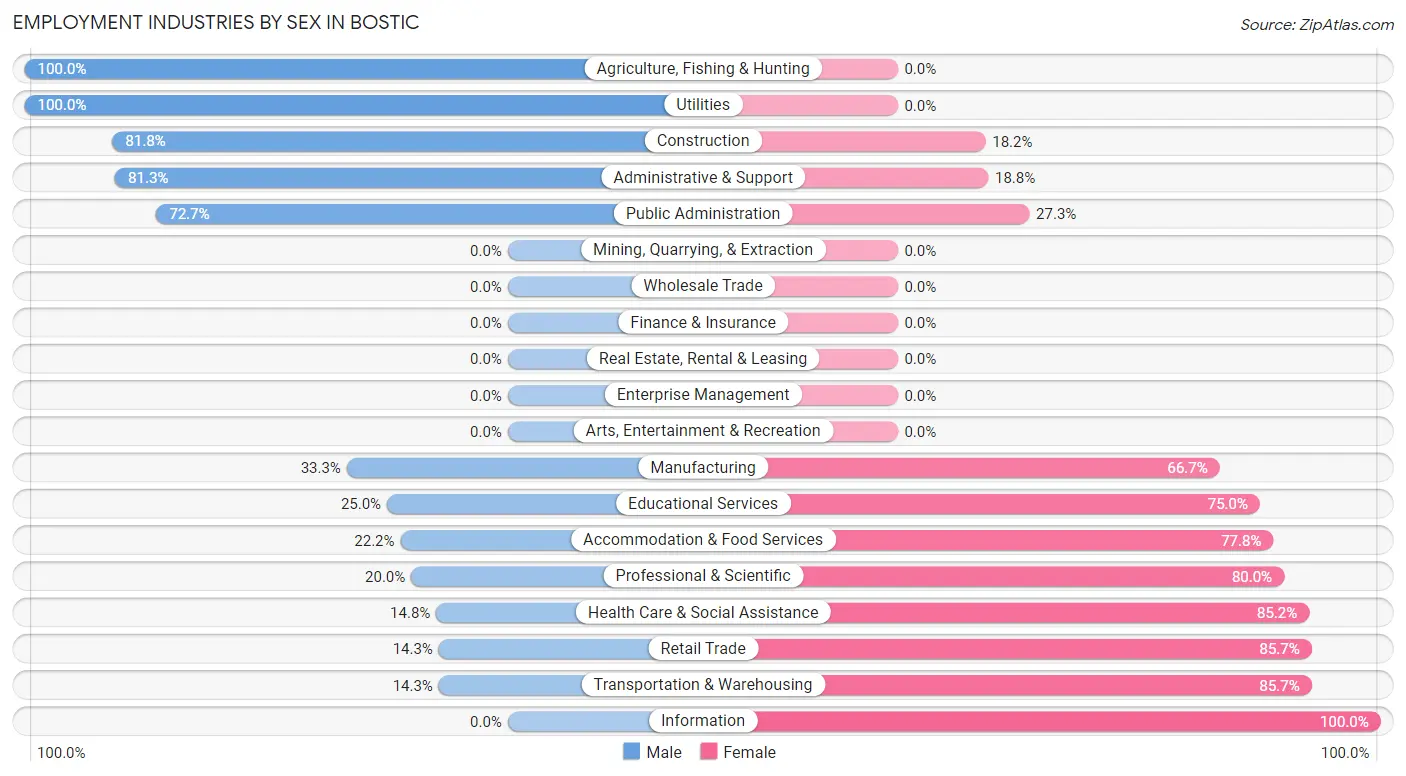
Employment Industries by Sex in Bostic
The Bostic industries that see more men than women are Agriculture, Fishing & Hunting (100.0%), Utilities (100.0%), and Construction (81.8%), whereas the industries that tend to have a higher number of women are Information (100.0%), Retail Trade (85.7%), and Transportation & Warehousing (85.7%).
| Industry | Male | Female |
| Agriculture, Fishing & Hunting | 5 (100.0%) | 0 (0.0%) |
| Mining, Quarrying, & Extraction | 0 (0.0%) | 0 (0.0%) |
| Construction | 9 (81.8%) | 2 (18.2%) |
| Manufacturing | 1 (33.3%) | 2 (66.7%) |
| Wholesale Trade | 0 (0.0%) | 0 (0.0%) |
| Retail Trade | 5 (14.3%) | 30 (85.7%) |
| Transportation & Warehousing | 1 (14.3%) | 6 (85.7%) |
| Utilities | 2 (100.0%) | 0 (0.0%) |
| Information | 0 (0.0%) | 2 (100.0%) |
| Finance & Insurance | 0 (0.0%) | 0 (0.0%) |
| Real Estate, Rental & Leasing | 0 (0.0%) | 0 (0.0%) |
| Professional & Scientific | 1 (20.0%) | 4 (80.0%) |
| Enterprise Management | 0 (0.0%) | 0 (0.0%) |
| Administrative & Support | 13 (81.2%) | 3 (18.8%) |
| Educational Services | 2 (25.0%) | 6 (75.0%) |
| Health Care & Social Assistance | 4 (14.8%) | 23 (85.2%) |
| Arts, Entertainment & Recreation | 0 (0.0%) | 0 (0.0%) |
| Accommodation & Food Services | 2 (22.2%) | 7 (77.8%) |
| Public Administration | 8 (72.7%) | 3 (27.3%) |
| Total | 53 (37.3%) | 89 (62.7%) |
Education in Bostic
School Enrollment in Bostic
The most common levels of schooling among the 62 students in Bostic are elementary school (24 | 38.7%), college / undergraduate (16 | 25.8%), and graduate / professional (9 | 14.5%).
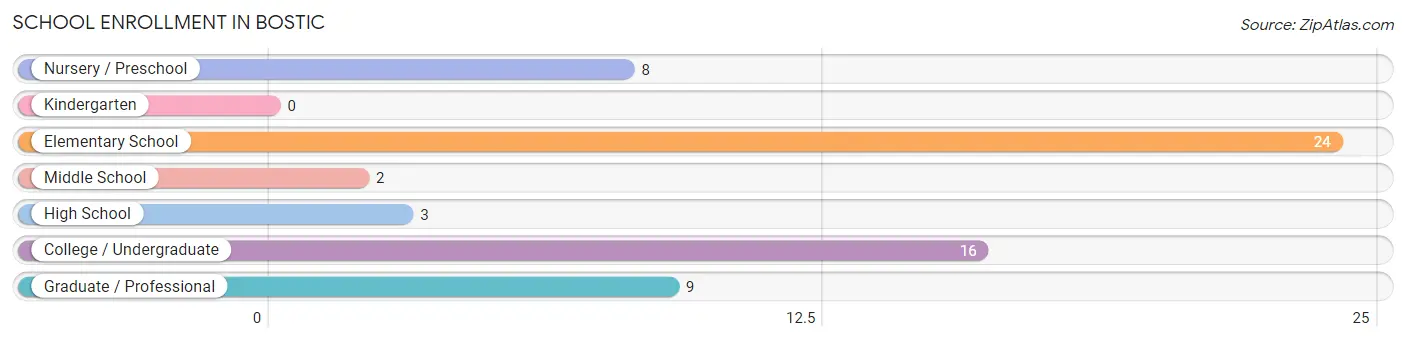
| School Level | # Students | % Students |
| Nursery / Preschool | 8 | 12.9% |
| Kindergarten | 0 | 0.0% |
| Elementary School | 24 | 38.7% |
| Middle School | 2 | 3.2% |
| High School | 3 | 4.8% |
| College / Undergraduate | 16 | 25.8% |
| Graduate / Professional | 9 | 14.5% |
| Total | 62 | 100.0% |
School Enrollment by Age by Funding Source in Bostic
Out of a total of 62 students who are enrolled in schools in Bostic, 6 (9.7%) attend a private institution, while the remaining 56 (90.3%) are enrolled in public schools. The age group of 35 years and over has the highest likelihood of being enrolled in private schools, with 4 (44.4% in the age bracket) enrolled. Conversely, the age group of 5 to 9 year old has the lowest likelihood of being enrolled in a private school, with 21 (100.0% in the age bracket) attending a public institution.
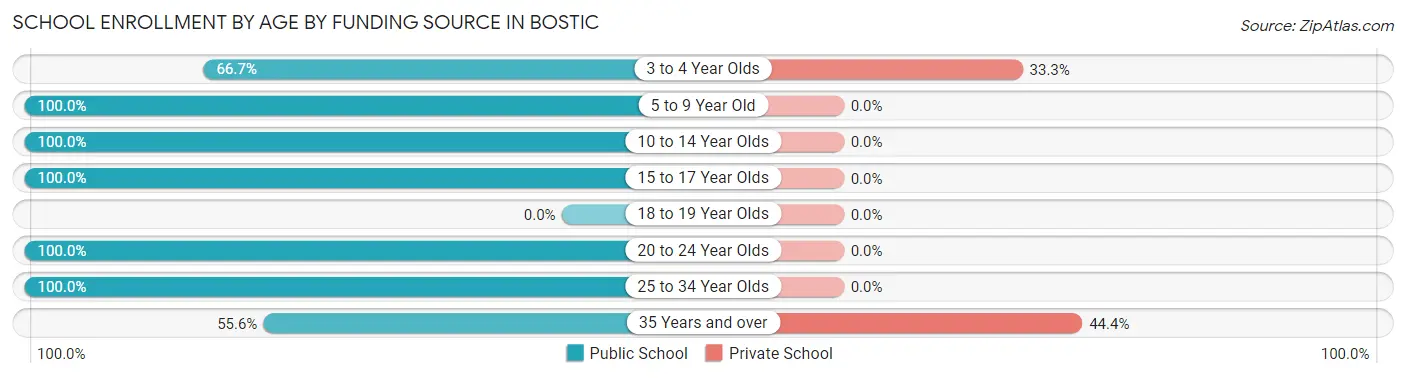
| Age Bracket | Public School | Private School |
| 3 to 4 Year Olds | 4 (66.7%) | 2 (33.3%) |
| 5 to 9 Year Old | 21 (100.0%) | 0 (0.0%) |
| 10 to 14 Year Olds | 7 (100.0%) | 0 (0.0%) |
| 15 to 17 Year Olds | 3 (100.0%) | 0 (0.0%) |
| 18 to 19 Year Olds | 0 (0.0%) | 0 (0.0%) |
| 20 to 24 Year Olds | 14 (100.0%) | 0 (0.0%) |
| 25 to 34 Year Olds | 2 (100.0%) | 0 (0.0%) |
| 35 Years and over | 5 (55.6%) | 4 (44.4%) |
| Total | 56 (90.3%) | 6 (9.7%) |
Educational Attainment by Field of Study in Bostic
Arts & humanities (9 | 19.6%), education (8 | 17.4%), psychology (5 | 10.9%), science & technology (5 | 10.9%), and visual & performing arts (5 | 10.9%) are the most common fields of study among 46 individuals in Bostic who have obtained a bachelor's degree or higher.
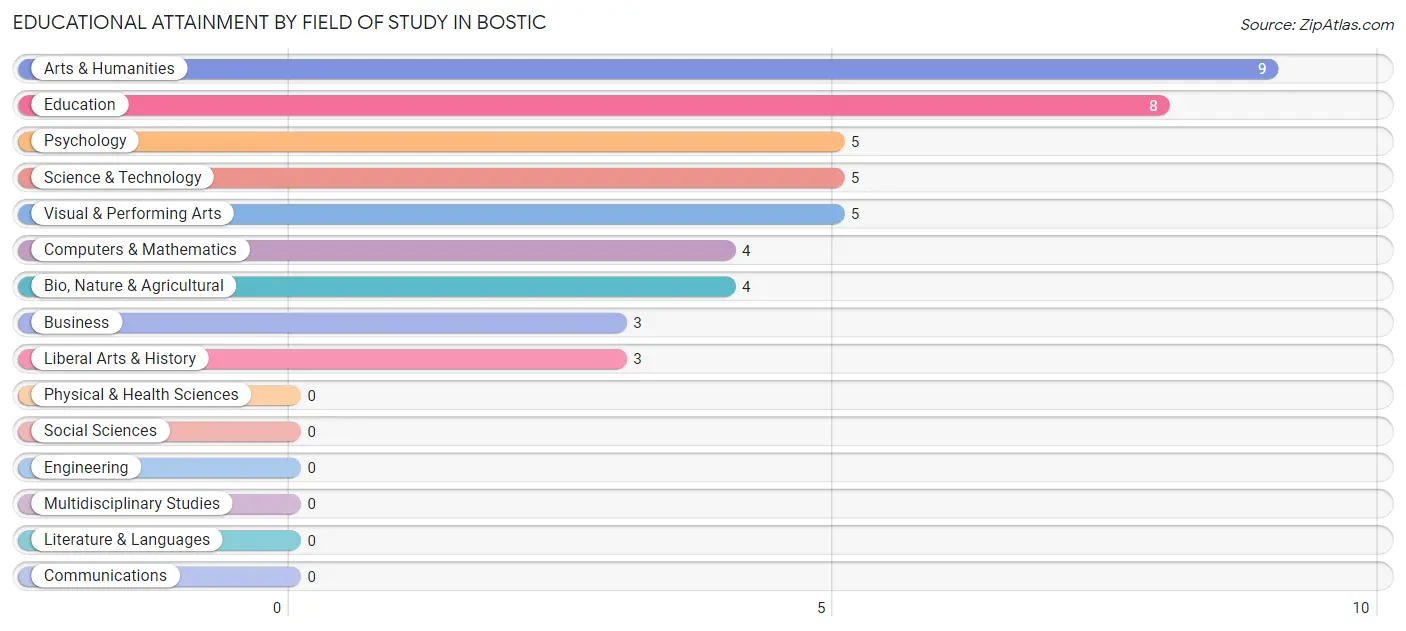
| Field of Study | # Graduates | % Graduates |
| Computers & Mathematics | 4 | 8.7% |
| Bio, Nature & Agricultural | 4 | 8.7% |
| Physical & Health Sciences | 0 | 0.0% |
| Psychology | 5 | 10.9% |
| Social Sciences | 0 | 0.0% |
| Engineering | 0 | 0.0% |
| Multidisciplinary Studies | 0 | 0.0% |
| Science & Technology | 5 | 10.9% |
| Business | 3 | 6.5% |
| Education | 8 | 17.4% |
| Literature & Languages | 0 | 0.0% |
| Liberal Arts & History | 3 | 6.5% |
| Visual & Performing Arts | 5 | 10.9% |
| Communications | 0 | 0.0% |
| Arts & Humanities | 9 | 19.6% |
| Total | 46 | 100.0% |
Transportation & Commute in Bostic
Vehicle Availability by Sex in Bostic
The most prevalent vehicle ownership categories in Bostic are males with 2 vehicles (16, accounting for 36.4%) and females with 2 vehicles (29, making up 18.0%).
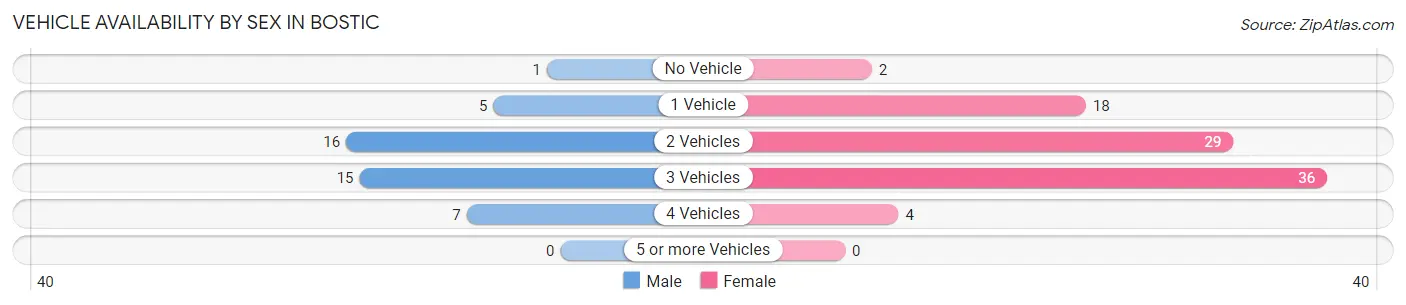
| Vehicles Available | Male | Female |
| No Vehicle | 1 (2.3%) | 2 (2.2%) |
| 1 Vehicle | 5 (11.4%) | 18 (20.2%) |
| 2 Vehicles | 16 (36.4%) | 29 (32.6%) |
| 3 Vehicles | 15 (34.1%) | 36 (40.5%) |
| 4 Vehicles | 7 (15.9%) | 4 (4.5%) |
| 5 or more Vehicles | 0 (0.0%) | 0 (0.0%) |
| Total | 44 (100.0%) | 89 (100.0%) |
Commute Time in Bostic
The most frequently occuring commute durations in Bostic are 15 to 19 minutes (38 commuters, 29.5%), 10 to 14 minutes (25 commuters, 19.4%), and 60 to 89 minutes (14 commuters, 10.8%).
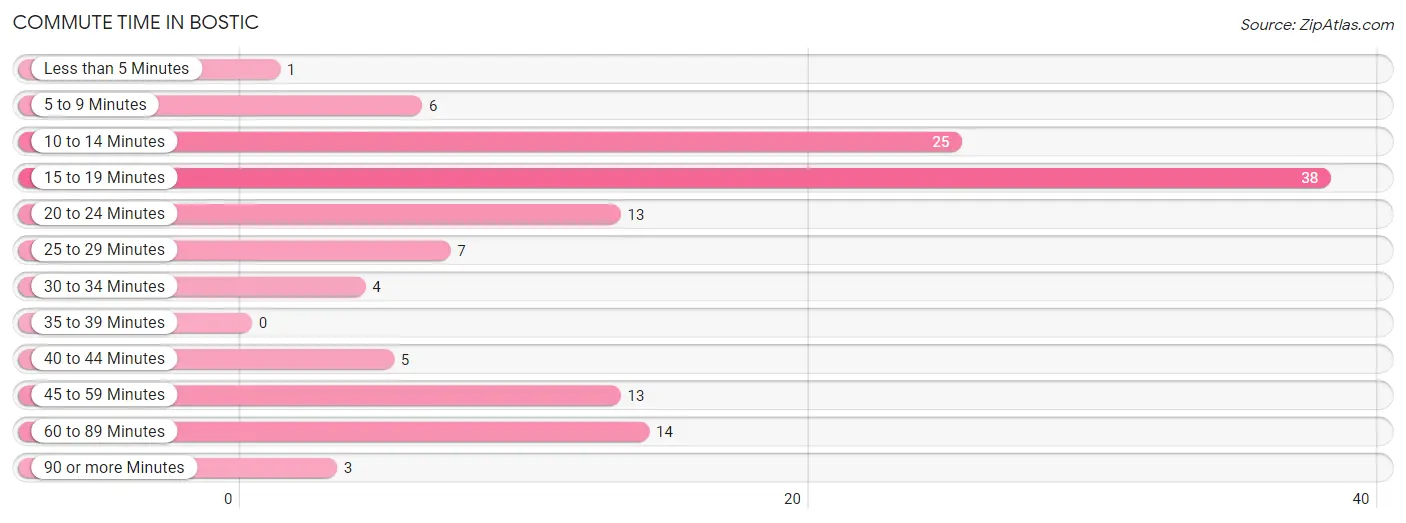
| Commute Time | # Commuters | % Commuters |
| Less than 5 Minutes | 1 | 0.8% |
| 5 to 9 Minutes | 6 | 4.6% |
| 10 to 14 Minutes | 25 | 19.4% |
| 15 to 19 Minutes | 38 | 29.5% |
| 20 to 24 Minutes | 13 | 10.1% |
| 25 to 29 Minutes | 7 | 5.4% |
| 30 to 34 Minutes | 4 | 3.1% |
| 35 to 39 Minutes | 0 | 0.0% |
| 40 to 44 Minutes | 5 | 3.9% |
| 45 to 59 Minutes | 13 | 10.1% |
| 60 to 89 Minutes | 14 | 10.8% |
| 90 or more Minutes | 3 | 2.3% |
Commute Time by Sex in Bostic
The most common commute times in Bostic are 10 to 14 minutes (15 commuters, 35.7%) for males and 15 to 19 minutes (30 commuters, 34.5%) for females.
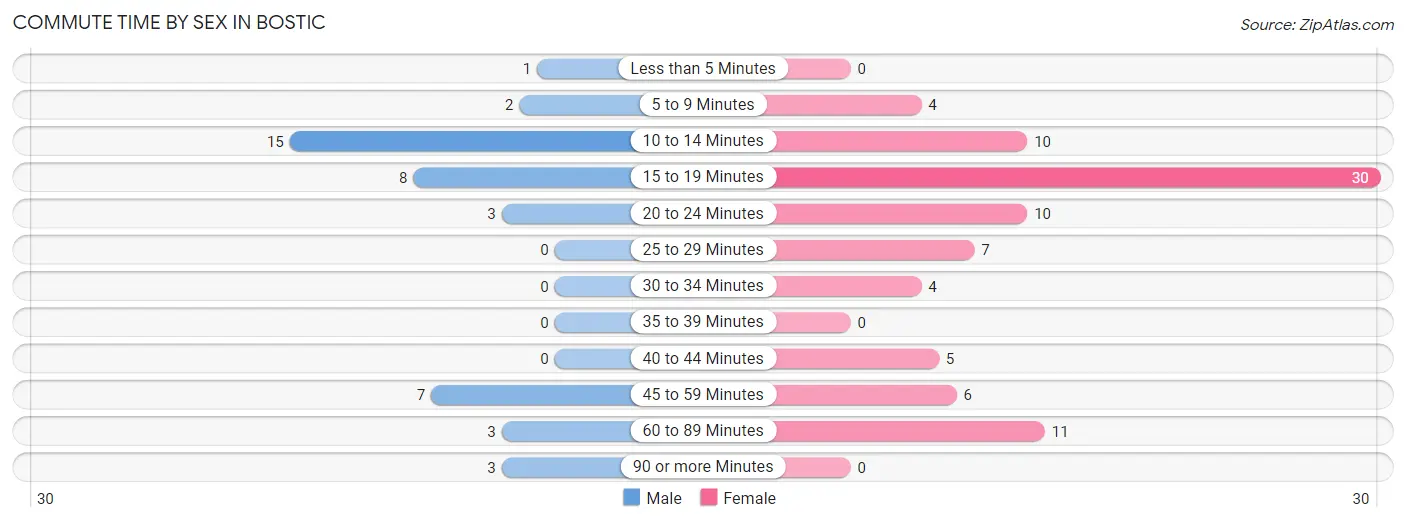
| Commute Time | Male | Female |
| Less than 5 Minutes | 1 (2.4%) | 0 (0.0%) |
| 5 to 9 Minutes | 2 (4.8%) | 4 (4.6%) |
| 10 to 14 Minutes | 15 (35.7%) | 10 (11.5%) |
| 15 to 19 Minutes | 8 (19.1%) | 30 (34.5%) |
| 20 to 24 Minutes | 3 (7.1%) | 10 (11.5%) |
| 25 to 29 Minutes | 0 (0.0%) | 7 (8.1%) |
| 30 to 34 Minutes | 0 (0.0%) | 4 (4.6%) |
| 35 to 39 Minutes | 0 (0.0%) | 0 (0.0%) |
| 40 to 44 Minutes | 0 (0.0%) | 5 (5.8%) |
| 45 to 59 Minutes | 7 (16.7%) | 6 (6.9%) |
| 60 to 89 Minutes | 3 (7.1%) | 11 (12.6%) |
| 90 or more Minutes | 3 (7.1%) | 0 (0.0%) |
Time of Departure to Work by Sex in Bostic
The most frequent times of departure to work in Bostic are 8:00 AM to 8:29 AM (9, 21.4%) for males and 7:00 AM to 7:29 AM (25, 28.7%) for females.
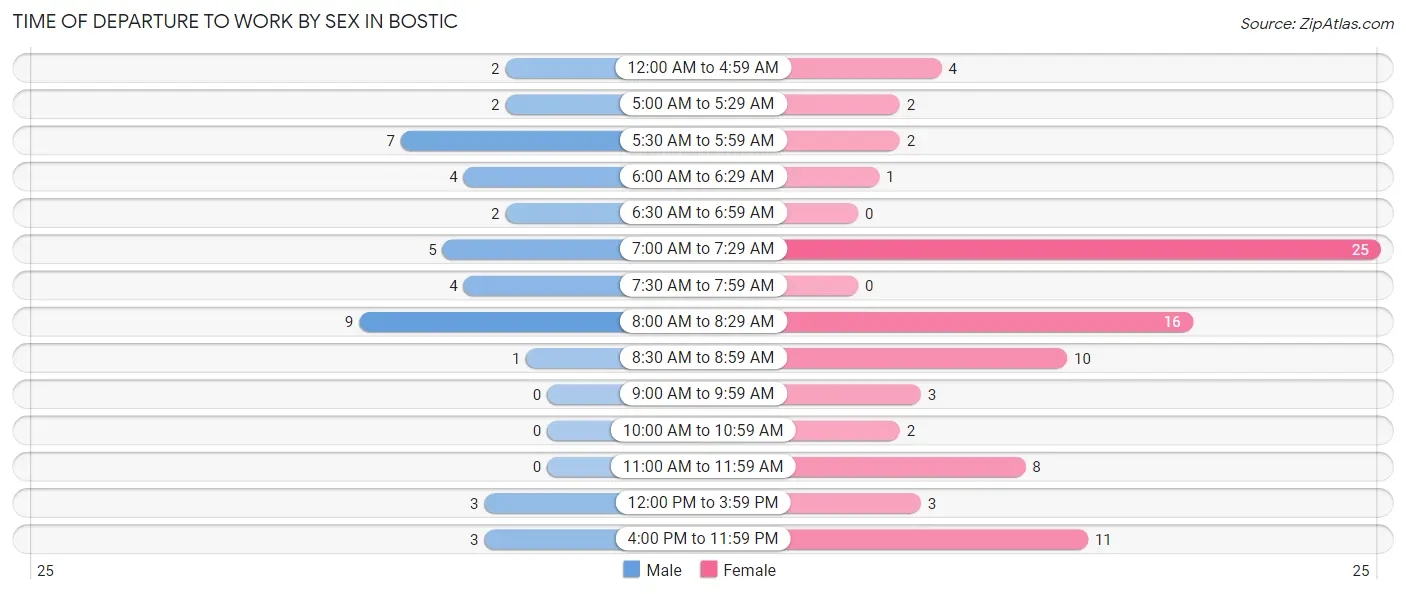
| Time of Departure | Male | Female |
| 12:00 AM to 4:59 AM | 2 (4.8%) | 4 (4.6%) |
| 5:00 AM to 5:29 AM | 2 (4.8%) | 2 (2.3%) |
| 5:30 AM to 5:59 AM | 7 (16.7%) | 2 (2.3%) |
| 6:00 AM to 6:29 AM | 4 (9.5%) | 1 (1.1%) |
| 6:30 AM to 6:59 AM | 2 (4.8%) | 0 (0.0%) |
| 7:00 AM to 7:29 AM | 5 (11.9%) | 25 (28.7%) |
| 7:30 AM to 7:59 AM | 4 (9.5%) | 0 (0.0%) |
| 8:00 AM to 8:29 AM | 9 (21.4%) | 16 (18.4%) |
| 8:30 AM to 8:59 AM | 1 (2.4%) | 10 (11.5%) |
| 9:00 AM to 9:59 AM | 0 (0.0%) | 3 (3.5%) |
| 10:00 AM to 10:59 AM | 0 (0.0%) | 2 (2.3%) |
| 11:00 AM to 11:59 AM | 0 (0.0%) | 8 (9.2%) |
| 12:00 PM to 3:59 PM | 3 (7.1%) | 3 (3.5%) |
| 4:00 PM to 11:59 PM | 3 (7.1%) | 11 (12.6%) |
| Total | 42 (100.0%) | 87 (100.0%) |
Housing Occupancy in Bostic
Occupancy by Ownership in Bostic
Of the total 144 dwellings in Bostic, owner-occupied units account for 99 (68.8%), while renter-occupied units make up 45 (31.2%).
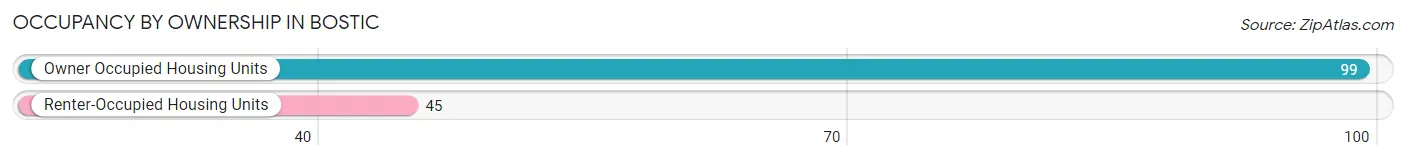
| Occupancy | # Housing Units | % Housing Units |
| Owner Occupied Housing Units | 99 | 68.8% |
| Renter-Occupied Housing Units | 45 | 31.2% |
| Total Occupied Housing Units | 144 | 100.0% |
Occupancy by Household Size in Bostic
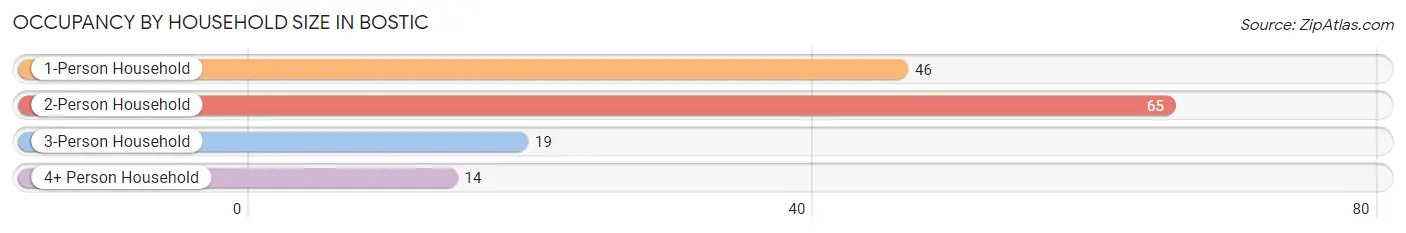
| Household Size | # Housing Units | % Housing Units |
| 1-Person Household | 46 | 31.9% |
| 2-Person Household | 65 | 45.1% |
| 3-Person Household | 19 | 13.2% |
| 4+ Person Household | 14 | 9.7% |
| Total Housing Units | 144 | 100.0% |
Occupancy by Ownership by Household Size in Bostic
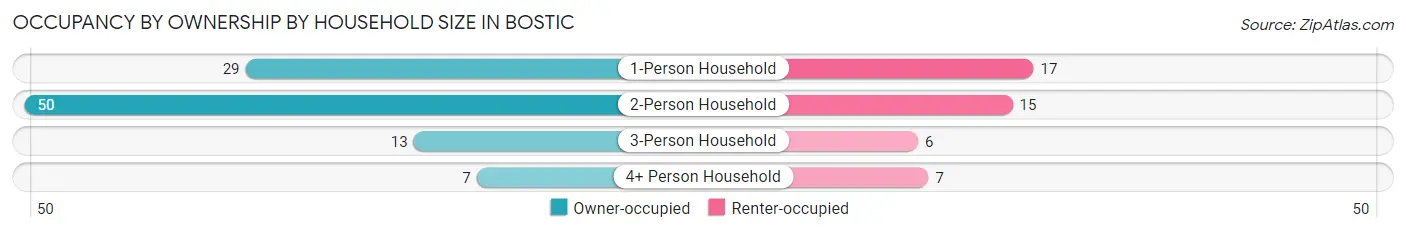
| Household Size | Owner-occupied | Renter-occupied |
| 1-Person Household | 29 (63.0%) | 17 (37.0%) |
| 2-Person Household | 50 (76.9%) | 15 (23.1%) |
| 3-Person Household | 13 (68.4%) | 6 (31.6%) |
| 4+ Person Household | 7 (50.0%) | 7 (50.0%) |
| Total Housing Units | 99 (68.8%) | 45 (31.2%) |
Occupancy by Educational Attainment in Bostic
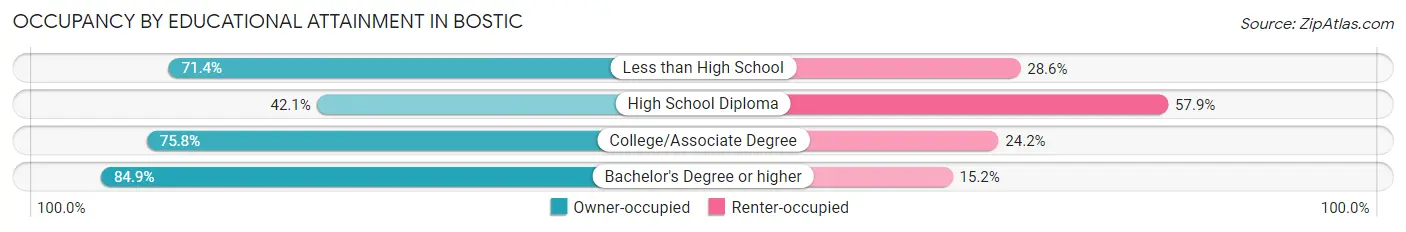
| Household Size | Owner-occupied | Renter-occupied |
| Less than High School | 5 (71.4%) | 2 (28.6%) |
| High School Diploma | 16 (42.1%) | 22 (57.9%) |
| College/Associate Degree | 50 (75.8%) | 16 (24.2%) |
| Bachelor's Degree or higher | 28 (84.9%) | 5 (15.1%) |
Occupancy by Age of Householder in Bostic
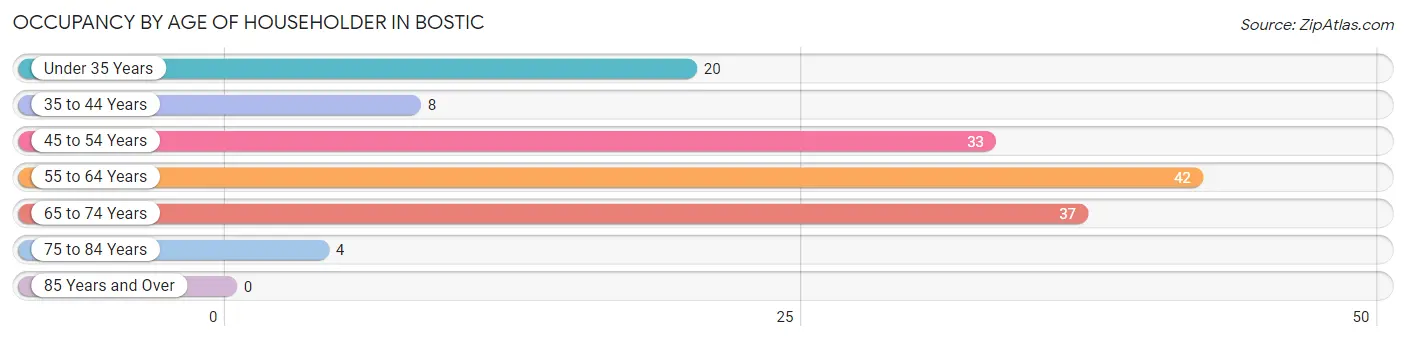
| Age Bracket | # Households | % Households |
| Under 35 Years | 20 | 13.9% |
| 35 to 44 Years | 8 | 5.6% |
| 45 to 54 Years | 33 | 22.9% |
| 55 to 64 Years | 42 | 29.2% |
| 65 to 74 Years | 37 | 25.7% |
| 75 to 84 Years | 4 | 2.8% |
| 85 Years and Over | 0 | 0.0% |
| Total | 144 | 100.0% |
Housing Finances in Bostic
Median Income by Occupancy in Bostic
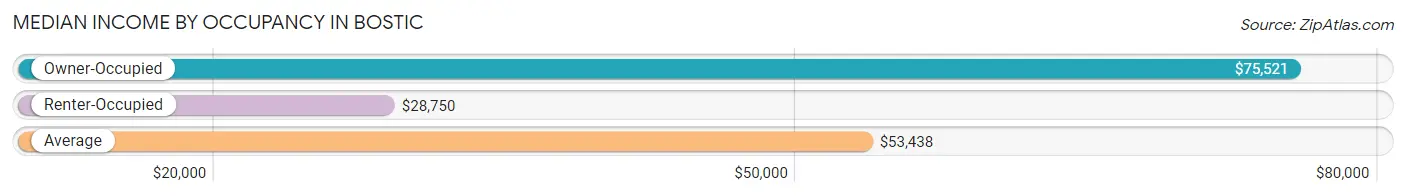
| Occupancy Type | # Households | Median Income |
| Owner-Occupied | 99 (68.8%) | $75,521 |
| Renter-Occupied | 45 (31.2%) | $28,750 |
| Average | 144 (100.0%) | $53,438 |
Occupancy by Householder Income Bracket in Bostic
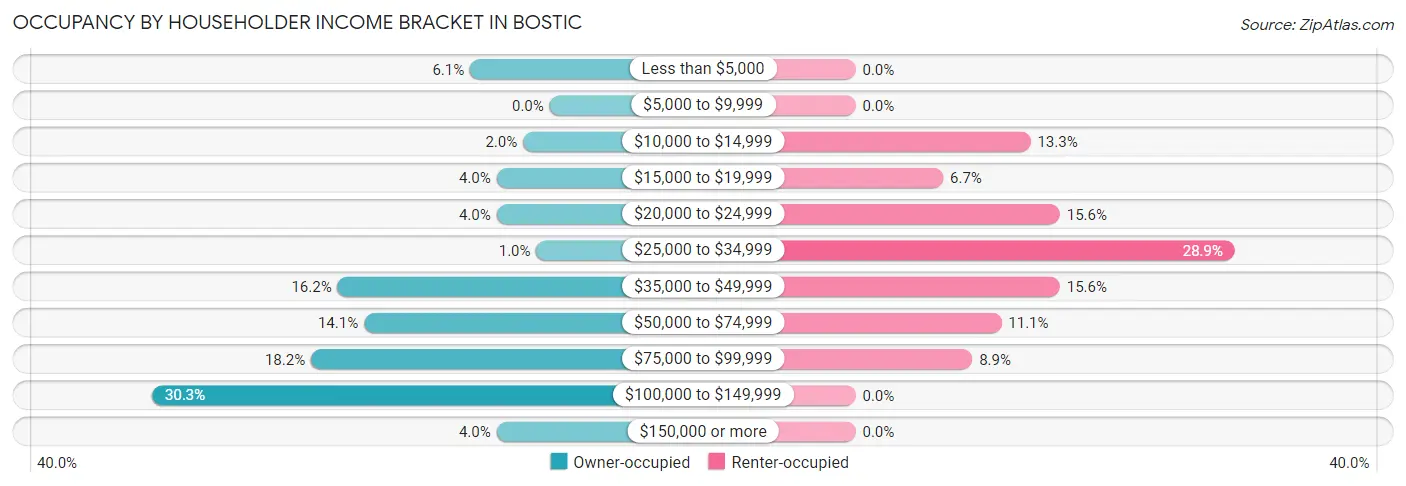
| Income Bracket | Owner-occupied | Renter-occupied |
| Less than $5,000 | 6 (6.1%) | 0 (0.0%) |
| $5,000 to $9,999 | 0 (0.0%) | 0 (0.0%) |
| $10,000 to $14,999 | 2 (2.0%) | 6 (13.3%) |
| $15,000 to $19,999 | 4 (4.0%) | 3 (6.7%) |
| $20,000 to $24,999 | 4 (4.0%) | 7 (15.6%) |
| $25,000 to $34,999 | 1 (1.0%) | 13 (28.9%) |
| $35,000 to $49,999 | 16 (16.2%) | 7 (15.6%) |
| $50,000 to $74,999 | 14 (14.1%) | 5 (11.1%) |
| $75,000 to $99,999 | 18 (18.2%) | 4 (8.9%) |
| $100,000 to $149,999 | 30 (30.3%) | 0 (0.0%) |
| $150,000 or more | 4 (4.0%) | 0 (0.0%) |
| Total | 99 (100.0%) | 45 (100.0%) |
Monthly Housing Cost Tiers in Bostic
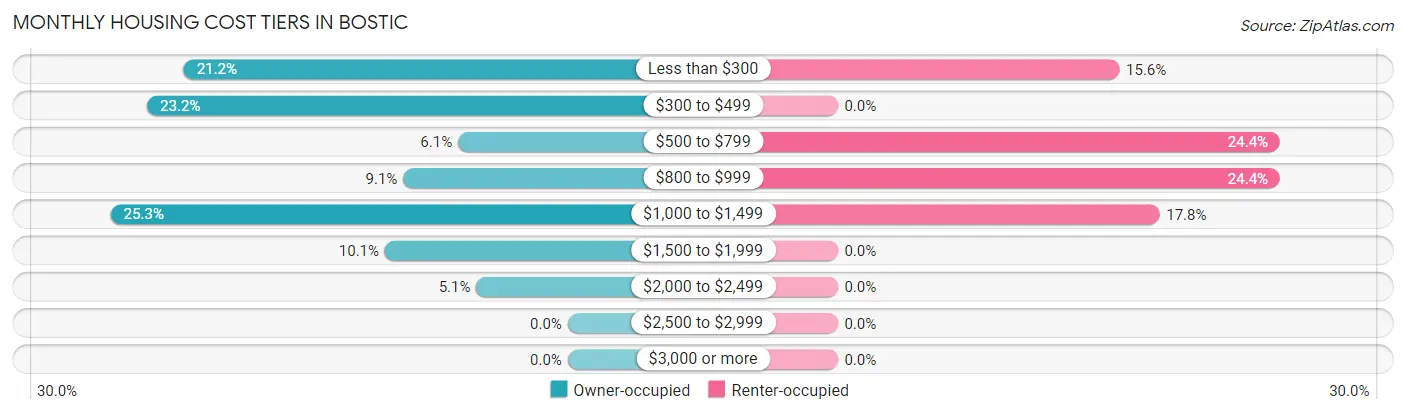
| Monthly Cost | Owner-occupied | Renter-occupied |
| Less than $300 | 21 (21.2%) | 7 (15.6%) |
| $300 to $499 | 23 (23.2%) | 0 (0.0%) |
| $500 to $799 | 6 (6.1%) | 11 (24.4%) |
| $800 to $999 | 9 (9.1%) | 11 (24.4%) |
| $1,000 to $1,499 | 25 (25.3%) | 8 (17.8%) |
| $1,500 to $1,999 | 10 (10.1%) | 0 (0.0%) |
| $2,000 to $2,499 | 5 (5.1%) | 0 (0.0%) |
| $2,500 to $2,999 | 0 (0.0%) | 0 (0.0%) |
| $3,000 or more | 0 (0.0%) | 0 (0.0%) |
| Total | 99 (100.0%) | 45 (100.0%) |
Physical Housing Characteristics in Bostic
Housing Structures in Bostic
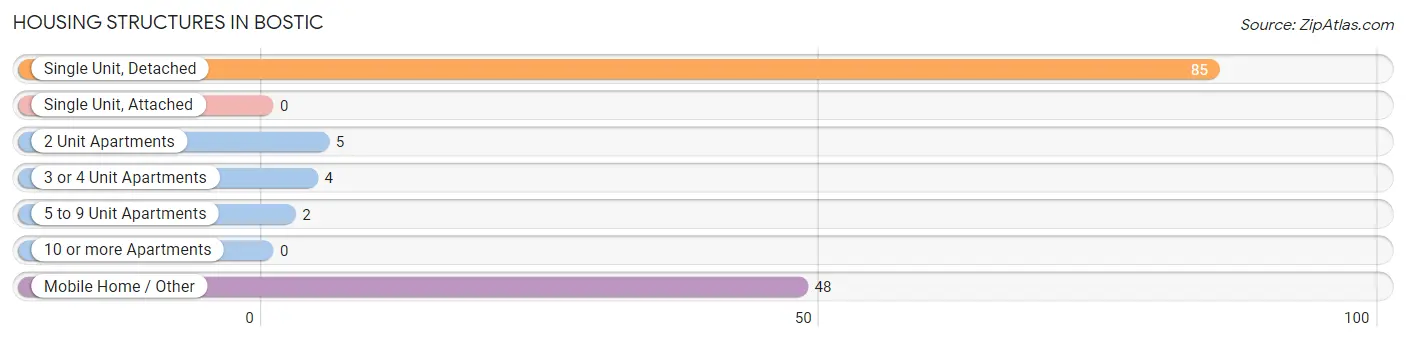
| Structure Type | # Housing Units | % Housing Units |
| Single Unit, Detached | 85 | 59.0% |
| Single Unit, Attached | 0 | 0.0% |
| 2 Unit Apartments | 5 | 3.5% |
| 3 or 4 Unit Apartments | 4 | 2.8% |
| 5 to 9 Unit Apartments | 2 | 1.4% |
| 10 or more Apartments | 0 | 0.0% |
| Mobile Home / Other | 48 | 33.3% |
| Total | 144 | 100.0% |
Housing Structures by Occupancy in Bostic
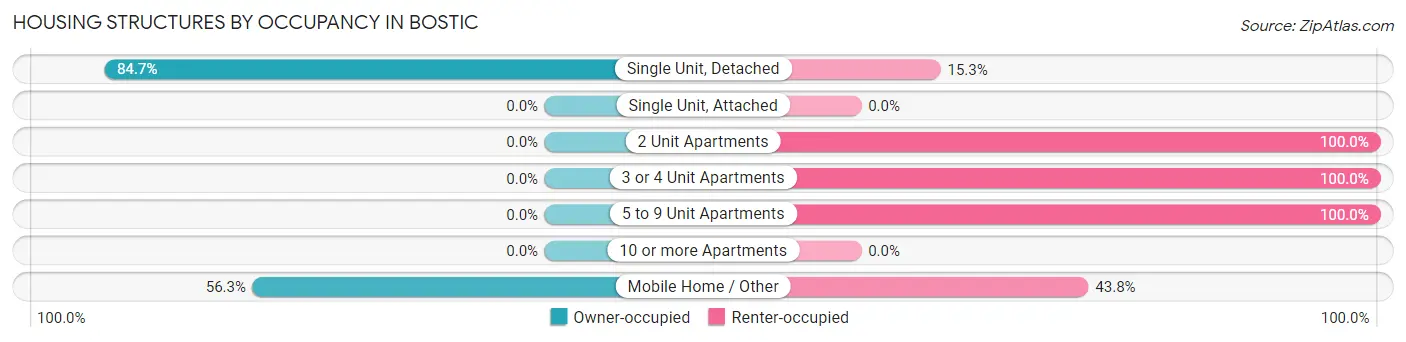
| Structure Type | Owner-occupied | Renter-occupied |
| Single Unit, Detached | 72 (84.7%) | 13 (15.3%) |
| Single Unit, Attached | 0 (0.0%) | 0 (0.0%) |
| 2 Unit Apartments | 0 (0.0%) | 5 (100.0%) |
| 3 or 4 Unit Apartments | 0 (0.0%) | 4 (100.0%) |
| 5 to 9 Unit Apartments | 0 (0.0%) | 2 (100.0%) |
| 10 or more Apartments | 0 (0.0%) | 0 (0.0%) |
| Mobile Home / Other | 27 (56.2%) | 21 (43.8%) |
| Total | 99 (68.8%) | 45 (31.2%) |
Housing Structures by Number of Rooms in Bostic
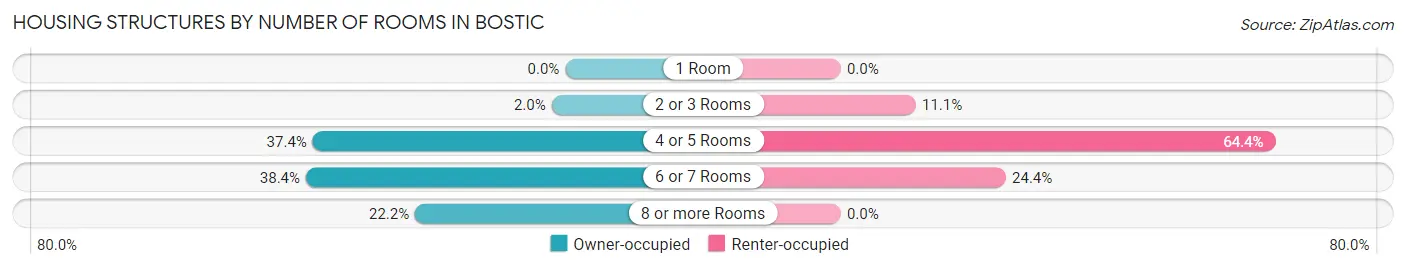
| Number of Rooms | Owner-occupied | Renter-occupied |
| 1 Room | 0 (0.0%) | 0 (0.0%) |
| 2 or 3 Rooms | 2 (2.0%) | 5 (11.1%) |
| 4 or 5 Rooms | 37 (37.4%) | 29 (64.4%) |
| 6 or 7 Rooms | 38 (38.4%) | 11 (24.4%) |
| 8 or more Rooms | 22 (22.2%) | 0 (0.0%) |
| Total | 99 (100.0%) | 45 (100.0%) |
Housing Structure by Heating Type in Bostic
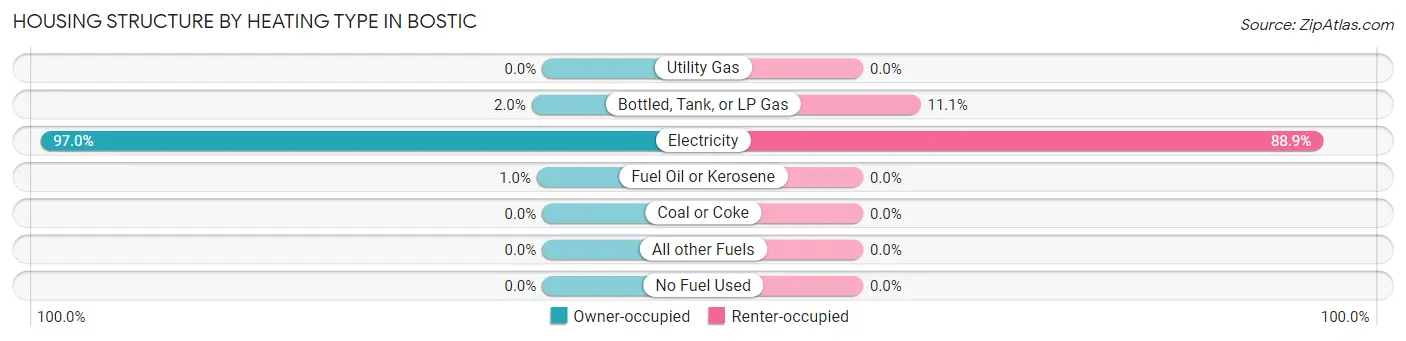
| Heating Type | Owner-occupied | Renter-occupied |
| Utility Gas | 0 (0.0%) | 0 (0.0%) |
| Bottled, Tank, or LP Gas | 2 (2.0%) | 5 (11.1%) |
| Electricity | 96 (97.0%) | 40 (88.9%) |
| Fuel Oil or Kerosene | 1 (1.0%) | 0 (0.0%) |
| Coal or Coke | 0 (0.0%) | 0 (0.0%) |
| All other Fuels | 0 (0.0%) | 0 (0.0%) |
| No Fuel Used | 0 (0.0%) | 0 (0.0%) |
| Total | 99 (100.0%) | 45 (100.0%) |
Household Vehicle Usage in Bostic
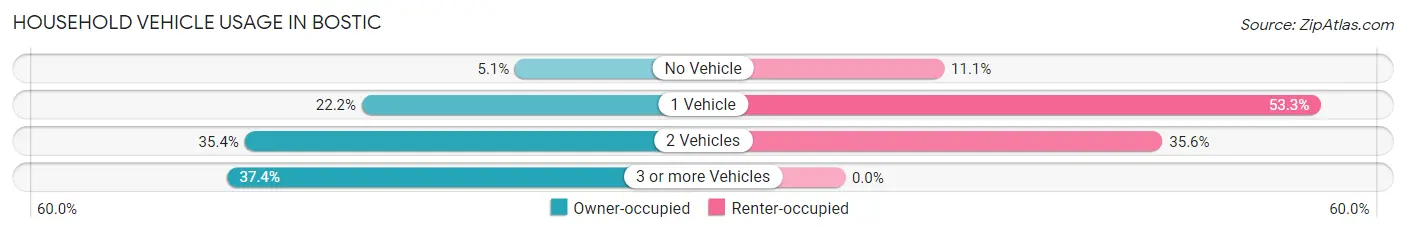
| Vehicles per Household | Owner-occupied | Renter-occupied |
| No Vehicle | 5 (5.1%) | 5 (11.1%) |
| 1 Vehicle | 22 (22.2%) | 24 (53.3%) |
| 2 Vehicles | 35 (35.3%) | 16 (35.6%) |
| 3 or more Vehicles | 37 (37.4%) | 0 (0.0%) |
| Total | 99 (100.0%) | 45 (100.0%) |
Real Estate & Mortgages in Bostic
Real Estate and Mortgage Overview in Bostic
| Characteristic | Without Mortgage | With Mortgage |
| Housing Units | 42 | 57 |
| Median Property Value | $107,400 | $177,700 |
| Median Household Income | $61,250 | $4 |
| Monthly Housing Costs | $300 | $0 |
| Real Estate Taxes | $680 | $0 |
Property Value by Mortgage Status in Bostic
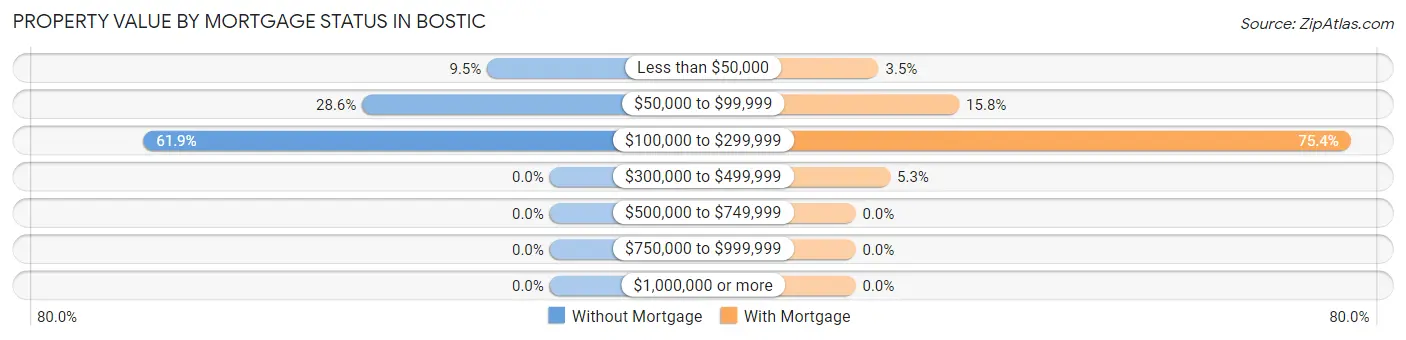
| Property Value | Without Mortgage | With Mortgage |
| Less than $50,000 | 4 (9.5%) | 2 (3.5%) |
| $50,000 to $99,999 | 12 (28.6%) | 9 (15.8%) |
| $100,000 to $299,999 | 26 (61.9%) | 43 (75.4%) |
| $300,000 to $499,999 | 0 (0.0%) | 3 (5.3%) |
| $500,000 to $749,999 | 0 (0.0%) | 0 (0.0%) |
| $750,000 to $999,999 | 0 (0.0%) | 0 (0.0%) |
| $1,000,000 or more | 0 (0.0%) | 0 (0.0%) |
| Total | 42 (100.0%) | 57 (100.0%) |
Household Income by Mortgage Status in Bostic
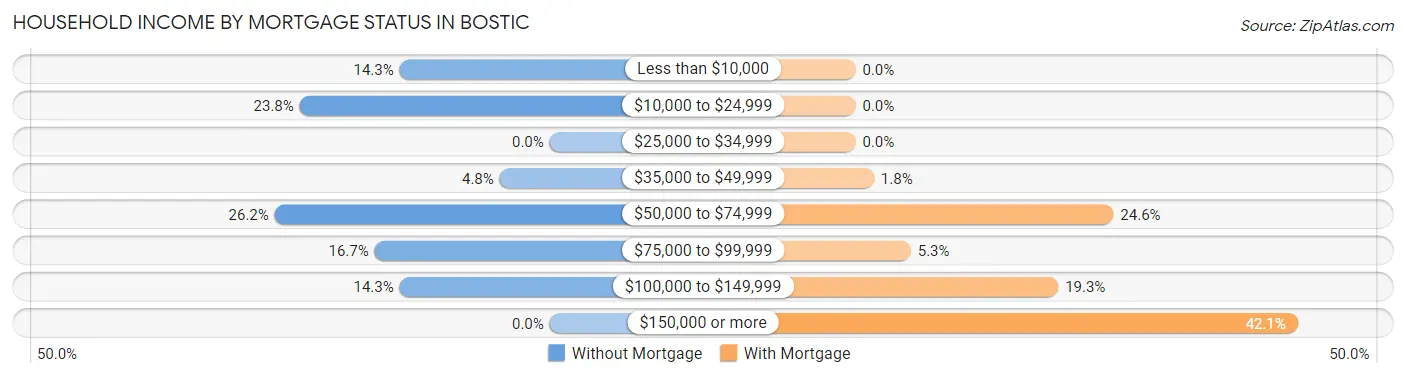
| Household Income | Without Mortgage | With Mortgage |
| Less than $10,000 | 6 (14.3%) | 0 (0.0%) |
| $10,000 to $24,999 | 10 (23.8%) | 0 (0.0%) |
| $25,000 to $34,999 | 0 (0.0%) | 0 (0.0%) |
| $35,000 to $49,999 | 2 (4.8%) | 1 (1.8%) |
| $50,000 to $74,999 | 11 (26.2%) | 14 (24.6%) |
| $75,000 to $99,999 | 7 (16.7%) | 3 (5.3%) |
| $100,000 to $149,999 | 6 (14.3%) | 11 (19.3%) |
| $150,000 or more | 0 (0.0%) | 24 (42.1%) |
| Total | 42 (100.0%) | 57 (100.0%) |
Property Value to Household Income Ratio in Bostic
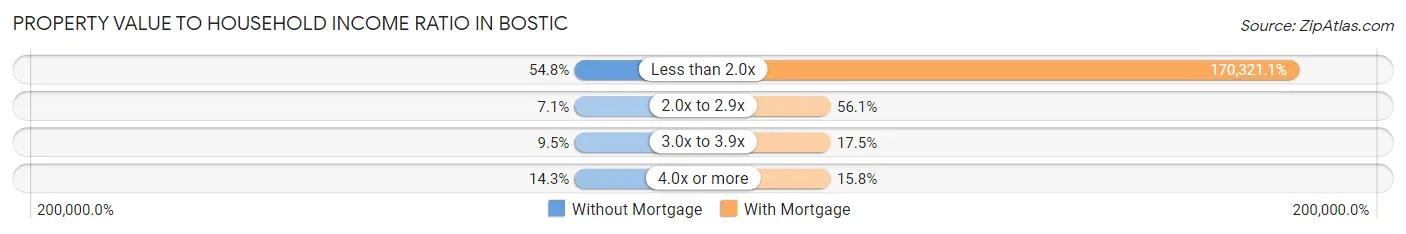
| Value-to-Income Ratio | Without Mortgage | With Mortgage |
| Less than 2.0x | 23 (54.8%) | 97,083 (170,321.0%) |
| 2.0x to 2.9x | 3 (7.1%) | 32 (56.1%) |
| 3.0x to 3.9x | 4 (9.5%) | 10 (17.5%) |
| 4.0x or more | 6 (14.3%) | 9 (15.8%) |
| Total | 42 (100.0%) | 57 (100.0%) |
Real Estate Taxes by Mortgage Status in Bostic
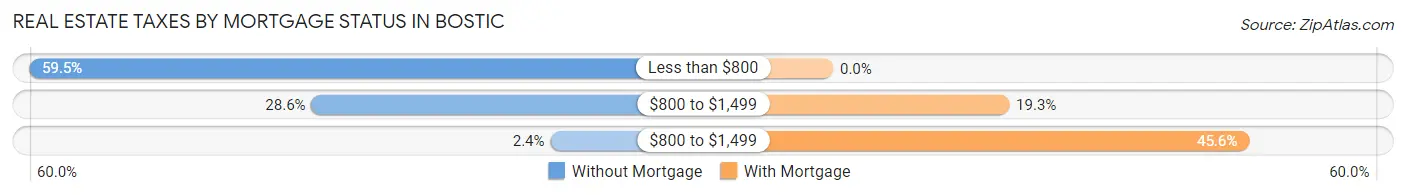
| Property Taxes | Without Mortgage | With Mortgage |
| Less than $800 | 25 (59.5%) | 0 (0.0%) |
| $800 to $1,499 | 12 (28.6%) | 11 (19.3%) |
| $800 to $1,499 | 1 (2.4%) | 26 (45.6%) |
| Total | 42 (100.0%) | 57 (100.0%) |
Health & Disability in Bostic
Health Insurance Coverage by Age in Bostic
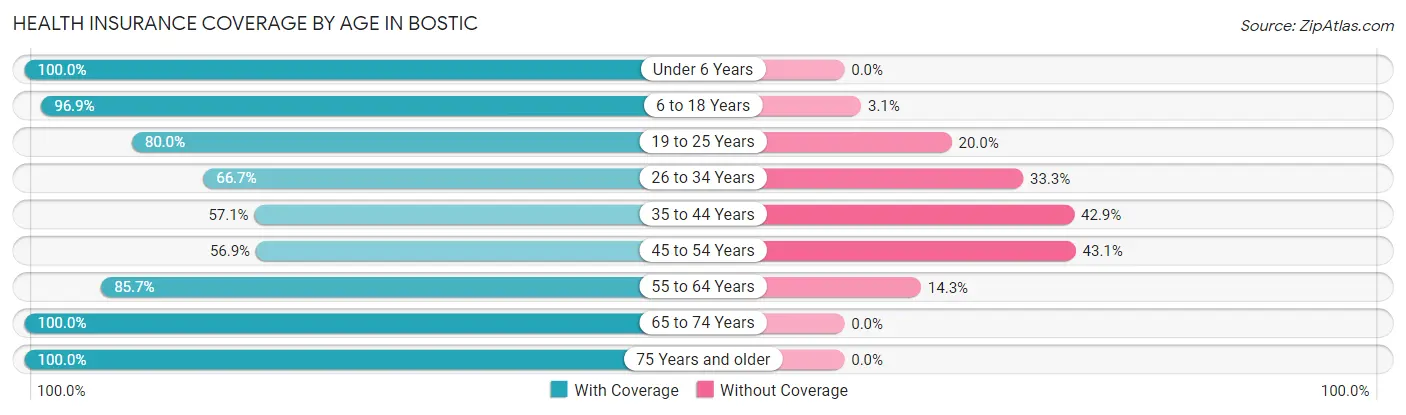
| Age Bracket | With Coverage | Without Coverage |
| Under 6 Years | 22 (100.0%) | 0 (0.0%) |
| 6 to 18 Years | 31 (96.9%) | 1 (3.1%) |
| 19 to 25 Years | 16 (80.0%) | 4 (20.0%) |
| 26 to 34 Years | 26 (66.7%) | 13 (33.3%) |
| 35 to 44 Years | 12 (57.1%) | 9 (42.9%) |
| 45 to 54 Years | 29 (56.9%) | 22 (43.1%) |
| 55 to 64 Years | 48 (85.7%) | 8 (14.3%) |
| 65 to 74 Years | 50 (100.0%) | 0 (0.0%) |
| 75 Years and older | 13 (100.0%) | 0 (0.0%) |
| Total | 247 (81.2%) | 57 (18.8%) |
Health Insurance Coverage by Citizenship Status in Bostic
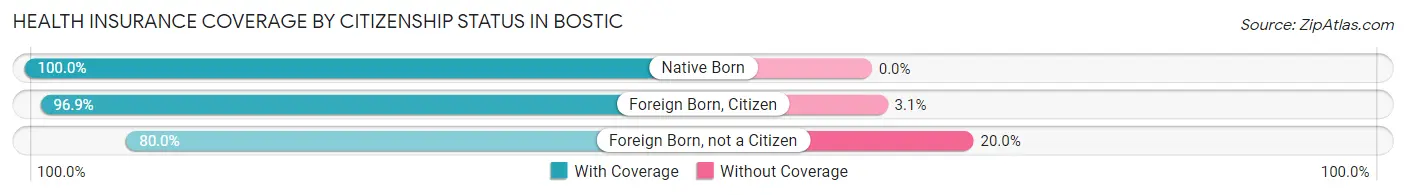
| Citizenship Status | With Coverage | Without Coverage |
| Native Born | 22 (100.0%) | 0 (0.0%) |
| Foreign Born, Citizen | 31 (96.9%) | 1 (3.1%) |
| Foreign Born, not a Citizen | 16 (80.0%) | 4 (20.0%) |
Health Insurance Coverage by Household Income in Bostic
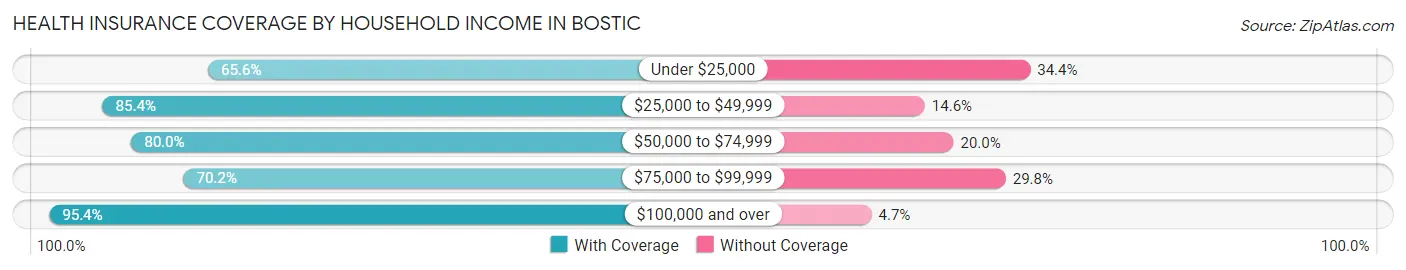
| Household Income | With Coverage | Without Coverage |
| Under $25,000 | 42 (65.6%) | 22 (34.4%) |
| $25,000 to $49,999 | 70 (85.4%) | 12 (14.6%) |
| $50,000 to $74,999 | 20 (80.0%) | 5 (20.0%) |
| $75,000 to $99,999 | 33 (70.2%) | 14 (29.8%) |
| $100,000 and over | 82 (95.4%) | 4 (4.6%) |
Public vs Private Health Insurance Coverage by Age in Bostic
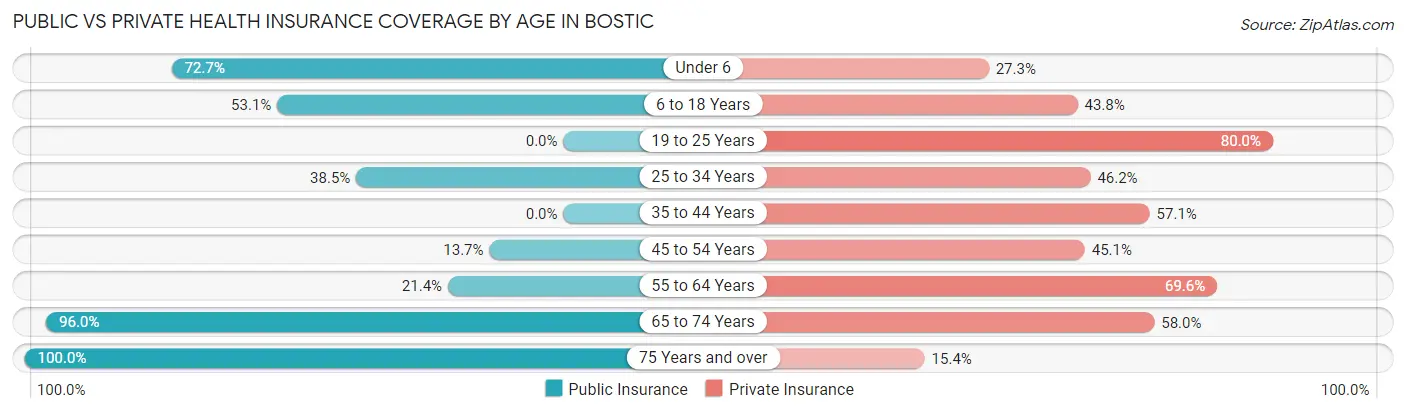
| Age Bracket | Public Insurance | Private Insurance |
| Under 6 | 16 (72.7%) | 6 (27.3%) |
| 6 to 18 Years | 17 (53.1%) | 14 (43.8%) |
| 19 to 25 Years | 0 (0.0%) | 16 (80.0%) |
| 25 to 34 Years | 15 (38.5%) | 18 (46.2%) |
| 35 to 44 Years | 0 (0.0%) | 12 (57.1%) |
| 45 to 54 Years | 7 (13.7%) | 23 (45.1%) |
| 55 to 64 Years | 12 (21.4%) | 39 (69.6%) |
| 65 to 74 Years | 48 (96.0%) | 29 (58.0%) |
| 75 Years and over | 13 (100.0%) | 2 (15.4%) |
| Total | 128 (42.1%) | 159 (52.3%) |
Disability Status by Sex by Age in Bostic
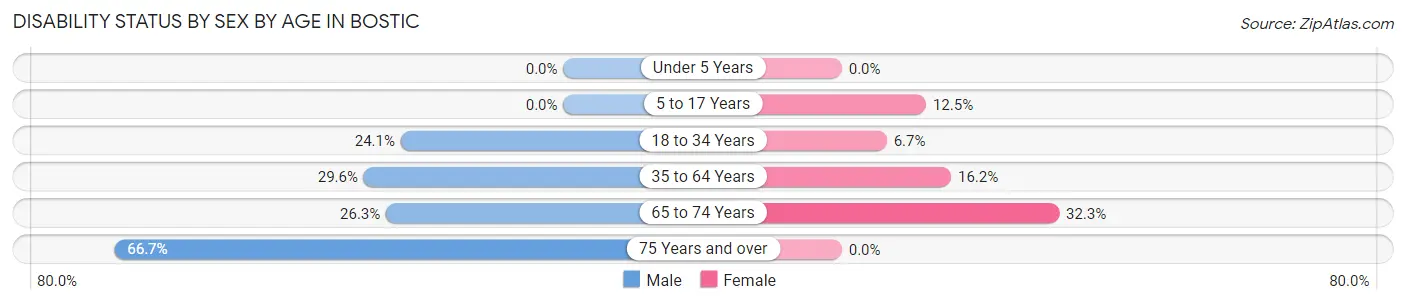
| Age Bracket | Male | Female |
| Under 5 Years | 0 (0.0%) | 0 (0.0%) |
| 5 to 17 Years | 0 (0.0%) | 2 (12.5%) |
| 18 to 34 Years | 7 (24.1%) | 2 (6.7%) |
| 35 to 64 Years | 16 (29.6%) | 12 (16.2%) |
| 65 to 74 Years | 5 (26.3%) | 10 (32.3%) |
| 75 Years and over | 8 (66.7%) | 0 (0.0%) |
Disability Class by Sex by Age in Bostic
Disability Class: Hearing Difficulty
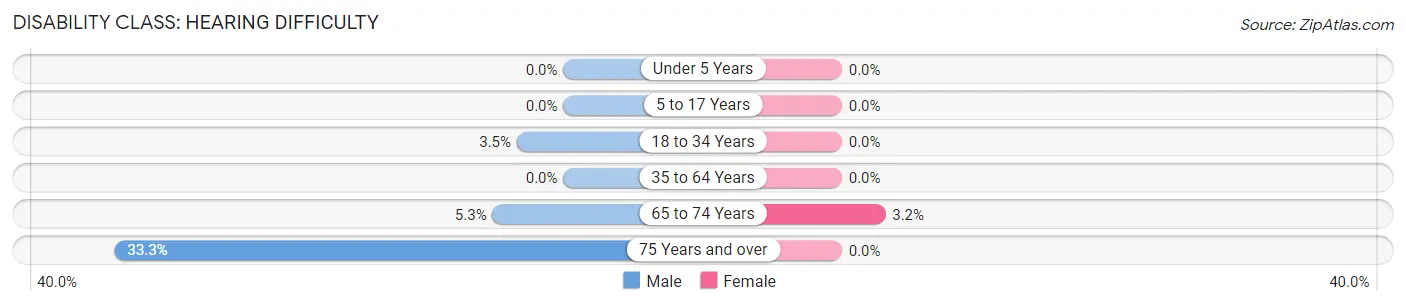
| Age Bracket | Male | Female |
| Under 5 Years | 0 (0.0%) | 0 (0.0%) |
| 5 to 17 Years | 0 (0.0%) | 0 (0.0%) |
| 18 to 34 Years | 1 (3.5%) | 0 (0.0%) |
| 35 to 64 Years | 0 (0.0%) | 0 (0.0%) |
| 65 to 74 Years | 1 (5.3%) | 1 (3.2%) |
| 75 Years and over | 4 (33.3%) | 0 (0.0%) |
Disability Class: Vision Difficulty
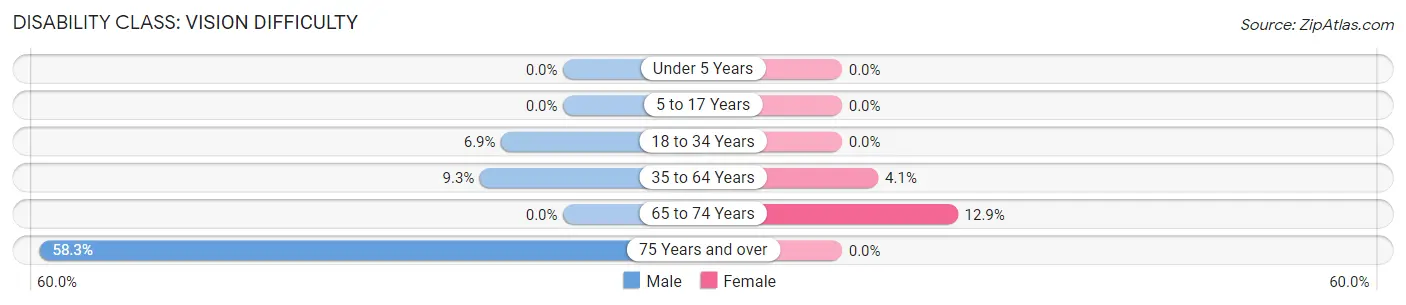
| Age Bracket | Male | Female |
| Under 5 Years | 0 (0.0%) | 0 (0.0%) |
| 5 to 17 Years | 0 (0.0%) | 0 (0.0%) |
| 18 to 34 Years | 2 (6.9%) | 0 (0.0%) |
| 35 to 64 Years | 5 (9.3%) | 3 (4.1%) |
| 65 to 74 Years | 0 (0.0%) | 4 (12.9%) |
| 75 Years and over | 7 (58.3%) | 0 (0.0%) |
Disability Class: Cognitive Difficulty
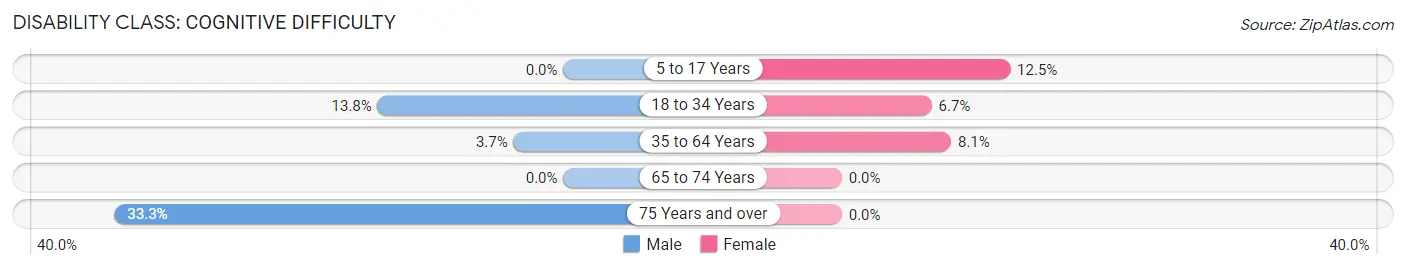
| Age Bracket | Male | Female |
| 5 to 17 Years | 0 (0.0%) | 2 (12.5%) |
| 18 to 34 Years | 4 (13.8%) | 2 (6.7%) |
| 35 to 64 Years | 2 (3.7%) | 6 (8.1%) |
| 65 to 74 Years | 0 (0.0%) | 0 (0.0%) |
| 75 Years and over | 4 (33.3%) | 0 (0.0%) |
Disability Class: Ambulatory Difficulty
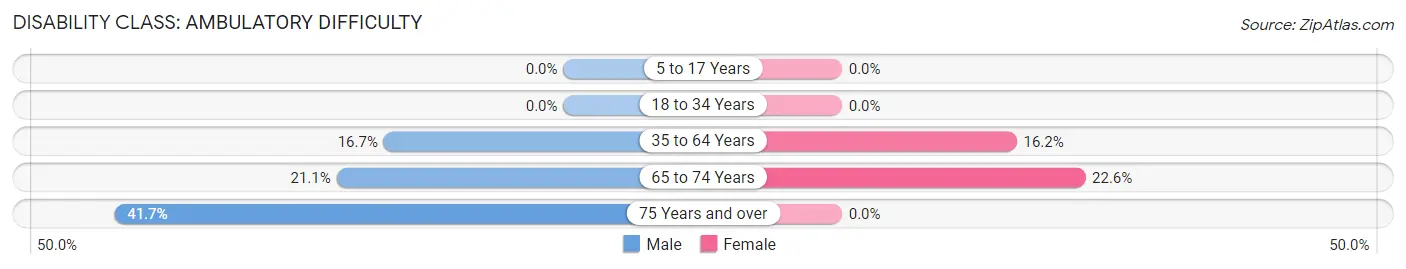
| Age Bracket | Male | Female |
| 5 to 17 Years | 0 (0.0%) | 0 (0.0%) |
| 18 to 34 Years | 0 (0.0%) | 0 (0.0%) |
| 35 to 64 Years | 9 (16.7%) | 12 (16.2%) |
| 65 to 74 Years | 4 (21.0%) | 7 (22.6%) |
| 75 Years and over | 5 (41.7%) | 0 (0.0%) |
Disability Class: Self-Care Difficulty
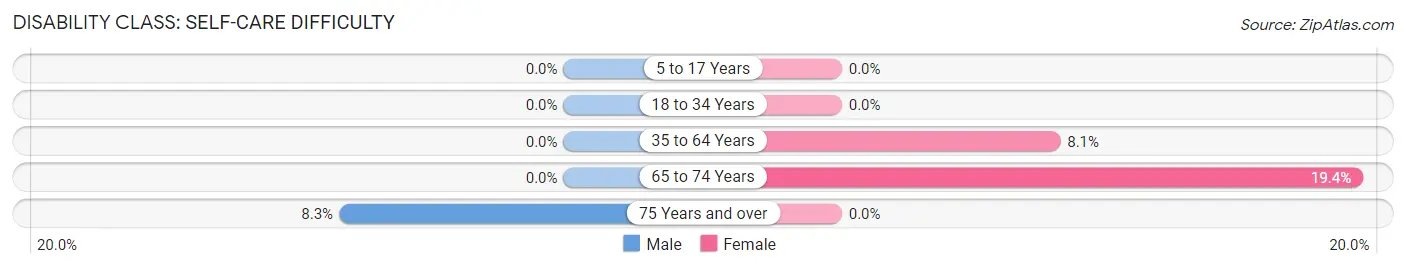
| Age Bracket | Male | Female |
| 5 to 17 Years | 0 (0.0%) | 0 (0.0%) |
| 18 to 34 Years | 0 (0.0%) | 0 (0.0%) |
| 35 to 64 Years | 0 (0.0%) | 6 (8.1%) |
| 65 to 74 Years | 0 (0.0%) | 6 (19.4%) |
| 75 Years and over | 1 (8.3%) | 0 (0.0%) |
Technology Access in Bostic
Computing Device Access in Bostic
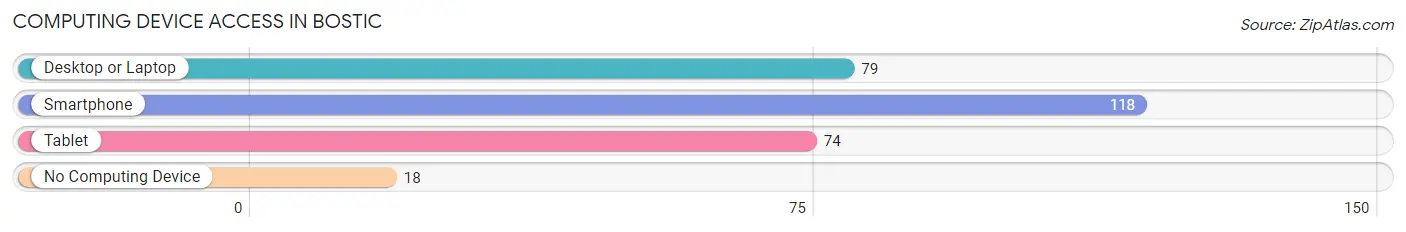
| Device Type | # Households | % Households |
| Desktop or Laptop | 79 | 54.9% |
| Smartphone | 118 | 81.9% |
| Tablet | 74 | 51.4% |
| No Computing Device | 18 | 12.5% |
| Total | 144 | 100.0% |
Internet Access in Bostic
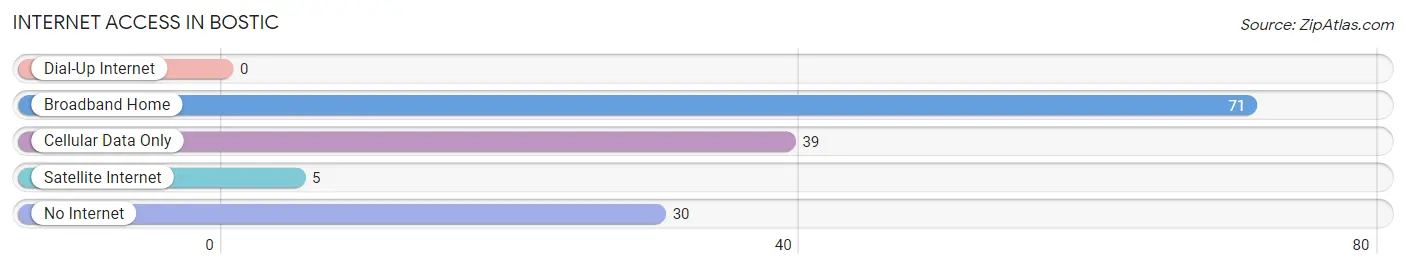
| Internet Type | # Households | % Households |
| Dial-Up Internet | 0 | 0.0% |
| Broadband Home | 71 | 49.3% |
| Cellular Data Only | 39 | 27.1% |
| Satellite Internet | 5 | 3.5% |
| No Internet | 30 | 20.8% |
| Total | 144 | 100.0% |
Bostic Summary
Bostic is a small town located in Rutherford County, North Carolina. It is situated in the foothills of the Blue Ridge Mountains, approximately 40 miles southeast of Asheville. The town was founded in 1887 and named after the Bostic family, who were early settlers in the area. The population of Bostic was estimated to be 1,072 in 2020.
Geography
Bostic is located in the foothills of the Blue Ridge Mountains, at an elevation of 1,400 feet. The town is situated on the Broad River, which flows through the center of town. The town is surrounded by rolling hills and forests, and is home to several small lakes. The climate in Bostic is mild, with temperatures ranging from the mid-50s in the winter to the mid-80s in the summer.
Economy
Bostic’s economy is largely based on agriculture and forestry. The town is home to several small farms, which produce a variety of crops, including corn, soybeans, and hay. The town is also home to several sawmills, which produce lumber for the local market. In addition, Bostic is home to several small businesses, including restaurants, shops, and a hardware store.
Demographics
As of the 2010 census, the population of Bostic was 1,072. The racial makeup of the town was 95.3% White, 1.7% African American, 0.3% Native American, 0.2% Asian, 0.1% Pacific Islander, and 2.4% from other races. The median household income in Bostic was $31,250, and the median age was 41.
History
Bostic was founded in 1887 by the Bostic family, who were early settlers in the area. The town was originally known as Bostic Station, as it was a stop on the Rutherford and Spindale Railroad. The town was officially incorporated in 1889, and the name was changed to Bostic. The town grew slowly over the years, and by the early 20th century, it had become a popular destination for tourists. The town was home to several hotels, restaurants, and shops.
In the late 20th century, Bostic began to experience a decline in population, as many of its residents moved away in search of better job opportunities. However, in recent years, the town has seen a resurgence in population, as many people have moved back to the area in search of a more rural lifestyle.
Today, Bostic is a small, rural town with a population of just over 1,000. The town is home to several small businesses, farms, and sawmills, and is a popular destination for tourists looking to explore the foothills of the Blue Ridge Mountains.
Common Questions
What is Per Capita Income in Bostic?
Per Capita income in Bostic is $31,917.
What is the Median Family Income in Bostic?
Median Family Income in Bostic is $68,125.
What is the Median Household income in Bostic?
Median Household Income in Bostic is $53,438.
What is Income or Wage Gap in Bostic?
Income or Wage Gap in Bostic is 6.6%.
Women in Bostic earn 93.4 cents for every dollar earned by a man.
What is Inequality or Gini Index in Bostic?
Inequality or Gini Index in Bostic is 0.42.
What is the Total Population of Bostic?
Total Population of Bostic is 304.
What is the Total Male Population of Bostic?
Total Male Population of Bostic is 142.
What is the Total Female Population of Bostic?
Total Female Population of Bostic is 162.
What is the Ratio of Males per 100 Females in Bostic?
There are 87.65 Males per 100 Females in Bostic.
What is the Ratio of Females per 100 Males in Bostic?
There are 114.08 Females per 100 Males in Bostic.
What is the Median Population Age in Bostic?
Median Population Age in Bostic is 49.9 Years.
What is the Average Family Size in Bostic
Average Family Size in Bostic is 2.6 People.
What is the Average Household Size in Bostic
Average Household Size in Bostic is 2.1 People.
How Large is the Labor Force in Bostic?
There are 153 People in the Labor Forcein in Bostic.
What is the Percentage of People in the Labor Force in Bostic?
60.5% of People are in the Labor Force in Bostic.
What is the Unemployment Rate in Bostic?
Unemployment Rate in Bostic is 7.2%.