Boiling Springs, NC Map & Demographics
Boiling Springs Map
Boiling Springs Overview
$40,193
PER CAPITA INCOME
$107,714
AVG FAMILY INCOME
$90,625
AVG HOUSEHOLD INCOME
1.1%
WAGE / INCOME GAP [ % ]
98.9¢/ $1
WAGE / INCOME GAP [ $ ]
0.57
INEQUALITY / GINI INDEX
4,622
TOTAL POPULATION
2,196
MALE POPULATION
2,426
FEMALE POPULATION
90.52
MALES / 100 FEMALES
110.47
FEMALES / 100 MALES
21.9
MEDIAN AGE
3.6
AVG FAMILY SIZE
3.3
AVG HOUSEHOLD SIZE
2,047
LABOR FORCE [ PEOPLE ]
54.8%
PERCENT IN LABOR FORCE
4.9%
UNEMPLOYMENT RATE
Boiling Springs Zip Codes
Boiling Springs Area Codes
Income in Boiling Springs
Income Overview in Boiling Springs
Per Capita Income in Boiling Springs is $40,193, while median incomes of families and households are $107,714 and $90,625 respectively.
| Characteristic | Number | Measure |
| Per Capita Income | 4,622 | $40,193 |
| Median Family Income | 926 | $107,714 |
| Mean Family Income | 926 | $184,519 |
| Median Household Income | 1,092 | $90,625 |
| Mean Household Income | 1,092 | $162,400 |
| Income Deficit | 926 | $0 |
| Wage / Income Gap (%) | 4,622 | 1.14% |
| Wage / Income Gap ($) | 4,622 | 98.86¢ per $1 |
| Gini / Inequality Index | 4,622 | 0.57 |
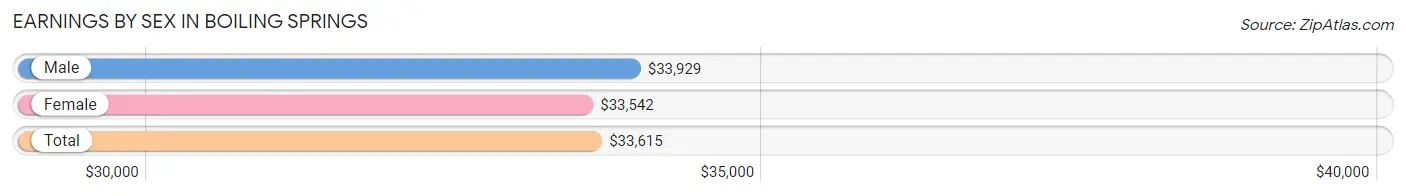
Earnings by Sex in Boiling Springs
Average Earnings in Boiling Springs are $33,615, $33,929 for men and $33,542 for women, a difference of 1.1%.
| Sex | Number | Average Earnings |
| Male | 1,108 (49.6%) | $33,929 |
| Female | 1,124 (50.4%) | $33,542 |
| Total | 2,232 (100.0%) | $33,615 |
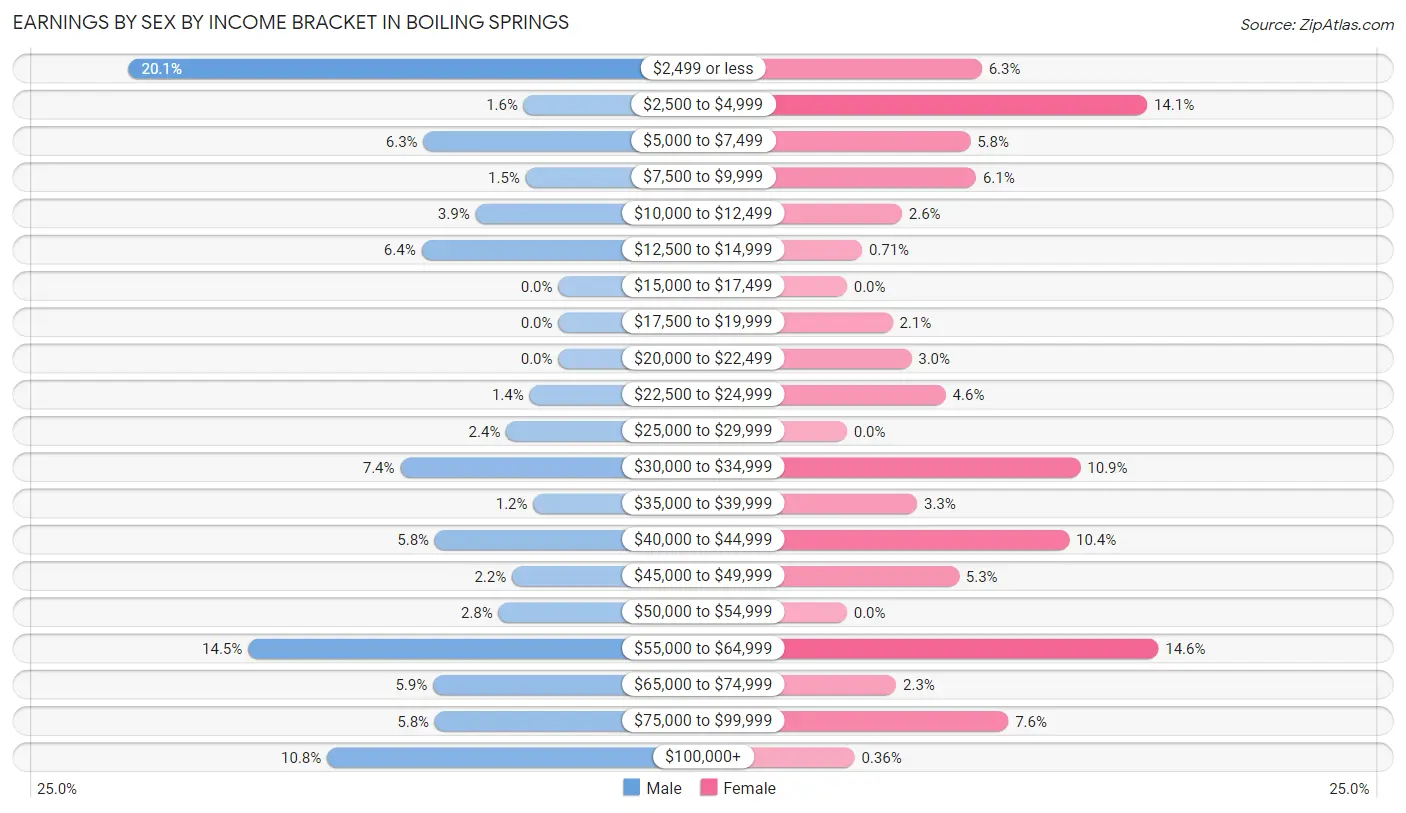
Earnings by Sex by Income Bracket in Boiling Springs
The most common earnings brackets in Boiling Springs are $2,499 or less for men (223 | 20.1%) and $55,000 to $64,999 for women (164 | 14.6%).
| Income | Male | Female |
| $2,499 or less | 223 (20.1%) | 71 (6.3%) |
| $2,500 to $4,999 | 18 (1.6%) | 158 (14.1%) |
| $5,000 to $7,499 | 70 (6.3%) | 65 (5.8%) |
| $7,500 to $9,999 | 17 (1.5%) | 68 (6.0%) |
| $10,000 to $12,499 | 43 (3.9%) | 29 (2.6%) |
| $12,500 to $14,999 | 71 (6.4%) | 8 (0.7%) |
| $15,000 to $17,499 | 0 (0.0%) | 0 (0.0%) |
| $17,500 to $19,999 | 0 (0.0%) | 24 (2.1%) |
| $20,000 to $22,499 | 0 (0.0%) | 34 (3.0%) |
| $22,500 to $24,999 | 15 (1.3%) | 52 (4.6%) |
| $25,000 to $29,999 | 27 (2.4%) | 0 (0.0%) |
| $30,000 to $34,999 | 82 (7.4%) | 123 (10.9%) |
| $35,000 to $39,999 | 13 (1.2%) | 37 (3.3%) |
| $40,000 to $44,999 | 64 (5.8%) | 117 (10.4%) |
| $45,000 to $49,999 | 24 (2.2%) | 59 (5.2%) |
| $50,000 to $54,999 | 31 (2.8%) | 0 (0.0%) |
| $55,000 to $64,999 | 161 (14.5%) | 164 (14.6%) |
| $65,000 to $74,999 | 65 (5.9%) | 26 (2.3%) |
| $75,000 to $99,999 | 64 (5.8%) | 85 (7.6%) |
| $100,000+ | 120 (10.8%) | 4 (0.4%) |
| Total | 1,108 (100.0%) | 1,124 (100.0%) |
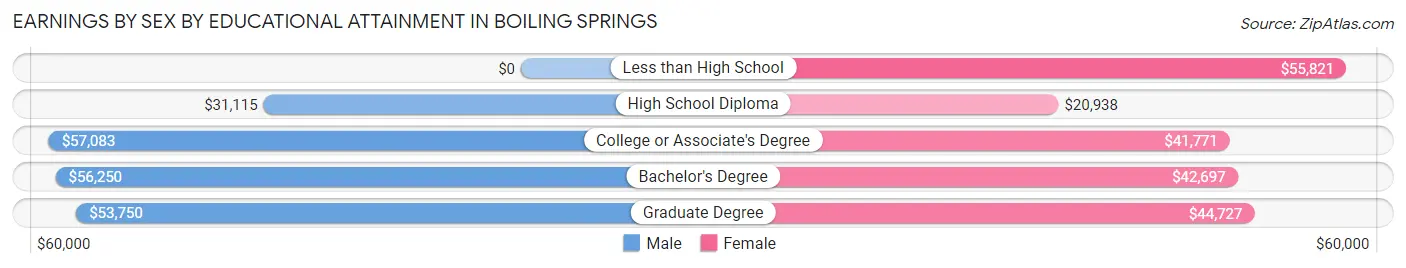
Earnings by Sex by Educational Attainment in Boiling Springs
Average earnings in Boiling Springs are $55,000 for men and $43,194 for women, a difference of 21.5%. Men with an educational attainment of college or associate's degree enjoy the highest average annual earnings of $57,083, while those with high school diploma education earn the least with $31,115. Women with an educational attainment of less than high school earn the most with the average annual earnings of $55,821, while those with high school diploma education have the smallest earnings of $20,938.
| Educational Attainment | Male Income | Female Income |
| Less than High School | - | - |
| High School Diploma | $31,115 | $20,938 |
| College or Associate's Degree | $57,083 | $41,771 |
| Bachelor's Degree | $56,250 | $42,697 |
| Graduate Degree | $53,750 | $44,727 |
| Total | $55,000 | $43,194 |
Family Income in Boiling Springs
Family Income Brackets in Boiling Springs
According to the Boiling Springs family income data, there are 293 families falling into the $100,000 to $149,999 income range, which is the most common income bracket and makes up 31.6% of all families.
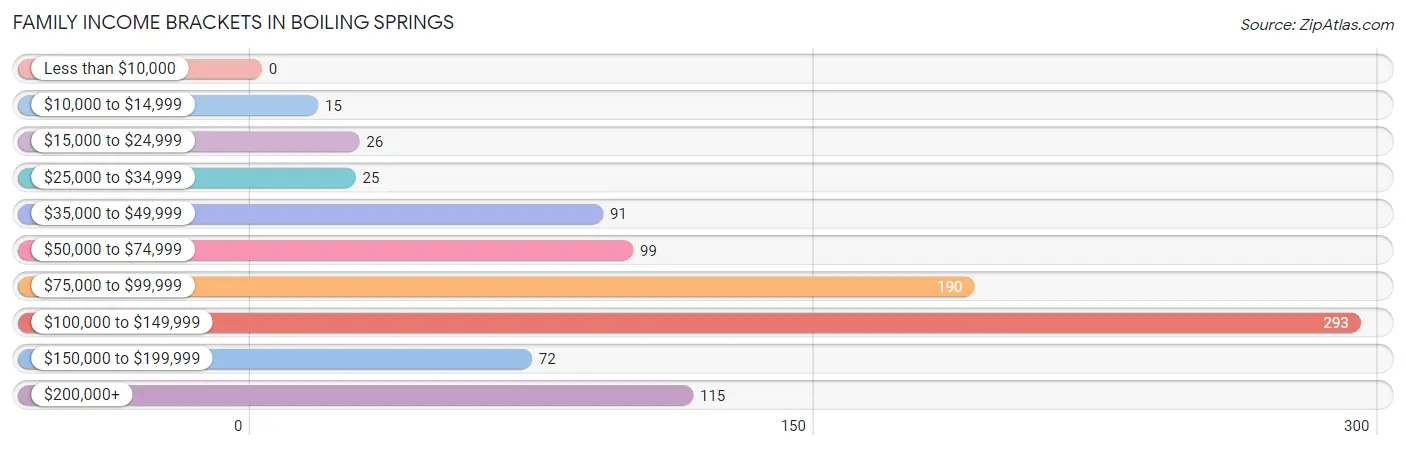
| Income Bracket | # Families | % Families |
| Less than $10,000 | 0 | 0.0% |
| $10,000 to $14,999 | 15 | 1.6% |
| $15,000 to $24,999 | 26 | 2.8% |
| $25,000 to $34,999 | 25 | 2.7% |
| $35,000 to $49,999 | 91 | 9.8% |
| $50,000 to $74,999 | 99 | 10.7% |
| $75,000 to $99,999 | 190 | 20.5% |
| $100,000 to $149,999 | 293 | 31.6% |
| $150,000 to $199,999 | 72 | 7.8% |
| $200,000+ | 115 | 12.4% |
Family Income by Famaliy Size in Boiling Springs
4-person families (112 | 12.1%) account for the highest median family income in Boiling Springs with $125,000 per family, while 2-person families (436 | 47.1%) have the highest median income of $44,688 per family member.
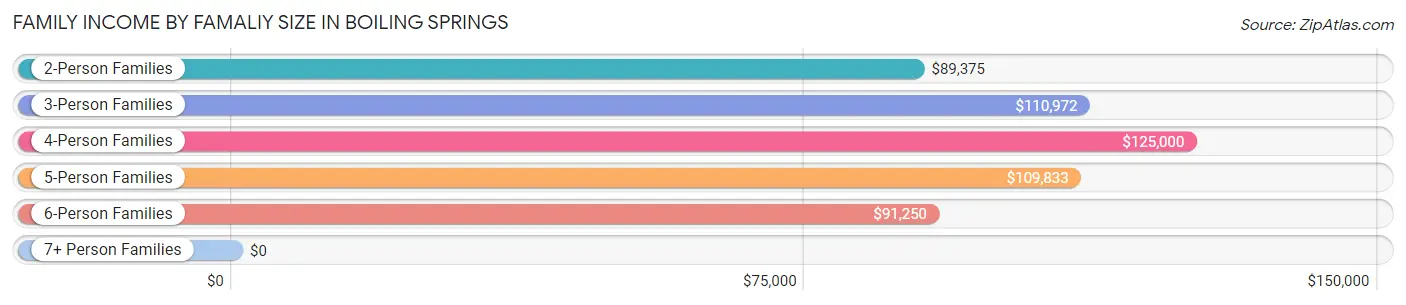
| Income Bracket | # Families | Median Income |
| 2-Person Families | 436 (47.1%) | $89,375 |
| 3-Person Families | 223 (24.1%) | $110,972 |
| 4-Person Families | 112 (12.1%) | $125,000 |
| 5-Person Families | 72 (7.8%) | $109,833 |
| 6-Person Families | 48 (5.2%) | $91,250 |
| 7+ Person Families | 35 (3.8%) | $0 |
| Total | 926 (100.0%) | $107,714 |
Family Income by Number of Earners in Boiling Springs
The median family income in Boiling Springs is $107,714, with families comprising 3+ earners (150) having the highest median family income of $113,125, while families with no earners (121) have the lowest median family income of $47,455, accounting for 16.2% and 13.1% of families, respectively.
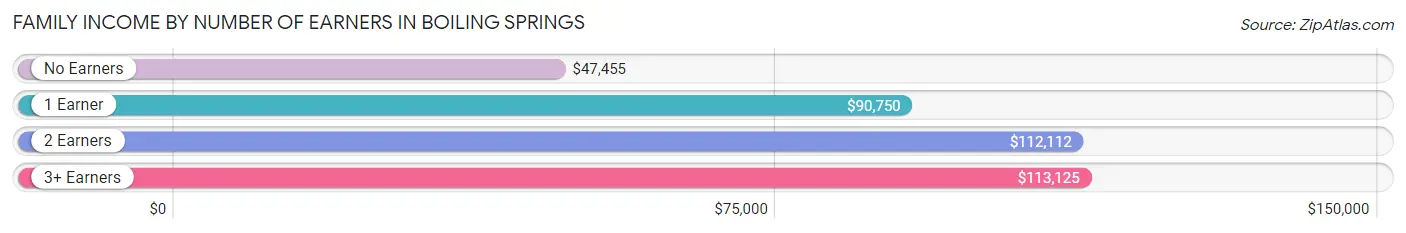
| Number of Earners | # Families | Median Income |
| No Earners | 121 (13.1%) | $47,455 |
| 1 Earner | 161 (17.4%) | $90,750 |
| 2 Earners | 494 (53.3%) | $112,112 |
| 3+ Earners | 150 (16.2%) | $113,125 |
| Total | 926 (100.0%) | $107,714 |
Household Income in Boiling Springs
Household Income Brackets in Boiling Springs
With 293 households falling in the category, the $100,000 to $149,999 income range is the most frequent in Boiling Springs, accounting for 26.8% of all households. In contrast, only 17 households (1.6%) fall into the less than $10,000 income bracket, making it the least populous group.
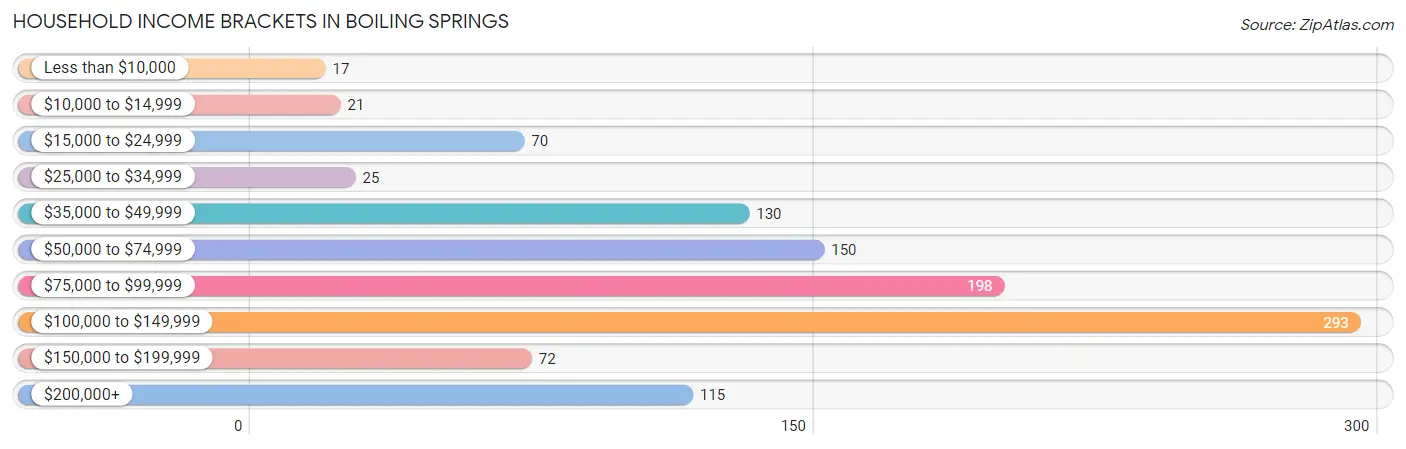
| Income Bracket | # Households | % Households |
| Less than $10,000 | 17 | 1.6% |
| $10,000 to $14,999 | 21 | 1.9% |
| $15,000 to $24,999 | 70 | 6.4% |
| $25,000 to $34,999 | 25 | 2.3% |
| $35,000 to $49,999 | 130 | 11.9% |
| $50,000 to $74,999 | 150 | 13.7% |
| $75,000 to $99,999 | 198 | 18.1% |
| $100,000 to $149,999 | 293 | 26.8% |
| $150,000 to $199,999 | 72 | 6.6% |
| $200,000+ | 115 | 10.5% |
Household Income by Householder Age in Boiling Springs
The median household income in Boiling Springs is $90,625, with the highest median household income of $112,923 found in the 45 to 64 years age bracket for the primary householder. A total of 492 households (45.1%) fall into this category. Meanwhile, the 15 to 24 years age bracket for the primary householder has the lowest median household income of $35,469, with 38 households (3.5%) in this group.
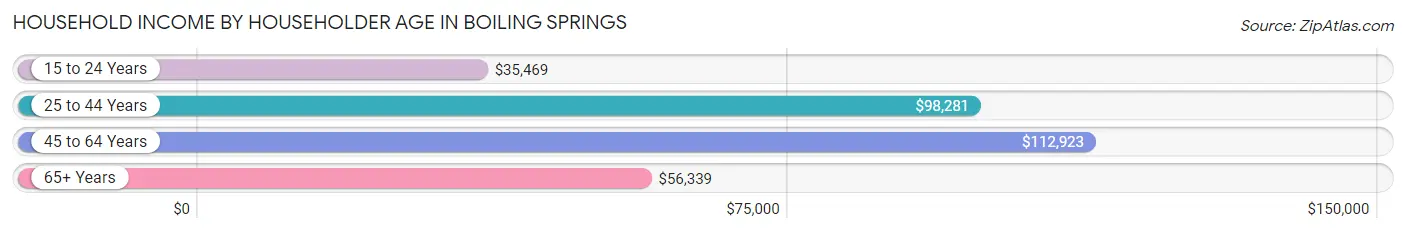
| Income Bracket | # Households | Median Income |
| 15 to 24 Years | 38 (3.5%) | $35,469 |
| 25 to 44 Years | 306 (28.0%) | $98,281 |
| 45 to 64 Years | 492 (45.1%) | $112,923 |
| 65+ Years | 256 (23.4%) | $56,339 |
| Total | 1,092 (100.0%) | $90,625 |
Poverty in Boiling Springs
Income Below Poverty by Sex and Age in Boiling Springs
With 3.0% poverty level for males and 4.1% for females among the residents of Boiling Springs, 12 to 14 year old males and 5 year old females are the most vulnerable to poverty, with 18 males (13.1%) and 7 females (20.6%) in their respective age groups living below the poverty level.
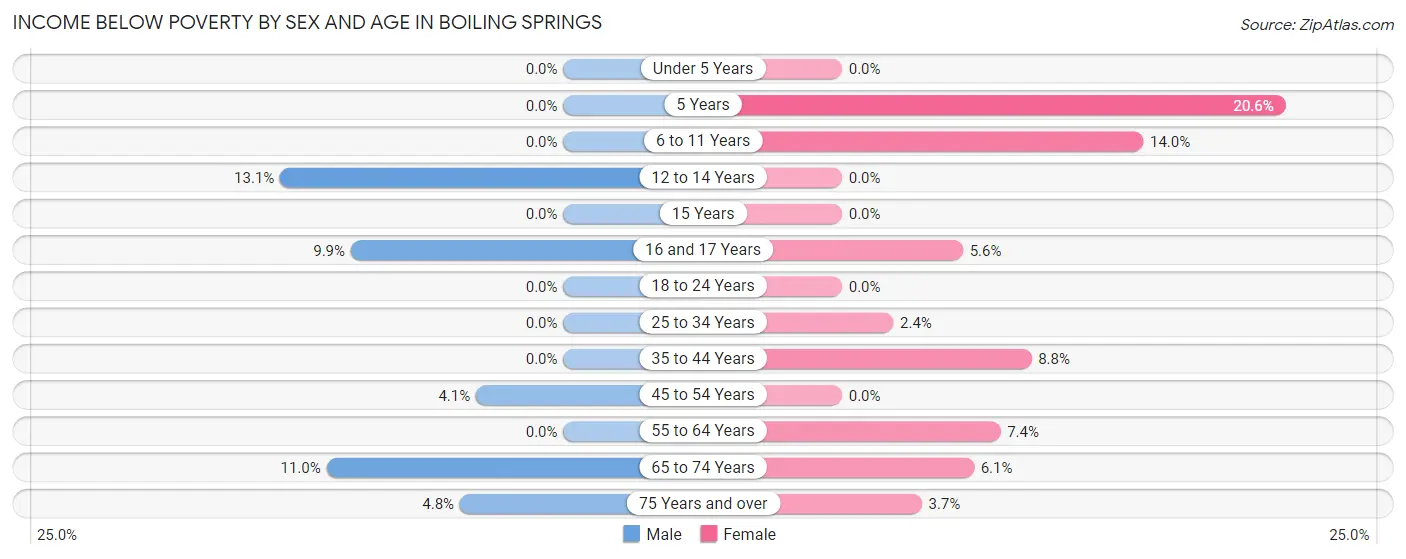
| Age Bracket | Male | Female |
| Under 5 Years | 0 (0.0%) | 0 (0.0%) |
| 5 Years | 0 (0.0%) | 7 (20.6%) |
| 6 to 11 Years | 0 (0.0%) | 13 (14.0%) |
| 12 to 14 Years | 18 (13.1%) | 0 (0.0%) |
| 15 Years | 0 (0.0%) | 0 (0.0%) |
| 16 and 17 Years | 7 (9.9%) | 6 (5.6%) |
| 18 to 24 Years | 0 (0.0%) | 0 (0.0%) |
| 25 to 34 Years | 0 (0.0%) | 6 (2.4%) |
| 35 to 44 Years | 0 (0.0%) | 21 (8.8%) |
| 45 to 54 Years | 10 (4.1%) | 0 (0.0%) |
| 55 to 64 Years | 0 (0.0%) | 10 (7.3%) |
| 65 to 74 Years | 10 (11.0%) | 6 (6.1%) |
| 75 Years and over | 6 (4.8%) | 6 (3.7%) |
| Total | 51 (3.0%) | 75 (4.1%) |
Income Above Poverty by Sex and Age in Boiling Springs
According to the poverty statistics in Boiling Springs, males aged under 5 years and females aged under 5 years are the age groups that are most secure financially, with 100.0% of males and 100.0% of females in these age groups living above the poverty line.
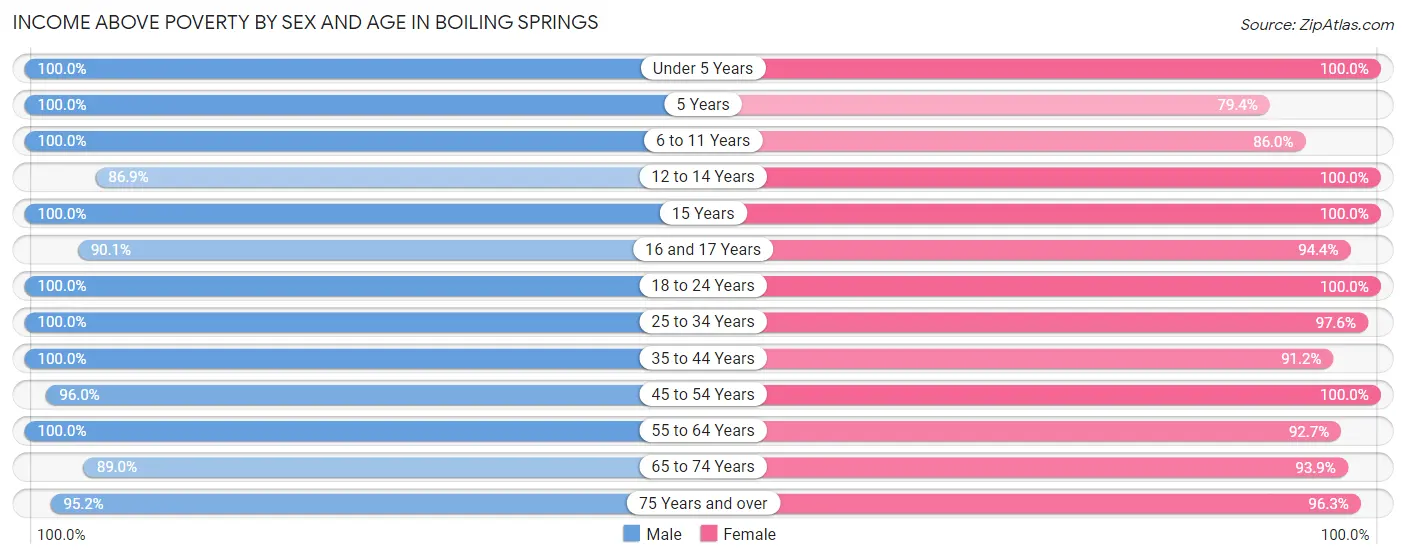
| Age Bracket | Male | Female |
| Under 5 Years | 167 (100.0%) | 199 (100.0%) |
| 5 Years | 7 (100.0%) | 27 (79.4%) |
| 6 to 11 Years | 115 (100.0%) | 80 (86.0%) |
| 12 to 14 Years | 119 (86.9%) | 52 (100.0%) |
| 15 Years | 58 (100.0%) | 7 (100.0%) |
| 16 and 17 Years | 64 (90.1%) | 101 (94.4%) |
| 18 to 24 Years | 196 (100.0%) | 174 (100.0%) |
| 25 to 34 Years | 161 (100.0%) | 246 (97.6%) |
| 35 to 44 Years | 164 (100.0%) | 218 (91.2%) |
| 45 to 54 Years | 237 (96.0%) | 263 (100.0%) |
| 55 to 64 Years | 185 (100.0%) | 126 (92.6%) |
| 65 to 74 Years | 81 (89.0%) | 92 (93.9%) |
| 75 Years and over | 119 (95.2%) | 156 (96.3%) |
| Total | 1,673 (97.0%) | 1,741 (95.9%) |
Income Below Poverty Among Married-Couple Families in Boiling Springs
The poverty statistics for married-couple families in Boiling Springs show that 2.6% or 20 of the total 760 families live below the poverty line. Families with 1 or 2 children have the highest poverty rate of 4.9%, comprising of 10 families. On the other hand, families with 3 or 4 children have the lowest poverty rate of 0.0%, which includes 0 families.
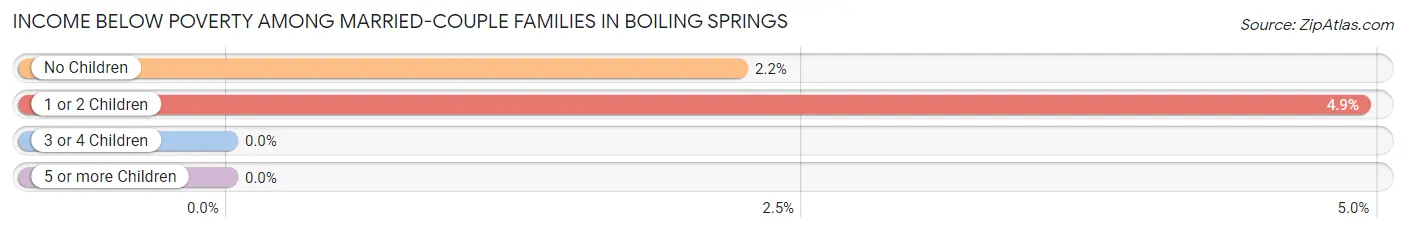
| Children | Above Poverty | Below Poverty |
| No Children | 441 (97.8%) | 10 (2.2%) |
| 1 or 2 Children | 193 (95.1%) | 10 (4.9%) |
| 3 or 4 Children | 106 (100.0%) | 0 (0.0%) |
| 5 or more Children | 0 (0.0%) | 0 (0.0%) |
| Total | 740 (97.4%) | 20 (2.6%) |
Income Below Poverty Among Single-Parent Households in Boiling Springs
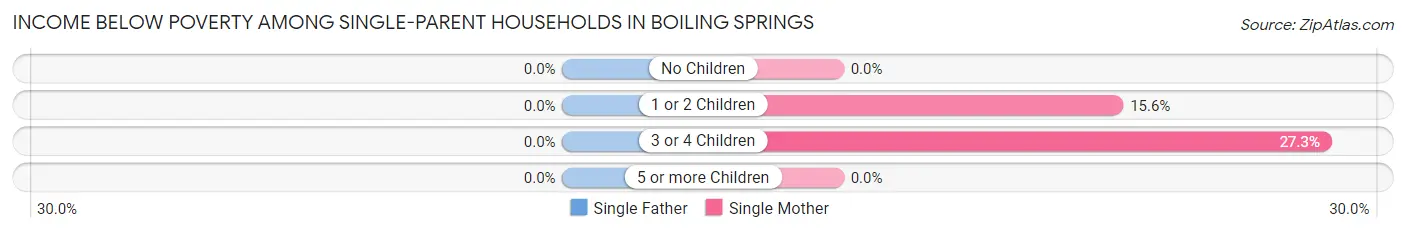
| Children | Single Father | Single Mother |
| No Children | 0 (0.0%) | 0 (0.0%) |
| 1 or 2 Children | 0 (0.0%) | 5 (15.6%) |
| 3 or 4 Children | 0 (0.0%) | 6 (27.3%) |
| 5 or more Children | 0 (0.0%) | 0 (0.0%) |
| Total | 0 (0.0%) | 11 (7.7%) |
Income Below Poverty Among Married-Couple vs Single-Parent Households in Boiling Springs
The poverty data for Boiling Springs shows that 20 of the married-couple family households (2.6%) and 11 of the single-parent households (6.6%) are living below the poverty level. Within the married-couple family households, those with 1 or 2 children have the highest poverty rate, with 10 households (4.9%) falling below the poverty line. Among the single-parent households, those with 3 or 4 children have the highest poverty rate, with 6 household (20.7%) living below poverty.
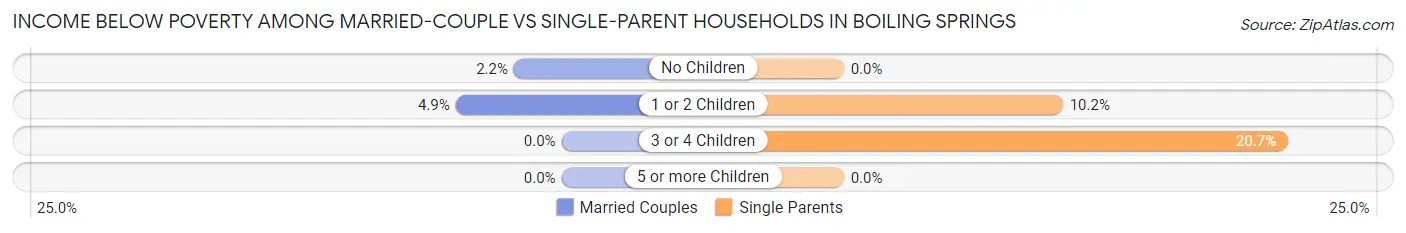
| Children | Married-Couple Families | Single-Parent Households |
| No Children | 10 (2.2%) | 0 (0.0%) |
| 1 or 2 Children | 10 (4.9%) | 5 (10.2%) |
| 3 or 4 Children | 0 (0.0%) | 6 (20.7%) |
| 5 or more Children | 0 (0.0%) | 0 (0.0%) |
| Total | 20 (2.6%) | 11 (6.6%) |
Race in Boiling Springs
The most populous races in Boiling Springs are White / Caucasian (3,666 | 79.3%), Black / African American (712 | 15.4%), and Hispanic or Latino (299 | 6.5%).
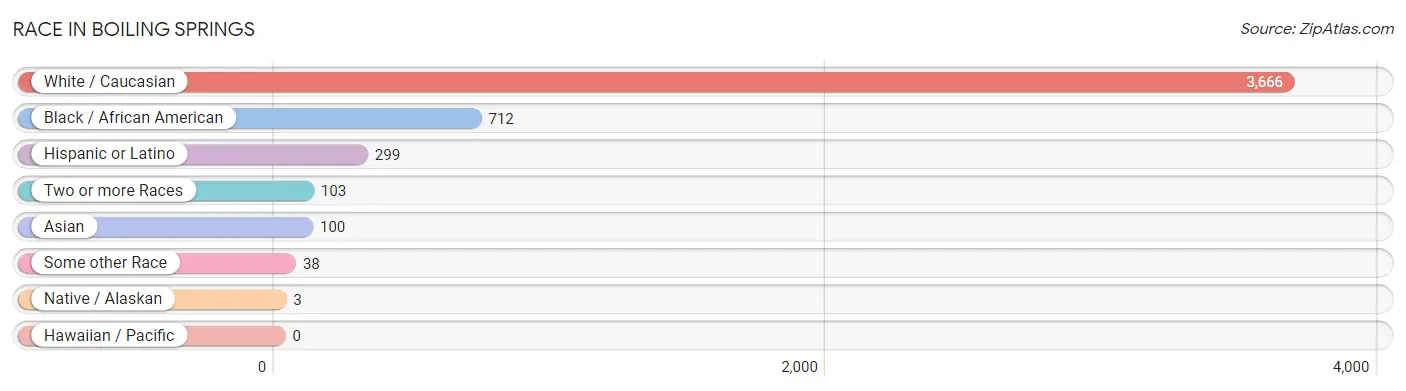
| Race | # Population | % Population |
| Asian | 100 | 2.2% |
| Black / African American | 712 | 15.4% |
| Hawaiian / Pacific | 0 | 0.0% |
| Hispanic or Latino | 299 | 6.5% |
| Native / Alaskan | 3 | 0.1% |
| White / Caucasian | 3,666 | 79.3% |
| Two or more Races | 103 | 2.2% |
| Some other Race | 38 | 0.8% |
| Total | 4,622 | 100.0% |
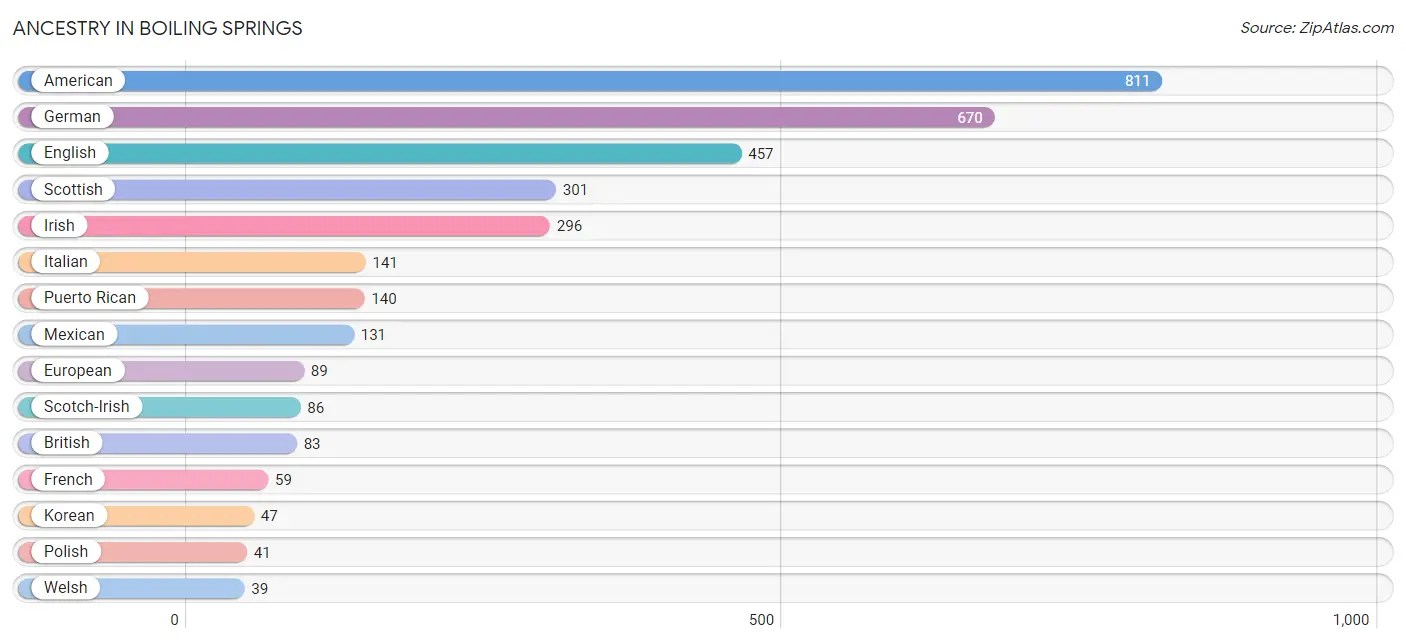
Ancestry in Boiling Springs
The most populous ancestries reported in Boiling Springs are American (811 | 17.5%), German (670 | 14.5%), English (457 | 9.9%), Scottish (301 | 6.5%), and Irish (296 | 6.4%), together accounting for 54.8% of all Boiling Springs residents.
| Ancestry | # Population | % Population |
| American | 811 | 17.5% |
| British | 83 | 1.8% |
| Canadian | 6 | 0.1% |
| Colombian | 21 | 0.4% |
| Danish | 3 | 0.1% |
| Dutch | 24 | 0.5% |
| English | 457 | 9.9% |
| European | 89 | 1.9% |
| French | 59 | 1.3% |
| French Canadian | 13 | 0.3% |
| German | 670 | 14.5% |
| Greek | 10 | 0.2% |
| Indian (Asian) | 7 | 0.2% |
| Irish | 296 | 6.4% |
| Italian | 141 | 3.0% |
| Korean | 47 | 1.0% |
| Lithuanian | 5 | 0.1% |
| Mexican | 131 | 2.8% |
| Mexican American Indian | 3 | 0.1% |
| Polish | 41 | 0.9% |
| Puerto Rican | 140 | 3.0% |
| Scandinavian | 25 | 0.5% |
| Scotch-Irish | 86 | 1.9% |
| Scottish | 301 | 6.5% |
| South American | 21 | 0.4% |
| Spaniard | 7 | 0.2% |
| Thai | 6 | 0.1% |
| Welsh | 39 | 0.8% | View All 28 Rows |
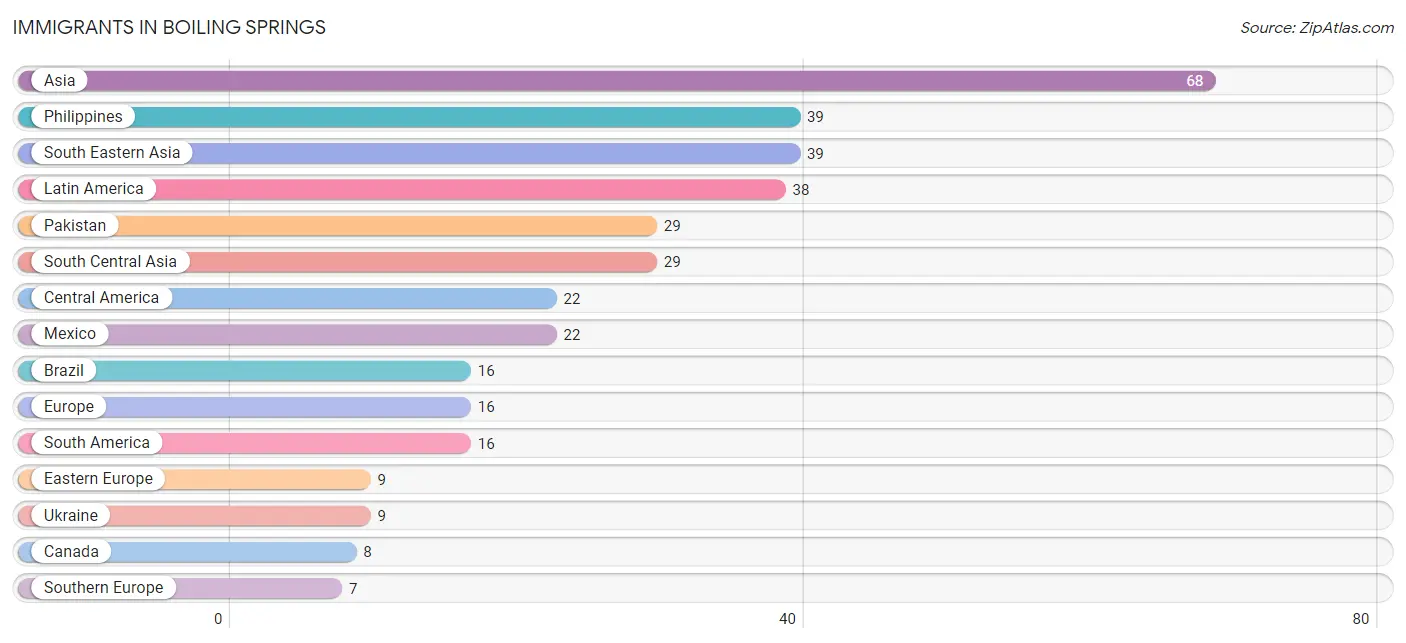
Immigrants in Boiling Springs
The most numerous immigrant groups reported in Boiling Springs came from Asia (68 | 1.5%), Philippines (39 | 0.8%), South Eastern Asia (39 | 0.8%), Latin America (38 | 0.8%), and Pakistan (29 | 0.6%), together accounting for 4.6% of all Boiling Springs residents.
| Immigration Origin | # Population | % Population |
| Africa | 5 | 0.1% |
| Asia | 68 | 1.5% |
| Brazil | 16 | 0.4% |
| Cameroon | 5 | 0.1% |
| Canada | 8 | 0.2% |
| Central America | 22 | 0.5% |
| Eastern Europe | 9 | 0.2% |
| Europe | 16 | 0.4% |
| Latin America | 38 | 0.8% |
| Mexico | 22 | 0.5% |
| Middle Africa | 5 | 0.1% |
| Pakistan | 29 | 0.6% |
| Philippines | 39 | 0.8% |
| South America | 16 | 0.4% |
| South Central Asia | 29 | 0.6% |
| South Eastern Asia | 39 | 0.8% |
| Southern Europe | 7 | 0.2% |
| Spain | 7 | 0.2% |
| Ukraine | 9 | 0.2% | View All 19 Rows |
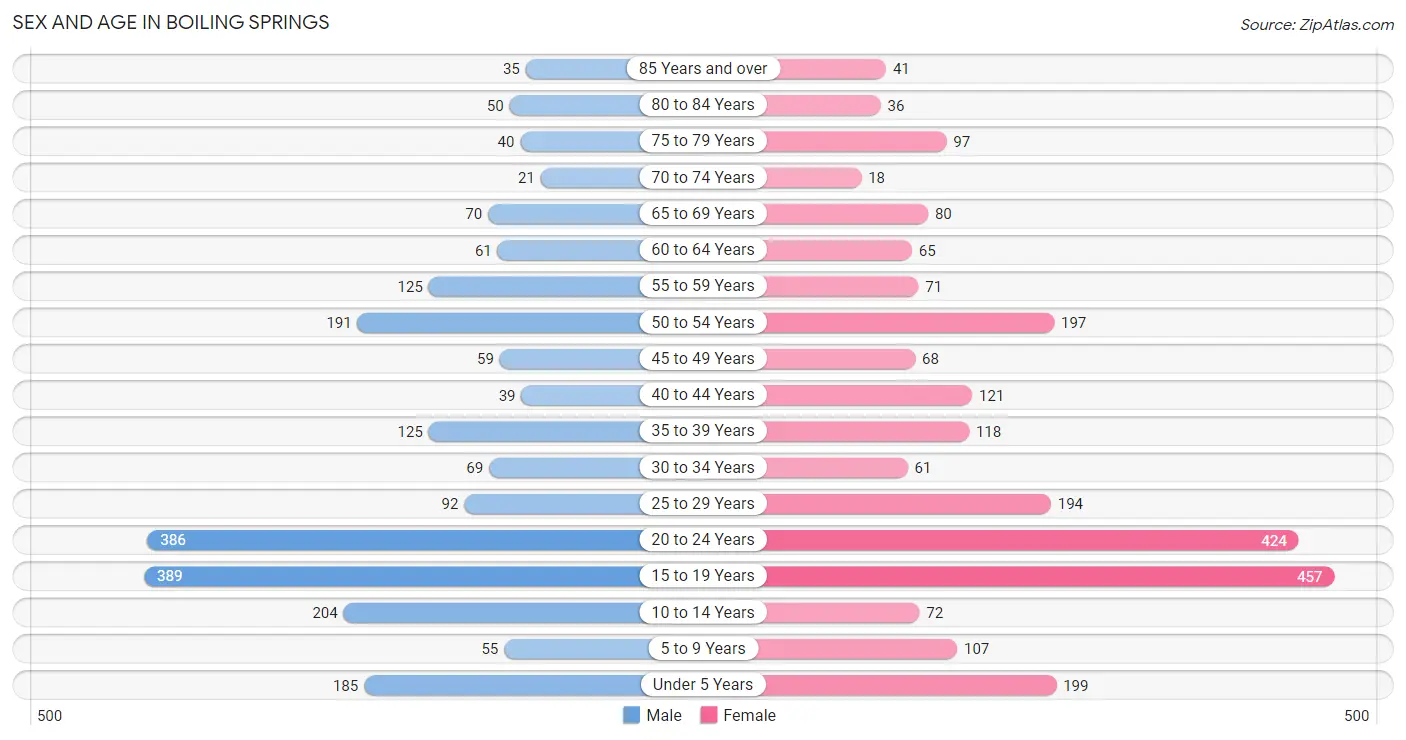
Sex and Age in Boiling Springs
Sex and Age in Boiling Springs
The most populous age groups in Boiling Springs are 15 to 19 Years (389 | 17.7%) for men and 15 to 19 Years (457 | 18.8%) for women.
| Age Bracket | Male | Female |
| Under 5 Years | 185 (8.4%) | 199 (8.2%) |
| 5 to 9 Years | 55 (2.5%) | 107 (4.4%) |
| 10 to 14 Years | 204 (9.3%) | 72 (3.0%) |
| 15 to 19 Years | 389 (17.7%) | 457 (18.8%) |
| 20 to 24 Years | 386 (17.6%) | 424 (17.5%) |
| 25 to 29 Years | 92 (4.2%) | 194 (8.0%) |
| 30 to 34 Years | 69 (3.1%) | 61 (2.5%) |
| 35 to 39 Years | 125 (5.7%) | 118 (4.9%) |
| 40 to 44 Years | 39 (1.8%) | 121 (5.0%) |
| 45 to 49 Years | 59 (2.7%) | 68 (2.8%) |
| 50 to 54 Years | 191 (8.7%) | 197 (8.1%) |
| 55 to 59 Years | 125 (5.7%) | 71 (2.9%) |
| 60 to 64 Years | 61 (2.8%) | 65 (2.7%) |
| 65 to 69 Years | 70 (3.2%) | 80 (3.3%) |
| 70 to 74 Years | 21 (1.0%) | 18 (0.7%) |
| 75 to 79 Years | 40 (1.8%) | 97 (4.0%) |
| 80 to 84 Years | 50 (2.3%) | 36 (1.5%) |
| 85 Years and over | 35 (1.6%) | 41 (1.7%) |
| Total | 2,196 (100.0%) | 2,426 (100.0%) |
Families and Households in Boiling Springs
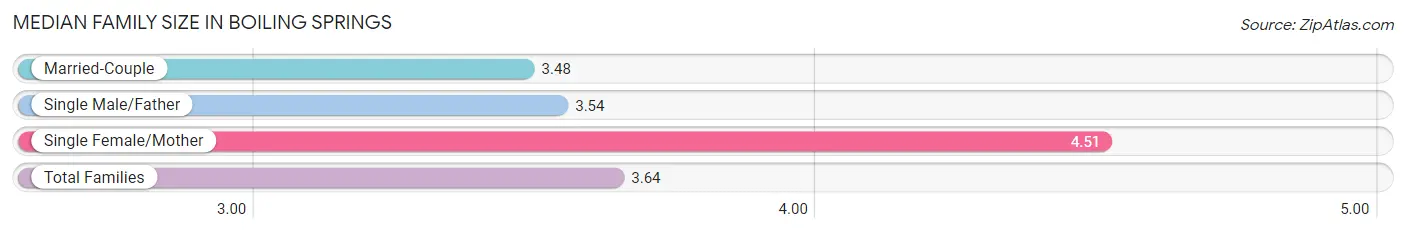
Median Family Size in Boiling Springs
The median family size in Boiling Springs is 3.64 persons per family, with single female/mother families (142 | 15.3%) accounting for the largest median family size of 4.51 persons per family. On the other hand, married-couple families (760 | 82.1%) represent the smallest median family size with 3.48 persons per family.
| Family Type | # Families | Family Size |
| Married-Couple | 760 (82.1%) | 3.48 |
| Single Male/Father | 24 (2.6%) | 3.54 |
| Single Female/Mother | 142 (15.3%) | 4.51 |
| Total Families | 926 (100.0%) | 3.64 |
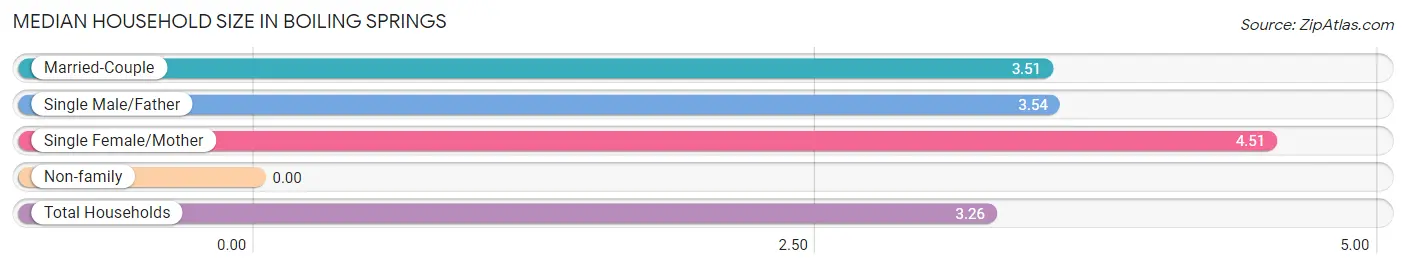
Median Household Size in Boiling Springs
| Household Type | # Households | Household Size |
| Married-Couple | 760 (69.6%) | 3.51 |
| Single Male/Father | 24 (2.2%) | 3.54 |
| Single Female/Mother | 142 (13.0%) | 4.51 |
| Non-family | 166 (15.2%) | - |
| Total Households | 1,092 (100.0%) | 3.26 |
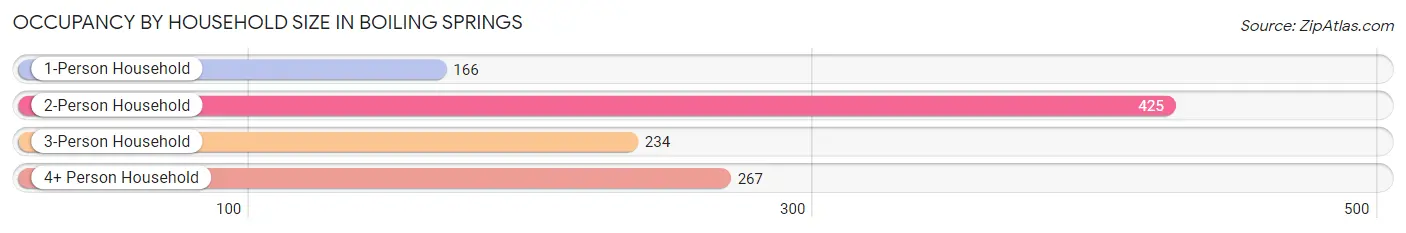
Household Size by Marriage Status in Boiling Springs
Out of a total of 1,092 households in Boiling Springs, 926 (84.8%) are family households, while 166 (15.2%) are nonfamily households. The most numerous type of family households are 2-person households, comprising 425, and the most common type of nonfamily households are 1-person households, comprising 166.
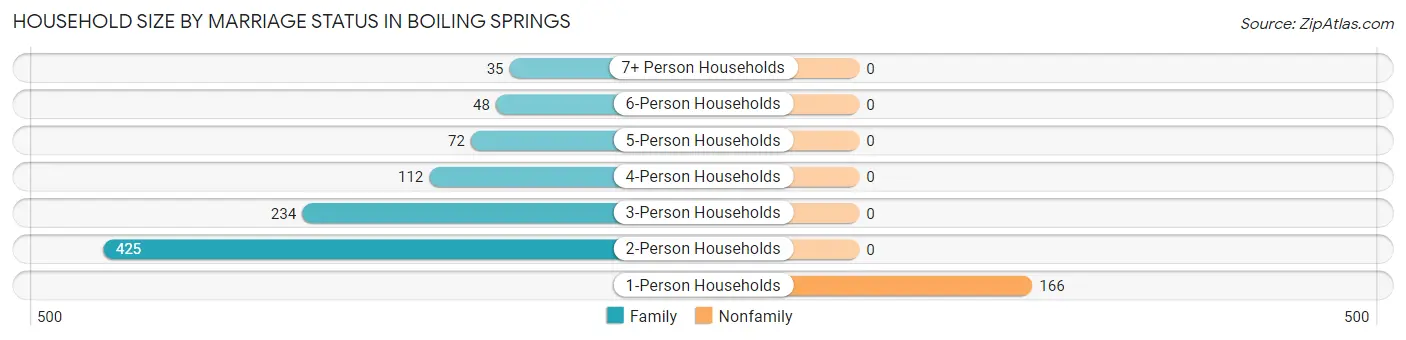
| Household Size | Family Households | Nonfamily Households |
| 1-Person Households | - | 166 (15.2%) |
| 2-Person Households | 425 (38.9%) | 0 (0.0%) |
| 3-Person Households | 234 (21.4%) | 0 (0.0%) |
| 4-Person Households | 112 (10.3%) | 0 (0.0%) |
| 5-Person Households | 72 (6.6%) | 0 (0.0%) |
| 6-Person Households | 48 (4.4%) | 0 (0.0%) |
| 7+ Person Households | 35 (3.2%) | 0 (0.0%) |
| Total | 926 (84.8%) | 166 (15.2%) |
Female Fertility in Boiling Springs
Fertility by Age in Boiling Springs
Average fertility rate in Boiling Springs is 20.0 births per 1,000 women. Women in the age bracket of 20 to 34 years have the highest fertility rate with 43.0 births per 1,000 women. Women in the age bracket of 20 to 34 years acount for 100.0% of all women with births.
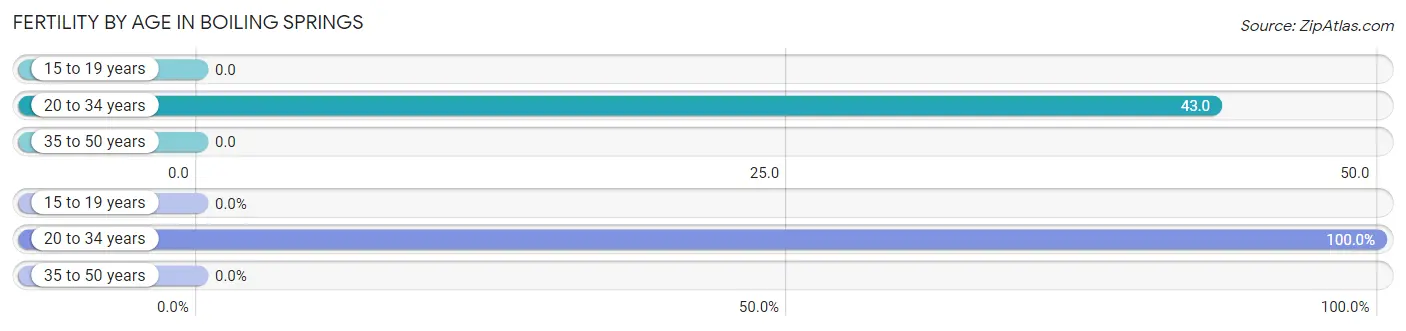
| Age Bracket | Women with Births | Births / 1,000 Women |
| 15 to 19 years | 0 (0.0%) | 0.0 |
| 20 to 34 years | 29 (100.0%) | 43.0 |
| 35 to 50 years | 0 (0.0%) | 0.0 |
| Total | 29 (100.0%) | 20.0 |
Fertility by Age by Marriage Status in Boiling Springs
31.0% of women with births (29) in Boiling Springs are married. The highest percentage of unmarried women with births falls into 20 to 34 years age bracket with 69.0% of them unmarried at the time of birth, while the lowest percentage of unmarried women with births belong to 20 to 34 years age bracket with 69.0% of them unmarried.
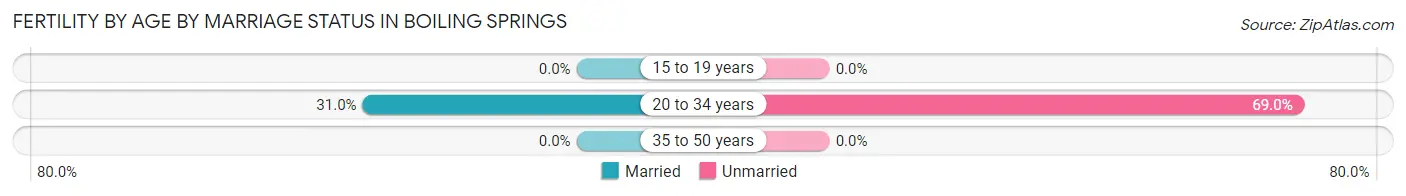
| Age Bracket | Married | Unmarried |
| 15 to 19 years | 0 (0.0%) | 0 (0.0%) |
| 20 to 34 years | 9 (31.0%) | 20 (69.0%) |
| 35 to 50 years | 0 (0.0%) | 0 (0.0%) |
| Total | 9 (31.0%) | 20 (69.0%) |
Fertility by Education in Boiling Springs
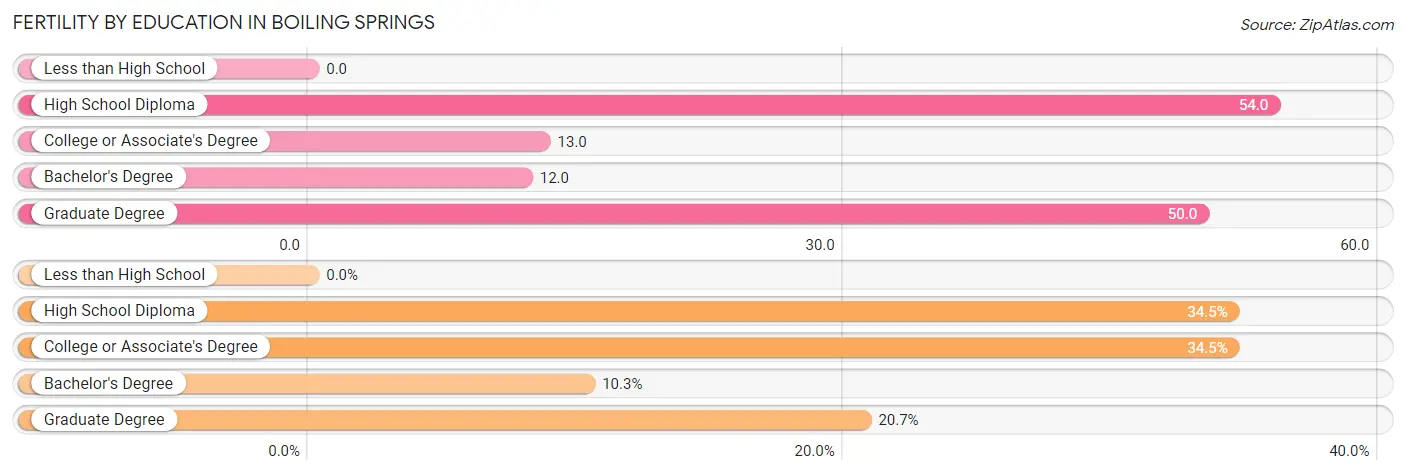
| Educational Attainment | Women with Births | Births / 1,000 Women |
| Less than High School | 0 (0.0%) | 0.0 |
| High School Diploma | 10 (34.5%) | 54.0 |
| College or Associate's Degree | 10 (34.5%) | 13.0 |
| Bachelor's Degree | 3 (10.3%) | 12.0 |
| Graduate Degree | 6 (20.7%) | 50.0 |
| Total | 29 (100.0%) | 20.0 |
Fertility by Education by Marriage Status in Boiling Springs
69.0% of women with births in Boiling Springs are unmarried. Women with the educational attainment of bachelor's degree are most likely to be married with 100.0% of them married at childbirth, while women with the educational attainment of high school diploma are least likely to be married with 100.0% of them unmarried at childbirth.
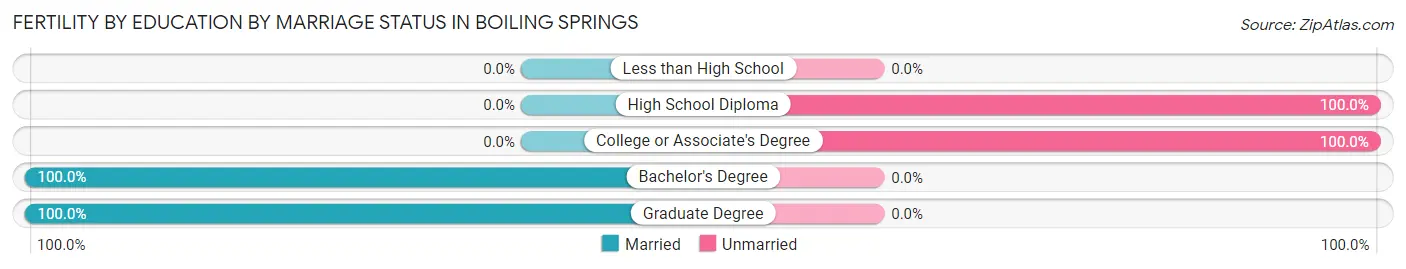
| Educational Attainment | Married | Unmarried |
| Less than High School | 0 (0.0%) | 0 (0.0%) |
| High School Diploma | 0 (0.0%) | 10 (100.0%) |
| College or Associate's Degree | 0 (0.0%) | 10 (100.0%) |
| Bachelor's Degree | 3 (100.0%) | 0 (0.0%) |
| Graduate Degree | 6 (100.0%) | 0 (0.0%) |
| Total | 9 (31.0%) | 20 (69.0%) |
Employment Characteristics in Boiling Springs
Employment by Class of Employer in Boiling Springs
Among the 1,917 employed individuals in Boiling Springs, private company employees (1,040 | 54.2%), local government employees (345 | 18.0%), and not-for-profit organizations (228 | 11.9%) make up the most common classes of employment.
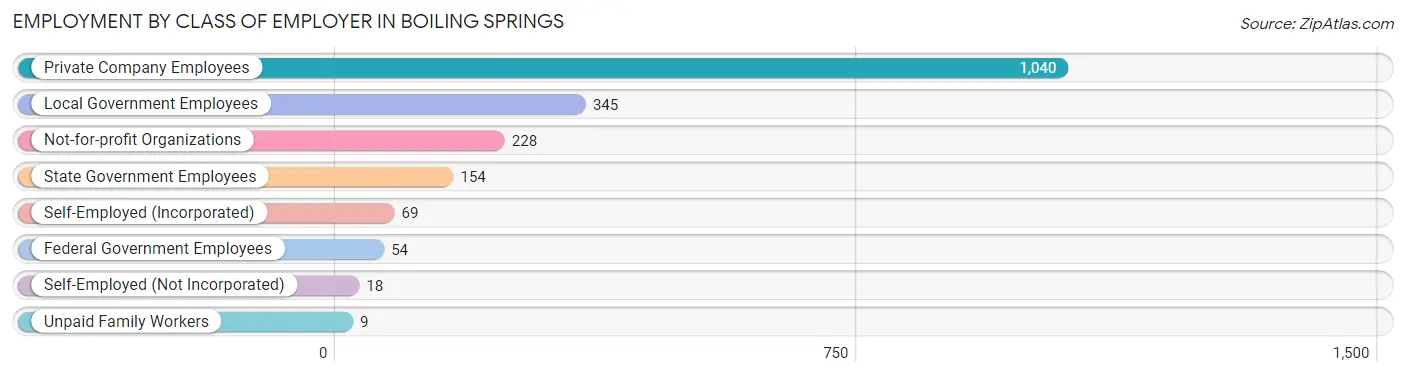
| Employer Class | # Employees | % Employees |
| Private Company Employees | 1,040 | 54.2% |
| Self-Employed (Incorporated) | 69 | 3.6% |
| Self-Employed (Not Incorporated) | 18 | 0.9% |
| Not-for-profit Organizations | 228 | 11.9% |
| Local Government Employees | 345 | 18.0% |
| State Government Employees | 154 | 8.0% |
| Federal Government Employees | 54 | 2.8% |
| Unpaid Family Workers | 9 | 0.5% |
| Total | 1,917 | 100.0% |
Employment Status by Age in Boiling Springs
According to the labor force statistics for Boiling Springs, out of the total population over 16 years of age (3,735), 54.8% or 2,047 individuals are in the labor force, with 4.9% or 100 of them unemployed. The age group with the highest labor force participation rate is 55 to 59 years, with 94.4% or 185 individuals in the labor force. Within the labor force, the 20 to 24 years age range has the highest percentage of unemployed individuals, with 21.3% or 55 of them being unemployed.
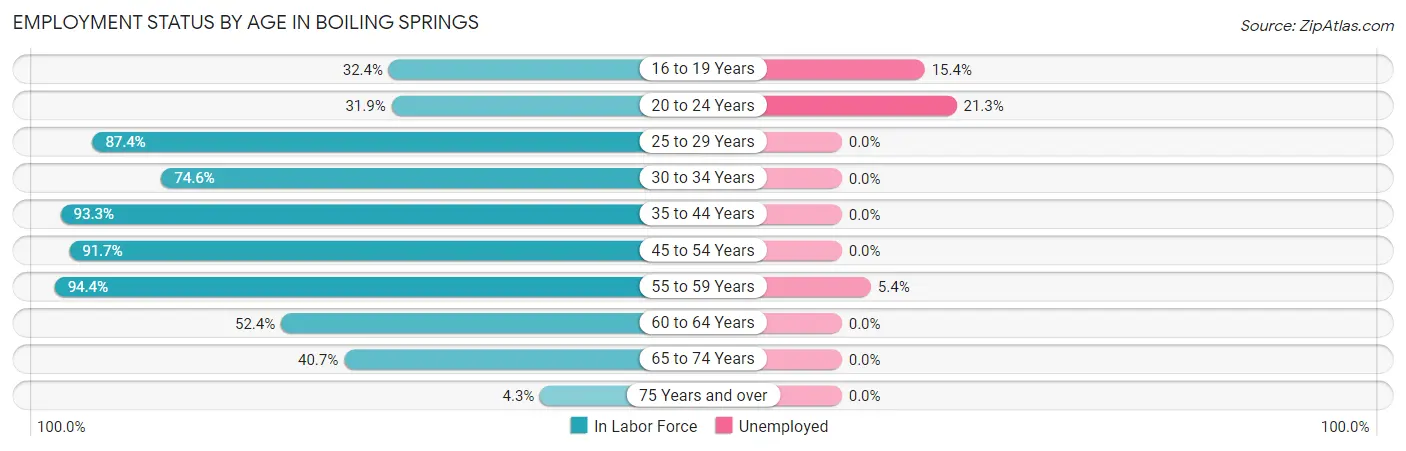
| Age Bracket | In Labor Force | Unemployed |
| 16 to 19 Years | 253 (32.4%) | 39 (15.4%) |
| 20 to 24 Years | 258 (31.9%) | 55 (21.3%) |
| 25 to 29 Years | 250 (87.4%) | 0 (0.0%) |
| 30 to 34 Years | 97 (74.6%) | 0 (0.0%) |
| 35 to 44 Years | 376 (93.3%) | 0 (0.0%) |
| 45 to 54 Years | 472 (91.7%) | 0 (0.0%) |
| 55 to 59 Years | 185 (94.4%) | 10 (5.4%) |
| 60 to 64 Years | 66 (52.4%) | 0 (0.0%) |
| 65 to 74 Years | 77 (40.7%) | 0 (0.0%) |
| 75 Years and over | 13 (4.3%) | 0 (0.0%) |
| Total | 2,047 (54.8%) | 100 (4.9%) |
Employment Status by Educational Attainment in Boiling Springs
According to labor force statistics for Boiling Springs, 87.3% of individuals (1,446) out of the total population between 25 and 64 years of age (1,656) are in the labor force, with 0.7% or 10 of them being unemployed. The group with the highest labor force participation rate are those with the educational attainment of less than high school, with 100.0% or 147 individuals in the labor force. Within the labor force, individuals with bachelor's degree or higher education have the highest percentage of unemployment, with 1.2% or 10 of them being unemployed.
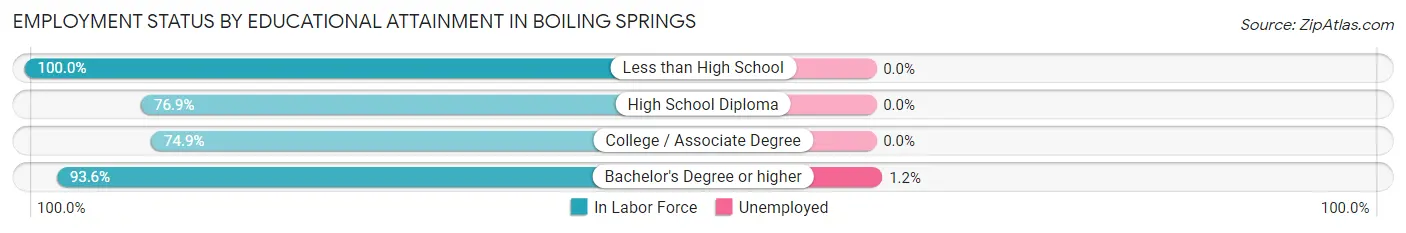
| Educational Attainment | In Labor Force | Unemployed |
| Less than High School | 147 (100.0%) | 0 (0.0%) |
| High School Diploma | 253 (76.9%) | 0 (0.0%) |
| College / Associate Degree | 236 (74.9%) | 0 (0.0%) |
| Bachelor's Degree or higher | 810 (93.6%) | 10 (1.2%) |
| Total | 1,446 (87.3%) | 12 (0.7%) |
Employment Occupations by Sex in Boiling Springs
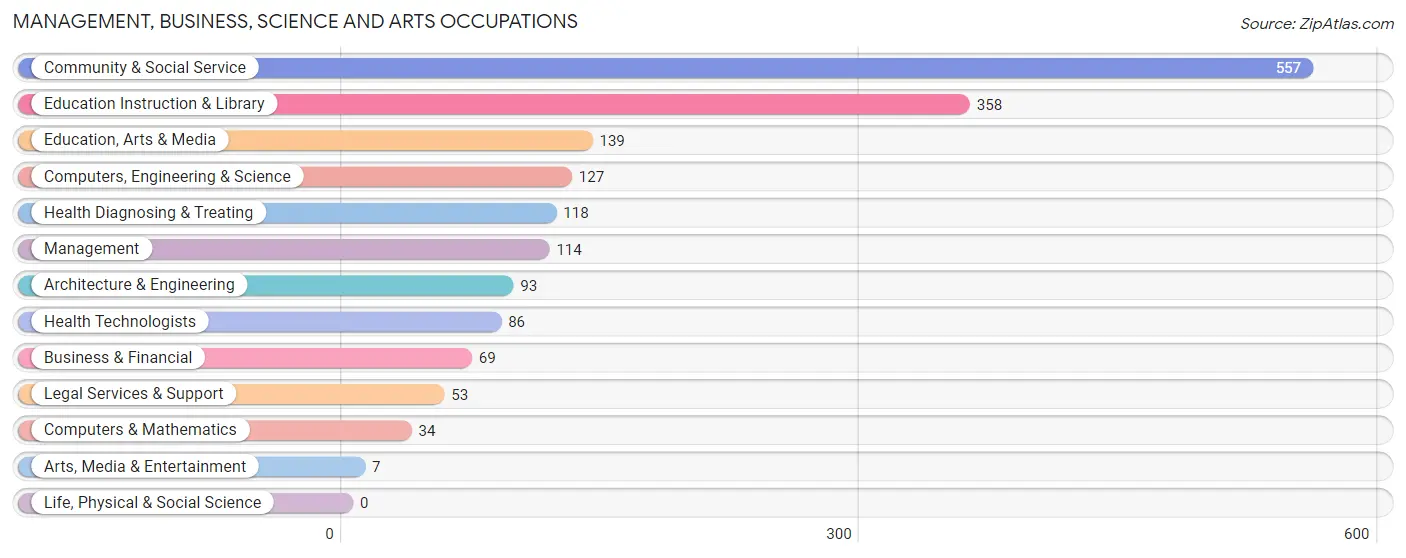
Management, Business, Science and Arts Occupations
The most common Management, Business, Science and Arts occupations in Boiling Springs are Community & Social Service (557 | 28.9%), Education Instruction & Library (358 | 18.6%), Education, Arts & Media (139 | 7.2%), Computers, Engineering & Science (127 | 6.6%), and Health Diagnosing & Treating (118 | 6.1%).
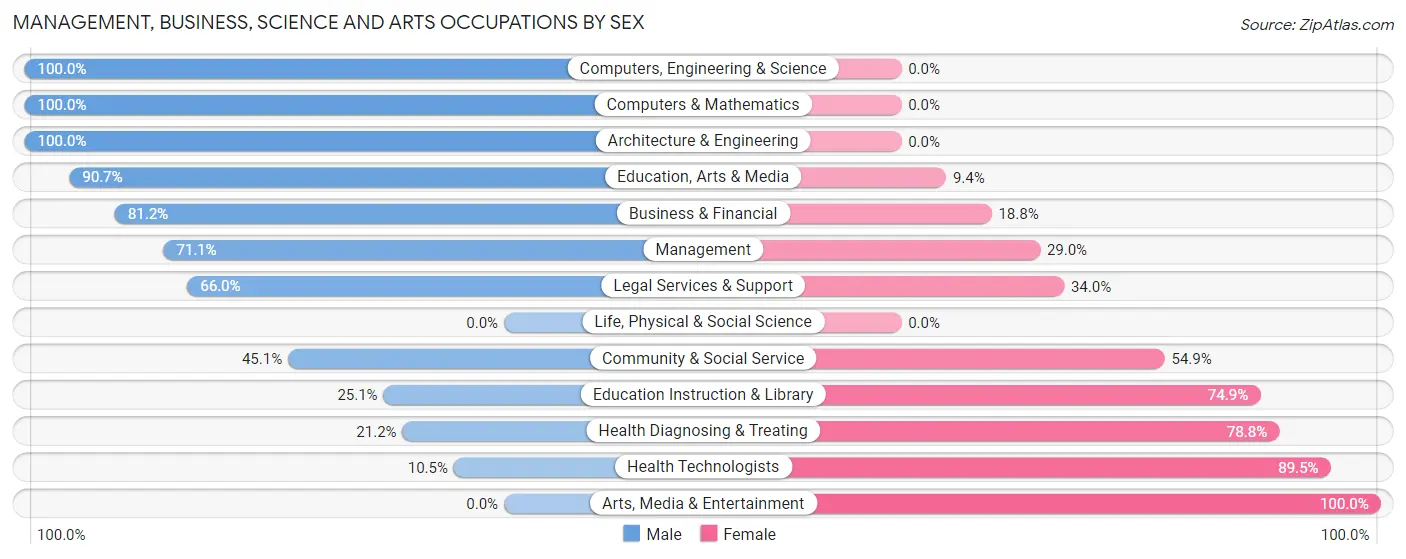
Management, Business, Science and Arts Occupations by Sex
Within the Management, Business, Science and Arts occupations in Boiling Springs, the most male-oriented occupations are Computers, Engineering & Science (100.0%), Computers & Mathematics (100.0%), and Architecture & Engineering (100.0%), while the most female-oriented occupations are Arts, Media & Entertainment (100.0%), Health Technologists (89.5%), and Health Diagnosing & Treating (78.8%).
| Occupation | Male | Female |
| Management | 81 (71.1%) | 33 (28.9%) |
| Business & Financial | 56 (81.2%) | 13 (18.8%) |
| Computers, Engineering & Science | 127 (100.0%) | 0 (0.0%) |
| Computers & Mathematics | 34 (100.0%) | 0 (0.0%) |
| Architecture & Engineering | 93 (100.0%) | 0 (0.0%) |
| Life, Physical & Social Science | 0 (0.0%) | 0 (0.0%) |
| Community & Social Service | 251 (45.1%) | 306 (54.9%) |
| Education, Arts & Media | 126 (90.6%) | 13 (9.3%) |
| Legal Services & Support | 35 (66.0%) | 18 (34.0%) |
| Education Instruction & Library | 90 (25.1%) | 268 (74.9%) |
| Arts, Media & Entertainment | 0 (0.0%) | 7 (100.0%) |
| Health Diagnosing & Treating | 25 (21.2%) | 93 (78.8%) |
| Health Technologists | 9 (10.5%) | 77 (89.5%) |
| Total (Category) | 540 (54.8%) | 445 (45.2%) |
| Total (Overall) | 941 (48.8%) | 987 (51.2%) |
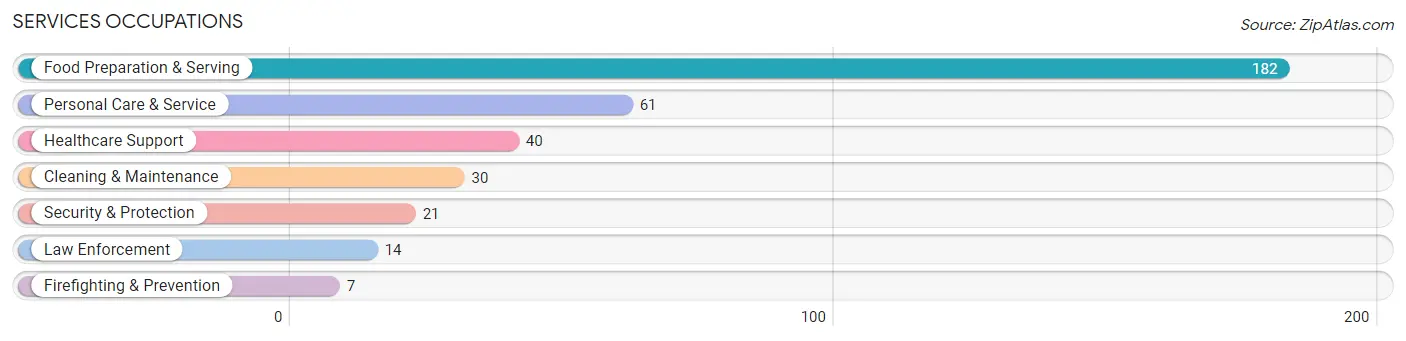
Services Occupations
The most common Services occupations in Boiling Springs are Food Preparation & Serving (182 | 9.4%), Personal Care & Service (61 | 3.2%), Healthcare Support (40 | 2.1%), Cleaning & Maintenance (30 | 1.6%), and Security & Protection (21 | 1.1%).
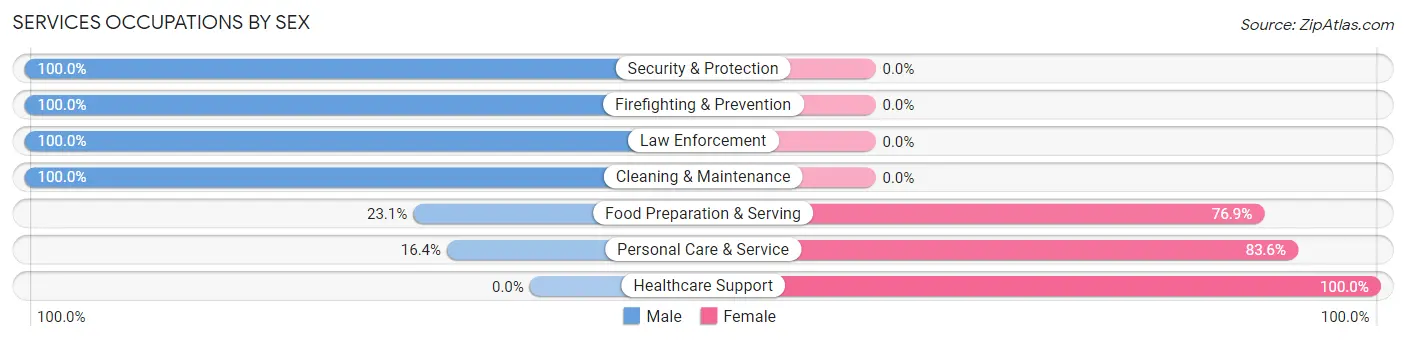
Services Occupations by Sex
Within the Services occupations in Boiling Springs, the most male-oriented occupations are Security & Protection (100.0%), Firefighting & Prevention (100.0%), and Law Enforcement (100.0%), while the most female-oriented occupations are Healthcare Support (100.0%), Personal Care & Service (83.6%), and Food Preparation & Serving (76.9%).
| Occupation | Male | Female |
| Healthcare Support | 0 (0.0%) | 40 (100.0%) |
| Security & Protection | 21 (100.0%) | 0 (0.0%) |
| Firefighting & Prevention | 7 (100.0%) | 0 (0.0%) |
| Law Enforcement | 14 (100.0%) | 0 (0.0%) |
| Food Preparation & Serving | 42 (23.1%) | 140 (76.9%) |
| Cleaning & Maintenance | 30 (100.0%) | 0 (0.0%) |
| Personal Care & Service | 10 (16.4%) | 51 (83.6%) |
| Total (Category) | 103 (30.8%) | 231 (69.2%) |
| Total (Overall) | 941 (48.8%) | 987 (51.2%) |
Sales and Office Occupations
The most common Sales and Office occupations in Boiling Springs are Office & Administration (160 | 8.3%), and Sales & Related (131 | 6.8%).
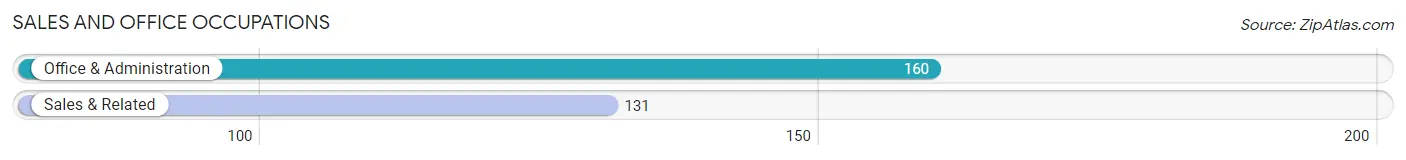
Sales and Office Occupations by Sex
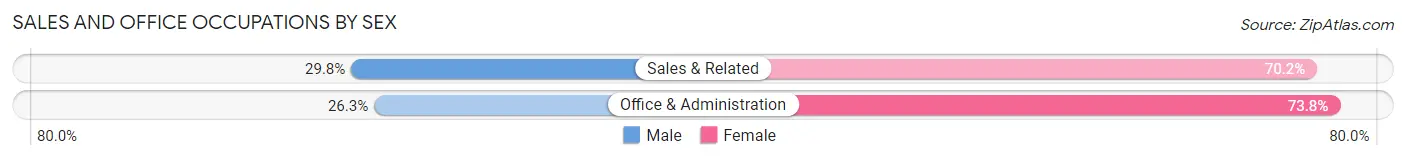
| Occupation | Male | Female |
| Sales & Related | 39 (29.8%) | 92 (70.2%) |
| Office & Administration | 42 (26.3%) | 118 (73.8%) |
| Total (Category) | 81 (27.8%) | 210 (72.2%) |
| Total (Overall) | 941 (48.8%) | 987 (51.2%) |
Natural Resources, Construction and Maintenance Occupations
The most common Natural Resources, Construction and Maintenance occupations in Boiling Springs are Installation, Maintenance & Repair (41 | 2.1%), and Construction & Extraction (21 | 1.1%).
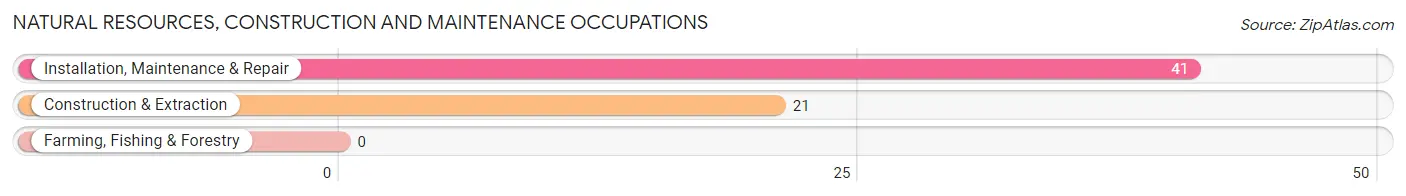
Natural Resources, Construction and Maintenance Occupations by Sex
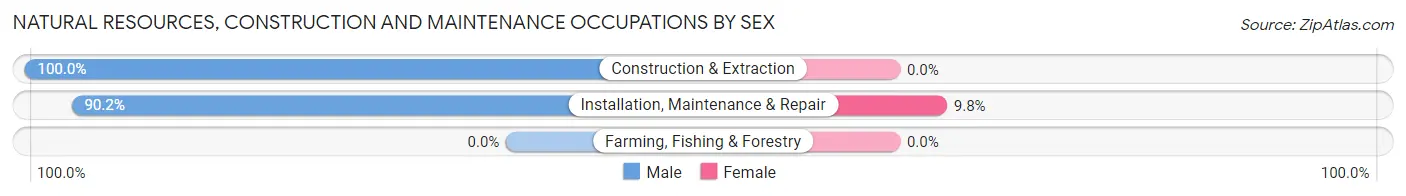
| Occupation | Male | Female |
| Farming, Fishing & Forestry | 0 (0.0%) | 0 (0.0%) |
| Construction & Extraction | 21 (100.0%) | 0 (0.0%) |
| Installation, Maintenance & Repair | 37 (90.2%) | 4 (9.8%) |
| Total (Category) | 58 (93.5%) | 4 (6.5%) |
| Total (Overall) | 941 (48.8%) | 987 (51.2%) |
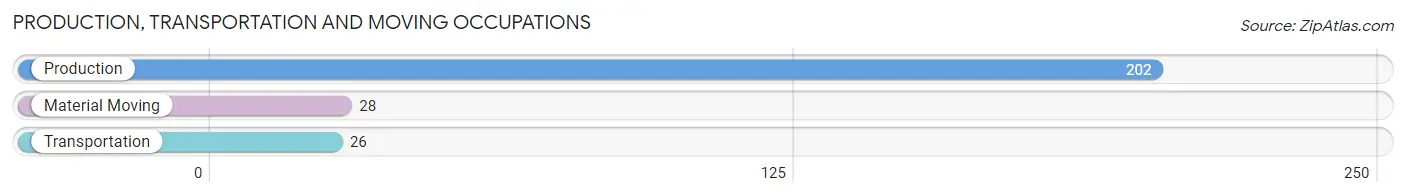
Production, Transportation and Moving Occupations
The most common Production, Transportation and Moving occupations in Boiling Springs are Production (202 | 10.5%), Material Moving (28 | 1.5%), and Transportation (26 | 1.3%).
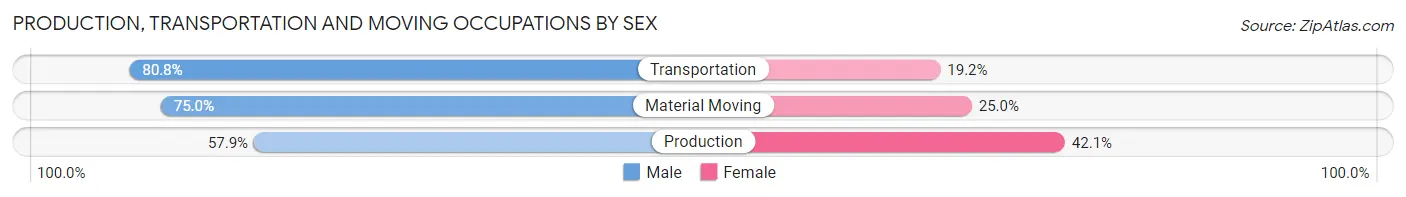
Production, Transportation and Moving Occupations by Sex
| Occupation | Male | Female |
| Production | 117 (57.9%) | 85 (42.1%) |
| Transportation | 21 (80.8%) | 5 (19.2%) |
| Material Moving | 21 (75.0%) | 7 (25.0%) |
| Total (Category) | 159 (62.1%) | 97 (37.9%) |
| Total (Overall) | 941 (48.8%) | 987 (51.2%) |
Employment Industries by Sex in Boiling Springs
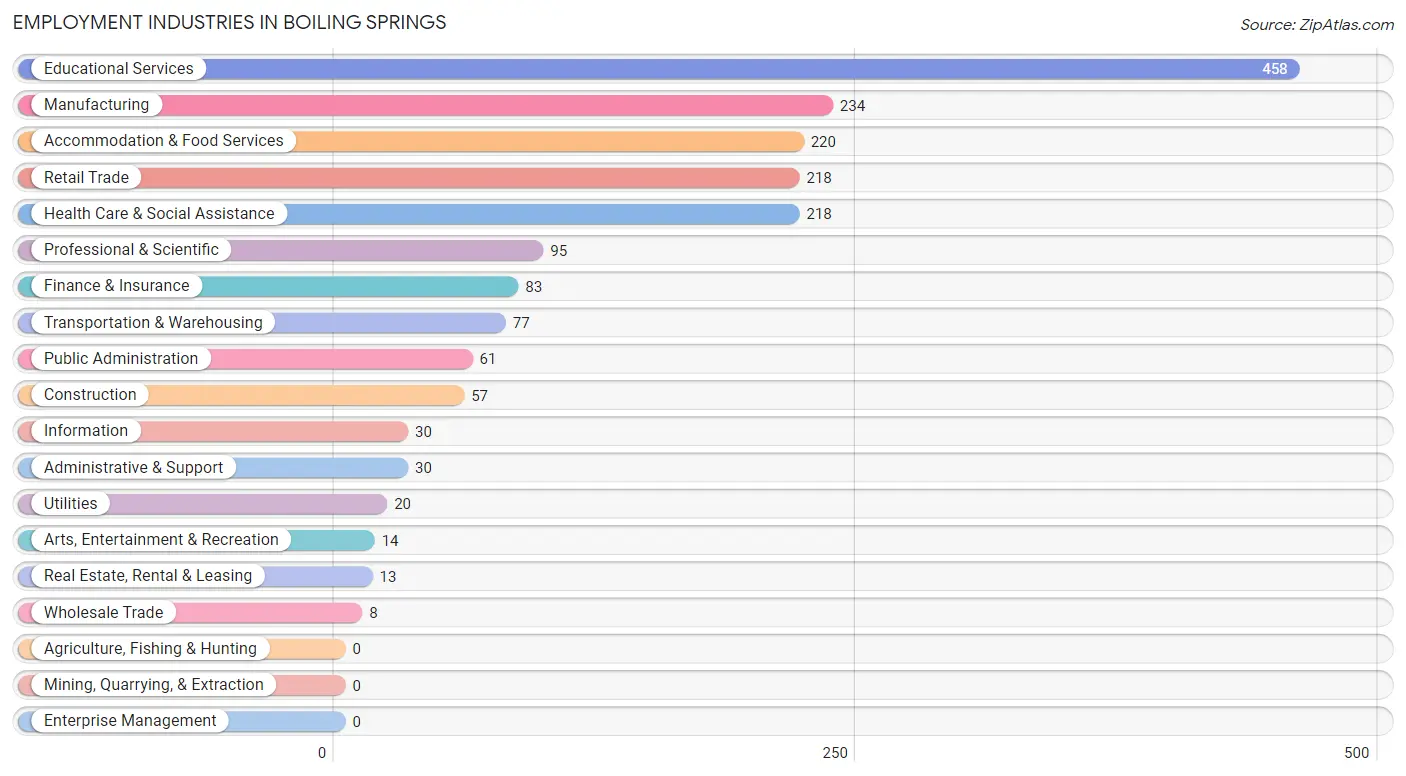
Employment Industries in Boiling Springs
The major employment industries in Boiling Springs include Educational Services (458 | 23.8%), Manufacturing (234 | 12.1%), Accommodation & Food Services (220 | 11.4%), Retail Trade (218 | 11.3%), and Health Care & Social Assistance (218 | 11.3%).
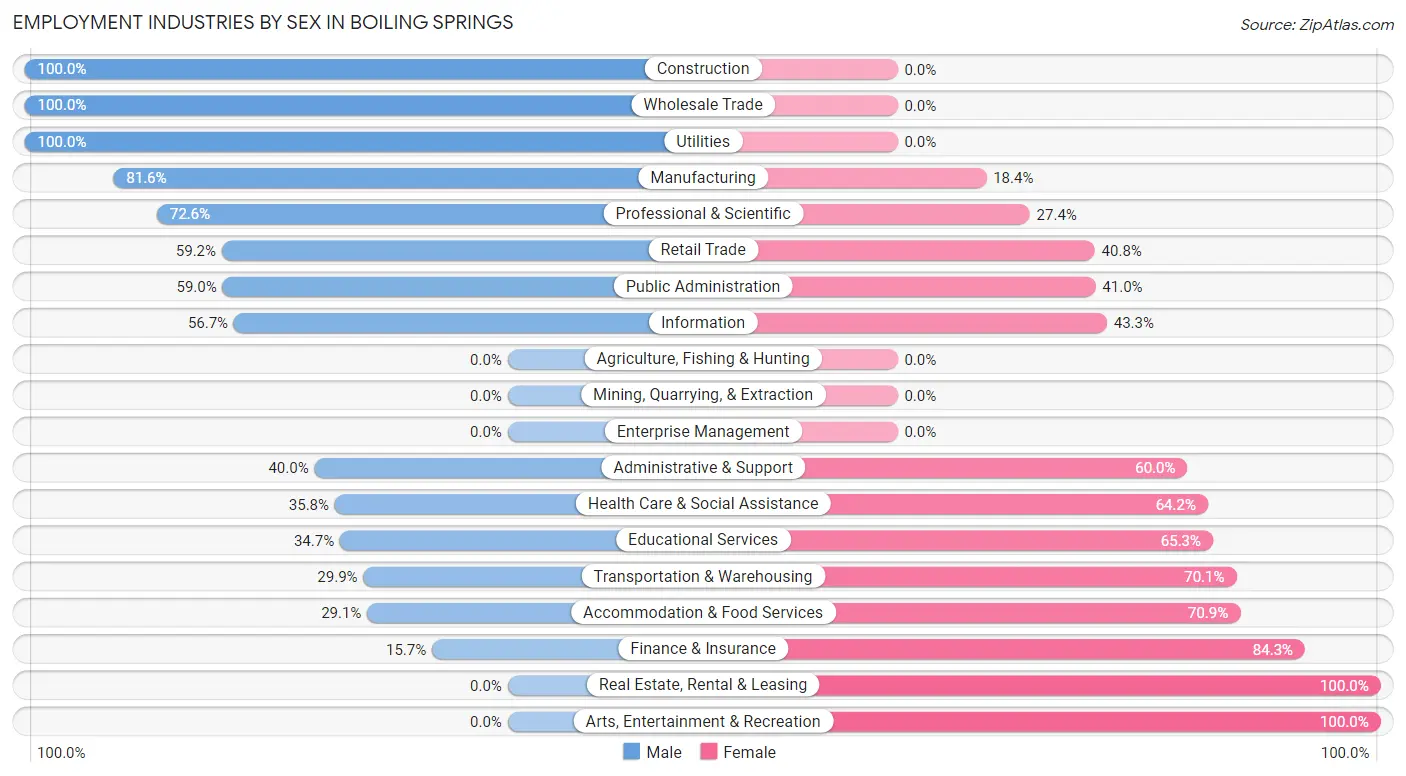
Employment Industries by Sex in Boiling Springs
The Boiling Springs industries that see more men than women are Construction (100.0%), Wholesale Trade (100.0%), and Utilities (100.0%), whereas the industries that tend to have a higher number of women are Real Estate, Rental & Leasing (100.0%), Arts, Entertainment & Recreation (100.0%), and Finance & Insurance (84.3%).
| Industry | Male | Female |
| Agriculture, Fishing & Hunting | 0 (0.0%) | 0 (0.0%) |
| Mining, Quarrying, & Extraction | 0 (0.0%) | 0 (0.0%) |
| Construction | 57 (100.0%) | 0 (0.0%) |
| Manufacturing | 191 (81.6%) | 43 (18.4%) |
| Wholesale Trade | 8 (100.0%) | 0 (0.0%) |
| Retail Trade | 129 (59.2%) | 89 (40.8%) |
| Transportation & Warehousing | 23 (29.9%) | 54 (70.1%) |
| Utilities | 20 (100.0%) | 0 (0.0%) |
| Information | 17 (56.7%) | 13 (43.3%) |
| Finance & Insurance | 13 (15.7%) | 70 (84.3%) |
| Real Estate, Rental & Leasing | 0 (0.0%) | 13 (100.0%) |
| Professional & Scientific | 69 (72.6%) | 26 (27.4%) |
| Enterprise Management | 0 (0.0%) | 0 (0.0%) |
| Administrative & Support | 12 (40.0%) | 18 (60.0%) |
| Educational Services | 159 (34.7%) | 299 (65.3%) |
| Health Care & Social Assistance | 78 (35.8%) | 140 (64.2%) |
| Arts, Entertainment & Recreation | 0 (0.0%) | 14 (100.0%) |
| Accommodation & Food Services | 64 (29.1%) | 156 (70.9%) |
| Public Administration | 36 (59.0%) | 25 (41.0%) |
| Total | 941 (48.8%) | 987 (51.2%) |
Education in Boiling Springs
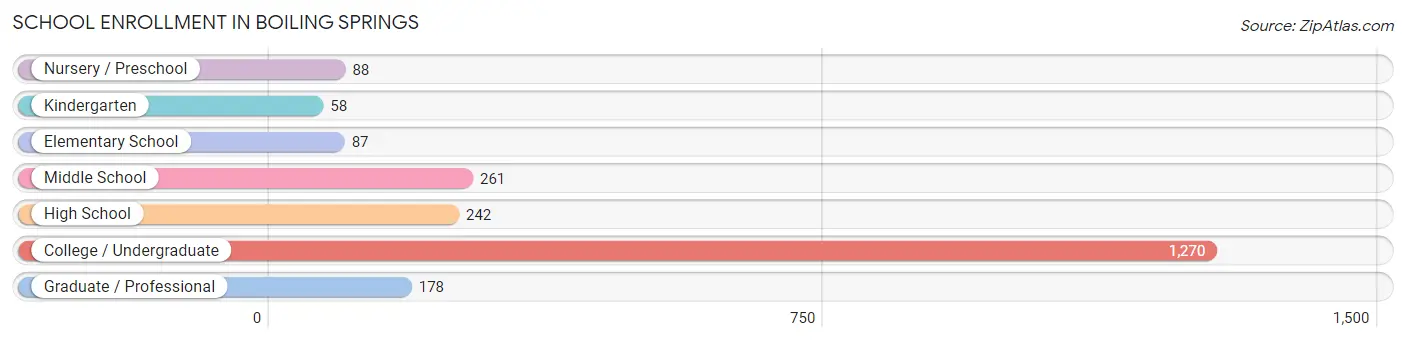
School Enrollment in Boiling Springs
The most common levels of schooling among the 2,184 students in Boiling Springs are college / undergraduate (1,270 | 58.2%), middle school (261 | 11.9%), and high school (242 | 11.1%).
| School Level | # Students | % Students |
| Nursery / Preschool | 88 | 4.0% |
| Kindergarten | 58 | 2.7% |
| Elementary School | 87 | 4.0% |
| Middle School | 261 | 11.9% |
| High School | 242 | 11.1% |
| College / Undergraduate | 1,270 | 58.2% |
| Graduate / Professional | 178 | 8.2% |
| Total | 2,184 | 100.0% |
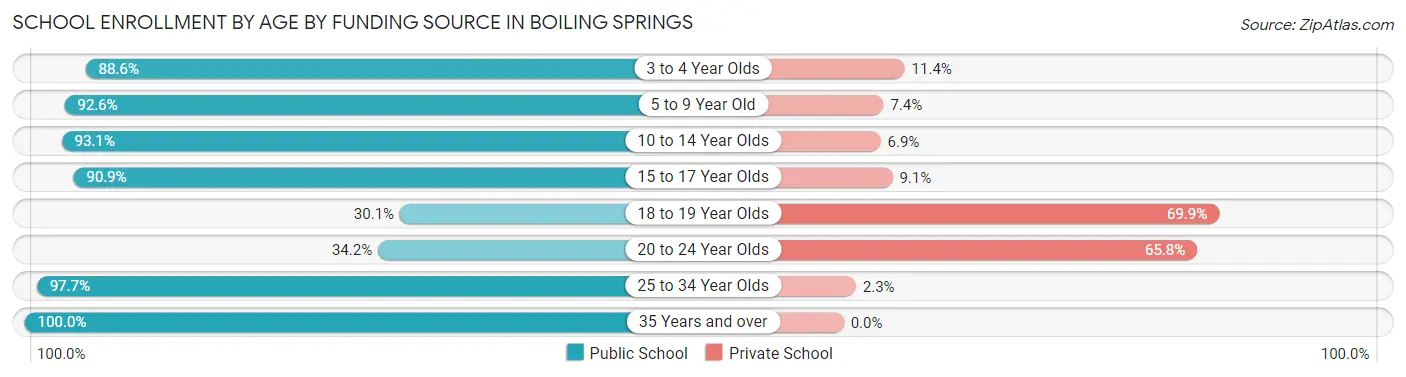
School Enrollment by Age by Funding Source in Boiling Springs
Out of a total of 2,184 students who are enrolled in schools in Boiling Springs, 904 (41.4%) attend a private institution, while the remaining 1,280 (58.6%) are enrolled in public schools. The age group of 18 to 19 year olds has the highest likelihood of being enrolled in private schools, with 402 (69.9% in the age bracket) enrolled. Conversely, the age group of 35 years and over has the lowest likelihood of being enrolled in a private school, with 47 (100.0% in the age bracket) attending a public institution.
| Age Bracket | Public School | Private School |
| 3 to 4 Year Olds | 78 (88.6%) | 10 (11.4%) |
| 5 to 9 Year Old | 125 (92.6%) | 10 (7.4%) |
| 10 to 14 Year Olds | 257 (93.1%) | 19 (6.9%) |
| 15 to 17 Year Olds | 200 (90.9%) | 20 (9.1%) |
| 18 to 19 Year Olds | 173 (30.1%) | 402 (69.9%) |
| 20 to 24 Year Olds | 228 (34.2%) | 439 (65.8%) |
| 25 to 34 Year Olds | 172 (97.7%) | 4 (2.3%) |
| 35 Years and over | 47 (100.0%) | 0 (0.0%) |
| Total | 1,280 (58.6%) | 904 (41.4%) |
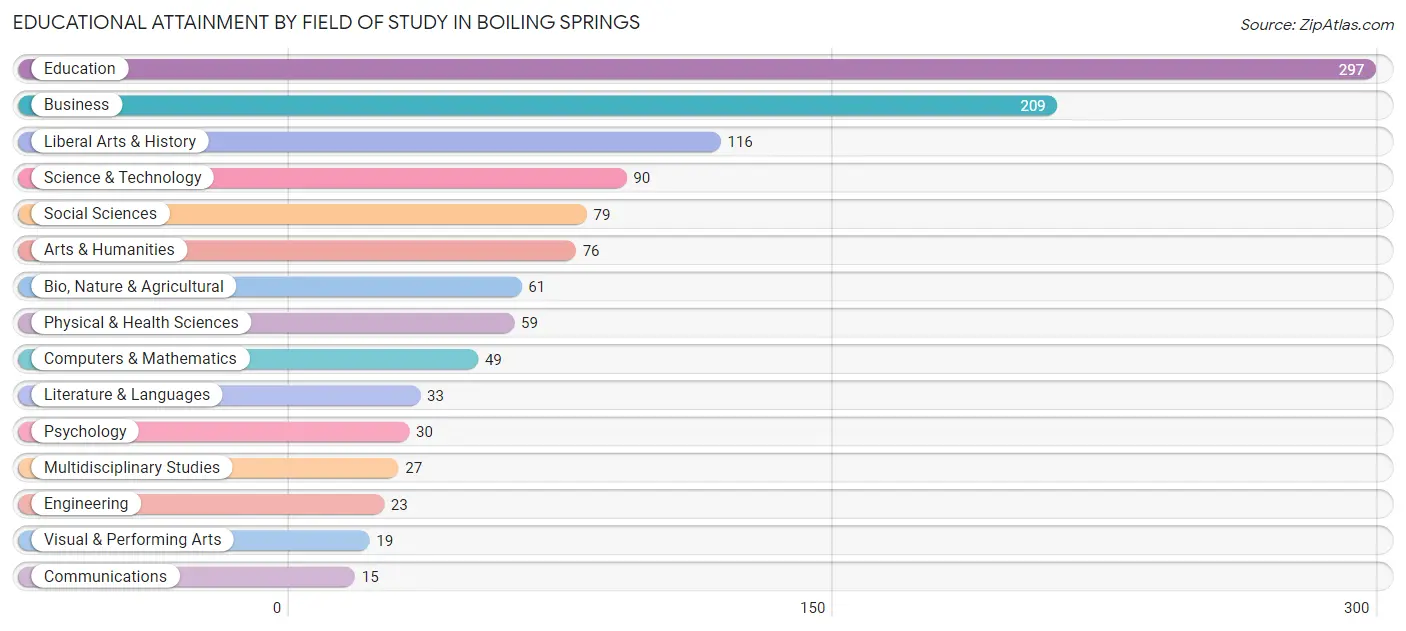
Educational Attainment by Field of Study in Boiling Springs
Education (297 | 25.1%), business (209 | 17.7%), liberal arts & history (116 | 9.8%), science & technology (90 | 7.6%), and social sciences (79 | 6.7%) are the most common fields of study among 1,183 individuals in Boiling Springs who have obtained a bachelor's degree or higher.
| Field of Study | # Graduates | % Graduates |
| Computers & Mathematics | 49 | 4.1% |
| Bio, Nature & Agricultural | 61 | 5.2% |
| Physical & Health Sciences | 59 | 5.0% |
| Psychology | 30 | 2.5% |
| Social Sciences | 79 | 6.7% |
| Engineering | 23 | 1.9% |
| Multidisciplinary Studies | 27 | 2.3% |
| Science & Technology | 90 | 7.6% |
| Business | 209 | 17.7% |
| Education | 297 | 25.1% |
| Literature & Languages | 33 | 2.8% |
| Liberal Arts & History | 116 | 9.8% |
| Visual & Performing Arts | 19 | 1.6% |
| Communications | 15 | 1.3% |
| Arts & Humanities | 76 | 6.4% |
| Total | 1,183 | 100.0% |
Transportation & Commute in Boiling Springs
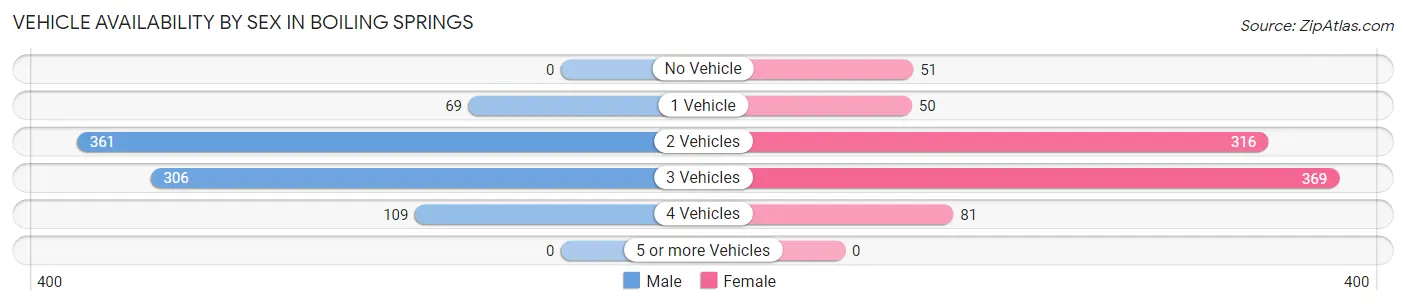
Vehicle Availability by Sex in Boiling Springs
The most prevalent vehicle ownership categories in Boiling Springs are males with 2 vehicles (361, accounting for 42.7%) and females with 2 vehicles (316, making up 41.6%).
| Vehicles Available | Male | Female |
| No Vehicle | 0 (0.0%) | 51 (5.9%) |
| 1 Vehicle | 69 (8.2%) | 50 (5.8%) |
| 2 Vehicles | 361 (42.7%) | 316 (36.4%) |
| 3 Vehicles | 306 (36.2%) | 369 (42.6%) |
| 4 Vehicles | 109 (12.9%) | 81 (9.3%) |
| 5 or more Vehicles | 0 (0.0%) | 0 (0.0%) |
| Total | 845 (100.0%) | 867 (100.0%) |
Commute Time in Boiling Springs
The most frequently occuring commute durations in Boiling Springs are 10 to 14 minutes (349 commuters, 19.9%), 30 to 34 minutes (283 commuters, 16.1%), and 5 to 9 minutes (267 commuters, 15.2%).
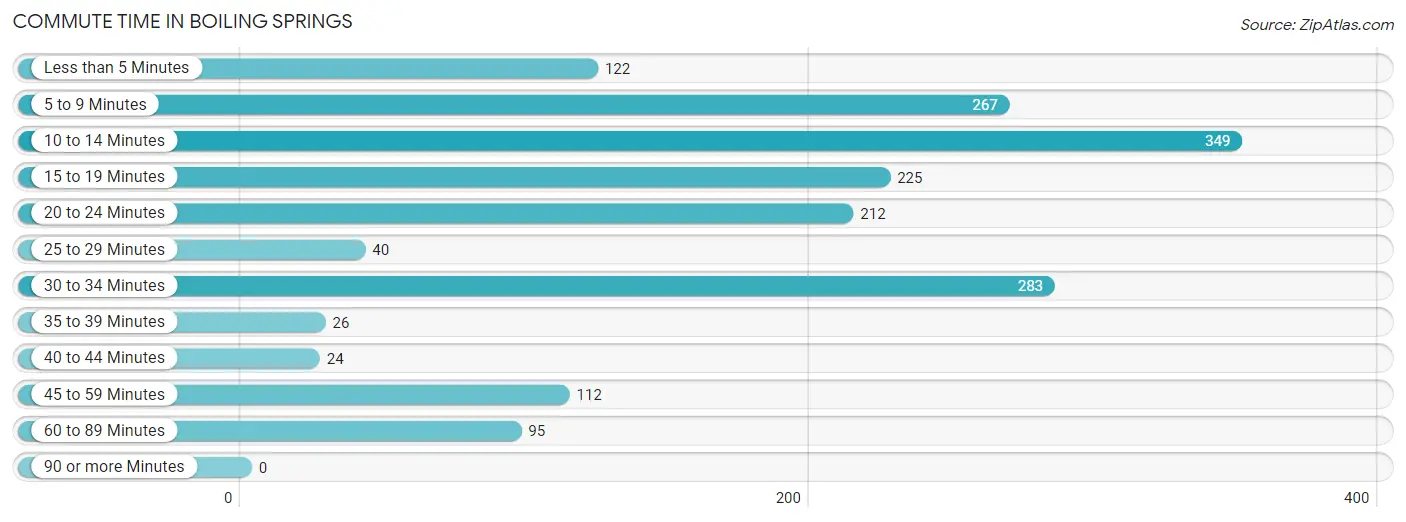
| Commute Time | # Commuters | % Commuters |
| Less than 5 Minutes | 122 | 7.0% |
| 5 to 9 Minutes | 267 | 15.2% |
| 10 to 14 Minutes | 349 | 19.9% |
| 15 to 19 Minutes | 225 | 12.8% |
| 20 to 24 Minutes | 212 | 12.1% |
| 25 to 29 Minutes | 40 | 2.3% |
| 30 to 34 Minutes | 283 | 16.1% |
| 35 to 39 Minutes | 26 | 1.5% |
| 40 to 44 Minutes | 24 | 1.4% |
| 45 to 59 Minutes | 112 | 6.4% |
| 60 to 89 Minutes | 95 | 5.4% |
| 90 or more Minutes | 0 | 0.0% |
Commute Time by Sex in Boiling Springs
The most common commute times in Boiling Springs are 10 to 14 minutes (193 commuters, 24.7%) for males and 5 to 9 minutes (182 commuters, 18.7%) for females.
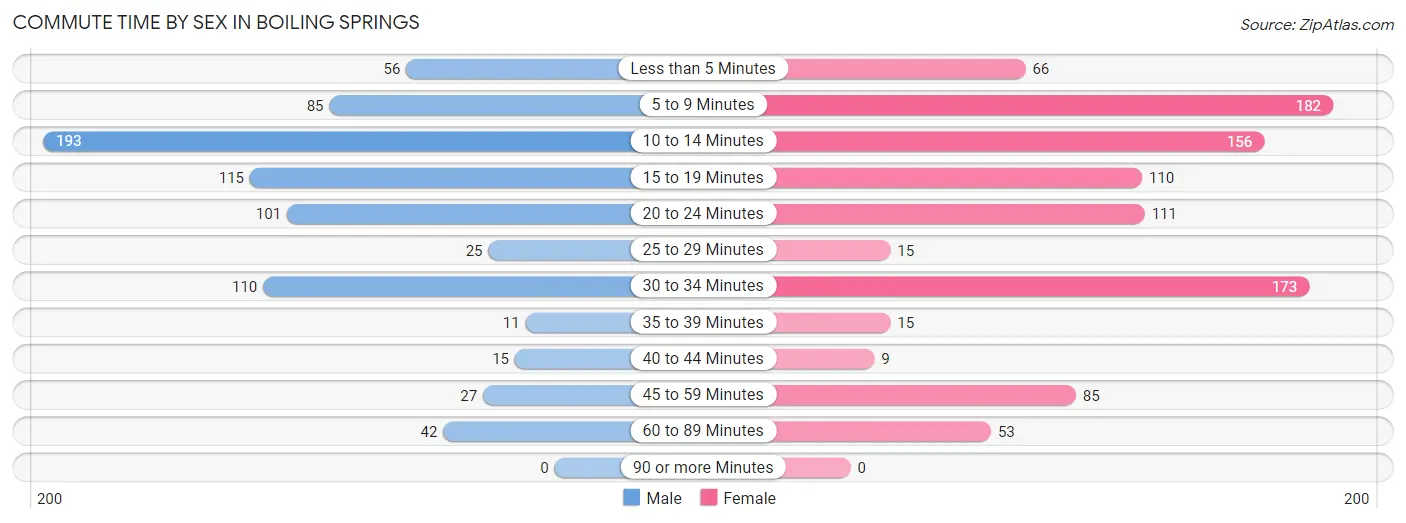
| Commute Time | Male | Female |
| Less than 5 Minutes | 56 (7.2%) | 66 (6.8%) |
| 5 to 9 Minutes | 85 (10.9%) | 182 (18.7%) |
| 10 to 14 Minutes | 193 (24.7%) | 156 (16.0%) |
| 15 to 19 Minutes | 115 (14.7%) | 110 (11.3%) |
| 20 to 24 Minutes | 101 (13.0%) | 111 (11.4%) |
| 25 to 29 Minutes | 25 (3.2%) | 15 (1.5%) |
| 30 to 34 Minutes | 110 (14.1%) | 173 (17.7%) |
| 35 to 39 Minutes | 11 (1.4%) | 15 (1.5%) |
| 40 to 44 Minutes | 15 (1.9%) | 9 (0.9%) |
| 45 to 59 Minutes | 27 (3.5%) | 85 (8.7%) |
| 60 to 89 Minutes | 42 (5.4%) | 53 (5.4%) |
| 90 or more Minutes | 0 (0.0%) | 0 (0.0%) |
Time of Departure to Work by Sex in Boiling Springs
The most frequent times of departure to work in Boiling Springs are 7:00 AM to 7:29 AM (138, 17.7%) for males and 7:30 AM to 7:59 AM (207, 21.2%) for females.
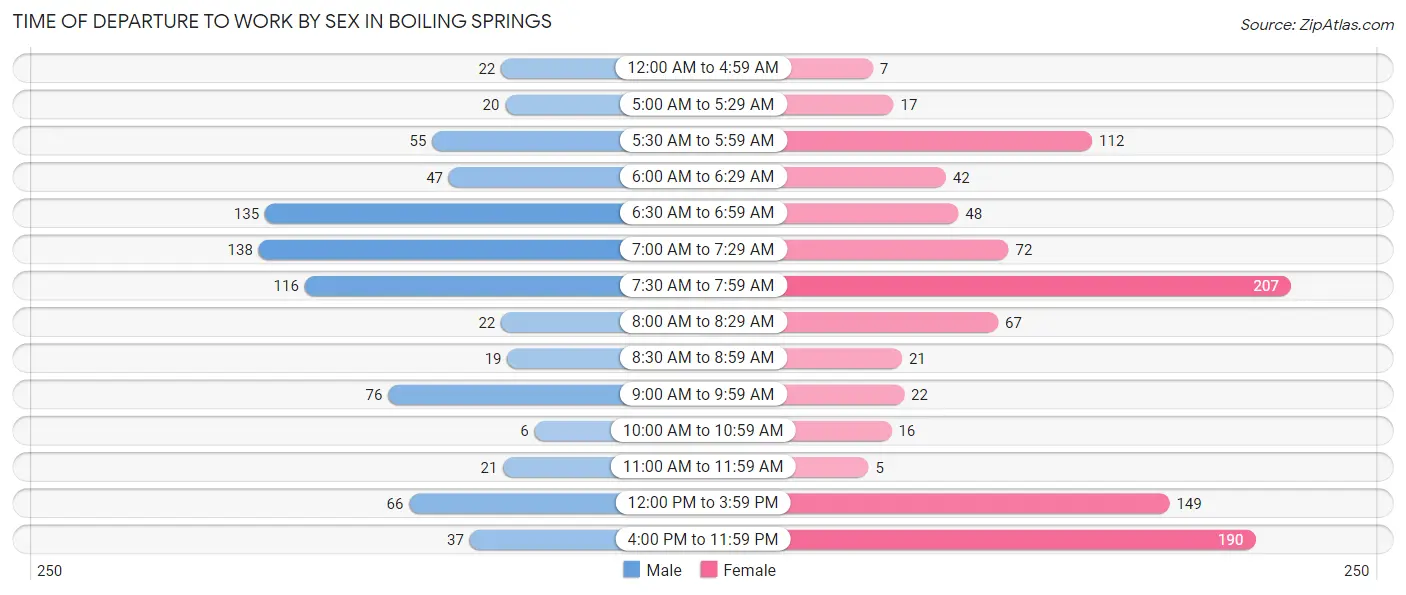
| Time of Departure | Male | Female |
| 12:00 AM to 4:59 AM | 22 (2.8%) | 7 (0.7%) |
| 5:00 AM to 5:29 AM | 20 (2.6%) | 17 (1.7%) |
| 5:30 AM to 5:59 AM | 55 (7.0%) | 112 (11.5%) |
| 6:00 AM to 6:29 AM | 47 (6.0%) | 42 (4.3%) |
| 6:30 AM to 6:59 AM | 135 (17.3%) | 48 (4.9%) |
| 7:00 AM to 7:29 AM | 138 (17.7%) | 72 (7.4%) |
| 7:30 AM to 7:59 AM | 116 (14.9%) | 207 (21.2%) |
| 8:00 AM to 8:29 AM | 22 (2.8%) | 67 (6.9%) |
| 8:30 AM to 8:59 AM | 19 (2.4%) | 21 (2.1%) |
| 9:00 AM to 9:59 AM | 76 (9.7%) | 22 (2.3%) |
| 10:00 AM to 10:59 AM | 6 (0.8%) | 16 (1.6%) |
| 11:00 AM to 11:59 AM | 21 (2.7%) | 5 (0.5%) |
| 12:00 PM to 3:59 PM | 66 (8.5%) | 149 (15.3%) |
| 4:00 PM to 11:59 PM | 37 (4.7%) | 190 (19.5%) |
| Total | 780 (100.0%) | 975 (100.0%) |
Housing Occupancy in Boiling Springs
Occupancy by Ownership in Boiling Springs
Of the total 1,092 dwellings in Boiling Springs, owner-occupied units account for 887 (81.2%), while renter-occupied units make up 205 (18.8%).
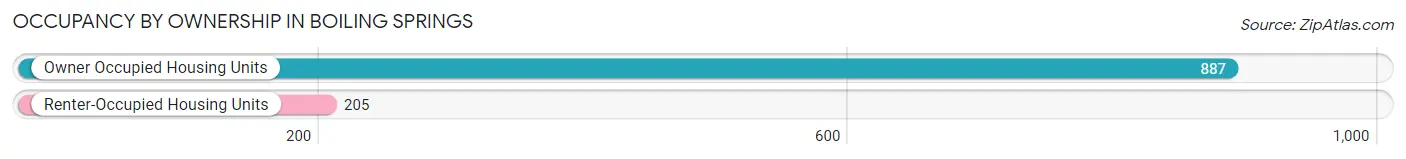
| Occupancy | # Housing Units | % Housing Units |
| Owner Occupied Housing Units | 887 | 81.2% |
| Renter-Occupied Housing Units | 205 | 18.8% |
| Total Occupied Housing Units | 1,092 | 100.0% |
Occupancy by Household Size in Boiling Springs
| Household Size | # Housing Units | % Housing Units |
| 1-Person Household | 166 | 15.2% |
| 2-Person Household | 425 | 38.9% |
| 3-Person Household | 234 | 21.4% |
| 4+ Person Household | 267 | 24.4% |
| Total Housing Units | 1,092 | 100.0% |
Occupancy by Ownership by Household Size in Boiling Springs
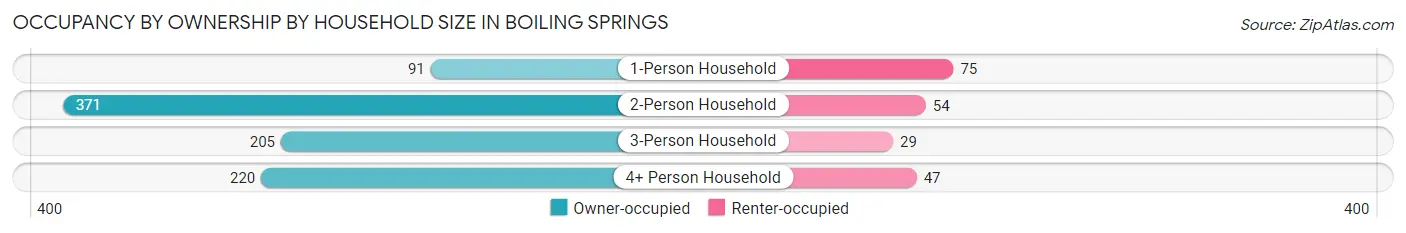
| Household Size | Owner-occupied | Renter-occupied |
| 1-Person Household | 91 (54.8%) | 75 (45.2%) |
| 2-Person Household | 371 (87.3%) | 54 (12.7%) |
| 3-Person Household | 205 (87.6%) | 29 (12.4%) |
| 4+ Person Household | 220 (82.4%) | 47 (17.6%) |
| Total Housing Units | 887 (81.2%) | 205 (18.8%) |
Occupancy by Educational Attainment in Boiling Springs
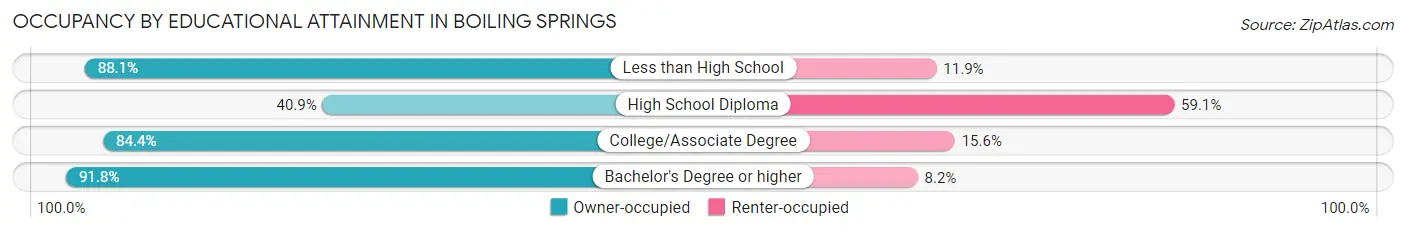
| Household Size | Owner-occupied | Renter-occupied |
| Less than High School | 59 (88.1%) | 8 (11.9%) |
| High School Diploma | 79 (40.9%) | 114 (59.1%) |
| College/Associate Degree | 168 (84.4%) | 31 (15.6%) |
| Bachelor's Degree or higher | 581 (91.8%) | 52 (8.2%) |
Occupancy by Age of Householder in Boiling Springs
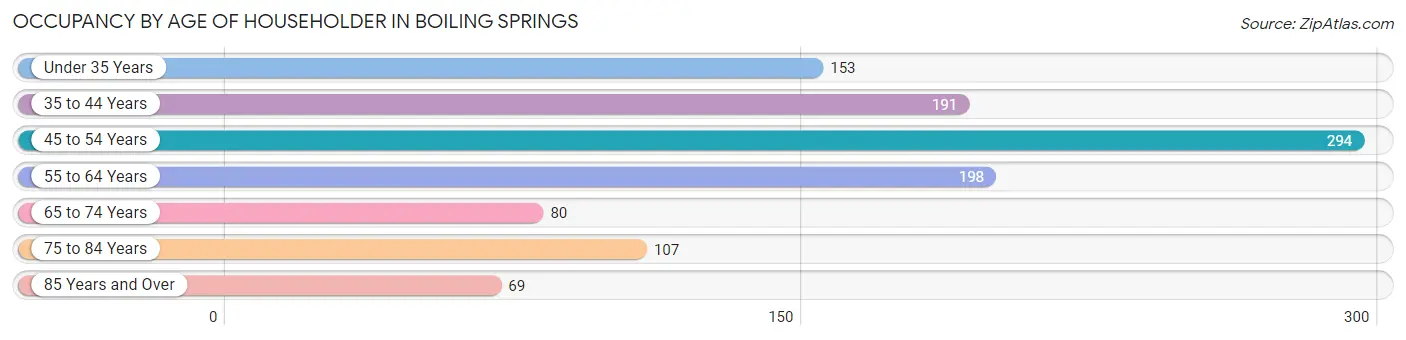
| Age Bracket | # Households | % Households |
| Under 35 Years | 153 | 14.0% |
| 35 to 44 Years | 191 | 17.5% |
| 45 to 54 Years | 294 | 26.9% |
| 55 to 64 Years | 198 | 18.1% |
| 65 to 74 Years | 80 | 7.3% |
| 75 to 84 Years | 107 | 9.8% |
| 85 Years and Over | 69 | 6.3% |
| Total | 1,092 | 100.0% |
Housing Finances in Boiling Springs
Median Income by Occupancy in Boiling Springs
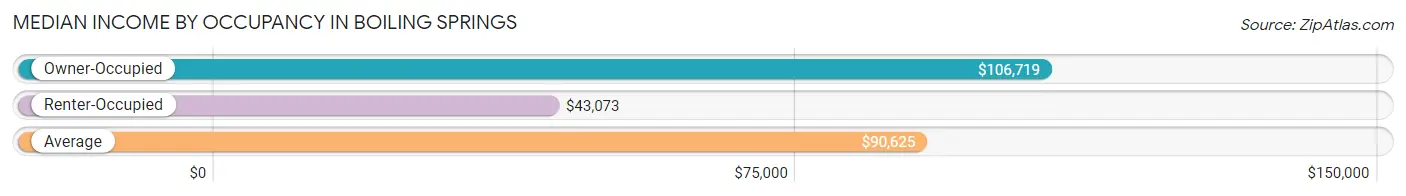
| Occupancy Type | # Households | Median Income |
| Owner-Occupied | 887 (81.2%) | $106,719 |
| Renter-Occupied | 205 (18.8%) | $43,073 |
| Average | 1,092 (100.0%) | $90,625 |
Occupancy by Householder Income Bracket in Boiling Springs
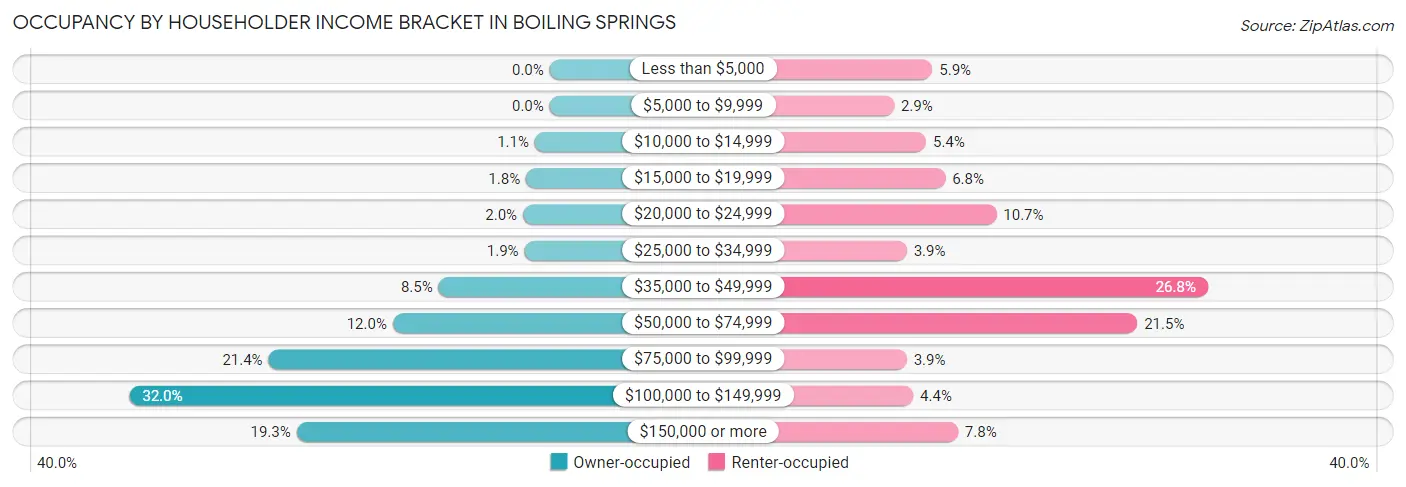
| Income Bracket | Owner-occupied | Renter-occupied |
| Less than $5,000 | 0 (0.0%) | 12 (5.9%) |
| $5,000 to $9,999 | 0 (0.0%) | 6 (2.9%) |
| $10,000 to $14,999 | 10 (1.1%) | 11 (5.4%) |
| $15,000 to $19,999 | 16 (1.8%) | 14 (6.8%) |
| $20,000 to $24,999 | 18 (2.0%) | 22 (10.7%) |
| $25,000 to $34,999 | 17 (1.9%) | 8 (3.9%) |
| $35,000 to $49,999 | 75 (8.5%) | 55 (26.8%) |
| $50,000 to $74,999 | 106 (11.9%) | 44 (21.5%) |
| $75,000 to $99,999 | 190 (21.4%) | 8 (3.9%) |
| $100,000 to $149,999 | 284 (32.0%) | 9 (4.4%) |
| $150,000 or more | 171 (19.3%) | 16 (7.8%) |
| Total | 887 (100.0%) | 205 (100.0%) |
Monthly Housing Cost Tiers in Boiling Springs
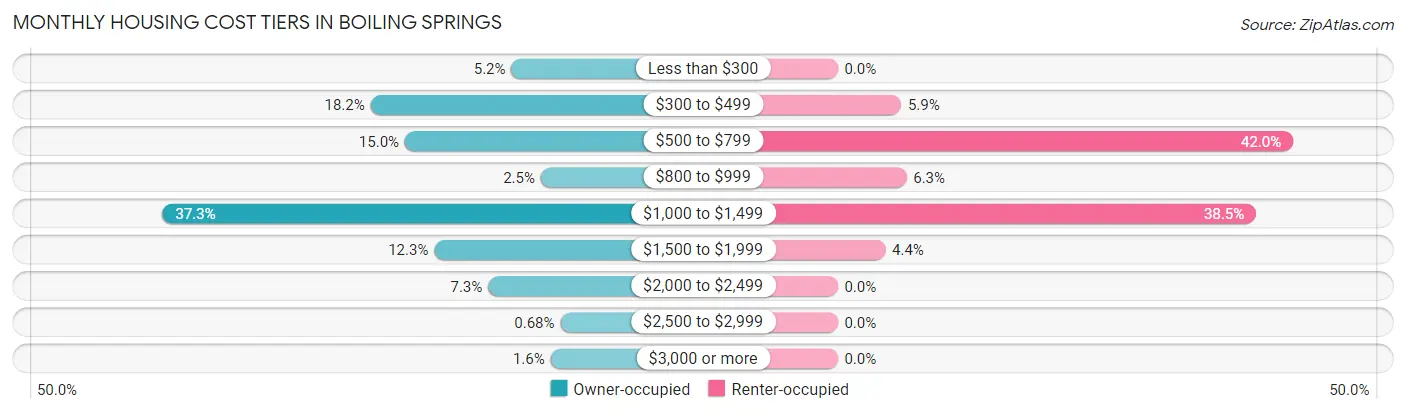
| Monthly Cost | Owner-occupied | Renter-occupied |
| Less than $300 | 46 (5.2%) | 0 (0.0%) |
| $300 to $499 | 161 (18.1%) | 12 (5.9%) |
| $500 to $799 | 133 (15.0%) | 86 (41.9%) |
| $800 to $999 | 22 (2.5%) | 13 (6.3%) |
| $1,000 to $1,499 | 331 (37.3%) | 79 (38.5%) |
| $1,500 to $1,999 | 109 (12.3%) | 9 (4.4%) |
| $2,000 to $2,499 | 65 (7.3%) | 0 (0.0%) |
| $2,500 to $2,999 | 6 (0.7%) | 0 (0.0%) |
| $3,000 or more | 14 (1.6%) | 0 (0.0%) |
| Total | 887 (100.0%) | 205 (100.0%) |
Physical Housing Characteristics in Boiling Springs
Housing Structures in Boiling Springs
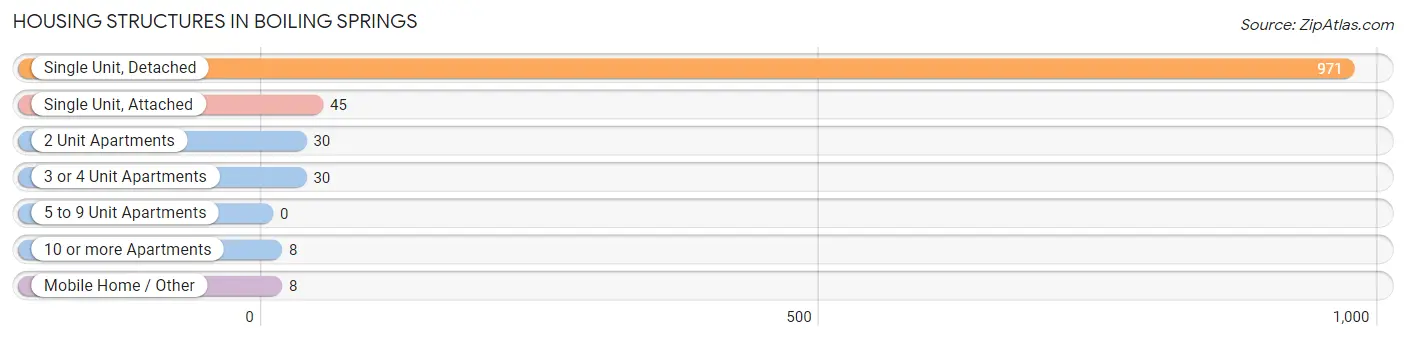
| Structure Type | # Housing Units | % Housing Units |
| Single Unit, Detached | 971 | 88.9% |
| Single Unit, Attached | 45 | 4.1% |
| 2 Unit Apartments | 30 | 2.8% |
| 3 or 4 Unit Apartments | 30 | 2.8% |
| 5 to 9 Unit Apartments | 0 | 0.0% |
| 10 or more Apartments | 8 | 0.7% |
| Mobile Home / Other | 8 | 0.7% |
| Total | 1,092 | 100.0% |
Housing Structures by Occupancy in Boiling Springs
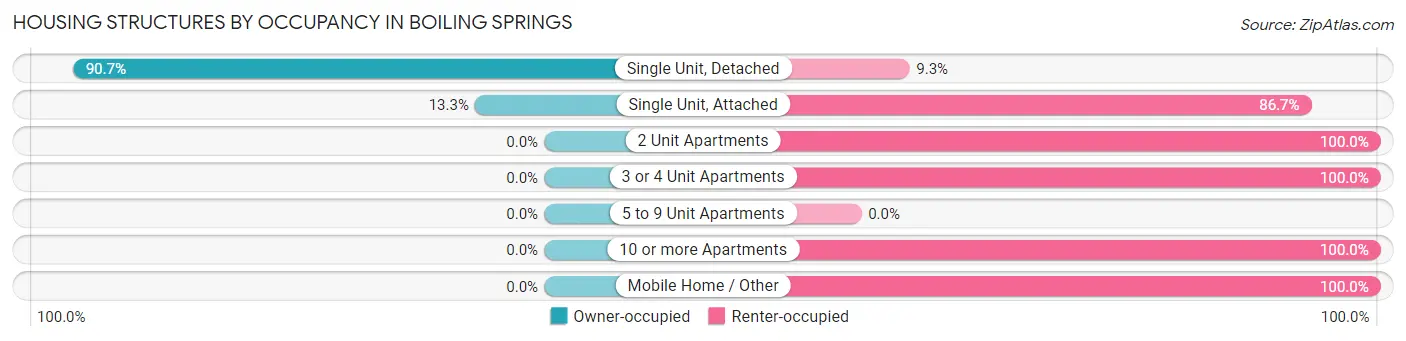
| Structure Type | Owner-occupied | Renter-occupied |
| Single Unit, Detached | 881 (90.7%) | 90 (9.3%) |
| Single Unit, Attached | 6 (13.3%) | 39 (86.7%) |
| 2 Unit Apartments | 0 (0.0%) | 30 (100.0%) |
| 3 or 4 Unit Apartments | 0 (0.0%) | 30 (100.0%) |
| 5 to 9 Unit Apartments | 0 (0.0%) | 0 (0.0%) |
| 10 or more Apartments | 0 (0.0%) | 8 (100.0%) |
| Mobile Home / Other | 0 (0.0%) | 8 (100.0%) |
| Total | 887 (81.2%) | 205 (18.8%) |
Housing Structures by Number of Rooms in Boiling Springs
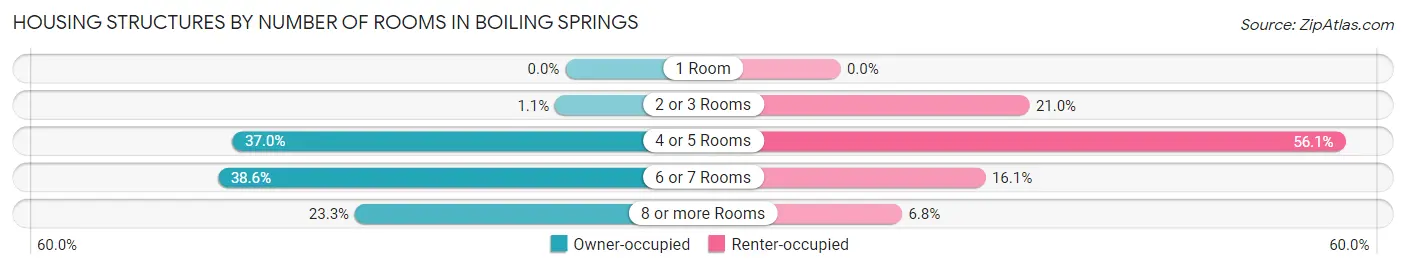
| Number of Rooms | Owner-occupied | Renter-occupied |
| 1 Room | 0 (0.0%) | 0 (0.0%) |
| 2 or 3 Rooms | 10 (1.1%) | 43 (21.0%) |
| 4 or 5 Rooms | 328 (37.0%) | 115 (56.1%) |
| 6 or 7 Rooms | 342 (38.6%) | 33 (16.1%) |
| 8 or more Rooms | 207 (23.3%) | 14 (6.8%) |
| Total | 887 (100.0%) | 205 (100.0%) |
Housing Structure by Heating Type in Boiling Springs
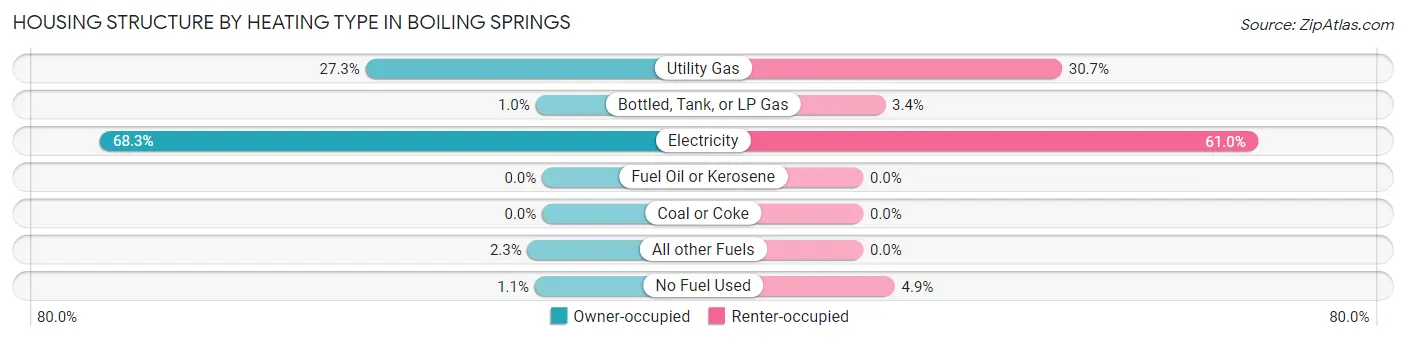
| Heating Type | Owner-occupied | Renter-occupied |
| Utility Gas | 242 (27.3%) | 63 (30.7%) |
| Bottled, Tank, or LP Gas | 9 (1.0%) | 7 (3.4%) |
| Electricity | 606 (68.3%) | 125 (61.0%) |
| Fuel Oil or Kerosene | 0 (0.0%) | 0 (0.0%) |
| Coal or Coke | 0 (0.0%) | 0 (0.0%) |
| All other Fuels | 20 (2.2%) | 0 (0.0%) |
| No Fuel Used | 10 (1.1%) | 10 (4.9%) |
| Total | 887 (100.0%) | 205 (100.0%) |
Household Vehicle Usage in Boiling Springs
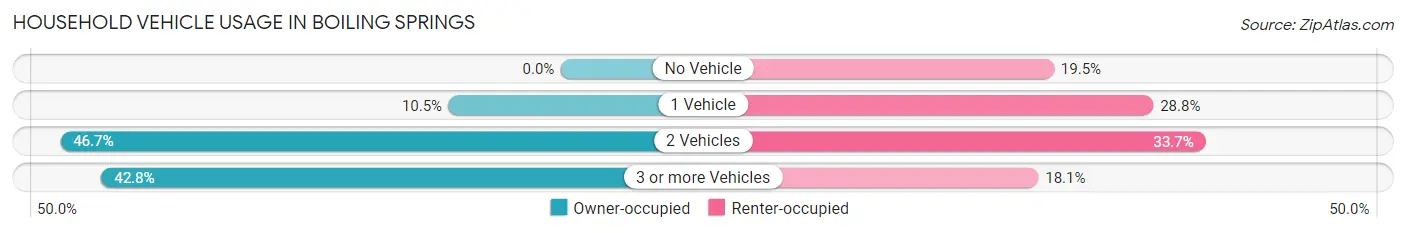
| Vehicles per Household | Owner-occupied | Renter-occupied |
| No Vehicle | 0 (0.0%) | 40 (19.5%) |
| 1 Vehicle | 93 (10.5%) | 59 (28.8%) |
| 2 Vehicles | 414 (46.7%) | 69 (33.7%) |
| 3 or more Vehicles | 380 (42.8%) | 37 (18.0%) |
| Total | 887 (100.0%) | 205 (100.0%) |
Real Estate & Mortgages in Boiling Springs
Real Estate and Mortgage Overview in Boiling Springs
| Characteristic | Without Mortgage | With Mortgage |
| Housing Units | 289 | 598 |
| Median Property Value | $169,800 | $219,200 |
| Median Household Income | $71,477 | $144 |
| Monthly Housing Costs | $384 | $14 |
| Real Estate Taxes | $1,779 | $10 |
Property Value by Mortgage Status in Boiling Springs

| Property Value | Without Mortgage | With Mortgage |
| Less than $50,000 | 8 (2.8%) | 35 (5.9%) |
| $50,000 to $99,999 | 18 (6.2%) | 0 (0.0%) |
| $100,000 to $299,999 | 227 (78.5%) | 485 (81.1%) |
| $300,000 to $499,999 | 36 (12.5%) | 78 (13.0%) |
| $500,000 to $749,999 | 0 (0.0%) | 0 (0.0%) |
| $750,000 to $999,999 | 0 (0.0%) | 0 (0.0%) |
| $1,000,000 or more | 0 (0.0%) | 0 (0.0%) |
| Total | 289 (100.0%) | 598 (100.0%) |
Household Income by Mortgage Status in Boiling Springs
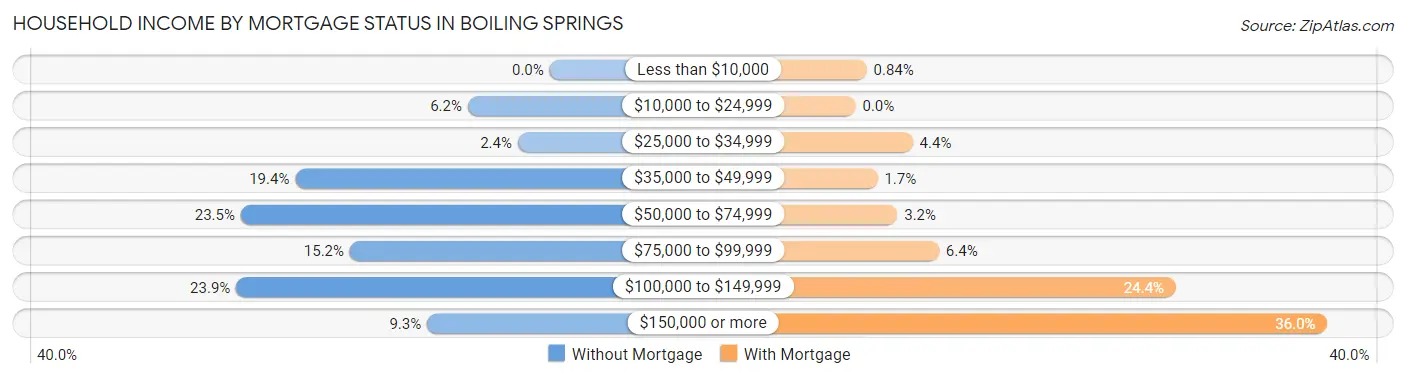
| Household Income | Without Mortgage | With Mortgage |
| Less than $10,000 | 0 (0.0%) | 5 (0.8%) |
| $10,000 to $24,999 | 18 (6.2%) | 0 (0.0%) |
| $25,000 to $34,999 | 7 (2.4%) | 26 (4.3%) |
| $35,000 to $49,999 | 56 (19.4%) | 10 (1.7%) |
| $50,000 to $74,999 | 68 (23.5%) | 19 (3.2%) |
| $75,000 to $99,999 | 44 (15.2%) | 38 (6.4%) |
| $100,000 to $149,999 | 69 (23.9%) | 146 (24.4%) |
| $150,000 or more | 27 (9.3%) | 215 (35.9%) |
| Total | 289 (100.0%) | 598 (100.0%) |
Property Value to Household Income Ratio in Boiling Springs
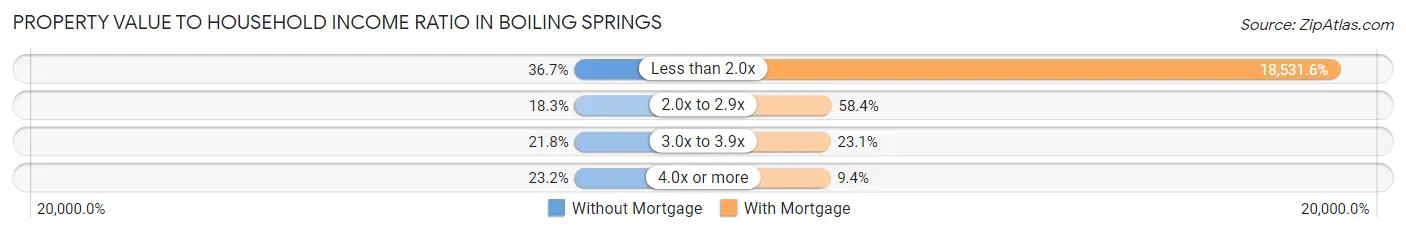
| Value-to-Income Ratio | Without Mortgage | With Mortgage |
| Less than 2.0x | 106 (36.7%) | 110,819 (18,531.6%) |
| 2.0x to 2.9x | 53 (18.3%) | 349 (58.4%) |
| 3.0x to 3.9x | 63 (21.8%) | 138 (23.1%) |
| 4.0x or more | 67 (23.2%) | 56 (9.4%) |
| Total | 289 (100.0%) | 598 (100.0%) |
Real Estate Taxes by Mortgage Status in Boiling Springs
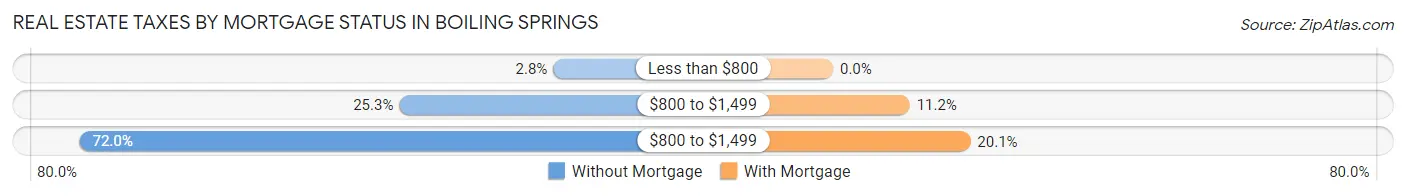
| Property Taxes | Without Mortgage | With Mortgage |
| Less than $800 | 8 (2.8%) | 0 (0.0%) |
| $800 to $1,499 | 73 (25.3%) | 67 (11.2%) |
| $800 to $1,499 | 208 (72.0%) | 120 (20.1%) |
| Total | 289 (100.0%) | 598 (100.0%) |
Health & Disability in Boiling Springs
Health Insurance Coverage by Age in Boiling Springs
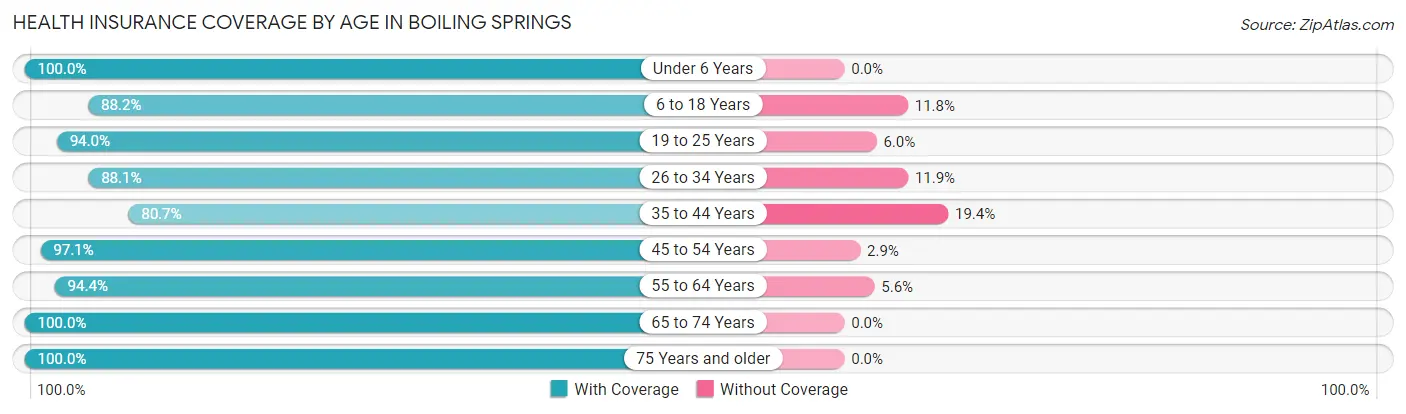
| Age Bracket | With Coverage | Without Coverage |
| Under 6 Years | 425 (100.0%) | 0 (0.0%) |
| 6 to 18 Years | 782 (88.2%) | 105 (11.8%) |
| 19 to 25 Years | 1,096 (94.0%) | 70 (6.0%) |
| 26 to 34 Years | 349 (88.1%) | 47 (11.9%) |
| 35 to 44 Years | 325 (80.6%) | 78 (19.4%) |
| 45 to 54 Years | 495 (97.1%) | 15 (2.9%) |
| 55 to 64 Years | 303 (94.4%) | 18 (5.6%) |
| 65 to 74 Years | 189 (100.0%) | 0 (0.0%) |
| 75 Years and older | 287 (100.0%) | 0 (0.0%) |
| Total | 4,251 (92.7%) | 333 (7.3%) |
Health Insurance Coverage by Citizenship Status in Boiling Springs
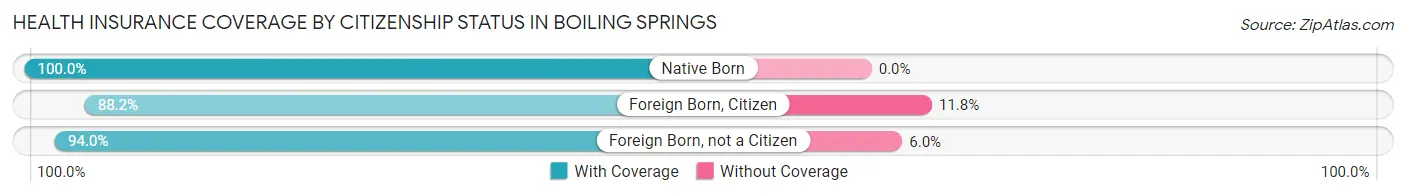
| Citizenship Status | With Coverage | Without Coverage |
| Native Born | 425 (100.0%) | 0 (0.0%) |
| Foreign Born, Citizen | 782 (88.2%) | 105 (11.8%) |
| Foreign Born, not a Citizen | 1,096 (94.0%) | 70 (6.0%) |
Health Insurance Coverage by Household Income in Boiling Springs
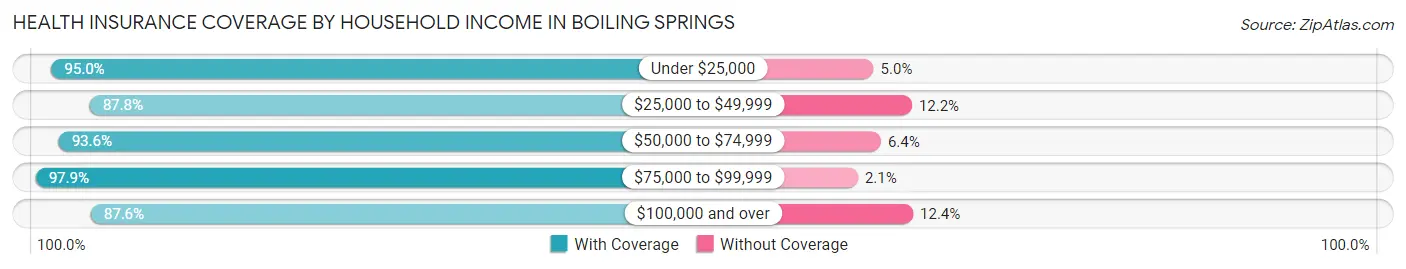
| Household Income | With Coverage | Without Coverage |
| Under $25,000 | 189 (95.0%) | 10 (5.0%) |
| $25,000 to $49,999 | 374 (87.8%) | 52 (12.2%) |
| $50,000 to $74,999 | 322 (93.6%) | 22 (6.4%) |
| $75,000 to $99,999 | 750 (97.9%) | 16 (2.1%) |
| $100,000 and over | 1,580 (87.6%) | 224 (12.4%) |
Public vs Private Health Insurance Coverage by Age in Boiling Springs
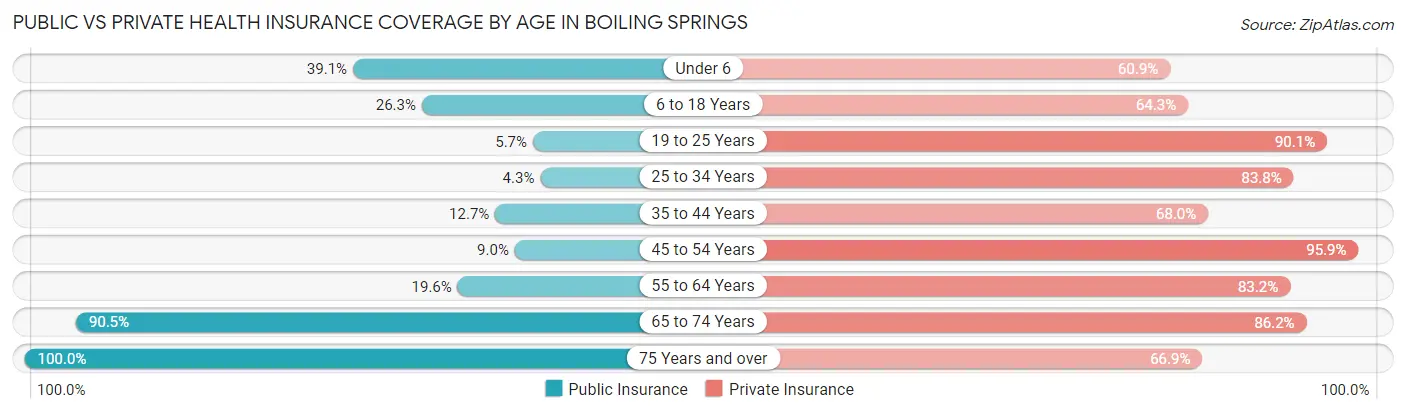
| Age Bracket | Public Insurance | Private Insurance |
| Under 6 | 166 (39.1%) | 259 (60.9%) |
| 6 to 18 Years | 233 (26.3%) | 570 (64.3%) |
| 19 to 25 Years | 66 (5.7%) | 1,050 (90.0%) |
| 25 to 34 Years | 17 (4.3%) | 332 (83.8%) |
| 35 to 44 Years | 51 (12.7%) | 274 (68.0%) |
| 45 to 54 Years | 46 (9.0%) | 489 (95.9%) |
| 55 to 64 Years | 63 (19.6%) | 267 (83.2%) |
| 65 to 74 Years | 171 (90.5%) | 163 (86.2%) |
| 75 Years and over | 287 (100.0%) | 192 (66.9%) |
| Total | 1,100 (24.0%) | 3,596 (78.4%) |
Disability Status by Sex by Age in Boiling Springs
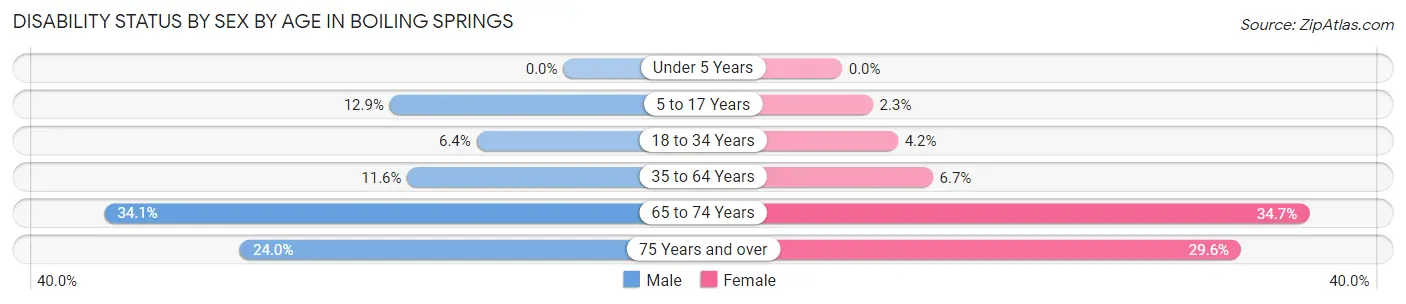
| Age Bracket | Male | Female |
| Under 5 Years | 0 (0.0%) | 0 (0.0%) |
| 5 to 17 Years | 50 (12.9%) | 7 (2.3%) |
| 18 to 34 Years | 52 (6.4%) | 41 (4.2%) |
| 35 to 64 Years | 69 (11.6%) | 43 (6.7%) |
| 65 to 74 Years | 31 (34.1%) | 34 (34.7%) |
| 75 Years and over | 30 (24.0%) | 48 (29.6%) |
Disability Class by Sex by Age in Boiling Springs
Disability Class: Hearing Difficulty
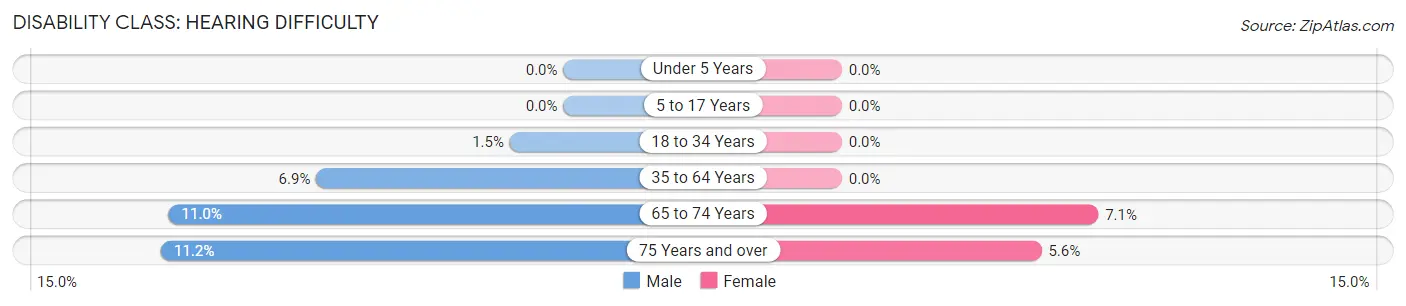
| Age Bracket | Male | Female |
| Under 5 Years | 0 (0.0%) | 0 (0.0%) |
| 5 to 17 Years | 0 (0.0%) | 0 (0.0%) |
| 18 to 34 Years | 12 (1.5%) | 0 (0.0%) |
| 35 to 64 Years | 41 (6.9%) | 0 (0.0%) |
| 65 to 74 Years | 10 (11.0%) | 7 (7.1%) |
| 75 Years and over | 14 (11.2%) | 9 (5.6%) |
Disability Class: Vision Difficulty
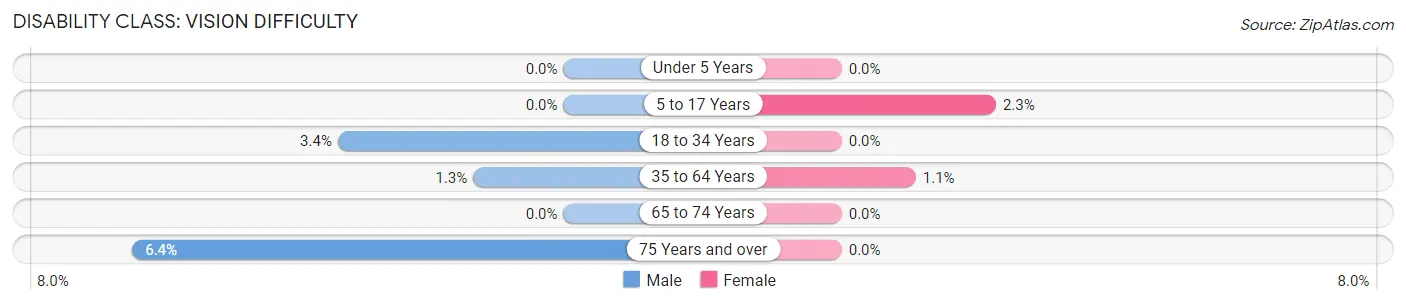
| Age Bracket | Male | Female |
| Under 5 Years | 0 (0.0%) | 0 (0.0%) |
| 5 to 17 Years | 0 (0.0%) | 7 (2.3%) |
| 18 to 34 Years | 27 (3.4%) | 0 (0.0%) |
| 35 to 64 Years | 8 (1.3%) | 7 (1.1%) |
| 65 to 74 Years | 0 (0.0%) | 0 (0.0%) |
| 75 Years and over | 8 (6.4%) | 0 (0.0%) |
Disability Class: Cognitive Difficulty
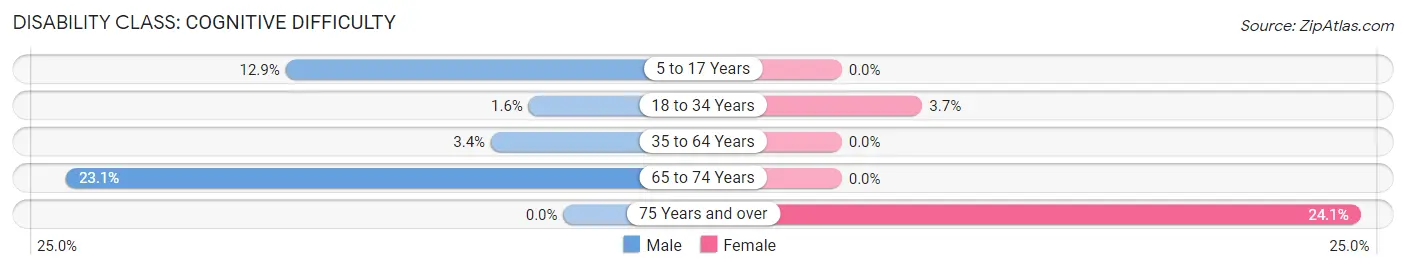
| Age Bracket | Male | Female |
| 5 to 17 Years | 50 (12.9%) | 0 (0.0%) |
| 18 to 34 Years | 13 (1.6%) | 37 (3.7%) |
| 35 to 64 Years | 20 (3.4%) | 0 (0.0%) |
| 65 to 74 Years | 21 (23.1%) | 0 (0.0%) |
| 75 Years and over | 0 (0.0%) | 39 (24.1%) |
Disability Class: Ambulatory Difficulty
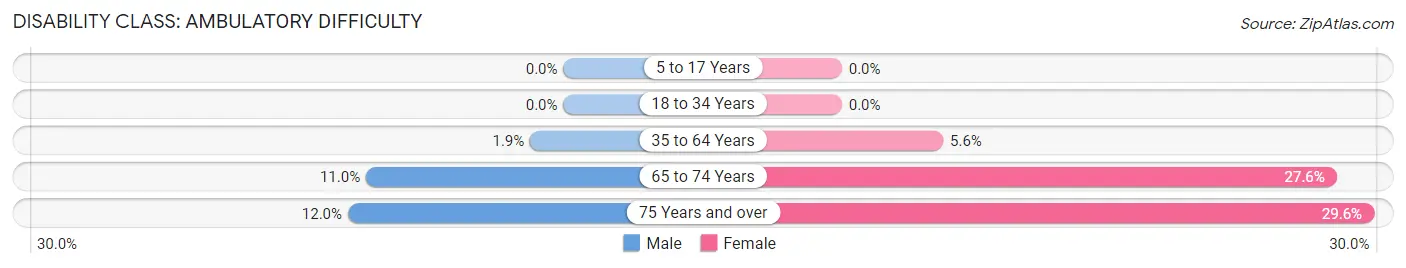
| Age Bracket | Male | Female |
| 5 to 17 Years | 0 (0.0%) | 0 (0.0%) |
| 18 to 34 Years | 0 (0.0%) | 0 (0.0%) |
| 35 to 64 Years | 11 (1.8%) | 36 (5.6%) |
| 65 to 74 Years | 10 (11.0%) | 27 (27.6%) |
| 75 Years and over | 15 (12.0%) | 48 (29.6%) |
Disability Class: Self-Care Difficulty
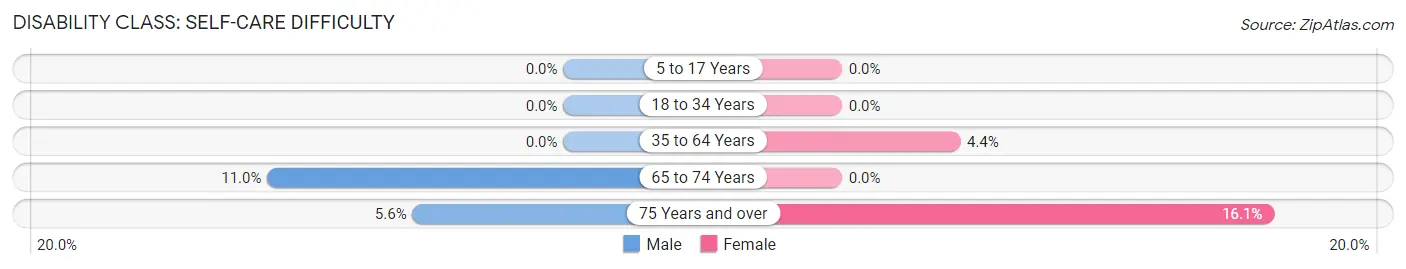
| Age Bracket | Male | Female |
| 5 to 17 Years | 0 (0.0%) | 0 (0.0%) |
| 18 to 34 Years | 0 (0.0%) | 0 (0.0%) |
| 35 to 64 Years | 0 (0.0%) | 28 (4.4%) |
| 65 to 74 Years | 10 (11.0%) | 0 (0.0%) |
| 75 Years and over | 7 (5.6%) | 26 (16.1%) |
Technology Access in Boiling Springs
Computing Device Access in Boiling Springs
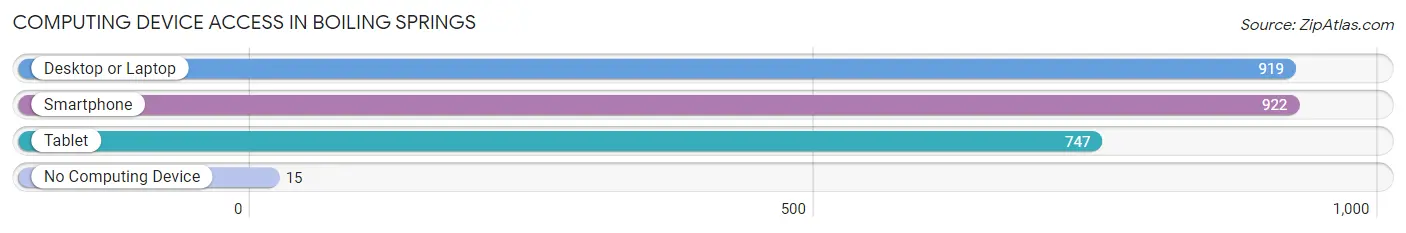
| Device Type | # Households | % Households |
| Desktop or Laptop | 919 | 84.2% |
| Smartphone | 922 | 84.4% |
| Tablet | 747 | 68.4% |
| No Computing Device | 15 | 1.4% |
| Total | 1,092 | 100.0% |
Internet Access in Boiling Springs
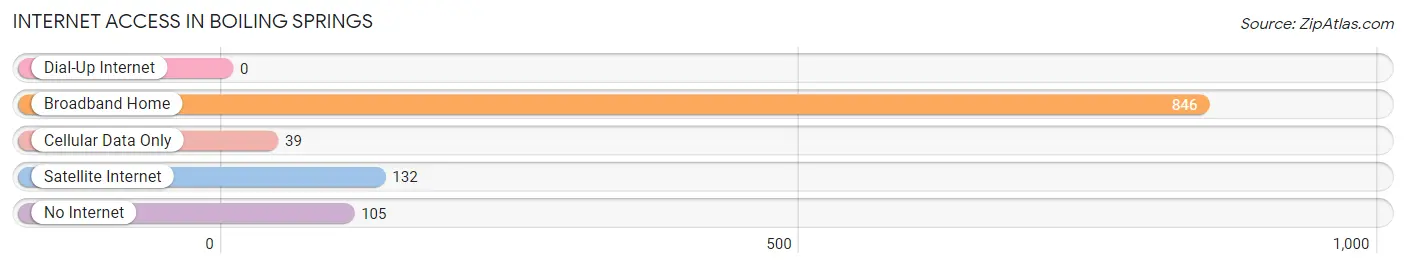
| Internet Type | # Households | % Households |
| Dial-Up Internet | 0 | 0.0% |
| Broadband Home | 846 | 77.5% |
| Cellular Data Only | 39 | 3.6% |
| Satellite Internet | 132 | 12.1% |
| No Internet | 105 | 9.6% |
| Total | 1,092 | 100.0% |
Boiling Springs Summary
Boiling Springs is a small town located in Cleveland County, North Carolina. It is situated in the foothills of the Blue Ridge Mountains, approximately 25 miles south of Asheville. The town was founded in 1851 and is named after a nearby natural spring that boils up from the ground. Boiling Springs is home to Gardner-Webb University, a private Christian university, and is a popular destination for outdoor recreation.
Geography
Boiling Springs is located in the foothills of the Blue Ridge Mountains in western North Carolina. The town is situated at an elevation of 1,000 feet and is surrounded by rolling hills and forests. The nearby Broad River flows through the town and provides a scenic backdrop. Boiling Springs is located approximately 25 miles south of Asheville and is accessible via US Highway 74.
Climate
Boiling Springs has a humid subtropical climate, with hot, humid summers and mild winters. The average annual temperature is around 60°F, with temperatures ranging from the mid-30s in the winter to the mid-80s in the summer. The town receives an average of 48 inches of precipitation per year, with most of it falling in the form of rain.
Demographics
As of the 2010 census, Boiling Springs had a population of 2,945. The racial makeup of the town was 91.3% White, 4.7% African American, 0.3% Native American, 1.2% Asian, and 2.5% from other races. The median household income was $41,944, and the median age was 33.
Economy
Boiling Springs is home to Gardner-Webb University, a private Christian university. The university is the largest employer in the town, providing jobs for faculty, staff, and students. Other major employers in the town include the Cleveland County School System, Boiling Springs Family Practice, and Boiling Springs Pharmacy.
Boiling Springs is also a popular destination for outdoor recreation. The town is home to several parks, including Boiling Springs Park, which features a lake, walking trails, and picnic areas. The nearby Broad River is popular for fishing, canoeing, and kayaking.
Boiling Springs is home to several small businesses, including restaurants, shops, and galleries. The town also hosts several annual events, including the Boiling Springs Festival, which features live music, food, and crafts.
Conclusion
Boiling Springs is a small town located in the foothills of the Blue Ridge Mountains in western North Carolina. The town was founded in 1851 and is home to Gardner-Webb University, a private Christian university. Boiling Springs has a humid subtropical climate, with hot, humid summers and mild winters. As of the 2010 census, the town had a population of 2,945. The largest employer in the town is Gardner-Webb University, and the town is also a popular destination for outdoor recreation. Boiling Springs is home to several small businesses, including restaurants, shops, and galleries, and hosts several annual events.
Common Questions
What is Per Capita Income in Boiling Springs?
Per Capita income in Boiling Springs is $40,193.
What is the Median Family Income in Boiling Springs?
Median Family Income in Boiling Springs is $107,714.
What is the Median Household income in Boiling Springs?
Median Household Income in Boiling Springs is $90,625.
What is Income or Wage Gap in Boiling Springs?
Income or Wage Gap in Boiling Springs is 1.1%.
Women in Boiling Springs earn 98.9 cents for every dollar earned by a man.
What is Inequality or Gini Index in Boiling Springs?
Inequality or Gini Index in Boiling Springs is 0.57.
What is the Total Population of Boiling Springs?
Total Population of Boiling Springs is 4,622.
What is the Total Male Population of Boiling Springs?
Total Male Population of Boiling Springs is 2,196.
What is the Total Female Population of Boiling Springs?
Total Female Population of Boiling Springs is 2,426.
What is the Ratio of Males per 100 Females in Boiling Springs?
There are 90.52 Males per 100 Females in Boiling Springs.
What is the Ratio of Females per 100 Males in Boiling Springs?
There are 110.47 Females per 100 Males in Boiling Springs.
What is the Median Population Age in Boiling Springs?
Median Population Age in Boiling Springs is 21.9 Years.
What is the Average Family Size in Boiling Springs
Average Family Size in Boiling Springs is 3.6 People.
What is the Average Household Size in Boiling Springs
Average Household Size in Boiling Springs is 3.3 People.
How Large is the Labor Force in Boiling Springs?
There are 2,047 People in the Labor Forcein in Boiling Springs.
What is the Percentage of People in the Labor Force in Boiling Springs?
54.8% of People are in the Labor Force in Boiling Springs.
What is the Unemployment Rate in Boiling Springs?
Unemployment Rate in Boiling Springs is 4.9%.