Andrews, NC Map & Demographics
Andrews Map
Andrews Overview
$23,353
PER CAPITA INCOME
$37,216
AVG FAMILY INCOME
$34,939
AVG HOUSEHOLD INCOME
33.4%
WAGE / INCOME GAP [ % ]
66.6¢/ $1
WAGE / INCOME GAP [ $ ]
0.41
INEQUALITY / GINI INDEX
2,086
TOTAL POPULATION
942
MALE POPULATION
1,144
FEMALE POPULATION
82.34
MALES / 100 FEMALES
121.44
FEMALES / 100 MALES
46.0
MEDIAN AGE
2.8
AVG FAMILY SIZE
2.1
AVG HOUSEHOLD SIZE
984
LABOR FORCE [ PEOPLE ]
58.8%
PERCENT IN LABOR FORCE
12.9%
UNEMPLOYMENT RATE
Andrews Zip Codes
Andrews Area Codes
Income in Andrews
Income Overview in Andrews
Per Capita Income in Andrews is $23,353, while median incomes of families and households are $37,216 and $34,939 respectively.
| Characteristic | Number | Measure |
| Per Capita Income | 2,086 | $23,353 |
| Median Family Income | 433 | $37,216 |
| Mean Family Income | 433 | $51,512 |
| Median Household Income | 947 | $34,939 |
| Mean Household Income | 947 | $49,894 |
| Income Deficit | 433 | $0 |
| Wage / Income Gap (%) | 2,086 | 33.36% |
| Wage / Income Gap ($) | 2,086 | 66.64¢ per $1 |
| Gini / Inequality Index | 2,086 | 0.41 |
Earnings by Sex in Andrews
Average Earnings in Andrews are $28,891, $38,542 for men and $25,684 for women, a difference of 33.4%.
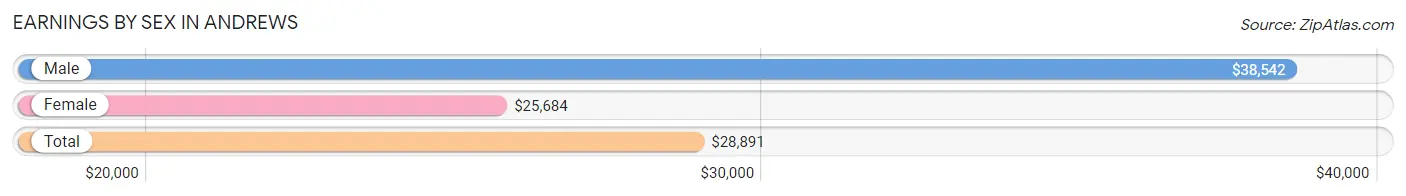
| Sex | Number | Average Earnings |
| Male | 524 (56.1%) | $38,542 |
| Female | 410 (43.9%) | $25,684 |
| Total | 934 (100.0%) | $28,891 |
Earnings by Sex by Income Bracket in Andrews
The most common earnings brackets in Andrews are $45,000 to $49,999 for men (138 | 26.3%) and $25,000 to $29,999 for women (148 | 36.1%).
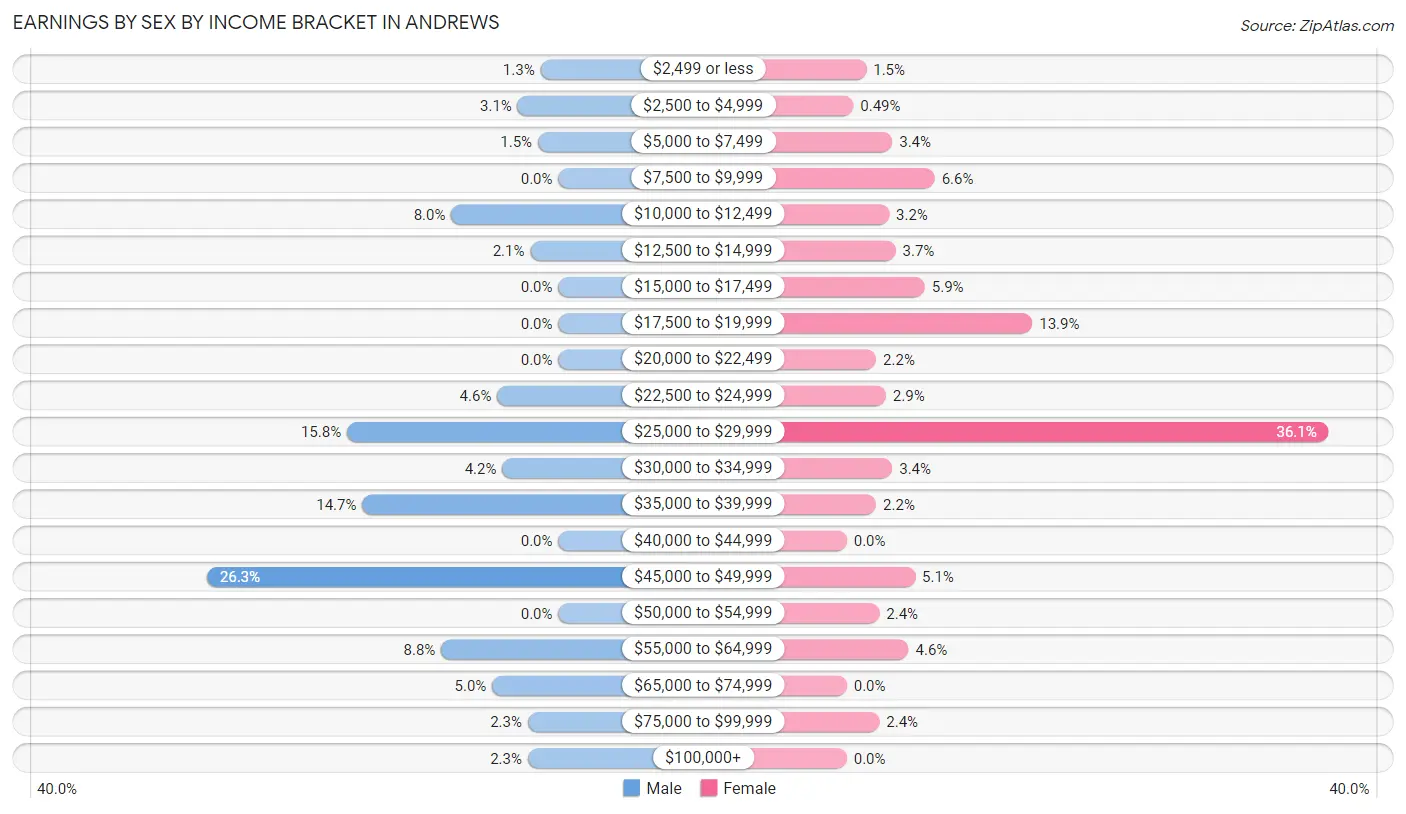
| Income | Male | Female |
| $2,499 or less | 7 (1.3%) | 6 (1.5%) |
| $2,500 to $4,999 | 16 (3.0%) | 2 (0.5%) |
| $5,000 to $7,499 | 8 (1.5%) | 14 (3.4%) |
| $7,500 to $9,999 | 0 (0.0%) | 27 (6.6%) |
| $10,000 to $12,499 | 42 (8.0%) | 13 (3.2%) |
| $12,500 to $14,999 | 11 (2.1%) | 15 (3.7%) |
| $15,000 to $17,499 | 0 (0.0%) | 24 (5.9%) |
| $17,500 to $19,999 | 0 (0.0%) | 57 (13.9%) |
| $20,000 to $22,499 | 0 (0.0%) | 9 (2.2%) |
| $22,500 to $24,999 | 24 (4.6%) | 12 (2.9%) |
| $25,000 to $29,999 | 83 (15.8%) | 148 (36.1%) |
| $30,000 to $34,999 | 22 (4.2%) | 14 (3.4%) |
| $35,000 to $39,999 | 77 (14.7%) | 9 (2.2%) |
| $40,000 to $44,999 | 0 (0.0%) | 0 (0.0%) |
| $45,000 to $49,999 | 138 (26.3%) | 21 (5.1%) |
| $50,000 to $54,999 | 0 (0.0%) | 10 (2.4%) |
| $55,000 to $64,999 | 46 (8.8%) | 19 (4.6%) |
| $65,000 to $74,999 | 26 (5.0%) | 0 (0.0%) |
| $75,000 to $99,999 | 12 (2.3%) | 10 (2.4%) |
| $100,000+ | 12 (2.3%) | 0 (0.0%) |
| Total | 524 (100.0%) | 410 (100.0%) |
Earnings by Sex by Educational Attainment in Andrews
Average earnings in Andrews are $45,217 for men and $27,125 for women, a difference of 40.0%. Men with an educational attainment of high school diploma enjoy the highest average annual earnings of $46,402, while those with college or associate's degree education earn the least with $35,625. Women with an educational attainment of high school diploma earn the most with the average annual earnings of $28,988, while those with college or associate's degree education have the smallest earnings of $26,356.
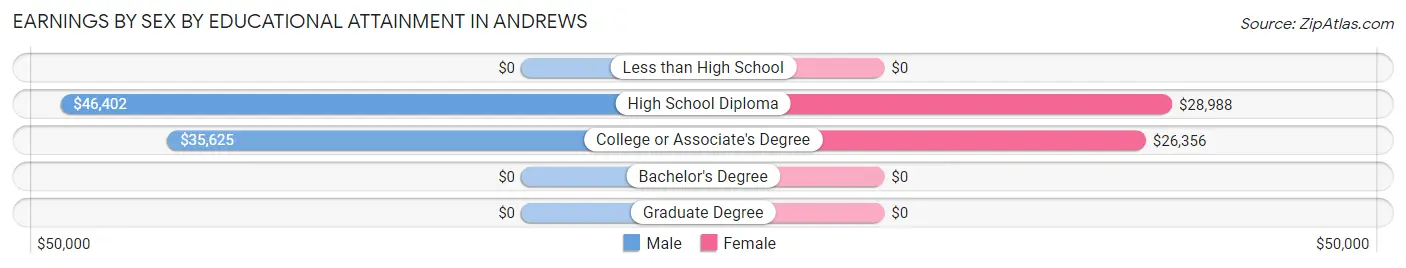
| Educational Attainment | Male Income | Female Income |
| Less than High School | - | - |
| High School Diploma | $46,402 | $28,988 |
| College or Associate's Degree | $35,625 | $26,356 |
| Bachelor's Degree | - | - |
| Graduate Degree | - | - |
| Total | $45,217 | $27,125 |
Family Income in Andrews
Family Income Brackets in Andrews
According to the Andrews family income data, there are 86 families falling into the $15,000 to $24,999 income range, which is the most common income bracket and makes up 19.9% of all families. Conversely, the $200,000+ income bracket is the least frequent group with only 2 families (0.5%) belonging to this category.
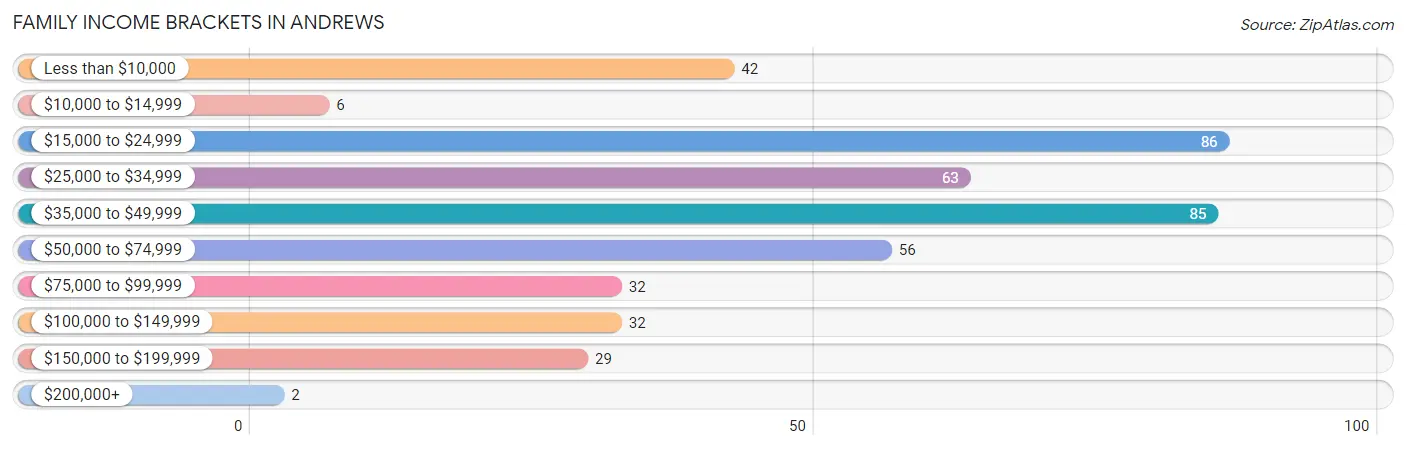
| Income Bracket | # Families | % Families |
| Less than $10,000 | 42 | 9.7% |
| $10,000 to $14,999 | 6 | 1.4% |
| $15,000 to $24,999 | 86 | 19.9% |
| $25,000 to $34,999 | 63 | 14.5% |
| $35,000 to $49,999 | 85 | 19.6% |
| $50,000 to $74,999 | 56 | 12.9% |
| $75,000 to $99,999 | 32 | 7.4% |
| $100,000 to $149,999 | 32 | 7.4% |
| $150,000 to $199,999 | 29 | 6.7% |
| $200,000+ | 2 | 0.5% |
Family Income by Famaliy Size in Andrews
3-person families (58 | 13.4%) account for the highest median family income in Andrews with $94,167 per family, while 3-person families (58 | 13.4%) have the highest median income of $31,389 per family member.
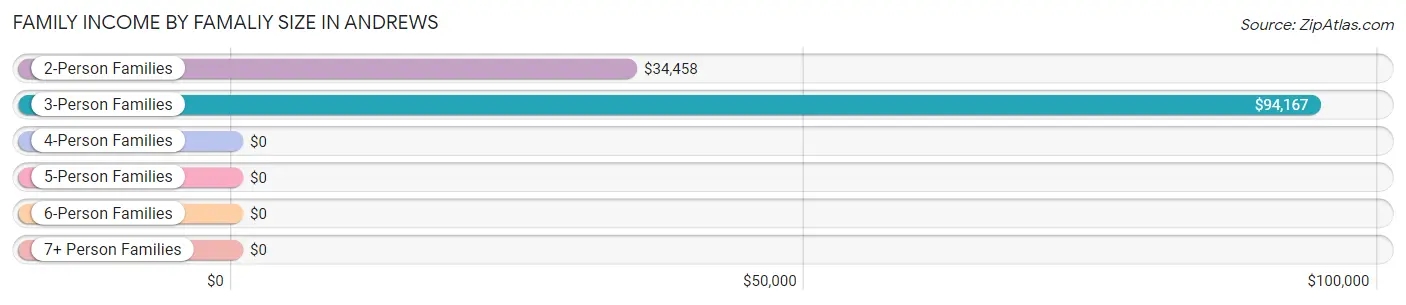
| Income Bracket | # Families | Median Income |
| 2-Person Families | 287 (66.3%) | $34,458 |
| 3-Person Families | 58 (13.4%) | $94,167 |
| 4-Person Families | 79 (18.2%) | $0 |
| 5-Person Families | 9 (2.1%) | $0 |
| 6-Person Families | 0 (0.0%) | $0 |
| 7+ Person Families | 0 (0.0%) | $0 |
| Total | 433 (100.0%) | $37,216 |
Family Income by Number of Earners in Andrews
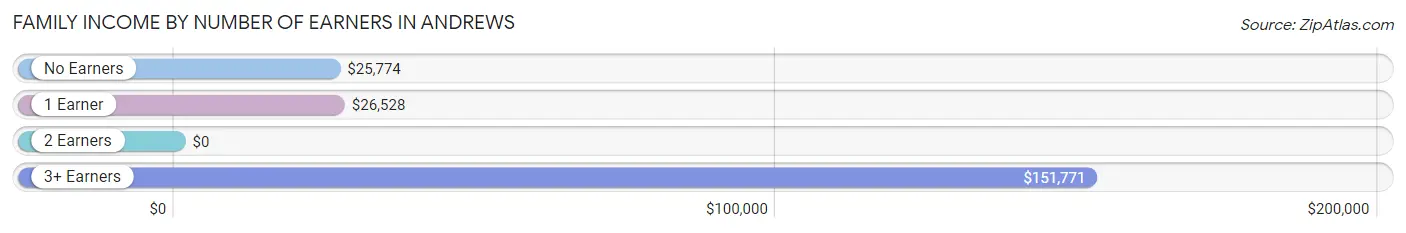
| Number of Earners | # Families | Median Income |
| No Earners | 119 (27.5%) | $25,774 |
| 1 Earner | 167 (38.6%) | $26,528 |
| 2 Earners | 122 (28.2%) | $0 |
| 3+ Earners | 25 (5.8%) | $151,771 |
| Total | 433 (100.0%) | $37,216 |
Household Income in Andrews
Household Income Brackets in Andrews
With 230 households falling in the category, the $50,000 to $74,999 income range is the most frequent in Andrews, accounting for 24.3% of all households. In contrast, only 16 households (1.7%) fall into the $200,000+ income bracket, making it the least populous group.
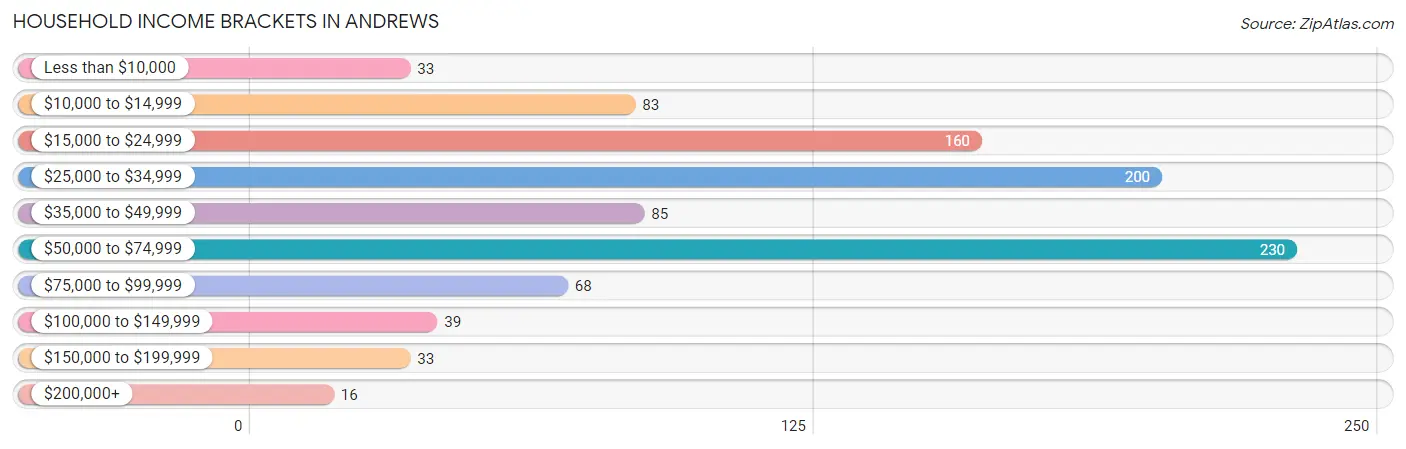
| Income Bracket | # Households | % Households |
| Less than $10,000 | 33 | 3.5% |
| $10,000 to $14,999 | 83 | 8.8% |
| $15,000 to $24,999 | 160 | 16.9% |
| $25,000 to $34,999 | 200 | 21.1% |
| $35,000 to $49,999 | 85 | 9.0% |
| $50,000 to $74,999 | 230 | 24.3% |
| $75,000 to $99,999 | 68 | 7.2% |
| $100,000 to $149,999 | 39 | 4.1% |
| $150,000 to $199,999 | 33 | 3.5% |
| $200,000+ | 16 | 1.7% |
Household Income by Householder Age in Andrews
The median household income in Andrews is $34,939, with the highest median household income of $58,534 found in the 25 to 44 years age bracket for the primary householder. A total of 138 households (14.6%) fall into this category. Meanwhile, the 65+ years age bracket for the primary householder has the lowest median household income of $22,382, with 379 households (40.0%) in this group.
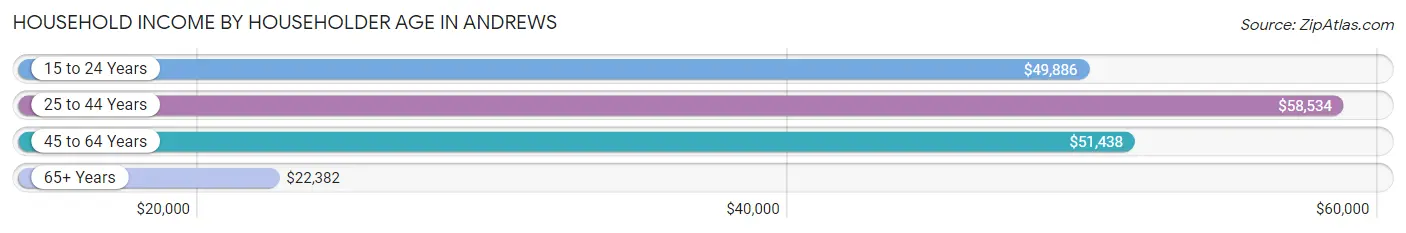
| Income Bracket | # Households | Median Income |
| 15 to 24 Years | 129 (13.6%) | $49,886 |
| 25 to 44 Years | 138 (14.6%) | $58,534 |
| 45 to 64 Years | 301 (31.8%) | $51,438 |
| 65+ Years | 379 (40.0%) | $22,382 |
| Total | 947 (100.0%) | $34,939 |
Poverty in Andrews
Income Below Poverty by Sex and Age in Andrews
With 16.8% poverty level for males and 34.8% for females among the residents of Andrews, under 5 year old males and 12 to 14 year old females are the most vulnerable to poverty, with 2 males (100.0%) and 75 females (78.1%) in their respective age groups living below the poverty level.
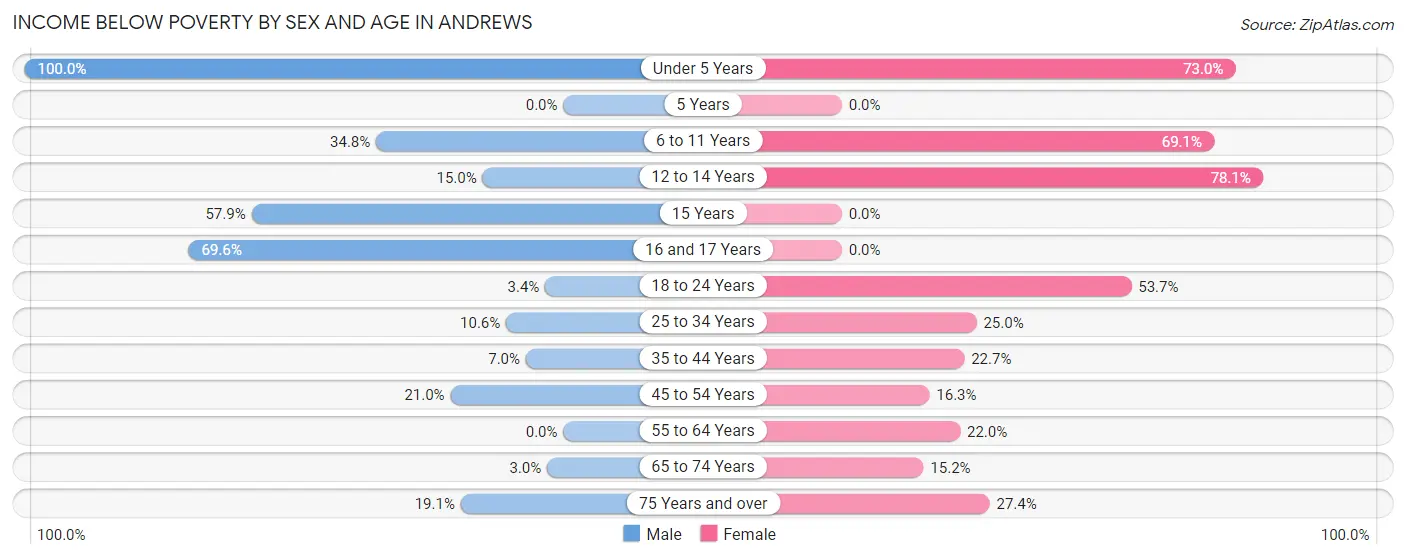
| Age Bracket | Male | Female |
| Under 5 Years | 2 (100.0%) | 46 (73.0%) |
| 5 Years | 0 (0.0%) | 0 (0.0%) |
| 6 to 11 Years | 49 (34.7%) | 29 (69.1%) |
| 12 to 14 Years | 3 (15.0%) | 75 (78.1%) |
| 15 Years | 11 (57.9%) | 0 (0.0%) |
| 16 and 17 Years | 16 (69.6%) | 0 (0.0%) |
| 18 to 24 Years | 3 (3.4%) | 79 (53.7%) |
| 25 to 34 Years | 12 (10.6%) | 4 (25.0%) |
| 35 to 44 Years | 8 (7.0%) | 20 (22.7%) |
| 45 to 54 Years | 35 (21.0%) | 39 (16.3%) |
| 55 to 64 Years | 0 (0.0%) | 18 (22.0%) |
| 65 to 74 Years | 3 (3.0%) | 20 (15.1%) |
| 75 Years and over | 12 (19.1%) | 51 (27.4%) |
| Total | 154 (16.8%) | 381 (34.8%) |
Income Above Poverty by Sex and Age in Andrews
According to the poverty statistics in Andrews, males aged 55 to 64 years and females aged 15 years are the age groups that are most secure financially, with 100.0% of males and 100.0% of females in these age groups living above the poverty line.
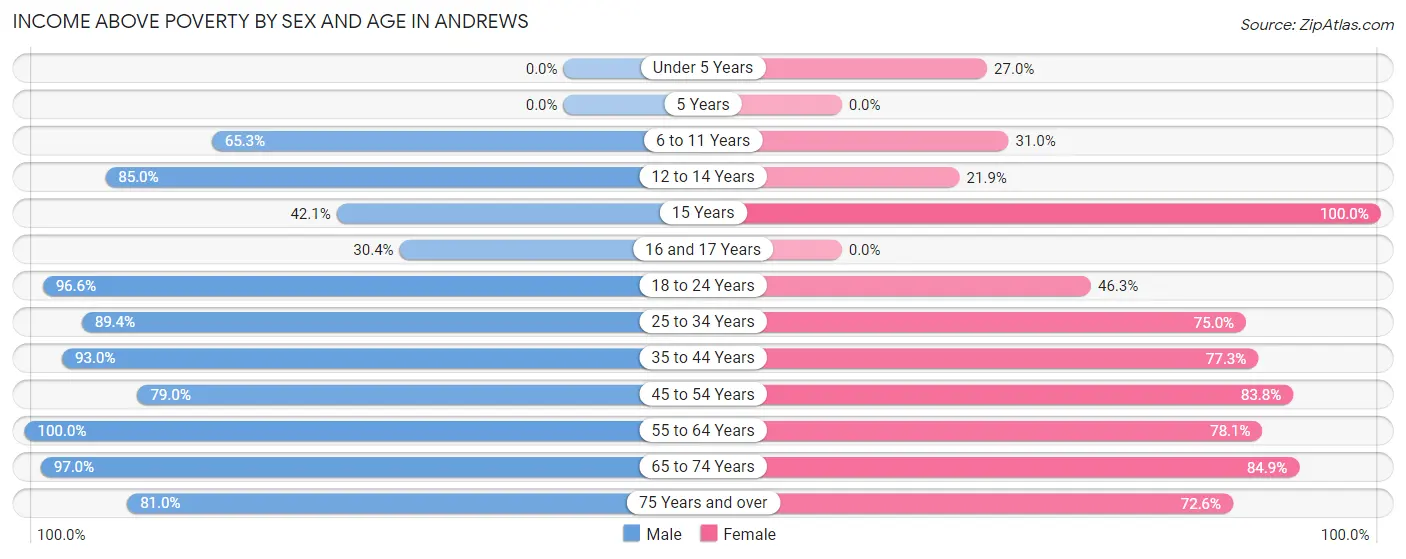
| Age Bracket | Male | Female |
| Under 5 Years | 0 (0.0%) | 17 (27.0%) |
| 5 Years | 0 (0.0%) | 0 (0.0%) |
| 6 to 11 Years | 92 (65.2%) | 13 (30.9%) |
| 12 to 14 Years | 17 (85.0%) | 21 (21.9%) |
| 15 Years | 8 (42.1%) | 4 (100.0%) |
| 16 and 17 Years | 7 (30.4%) | 0 (0.0%) |
| 18 to 24 Years | 86 (96.6%) | 68 (46.3%) |
| 25 to 34 Years | 101 (89.4%) | 12 (75.0%) |
| 35 to 44 Years | 107 (93.0%) | 68 (77.3%) |
| 45 to 54 Years | 132 (79.0%) | 201 (83.8%) |
| 55 to 64 Years | 65 (100.0%) | 64 (78.0%) |
| 65 to 74 Years | 96 (97.0%) | 112 (84.9%) |
| 75 Years and over | 51 (80.9%) | 135 (72.6%) |
| Total | 762 (83.2%) | 715 (65.2%) |
Income Below Poverty Among Married-Couple Families in Andrews
The poverty statistics for married-couple families in Andrews show that 3.4% or 9 of the total 265 families live below the poverty line. Families with no children have the highest poverty rate of 4.4%, comprising of 9 families. On the other hand, families with 1 or 2 children have the lowest poverty rate of 0.0%, which includes 0 families.
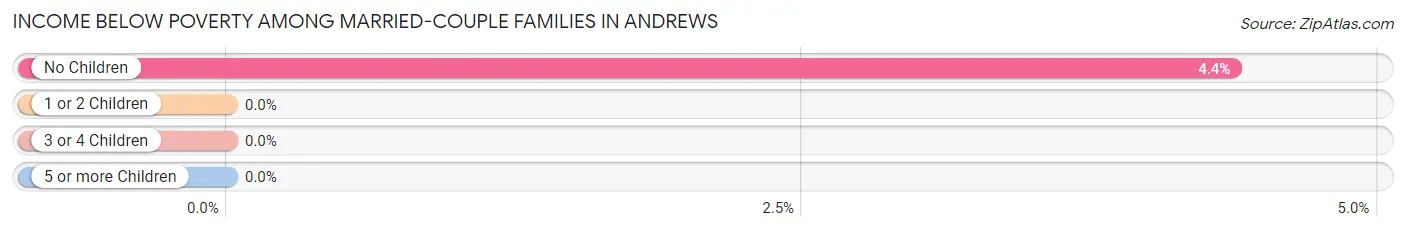
| Children | Above Poverty | Below Poverty |
| No Children | 197 (95.6%) | 9 (4.4%) |
| 1 or 2 Children | 59 (100.0%) | 0 (0.0%) |
| 3 or 4 Children | 0 (0.0%) | 0 (0.0%) |
| 5 or more Children | 0 (0.0%) | 0 (0.0%) |
| Total | 256 (96.6%) | 9 (3.4%) |
Income Below Poverty Among Single-Parent Households in Andrews
According to the poverty data in Andrews, 60.0% or 9 single-father households and 64.7% or 99 single-mother households are living below the poverty line. Among single-father households, those with 3 or 4 children have the highest poverty rate, with 9 households (100.0%) experiencing poverty. Likewise, among single-mother households, those with 3 or 4 children have the highest poverty rate, with 32 households (100.0%) falling below the poverty line.
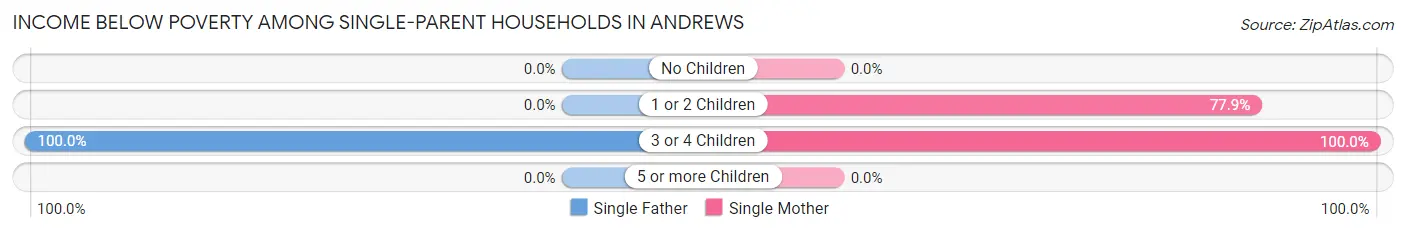
| Children | Single Father | Single Mother |
| No Children | 0 (0.0%) | 0 (0.0%) |
| 1 or 2 Children | 0 (0.0%) | 67 (77.9%) |
| 3 or 4 Children | 9 (100.0%) | 32 (100.0%) |
| 5 or more Children | 0 (0.0%) | 0 (0.0%) |
| Total | 9 (60.0%) | 99 (64.7%) |
Income Below Poverty Among Married-Couple vs Single-Parent Households in Andrews
The poverty data for Andrews shows that 9 of the married-couple family households (3.4%) and 108 of the single-parent households (64.3%) are living below the poverty level. Within the married-couple family households, those with no children have the highest poverty rate, with 9 households (4.4%) falling below the poverty line. Among the single-parent households, those with 3 or 4 children have the highest poverty rate, with 41 household (100.0%) living below poverty.
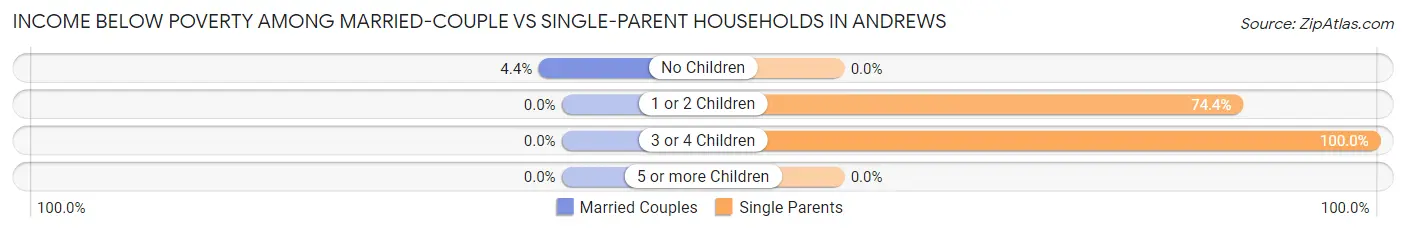
| Children | Married-Couple Families | Single-Parent Households |
| No Children | 9 (4.4%) | 0 (0.0%) |
| 1 or 2 Children | 0 (0.0%) | 67 (74.4%) |
| 3 or 4 Children | 0 (0.0%) | 41 (100.0%) |
| 5 or more Children | 0 (0.0%) | 0 (0.0%) |
| Total | 9 (3.4%) | 108 (64.3%) |
Race in Andrews
The most populous races in Andrews are White / Caucasian (1,647 | 78.9%), Hispanic or Latino (407 | 19.5%), and Two or more Races (224 | 10.7%).
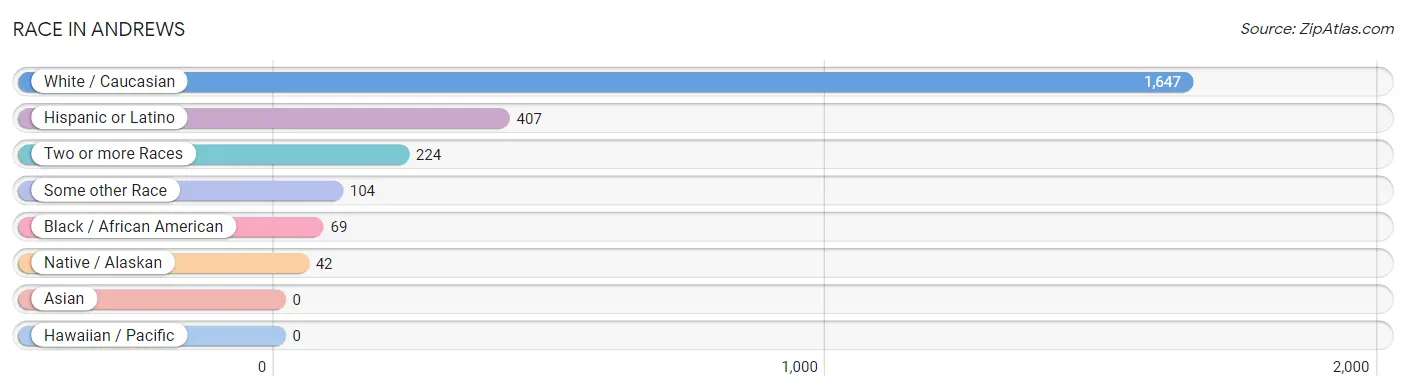
| Race | # Population | % Population |
| Asian | 0 | 0.0% |
| Black / African American | 69 | 3.3% |
| Hawaiian / Pacific | 0 | 0.0% |
| Hispanic or Latino | 407 | 19.5% |
| Native / Alaskan | 42 | 2.0% |
| White / Caucasian | 1,647 | 78.9% |
| Two or more Races | 224 | 10.7% |
| Some other Race | 104 | 5.0% |
| Total | 2,086 | 100.0% |
Ancestry in Andrews
The most populous ancestries reported in Andrews are Mexican (391 | 18.7%), American (323 | 15.5%), Irish (188 | 9.0%), German (143 | 6.9%), and English (141 | 6.8%), together accounting for 56.9% of all Andrews residents.
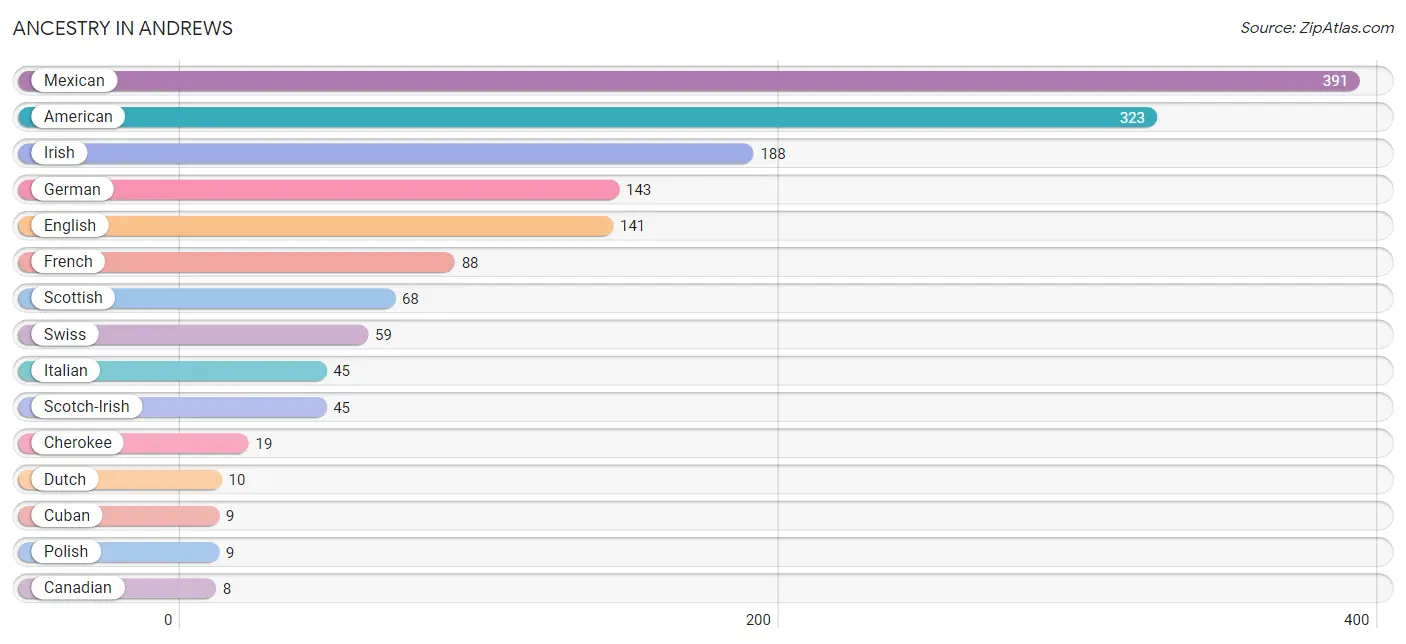
| Ancestry | # Population | % Population |
| Alaska Native | 2 | 0.1% |
| American | 323 | 15.5% |
| Canadian | 8 | 0.4% |
| Central American | 7 | 0.3% |
| Central American Indian | 7 | 0.3% |
| Cherokee | 19 | 0.9% |
| Cuban | 9 | 0.4% |
| Dutch | 10 | 0.5% |
| English | 141 | 6.8% |
| French | 88 | 4.2% |
| German | 143 | 6.9% |
| Guatemalan | 7 | 0.3% |
| Irish | 188 | 9.0% |
| Italian | 45 | 2.2% |
| Mexican | 391 | 18.7% |
| Polish | 9 | 0.4% |
| Scotch-Irish | 45 | 2.2% |
| Scottish | 68 | 3.3% |
| Swiss | 59 | 2.8% | View All 19 Rows |
Immigrants in Andrews
The most numerous immigrant groups reported in Andrews came from Central America (184 | 8.8%), Latin America (184 | 8.8%), Mexico (184 | 8.8%), England (13 | 0.6%), and Europe (13 | 0.6%), together accounting for 27.7% of all Andrews residents.
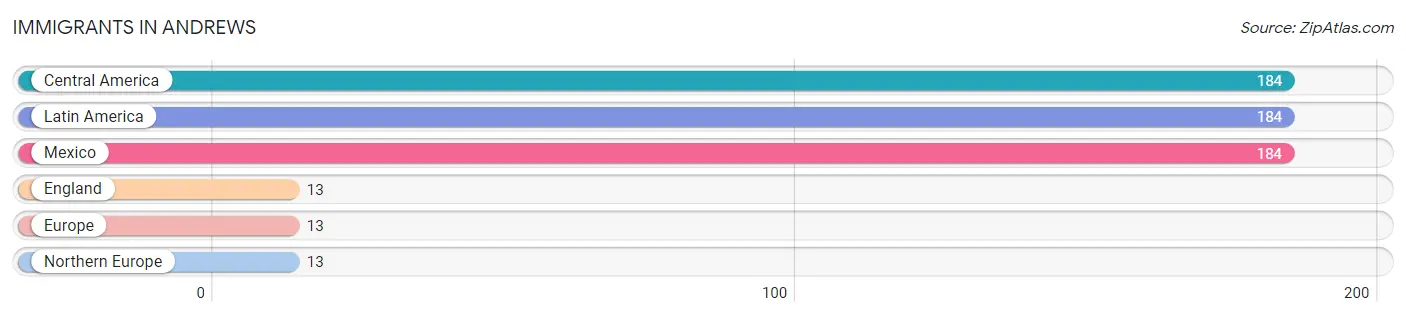
| Immigration Origin | # Population | % Population |
| Central America | 184 | 8.8% |
| England | 13 | 0.6% |
| Europe | 13 | 0.6% |
| Latin America | 184 | 8.8% |
| Mexico | 184 | 8.8% |
| Northern Europe | 13 | 0.6% | View All 6 Rows |
Sex and Age in Andrews
Sex and Age in Andrews
The most populous age groups in Andrews are 30 to 34 Years (105 | 11.2%) for men and 20 to 24 Years (137 | 12.0%) for women.
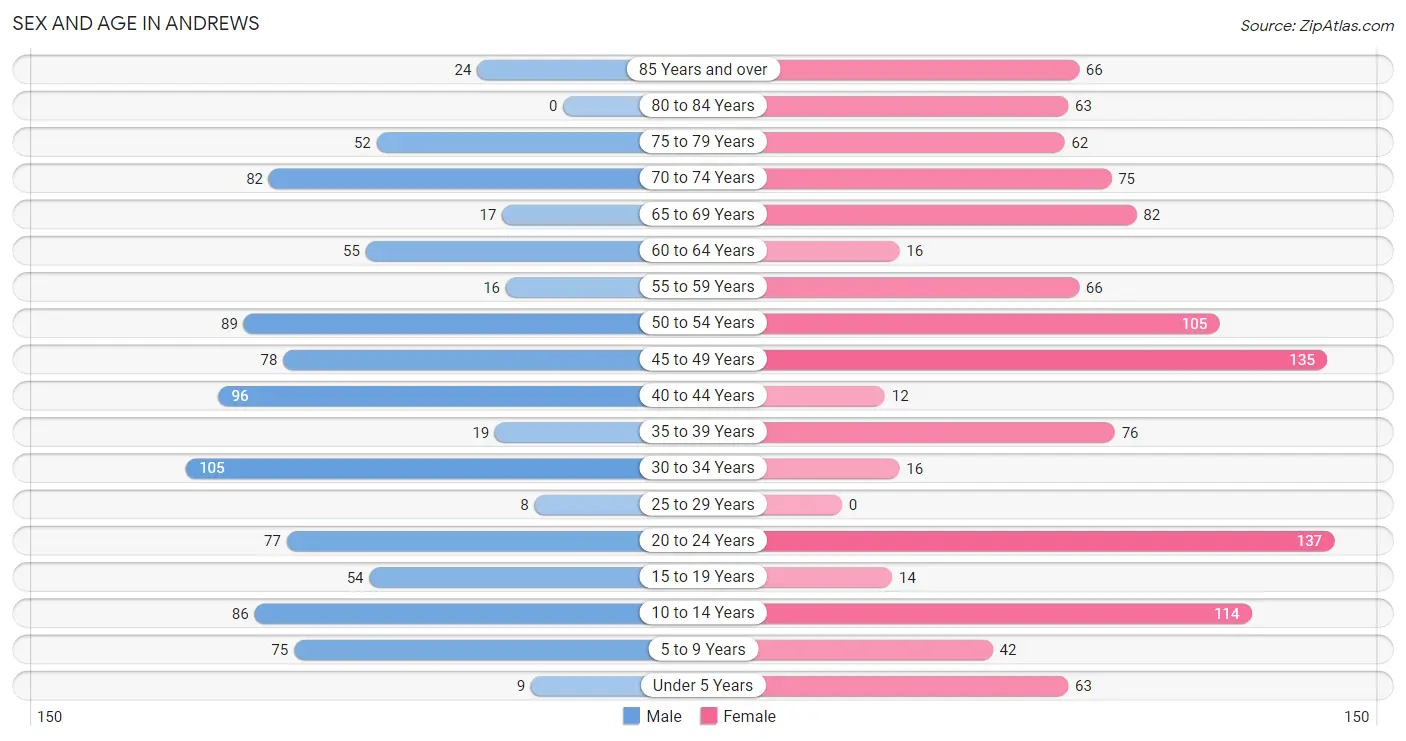
| Age Bracket | Male | Female |
| Under 5 Years | 9 (1.0%) | 63 (5.5%) |
| 5 to 9 Years | 75 (8.0%) | 42 (3.7%) |
| 10 to 14 Years | 86 (9.1%) | 114 (10.0%) |
| 15 to 19 Years | 54 (5.7%) | 14 (1.2%) |
| 20 to 24 Years | 77 (8.2%) | 137 (12.0%) |
| 25 to 29 Years | 8 (0.9%) | 0 (0.0%) |
| 30 to 34 Years | 105 (11.2%) | 16 (1.4%) |
| 35 to 39 Years | 19 (2.0%) | 76 (6.6%) |
| 40 to 44 Years | 96 (10.2%) | 12 (1.1%) |
| 45 to 49 Years | 78 (8.3%) | 135 (11.8%) |
| 50 to 54 Years | 89 (9.5%) | 105 (9.2%) |
| 55 to 59 Years | 16 (1.7%) | 66 (5.8%) |
| 60 to 64 Years | 55 (5.8%) | 16 (1.4%) |
| 65 to 69 Years | 17 (1.8%) | 82 (7.2%) |
| 70 to 74 Years | 82 (8.7%) | 75 (6.6%) |
| 75 to 79 Years | 52 (5.5%) | 62 (5.4%) |
| 80 to 84 Years | 0 (0.0%) | 63 (5.5%) |
| 85 Years and over | 24 (2.5%) | 66 (5.8%) |
| Total | 942 (100.0%) | 1,144 (100.0%) |
Families and Households in Andrews
Median Family Size in Andrews
The median family size in Andrews is 2.77 persons per family, with single male/father families (15 | 3.5%) accounting for the largest median family size of 4.6 persons per family. On the other hand, married-couple families (265 | 61.2%) represent the smallest median family size with 2.60 persons per family.
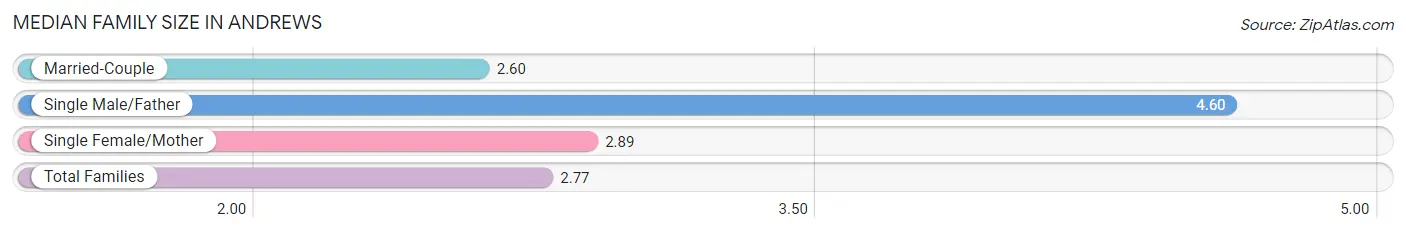
| Family Type | # Families | Family Size |
| Married-Couple | 265 (61.2%) | 2.60 |
| Single Male/Father | 15 (3.5%) | 4.60 |
| Single Female/Mother | 153 (35.3%) | 2.89 |
| Total Families | 433 (100.0%) | 2.77 |
Median Household Size in Andrews
The median household size in Andrews is 2.14 persons per household, with single male/father households (15 | 1.6%) accounting for the largest median household size of 4.6 persons per household. non-family households (514 | 54.3%) represent the smallest median household size with 1.42 persons per household.
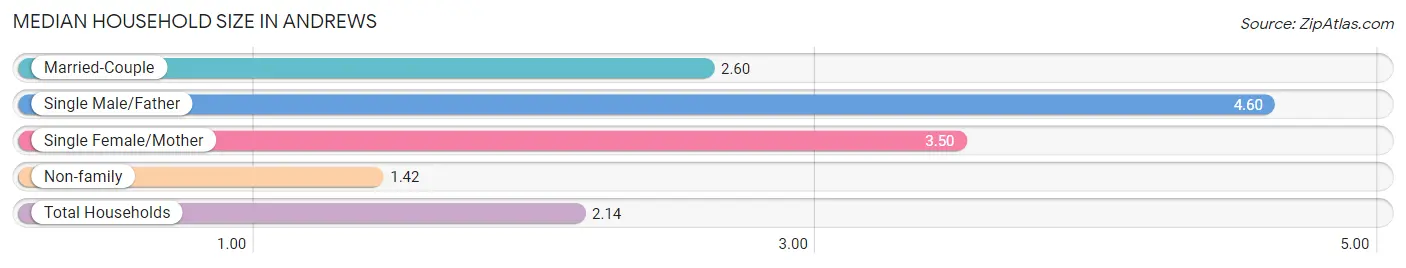
| Household Type | # Households | Household Size |
| Married-Couple | 265 (28.0%) | 2.60 |
| Single Male/Father | 15 (1.6%) | 4.60 |
| Single Female/Mother | 153 (16.2%) | 3.50 |
| Non-family | 514 (54.3%) | 1.42 |
| Total Households | 947 (100.0%) | 2.14 |
Household Size by Marriage Status in Andrews
Out of a total of 947 households in Andrews, 433 (45.7%) are family households, while 514 (54.3%) are nonfamily households. The most numerous type of family households are 2-person households, comprising 223, and the most common type of nonfamily households are 1-person households, comprising 348.
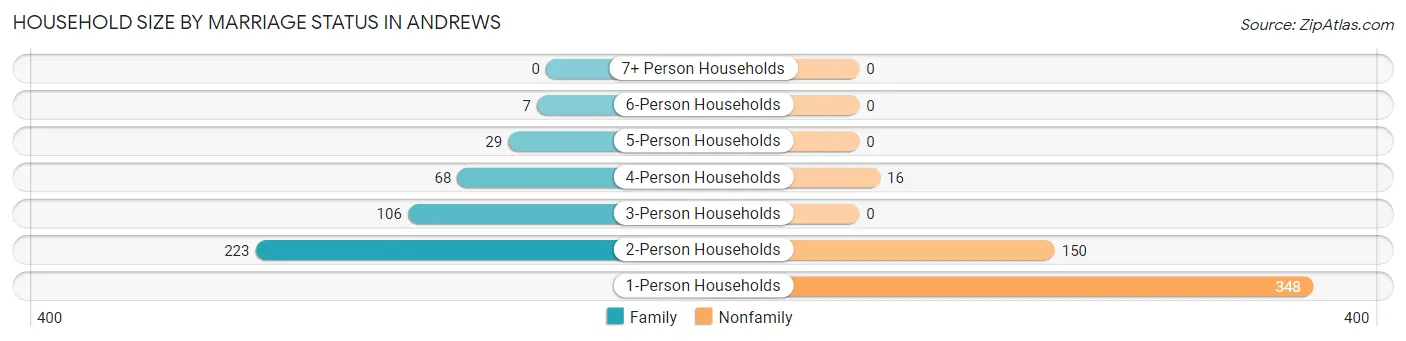
| Household Size | Family Households | Nonfamily Households |
| 1-Person Households | - | 348 (36.7%) |
| 2-Person Households | 223 (23.5%) | 150 (15.8%) |
| 3-Person Households | 106 (11.2%) | 0 (0.0%) |
| 4-Person Households | 68 (7.2%) | 16 (1.7%) |
| 5-Person Households | 29 (3.1%) | 0 (0.0%) |
| 6-Person Households | 7 (0.7%) | 0 (0.0%) |
| 7+ Person Households | 0 (0.0%) | 0 (0.0%) |
| Total | 433 (45.7%) | 514 (54.3%) |
Female Fertility in Andrews
Fertility by Age in Andrews
Average fertility rate in Andrews is 162.0 births per 1,000 women. Women in the age bracket of 15 to 19 years have the highest fertility rate with 714.0 births per 1,000 women. Women in the age bracket of 20 to 34 years acount for 84.1% of all women with births.
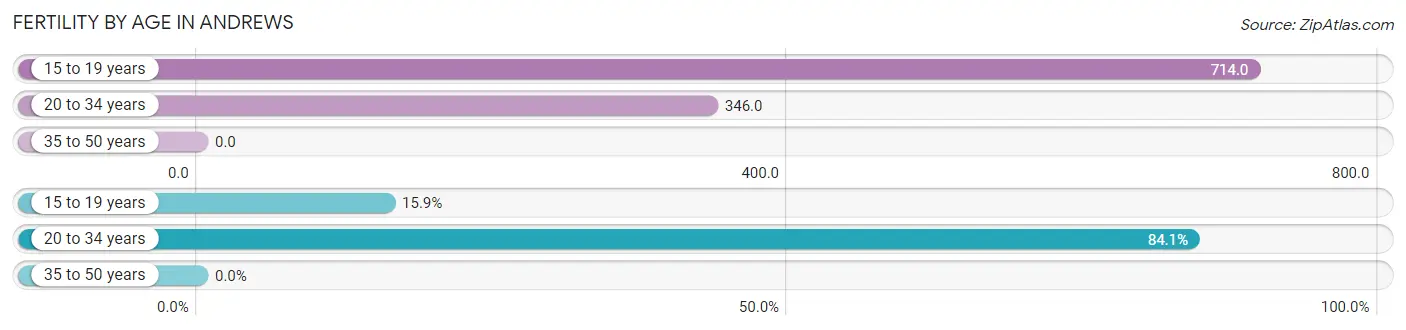
| Age Bracket | Women with Births | Births / 1,000 Women |
| 15 to 19 years | 10 (15.9%) | 714.0 |
| 20 to 34 years | 53 (84.1%) | 346.0 |
| 35 to 50 years | 0 (0.0%) | 0.0 |
| Total | 63 (100.0%) | 162.0 |
Fertility by Age by Marriage Status in Andrews
15.9% of women with births (63) in Andrews are married. The highest percentage of unmarried women with births falls into 20 to 34 years age bracket with 100.0% of them unmarried at the time of birth, while the lowest percentage of unmarried women with births belong to 15 to 19 years age bracket with 0.0% of them unmarried.
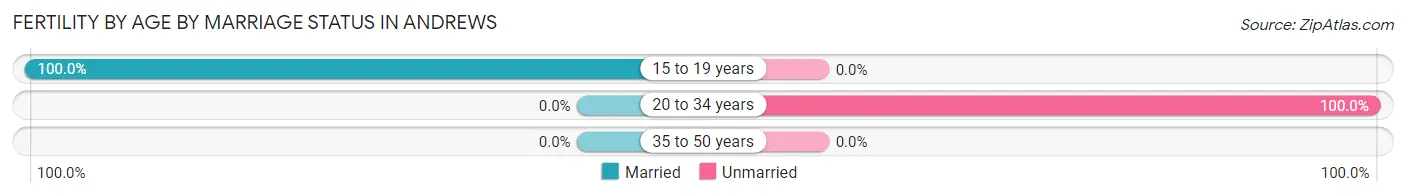
| Age Bracket | Married | Unmarried |
| 15 to 19 years | 10 (100.0%) | 0 (0.0%) |
| 20 to 34 years | 0 (0.0%) | 53 (100.0%) |
| 35 to 50 years | 0 (0.0%) | 0 (0.0%) |
| Total | 10 (15.9%) | 53 (84.1%) |
Fertility by Education in Andrews
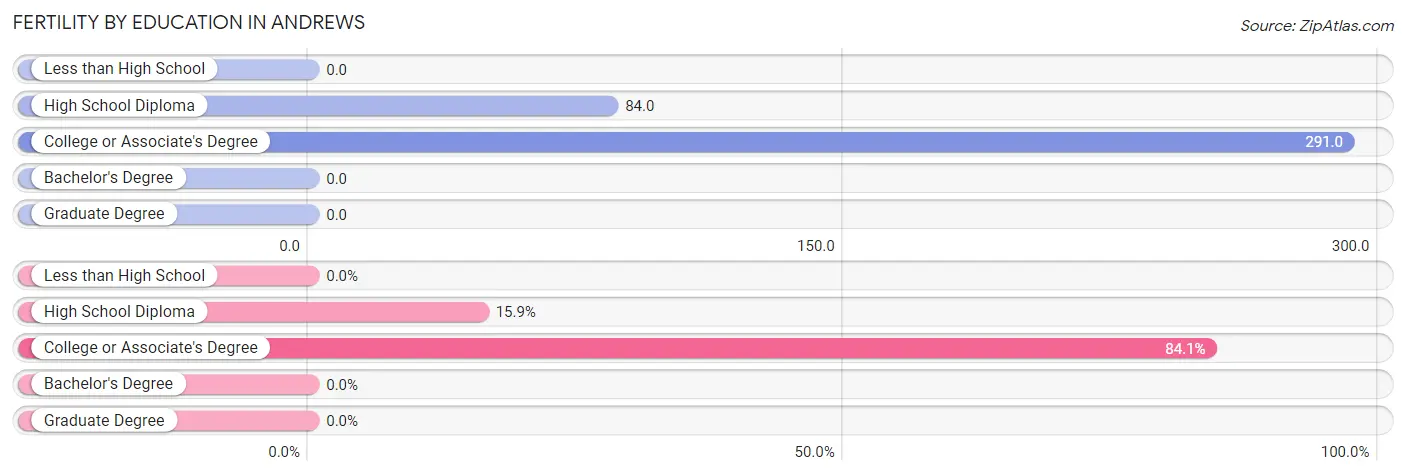
| Educational Attainment | Women with Births | Births / 1,000 Women |
| Less than High School | 0 (0.0%) | 0.0 |
| High School Diploma | 10 (15.9%) | 84.0 |
| College or Associate's Degree | 53 (84.1%) | 291.0 |
| Bachelor's Degree | 0 (0.0%) | 0.0 |
| Graduate Degree | 0 (0.0%) | 0.0 |
| Total | 63 (100.0%) | 162.0 |
Fertility by Education by Marriage Status in Andrews
84.1% of women with births in Andrews are unmarried. Women with the educational attainment of high school diploma are most likely to be married with 100.0% of them married at childbirth, while women with the educational attainment of college or associate's degree are least likely to be married with 100.0% of them unmarried at childbirth.
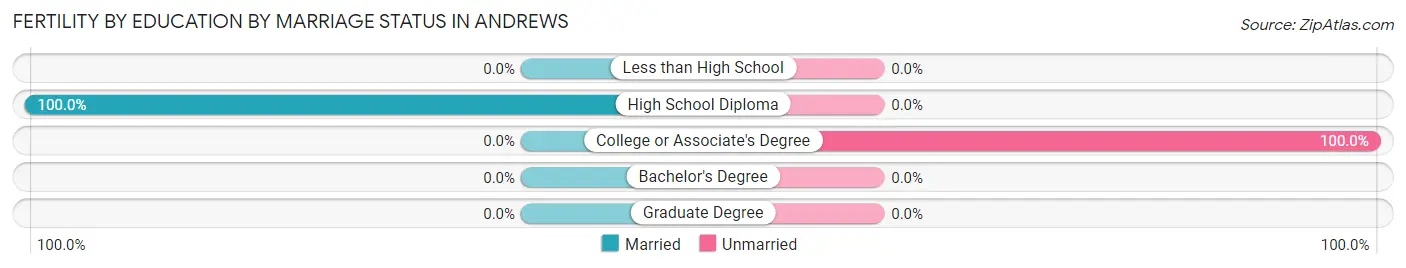
| Educational Attainment | Married | Unmarried |
| Less than High School | 0 (0.0%) | 0 (0.0%) |
| High School Diploma | 10 (100.0%) | 0 (0.0%) |
| College or Associate's Degree | 0 (0.0%) | 53 (100.0%) |
| Bachelor's Degree | 0 (0.0%) | 0 (0.0%) |
| Graduate Degree | 0 (0.0%) | 0 (0.0%) |
| Total | 10 (15.9%) | 53 (84.1%) |
Employment Characteristics in Andrews
Employment by Class of Employer in Andrews
Among the 833 employed individuals in Andrews, private company employees (501 | 60.1%), not-for-profit organizations (160 | 19.2%), and local government employees (52 | 6.2%) make up the most common classes of employment.
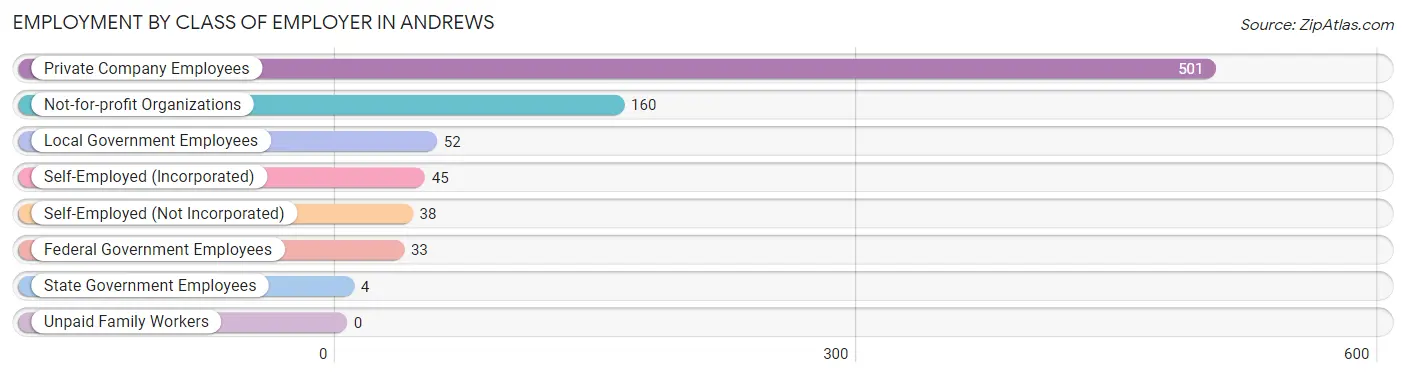
| Employer Class | # Employees | % Employees |
| Private Company Employees | 501 | 60.1% |
| Self-Employed (Incorporated) | 45 | 5.4% |
| Self-Employed (Not Incorporated) | 38 | 4.6% |
| Not-for-profit Organizations | 160 | 19.2% |
| Local Government Employees | 52 | 6.2% |
| State Government Employees | 4 | 0.5% |
| Federal Government Employees | 33 | 4.0% |
| Unpaid Family Workers | 0 | 0.0% |
| Total | 833 | 100.0% |
Employment Status by Age in Andrews
According to the labor force statistics for Andrews, out of the total population over 16 years of age (1,674), 58.8% or 984 individuals are in the labor force, with 12.9% or 127 of them unemployed. The age group with the highest labor force participation rate is 30 to 34 years, with 100.0% or 121 individuals in the labor force. Within the labor force, the 16 to 19 years age range has the highest percentage of unemployed individuals, with 45.7% or 16 of them being unemployed.
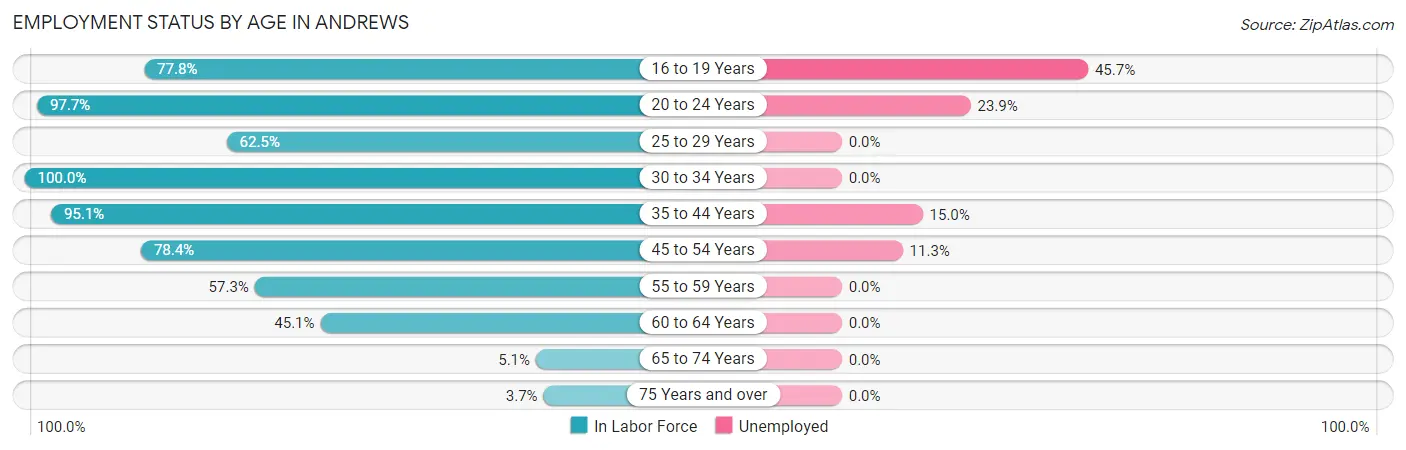
| Age Bracket | In Labor Force | Unemployed |
| 16 to 19 Years | 35 (77.8%) | 16 (45.7%) |
| 20 to 24 Years | 209 (97.7%) | 50 (23.9%) |
| 25 to 29 Years | 5 (62.5%) | 0 (0.0%) |
| 30 to 34 Years | 121 (100.0%) | 0 (0.0%) |
| 35 to 44 Years | 193 (95.1%) | 29 (15.0%) |
| 45 to 54 Years | 319 (78.4%) | 36 (11.3%) |
| 55 to 59 Years | 47 (57.3%) | 0 (0.0%) |
| 60 to 64 Years | 32 (45.1%) | 0 (0.0%) |
| 65 to 74 Years | 13 (5.1%) | 0 (0.0%) |
| 75 Years and over | 10 (3.7%) | 0 (0.0%) |
| Total | 984 (58.8%) | 127 (12.9%) |
Employment Status by Educational Attainment in Andrews
According to labor force statistics for Andrews, 80.4% of individuals (717) out of the total population between 25 and 64 years of age (892) are in the labor force, with 9.1% or 65 of them being unemployed. The group with the highest labor force participation rate are those with the educational attainment of college / associate degree, with 95.1% or 213 individuals in the labor force. Within the labor force, individuals with less than high school education have the highest percentage of unemployment, with 19.4% or 21 of them being unemployed.
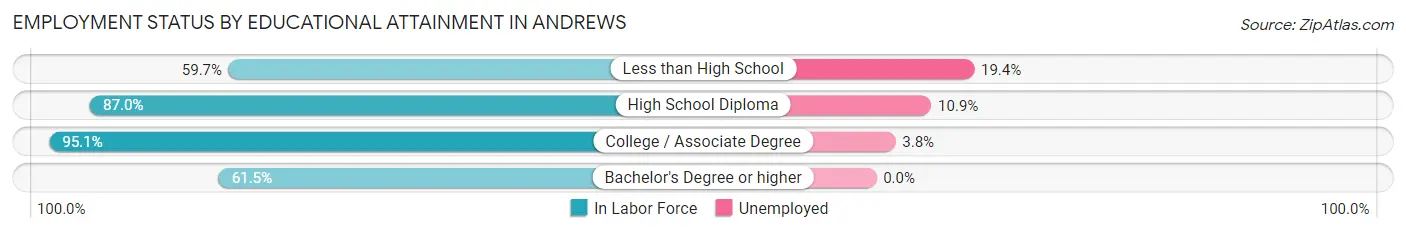
| Educational Attainment | In Labor Force | Unemployed |
| Less than High School | 108 (59.7%) | 35 (19.4%) |
| High School Diploma | 329 (87.0%) | 41 (10.9%) |
| College / Associate Degree | 213 (95.1%) | 9 (3.8%) |
| Bachelor's Degree or higher | 67 (61.5%) | 0 (0.0%) |
| Total | 717 (80.4%) | 81 (9.1%) |
Employment Occupations by Sex in Andrews
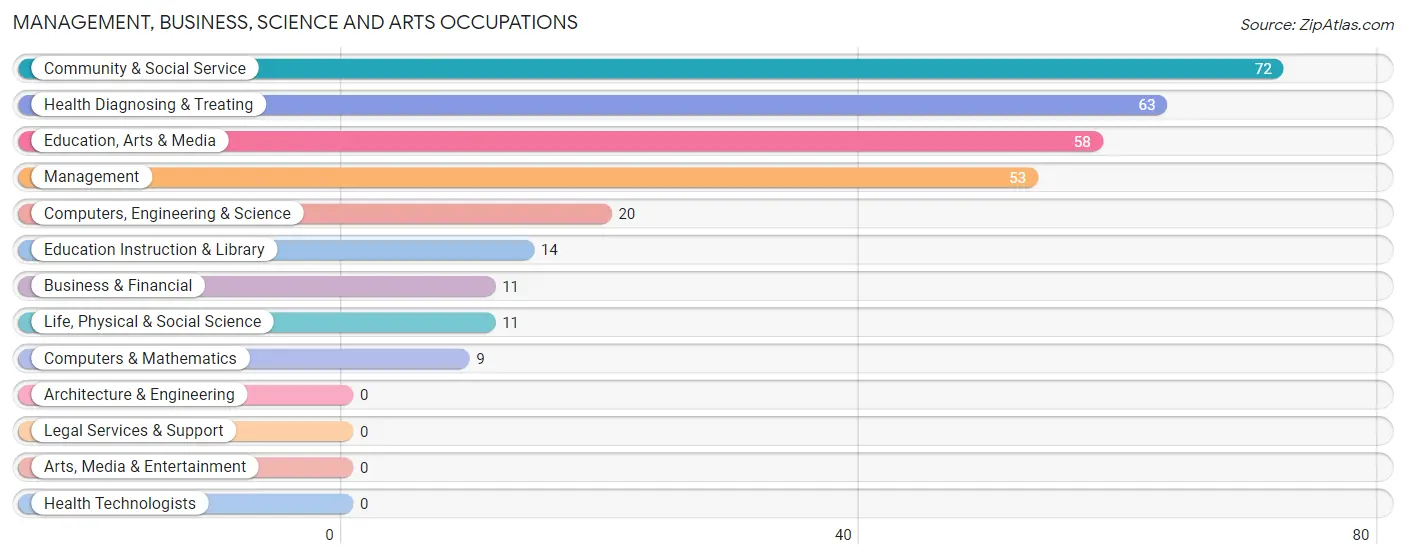
Management, Business, Science and Arts Occupations
The most common Management, Business, Science and Arts occupations in Andrews are Community & Social Service (72 | 8.7%), Health Diagnosing & Treating (63 | 7.6%), Education, Arts & Media (58 | 7.0%), Management (53 | 6.4%), and Computers, Engineering & Science (20 | 2.4%).
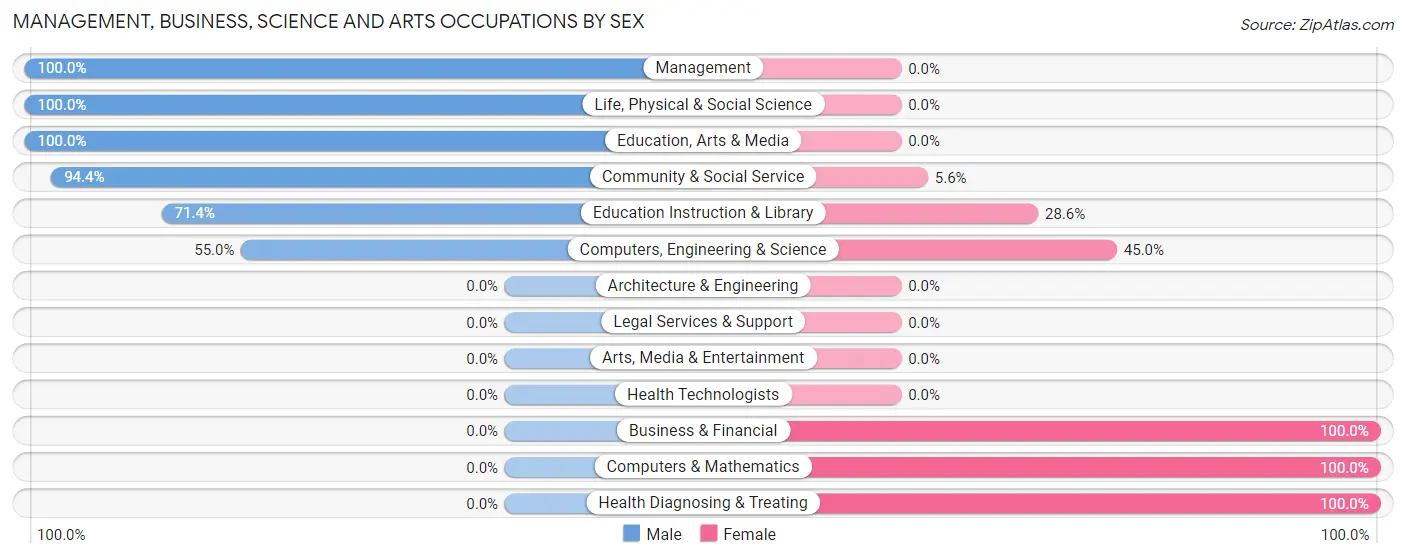
Management, Business, Science and Arts Occupations by Sex
Within the Management, Business, Science and Arts occupations in Andrews, the most male-oriented occupations are Management (100.0%), Life, Physical & Social Science (100.0%), and Education, Arts & Media (100.0%), while the most female-oriented occupations are Business & Financial (100.0%), Computers & Mathematics (100.0%), and Health Diagnosing & Treating (100.0%).
| Occupation | Male | Female |
| Management | 53 (100.0%) | 0 (0.0%) |
| Business & Financial | 0 (0.0%) | 11 (100.0%) |
| Computers, Engineering & Science | 11 (55.0%) | 9 (45.0%) |
| Computers & Mathematics | 0 (0.0%) | 9 (100.0%) |
| Architecture & Engineering | 0 (0.0%) | 0 (0.0%) |
| Life, Physical & Social Science | 11 (100.0%) | 0 (0.0%) |
| Community & Social Service | 68 (94.4%) | 4 (5.6%) |
| Education, Arts & Media | 58 (100.0%) | 0 (0.0%) |
| Legal Services & Support | 0 (0.0%) | 0 (0.0%) |
| Education Instruction & Library | 10 (71.4%) | 4 (28.6%) |
| Arts, Media & Entertainment | 0 (0.0%) | 0 (0.0%) |
| Health Diagnosing & Treating | 0 (0.0%) | 63 (100.0%) |
| Health Technologists | 0 (0.0%) | 0 (0.0%) |
| Total (Category) | 132 (60.3%) | 87 (39.7%) |
| Total (Overall) | 461 (55.7%) | 367 (44.3%) |
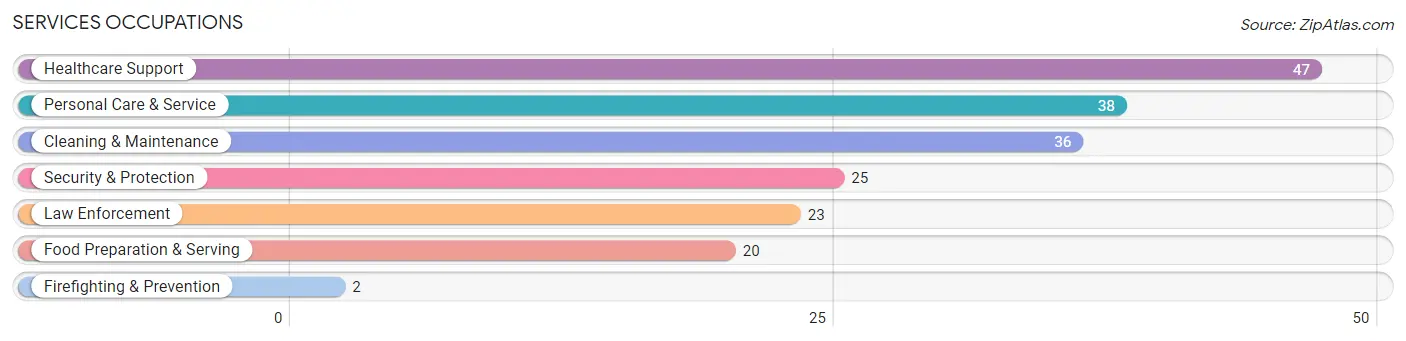
Services Occupations
The most common Services occupations in Andrews are Healthcare Support (47 | 5.7%), Personal Care & Service (38 | 4.6%), Cleaning & Maintenance (36 | 4.3%), Security & Protection (25 | 3.0%), and Law Enforcement (23 | 2.8%).
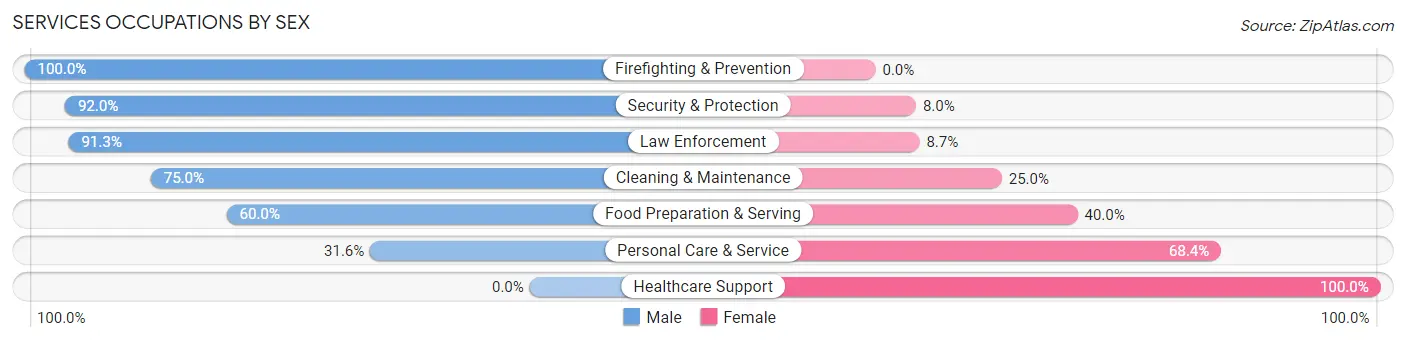
Services Occupations by Sex
Within the Services occupations in Andrews, the most male-oriented occupations are Firefighting & Prevention (100.0%), Security & Protection (92.0%), and Law Enforcement (91.3%), while the most female-oriented occupations are Healthcare Support (100.0%), Personal Care & Service (68.4%), and Food Preparation & Serving (40.0%).
| Occupation | Male | Female |
| Healthcare Support | 0 (0.0%) | 47 (100.0%) |
| Security & Protection | 23 (92.0%) | 2 (8.0%) |
| Firefighting & Prevention | 2 (100.0%) | 0 (0.0%) |
| Law Enforcement | 21 (91.3%) | 2 (8.7%) |
| Food Preparation & Serving | 12 (60.0%) | 8 (40.0%) |
| Cleaning & Maintenance | 27 (75.0%) | 9 (25.0%) |
| Personal Care & Service | 12 (31.6%) | 26 (68.4%) |
| Total (Category) | 74 (44.6%) | 92 (55.4%) |
| Total (Overall) | 461 (55.7%) | 367 (44.3%) |
Sales and Office Occupations
The most common Sales and Office occupations in Andrews are Office & Administration (170 | 20.5%), and Sales & Related (89 | 10.7%).
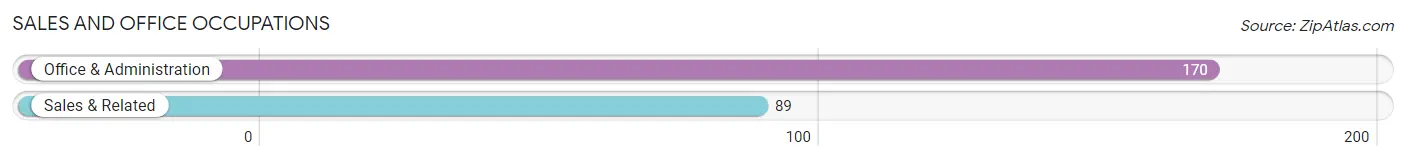
Sales and Office Occupations by Sex
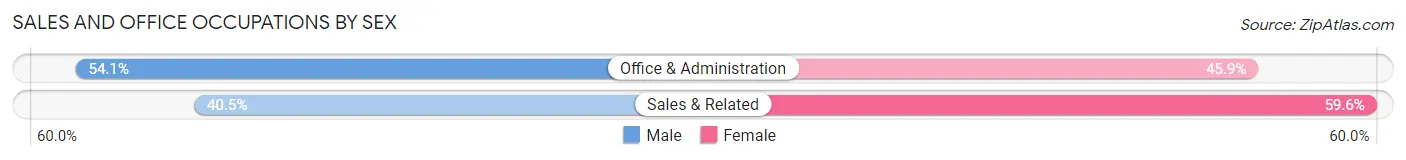
| Occupation | Male | Female |
| Sales & Related | 36 (40.5%) | 53 (59.6%) |
| Office & Administration | 92 (54.1%) | 78 (45.9%) |
| Total (Category) | 128 (49.4%) | 131 (50.6%) |
| Total (Overall) | 461 (55.7%) | 367 (44.3%) |
Natural Resources, Construction and Maintenance Occupations
The most common Natural Resources, Construction and Maintenance occupations in Andrews are Construction & Extraction (50 | 6.0%), Installation, Maintenance & Repair (46 | 5.6%), and Farming, Fishing & Forestry (16 | 1.9%).
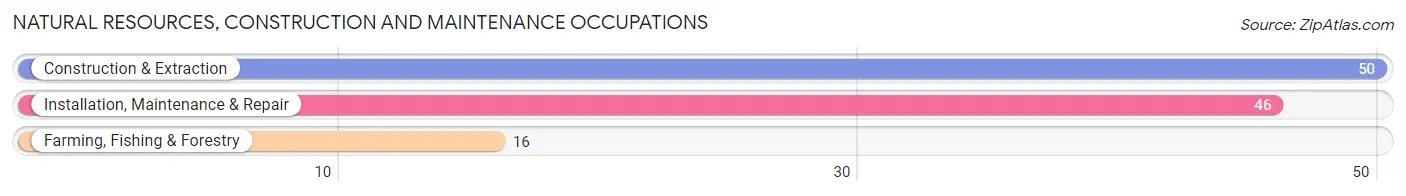
Natural Resources, Construction and Maintenance Occupations by Sex
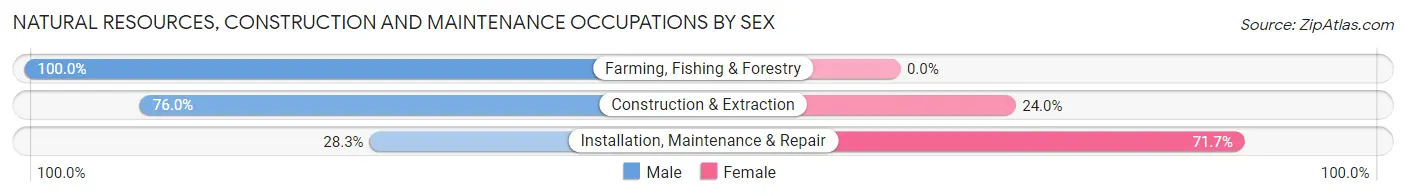
| Occupation | Male | Female |
| Farming, Fishing & Forestry | 16 (100.0%) | 0 (0.0%) |
| Construction & Extraction | 38 (76.0%) | 12 (24.0%) |
| Installation, Maintenance & Repair | 13 (28.3%) | 33 (71.7%) |
| Total (Category) | 67 (59.8%) | 45 (40.2%) |
| Total (Overall) | 461 (55.7%) | 367 (44.3%) |
Production, Transportation and Moving Occupations
The most common Production, Transportation and Moving occupations in Andrews are Material Moving (36 | 4.3%), Production (27 | 3.3%), and Transportation (9 | 1.1%).
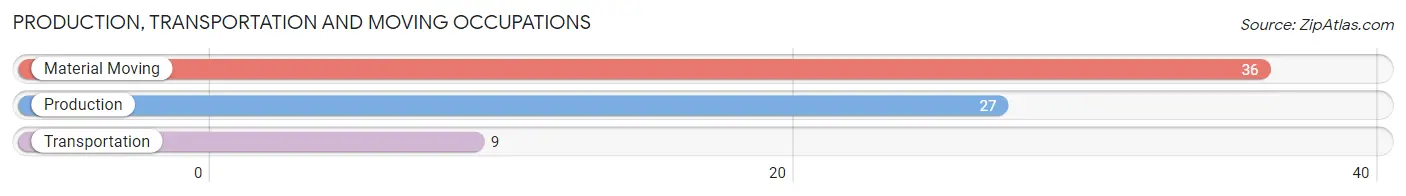
Production, Transportation and Moving Occupations by Sex
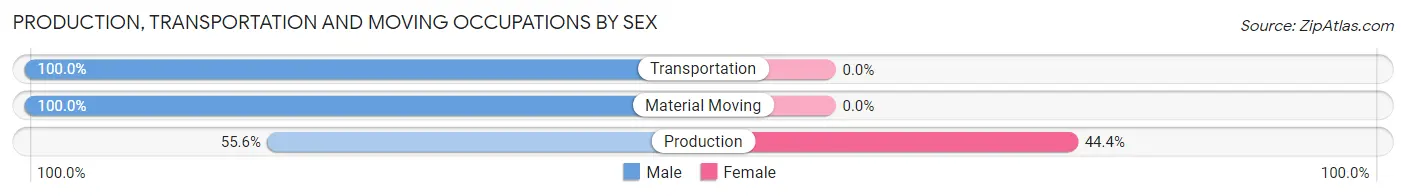
| Occupation | Male | Female |
| Production | 15 (55.6%) | 12 (44.4%) |
| Transportation | 9 (100.0%) | 0 (0.0%) |
| Material Moving | 36 (100.0%) | 0 (0.0%) |
| Total (Category) | 60 (83.3%) | 12 (16.7%) |
| Total (Overall) | 461 (55.7%) | 367 (44.3%) |
Employment Industries by Sex in Andrews
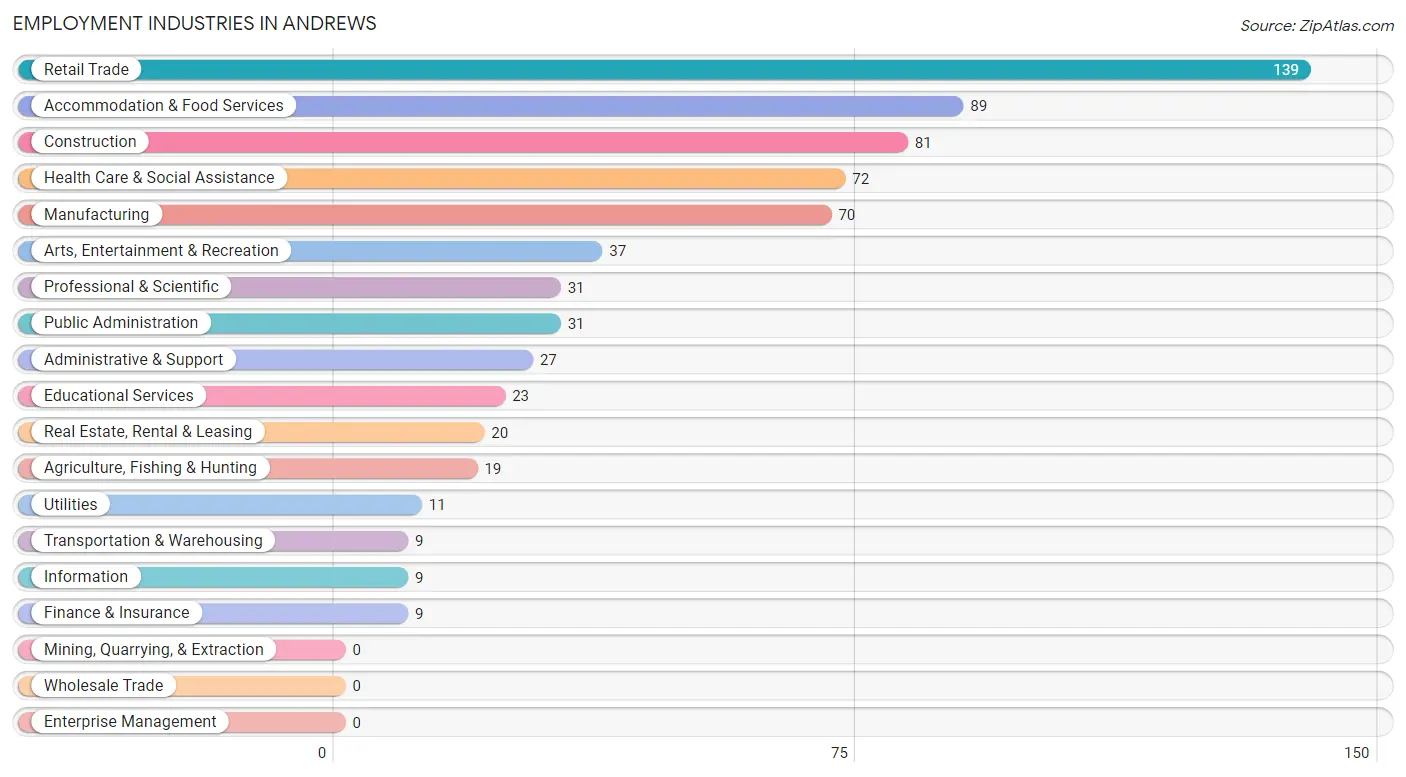
Employment Industries in Andrews
The major employment industries in Andrews include Retail Trade (139 | 16.8%), Accommodation & Food Services (89 | 10.7%), Construction (81 | 9.8%), Health Care & Social Assistance (72 | 8.7%), and Manufacturing (70 | 8.5%).
Employment Industries by Sex in Andrews
The Andrews industries that see more men than women are Transportation & Warehousing (100.0%), Utilities (100.0%), and Administrative & Support (100.0%), whereas the industries that tend to have a higher number of women are Information (100.0%), Finance & Insurance (100.0%), and Real Estate, Rental & Leasing (100.0%).
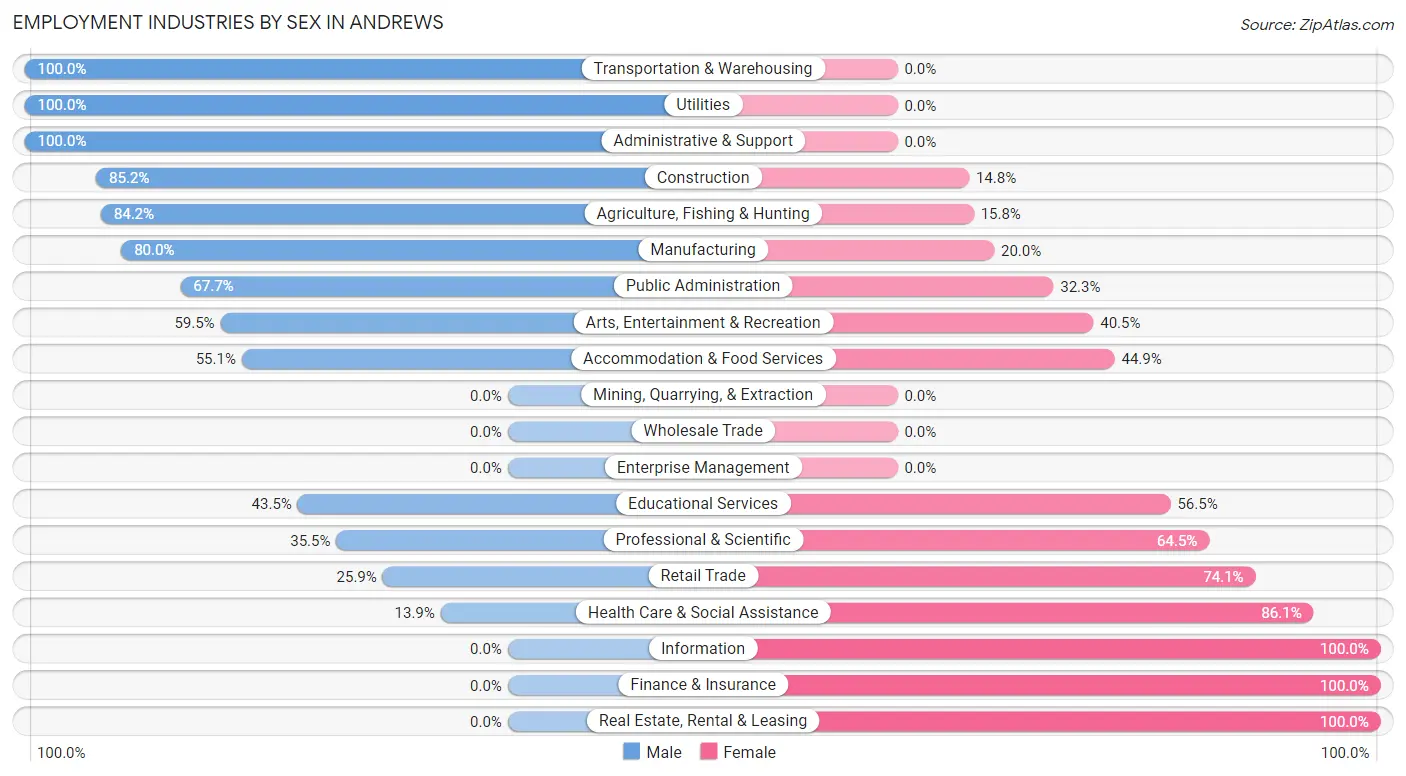
| Industry | Male | Female |
| Agriculture, Fishing & Hunting | 16 (84.2%) | 3 (15.8%) |
| Mining, Quarrying, & Extraction | 0 (0.0%) | 0 (0.0%) |
| Construction | 69 (85.2%) | 12 (14.8%) |
| Manufacturing | 56 (80.0%) | 14 (20.0%) |
| Wholesale Trade | 0 (0.0%) | 0 (0.0%) |
| Retail Trade | 36 (25.9%) | 103 (74.1%) |
| Transportation & Warehousing | 9 (100.0%) | 0 (0.0%) |
| Utilities | 11 (100.0%) | 0 (0.0%) |
| Information | 0 (0.0%) | 9 (100.0%) |
| Finance & Insurance | 0 (0.0%) | 9 (100.0%) |
| Real Estate, Rental & Leasing | 0 (0.0%) | 20 (100.0%) |
| Professional & Scientific | 11 (35.5%) | 20 (64.5%) |
| Enterprise Management | 0 (0.0%) | 0 (0.0%) |
| Administrative & Support | 27 (100.0%) | 0 (0.0%) |
| Educational Services | 10 (43.5%) | 13 (56.5%) |
| Health Care & Social Assistance | 10 (13.9%) | 62 (86.1%) |
| Arts, Entertainment & Recreation | 22 (59.5%) | 15 (40.5%) |
| Accommodation & Food Services | 49 (55.1%) | 40 (44.9%) |
| Public Administration | 21 (67.7%) | 10 (32.3%) |
| Total | 461 (55.7%) | 367 (44.3%) |
Education in Andrews
School Enrollment in Andrews
The most common levels of schooling among the 383 students in Andrews are middle school (185 | 48.3%), elementary school (98 | 25.6%), and high school (48 | 12.5%).
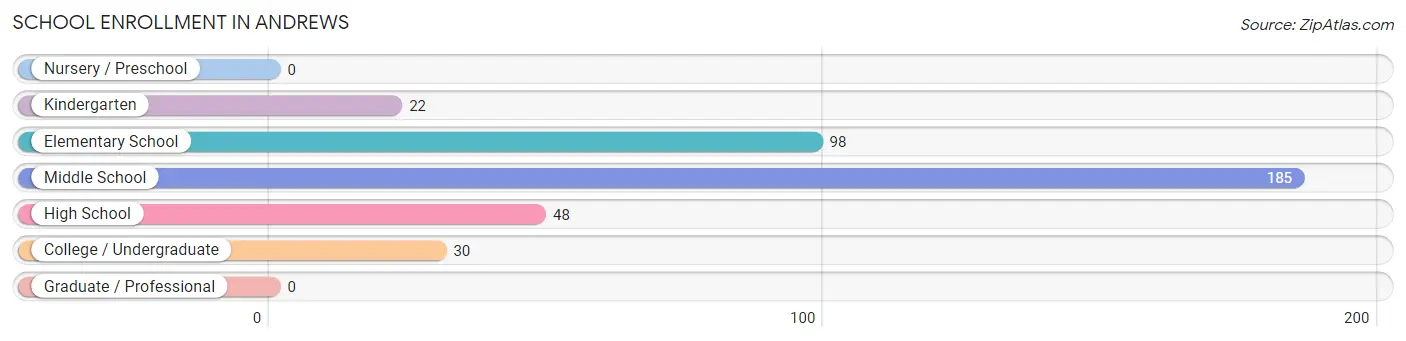
| School Level | # Students | % Students |
| Nursery / Preschool | 0 | 0.0% |
| Kindergarten | 22 | 5.7% |
| Elementary School | 98 | 25.6% |
| Middle School | 185 | 48.3% |
| High School | 48 | 12.5% |
| College / Undergraduate | 30 | 7.8% |
| Graduate / Professional | 0 | 0.0% |
| Total | 383 | 100.0% |
School Enrollment by Age by Funding Source in Andrews
Out of a total of 383 students who are enrolled in schools in Andrews, 5 (1.3%) attend a private institution, while the remaining 378 (98.7%) are enrolled in public schools. The age group of 20 to 24 year olds has the highest likelihood of being enrolled in private schools, with 5 (27.8% in the age bracket) enrolled. Conversely, the age group of 5 to 9 year old has the lowest likelihood of being enrolled in a private school, with 117 (100.0% in the age bracket) attending a public institution.

| Age Bracket | Public School | Private School |
| 3 to 4 Year Olds | 0 (0.0%) | 0 (0.0%) |
| 5 to 9 Year Old | 117 (100.0%) | 0 (0.0%) |
| 10 to 14 Year Olds | 200 (100.0%) | 0 (0.0%) |
| 15 to 17 Year Olds | 30 (100.0%) | 0 (0.0%) |
| 18 to 19 Year Olds | 0 (0.0%) | 0 (0.0%) |
| 20 to 24 Year Olds | 13 (72.2%) | 5 (27.8%) |
| 25 to 34 Year Olds | 12 (100.0%) | 0 (0.0%) |
| 35 Years and over | 6 (100.0%) | 0 (0.0%) |
| Total | 378 (98.7%) | 5 (1.3%) |
Educational Attainment by Field of Study in Andrews
Education (43 | 22.8%), science & technology (42 | 22.2%), social sciences (30 | 15.9%), arts & humanities (23 | 12.2%), and liberal arts & history (21 | 11.1%) are the most common fields of study among 189 individuals in Andrews who have obtained a bachelor's degree or higher.
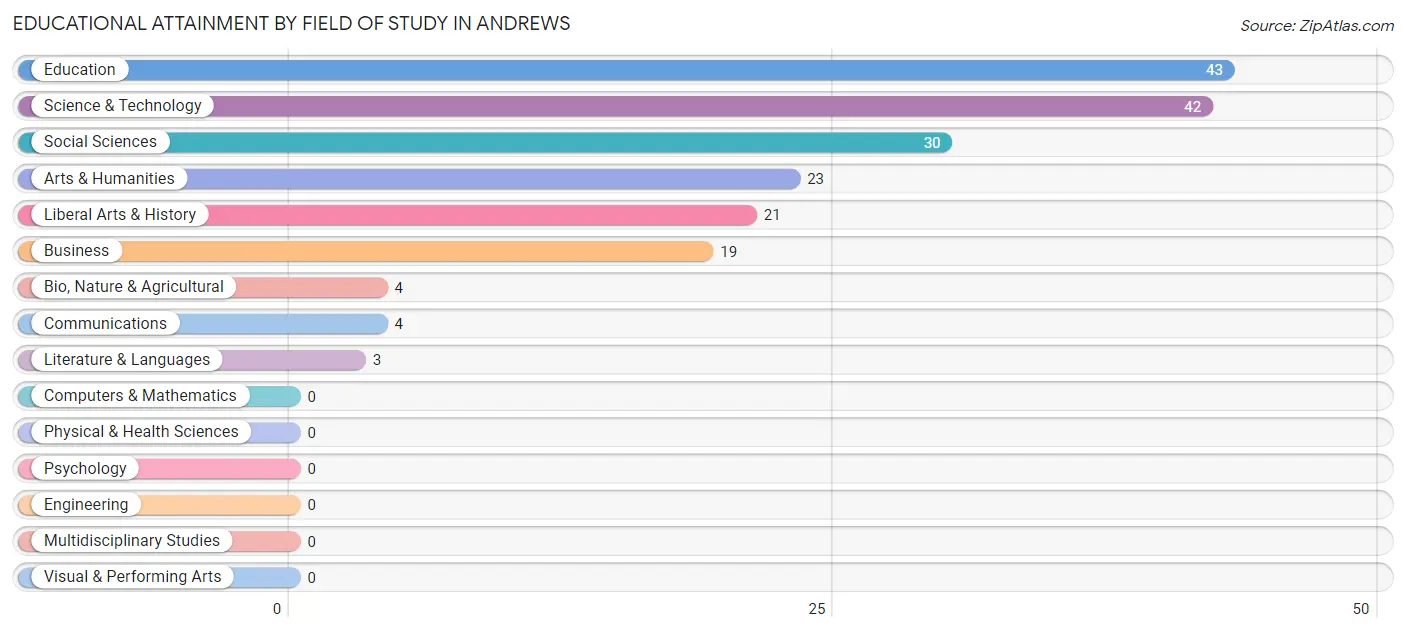
| Field of Study | # Graduates | % Graduates |
| Computers & Mathematics | 0 | 0.0% |
| Bio, Nature & Agricultural | 4 | 2.1% |
| Physical & Health Sciences | 0 | 0.0% |
| Psychology | 0 | 0.0% |
| Social Sciences | 30 | 15.9% |
| Engineering | 0 | 0.0% |
| Multidisciplinary Studies | 0 | 0.0% |
| Science & Technology | 42 | 22.2% |
| Business | 19 | 10.1% |
| Education | 43 | 22.8% |
| Literature & Languages | 3 | 1.6% |
| Liberal Arts & History | 21 | 11.1% |
| Visual & Performing Arts | 0 | 0.0% |
| Communications | 4 | 2.1% |
| Arts & Humanities | 23 | 12.2% |
| Total | 189 | 100.0% |
Transportation & Commute in Andrews
Vehicle Availability by Sex in Andrews
The most prevalent vehicle ownership categories in Andrews are males with 1 vehicle (208, accounting for 47.1%) and females with 1 vehicle (152, making up 53.2%).
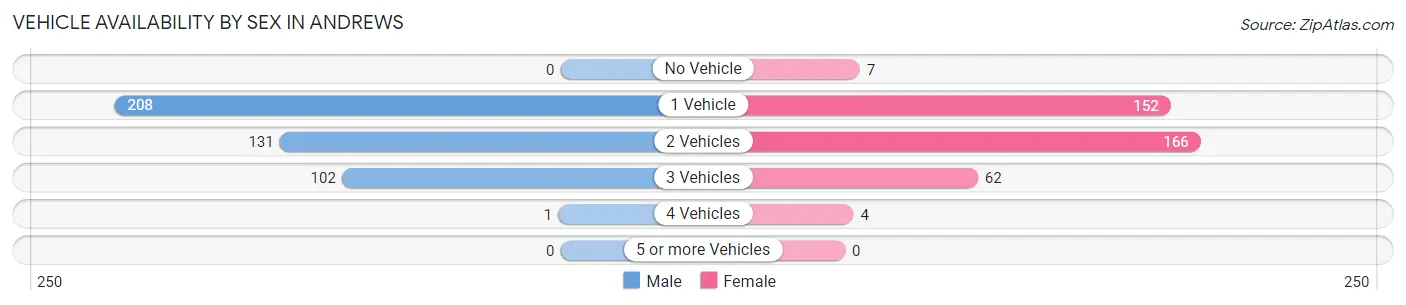
| Vehicles Available | Male | Female |
| No Vehicle | 0 (0.0%) | 7 (1.8%) |
| 1 Vehicle | 208 (47.1%) | 152 (38.9%) |
| 2 Vehicles | 131 (29.6%) | 166 (42.5%) |
| 3 Vehicles | 102 (23.1%) | 62 (15.9%) |
| 4 Vehicles | 1 (0.2%) | 4 (1.0%) |
| 5 or more Vehicles | 0 (0.0%) | 0 (0.0%) |
| Total | 442 (100.0%) | 391 (100.0%) |
Commute Time in Andrews
The most frequently occuring commute durations in Andrews are 5 to 9 minutes (217 commuters, 26.1%), 30 to 34 minutes (183 commuters, 22.0%), and less than 5 minutes (159 commuters, 19.1%).
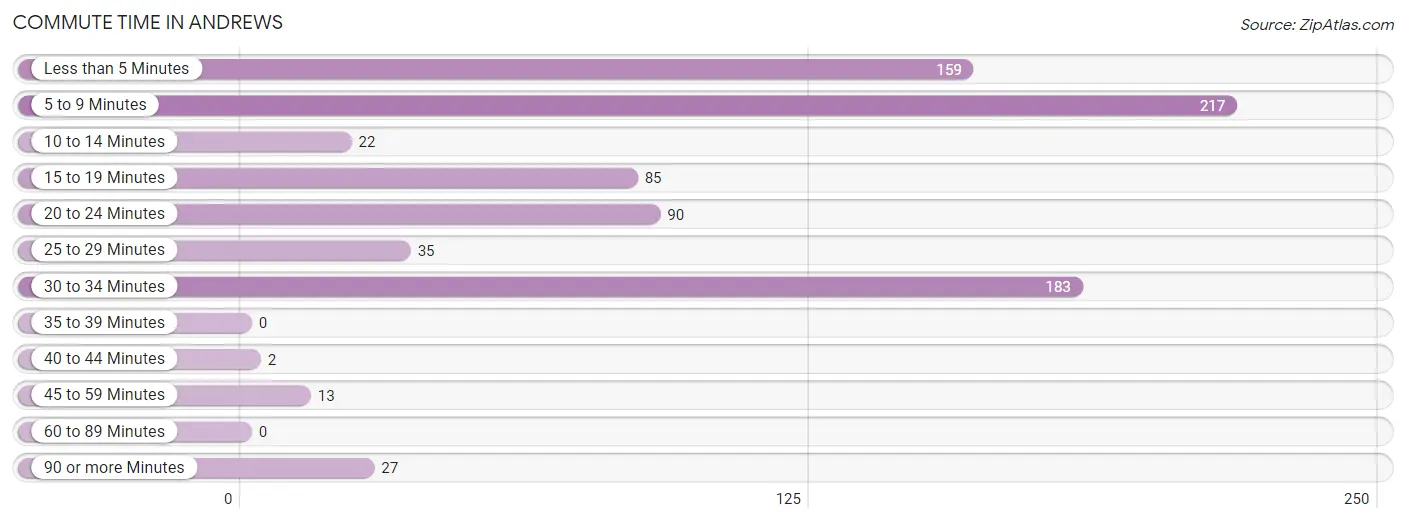
| Commute Time | # Commuters | % Commuters |
| Less than 5 Minutes | 159 | 19.1% |
| 5 to 9 Minutes | 217 | 26.1% |
| 10 to 14 Minutes | 22 | 2.6% |
| 15 to 19 Minutes | 85 | 10.2% |
| 20 to 24 Minutes | 90 | 10.8% |
| 25 to 29 Minutes | 35 | 4.2% |
| 30 to 34 Minutes | 183 | 22.0% |
| 35 to 39 Minutes | 0 | 0.0% |
| 40 to 44 Minutes | 2 | 0.2% |
| 45 to 59 Minutes | 13 | 1.6% |
| 60 to 89 Minutes | 0 | 0.0% |
| 90 or more Minutes | 27 | 3.2% |
Commute Time by Sex in Andrews
The most common commute times in Andrews are 5 to 9 minutes (165 commuters, 37.3%) for males and 30 to 34 minutes (95 commuters, 24.3%) for females.
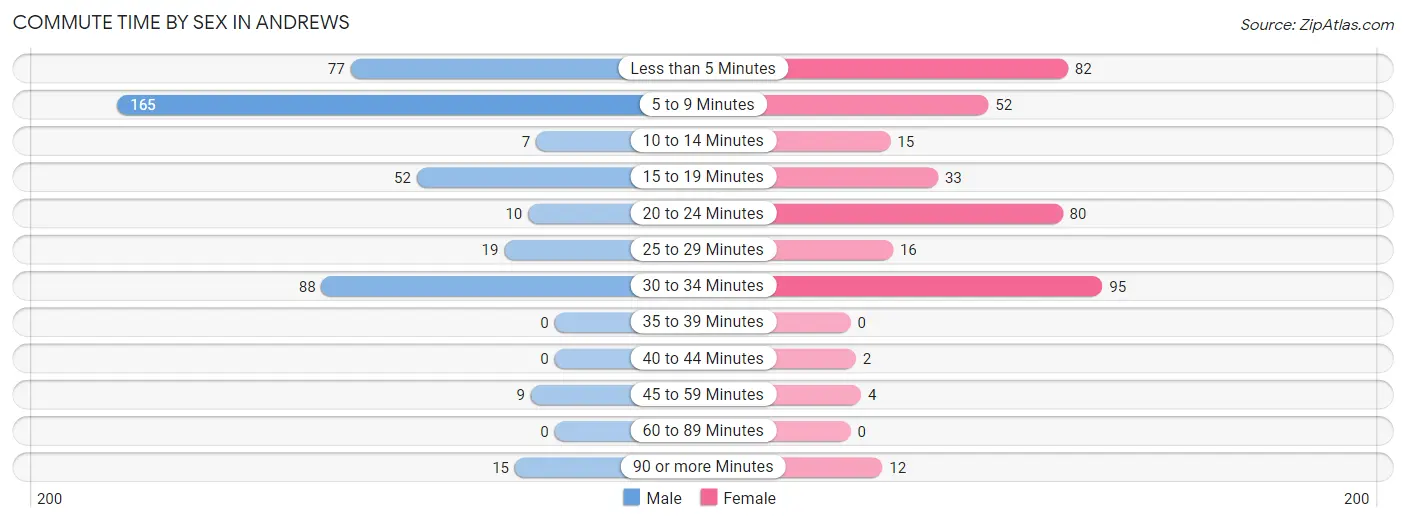
| Commute Time | Male | Female |
| Less than 5 Minutes | 77 (17.4%) | 82 (21.0%) |
| 5 to 9 Minutes | 165 (37.3%) | 52 (13.3%) |
| 10 to 14 Minutes | 7 (1.6%) | 15 (3.8%) |
| 15 to 19 Minutes | 52 (11.8%) | 33 (8.4%) |
| 20 to 24 Minutes | 10 (2.3%) | 80 (20.5%) |
| 25 to 29 Minutes | 19 (4.3%) | 16 (4.1%) |
| 30 to 34 Minutes | 88 (19.9%) | 95 (24.3%) |
| 35 to 39 Minutes | 0 (0.0%) | 0 (0.0%) |
| 40 to 44 Minutes | 0 (0.0%) | 2 (0.5%) |
| 45 to 59 Minutes | 9 (2.0%) | 4 (1.0%) |
| 60 to 89 Minutes | 0 (0.0%) | 0 (0.0%) |
| 90 or more Minutes | 15 (3.4%) | 12 (3.1%) |
Time of Departure to Work by Sex in Andrews
The most frequent times of departure to work in Andrews are 7:00 AM to 7:29 AM (159, 36.0%) for males and 7:00 AM to 7:29 AM (121, 30.9%) for females.
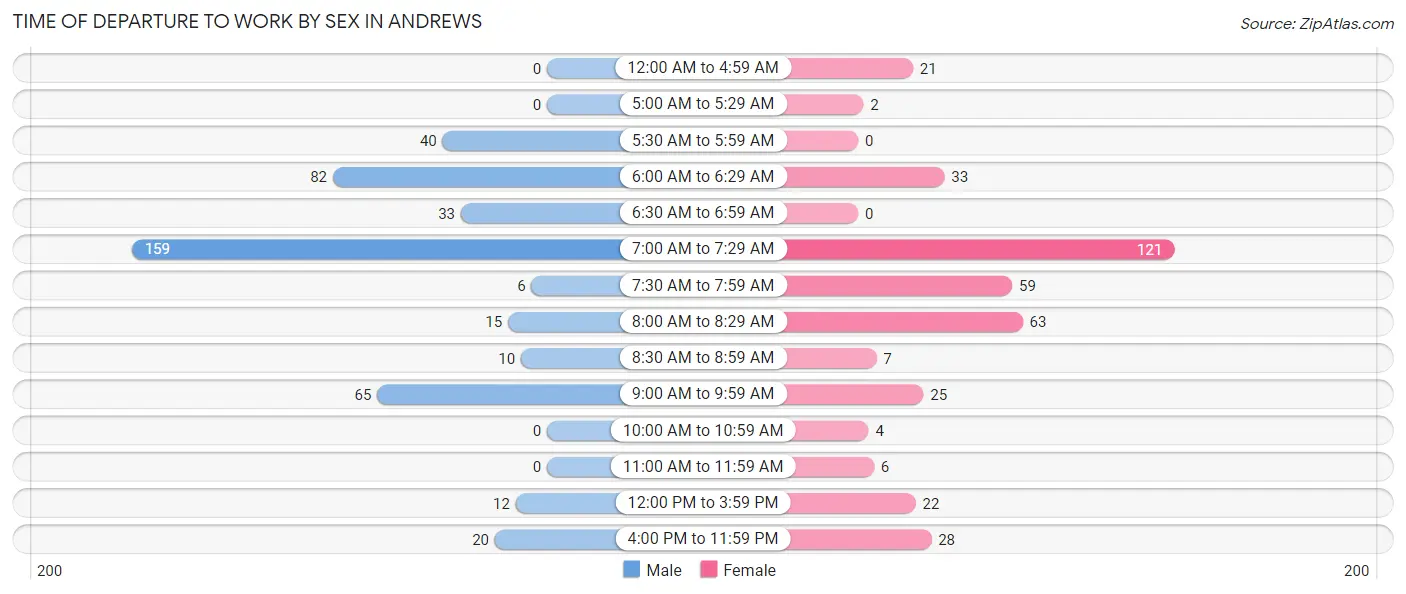
| Time of Departure | Male | Female |
| 12:00 AM to 4:59 AM | 0 (0.0%) | 21 (5.4%) |
| 5:00 AM to 5:29 AM | 0 (0.0%) | 2 (0.5%) |
| 5:30 AM to 5:59 AM | 40 (9.0%) | 0 (0.0%) |
| 6:00 AM to 6:29 AM | 82 (18.5%) | 33 (8.4%) |
| 6:30 AM to 6:59 AM | 33 (7.5%) | 0 (0.0%) |
| 7:00 AM to 7:29 AM | 159 (36.0%) | 121 (30.9%) |
| 7:30 AM to 7:59 AM | 6 (1.4%) | 59 (15.1%) |
| 8:00 AM to 8:29 AM | 15 (3.4%) | 63 (16.1%) |
| 8:30 AM to 8:59 AM | 10 (2.3%) | 7 (1.8%) |
| 9:00 AM to 9:59 AM | 65 (14.7%) | 25 (6.4%) |
| 10:00 AM to 10:59 AM | 0 (0.0%) | 4 (1.0%) |
| 11:00 AM to 11:59 AM | 0 (0.0%) | 6 (1.5%) |
| 12:00 PM to 3:59 PM | 12 (2.7%) | 22 (5.6%) |
| 4:00 PM to 11:59 PM | 20 (4.5%) | 28 (7.2%) |
| Total | 442 (100.0%) | 391 (100.0%) |
Housing Occupancy in Andrews
Occupancy by Ownership in Andrews
Of the total 947 dwellings in Andrews, owner-occupied units account for 481 (50.8%), while renter-occupied units make up 466 (49.2%).
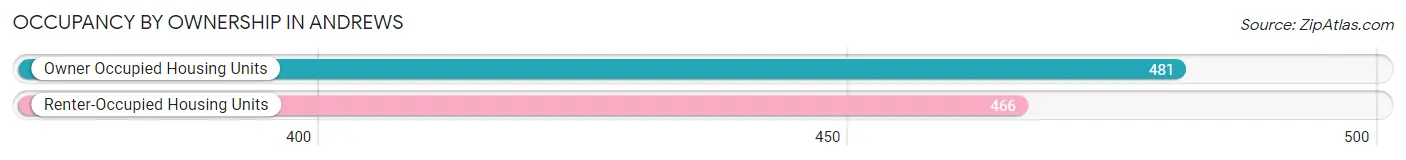
| Occupancy | # Housing Units | % Housing Units |
| Owner Occupied Housing Units | 481 | 50.8% |
| Renter-Occupied Housing Units | 466 | 49.2% |
| Total Occupied Housing Units | 947 | 100.0% |
Occupancy by Household Size in Andrews
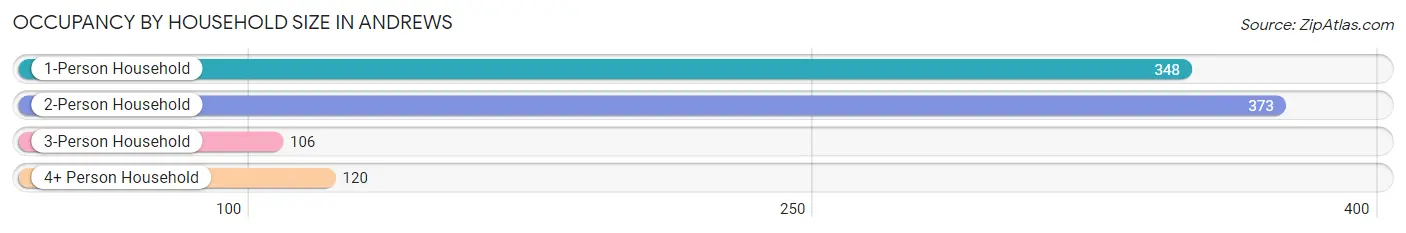
| Household Size | # Housing Units | % Housing Units |
| 1-Person Household | 348 | 36.7% |
| 2-Person Household | 373 | 39.4% |
| 3-Person Household | 106 | 11.2% |
| 4+ Person Household | 120 | 12.7% |
| Total Housing Units | 947 | 100.0% |
Occupancy by Ownership by Household Size in Andrews
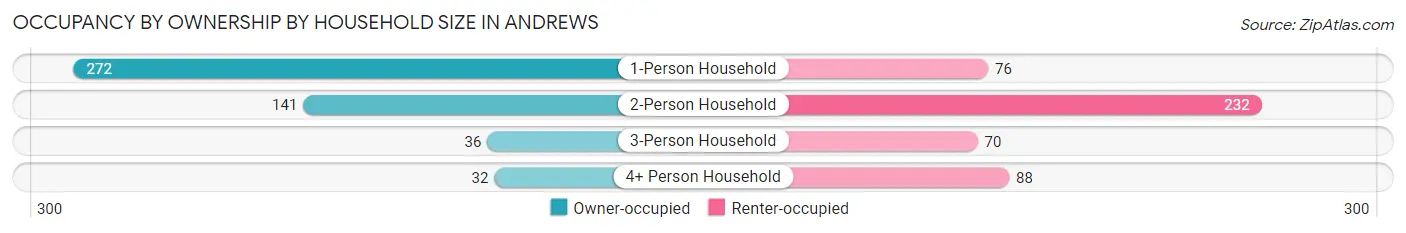
| Household Size | Owner-occupied | Renter-occupied |
| 1-Person Household | 272 (78.2%) | 76 (21.8%) |
| 2-Person Household | 141 (37.8%) | 232 (62.2%) |
| 3-Person Household | 36 (34.0%) | 70 (66.0%) |
| 4+ Person Household | 32 (26.7%) | 88 (73.3%) |
| Total Housing Units | 481 (50.8%) | 466 (49.2%) |
Occupancy by Educational Attainment in Andrews
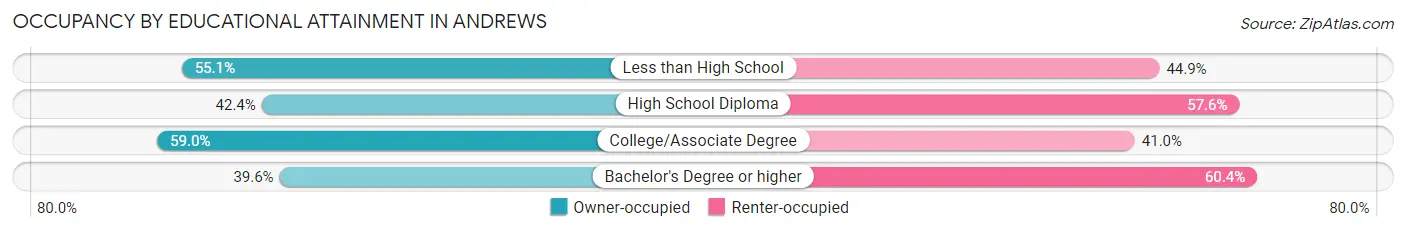
| Household Size | Owner-occupied | Renter-occupied |
| Less than High School | 76 (55.1%) | 62 (44.9%) |
| High School Diploma | 137 (42.4%) | 186 (57.6%) |
| College/Associate Degree | 230 (59.0%) | 160 (41.0%) |
| Bachelor's Degree or higher | 38 (39.6%) | 58 (60.4%) |
Occupancy by Age of Householder in Andrews
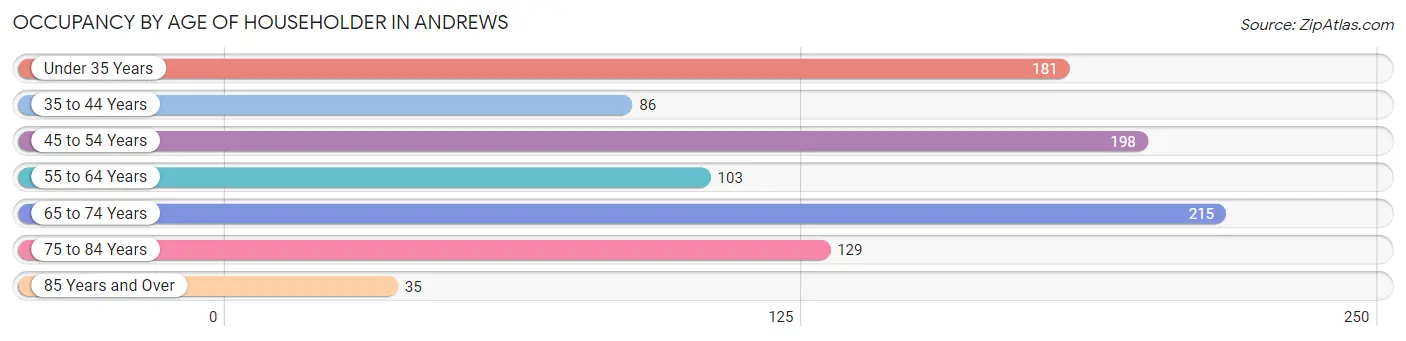
| Age Bracket | # Households | % Households |
| Under 35 Years | 181 | 19.1% |
| 35 to 44 Years | 86 | 9.1% |
| 45 to 54 Years | 198 | 20.9% |
| 55 to 64 Years | 103 | 10.9% |
| 65 to 74 Years | 215 | 22.7% |
| 75 to 84 Years | 129 | 13.6% |
| 85 Years and Over | 35 | 3.7% |
| Total | 947 | 100.0% |
Housing Finances in Andrews
Median Income by Occupancy in Andrews
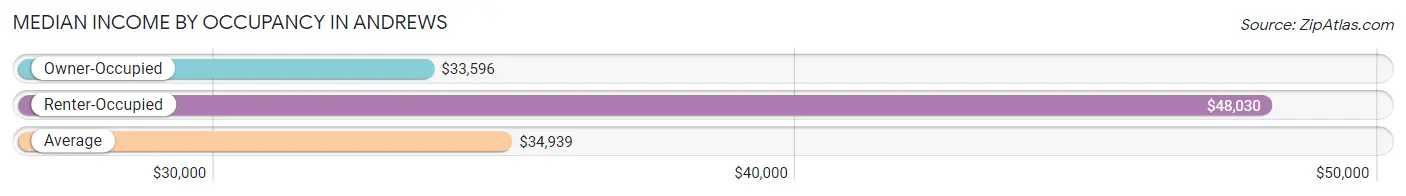
| Occupancy Type | # Households | Median Income |
| Owner-Occupied | 481 (50.8%) | $33,596 |
| Renter-Occupied | 466 (49.2%) | $48,030 |
| Average | 947 (100.0%) | $34,939 |
Occupancy by Householder Income Bracket in Andrews
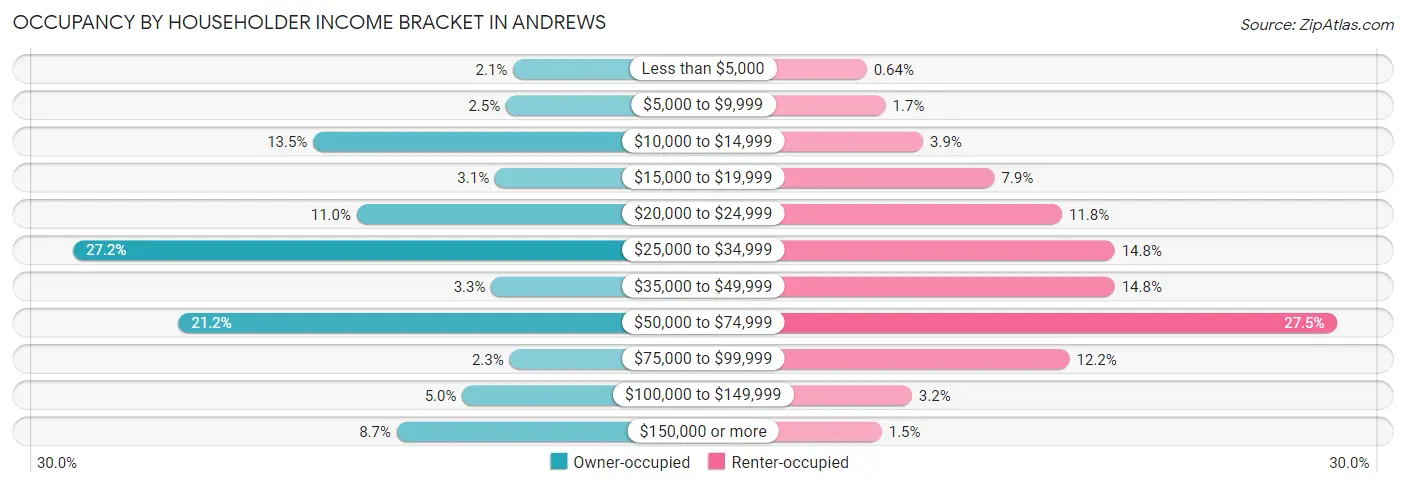
| Income Bracket | Owner-occupied | Renter-occupied |
| Less than $5,000 | 10 (2.1%) | 3 (0.6%) |
| $5,000 to $9,999 | 12 (2.5%) | 8 (1.7%) |
| $10,000 to $14,999 | 65 (13.5%) | 18 (3.9%) |
| $15,000 to $19,999 | 15 (3.1%) | 37 (7.9%) |
| $20,000 to $24,999 | 53 (11.0%) | 55 (11.8%) |
| $25,000 to $34,999 | 131 (27.2%) | 69 (14.8%) |
| $35,000 to $49,999 | 16 (3.3%) | 69 (14.8%) |
| $50,000 to $74,999 | 102 (21.2%) | 128 (27.5%) |
| $75,000 to $99,999 | 11 (2.3%) | 57 (12.2%) |
| $100,000 to $149,999 | 24 (5.0%) | 15 (3.2%) |
| $150,000 or more | 42 (8.7%) | 7 (1.5%) |
| Total | 481 (100.0%) | 466 (100.0%) |
Monthly Housing Cost Tiers in Andrews
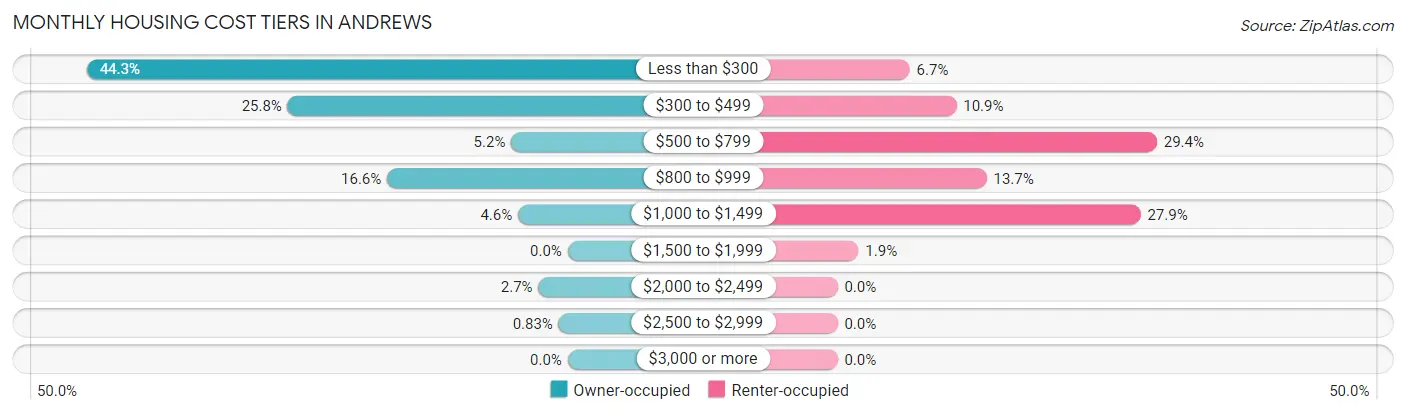
| Monthly Cost | Owner-occupied | Renter-occupied |
| Less than $300 | 213 (44.3%) | 31 (6.7%) |
| $300 to $499 | 124 (25.8%) | 51 (10.9%) |
| $500 to $799 | 25 (5.2%) | 137 (29.4%) |
| $800 to $999 | 80 (16.6%) | 64 (13.7%) |
| $1,000 to $1,499 | 22 (4.6%) | 130 (27.9%) |
| $1,500 to $1,999 | 0 (0.0%) | 9 (1.9%) |
| $2,000 to $2,499 | 13 (2.7%) | 0 (0.0%) |
| $2,500 to $2,999 | 4 (0.8%) | 0 (0.0%) |
| $3,000 or more | 0 (0.0%) | 0 (0.0%) |
| Total | 481 (100.0%) | 466 (100.0%) |
Physical Housing Characteristics in Andrews
Housing Structures in Andrews
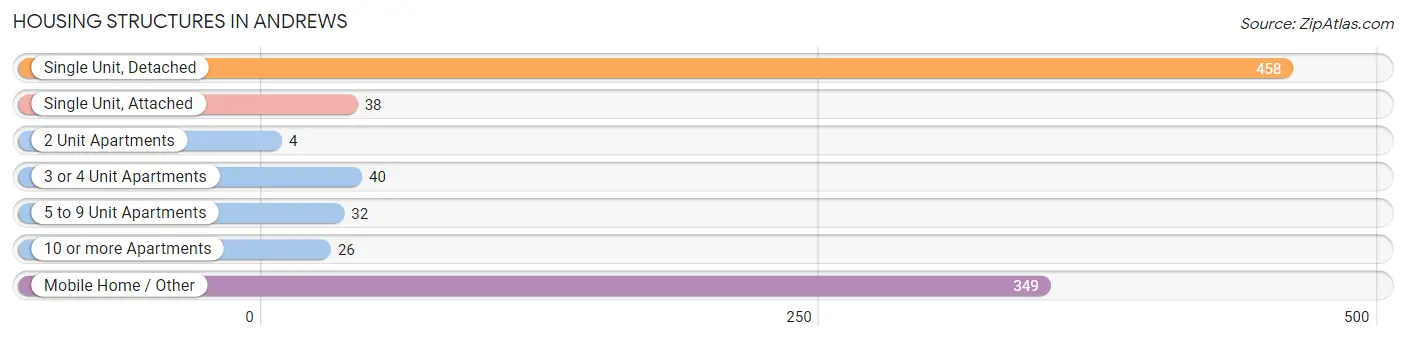
| Structure Type | # Housing Units | % Housing Units |
| Single Unit, Detached | 458 | 48.4% |
| Single Unit, Attached | 38 | 4.0% |
| 2 Unit Apartments | 4 | 0.4% |
| 3 or 4 Unit Apartments | 40 | 4.2% |
| 5 to 9 Unit Apartments | 32 | 3.4% |
| 10 or more Apartments | 26 | 2.8% |
| Mobile Home / Other | 349 | 36.8% |
| Total | 947 | 100.0% |
Housing Structures by Occupancy in Andrews
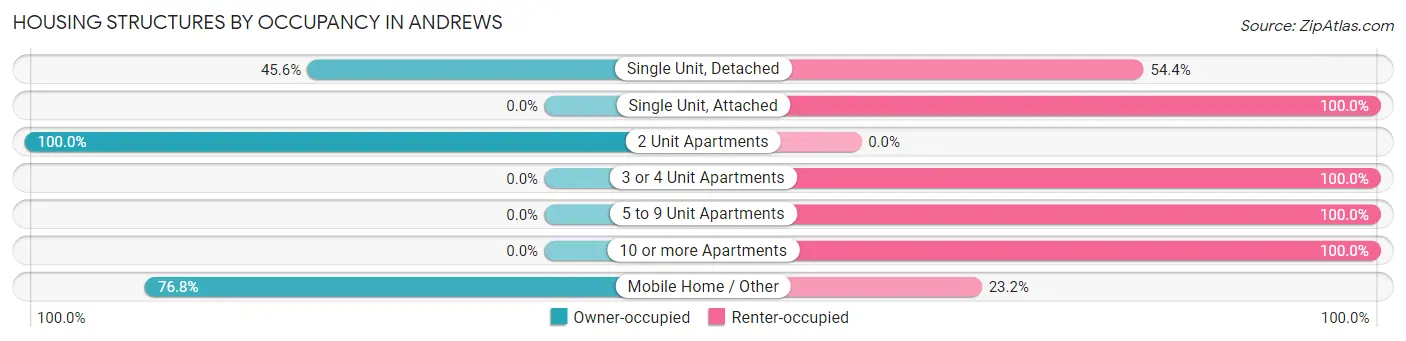
| Structure Type | Owner-occupied | Renter-occupied |
| Single Unit, Detached | 209 (45.6%) | 249 (54.4%) |
| Single Unit, Attached | 0 (0.0%) | 38 (100.0%) |
| 2 Unit Apartments | 4 (100.0%) | 0 (0.0%) |
| 3 or 4 Unit Apartments | 0 (0.0%) | 40 (100.0%) |
| 5 to 9 Unit Apartments | 0 (0.0%) | 32 (100.0%) |
| 10 or more Apartments | 0 (0.0%) | 26 (100.0%) |
| Mobile Home / Other | 268 (76.8%) | 81 (23.2%) |
| Total | 481 (50.8%) | 466 (49.2%) |
Housing Structures by Number of Rooms in Andrews
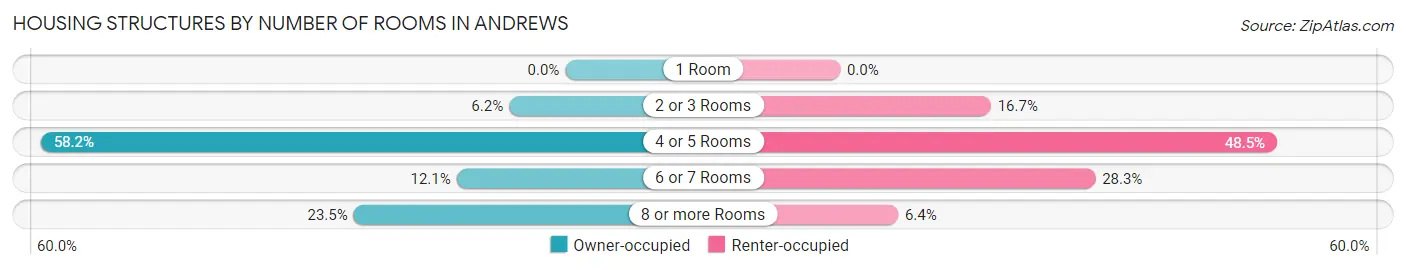
| Number of Rooms | Owner-occupied | Renter-occupied |
| 1 Room | 0 (0.0%) | 0 (0.0%) |
| 2 or 3 Rooms | 30 (6.2%) | 78 (16.7%) |
| 4 or 5 Rooms | 280 (58.2%) | 226 (48.5%) |
| 6 or 7 Rooms | 58 (12.1%) | 132 (28.3%) |
| 8 or more Rooms | 113 (23.5%) | 30 (6.4%) |
| Total | 481 (100.0%) | 466 (100.0%) |
Housing Structure by Heating Type in Andrews
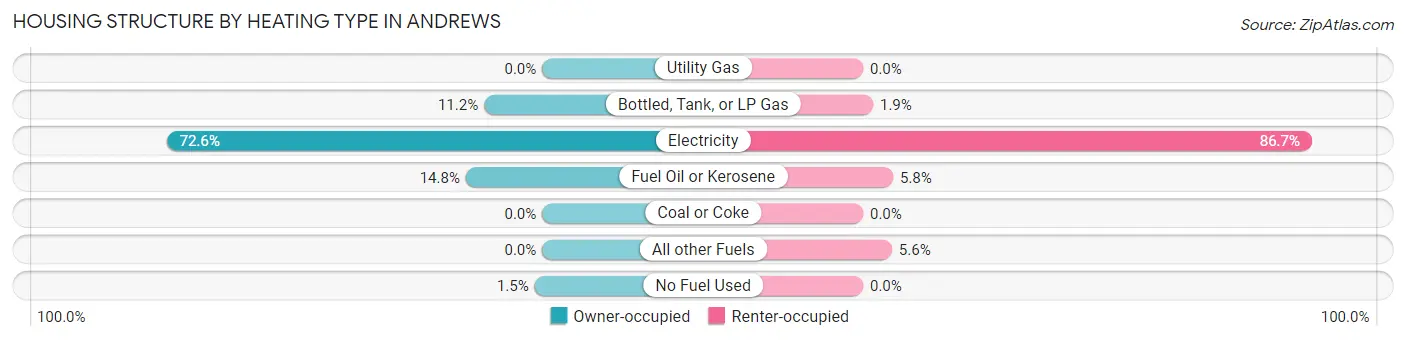
| Heating Type | Owner-occupied | Renter-occupied |
| Utility Gas | 0 (0.0%) | 0 (0.0%) |
| Bottled, Tank, or LP Gas | 54 (11.2%) | 9 (1.9%) |
| Electricity | 349 (72.6%) | 404 (86.7%) |
| Fuel Oil or Kerosene | 71 (14.8%) | 27 (5.8%) |
| Coal or Coke | 0 (0.0%) | 0 (0.0%) |
| All other Fuels | 0 (0.0%) | 26 (5.6%) |
| No Fuel Used | 7 (1.5%) | 0 (0.0%) |
| Total | 481 (100.0%) | 466 (100.0%) |
Household Vehicle Usage in Andrews
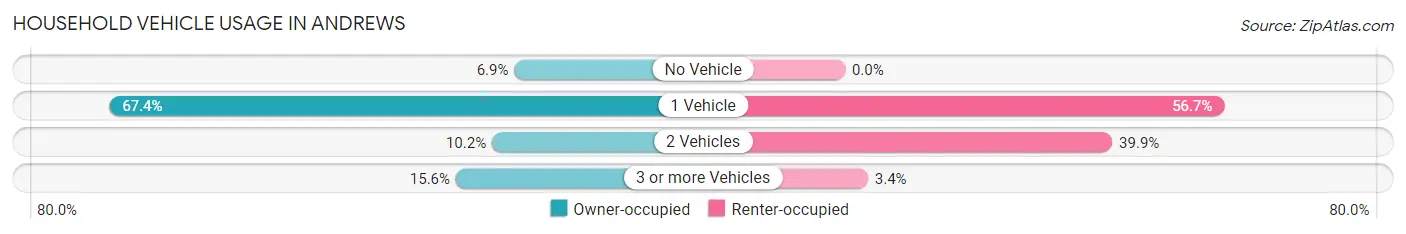
| Vehicles per Household | Owner-occupied | Renter-occupied |
| No Vehicle | 33 (6.9%) | 0 (0.0%) |
| 1 Vehicle | 324 (67.4%) | 264 (56.7%) |
| 2 Vehicles | 49 (10.2%) | 186 (39.9%) |
| 3 or more Vehicles | 75 (15.6%) | 16 (3.4%) |
| Total | 481 (100.0%) | 466 (100.0%) |
Real Estate & Mortgages in Andrews
Real Estate and Mortgage Overview in Andrews
| Characteristic | Without Mortgage | With Mortgage |
| Housing Units | 361 | 120 |
| Median Property Value | $92,000 | $162,500 |
| Median Household Income | $33,935 | $12 |
| Monthly Housing Costs | $288 | $0 |
| Real Estate Taxes | $649 | $0 |
Property Value by Mortgage Status in Andrews
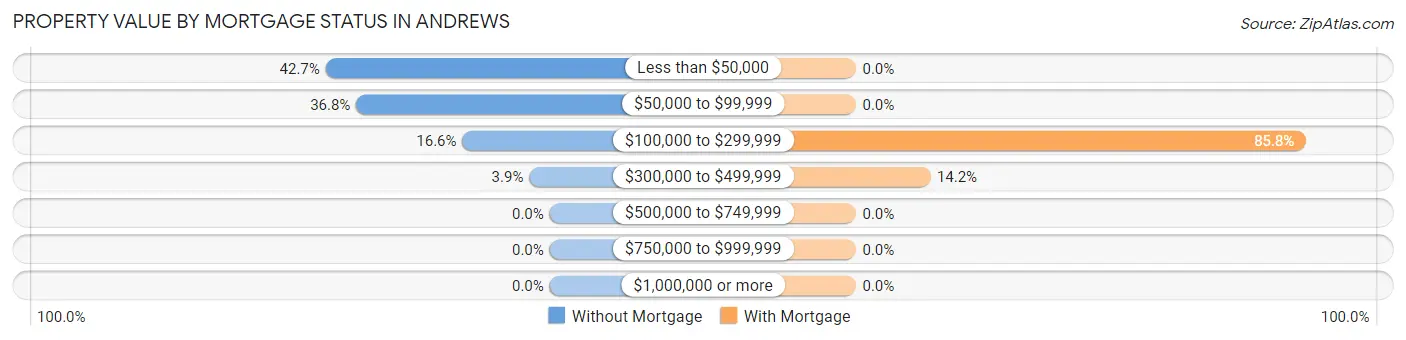
| Property Value | Without Mortgage | With Mortgage |
| Less than $50,000 | 154 (42.7%) | 0 (0.0%) |
| $50,000 to $99,999 | 133 (36.8%) | 0 (0.0%) |
| $100,000 to $299,999 | 60 (16.6%) | 103 (85.8%) |
| $300,000 to $499,999 | 14 (3.9%) | 17 (14.2%) |
| $500,000 to $749,999 | 0 (0.0%) | 0 (0.0%) |
| $750,000 to $999,999 | 0 (0.0%) | 0 (0.0%) |
| $1,000,000 or more | 0 (0.0%) | 0 (0.0%) |
| Total | 361 (100.0%) | 120 (100.0%) |
Household Income by Mortgage Status in Andrews
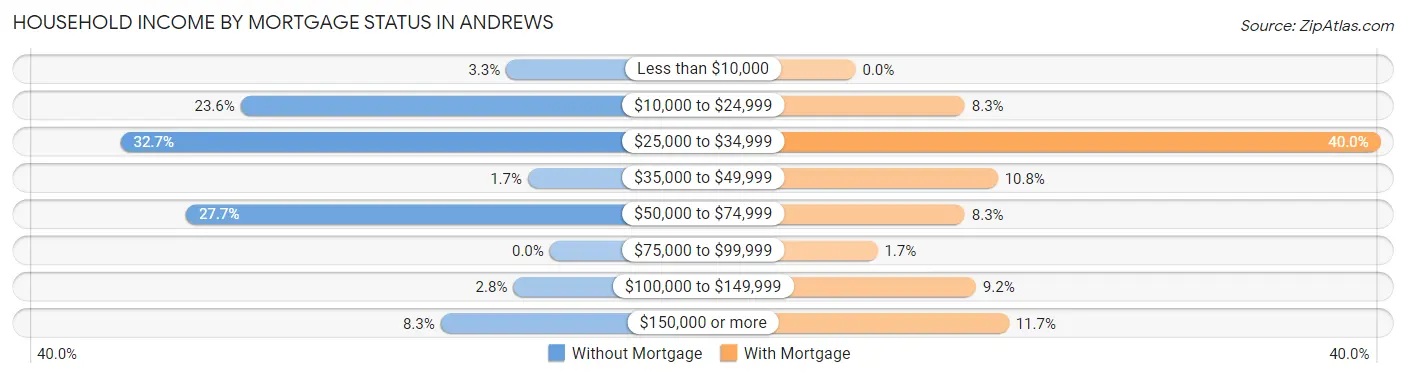
| Household Income | Without Mortgage | With Mortgage |
| Less than $10,000 | 12 (3.3%) | 0 (0.0%) |
| $10,000 to $24,999 | 85 (23.5%) | 10 (8.3%) |
| $25,000 to $34,999 | 118 (32.7%) | 48 (40.0%) |
| $35,000 to $49,999 | 6 (1.7%) | 13 (10.8%) |
| $50,000 to $74,999 | 100 (27.7%) | 10 (8.3%) |
| $75,000 to $99,999 | 0 (0.0%) | 2 (1.7%) |
| $100,000 to $149,999 | 10 (2.8%) | 11 (9.2%) |
| $150,000 or more | 30 (8.3%) | 14 (11.7%) |
| Total | 361 (100.0%) | 120 (100.0%) |
Property Value to Household Income Ratio in Andrews
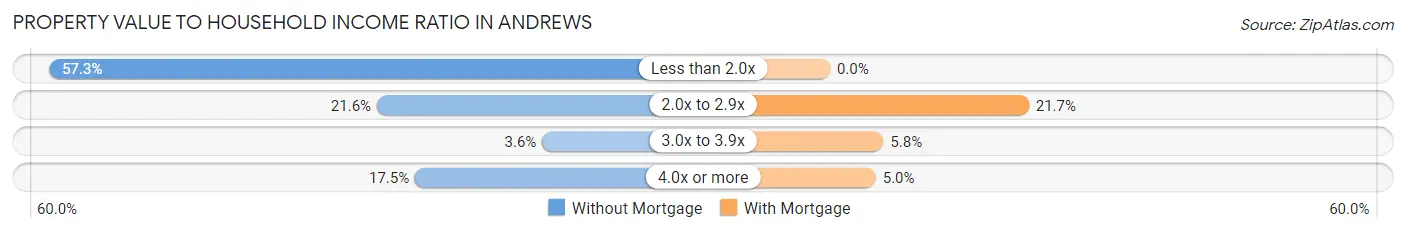
| Value-to-Income Ratio | Without Mortgage | With Mortgage |
| Less than 2.0x | 207 (57.3%) | 0 (0.0%) |
| 2.0x to 2.9x | 78 (21.6%) | 26 (21.7%) |
| 3.0x to 3.9x | 13 (3.6%) | 7 (5.8%) |
| 4.0x or more | 63 (17.4%) | 6 (5.0%) |
| Total | 361 (100.0%) | 120 (100.0%) |
Real Estate Taxes by Mortgage Status in Andrews
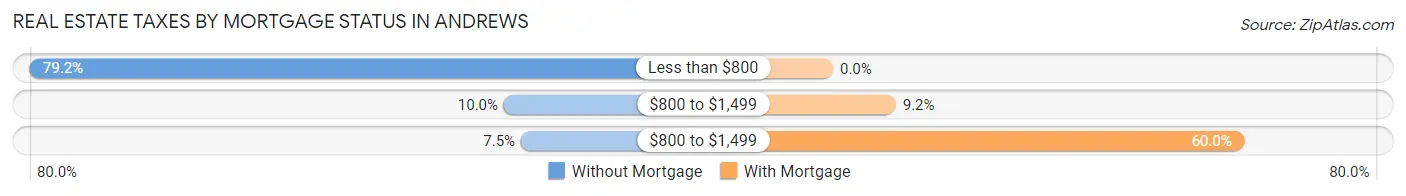
| Property Taxes | Without Mortgage | With Mortgage |
| Less than $800 | 286 (79.2%) | 0 (0.0%) |
| $800 to $1,499 | 36 (10.0%) | 11 (9.2%) |
| $800 to $1,499 | 27 (7.5%) | 72 (60.0%) |
| Total | 361 (100.0%) | 120 (100.0%) |
Health & Disability in Andrews
Health Insurance Coverage by Age in Andrews
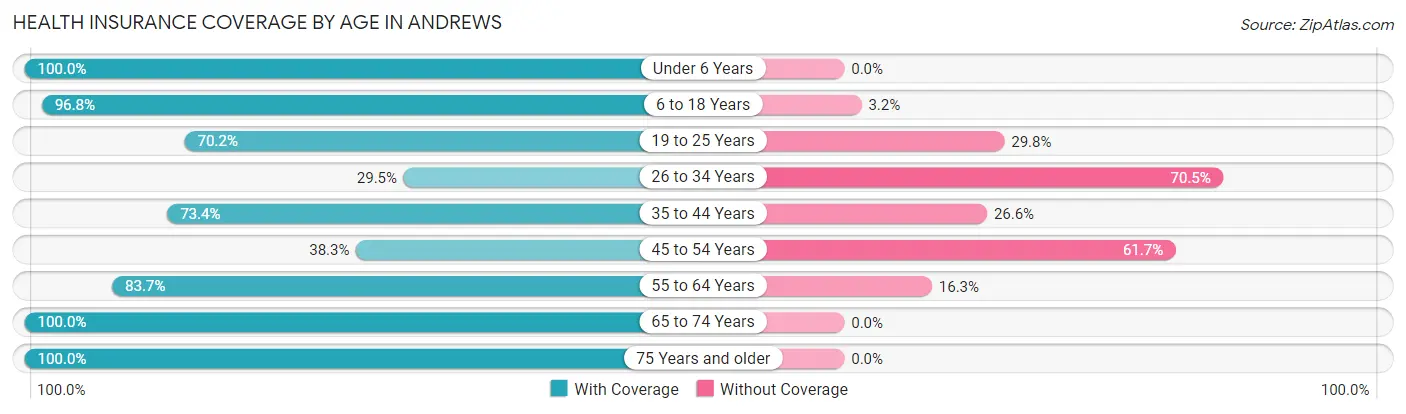
| Age Bracket | With Coverage | Without Coverage |
| Under 6 Years | 72 (100.0%) | 0 (0.0%) |
| 6 to 18 Years | 363 (96.8%) | 12 (3.2%) |
| 19 to 25 Years | 134 (70.2%) | 57 (29.8%) |
| 26 to 34 Years | 38 (29.5%) | 91 (70.5%) |
| 35 to 44 Years | 149 (73.4%) | 54 (26.6%) |
| 45 to 54 Years | 156 (38.3%) | 251 (61.7%) |
| 55 to 64 Years | 123 (83.7%) | 24 (16.3%) |
| 65 to 74 Years | 231 (100.0%) | 0 (0.0%) |
| 75 Years and older | 249 (100.0%) | 0 (0.0%) |
| Total | 1,515 (75.6%) | 489 (24.4%) |
Health Insurance Coverage by Citizenship Status in Andrews
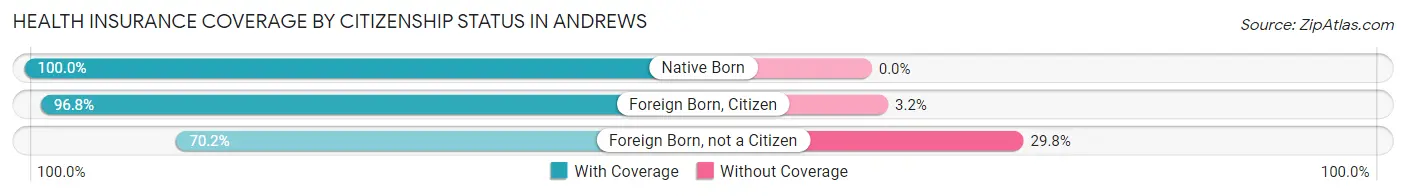
| Citizenship Status | With Coverage | Without Coverage |
| Native Born | 72 (100.0%) | 0 (0.0%) |
| Foreign Born, Citizen | 363 (96.8%) | 12 (3.2%) |
| Foreign Born, not a Citizen | 134 (70.2%) | 57 (29.8%) |
Health Insurance Coverage by Household Income in Andrews
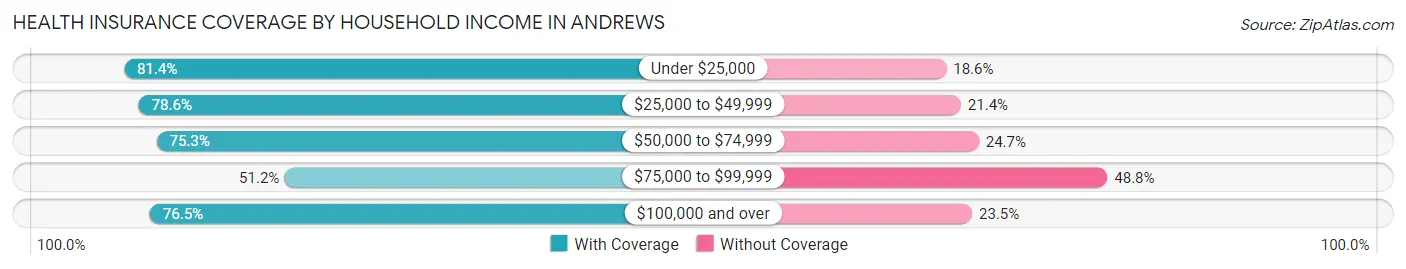
| Household Income | With Coverage | Without Coverage |
| Under $25,000 | 310 (81.4%) | 71 (18.6%) |
| $25,000 to $49,999 | 423 (78.6%) | 115 (21.4%) |
| $50,000 to $74,999 | 481 (75.3%) | 158 (24.7%) |
| $75,000 to $99,999 | 87 (51.2%) | 83 (48.8%) |
| $100,000 and over | 202 (76.5%) | 62 (23.5%) |
Public vs Private Health Insurance Coverage by Age in Andrews
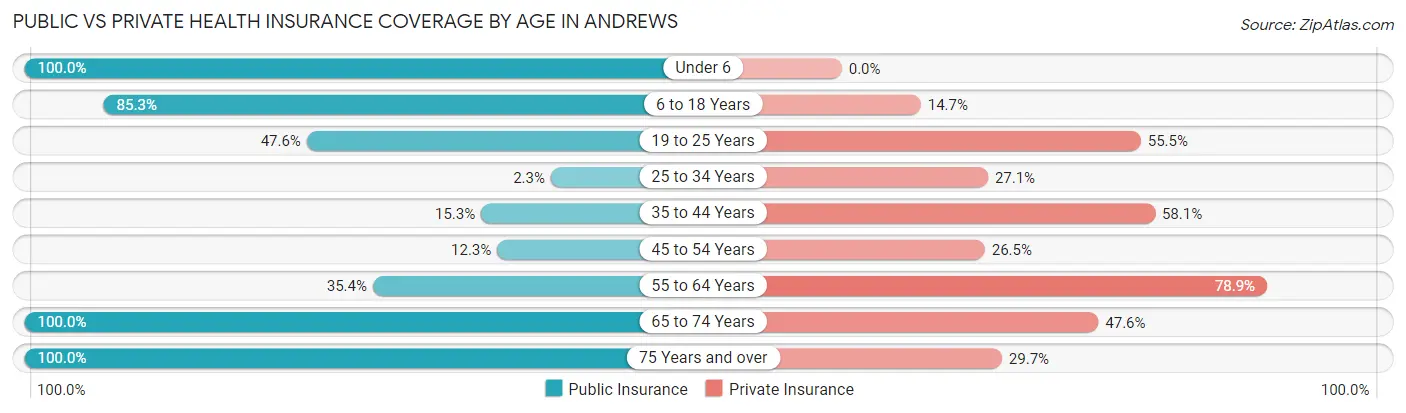
| Age Bracket | Public Insurance | Private Insurance |
| Under 6 | 72 (100.0%) | 0 (0.0%) |
| 6 to 18 Years | 320 (85.3%) | 55 (14.7%) |
| 19 to 25 Years | 91 (47.6%) | 106 (55.5%) |
| 25 to 34 Years | 3 (2.3%) | 35 (27.1%) |
| 35 to 44 Years | 31 (15.3%) | 118 (58.1%) |
| 45 to 54 Years | 50 (12.3%) | 108 (26.5%) |
| 55 to 64 Years | 52 (35.4%) | 116 (78.9%) |
| 65 to 74 Years | 231 (100.0%) | 110 (47.6%) |
| 75 Years and over | 249 (100.0%) | 74 (29.7%) |
| Total | 1,099 (54.8%) | 722 (36.0%) |
Disability Status by Sex by Age in Andrews
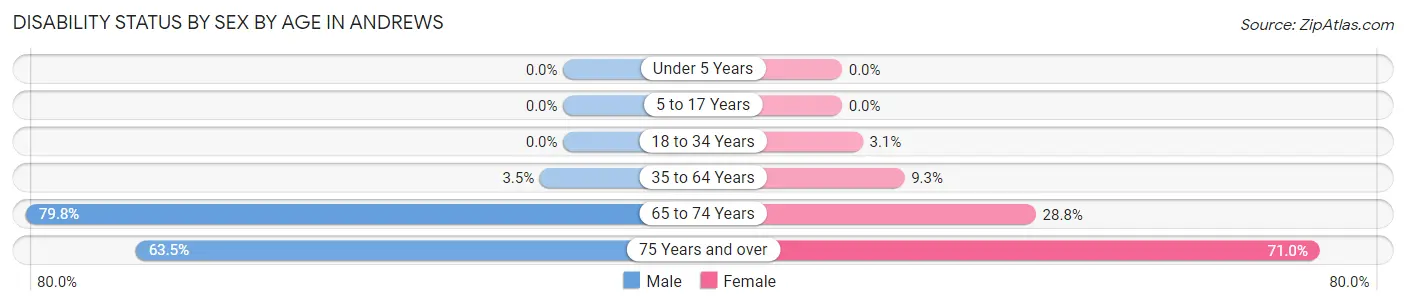
| Age Bracket | Male | Female |
| Under 5 Years | 0 (0.0%) | 0 (0.0%) |
| 5 to 17 Years | 0 (0.0%) | 0 (0.0%) |
| 18 to 34 Years | 0 (0.0%) | 4 (3.1%) |
| 35 to 64 Years | 12 (3.5%) | 38 (9.3%) |
| 65 to 74 Years | 79 (79.8%) | 38 (28.8%) |
| 75 Years and over | 40 (63.5%) | 132 (71.0%) |
Disability Class by Sex by Age in Andrews
Disability Class: Hearing Difficulty
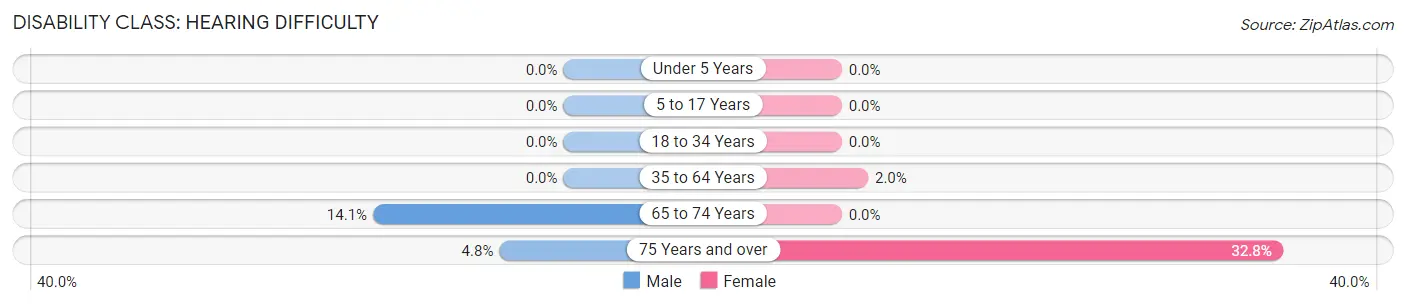
| Age Bracket | Male | Female |
| Under 5 Years | 0 (0.0%) | 0 (0.0%) |
| 5 to 17 Years | 0 (0.0%) | 0 (0.0%) |
| 18 to 34 Years | 0 (0.0%) | 0 (0.0%) |
| 35 to 64 Years | 0 (0.0%) | 8 (1.9%) |
| 65 to 74 Years | 14 (14.1%) | 0 (0.0%) |
| 75 Years and over | 3 (4.8%) | 61 (32.8%) |
Disability Class: Vision Difficulty
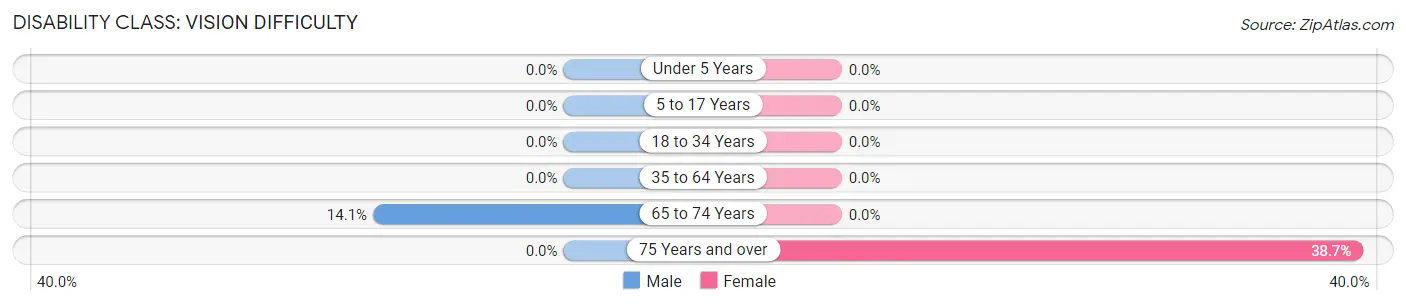
| Age Bracket | Male | Female |
| Under 5 Years | 0 (0.0%) | 0 (0.0%) |
| 5 to 17 Years | 0 (0.0%) | 0 (0.0%) |
| 18 to 34 Years | 0 (0.0%) | 0 (0.0%) |
| 35 to 64 Years | 0 (0.0%) | 0 (0.0%) |
| 65 to 74 Years | 14 (14.1%) | 0 (0.0%) |
| 75 Years and over | 0 (0.0%) | 72 (38.7%) |
Disability Class: Cognitive Difficulty
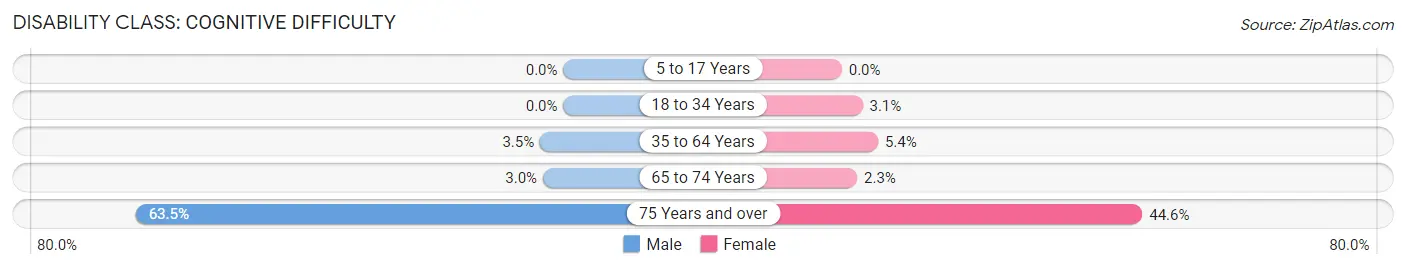
| Age Bracket | Male | Female |
| 5 to 17 Years | 0 (0.0%) | 0 (0.0%) |
| 18 to 34 Years | 0 (0.0%) | 4 (3.1%) |
| 35 to 64 Years | 12 (3.5%) | 22 (5.4%) |
| 65 to 74 Years | 3 (3.0%) | 3 (2.3%) |
| 75 Years and over | 40 (63.5%) | 83 (44.6%) |
Disability Class: Ambulatory Difficulty
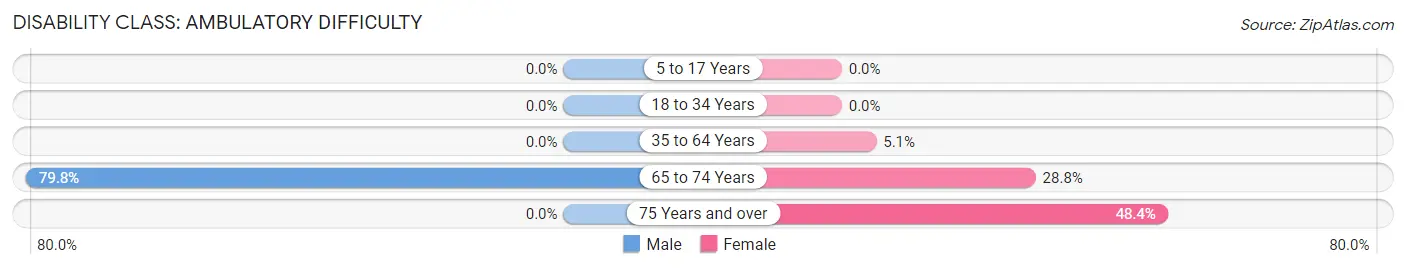
| Age Bracket | Male | Female |
| 5 to 17 Years | 0 (0.0%) | 0 (0.0%) |
| 18 to 34 Years | 0 (0.0%) | 0 (0.0%) |
| 35 to 64 Years | 0 (0.0%) | 21 (5.1%) |
| 65 to 74 Years | 79 (79.8%) | 38 (28.8%) |
| 75 Years and over | 0 (0.0%) | 90 (48.4%) |
Disability Class: Self-Care Difficulty
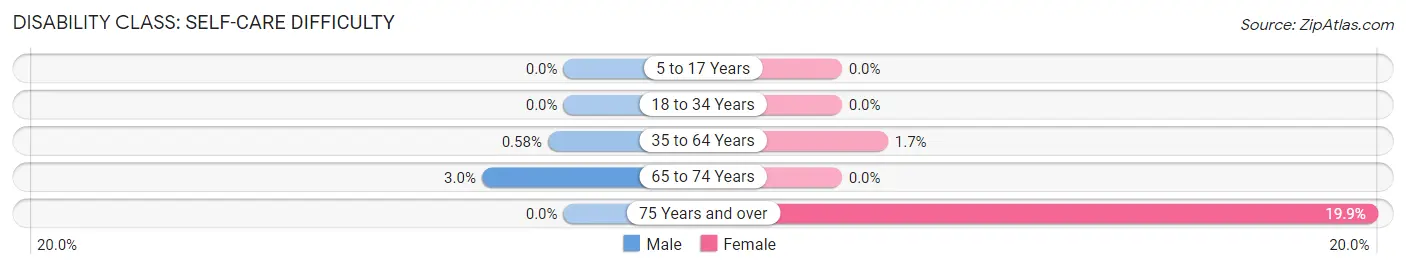
| Age Bracket | Male | Female |
| 5 to 17 Years | 0 (0.0%) | 0 (0.0%) |
| 18 to 34 Years | 0 (0.0%) | 0 (0.0%) |
| 35 to 64 Years | 2 (0.6%) | 7 (1.7%) |
| 65 to 74 Years | 3 (3.0%) | 0 (0.0%) |
| 75 Years and over | 0 (0.0%) | 37 (19.9%) |
Technology Access in Andrews
Computing Device Access in Andrews
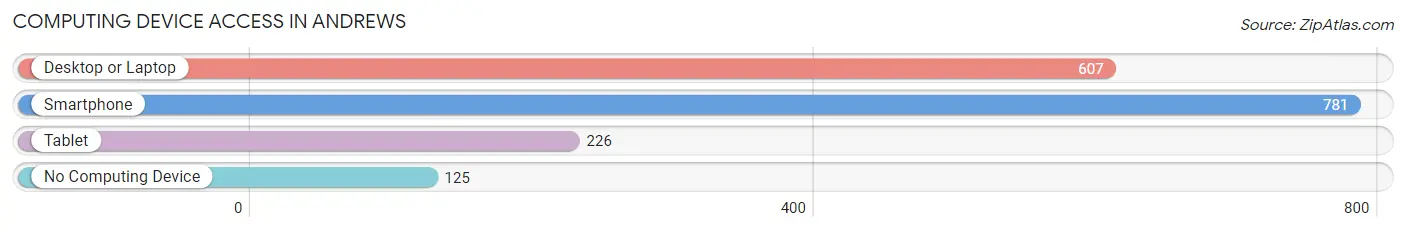
| Device Type | # Households | % Households |
| Desktop or Laptop | 607 | 64.1% |
| Smartphone | 781 | 82.5% |
| Tablet | 226 | 23.9% |
| No Computing Device | 125 | 13.2% |
| Total | 947 | 100.0% |
Internet Access in Andrews
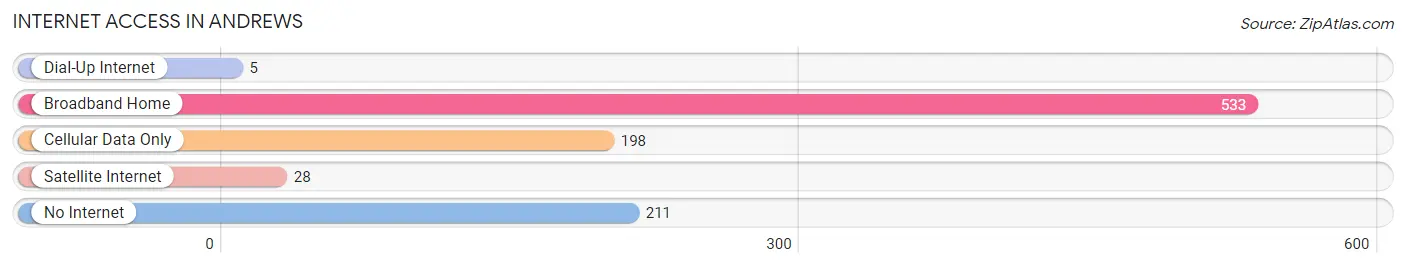
| Internet Type | # Households | % Households |
| Dial-Up Internet | 5 | 0.5% |
| Broadband Home | 533 | 56.3% |
| Cellular Data Only | 198 | 20.9% |
| Satellite Internet | 28 | 3.0% |
| No Internet | 211 | 22.3% |
| Total | 947 | 100.0% |
Andrews Summary
Andrews is a town located in Cherokee County, North Carolina, United States. It is situated in the foothills of the Great Smoky Mountains, and is the county seat of Cherokee County. The population was 1,781 at the 2010 census.
History
The area that is now Andrews was originally inhabited by the Cherokee Indians. The town was founded in 1868 and named after Colonel William Andrews, a prominent local landowner. The town was incorporated in 1891.
In the late 19th century, Andrews was a major center for the logging industry. The town was also home to several sawmills and a large furniture factory.
Geography
Andrews is located in the foothills of the Great Smoky Mountains, at the confluence of the Hiwassee and Valley rivers. The town is situated at an elevation of 1,890 feet (576 m).
The town is located at the intersection of U.S. Route 19 and North Carolina Highway 19. It is approximately 30 miles (48 km) west of Murphy, North Carolina, and 60 miles (97 km) east of Chattanooga, Tennessee.
Economy
The economy of Andrews is largely based on tourism and agriculture. The town is home to several tourist attractions, including the Andrews Geyser, a natural hot spring, and the Andrews Railroad Museum.
The town is also home to several farms, including a large dairy farm. The town is also home to several manufacturing companies, including a furniture factory and a woodworking plant.
Demographics
As of the 2010 census, there were 1,781 people, 745 households, and 463 families residing in the town. The population density was 1,092.3 people per square mile (422.2/km2). There were 845 housing units at an average density of 522.3 per square mile (201.6/km2). The racial makeup of the town was 95.2% White, 0.7% African American, 0.7% Native American, 0.3% Asian, 0.1% Pacific Islander, 1.7% from other races, and 1.3% from two or more races. Hispanic or Latino of any race were 3.2% of the population.
There were 745 households, out of which 24.3% had children under the age of 18 living with them, 44.2% were married couples living together, 13.2% had a female householder with no husband present, and 37.2% were non-families. 32.2% of all households were made up of individuals, and 15.2% had someone living alone who was 65 years of age or older. The average household size was 2.25 and the average family size was 2.83.
In the town, the population was spread out, with 21.2% under the age of 18, 8.2% from 18 to 24, 24.3% from 25 to 44, 25.2% from 45 to 64, and 21.1% who were 65 years of age or older. The median age was 41 years. For every 100 females, there were 87.2 males. For every 100 females age 18 and over, there were 83.2 males.
The median income for a household in the town was $25,938, and the median income for a family was $31,250. Males had a median income of $25,000 versus $20,000 for females. The per capita income for the town was $14,945. About 15.2% of families and 19.2% of the population were below the poverty line, including 25.2% of those under age 18 and 16.2% of those age 65 or over.
Common Questions
What is Per Capita Income in Andrews?
Per Capita income in Andrews is $23,353.
What is the Median Family Income in Andrews?
Median Family Income in Andrews is $37,216.
What is the Median Household income in Andrews?
Median Household Income in Andrews is $34,939.
What is Income or Wage Gap in Andrews?
Income or Wage Gap in Andrews is 33.4%.
Women in Andrews earn 66.6 cents for every dollar earned by a man.
What is Inequality or Gini Index in Andrews?
Inequality or Gini Index in Andrews is 0.41.
What is the Total Population of Andrews?
Total Population of Andrews is 2,086.
What is the Total Male Population of Andrews?
Total Male Population of Andrews is 942.
What is the Total Female Population of Andrews?
Total Female Population of Andrews is 1,144.
What is the Ratio of Males per 100 Females in Andrews?
There are 82.34 Males per 100 Females in Andrews.
What is the Ratio of Females per 100 Males in Andrews?
There are 121.44 Females per 100 Males in Andrews.
What is the Median Population Age in Andrews?
Median Population Age in Andrews is 46.0 Years.
What is the Average Family Size in Andrews
Average Family Size in Andrews is 2.8 People.
What is the Average Household Size in Andrews
Average Household Size in Andrews is 2.1 People.
How Large is the Labor Force in Andrews?
There are 984 People in the Labor Forcein in Andrews.
What is the Percentage of People in the Labor Force in Andrews?
58.8% of People are in the Labor Force in Andrews.
What is the Unemployment Rate in Andrews?
Unemployment Rate in Andrews is 12.9%.