Zip Codes with the Highest Percentage of Population Employed in Agriculture, Fishing & Hunting in Springfield, MO
RELATED REPORTS & OPTIONS
Agriculture, Fishing & Hunting
Springfield
Compare Zip Codes
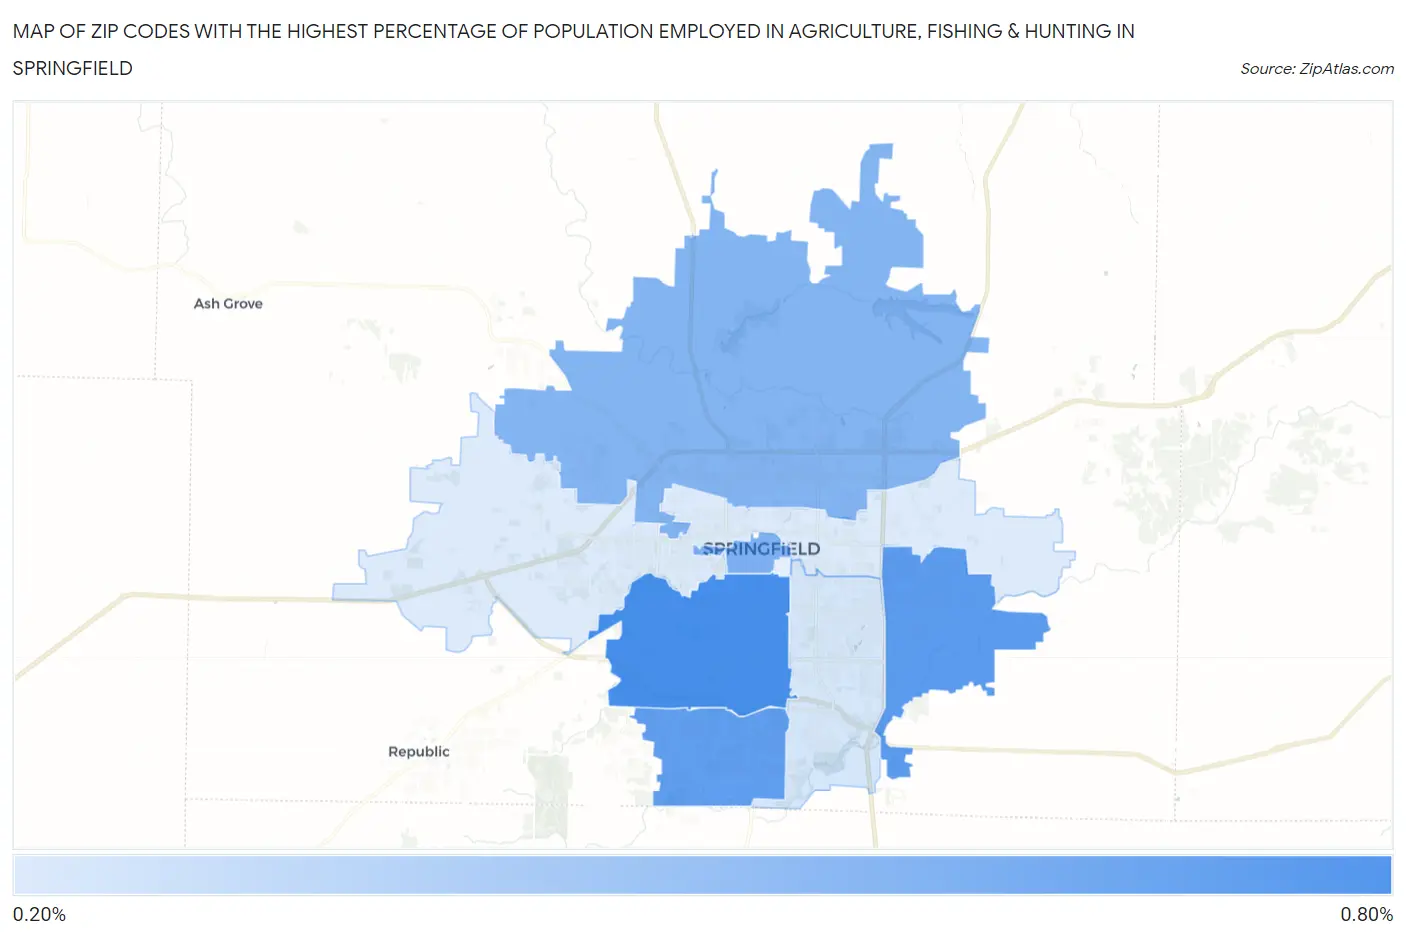
Map of Zip Codes with the Highest Percentage of Population Employed in Agriculture, Fishing & Hunting in Springfield
0.27%
0.60%
Zip Codes with the Highest Percentage of Population Employed in Agriculture, Fishing & Hunting in Springfield, MO
| Zip Code | % Employed | vs State | vs National | |
| 1. | 65807 | 0.60% | 1.4%(-0.843)#683 | 1.2%(-0.599)#18,485 |
| 2. | 65809 | 0.56% | 1.4%(-0.883)#688 | 1.2%(-0.639)#18,767 |
| 3. | 65810 | 0.54% | 1.4%(-0.902)#694 | 1.2%(-0.657)#18,915 |
| 4. | 65806 | 0.48% | 1.4%(-0.966)#710 | 1.2%(-0.722)#19,468 |
| 5. | 65803 | 0.47% | 1.4%(-0.974)#712 | 1.2%(-0.730)#19,540 |
| 6. | 65804 | 0.28% | 1.4%(-1.16)#769 | 1.2%(-0.917)#21,379 |
| 7. | 65802 | 0.27% | 1.4%(-1.18)#770 | 1.2%(-0.931)#21,560 |
1
Common Questions
What are the Top 5 Zip Codes with the Highest Percentage of Population Employed in Agriculture, Fishing & Hunting in Springfield, MO?
Top 5 Zip Codes with the Highest Percentage of Population Employed in Agriculture, Fishing & Hunting in Springfield, MO are:
What zip code has the Highest Percentage of Population Employed in Agriculture, Fishing & Hunting in Springfield, MO?
65807 has the Highest Percentage of Population Employed in Agriculture, Fishing & Hunting in Springfield, MO with 0.60%.
What is the Percentage of Population Employed in Agriculture, Fishing & Hunting in Springfield, MO?
Percentage of Population Employed in Agriculture, Fishing & Hunting in Springfield is 0.39%.
What is the Percentage of Population Employed in Agriculture, Fishing & Hunting in Missouri?
Percentage of Population Employed in Agriculture, Fishing & Hunting in Missouri is 1.4%.
What is the Percentage of Population Employed in Agriculture, Fishing & Hunting in the United States?
Percentage of Population Employed in Agriculture, Fishing & Hunting in the United States is 1.2%.