Zip Codes with the Highest Percentage of Population Employed in Installation, Maintenance & Repair in Jefferson City, MO
RELATED REPORTS & OPTIONS
Installation, Maintenance & Repair
Jefferson City
Compare Zip Codes
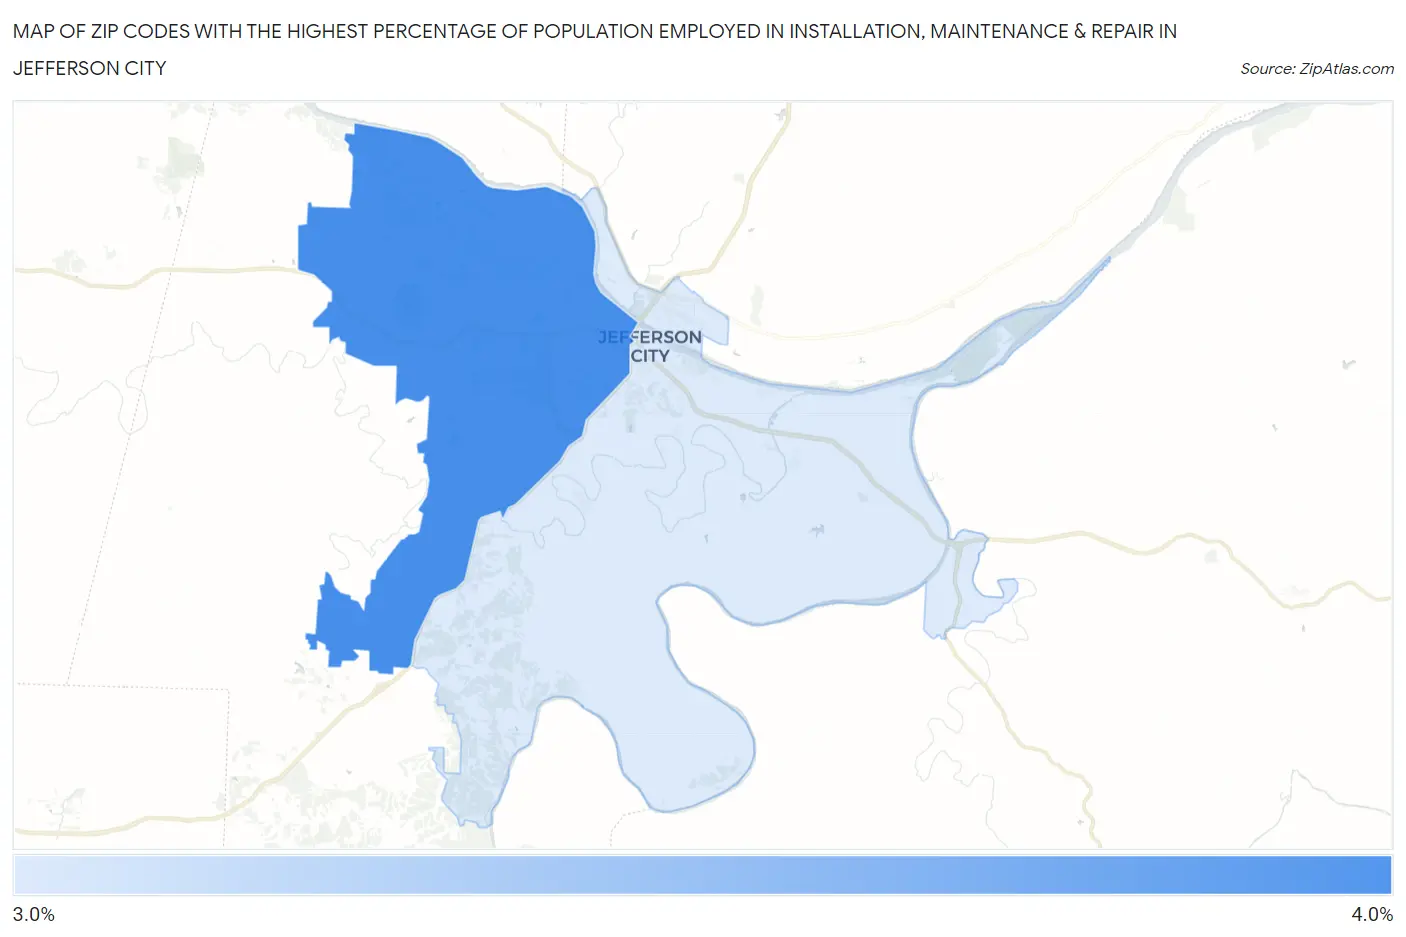
Map of Zip Codes with the Highest Percentage of Population Employed in Installation, Maintenance & Repair in Jefferson City
3.2%
3.3%
Zip Codes with the Highest Percentage of Population Employed in Installation, Maintenance & Repair in Jefferson City, MO
| Zip Code | % Employed | vs State | vs National | |
| 1. | 65109 | 3.3% | 3.2%(+0.114)#495 | 3.1%(+0.250)#15,466 |
| 2. | 65101 | 3.2% | 3.2%(-0.010)#527 | 3.1%(+0.126)#16,061 |
1
Common Questions
What are the Top Zip Codes with the Highest Percentage of Population Employed in Installation, Maintenance & Repair in Jefferson City, MO?
Top Zip Codes with the Highest Percentage of Population Employed in Installation, Maintenance & Repair in Jefferson City, MO are:
What zip code has the Highest Percentage of Population Employed in Installation, Maintenance & Repair in Jefferson City, MO?
65109 has the Highest Percentage of Population Employed in Installation, Maintenance & Repair in Jefferson City, MO with 3.3%.
What is the Percentage of Population Employed in Installation, Maintenance & Repair in Jefferson City, MO?
Percentage of Population Employed in Installation, Maintenance & Repair in Jefferson City is 2.9%.
What is the Percentage of Population Employed in Installation, Maintenance & Repair in Missouri?
Percentage of Population Employed in Installation, Maintenance & Repair in Missouri is 3.2%.
What is the Percentage of Population Employed in Installation, Maintenance & Repair in the United States?
Percentage of Population Employed in Installation, Maintenance & Repair in the United States is 3.1%.