Zip Codes with the Highest Percentage of Population Employed in Legal Services & Support in Jefferson City, MO
RELATED REPORTS & OPTIONS
Legal Services & Support
Jefferson City
Compare Zip Codes
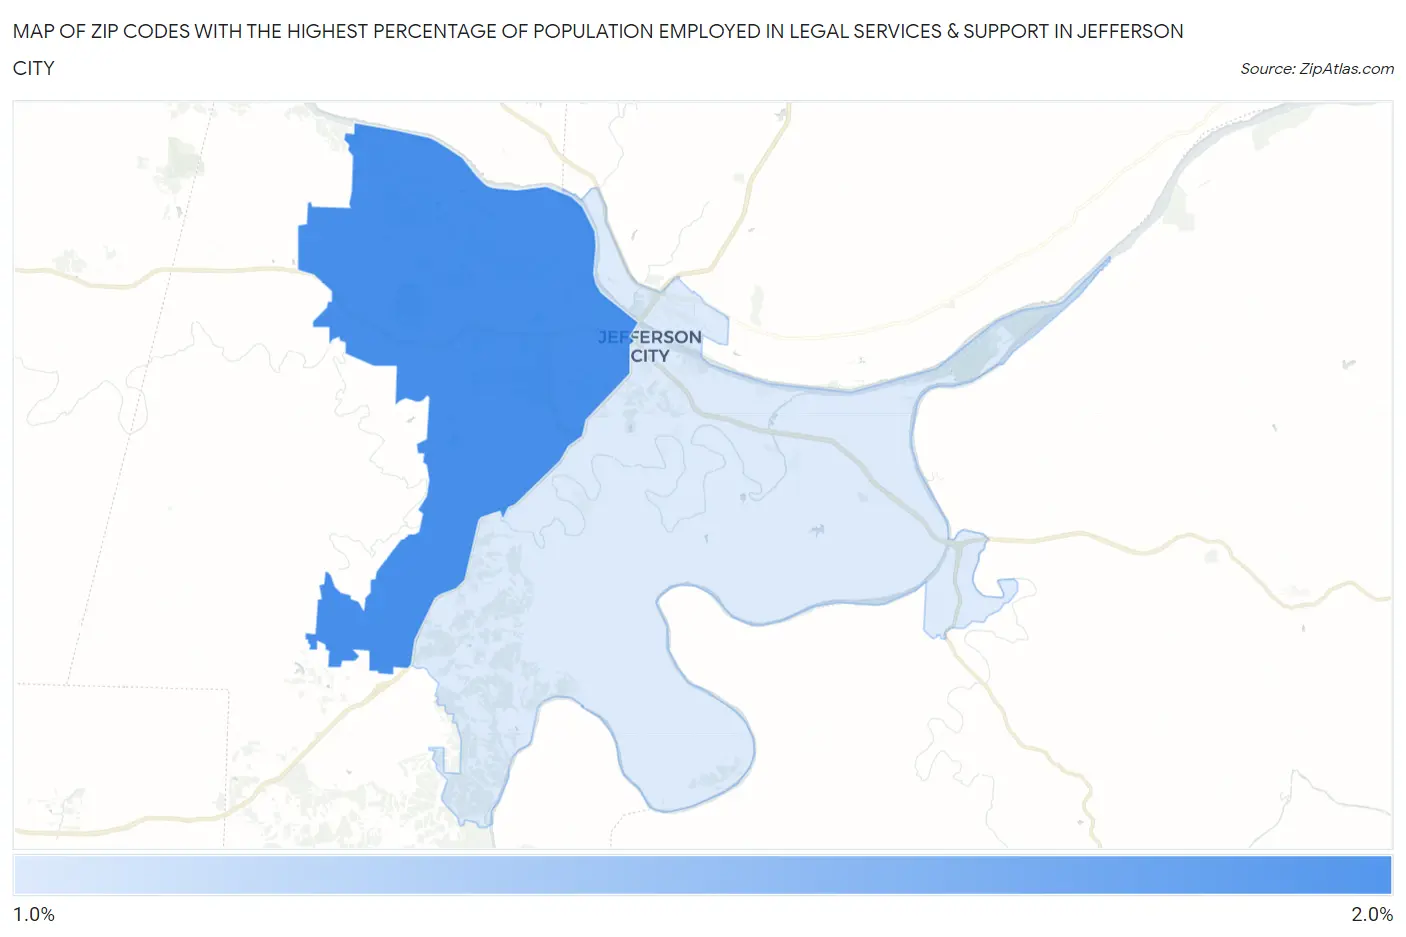
Map of Zip Codes with the Highest Percentage of Population Employed in Legal Services & Support in Jefferson City
1.0%
1.9%
Zip Codes with the Highest Percentage of Population Employed in Legal Services & Support in Jefferson City, MO
| Zip Code | % Employed | vs State | vs National | |
| 1. | 65109 | 1.9% | 0.99%(+0.901)#72 | 1.2%(+0.707)#3,751 |
| 2. | 65101 | 1.0% | 0.99%(+0.058)#158 | 1.2%(-0.136)#7,502 |
1
Common Questions
What are the Top Zip Codes with the Highest Percentage of Population Employed in Legal Services & Support in Jefferson City, MO?
Top Zip Codes with the Highest Percentage of Population Employed in Legal Services & Support in Jefferson City, MO are:
What zip code has the Highest Percentage of Population Employed in Legal Services & Support in Jefferson City, MO?
65109 has the Highest Percentage of Population Employed in Legal Services & Support in Jefferson City, MO with 1.9%.
What is the Percentage of Population Employed in Legal Services & Support in Jefferson City, MO?
Percentage of Population Employed in Legal Services & Support in Jefferson City is 1.7%.
What is the Percentage of Population Employed in Legal Services & Support in Missouri?
Percentage of Population Employed in Legal Services & Support in Missouri is 0.99%.
What is the Percentage of Population Employed in Legal Services & Support in the United States?
Percentage of Population Employed in Legal Services & Support in the United States is 1.2%.