Zip Codes with the Highest Percentage of Population Employed in Real Estate, Rental & Leasing in Jefferson City, MO
RELATED REPORTS & OPTIONS
Real Estate, Rental & Leasing
Jefferson City
Compare Zip Codes
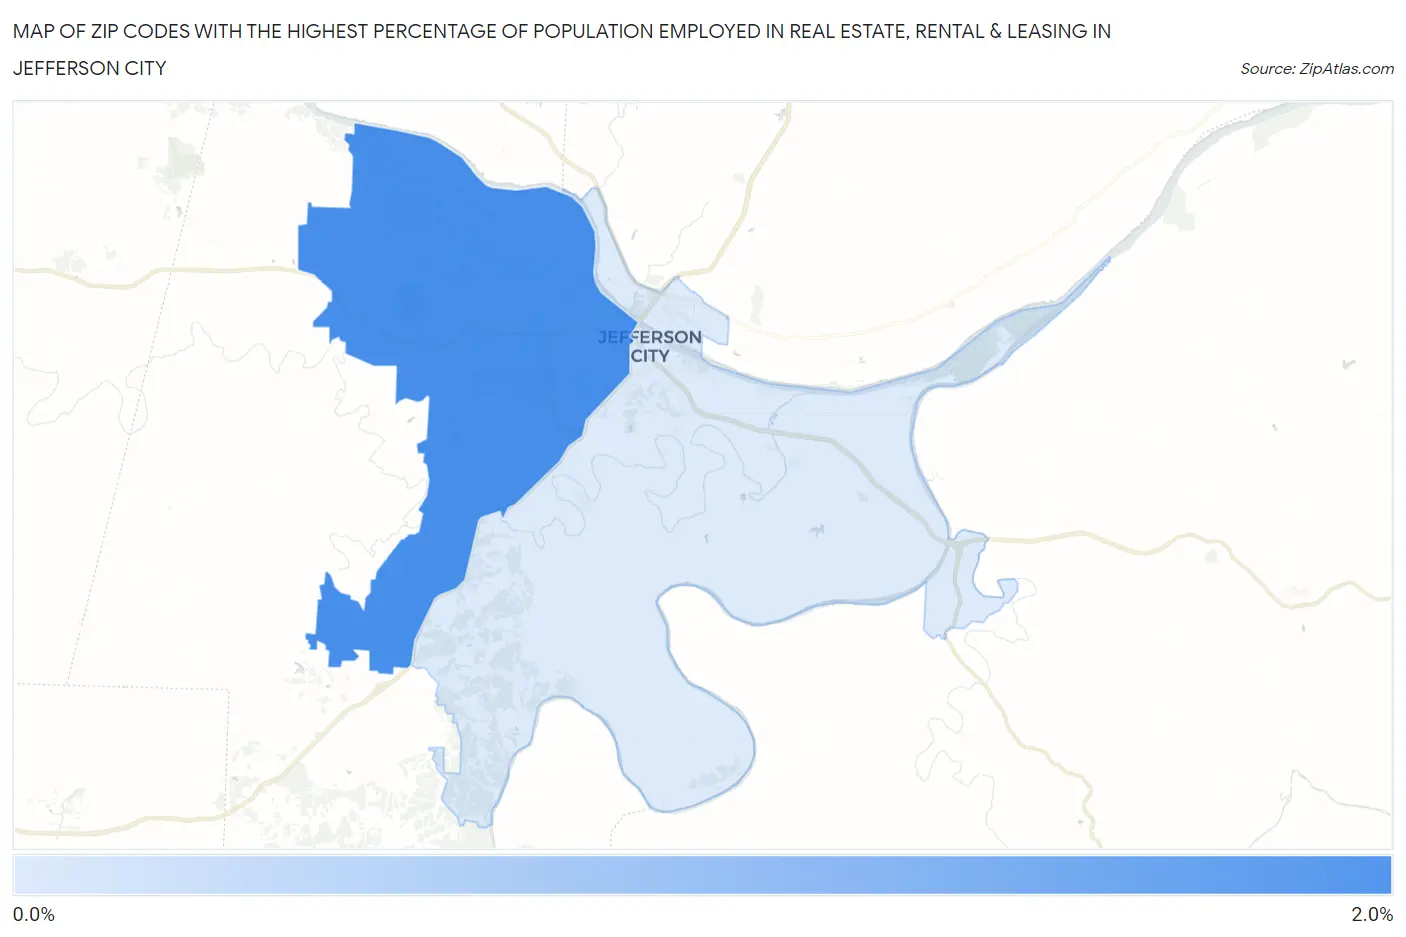
Map of Zip Codes with the Highest Percentage of Population Employed in Real Estate, Rental & Leasing in Jefferson City
0.55%
1.6%
Zip Codes with the Highest Percentage of Population Employed in Real Estate, Rental & Leasing in Jefferson City, MO
| Zip Code | % Employed | vs State | vs National | |
| 1. | 65109 | 1.6% | 1.6%(-0.061)#243 | 1.9%(-0.322)#10,639 |
| 2. | 65101 | 0.55% | 1.6%(-1.08)#464 | 1.9%(-1.34)#18,692 |
1
Common Questions
What are the Top Zip Codes with the Highest Percentage of Population Employed in Real Estate, Rental & Leasing in Jefferson City, MO?
Top Zip Codes with the Highest Percentage of Population Employed in Real Estate, Rental & Leasing in Jefferson City, MO are:
What zip code has the Highest Percentage of Population Employed in Real Estate, Rental & Leasing in Jefferson City, MO?
65109 has the Highest Percentage of Population Employed in Real Estate, Rental & Leasing in Jefferson City, MO with 1.6%.
What is the Percentage of Population Employed in Real Estate, Rental & Leasing in Jefferson City, MO?
Percentage of Population Employed in Real Estate, Rental & Leasing in Jefferson City is 0.81%.
What is the Percentage of Population Employed in Real Estate, Rental & Leasing in Missouri?
Percentage of Population Employed in Real Estate, Rental & Leasing in Missouri is 1.6%.
What is the Percentage of Population Employed in Real Estate, Rental & Leasing in the United States?
Percentage of Population Employed in Real Estate, Rental & Leasing in the United States is 1.9%.