Zip Codes with the Highest Percentage of Population Employed in Agriculture, Fishing & Hunting in Independence, MO
RELATED REPORTS & OPTIONS
Agriculture, Fishing & Hunting
Independence
Compare Zip Codes
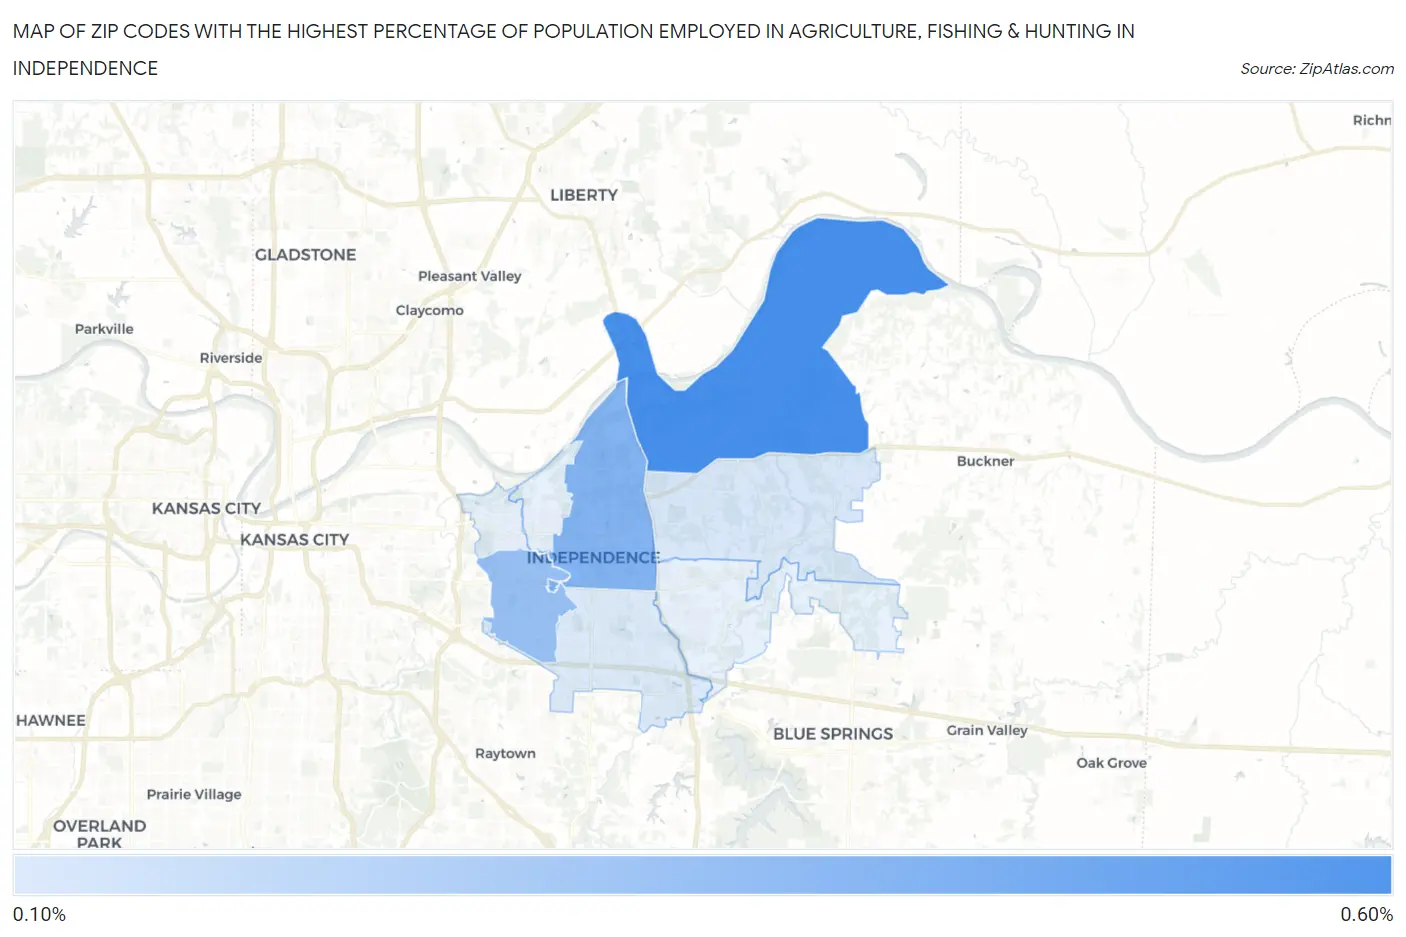
Map of Zip Codes with the Highest Percentage of Population Employed in Agriculture, Fishing & Hunting in Independence
0.0%
0.60%
Zip Codes with the Highest Percentage of Population Employed in Agriculture, Fishing & Hunting in Independence, MO
| Zip Code | % Employed | vs State | vs National | |
| 1. | 64058 | 0.55% | 1.4%(-0.896)#692 | 1.2%(-0.651)#18,866 |
| 2. | 64050 | 0.39% | 1.4%(-1.05)#731 | 1.2%(-0.808)#20,235 |
| 3. | 64052 | 0.34% | 1.4%(-1.10)#753 | 1.2%(-0.860)#20,760 |
| 4. | 64056 | 0.17% | 1.4%(-1.28)#789 | 1.2%(-1.03)#22,789 |
| 5. | 64055 | 0.16% | 1.4%(-1.29)#793 | 1.2%(-1.04)#22,923 |
1
Common Questions
What are the Top 5 Zip Codes with the Highest Percentage of Population Employed in Agriculture, Fishing & Hunting in Independence, MO?
Top 5 Zip Codes with the Highest Percentage of Population Employed in Agriculture, Fishing & Hunting in Independence, MO are:
What zip code has the Highest Percentage of Population Employed in Agriculture, Fishing & Hunting in Independence, MO?
64058 has the Highest Percentage of Population Employed in Agriculture, Fishing & Hunting in Independence, MO with 0.55%.
What is the Percentage of Population Employed in Agriculture, Fishing & Hunting in Independence, MO?
Percentage of Population Employed in Agriculture, Fishing & Hunting in Independence is 0.22%.
What is the Percentage of Population Employed in Agriculture, Fishing & Hunting in Missouri?
Percentage of Population Employed in Agriculture, Fishing & Hunting in Missouri is 1.4%.
What is the Percentage of Population Employed in Agriculture, Fishing & Hunting in the United States?
Percentage of Population Employed in Agriculture, Fishing & Hunting in the United States is 1.2%.