Zip Codes with the Highest Percentage of Population Employed in Arts, Entertainment & Recreation in Minneapolis, MN

RELATED REPORTS & OPTIONS

Arts, Entertainment & Recreation
Population
Families and Households
Female Fertility
Female Fertility (Unmarried)
Race (Community Size)
Race (Percentage)
Ancestry (Community Size)
AfghanAfricanAlaska NativeAlbanianAlsatianAmericanApacheArabArgentineanArmenianAssyrian / Chaldean / SyriacAustralianAustrianBahamianBangladeshiBarbadianBasqueBelgianBelizeanBhutaneseBlackfeetBolivianBrazilianBritishBritish West IndianBulgarianBurmeseCajunCambodianCanadianCape VerdeanCarpatho RusynCelticCentral AmericanCentral American IndianCherokeeCheyenneChickasawChileanChippewaChoctawColombianComancheCosta RicanCreeCreekCroatianCrowCubanCypriotCzechCzechoslovakianDanishDominicanDutchEastern EuropeanEcuadorianEgyptianEnglishEstonianEthiopianEuropeanFijianFilipinoFinnishFrenchFrench American IndianFrench CanadianGermanGerman RussianGhanaianGreekGuamanian / ChamorroGuatemalanGuyaneseHaitianHonduranHungarianIcelanderIndian (Asian)IndonesianInupiatIranianIraqiIrishIroquoisIsraeliItalianJamaicanJapaneseJordanianKenyanKoreanLaotianLatvianLebaneseLiberianLithuanianLuxembourgerMacedonianMalaysianMalteseMenomineeMexicanMexican American IndianMongolianMoroccanNative HawaiianNavajoNicaraguanNigerianNorthern EuropeanNorwegianOkinawanOsagePakistaniPalestinianPanamanianParaguayanPennsylvania GermanPeruvianPolishPortuguesePotawatomiPuerto RicanRomanianRussianSalvadoranSamoanScandinavianScotch-IrishScottishSenegaleseSerbianSierra LeoneanSiouxSlavicSlovakSloveneSomaliSouth AfricanSouth AmericanSouth American IndianSoviet UnionSpaniardSpanishSri LankanSubsaharan AfricanSudaneseSwedishSwissSyrianThaiTonganTrinidadian and TobagonianTurkishUgandanUkrainianUruguayanVenezuelanVietnameseWelshWest IndianYugoslavian
Ancestry (Percentage)
AfghanAfricanAlaska NativeAlbanianAlsatianAmericanApacheArabArgentineanArmenianAssyrian / Chaldean / SyriacAustralianAustrianBahamianBangladeshiBarbadianBasqueBelgianBelizeanBhutaneseBlackfeetBolivianBrazilianBritishBritish West IndianBulgarianBurmeseCajunCambodianCanadianCape VerdeanCarpatho RusynCelticCentral AmericanCentral American IndianCherokeeCheyenneChickasawChileanChippewaChoctawColombianComancheCosta RicanCreeCreekCroatianCrowCubanCypriotCzechCzechoslovakianDanishDominicanDutchEastern EuropeanEcuadorianEgyptianEnglishEstonianEthiopianEuropeanFijianFilipinoFinnishFrenchFrench American IndianFrench CanadianGermanGerman RussianGhanaianGreekGuamanian / ChamorroGuatemalanGuyaneseHaitianHonduranHungarianIcelanderIndian (Asian)IndonesianInupiatIranianIraqiIrishIroquoisIsraeliItalianJamaicanJapaneseJordanianKenyanKoreanLaotianLatvianLebaneseLiberianLithuanianLuxembourgerMacedonianMalaysianMalteseMenomineeMexicanMexican American IndianMongolianMoroccanNative HawaiianNavajoNicaraguanNigerianNorthern EuropeanNorwegianOkinawanOsagePakistaniPalestinianPanamanianParaguayanPennsylvania GermanPeruvianPolishPortuguesePotawatomiPuerto RicanRomanianRussianSalvadoranSamoanScandinavianScotch-IrishScottishSenegaleseSerbianSierra LeoneanSiouxSlavicSlovakSloveneSomaliSouth AfricanSouth AmericanSouth American IndianSoviet UnionSpaniardSpanishSri LankanSubsaharan AfricanSudaneseSwedishSwissSyrianThaiTonganTrinidadian and TobagonianTurkishUgandanUkrainianUruguayanVenezuelanVietnameseWelshWest IndianYugoslavian
Immigrant Origin (Total)
AfghanistanAfricaAlbaniaArgentinaAsiaAustraliaAustriaBahamasBangladeshBarbadosBelarusBelgiumBelizeBoliviaBosnia and HerzegovinaBrazilBulgariaBurma / MyanmarCabo VerdeCambodiaCameroonCanadaCaribbeanCentral AmericaChileChinaColombiaCongoCosta RicaCroatiaCubaCzechoslovakiaDenmarkDominican RepublicEastern AfricaEastern AsiaEastern EuropeEcuadorEgyptEl SalvadorEnglandEritreaEthiopiaEuropeFranceGermanyGhanaGreeceGuatemalaGuyanaHaitiHondurasHong KongHungaryIndiaIndonesiaIranIraqIrelandIsraelItalyJamaicaJapanJordanKazakhstanKenyaKoreaKuwaitLaosLatin AmericaLatviaLebanonLiberiaLithuaniaMalaysiaMexicoMicronesiaMiddle AfricaMoldovaMoroccoNepalNetherlandsNicaraguaNigeriaNorthern AfricaNorthern EuropeNorwayOceaniaPakistanPanamaPeruPhilippinesPolandRomaniaRussiaSaudi ArabiaScotlandSenegalSerbiaSierra LeoneSingaporeSomaliaSouth AfricaSouth AmericaSouth Central AsiaSouth Eastern AsiaSouthern EuropeSpainSri LankaSudanSwedenSwitzerlandSyriaTaiwanThailandTrinidad and TobagoTurkeyUgandaUkraineUruguayUzbekistanVenezuelaVietnamWestern AfricaWestern AsiaWestern EuropeYemenZaireZimbabwe
Immigrant Origin (Percentage)
AfghanistanAfricaAlbaniaArgentinaAsiaAustraliaAustriaBahamasBangladeshBarbadosBelarusBelgiumBelizeBoliviaBosnia and HerzegovinaBrazilBulgariaBurma / MyanmarCabo VerdeCambodiaCameroonCanadaCaribbeanCentral AmericaChileChinaColombiaCongoCosta RicaCroatiaCubaCzechoslovakiaDenmarkDominican RepublicEastern AfricaEastern AsiaEastern EuropeEcuadorEgyptEl SalvadorEnglandEritreaEthiopiaEuropeFranceGermanyGhanaGreeceGuatemalaGuyanaHaitiHondurasHong KongHungaryIndiaIndonesiaIranIraqIrelandIsraelItalyJamaicaJapanJordanKazakhstanKenyaKoreaKuwaitLaosLatin AmericaLatviaLebanonLiberiaLithuaniaMalaysiaMexicoMicronesiaMiddle AfricaMoldovaMoroccoNepalNetherlandsNicaraguaNigeriaNorthern AfricaNorthern EuropeNorwayOceaniaPakistanPanamaPeruPhilippinesPolandRomaniaRussiaSaudi ArabiaScotlandSenegalSerbiaSierra LeoneSingaporeSomaliaSouth AfricaSouth AmericaSouth Central AsiaSouth Eastern AsiaSouthern EuropeSpainSri LankaSudanSwedenSwitzerlandSyriaTaiwanThailandTrinidad and TobagoTurkeyUgandaUkraineUruguayUzbekistanVenezuelaVietnamWestern AfricaWestern AsiaWestern EuropeYemenZaireZimbabwe
Income
Income (Families)
Income (Households)
Poverty
Poverty (Families)
Unemployment
Employment Occupations
Employment Industries
Employer Class
Commute Time
Commute Means
School Enrollment
Education by Degree Field
Occupancy
Finances
Physical Characteristics
Minneapolis
Compare Zip Codes
Comparison Subject

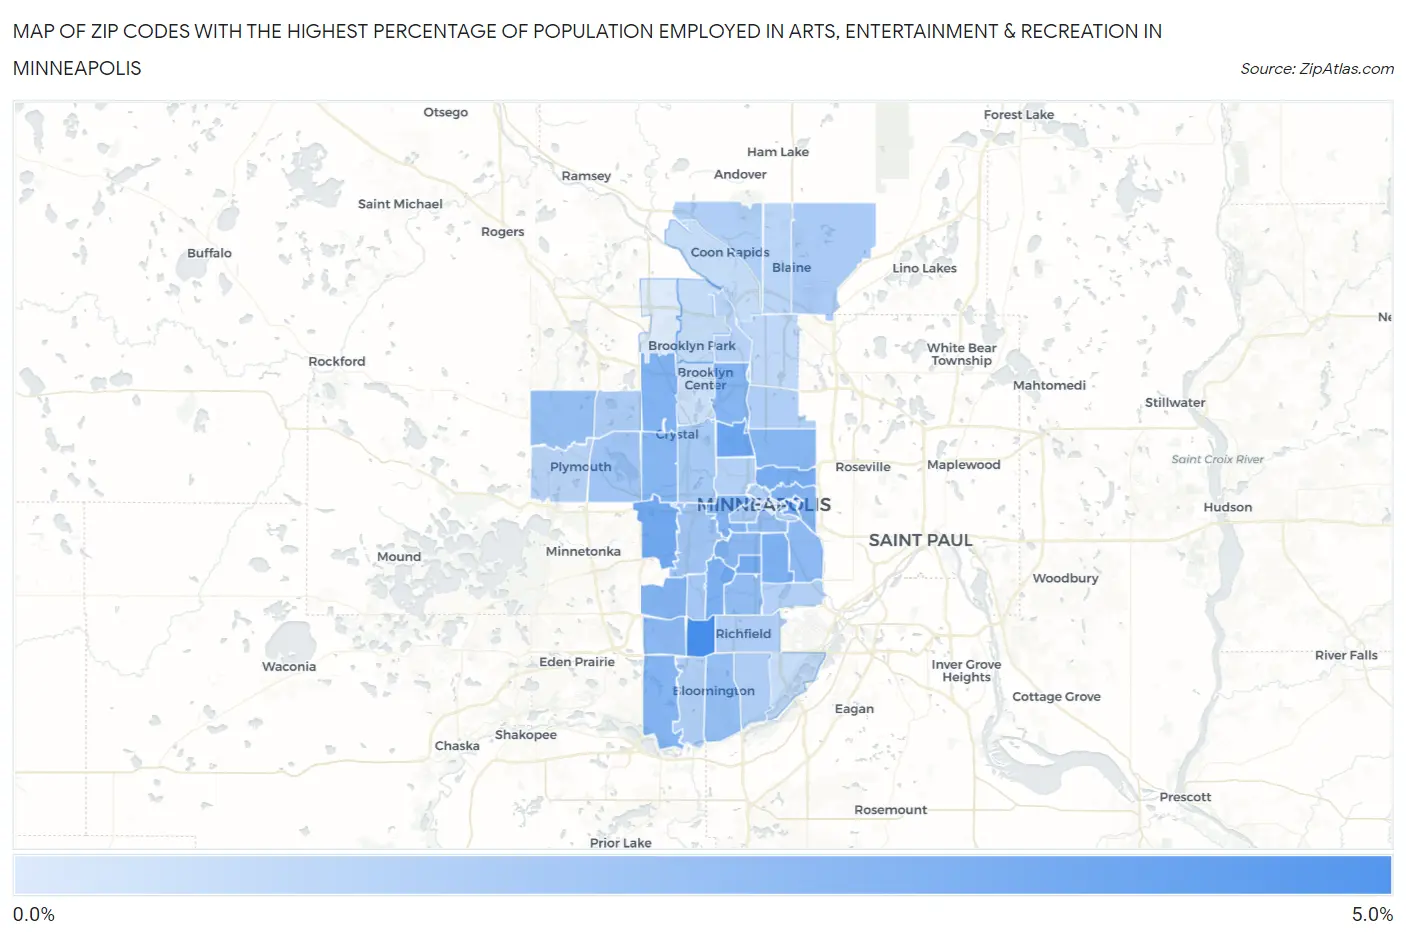
Map of Zip Codes with the Highest Percentage of Population Employed in Arts, Entertainment & Recreation in Minneapolis

0.0%
5.0%
Zip Codes with the Highest Percentage of Population Employed in Arts, Entertainment & Recreation in Minneapolis Map

Zip Codes with the Highest Percentage of Population Employed in Arts, Entertainment & Recreation in Minneapolis, MN

Zip Code % Employed vs State vs National
1.554354.6%1.9%(+2.70)#572.1%(+2.53)#2,618
2.554123.6%1.9%(+1.65)#872.1%(+1.48)#4,012
3.554553.5%1.9%(+1.57)#912.1%(+1.41)#4,154
4.554263.4%1.9%(+1.45)#1052.1%(+1.28)#4,433
5.554093.3%1.9%(+1.40)#1072.1%(+1.23)#4,549
6.554133.3%1.9%(+1.36)#1092.1%(+1.19)#4,628
7.554103.1%1.9%(+1.21)#1262.1%(+1.04)#5,009
8.554073.1%1.9%(+1.16)#1292.1%(+0.994)#5,145
9.554283.0%1.9%(+1.07)#1352.1%(+0.901)#5,405
10.554143.0%1.9%(+1.05)#1372.1%(+0.885)#5,456
11.554363.0%1.9%(+1.04)#1382.1%(+0.874)#5,487
12.554382.9%1.9%(+1.00)#1422.1%(+0.832)#5,607
13.554302.9%1.9%(+0.968)#1482.1%(+0.800)#5,703
14.554052.9%1.9%(+0.949)#1522.1%(+0.781)#5,765
15.554182.8%1.9%(+0.931)#1552.1%(+0.762)#5,837
16.554272.8%1.9%(+0.926)#1562.1%(+0.758)#5,853
17.554082.7%1.9%(+0.811)#1702.1%(+0.643)#6,271
18.554392.7%1.9%(+0.778)#1722.1%(+0.610)#6,395
19.554062.6%1.9%(+0.695)#1842.1%(+0.527)#6,716
20.554042.5%1.9%(+0.569)#1932.1%(+0.401)#7,246
21.554192.5%1.9%(+0.561)#1952.1%(+0.393)#7,285
22.554312.4%1.9%(+0.514)#2032.1%(+0.346)#7,513
23.554462.4%1.9%(+0.500)#2042.1%(+0.332)#7,580
24.554412.1%1.9%(+0.230)#2382.1%(+0.062)#8,965
25.554162.1%1.9%(+0.222)#2412.1%(+0.054)#9,009
26.554242.0%1.9%(+0.069)#2612.1%(-0.099)#9,869
27.554032.0%1.9%(+0.062)#2622.1%(-0.106)#9,911
28.554222.0%1.9%(+0.049)#2652.1%(-0.119)#9,990
29.554541.9%1.9%(-0.043)#2792.1%(-0.211)#10,543
30.554491.9%1.9%(-0.053)#2812.1%(-0.221)#10,605
31.554421.8%1.9%(-0.072)#2832.1%(-0.240)#10,738
32.554201.8%1.9%(-0.151)#2982.1%(-0.319)#11,267
33.554231.7%1.9%(-0.189)#3092.1%(-0.357)#11,549
34.554011.7%1.9%(-0.226)#3182.1%(-0.394)#11,834
35.554371.7%1.9%(-0.237)#3192.1%(-0.405)#11,889
36.554481.7%1.9%(-0.246)#3212.1%(-0.414)#11,955
37.554211.7%1.9%(-0.255)#3222.1%(-0.423)#12,021
38.554111.6%1.9%(-0.267)#3262.1%(-0.435)#12,106
39.554171.6%1.9%(-0.268)#3272.1%(-0.436)#12,115
40.554471.5%1.9%(-0.385)#3522.1%(-0.553)#13,036
41.554441.5%1.9%(-0.393)#3542.1%(-0.561)#13,093
42.554341.4%1.9%(-0.500)#3812.1%(-0.668)#13,863
43.554321.3%1.9%(-0.596)#3982.1%(-0.764)#14,580
44.554431.1%1.9%(-0.785)#4422.1%(-0.953)#16,010
45.554331.1%1.9%(-0.819)#4482.1%(-0.987)#16,280
46.554251.1%1.9%(-0.837)#4532.1%(-1.00)#16,406
47.554290.95%1.9%(-0.969)#4932.1%(-1.14)#17,358
48.554450.50%1.9%(-1.41)#6252.1%(-1.58)#20,478

Common Questions

What are the Top 10 Zip Codes with the Highest Percentage of Population Employed in Arts, Entertainment & Recreation in Minneapolis, MN?
Top 10 Zip Codes with the Highest Percentage of Population Employed in Arts, Entertainment & Recreation in Minneapolis, MN are:
#1
4.6%
#2
3.6%
#3
3.5%
#4
3.4%
#5
3.3%
#6
3.3%
#7
3.1%
#8
3.1%
#9
3.0%
#10
3.0%
What zip code has the Highest Percentage of Population Employed in Arts, Entertainment & Recreation in Minneapolis, MN?
55435 has the Highest Percentage of Population Employed in Arts, Entertainment & Recreation in Minneapolis, MN with 4.6%.
What is the Percentage of Population Employed in Arts, Entertainment & Recreation in Minneapolis, MN?
Percentage of Population Employed in Arts, Entertainment & Recreation in Minneapolis is 2.6%.
What is the Percentage of Population Employed in Arts, Entertainment & Recreation in Minnesota?
Percentage of Population Employed in Arts, Entertainment & Recreation in Minnesota is 1.9%.
What is the Percentage of Population Employed in Arts, Entertainment & Recreation in the United States?
Percentage of Population Employed in Arts, Entertainment & Recreation in the United States is 2.1%.