Zip Codes with the Highest Percentage of Population Employed in Legal Services & Support in Westland, MI
RELATED REPORTS & OPTIONS
Legal Services & Support
Westland
Compare Zip Codes
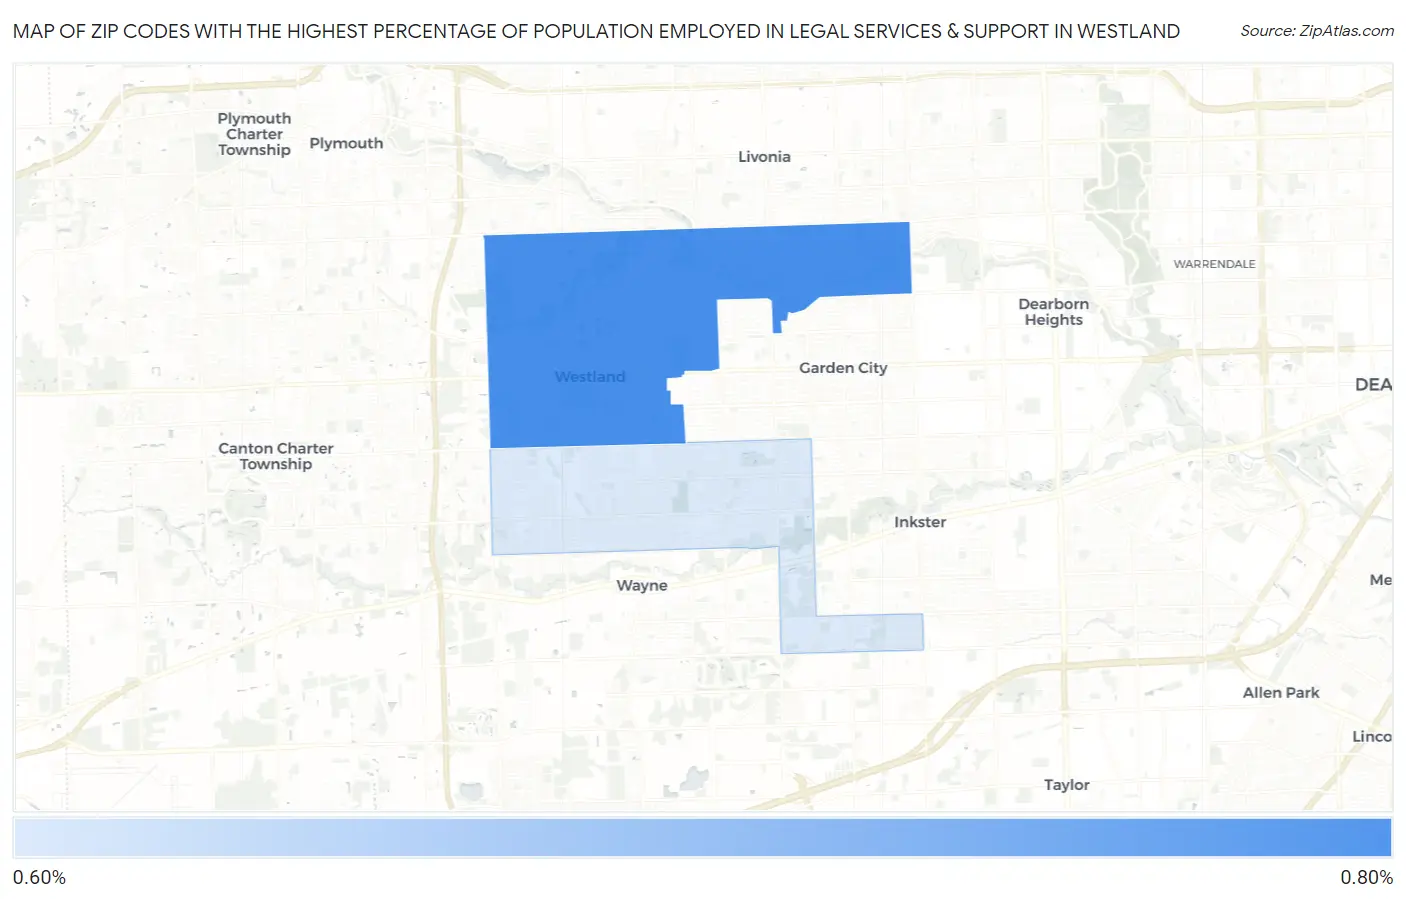
Map of Zip Codes with the Highest Percentage of Population Employed in Legal Services & Support in Westland
0.68%
0.69%
Zip Codes with the Highest Percentage of Population Employed in Legal Services & Support in Westland, MI
| Zip Code | % Employed | vs State | vs National | |
| 1. | 48185 | 0.69% | 0.89%(-0.199)#294 | 1.2%(-0.498)#10,545 |
| 2. | 48186 | 0.68% | 0.89%(-0.205)#299 | 1.2%(-0.504)#10,607 |
1
Common Questions
What are the Top Zip Codes with the Highest Percentage of Population Employed in Legal Services & Support in Westland, MI?
Top Zip Codes with the Highest Percentage of Population Employed in Legal Services & Support in Westland, MI are:
What zip code has the Highest Percentage of Population Employed in Legal Services & Support in Westland, MI?
48185 has the Highest Percentage of Population Employed in Legal Services & Support in Westland, MI with 0.69%.
What is the Percentage of Population Employed in Legal Services & Support in Westland, MI?
Percentage of Population Employed in Legal Services & Support in Westland is 0.68%.
What is the Percentage of Population Employed in Legal Services & Support in Michigan?
Percentage of Population Employed in Legal Services & Support in Michigan is 0.89%.
What is the Percentage of Population Employed in Legal Services & Support in the United States?
Percentage of Population Employed in Legal Services & Support in the United States is 1.2%.