Rapid City, MI Map & Demographics
Rapid City Map
Rapid City Overview
$29,801
PER CAPITA INCOME
$68,804
AVG FAMILY INCOME
$63,611
AVG HOUSEHOLD INCOME
49.0%
WAGE / INCOME GAP [ % ]
51.0¢/ $1
WAGE / INCOME GAP [ $ ]
0.33
INEQUALITY / GINI INDEX
1,196
TOTAL POPULATION
558
MALE POPULATION
638
FEMALE POPULATION
87.46
MALES / 100 FEMALES
114.34
FEMALES / 100 MALES
54.6
MEDIAN AGE
2.6
AVG FAMILY SIZE
2.2
AVG HOUSEHOLD SIZE
504
LABOR FORCE [ PEOPLE ]
50.0%
PERCENT IN LABOR FORCE
5.0%
UNEMPLOYMENT RATE
Rapid City Zip Codes
Rapid City Area Codes
Income in Rapid City
Income Overview in Rapid City
Per Capita Income in Rapid City is $29,801, while median incomes of families and households are $68,804 and $63,611 respectively.
| Characteristic | Number | Measure |
| Per Capita Income | 1,196 | $29,801 |
| Median Family Income | 374 | $68,804 |
| Mean Family Income | 374 | $73,267 |
| Median Household Income | 542 | $63,611 |
| Mean Household Income | 542 | $64,259 |
| Income Deficit | 374 | $0 |
| Wage / Income Gap (%) | 1,196 | 49.02% |
| Wage / Income Gap ($) | 1,196 | 50.98¢ per $1 |
| Gini / Inequality Index | 1,196 | 0.33 |
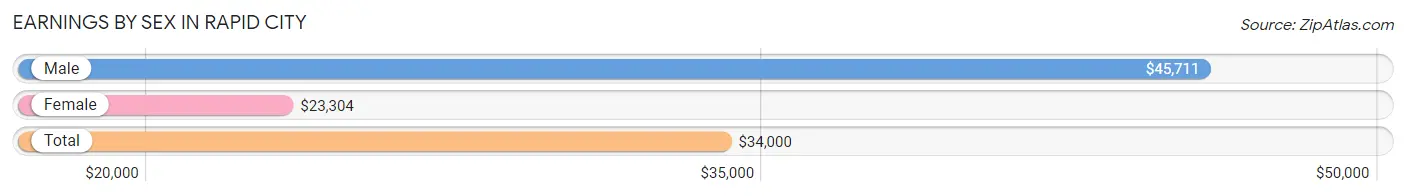
Earnings by Sex in Rapid City
Average Earnings in Rapid City are $34,000, $45,711 for men and $23,304 for women, a difference of 49.0%.
| Sex | Number | Average Earnings |
| Male | 311 (57.6%) | $45,711 |
| Female | 229 (42.4%) | $23,304 |
| Total | 540 (100.0%) | $34,000 |
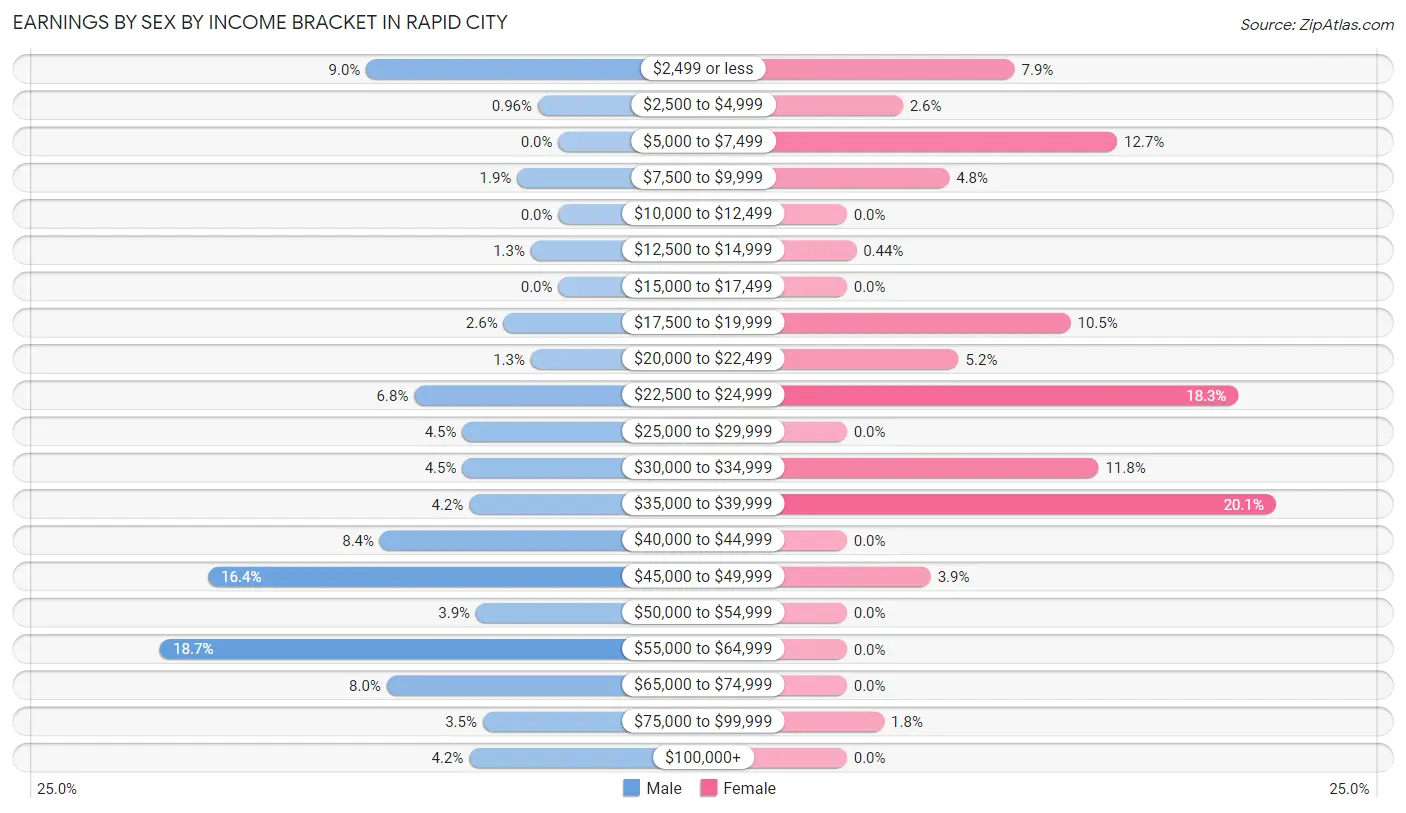
Earnings by Sex by Income Bracket in Rapid City
The most common earnings brackets in Rapid City are $55,000 to $64,999 for men (58 | 18.6%) and $35,000 to $39,999 for women (46 | 20.1%).
| Income | Male | Female |
| $2,499 or less | 28 (9.0%) | 18 (7.9%) |
| $2,500 to $4,999 | 3 (1.0%) | 6 (2.6%) |
| $5,000 to $7,499 | 0 (0.0%) | 29 (12.7%) |
| $7,500 to $9,999 | 6 (1.9%) | 11 (4.8%) |
| $10,000 to $12,499 | 0 (0.0%) | 0 (0.0%) |
| $12,500 to $14,999 | 4 (1.3%) | 1 (0.4%) |
| $15,000 to $17,499 | 0 (0.0%) | 0 (0.0%) |
| $17,500 to $19,999 | 8 (2.6%) | 24 (10.5%) |
| $20,000 to $22,499 | 4 (1.3%) | 12 (5.2%) |
| $22,500 to $24,999 | 21 (6.8%) | 42 (18.3%) |
| $25,000 to $29,999 | 14 (4.5%) | 0 (0.0%) |
| $30,000 to $34,999 | 14 (4.5%) | 27 (11.8%) |
| $35,000 to $39,999 | 13 (4.2%) | 46 (20.1%) |
| $40,000 to $44,999 | 26 (8.4%) | 0 (0.0%) |
| $45,000 to $49,999 | 51 (16.4%) | 9 (3.9%) |
| $50,000 to $54,999 | 12 (3.9%) | 0 (0.0%) |
| $55,000 to $64,999 | 58 (18.6%) | 0 (0.0%) |
| $65,000 to $74,999 | 25 (8.0%) | 0 (0.0%) |
| $75,000 to $99,999 | 11 (3.5%) | 4 (1.8%) |
| $100,000+ | 13 (4.2%) | 0 (0.0%) |
| Total | 311 (100.0%) | 229 (100.0%) |
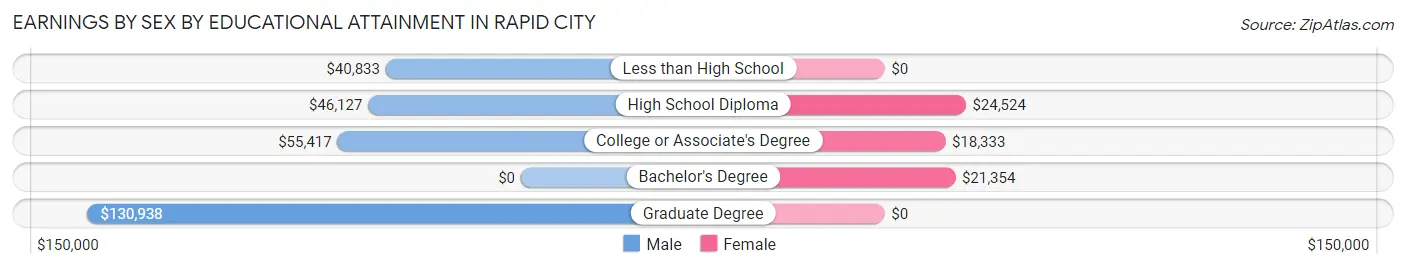
Earnings by Sex by Educational Attainment in Rapid City
Average earnings in Rapid City are $46,275 for men and $23,512 for women, a difference of 49.2%. Men with an educational attainment of graduate degree enjoy the highest average annual earnings of $130,938, while those with less than high school education earn the least with $40,833. Women with an educational attainment of high school diploma earn the most with the average annual earnings of $24,524, while those with college or associate's degree education have the smallest earnings of $18,333.
| Educational Attainment | Male Income | Female Income |
| Less than High School | $40,833 | $0 |
| High School Diploma | $46,127 | $24,524 |
| College or Associate's Degree | $55,417 | $18,333 |
| Bachelor's Degree | - | - |
| Graduate Degree | $130,938 | $0 |
| Total | $46,275 | $23,512 |
Family Income in Rapid City
Family Income Brackets in Rapid City
According to the Rapid City family income data, there are 114 families falling into the $50,000 to $74,999 income range, which is the most common income bracket and makes up 30.5% of all families.
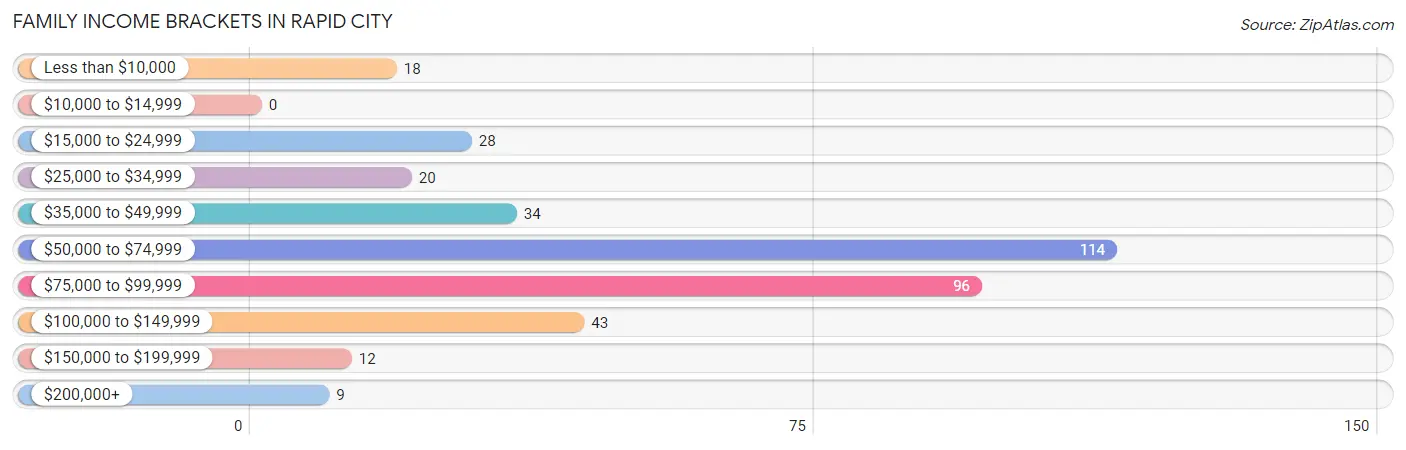
| Income Bracket | # Families | % Families |
| Less than $10,000 | 18 | 4.8% |
| $10,000 to $14,999 | 0 | 0.0% |
| $15,000 to $24,999 | 28 | 7.5% |
| $25,000 to $34,999 | 20 | 5.3% |
| $35,000 to $49,999 | 34 | 9.1% |
| $50,000 to $74,999 | 114 | 30.5% |
| $75,000 to $99,999 | 96 | 25.7% |
| $100,000 to $149,999 | 43 | 11.5% |
| $150,000 to $199,999 | 12 | 3.2% |
| $200,000+ | 9 | 2.4% |
Family Income by Famaliy Size in Rapid City
3-person families (14 | 3.7%) account for the highest median family income in Rapid City with $161,250 per family, while 3-person families (14 | 3.7%) have the highest median income of $53,750 per family member.
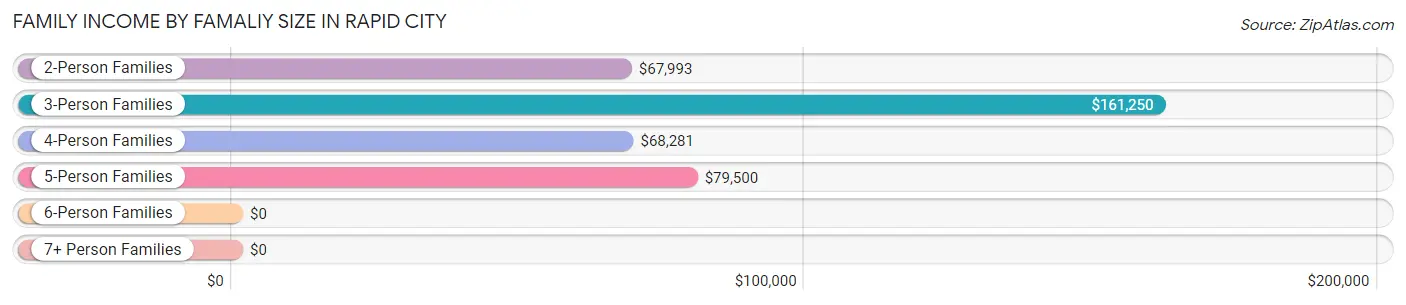
| Income Bracket | # Families | Median Income |
| 2-Person Families | 293 (78.3%) | $67,993 |
| 3-Person Families | 14 (3.7%) | $161,250 |
| 4-Person Families | 37 (9.9%) | $68,281 |
| 5-Person Families | 24 (6.4%) | $79,500 |
| 6-Person Families | 6 (1.6%) | $0 |
| 7+ Person Families | 0 (0.0%) | $0 |
| Total | 374 (100.0%) | $68,804 |
Family Income by Number of Earners in Rapid City
The median family income in Rapid City is $68,804, with families comprising 3+ earners (12) having the highest median family income of $93,125, while families with 1 earner (94) have the lowest median family income of $60,500, accounting for 3.2% and 25.1% of families, respectively.
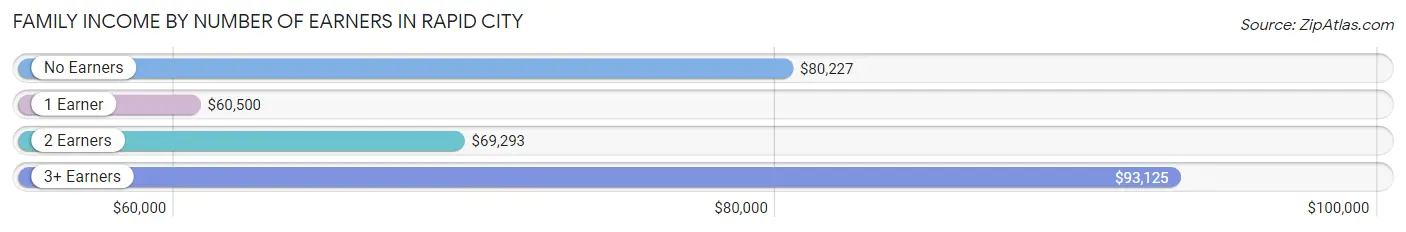
| Number of Earners | # Families | Median Income |
| No Earners | 124 (33.2%) | $80,227 |
| 1 Earner | 94 (25.1%) | $60,500 |
| 2 Earners | 144 (38.5%) | $69,293 |
| 3+ Earners | 12 (3.2%) | $93,125 |
| Total | 374 (100.0%) | $68,804 |
Household Income in Rapid City
Household Income Brackets in Rapid City
With 140 households falling in the category, the $50,000 to $74,999 income range is the most frequent in Rapid City, accounting for 25.8% of all households. In contrast, only 9 households (1.7%) fall into the $200,000+ income bracket, making it the least populous group.
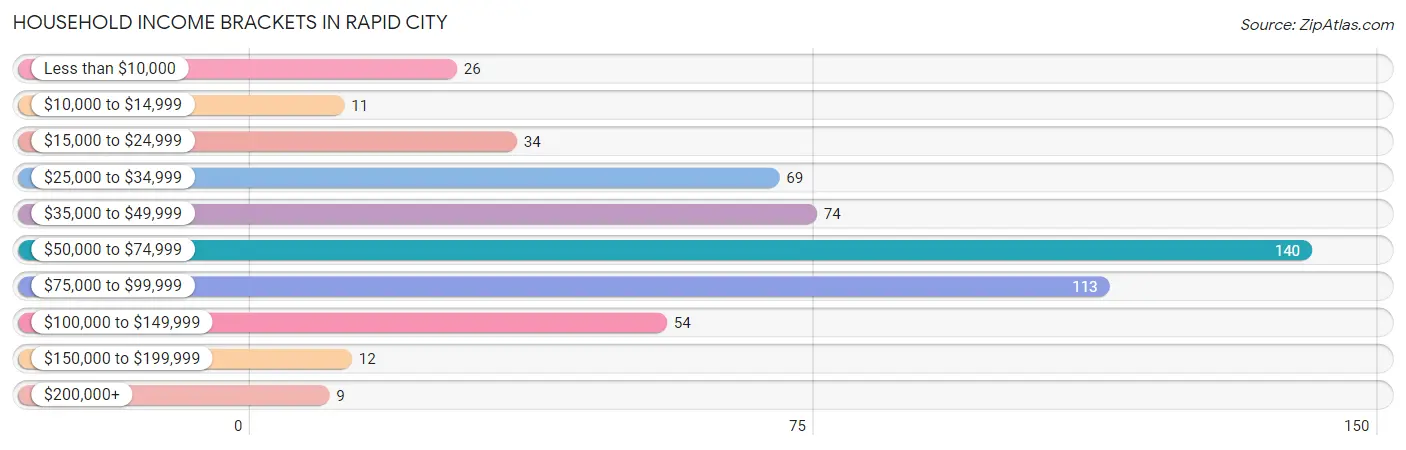
| Income Bracket | # Households | % Households |
| Less than $10,000 | 26 | 4.8% |
| $10,000 to $14,999 | 11 | 2.0% |
| $15,000 to $24,999 | 34 | 6.3% |
| $25,000 to $34,999 | 69 | 12.7% |
| $35,000 to $49,999 | 74 | 13.7% |
| $50,000 to $74,999 | 140 | 25.8% |
| $75,000 to $99,999 | 113 | 20.8% |
| $100,000 to $149,999 | 54 | 10.0% |
| $150,000 to $199,999 | 12 | 2.2% |
| $200,000+ | 9 | 1.7% |
Household Income by Householder Age in Rapid City
The median household income in Rapid City is $63,611, with the highest median household income of $74,250 found in the 65+ years age bracket for the primary householder. A total of 219 households (40.4%) fall into this category. Meanwhile, the 15 to 24 years age bracket for the primary householder has the lowest median household income of $0, with 12 households (2.2%) in this group.
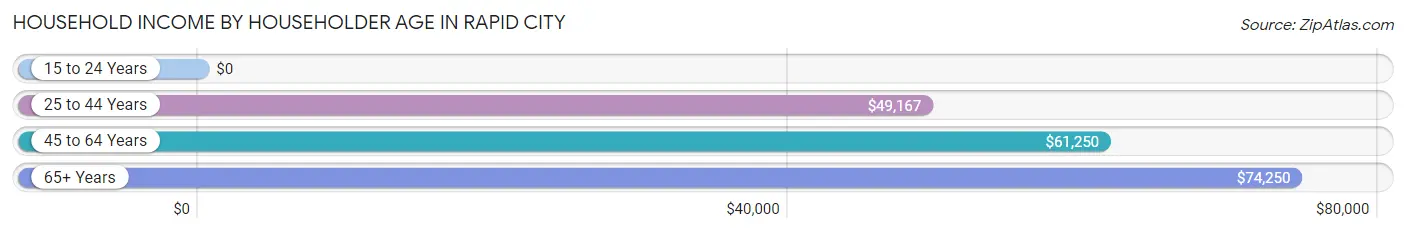
| Income Bracket | # Households | Median Income |
| 15 to 24 Years | 12 (2.2%) | $0 |
| 25 to 44 Years | 132 (24.3%) | $49,167 |
| 45 to 64 Years | 179 (33.0%) | $61,250 |
| 65+ Years | 219 (40.4%) | $74,250 |
| Total | 542 (100.0%) | $63,611 |
Poverty in Rapid City
Income Below Poverty by Sex and Age in Rapid City
With 10.6% poverty level for males and 13.2% for females among the residents of Rapid City, under 5 year old males and 45 to 54 year old females are the most vulnerable to poverty, with 8 males (100.0%) and 50 females (58.8%) in their respective age groups living below the poverty level.
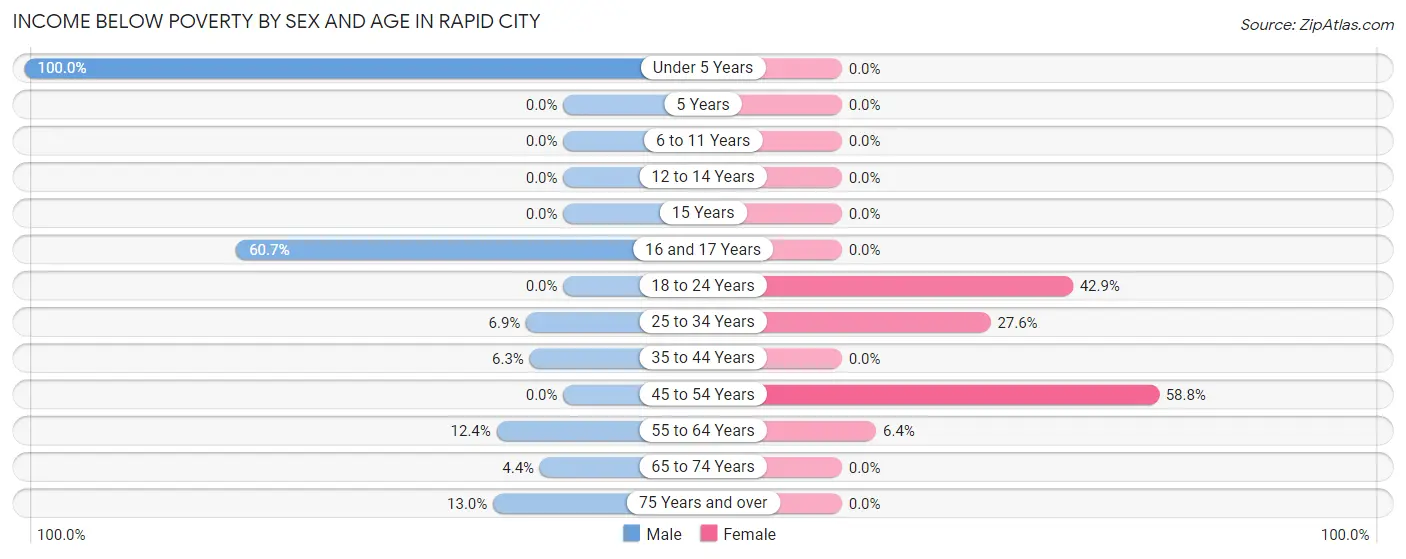
| Age Bracket | Male | Female |
| Under 5 Years | 8 (100.0%) | 0 (0.0%) |
| 5 Years | 0 (0.0%) | 0 (0.0%) |
| 6 to 11 Years | 0 (0.0%) | 0 (0.0%) |
| 12 to 14 Years | 0 (0.0%) | 0 (0.0%) |
| 15 Years | 0 (0.0%) | 0 (0.0%) |
| 16 and 17 Years | 17 (60.7%) | 0 (0.0%) |
| 18 to 24 Years | 0 (0.0%) | 3 (42.9%) |
| 25 to 34 Years | 4 (6.9%) | 24 (27.6%) |
| 35 to 44 Years | 4 (6.2%) | 0 (0.0%) |
| 45 to 54 Years | 0 (0.0%) | 50 (58.8%) |
| 55 to 64 Years | 14 (12.4%) | 7 (6.4%) |
| 65 to 74 Years | 6 (4.3%) | 0 (0.0%) |
| 75 Years and over | 6 (13.0%) | 0 (0.0%) |
| Total | 59 (10.6%) | 84 (13.2%) |
Income Above Poverty by Sex and Age in Rapid City
According to the poverty statistics in Rapid City, males aged 6 to 11 years and females aged under 5 years are the age groups that are most secure financially, with 100.0% of males and 100.0% of females in these age groups living above the poverty line.
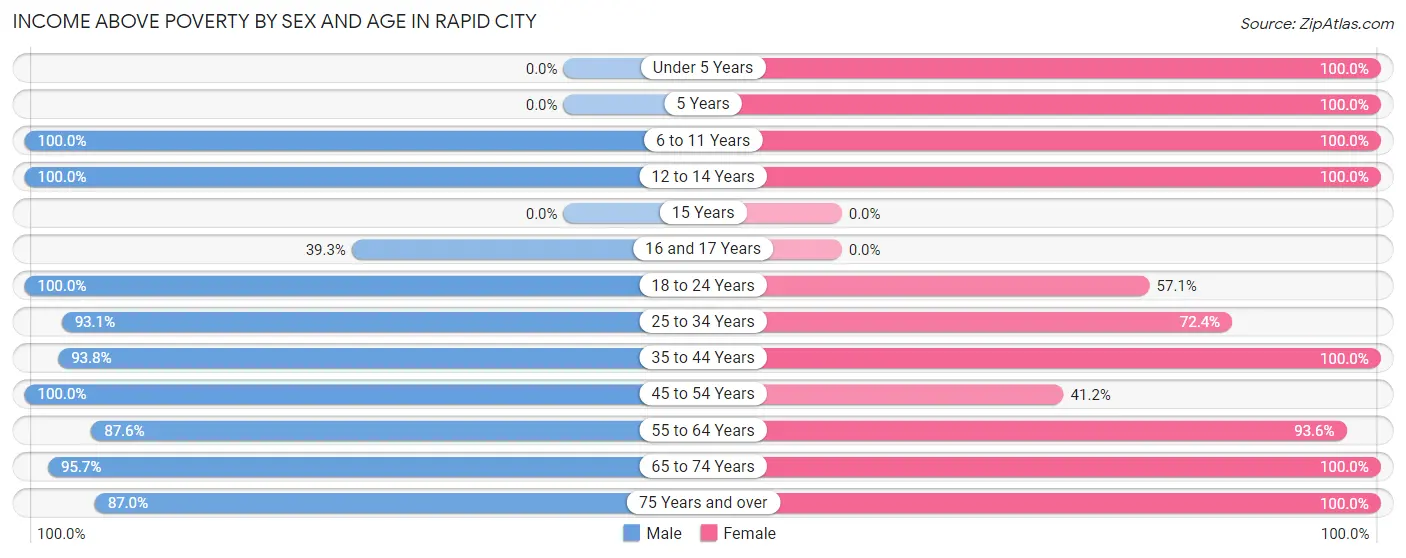
| Age Bracket | Male | Female |
| Under 5 Years | 0 (0.0%) | 44 (100.0%) |
| 5 Years | 0 (0.0%) | 23 (100.0%) |
| 6 to 11 Years | 17 (100.0%) | 46 (100.0%) |
| 12 to 14 Years | 38 (100.0%) | 11 (100.0%) |
| 15 Years | 0 (0.0%) | 0 (0.0%) |
| 16 and 17 Years | 11 (39.3%) | 0 (0.0%) |
| 18 to 24 Years | 20 (100.0%) | 4 (57.1%) |
| 25 to 34 Years | 54 (93.1%) | 63 (72.4%) |
| 35 to 44 Years | 60 (93.8%) | 44 (100.0%) |
| 45 to 54 Years | 28 (100.0%) | 35 (41.2%) |
| 55 to 64 Years | 99 (87.6%) | 103 (93.6%) |
| 65 to 74 Years | 132 (95.7%) | 114 (100.0%) |
| 75 Years and over | 40 (87.0%) | 67 (100.0%) |
| Total | 499 (89.4%) | 554 (86.8%) |
Income Below Poverty Among Married-Couple Families in Rapid City
The poverty statistics for married-couple families in Rapid City show that 4.9% or 16 of the total 326 families live below the poverty line. Families with 1 or 2 children have the highest poverty rate of 9.5%, comprising of 4 families. On the other hand, families with 3 or 4 children have the lowest poverty rate of 0.0%, which includes 0 families.
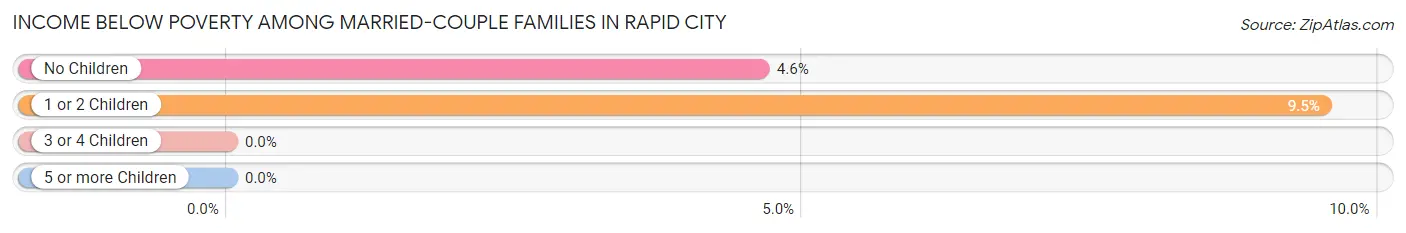
| Children | Above Poverty | Below Poverty |
| No Children | 247 (95.4%) | 12 (4.6%) |
| 1 or 2 Children | 38 (90.5%) | 4 (9.5%) |
| 3 or 4 Children | 25 (100.0%) | 0 (0.0%) |
| 5 or more Children | 0 (0.0%) | 0 (0.0%) |
| Total | 310 (95.1%) | 16 (4.9%) |
Income Below Poverty Among Single-Parent Households in Rapid City
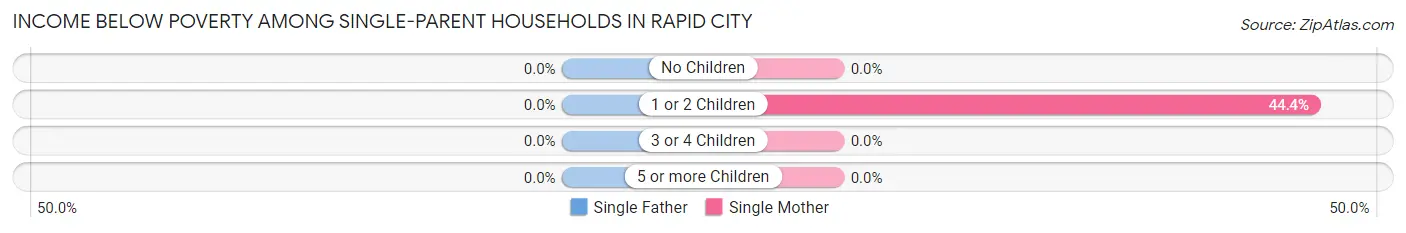
| Children | Single Father | Single Mother |
| No Children | 0 (0.0%) | 0 (0.0%) |
| 1 or 2 Children | 0 (0.0%) | 12 (44.4%) |
| 3 or 4 Children | 0 (0.0%) | 0 (0.0%) |
| 5 or more Children | 0 (0.0%) | 0 (0.0%) |
| Total | 0 (0.0%) | 12 (36.4%) |
Income Below Poverty Among Married-Couple vs Single-Parent Households in Rapid City
The poverty data for Rapid City shows that 16 of the married-couple family households (4.9%) and 12 of the single-parent households (25.0%) are living below the poverty level. Within the married-couple family households, those with 1 or 2 children have the highest poverty rate, with 4 households (9.5%) falling below the poverty line. Among the single-parent households, those with 1 or 2 children have the highest poverty rate, with 12 household (33.3%) living below poverty.
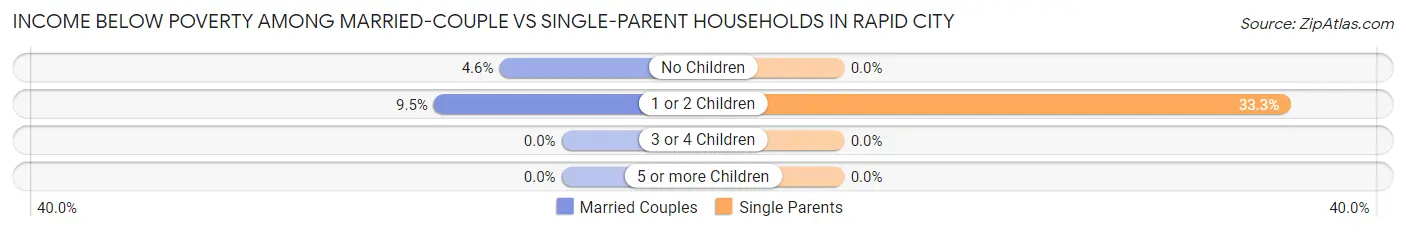
| Children | Married-Couple Families | Single-Parent Households |
| No Children | 12 (4.6%) | 0 (0.0%) |
| 1 or 2 Children | 4 (9.5%) | 12 (33.3%) |
| 3 or 4 Children | 0 (0.0%) | 0 (0.0%) |
| 5 or more Children | 0 (0.0%) | 0 (0.0%) |
| Total | 16 (4.9%) | 12 (25.0%) |
Race in Rapid City
The most populous races in Rapid City are White / Caucasian (1,151 | 96.2%), Hispanic or Latino (51 | 4.3%), and Two or more Races (17 | 1.4%).
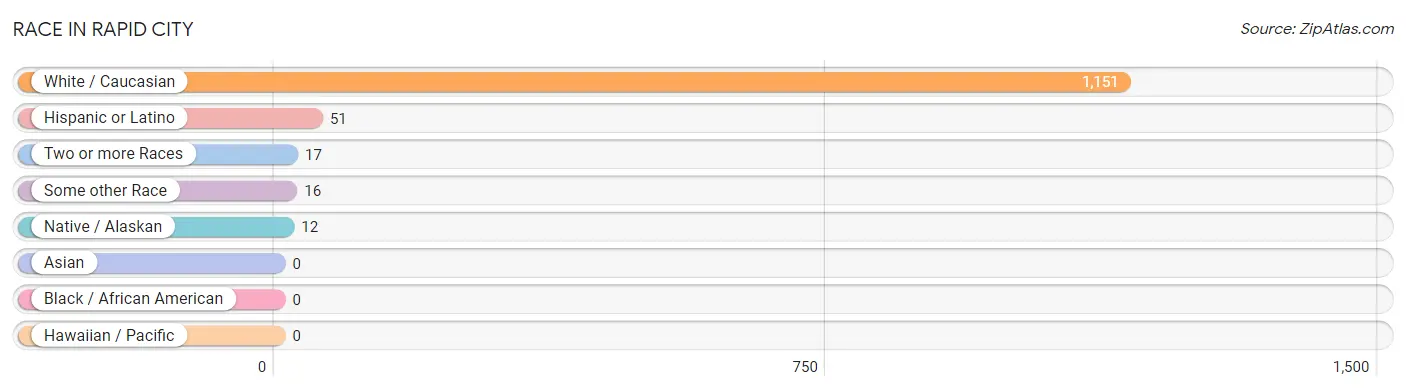
| Race | # Population | % Population |
| Asian | 0 | 0.0% |
| Black / African American | 0 | 0.0% |
| Hawaiian / Pacific | 0 | 0.0% |
| Hispanic or Latino | 51 | 4.3% |
| Native / Alaskan | 12 | 1.0% |
| White / Caucasian | 1,151 | 96.2% |
| Two or more Races | 17 | 1.4% |
| Some other Race | 16 | 1.3% |
| Total | 1,196 | 100.0% |
Ancestry in Rapid City
The most populous ancestries reported in Rapid City are German (342 | 28.6%), English (162 | 13.6%), American (130 | 10.9%), Irish (124 | 10.4%), and French (90 | 7.5%), together accounting for 70.9% of all Rapid City residents.
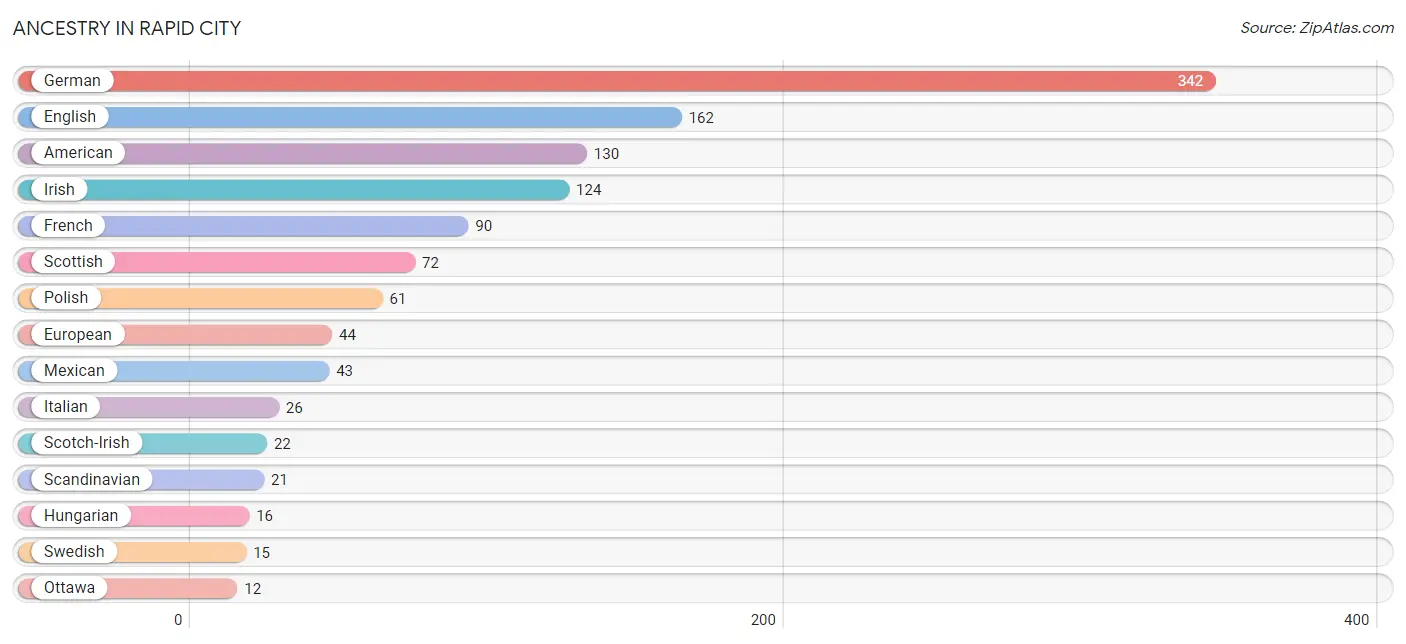
| Ancestry | # Population | % Population |
| American | 130 | 10.9% |
| Arab | 7 | 0.6% |
| Eastern European | 4 | 0.3% |
| English | 162 | 13.6% |
| European | 44 | 3.7% |
| French | 90 | 7.5% |
| French Canadian | 6 | 0.5% |
| German | 342 | 28.6% |
| Greek | 6 | 0.5% |
| Hungarian | 16 | 1.3% |
| Irish | 124 | 10.4% |
| Italian | 26 | 2.2% |
| Mexican | 43 | 3.6% |
| Navajo | 8 | 0.7% |
| Northern European | 6 | 0.5% |
| Norwegian | 3 | 0.3% |
| Ottawa | 12 | 1.0% |
| Polish | 61 | 5.1% |
| Romanian | 4 | 0.3% |
| Russian | 5 | 0.4% |
| Scandinavian | 21 | 1.8% |
| Scotch-Irish | 22 | 1.8% |
| Scottish | 72 | 6.0% |
| Spanish | 8 | 0.7% |
| Swedish | 15 | 1.3% |
| Syrian | 7 | 0.6% |
| Welsh | 3 | 0.3% | View All 27 Rows |
Immigrants in Rapid City
The most numerous immigrant groups reported in Rapid City came from , and Canada (6 | 0.5%), together accounting for 0.5% of all Rapid City residents.

| Immigration Origin | # Population | % Population |
| Canada | 6 | 0.5% | View All 1 Rows |
Sex and Age in Rapid City
Sex and Age in Rapid City
The most populous age groups in Rapid City are 70 to 74 Years (92 | 16.5%) for men and 70 to 74 Years (84 | 13.2%) for women.
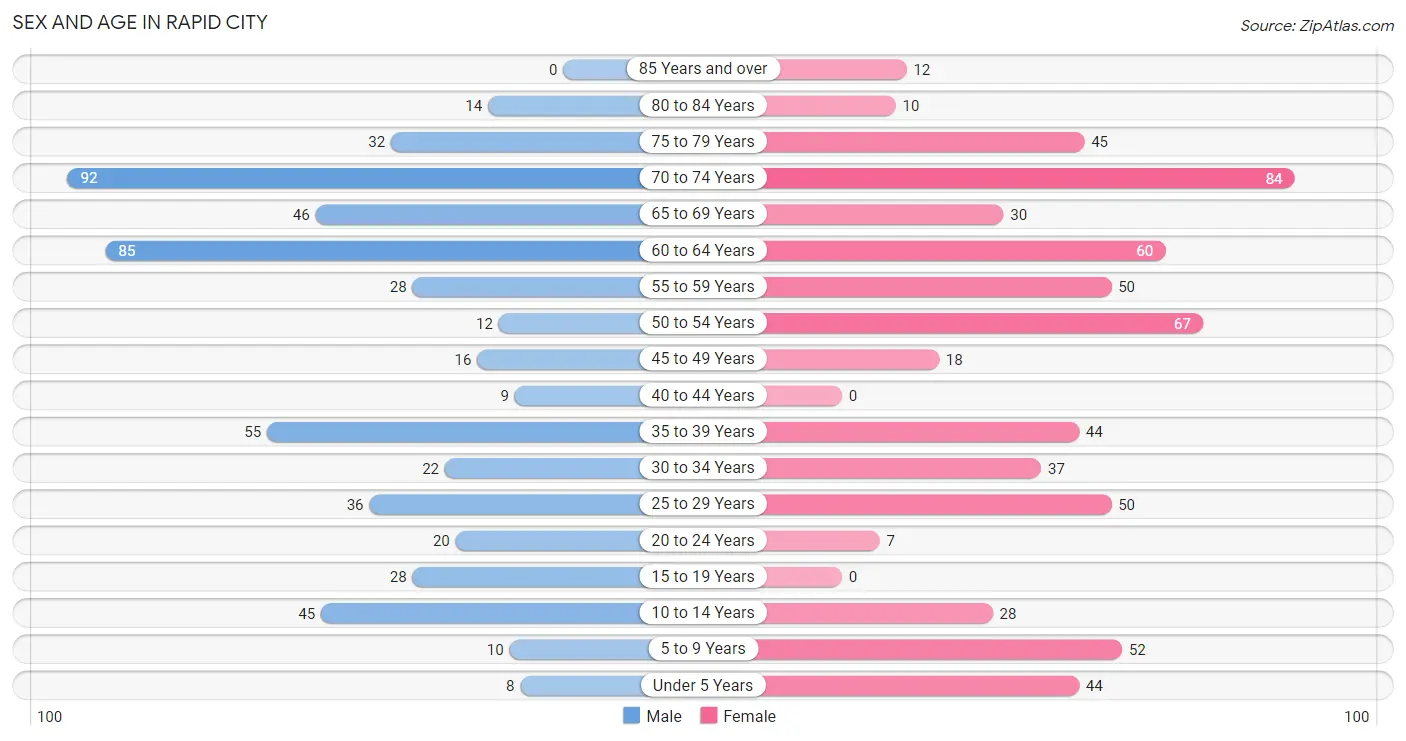
| Age Bracket | Male | Female |
| Under 5 Years | 8 (1.4%) | 44 (6.9%) |
| 5 to 9 Years | 10 (1.8%) | 52 (8.2%) |
| 10 to 14 Years | 45 (8.1%) | 28 (4.4%) |
| 15 to 19 Years | 28 (5.0%) | 0 (0.0%) |
| 20 to 24 Years | 20 (3.6%) | 7 (1.1%) |
| 25 to 29 Years | 36 (6.5%) | 50 (7.8%) |
| 30 to 34 Years | 22 (3.9%) | 37 (5.8%) |
| 35 to 39 Years | 55 (9.9%) | 44 (6.9%) |
| 40 to 44 Years | 9 (1.6%) | 0 (0.0%) |
| 45 to 49 Years | 16 (2.9%) | 18 (2.8%) |
| 50 to 54 Years | 12 (2.1%) | 67 (10.5%) |
| 55 to 59 Years | 28 (5.0%) | 50 (7.8%) |
| 60 to 64 Years | 85 (15.2%) | 60 (9.4%) |
| 65 to 69 Years | 46 (8.2%) | 30 (4.7%) |
| 70 to 74 Years | 92 (16.5%) | 84 (13.2%) |
| 75 to 79 Years | 32 (5.7%) | 45 (7.0%) |
| 80 to 84 Years | 14 (2.5%) | 10 (1.6%) |
| 85 Years and over | 0 (0.0%) | 12 (1.9%) |
| Total | 558 (100.0%) | 638 (100.0%) |
Families and Households in Rapid City
Median Family Size in Rapid City
The median family size in Rapid City is 2.59 persons per family, with married-couple families (326 | 87.2%) accounting for the largest median family size of 2.67 persons per family. On the other hand, single male/father families (15 | 4.0%) represent the smallest median family size with 1.80 persons per family.
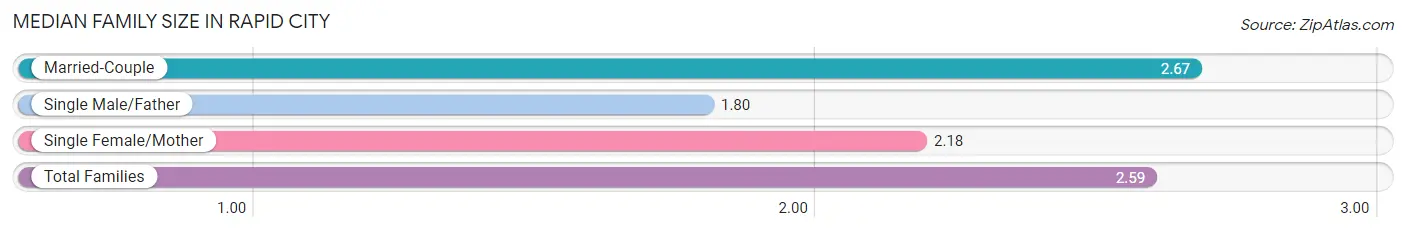
| Family Type | # Families | Family Size |
| Married-Couple | 326 (87.2%) | 2.67 |
| Single Male/Father | 15 (4.0%) | 1.80 |
| Single Female/Mother | 33 (8.8%) | 2.18 |
| Total Families | 374 (100.0%) | 2.59 |
Median Household Size in Rapid City
The median household size in Rapid City is 2.21 persons per household, with married-couple households (326 | 60.2%) accounting for the largest median household size of 2.67 persons per household. non-family households (168 | 31.0%) represent the smallest median household size with 1.28 persons per household.
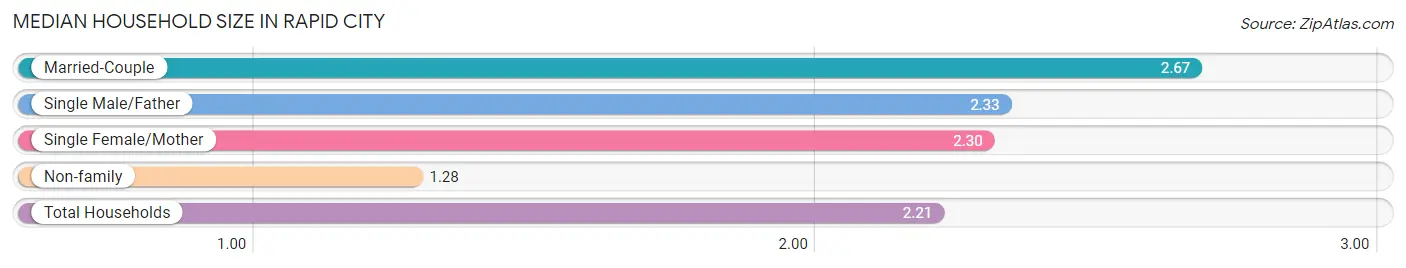
| Household Type | # Households | Household Size |
| Married-Couple | 326 (60.2%) | 2.67 |
| Single Male/Father | 15 (2.8%) | 2.33 |
| Single Female/Mother | 33 (6.1%) | 2.30 |
| Non-family | 168 (31.0%) | 1.28 |
| Total Households | 542 (100.0%) | 2.21 |
Household Size by Marriage Status in Rapid City
Out of a total of 542 households in Rapid City, 374 (69.0%) are family households, while 168 (31.0%) are nonfamily households. The most numerous type of family households are 2-person households, comprising 277, and the most common type of nonfamily households are 1-person households, comprising 116.
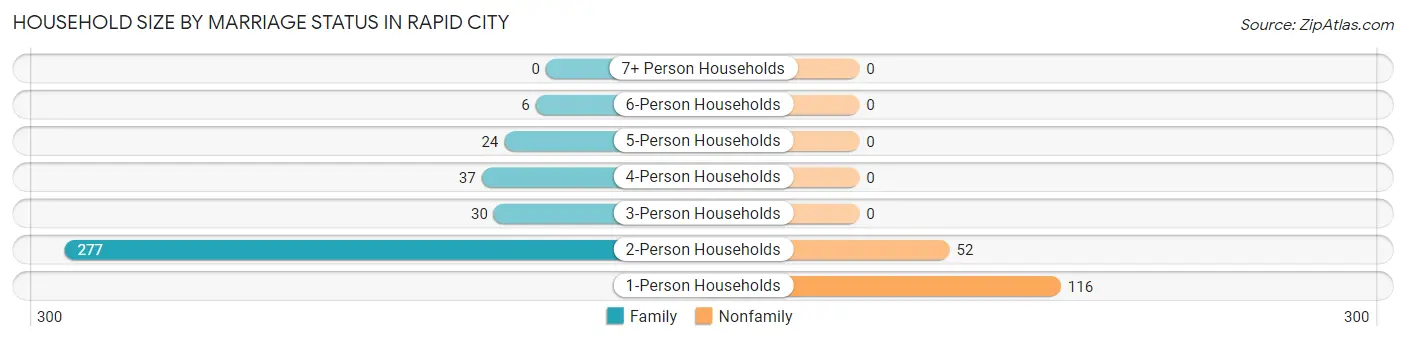
| Household Size | Family Households | Nonfamily Households |
| 1-Person Households | - | 116 (21.4%) |
| 2-Person Households | 277 (51.1%) | 52 (9.6%) |
| 3-Person Households | 30 (5.5%) | 0 (0.0%) |
| 4-Person Households | 37 (6.8%) | 0 (0.0%) |
| 5-Person Households | 24 (4.4%) | 0 (0.0%) |
| 6-Person Households | 6 (1.1%) | 0 (0.0%) |
| 7+ Person Households | 0 (0.0%) | 0 (0.0%) |
| Total | 374 (69.0%) | 168 (31.0%) |
Female Fertility in Rapid City
Fertility by Age in Rapid City
Average fertility rate in Rapid City is 145.0 births per 1,000 women. Women in the age bracket of 20 to 34 years have the highest fertility rate with 255.0 births per 1,000 women. Women in the age bracket of 20 to 34 years acount for 100.0% of all women with births.
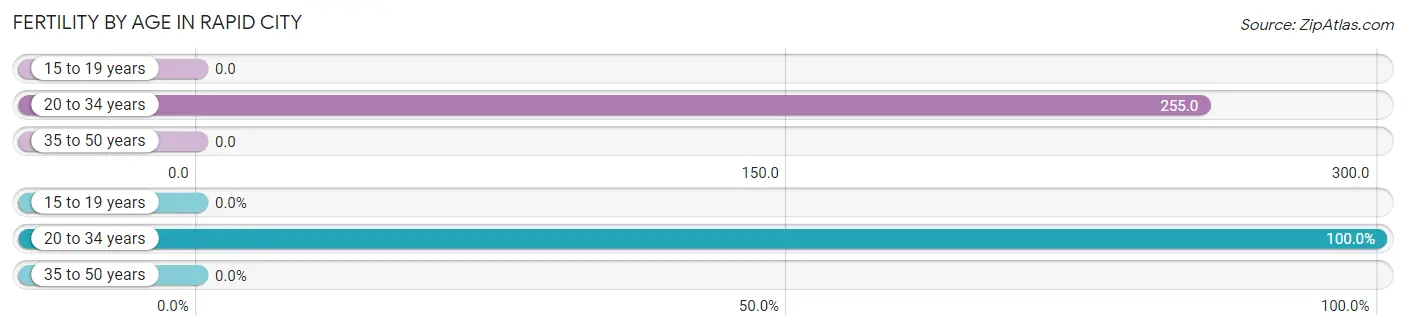
| Age Bracket | Women with Births | Births / 1,000 Women |
| 15 to 19 years | 0 (0.0%) | 0.0 |
| 20 to 34 years | 24 (100.0%) | 255.0 |
| 35 to 50 years | 0 (0.0%) | 0.0 |
| Total | 24 (100.0%) | 145.0 |
Fertility by Age by Marriage Status in Rapid City
16.7% of women with births (24) in Rapid City are married. The highest percentage of unmarried women with births falls into 20 to 34 years age bracket with 83.3% of them unmarried at the time of birth, while the lowest percentage of unmarried women with births belong to 20 to 34 years age bracket with 83.3% of them unmarried.

| Age Bracket | Married | Unmarried |
| 15 to 19 years | 0 (0.0%) | 0 (0.0%) |
| 20 to 34 years | 4 (16.7%) | 20 (83.3%) |
| 35 to 50 years | 0 (0.0%) | 0 (0.0%) |
| Total | 4 (16.7%) | 20 (83.3%) |
Fertility by Education in Rapid City
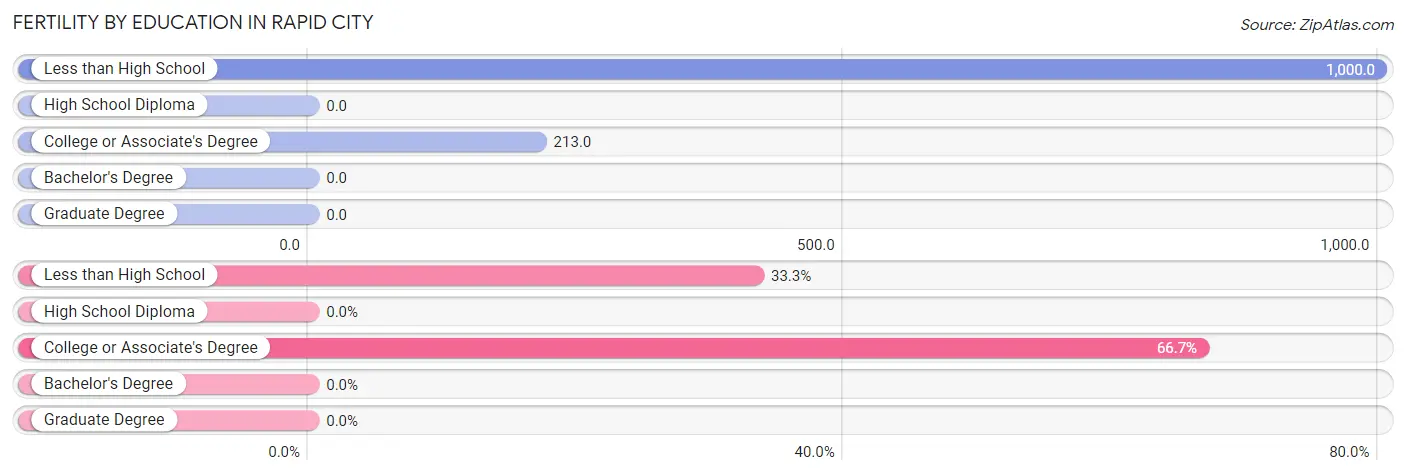
| Educational Attainment | Women with Births | Births / 1,000 Women |
| Less than High School | 8 (33.3%) | 1,000.0 |
| High School Diploma | 0 (0.0%) | 0.0 |
| College or Associate's Degree | 16 (66.7%) | 213.0 |
| Bachelor's Degree | 0 (0.0%) | 0.0 |
| Graduate Degree | 0 (0.0%) | 0.0 |
| Total | 24 (100.0%) | 145.0 |
Fertility by Education by Marriage Status in Rapid City
83.3% of women with births in Rapid City are unmarried. Women with the educational attainment of college or associate's degree are most likely to be married with 25.0% of them married at childbirth, while women with the educational attainment of less than high school are least likely to be married with 100.0% of them unmarried at childbirth.
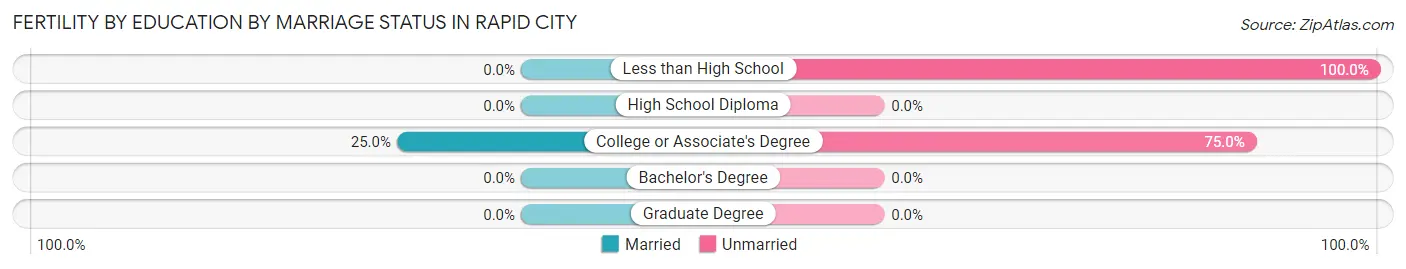
| Educational Attainment | Married | Unmarried |
| Less than High School | 0 (0.0%) | 8 (100.0%) |
| High School Diploma | 0 (0.0%) | 0 (0.0%) |
| College or Associate's Degree | 4 (25.0%) | 12 (75.0%) |
| Bachelor's Degree | 0 (0.0%) | 0 (0.0%) |
| Graduate Degree | 0 (0.0%) | 0 (0.0%) |
| Total | 4 (16.7%) | 20 (83.3%) |
Employment Characteristics in Rapid City
Employment by Class of Employer in Rapid City
Among the 445 employed individuals in Rapid City, private company employees (327 | 73.5%), self-employed (not incorporated) (54 | 12.1%), and self-employed (incorporated) (18 | 4.0%) make up the most common classes of employment.
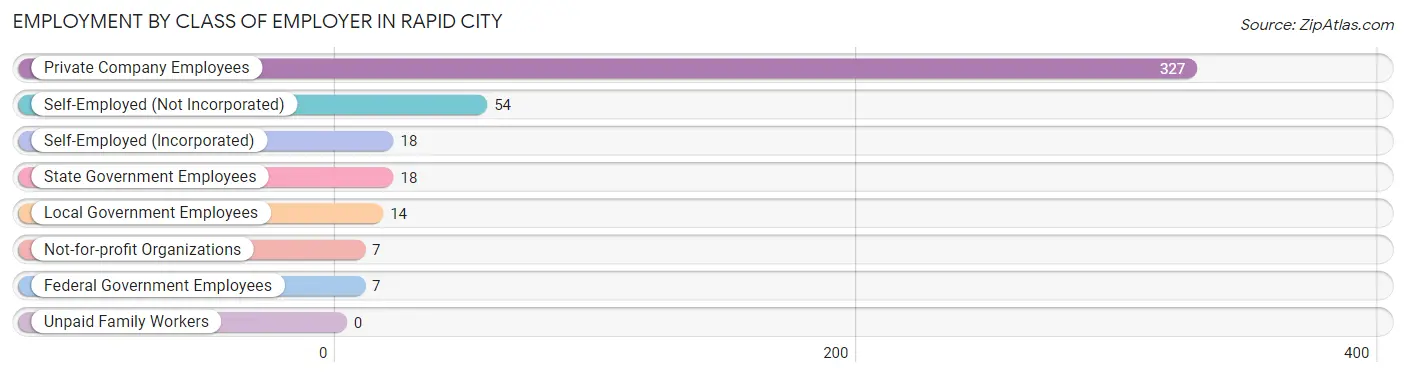
| Employer Class | # Employees | % Employees |
| Private Company Employees | 327 | 73.5% |
| Self-Employed (Incorporated) | 18 | 4.0% |
| Self-Employed (Not Incorporated) | 54 | 12.1% |
| Not-for-profit Organizations | 7 | 1.6% |
| Local Government Employees | 14 | 3.2% |
| State Government Employees | 18 | 4.0% |
| Federal Government Employees | 7 | 1.6% |
| Unpaid Family Workers | 0 | 0.0% |
| Total | 445 | 100.0% |
Employment Status by Age in Rapid City
According to the labor force statistics for Rapid City, out of the total population over 16 years of age (1,009), 50.0% or 504 individuals are in the labor force, with 5.0% or 25 of them unemployed. The age group with the highest labor force participation rate is 55 to 59 years, with 92.3% or 72 individuals in the labor force. Within the labor force, the 16 to 19 years age range has the highest percentage of unemployed individuals, with 72.7% or 8 of them being unemployed.
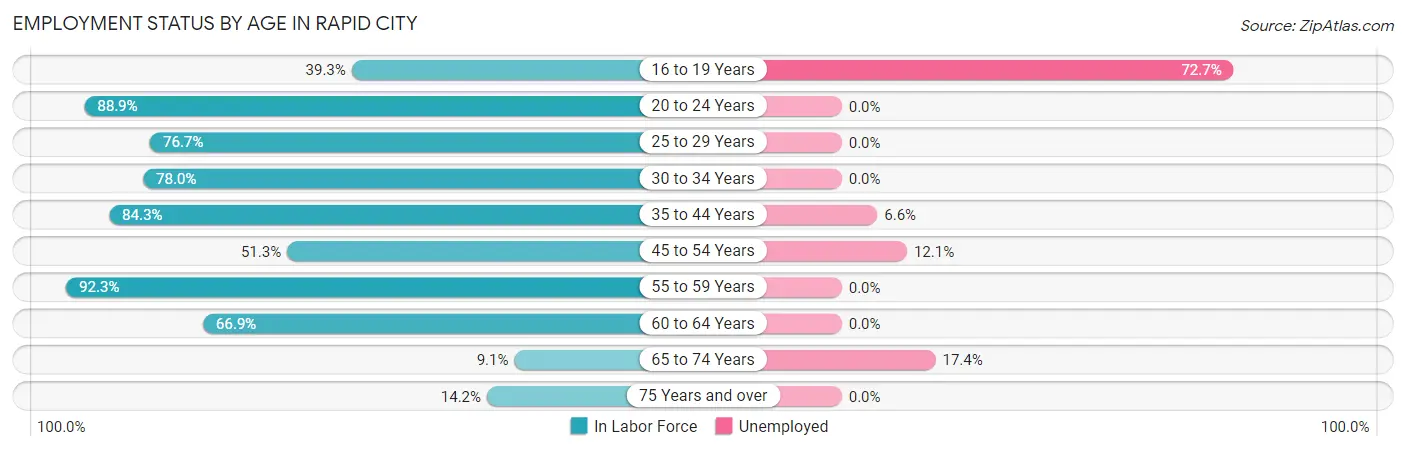
| Age Bracket | In Labor Force | Unemployed |
| 16 to 19 Years | 11 (39.3%) | 8 (72.7%) |
| 20 to 24 Years | 24 (88.9%) | 0 (0.0%) |
| 25 to 29 Years | 66 (76.7%) | 0 (0.0%) |
| 30 to 34 Years | 46 (78.0%) | 0 (0.0%) |
| 35 to 44 Years | 91 (84.3%) | 6 (6.6%) |
| 45 to 54 Years | 58 (51.3%) | 7 (12.1%) |
| 55 to 59 Years | 72 (92.3%) | 0 (0.0%) |
| 60 to 64 Years | 97 (66.9%) | 0 (0.0%) |
| 65 to 74 Years | 23 (9.1%) | 4 (17.4%) |
| 75 Years and over | 16 (14.2%) | 0 (0.0%) |
| Total | 504 (50.0%) | 25 (5.0%) |
Employment Status by Educational Attainment in Rapid City
According to labor force statistics for Rapid City, 73.0% of individuals (430) out of the total population between 25 and 64 years of age (589) are in the labor force, with 3.1% or 13 of them being unemployed. The group with the highest labor force participation rate are those with the educational attainment of high school diploma, with 84.6% or 247 individuals in the labor force. Within the labor force, individuals with college / associate degree education have the highest percentage of unemployment, with 8.3% or 8 of them being unemployed.
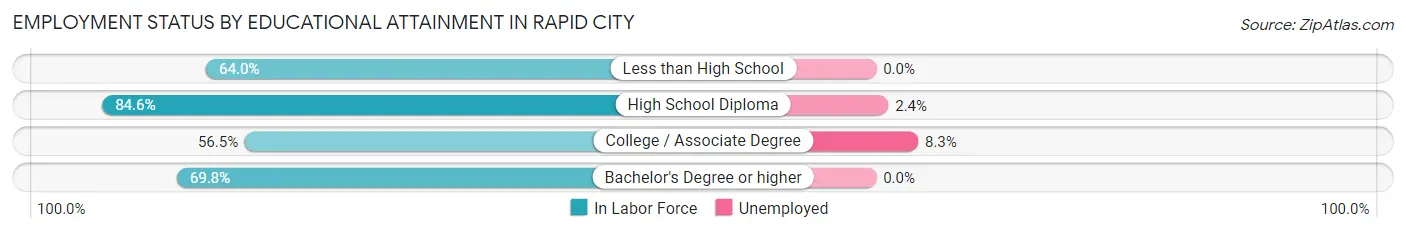
| Educational Attainment | In Labor Force | Unemployed |
| Less than High School | 32 (64.0%) | 0 (0.0%) |
| High School Diploma | 247 (84.6%) | 7 (2.4%) |
| College / Associate Degree | 91 (56.5%) | 13 (8.3%) |
| Bachelor's Degree or higher | 60 (69.8%) | 0 (0.0%) |
| Total | 430 (73.0%) | 18 (3.1%) |
Employment Occupations by Sex in Rapid City
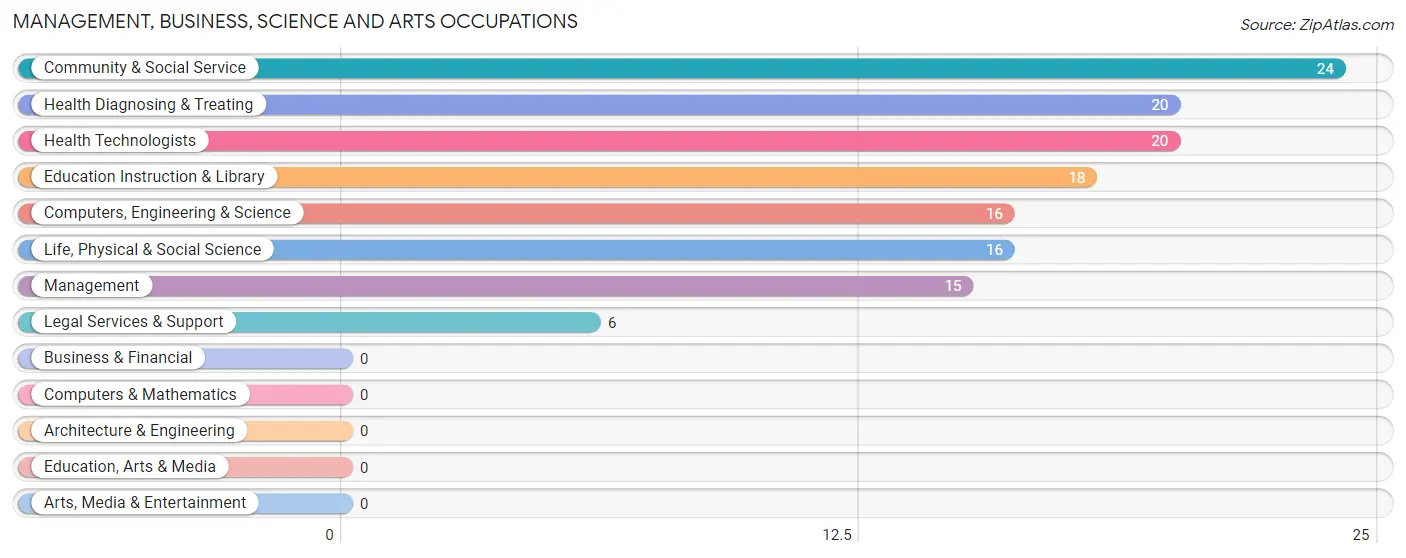
Management, Business, Science and Arts Occupations
The most common Management, Business, Science and Arts occupations in Rapid City are Community & Social Service (24 | 5.1%), Health Diagnosing & Treating (20 | 4.2%), Health Technologists (20 | 4.2%), Education Instruction & Library (18 | 3.8%), and Computers, Engineering & Science (16 | 3.4%).
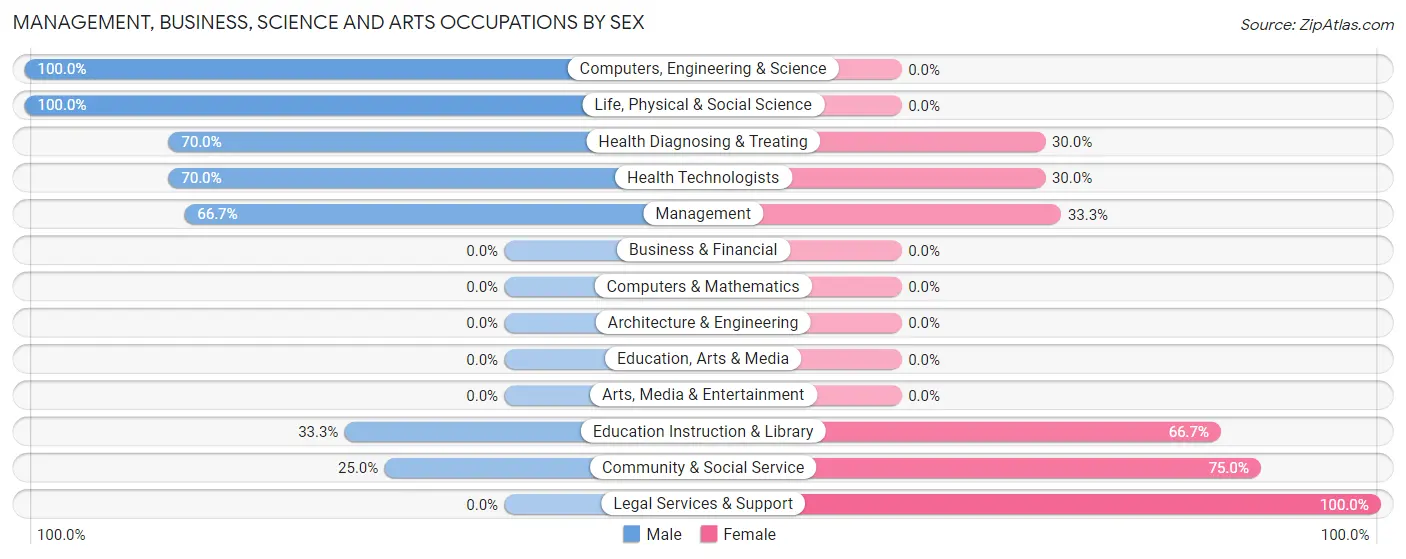
Management, Business, Science and Arts Occupations by Sex
Within the Management, Business, Science and Arts occupations in Rapid City, the most male-oriented occupations are Computers, Engineering & Science (100.0%), Life, Physical & Social Science (100.0%), and Health Diagnosing & Treating (70.0%), while the most female-oriented occupations are Legal Services & Support (100.0%), Community & Social Service (75.0%), and Education Instruction & Library (66.7%).
| Occupation | Male | Female |
| Management | 10 (66.7%) | 5 (33.3%) |
| Business & Financial | 0 (0.0%) | 0 (0.0%) |
| Computers, Engineering & Science | 16 (100.0%) | 0 (0.0%) |
| Computers & Mathematics | 0 (0.0%) | 0 (0.0%) |
| Architecture & Engineering | 0 (0.0%) | 0 (0.0%) |
| Life, Physical & Social Science | 16 (100.0%) | 0 (0.0%) |
| Community & Social Service | 6 (25.0%) | 18 (75.0%) |
| Education, Arts & Media | 0 (0.0%) | 0 (0.0%) |
| Legal Services & Support | 0 (0.0%) | 6 (100.0%) |
| Education Instruction & Library | 6 (33.3%) | 12 (66.7%) |
| Arts, Media & Entertainment | 0 (0.0%) | 0 (0.0%) |
| Health Diagnosing & Treating | 14 (70.0%) | 6 (30.0%) |
| Health Technologists | 14 (70.0%) | 6 (30.0%) |
| Total (Category) | 46 (61.3%) | 29 (38.7%) |
| Total (Overall) | 281 (59.5%) | 191 (40.5%) |
Services Occupations
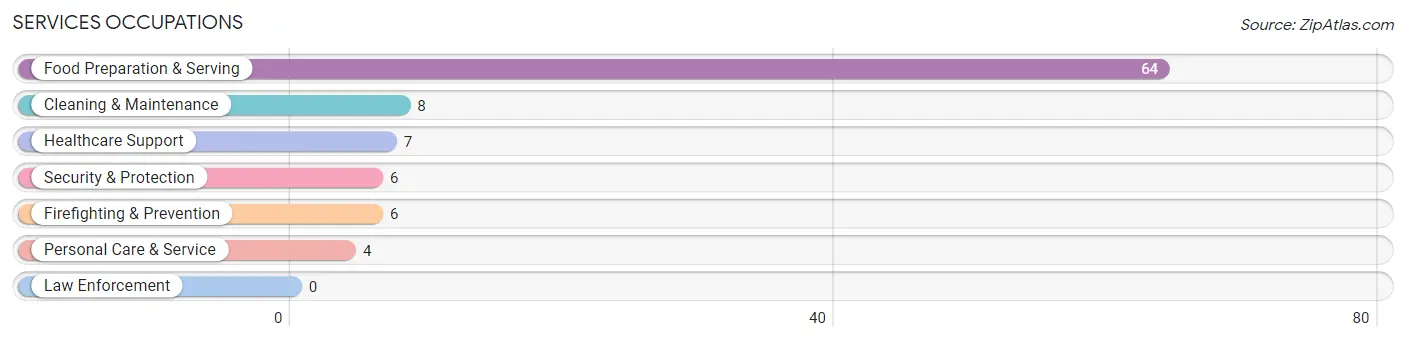
The most common Services occupations in Rapid City are Food Preparation & Serving (64 | 13.6%), Cleaning & Maintenance (8 | 1.7%), Healthcare Support (7 | 1.5%), Security & Protection (6 | 1.3%), and Firefighting & Prevention (6 | 1.3%).
Services Occupations by Sex
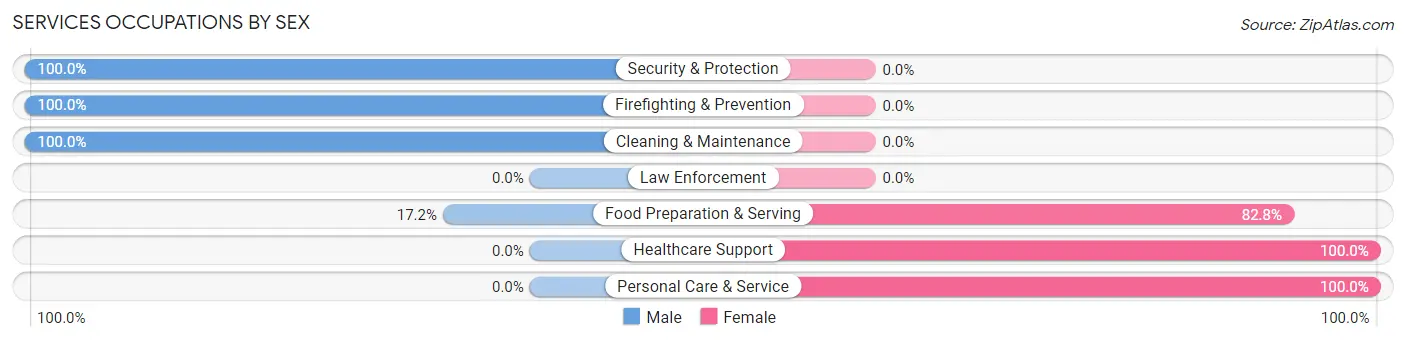
Within the Services occupations in Rapid City, the most male-oriented occupations are Security & Protection (100.0%), Firefighting & Prevention (100.0%), and Cleaning & Maintenance (100.0%), while the most female-oriented occupations are Healthcare Support (100.0%), Personal Care & Service (100.0%), and Food Preparation & Serving (82.8%).
| Occupation | Male | Female |
| Healthcare Support | 0 (0.0%) | 7 (100.0%) |
| Security & Protection | 6 (100.0%) | 0 (0.0%) |
| Firefighting & Prevention | 6 (100.0%) | 0 (0.0%) |
| Law Enforcement | 0 (0.0%) | 0 (0.0%) |
| Food Preparation & Serving | 11 (17.2%) | 53 (82.8%) |
| Cleaning & Maintenance | 8 (100.0%) | 0 (0.0%) |
| Personal Care & Service | 0 (0.0%) | 4 (100.0%) |
| Total (Category) | 25 (28.1%) | 64 (71.9%) |
| Total (Overall) | 281 (59.5%) | 191 (40.5%) |
Sales and Office Occupations
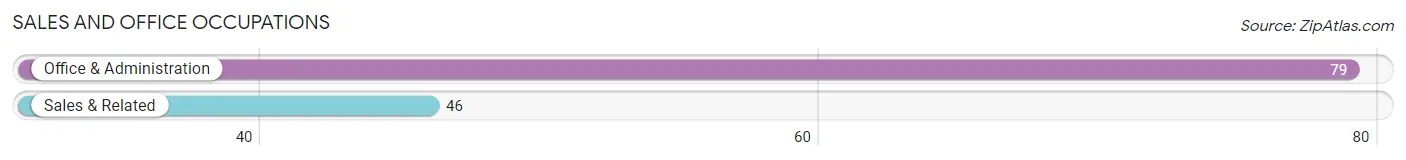
The most common Sales and Office occupations in Rapid City are Office & Administration (79 | 16.7%), and Sales & Related (46 | 9.8%).
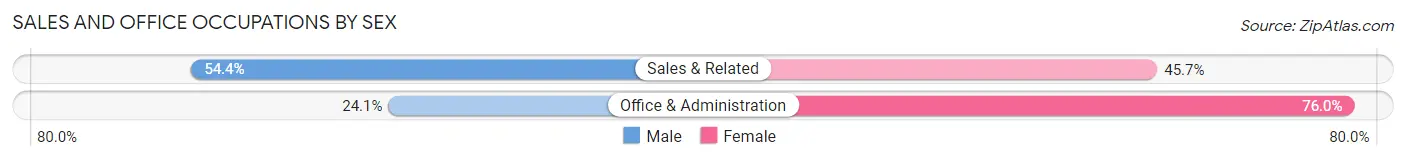
Sales and Office Occupations by Sex
| Occupation | Male | Female |
| Sales & Related | 25 (54.3%) | 21 (45.7%) |
| Office & Administration | 19 (24.0%) | 60 (75.9%) |
| Total (Category) | 44 (35.2%) | 81 (64.8%) |
| Total (Overall) | 281 (59.5%) | 191 (40.5%) |
Natural Resources, Construction and Maintenance Occupations
The most common Natural Resources, Construction and Maintenance occupations in Rapid City are Construction & Extraction (87 | 18.4%), Installation, Maintenance & Repair (24 | 5.1%), and Farming, Fishing & Forestry (4 | 0.9%).
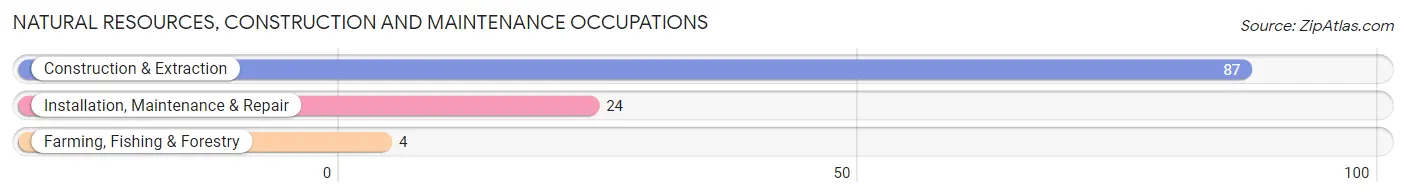
Natural Resources, Construction and Maintenance Occupations by Sex
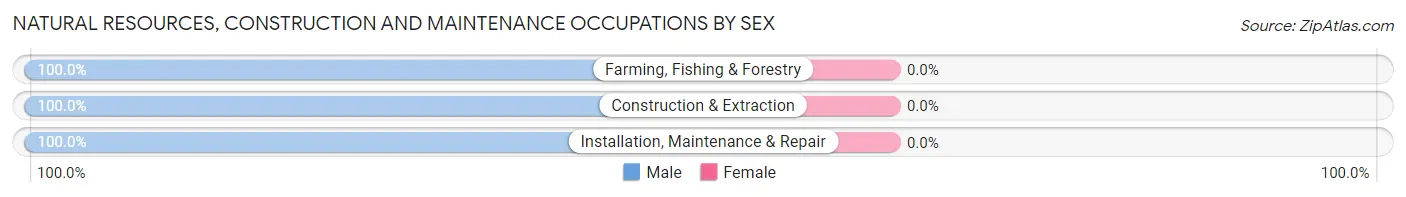
| Occupation | Male | Female |
| Farming, Fishing & Forestry | 4 (100.0%) | 0 (0.0%) |
| Construction & Extraction | 87 (100.0%) | 0 (0.0%) |
| Installation, Maintenance & Repair | 24 (100.0%) | 0 (0.0%) |
| Total (Category) | 115 (100.0%) | 0 (0.0%) |
| Total (Overall) | 281 (59.5%) | 191 (40.5%) |
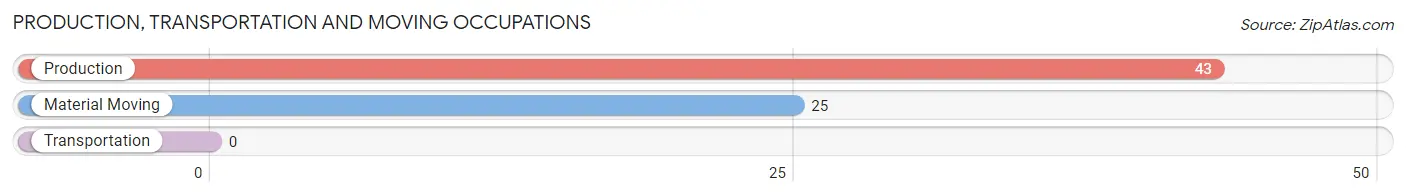
Production, Transportation and Moving Occupations
The most common Production, Transportation and Moving occupations in Rapid City are Production (43 | 9.1%), and Material Moving (25 | 5.3%).
Production, Transportation and Moving Occupations by Sex
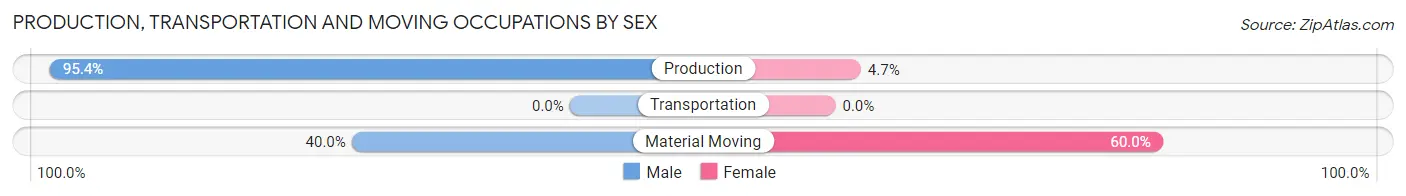
| Occupation | Male | Female |
| Production | 41 (95.4%) | 2 (4.6%) |
| Transportation | 0 (0.0%) | 0 (0.0%) |
| Material Moving | 10 (40.0%) | 15 (60.0%) |
| Total (Category) | 51 (75.0%) | 17 (25.0%) |
| Total (Overall) | 281 (59.5%) | 191 (40.5%) |
Employment Industries by Sex in Rapid City
Employment Industries in Rapid City
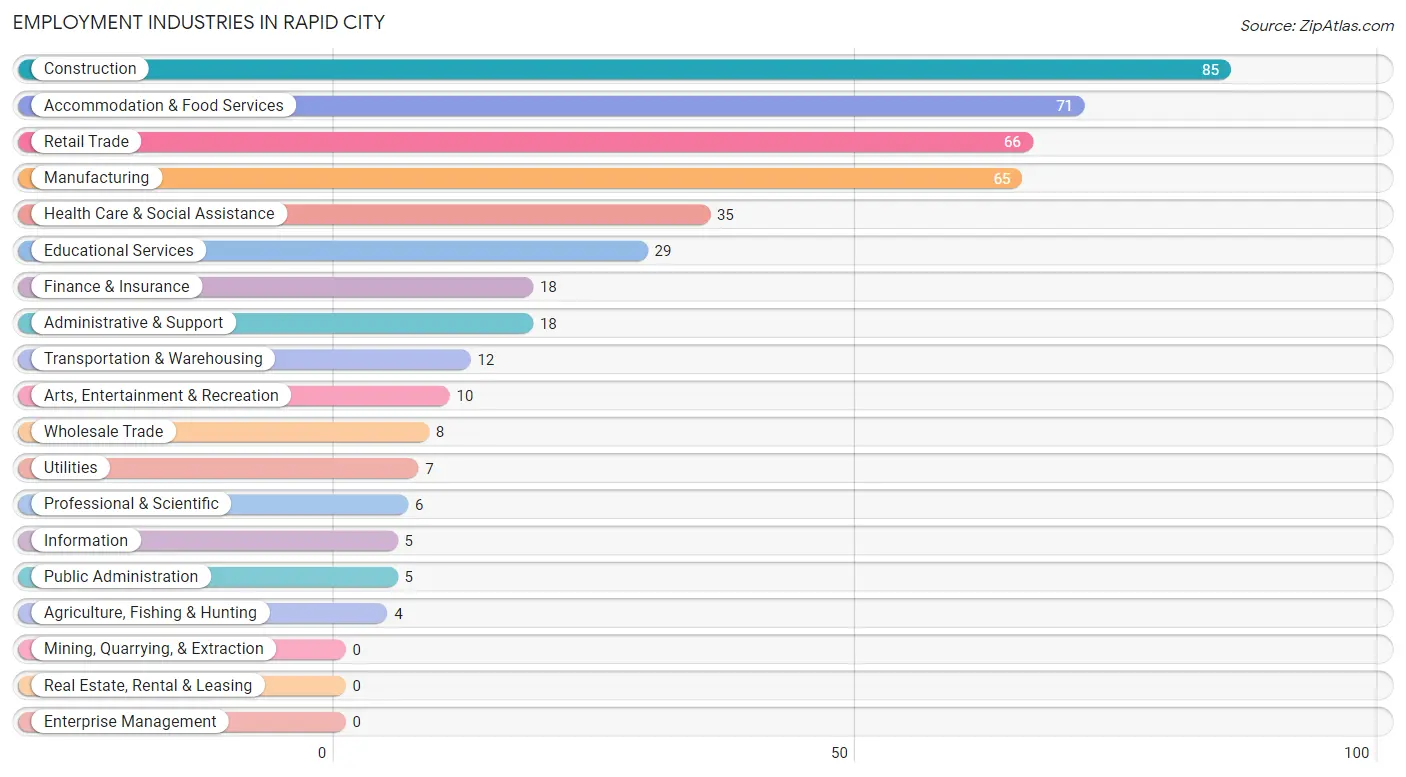
The major employment industries in Rapid City include Construction (85 | 18.0%), Accommodation & Food Services (71 | 15.0%), Retail Trade (66 | 14.0%), Manufacturing (65 | 13.8%), and Health Care & Social Assistance (35 | 7.4%).
Employment Industries by Sex in Rapid City
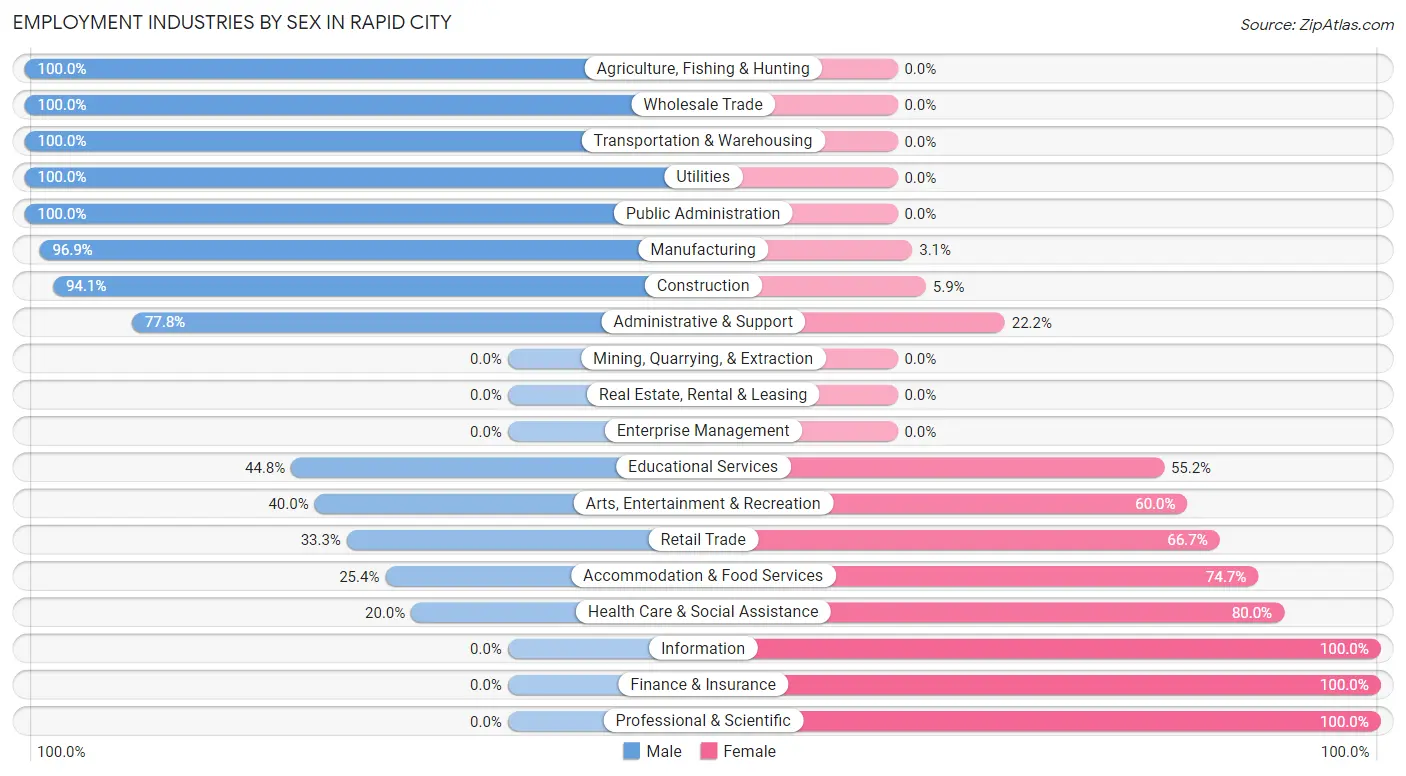
The Rapid City industries that see more men than women are Agriculture, Fishing & Hunting (100.0%), Wholesale Trade (100.0%), and Transportation & Warehousing (100.0%), whereas the industries that tend to have a higher number of women are Information (100.0%), Finance & Insurance (100.0%), and Professional & Scientific (100.0%).
| Industry | Male | Female |
| Agriculture, Fishing & Hunting | 4 (100.0%) | 0 (0.0%) |
| Mining, Quarrying, & Extraction | 0 (0.0%) | 0 (0.0%) |
| Construction | 80 (94.1%) | 5 (5.9%) |
| Manufacturing | 63 (96.9%) | 2 (3.1%) |
| Wholesale Trade | 8 (100.0%) | 0 (0.0%) |
| Retail Trade | 22 (33.3%) | 44 (66.7%) |
| Transportation & Warehousing | 12 (100.0%) | 0 (0.0%) |
| Utilities | 7 (100.0%) | 0 (0.0%) |
| Information | 0 (0.0%) | 5 (100.0%) |
| Finance & Insurance | 0 (0.0%) | 18 (100.0%) |
| Real Estate, Rental & Leasing | 0 (0.0%) | 0 (0.0%) |
| Professional & Scientific | 0 (0.0%) | 6 (100.0%) |
| Enterprise Management | 0 (0.0%) | 0 (0.0%) |
| Administrative & Support | 14 (77.8%) | 4 (22.2%) |
| Educational Services | 13 (44.8%) | 16 (55.2%) |
| Health Care & Social Assistance | 7 (20.0%) | 28 (80.0%) |
| Arts, Entertainment & Recreation | 4 (40.0%) | 6 (60.0%) |
| Accommodation & Food Services | 18 (25.4%) | 53 (74.7%) |
| Public Administration | 5 (100.0%) | 0 (0.0%) |
| Total | 281 (59.5%) | 191 (40.5%) |
Education in Rapid City
School Enrollment in Rapid City
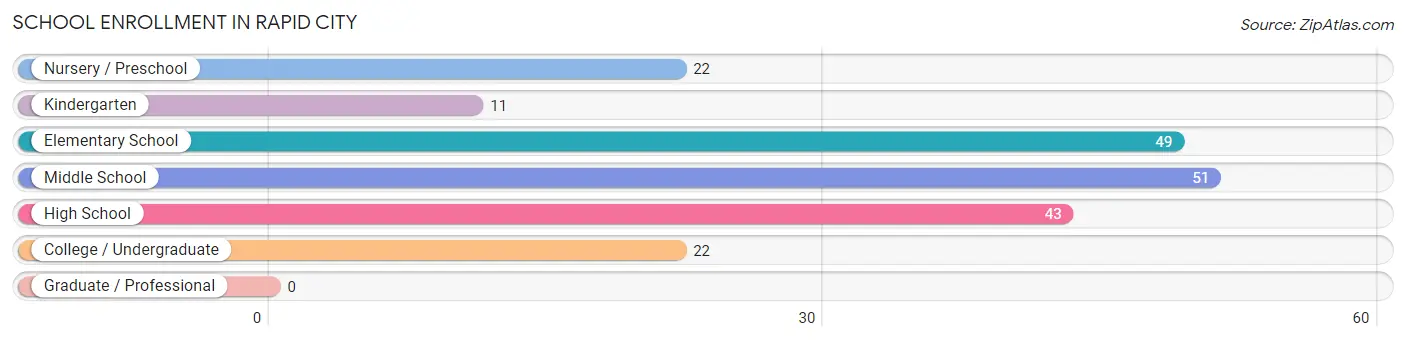
The most common levels of schooling among the 198 students in Rapid City are middle school (51 | 25.8%), elementary school (49 | 24.7%), and high school (43 | 21.7%).
| School Level | # Students | % Students |
| Nursery / Preschool | 22 | 11.1% |
| Kindergarten | 11 | 5.6% |
| Elementary School | 49 | 24.7% |
| Middle School | 51 | 25.8% |
| High School | 43 | 21.7% |
| College / Undergraduate | 22 | 11.1% |
| Graduate / Professional | 0 | 0.0% |
| Total | 198 | 100.0% |
School Enrollment by Age by Funding Source in Rapid City
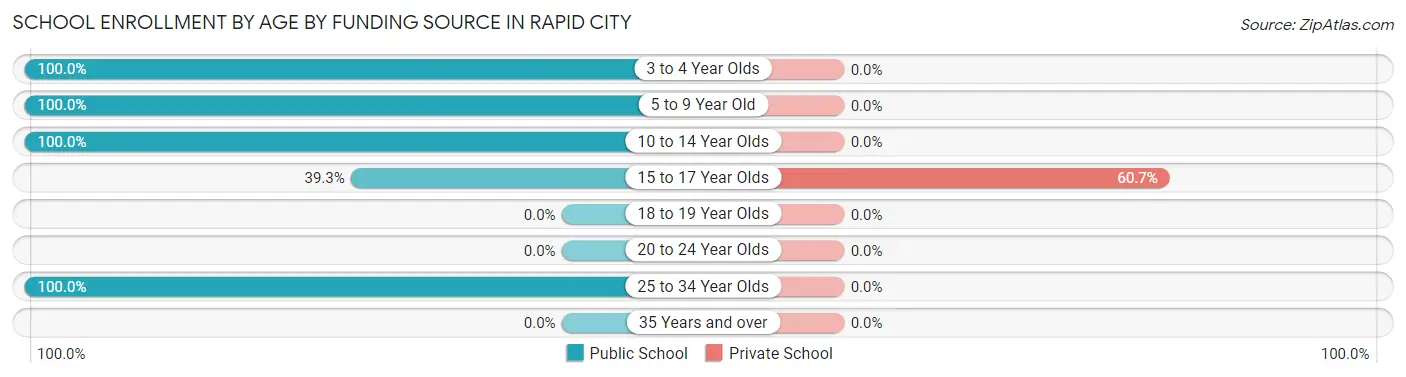
Out of a total of 198 students who are enrolled in schools in Rapid City, 17 (8.6%) attend a private institution, while the remaining 181 (91.4%) are enrolled in public schools. The age group of 15 to 17 year olds has the highest likelihood of being enrolled in private schools, with 17 (60.7% in the age bracket) enrolled. Conversely, the age group of 3 to 4 year olds has the lowest likelihood of being enrolled in a private school, with 13 (100.0% in the age bracket) attending a public institution.
| Age Bracket | Public School | Private School |
| 3 to 4 Year Olds | 13 (100.0%) | 0 (0.0%) |
| 5 to 9 Year Old | 62 (100.0%) | 0 (0.0%) |
| 10 to 14 Year Olds | 73 (100.0%) | 0 (0.0%) |
| 15 to 17 Year Olds | 11 (39.3%) | 17 (60.7%) |
| 18 to 19 Year Olds | 0 (0.0%) | 0 (0.0%) |
| 20 to 24 Year Olds | 0 (0.0%) | 0 (0.0%) |
| 25 to 34 Year Olds | 22 (100.0%) | 0 (0.0%) |
| 35 Years and over | 0 (0.0%) | 0 (0.0%) |
| Total | 181 (91.4%) | 17 (8.6%) |
Educational Attainment by Field of Study in Rapid City
Education (48 | 31.6%), computers & mathematics (25 | 16.5%), psychology (18 | 11.8%), business (17 | 11.2%), and bio, nature & agricultural (7 | 4.6%) are the most common fields of study among 152 individuals in Rapid City who have obtained a bachelor's degree or higher.
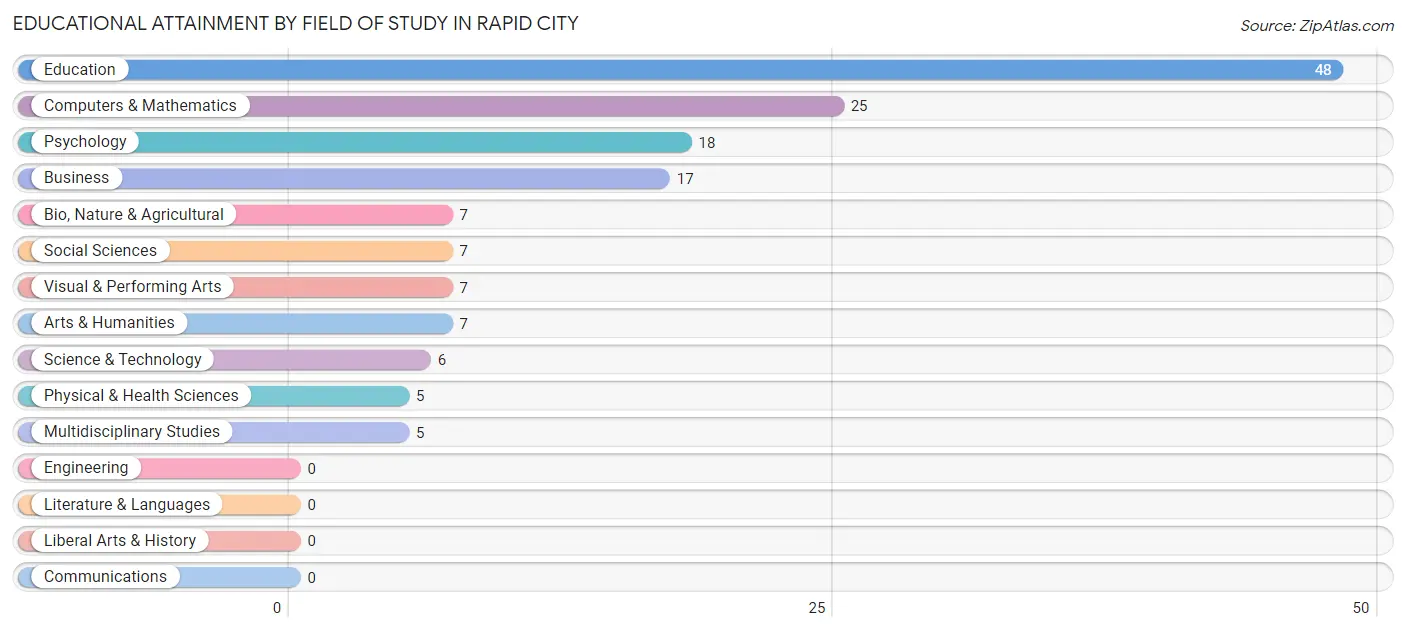
| Field of Study | # Graduates | % Graduates |
| Computers & Mathematics | 25 | 16.5% |
| Bio, Nature & Agricultural | 7 | 4.6% |
| Physical & Health Sciences | 5 | 3.3% |
| Psychology | 18 | 11.8% |
| Social Sciences | 7 | 4.6% |
| Engineering | 0 | 0.0% |
| Multidisciplinary Studies | 5 | 3.3% |
| Science & Technology | 6 | 4.0% |
| Business | 17 | 11.2% |
| Education | 48 | 31.6% |
| Literature & Languages | 0 | 0.0% |
| Liberal Arts & History | 0 | 0.0% |
| Visual & Performing Arts | 7 | 4.6% |
| Communications | 0 | 0.0% |
| Arts & Humanities | 7 | 4.6% |
| Total | 152 | 100.0% |
Transportation & Commute in Rapid City
Vehicle Availability by Sex in Rapid City
The most prevalent vehicle ownership categories in Rapid City are males with 2 vehicles (152, accounting for 54.1%) and females with 2 vehicles (127, making up 92.7%).
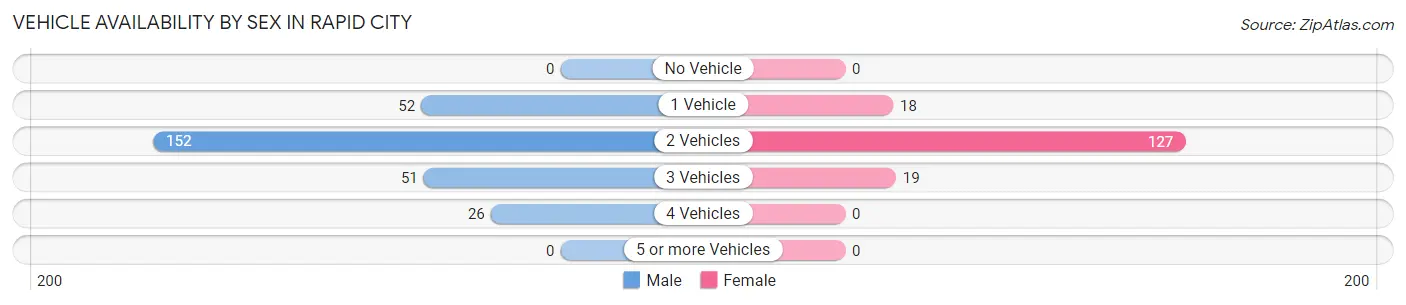
| Vehicles Available | Male | Female |
| No Vehicle | 0 (0.0%) | 0 (0.0%) |
| 1 Vehicle | 52 (18.5%) | 18 (11.0%) |
| 2 Vehicles | 152 (54.1%) | 127 (77.4%) |
| 3 Vehicles | 51 (18.1%) | 19 (11.6%) |
| 4 Vehicles | 26 (9.2%) | 0 (0.0%) |
| 5 or more Vehicles | 0 (0.0%) | 0 (0.0%) |
| Total | 281 (100.0%) | 164 (100.0%) |
Commute Time in Rapid City
The most frequently occuring commute durations in Rapid City are 10 to 14 minutes (98 commuters, 22.7%), 15 to 19 minutes (89 commuters, 20.6%), and 20 to 24 minutes (69 commuters, 16.0%).
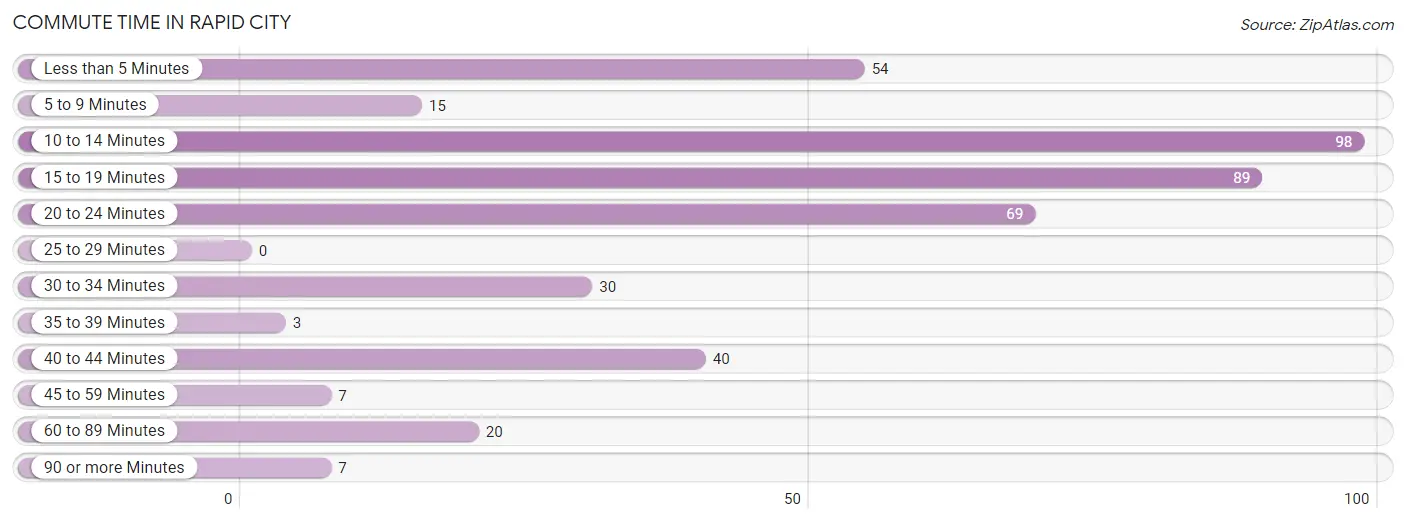
| Commute Time | # Commuters | % Commuters |
| Less than 5 Minutes | 54 | 12.5% |
| 5 to 9 Minutes | 15 | 3.5% |
| 10 to 14 Minutes | 98 | 22.7% |
| 15 to 19 Minutes | 89 | 20.6% |
| 20 to 24 Minutes | 69 | 16.0% |
| 25 to 29 Minutes | 0 | 0.0% |
| 30 to 34 Minutes | 30 | 6.9% |
| 35 to 39 Minutes | 3 | 0.7% |
| 40 to 44 Minutes | 40 | 9.3% |
| 45 to 59 Minutes | 7 | 1.6% |
| 60 to 89 Minutes | 20 | 4.6% |
| 90 or more Minutes | 7 | 1.6% |
Commute Time by Sex in Rapid City
The most common commute times in Rapid City are 20 to 24 minutes (59 commuters, 21.0%) for males and 10 to 14 minutes (52 commuters, 34.4%) for females.
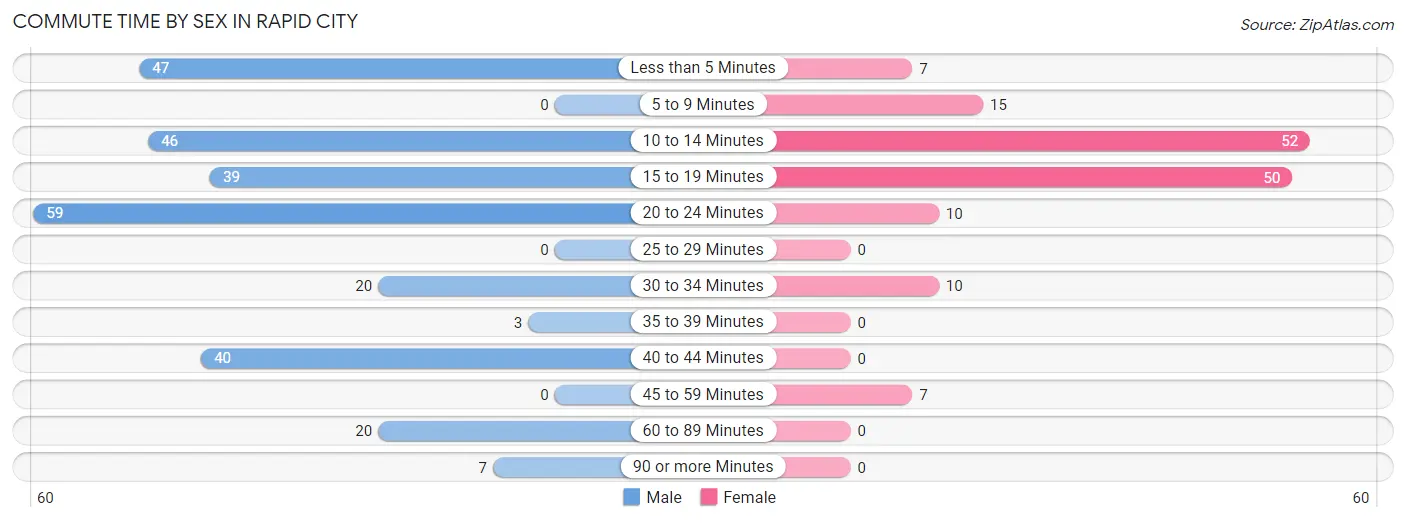
| Commute Time | Male | Female |
| Less than 5 Minutes | 47 (16.7%) | 7 (4.6%) |
| 5 to 9 Minutes | 0 (0.0%) | 15 (9.9%) |
| 10 to 14 Minutes | 46 (16.4%) | 52 (34.4%) |
| 15 to 19 Minutes | 39 (13.9%) | 50 (33.1%) |
| 20 to 24 Minutes | 59 (21.0%) | 10 (6.6%) |
| 25 to 29 Minutes | 0 (0.0%) | 0 (0.0%) |
| 30 to 34 Minutes | 20 (7.1%) | 10 (6.6%) |
| 35 to 39 Minutes | 3 (1.1%) | 0 (0.0%) |
| 40 to 44 Minutes | 40 (14.2%) | 0 (0.0%) |
| 45 to 59 Minutes | 0 (0.0%) | 7 (4.6%) |
| 60 to 89 Minutes | 20 (7.1%) | 0 (0.0%) |
| 90 or more Minutes | 7 (2.5%) | 0 (0.0%) |
Time of Departure to Work by Sex in Rapid City
The most frequent times of departure to work in Rapid City are 12:00 AM to 4:59 AM (93, 33.1%) for males and 6:00 AM to 6:29 AM (32, 21.2%) for females.
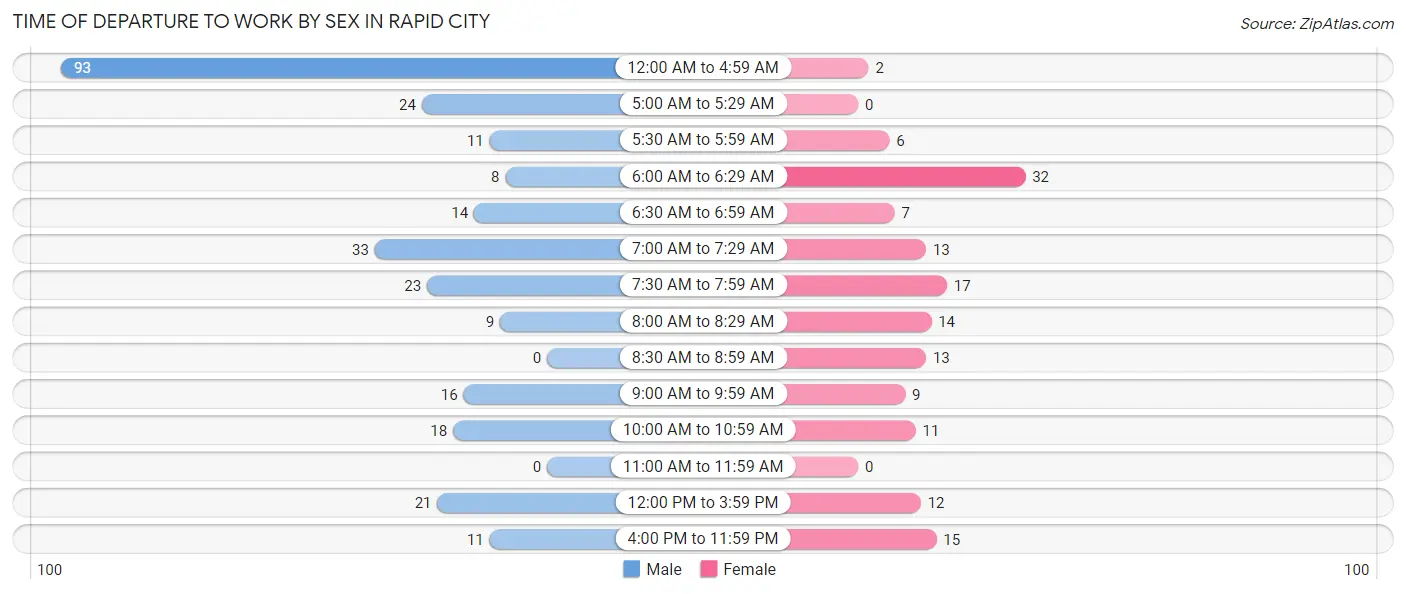
| Time of Departure | Male | Female |
| 12:00 AM to 4:59 AM | 93 (33.1%) | 2 (1.3%) |
| 5:00 AM to 5:29 AM | 24 (8.5%) | 0 (0.0%) |
| 5:30 AM to 5:59 AM | 11 (3.9%) | 6 (4.0%) |
| 6:00 AM to 6:29 AM | 8 (2.9%) | 32 (21.2%) |
| 6:30 AM to 6:59 AM | 14 (5.0%) | 7 (4.6%) |
| 7:00 AM to 7:29 AM | 33 (11.7%) | 13 (8.6%) |
| 7:30 AM to 7:59 AM | 23 (8.2%) | 17 (11.3%) |
| 8:00 AM to 8:29 AM | 9 (3.2%) | 14 (9.3%) |
| 8:30 AM to 8:59 AM | 0 (0.0%) | 13 (8.6%) |
| 9:00 AM to 9:59 AM | 16 (5.7%) | 9 (6.0%) |
| 10:00 AM to 10:59 AM | 18 (6.4%) | 11 (7.3%) |
| 11:00 AM to 11:59 AM | 0 (0.0%) | 0 (0.0%) |
| 12:00 PM to 3:59 PM | 21 (7.5%) | 12 (8.0%) |
| 4:00 PM to 11:59 PM | 11 (3.9%) | 15 (9.9%) |
| Total | 281 (100.0%) | 151 (100.0%) |
Housing Occupancy in Rapid City
Occupancy by Ownership in Rapid City
Of the total 542 dwellings in Rapid City, owner-occupied units account for 489 (90.2%), while renter-occupied units make up 53 (9.8%).
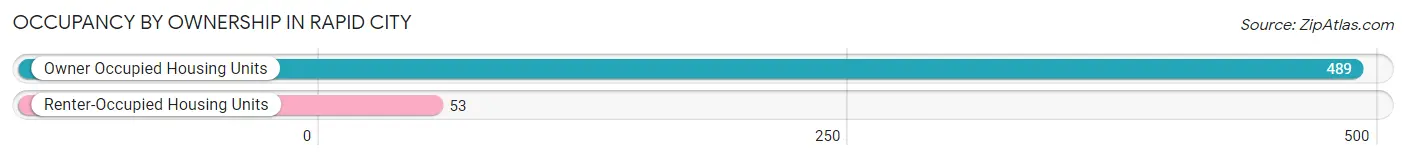
| Occupancy | # Housing Units | % Housing Units |
| Owner Occupied Housing Units | 489 | 90.2% |
| Renter-Occupied Housing Units | 53 | 9.8% |
| Total Occupied Housing Units | 542 | 100.0% |
Occupancy by Household Size in Rapid City
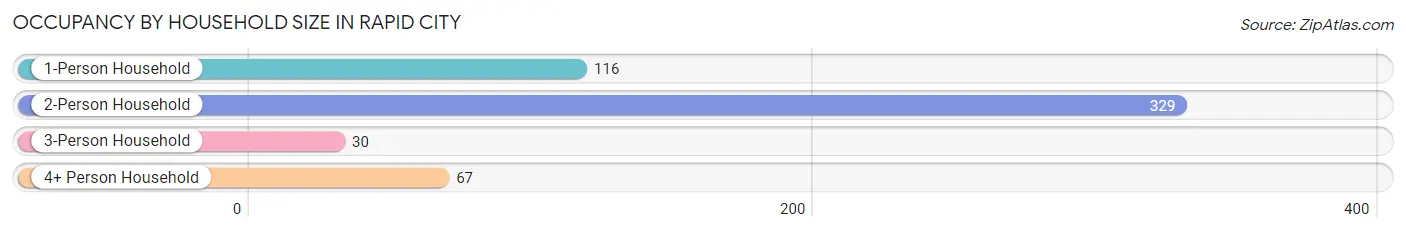
| Household Size | # Housing Units | % Housing Units |
| 1-Person Household | 116 | 21.4% |
| 2-Person Household | 329 | 60.7% |
| 3-Person Household | 30 | 5.5% |
| 4+ Person Household | 67 | 12.4% |
| Total Housing Units | 542 | 100.0% |
Occupancy by Ownership by Household Size in Rapid City
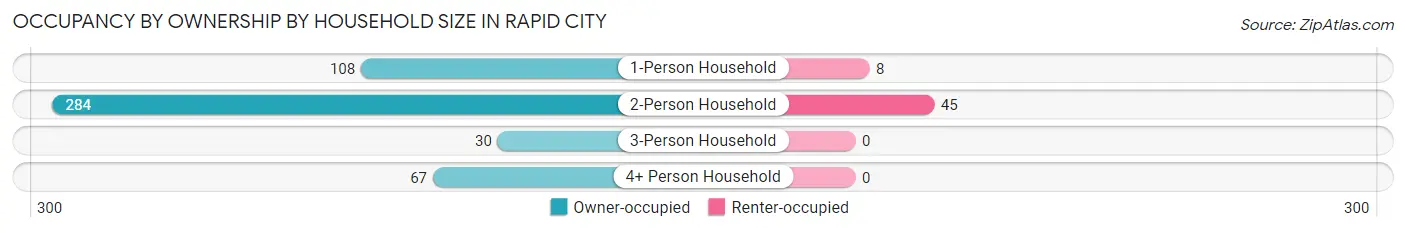
| Household Size | Owner-occupied | Renter-occupied |
| 1-Person Household | 108 (93.1%) | 8 (6.9%) |
| 2-Person Household | 284 (86.3%) | 45 (13.7%) |
| 3-Person Household | 30 (100.0%) | 0 (0.0%) |
| 4+ Person Household | 67 (100.0%) | 0 (0.0%) |
| Total Housing Units | 489 (90.2%) | 53 (9.8%) |
Occupancy by Educational Attainment in Rapid City
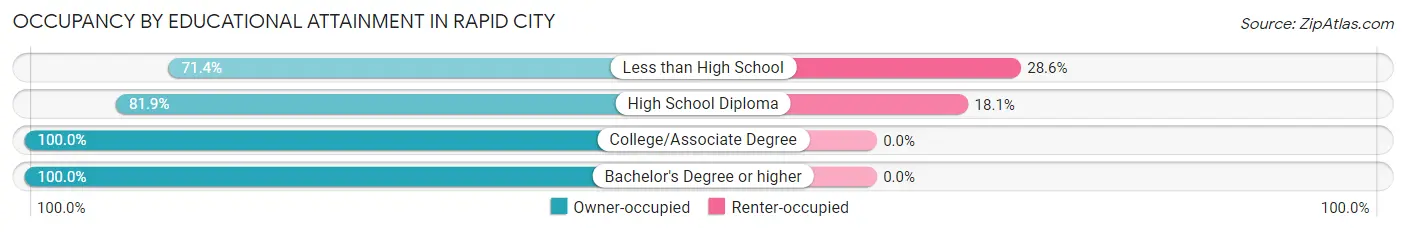
| Household Size | Owner-occupied | Renter-occupied |
| Less than High School | 30 (71.4%) | 12 (28.6%) |
| High School Diploma | 185 (81.9%) | 41 (18.1%) |
| College/Associate Degree | 181 (100.0%) | 0 (0.0%) |
| Bachelor's Degree or higher | 93 (100.0%) | 0 (0.0%) |
Occupancy by Age of Householder in Rapid City
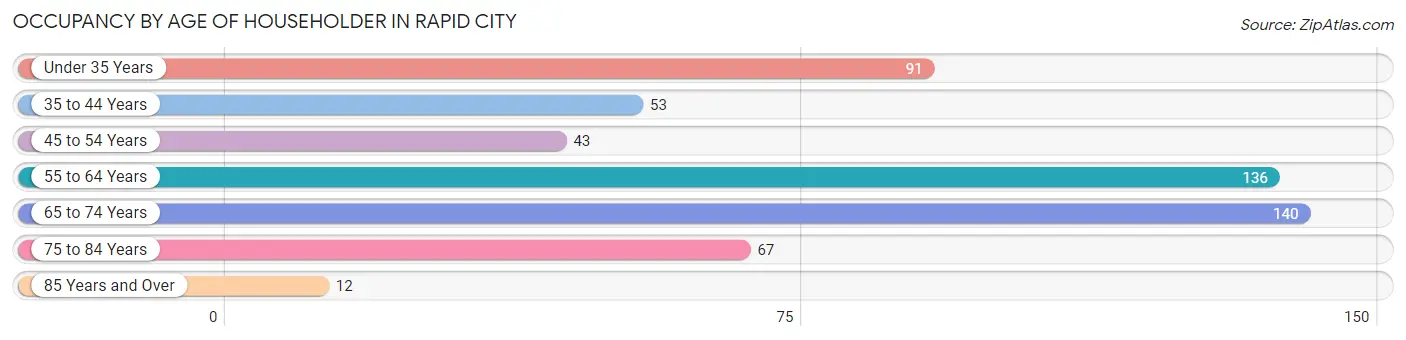
| Age Bracket | # Households | % Households |
| Under 35 Years | 91 | 16.8% |
| 35 to 44 Years | 53 | 9.8% |
| 45 to 54 Years | 43 | 7.9% |
| 55 to 64 Years | 136 | 25.1% |
| 65 to 74 Years | 140 | 25.8% |
| 75 to 84 Years | 67 | 12.4% |
| 85 Years and Over | 12 | 2.2% |
| Total | 542 | 100.0% |
Housing Finances in Rapid City
Median Income by Occupancy in Rapid City
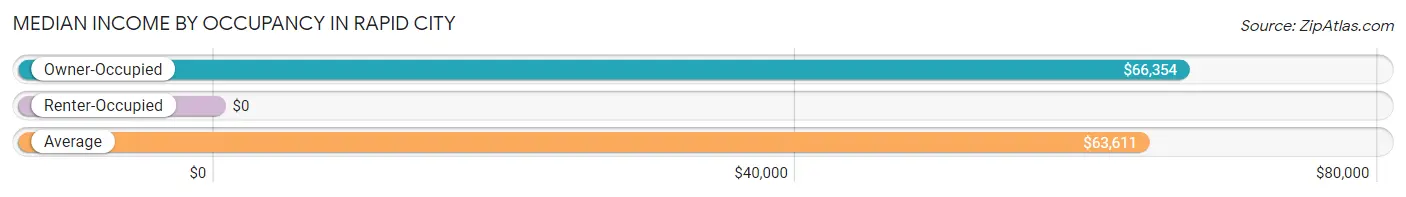
| Occupancy Type | # Households | Median Income |
| Owner-Occupied | 489 (90.2%) | $66,354 |
| Renter-Occupied | 53 (9.8%) | $0 |
| Average | 542 (100.0%) | $63,611 |
Occupancy by Householder Income Bracket in Rapid City
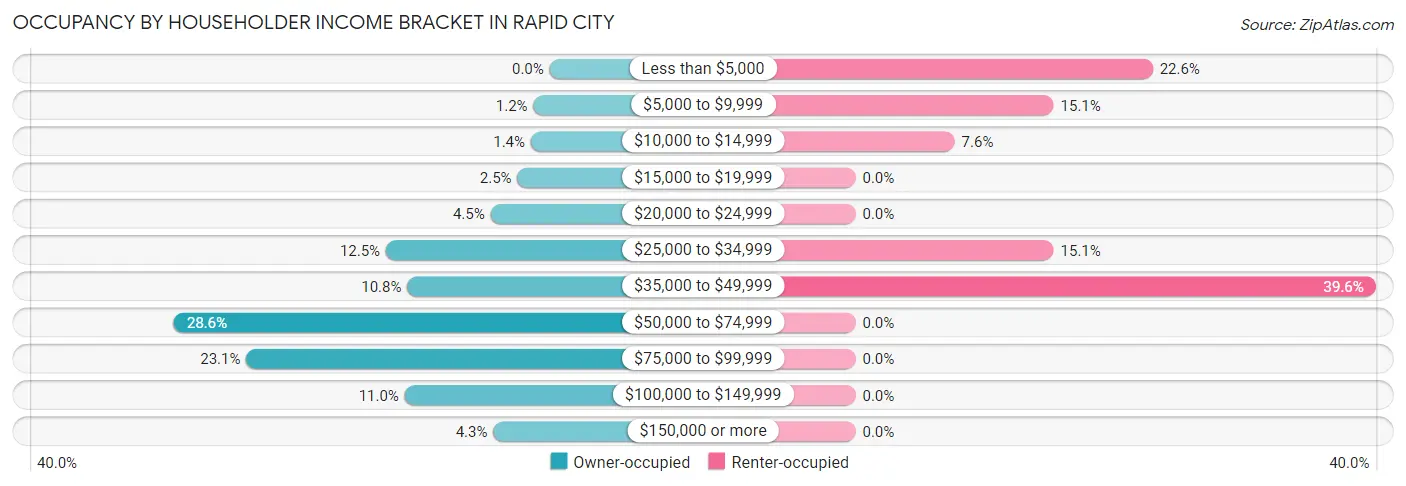
| Income Bracket | Owner-occupied | Renter-occupied |
| Less than $5,000 | 0 (0.0%) | 12 (22.6%) |
| $5,000 to $9,999 | 6 (1.2%) | 8 (15.1%) |
| $10,000 to $14,999 | 7 (1.4%) | 4 (7.5%) |
| $15,000 to $19,999 | 12 (2.5%) | 0 (0.0%) |
| $20,000 to $24,999 | 22 (4.5%) | 0 (0.0%) |
| $25,000 to $34,999 | 61 (12.5%) | 8 (15.1%) |
| $35,000 to $49,999 | 53 (10.8%) | 21 (39.6%) |
| $50,000 to $74,999 | 140 (28.6%) | 0 (0.0%) |
| $75,000 to $99,999 | 113 (23.1%) | 0 (0.0%) |
| $100,000 to $149,999 | 54 (11.0%) | 0 (0.0%) |
| $150,000 or more | 21 (4.3%) | 0 (0.0%) |
| Total | 489 (100.0%) | 53 (100.0%) |
Monthly Housing Cost Tiers in Rapid City
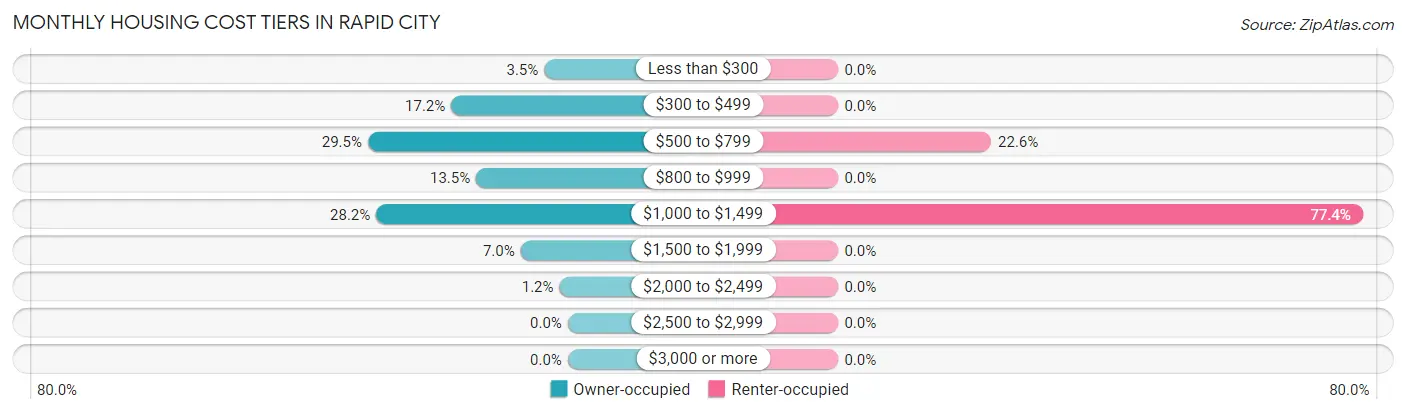
| Monthly Cost | Owner-occupied | Renter-occupied |
| Less than $300 | 17 (3.5%) | 0 (0.0%) |
| $300 to $499 | 84 (17.2%) | 0 (0.0%) |
| $500 to $799 | 144 (29.4%) | 12 (22.6%) |
| $800 to $999 | 66 (13.5%) | 0 (0.0%) |
| $1,000 to $1,499 | 138 (28.2%) | 41 (77.4%) |
| $1,500 to $1,999 | 34 (7.0%) | 0 (0.0%) |
| $2,000 to $2,499 | 6 (1.2%) | 0 (0.0%) |
| $2,500 to $2,999 | 0 (0.0%) | 0 (0.0%) |
| $3,000 or more | 0 (0.0%) | 0 (0.0%) |
| Total | 489 (100.0%) | 53 (100.0%) |
Physical Housing Characteristics in Rapid City
Housing Structures in Rapid City
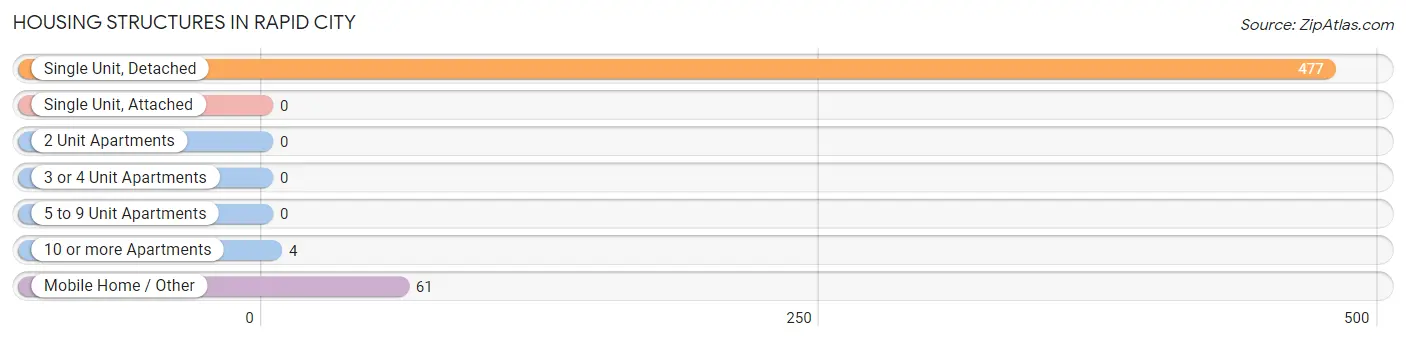
| Structure Type | # Housing Units | % Housing Units |
| Single Unit, Detached | 477 | 88.0% |
| Single Unit, Attached | 0 | 0.0% |
| 2 Unit Apartments | 0 | 0.0% |
| 3 or 4 Unit Apartments | 0 | 0.0% |
| 5 to 9 Unit Apartments | 0 | 0.0% |
| 10 or more Apartments | 4 | 0.7% |
| Mobile Home / Other | 61 | 11.3% |
| Total | 542 | 100.0% |
Housing Structures by Occupancy in Rapid City
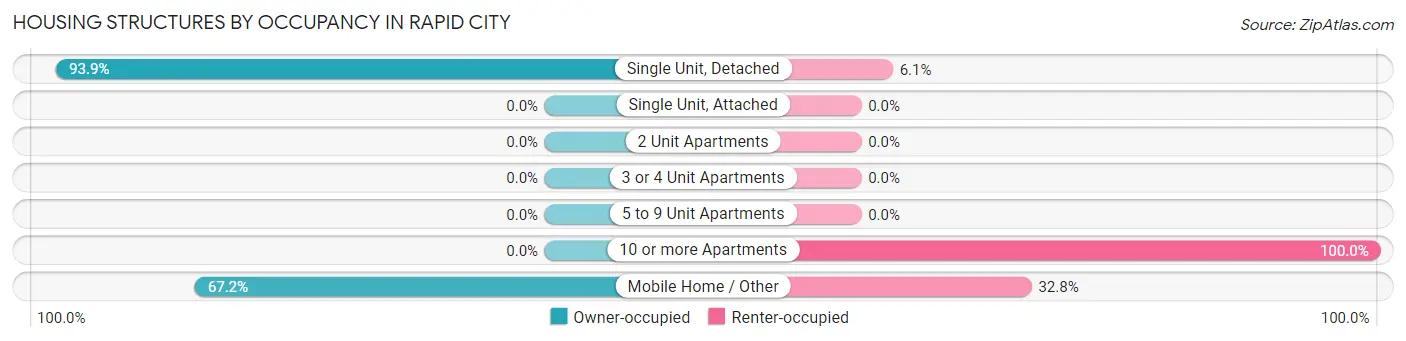
| Structure Type | Owner-occupied | Renter-occupied |
| Single Unit, Detached | 448 (93.9%) | 29 (6.1%) |
| Single Unit, Attached | 0 (0.0%) | 0 (0.0%) |
| 2 Unit Apartments | 0 (0.0%) | 0 (0.0%) |
| 3 or 4 Unit Apartments | 0 (0.0%) | 0 (0.0%) |
| 5 to 9 Unit Apartments | 0 (0.0%) | 0 (0.0%) |
| 10 or more Apartments | 0 (0.0%) | 4 (100.0%) |
| Mobile Home / Other | 41 (67.2%) | 20 (32.8%) |
| Total | 489 (90.2%) | 53 (9.8%) |
Housing Structures by Number of Rooms in Rapid City
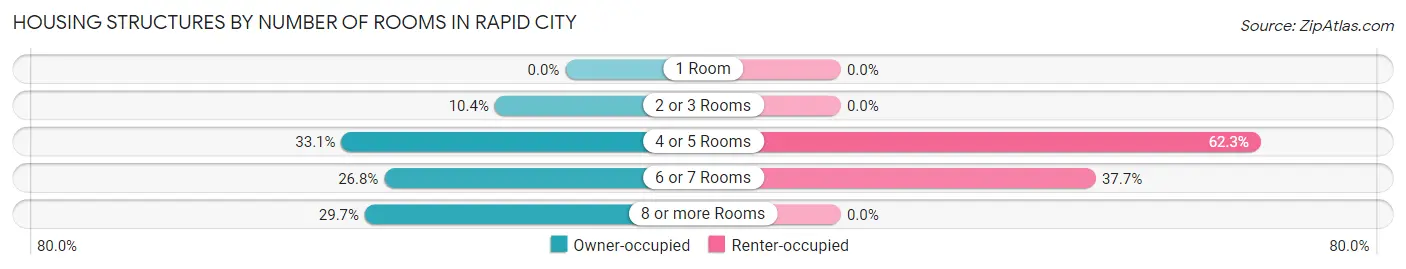
| Number of Rooms | Owner-occupied | Renter-occupied |
| 1 Room | 0 (0.0%) | 0 (0.0%) |
| 2 or 3 Rooms | 51 (10.4%) | 0 (0.0%) |
| 4 or 5 Rooms | 162 (33.1%) | 33 (62.3%) |
| 6 or 7 Rooms | 131 (26.8%) | 20 (37.7%) |
| 8 or more Rooms | 145 (29.6%) | 0 (0.0%) |
| Total | 489 (100.0%) | 53 (100.0%) |
Housing Structure by Heating Type in Rapid City
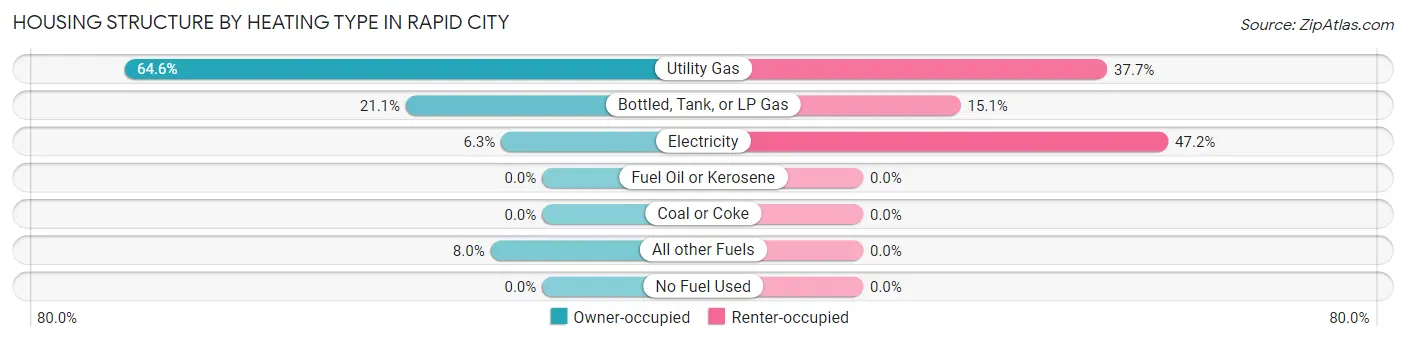
| Heating Type | Owner-occupied | Renter-occupied |
| Utility Gas | 316 (64.6%) | 20 (37.7%) |
| Bottled, Tank, or LP Gas | 103 (21.1%) | 8 (15.1%) |
| Electricity | 31 (6.3%) | 25 (47.2%) |
| Fuel Oil or Kerosene | 0 (0.0%) | 0 (0.0%) |
| Coal or Coke | 0 (0.0%) | 0 (0.0%) |
| All other Fuels | 39 (8.0%) | 0 (0.0%) |
| No Fuel Used | 0 (0.0%) | 0 (0.0%) |
| Total | 489 (100.0%) | 53 (100.0%) |
Household Vehicle Usage in Rapid City
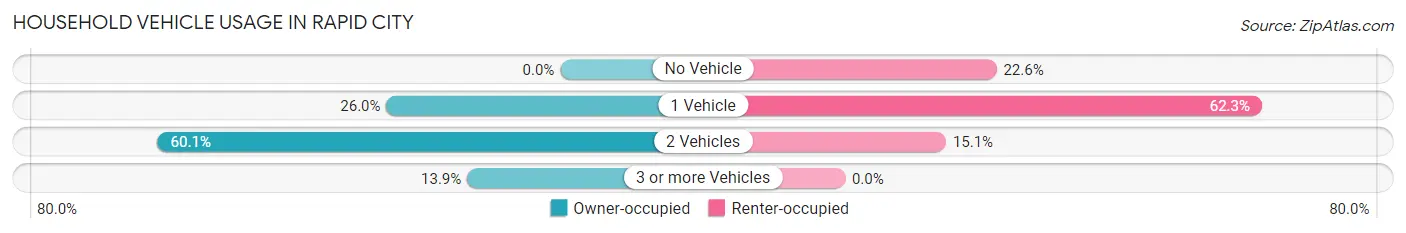
| Vehicles per Household | Owner-occupied | Renter-occupied |
| No Vehicle | 0 (0.0%) | 12 (22.6%) |
| 1 Vehicle | 127 (26.0%) | 33 (62.3%) |
| 2 Vehicles | 294 (60.1%) | 8 (15.1%) |
| 3 or more Vehicles | 68 (13.9%) | 0 (0.0%) |
| Total | 489 (100.0%) | 53 (100.0%) |
Real Estate & Mortgages in Rapid City
Real Estate and Mortgage Overview in Rapid City
| Characteristic | Without Mortgage | With Mortgage |
| Housing Units | 214 | 275 |
| Median Property Value | $179,300 | $193,800 |
| Median Household Income | $57,083 | $16 |
| Monthly Housing Costs | $514 | $0 |
| Real Estate Taxes | $1,800 | $6 |
Property Value by Mortgage Status in Rapid City
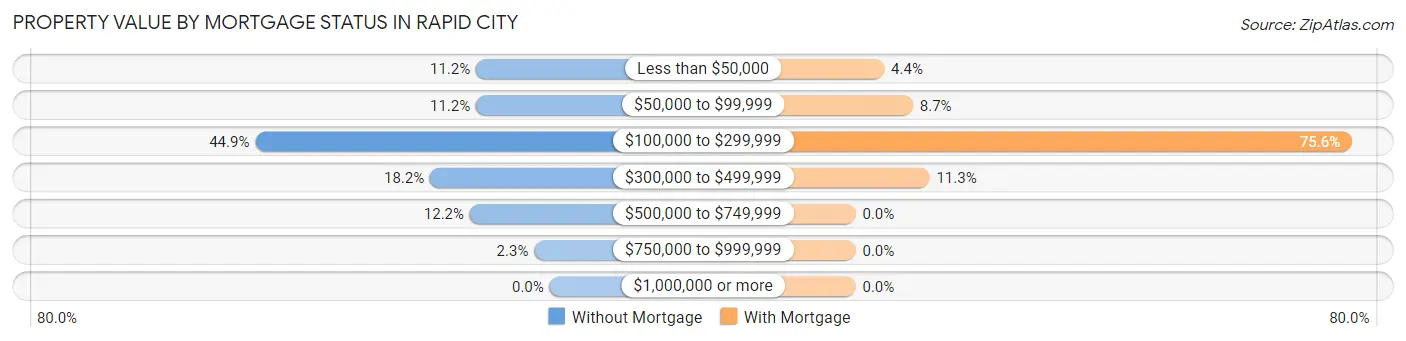
| Property Value | Without Mortgage | With Mortgage |
| Less than $50,000 | 24 (11.2%) | 12 (4.4%) |
| $50,000 to $99,999 | 24 (11.2%) | 24 (8.7%) |
| $100,000 to $299,999 | 96 (44.9%) | 208 (75.6%) |
| $300,000 to $499,999 | 39 (18.2%) | 31 (11.3%) |
| $500,000 to $749,999 | 26 (12.1%) | 0 (0.0%) |
| $750,000 to $999,999 | 5 (2.3%) | 0 (0.0%) |
| $1,000,000 or more | 0 (0.0%) | 0 (0.0%) |
| Total | 214 (100.0%) | 275 (100.0%) |
Household Income by Mortgage Status in Rapid City
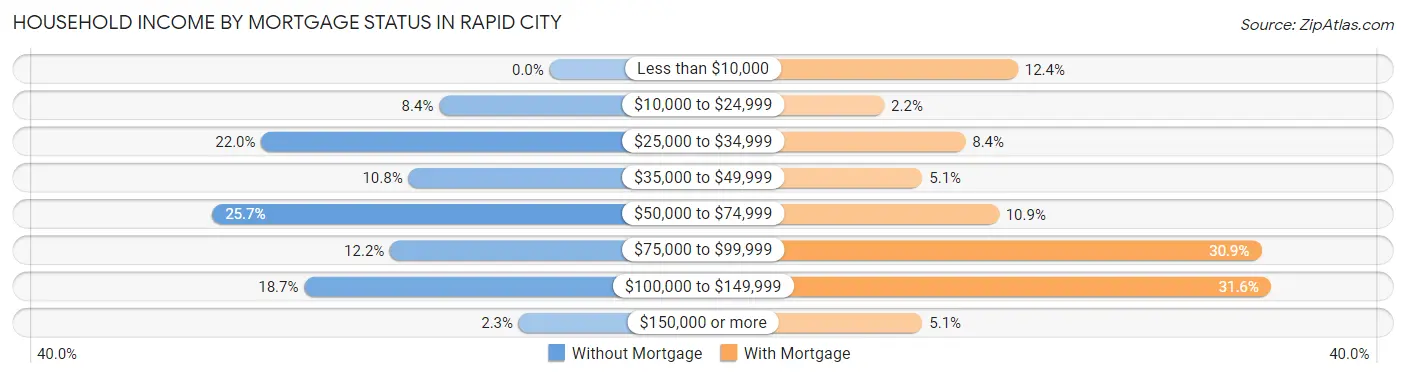
| Household Income | Without Mortgage | With Mortgage |
| Less than $10,000 | 0 (0.0%) | 34 (12.4%) |
| $10,000 to $24,999 | 18 (8.4%) | 6 (2.2%) |
| $25,000 to $34,999 | 47 (22.0%) | 23 (8.4%) |
| $35,000 to $49,999 | 23 (10.7%) | 14 (5.1%) |
| $50,000 to $74,999 | 55 (25.7%) | 30 (10.9%) |
| $75,000 to $99,999 | 26 (12.1%) | 85 (30.9%) |
| $100,000 to $149,999 | 40 (18.7%) | 87 (31.6%) |
| $150,000 or more | 5 (2.3%) | 14 (5.1%) |
| Total | 214 (100.0%) | 275 (100.0%) |
Property Value to Household Income Ratio in Rapid City
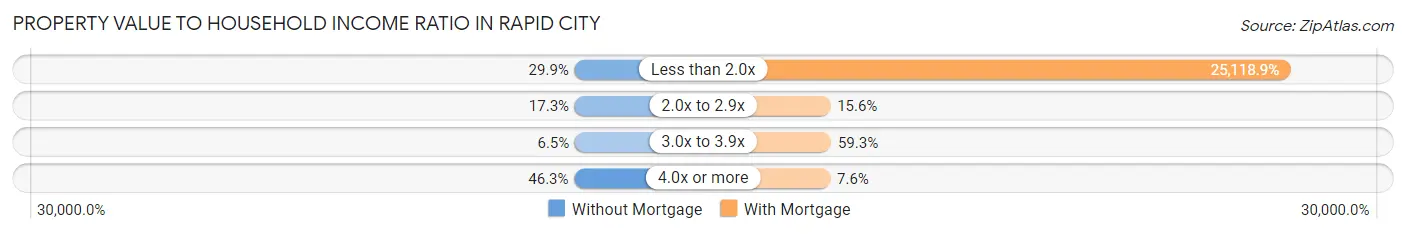
| Value-to-Income Ratio | Without Mortgage | With Mortgage |
| Less than 2.0x | 64 (29.9%) | 69,077 (25,118.9%) |
| 2.0x to 2.9x | 37 (17.3%) | 43 (15.6%) |
| 3.0x to 3.9x | 14 (6.5%) | 163 (59.3%) |
| 4.0x or more | 99 (46.3%) | 21 (7.6%) |
| Total | 214 (100.0%) | 275 (100.0%) |
Real Estate Taxes by Mortgage Status in Rapid City
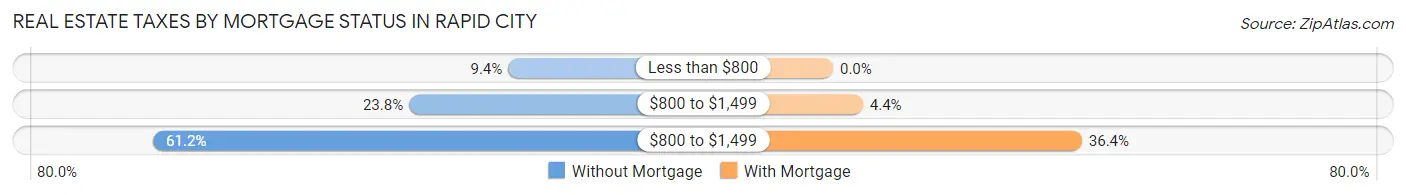
| Property Taxes | Without Mortgage | With Mortgage |
| Less than $800 | 20 (9.3%) | 0 (0.0%) |
| $800 to $1,499 | 51 (23.8%) | 12 (4.4%) |
| $800 to $1,499 | 131 (61.2%) | 100 (36.4%) |
| Total | 214 (100.0%) | 275 (100.0%) |
Health & Disability in Rapid City
Health Insurance Coverage by Age in Rapid City
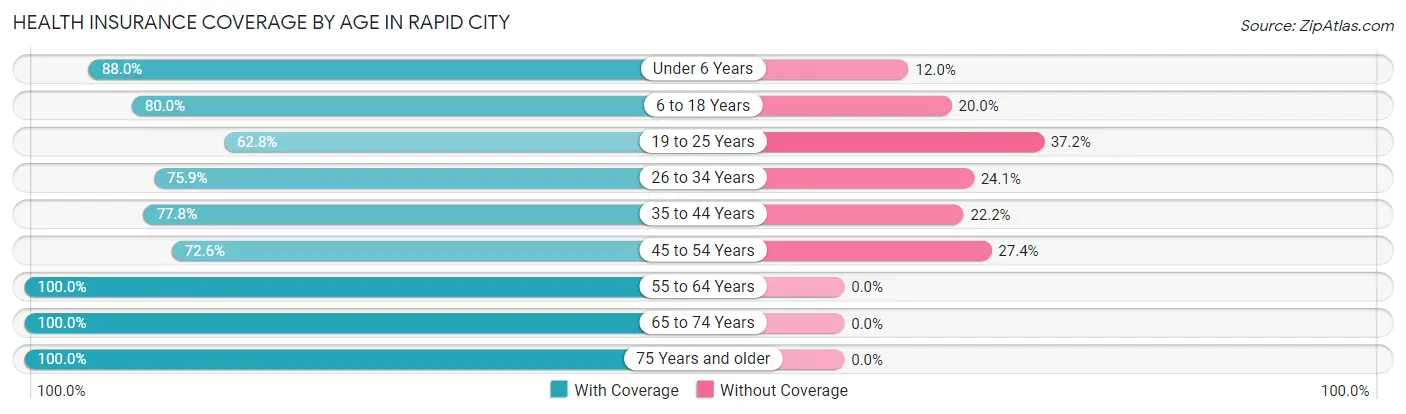
| Age Bracket | With Coverage | Without Coverage |
| Under 6 Years | 66 (88.0%) | 9 (12.0%) |
| 6 to 18 Years | 112 (80.0%) | 28 (20.0%) |
| 19 to 25 Years | 49 (62.8%) | 29 (37.2%) |
| 26 to 34 Years | 66 (75.9%) | 21 (24.1%) |
| 35 to 44 Years | 84 (77.8%) | 24 (22.2%) |
| 45 to 54 Years | 82 (72.6%) | 31 (27.4%) |
| 55 to 64 Years | 223 (100.0%) | 0 (0.0%) |
| 65 to 74 Years | 252 (100.0%) | 0 (0.0%) |
| 75 Years and older | 113 (100.0%) | 0 (0.0%) |
| Total | 1,047 (88.1%) | 142 (11.9%) |
Health Insurance Coverage by Citizenship Status in Rapid City
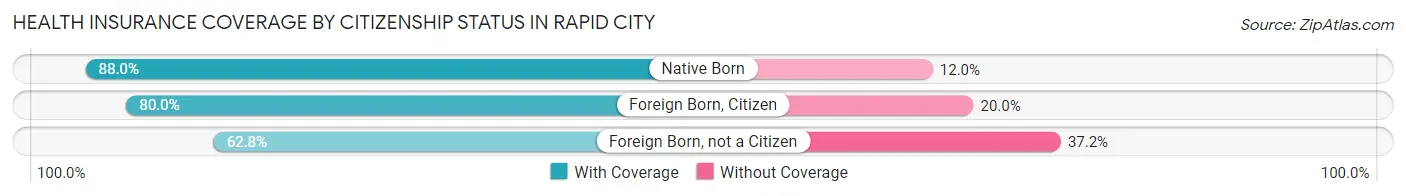
| Citizenship Status | With Coverage | Without Coverage |
| Native Born | 66 (88.0%) | 9 (12.0%) |
| Foreign Born, Citizen | 112 (80.0%) | 28 (20.0%) |
| Foreign Born, not a Citizen | 49 (62.8%) | 29 (37.2%) |
Health Insurance Coverage by Household Income in Rapid City
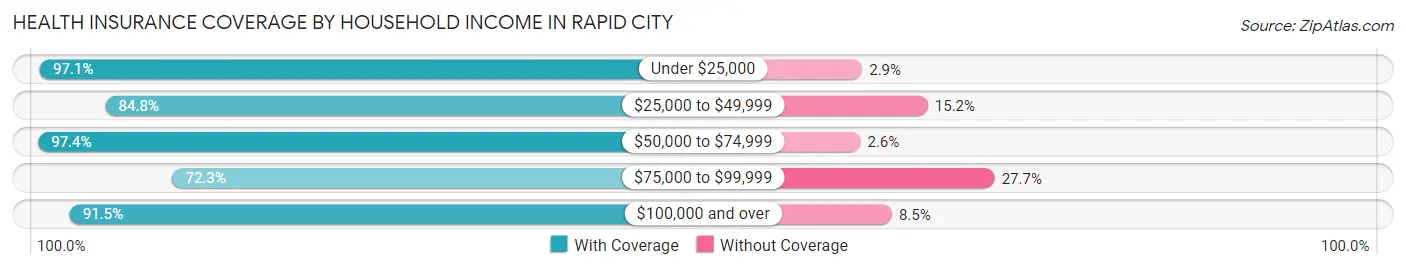
| Household Income | With Coverage | Without Coverage |
| Under $25,000 | 134 (97.1%) | 4 (2.9%) |
| $25,000 to $49,999 | 201 (84.8%) | 36 (15.2%) |
| $50,000 to $74,999 | 303 (97.4%) | 8 (2.6%) |
| $75,000 to $99,999 | 193 (72.3%) | 74 (27.7%) |
| $100,000 and over | 216 (91.5%) | 20 (8.5%) |
Public vs Private Health Insurance Coverage by Age in Rapid City
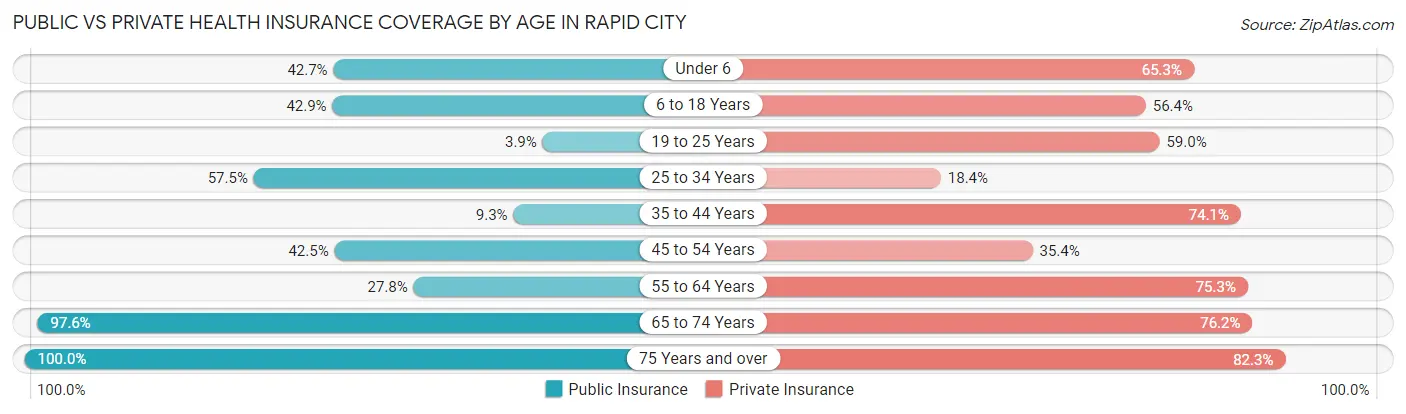
| Age Bracket | Public Insurance | Private Insurance |
| Under 6 | 32 (42.7%) | 49 (65.3%) |
| 6 to 18 Years | 60 (42.9%) | 79 (56.4%) |
| 19 to 25 Years | 3 (3.8%) | 46 (59.0%) |
| 25 to 34 Years | 50 (57.5%) | 16 (18.4%) |
| 35 to 44 Years | 10 (9.3%) | 80 (74.1%) |
| 45 to 54 Years | 48 (42.5%) | 40 (35.4%) |
| 55 to 64 Years | 62 (27.8%) | 168 (75.3%) |
| 65 to 74 Years | 246 (97.6%) | 192 (76.2%) |
| 75 Years and over | 113 (100.0%) | 93 (82.3%) |
| Total | 624 (52.5%) | 763 (64.2%) |
Disability Status by Sex by Age in Rapid City
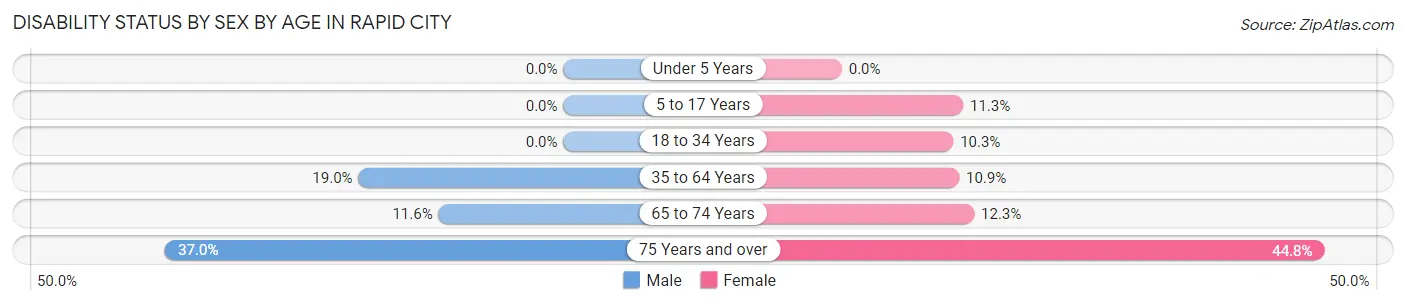
| Age Bracket | Male | Female |
| Under 5 Years | 0 (0.0%) | 0 (0.0%) |
| 5 to 17 Years | 0 (0.0%) | 9 (11.3%) |
| 18 to 34 Years | 0 (0.0%) | 9 (10.3%) |
| 35 to 64 Years | 39 (19.0%) | 26 (10.9%) |
| 65 to 74 Years | 16 (11.6%) | 14 (12.3%) |
| 75 Years and over | 17 (37.0%) | 30 (44.8%) |
Disability Class by Sex by Age in Rapid City
Disability Class: Hearing Difficulty
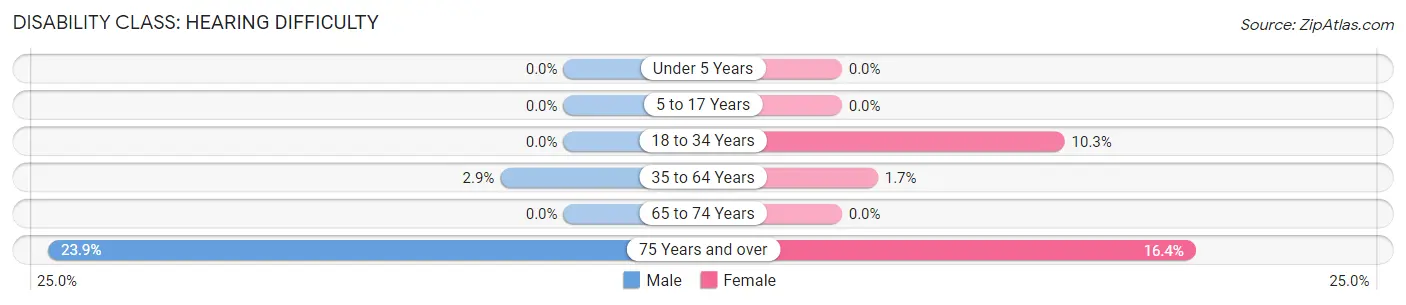
| Age Bracket | Male | Female |
| Under 5 Years | 0 (0.0%) | 0 (0.0%) |
| 5 to 17 Years | 0 (0.0%) | 0 (0.0%) |
| 18 to 34 Years | 0 (0.0%) | 9 (10.3%) |
| 35 to 64 Years | 6 (2.9%) | 4 (1.7%) |
| 65 to 74 Years | 0 (0.0%) | 0 (0.0%) |
| 75 Years and over | 11 (23.9%) | 11 (16.4%) |
Disability Class: Vision Difficulty
| Age Bracket | Male | Female |
| Under 5 Years | 0 (0.0%) | 0 (0.0%) |
| 5 to 17 Years | 0 (0.0%) | 0 (0.0%) |
| 18 to 34 Years | 0 (0.0%) | 0 (0.0%) |
| 35 to 64 Years | 0 (0.0%) | 0 (0.0%) |
| 65 to 74 Years | 0 (0.0%) | 0 (0.0%) |
| 75 Years and over | 0 (0.0%) | 0 (0.0%) |
Disability Class: Cognitive Difficulty
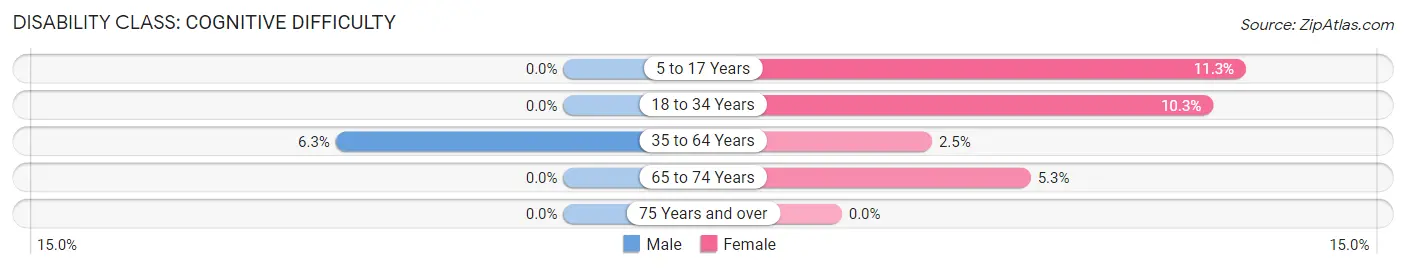
| Age Bracket | Male | Female |
| 5 to 17 Years | 0 (0.0%) | 9 (11.3%) |
| 18 to 34 Years | 0 (0.0%) | 9 (10.3%) |
| 35 to 64 Years | 13 (6.3%) | 6 (2.5%) |
| 65 to 74 Years | 0 (0.0%) | 6 (5.3%) |
| 75 Years and over | 0 (0.0%) | 0 (0.0%) |
Disability Class: Ambulatory Difficulty
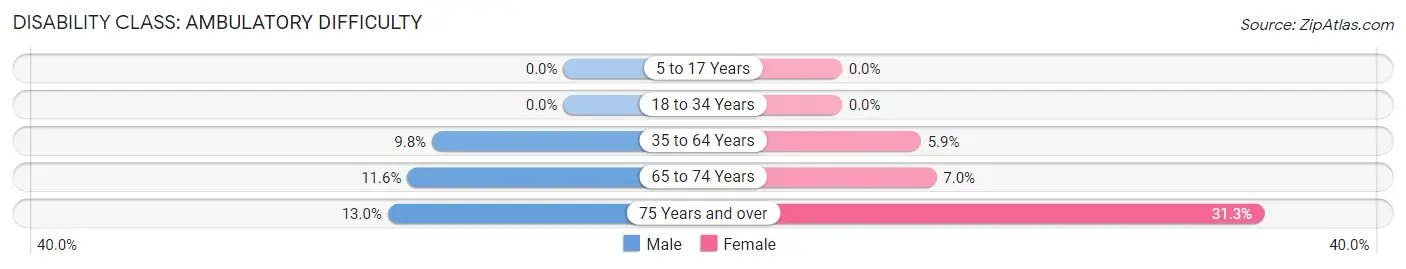
| Age Bracket | Male | Female |
| 5 to 17 Years | 0 (0.0%) | 0 (0.0%) |
| 18 to 34 Years | 0 (0.0%) | 0 (0.0%) |
| 35 to 64 Years | 20 (9.8%) | 14 (5.9%) |
| 65 to 74 Years | 16 (11.6%) | 8 (7.0%) |
| 75 Years and over | 6 (13.0%) | 21 (31.3%) |
Disability Class: Self-Care Difficulty
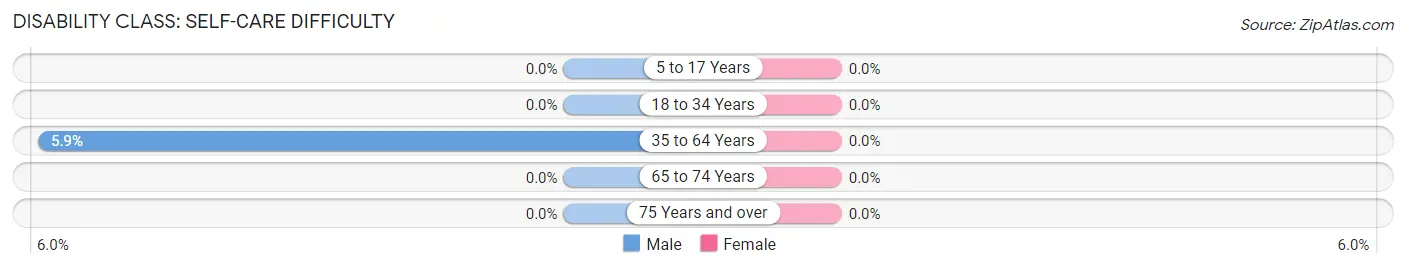
| Age Bracket | Male | Female |
| 5 to 17 Years | 0 (0.0%) | 0 (0.0%) |
| 18 to 34 Years | 0 (0.0%) | 0 (0.0%) |
| 35 to 64 Years | 12 (5.9%) | 0 (0.0%) |
| 65 to 74 Years | 0 (0.0%) | 0 (0.0%) |
| 75 Years and over | 0 (0.0%) | 0 (0.0%) |
Technology Access in Rapid City
Computing Device Access in Rapid City
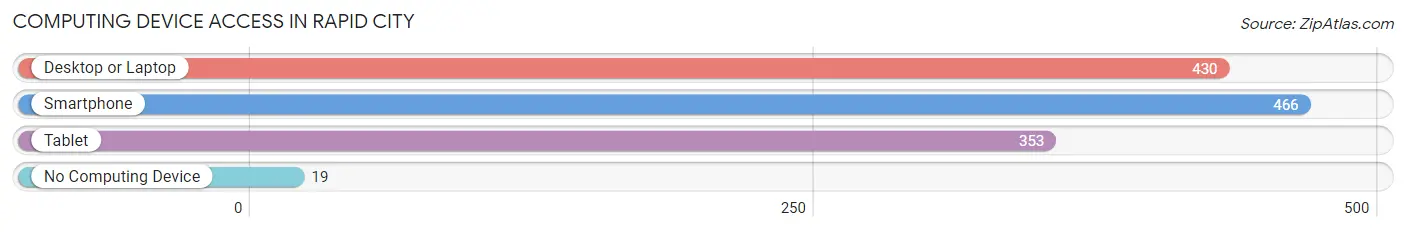
| Device Type | # Households | % Households |
| Desktop or Laptop | 430 | 79.3% |
| Smartphone | 466 | 86.0% |
| Tablet | 353 | 65.1% |
| No Computing Device | 19 | 3.5% |
| Total | 542 | 100.0% |
Internet Access in Rapid City
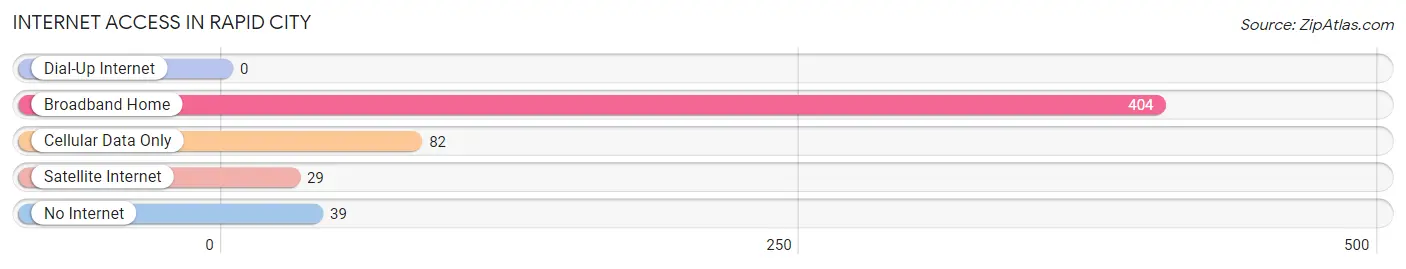
| Internet Type | # Households | % Households |
| Dial-Up Internet | 0 | 0.0% |
| Broadband Home | 404 | 74.5% |
| Cellular Data Only | 82 | 15.1% |
| Satellite Internet | 29 | 5.3% |
| No Internet | 39 | 7.2% |
| Total | 542 | 100.0% |
Rapid City Summary
Rapid City, Michigan is a small city located in the Upper Peninsula of Michigan. It is situated in the center of the Upper Peninsula, and is the county seat of Delta County. The city is located on the shores of Lake Michigan, and is home to a population of approximately 2,000 people.
History
Rapid City was founded in 1871 by a group of settlers from Wisconsin. The city was named after the nearby rapids in the Menominee River. The city was incorporated in 1887, and was the first city in Delta County to be incorporated.
The city was initially a lumber town, and the lumber industry was the main source of employment for the city's residents. The lumber industry was the primary source of employment until the early 1900s, when the city began to diversify its economy.
The city experienced a period of growth in the early 1900s, and the population increased from 1,000 in 1900 to 2,000 in 1910. The city continued to grow throughout the 20th century, and the population reached 4,000 in 2000.
Geography
Rapid City is located in the Upper Peninsula of Michigan, and is situated in the center of the Upper Peninsula. The city is located on the shores of Lake Michigan, and is bordered by the Menominee River to the north and the Escanaba River to the south.
The city has a total area of 2.2 square miles, and is located at an elevation of 645 feet above sea level. The city has a humid continental climate, with cold winters and warm summers.
Economy
The economy of Rapid City is largely based on tourism and manufacturing. The city is home to several tourist attractions, including the Rapid River Rapids, a popular whitewater rafting destination. The city is also home to several manufacturing companies, including a paper mill and a furniture factory.
The city is also home to several retail stores, restaurants, and other businesses. The city is served by the Delta County Airport, which provides air service to the city and the surrounding area.
Demographics
As of the 2010 census, the population of Rapid City was 2,000. The racial makeup of the city was 97.2% White, 0.7% African American, 0.3% Native American, 0.2% Asian, 0.1% Pacific Islander, 0.2% from other races, and 1.3% from two or more races. Hispanic or Latino of any race were 1.3% of the population.
The median income for a household in the city was $37,500, and the median income for a family was $45,000. The per capita income for the city was $19,000. About 11.2% of families and 14.2% of the population were below the poverty line, including 18.2% of those under age 18 and 8.2% of those age 65 or over.
Conclusion
Rapid City, Michigan is a small city located in the Upper Peninsula of Michigan. It is situated in the center of the Upper Peninsula, and is the county seat of Delta County. The city is located on the shores of Lake Michigan, and is home to a population of approximately 2,000 people. The economy of Rapid City is largely based on tourism and manufacturing, and the city is home to several tourist attractions and manufacturing companies. The racial makeup of the city is predominantly White, and the median income for a household in the city is $37,500.
Common Questions
What is Per Capita Income in Rapid City?
Per Capita income in Rapid City is $29,801.
What is the Median Family Income in Rapid City?
Median Family Income in Rapid City is $68,804.
What is the Median Household income in Rapid City?
Median Household Income in Rapid City is $63,611.
What is Income or Wage Gap in Rapid City?
Income or Wage Gap in Rapid City is 49.0%.
Women in Rapid City earn 51.0 cents for every dollar earned by a man.
What is Inequality or Gini Index in Rapid City?
Inequality or Gini Index in Rapid City is 0.33.
What is the Total Population of Rapid City?
Total Population of Rapid City is 1,196.
What is the Total Male Population of Rapid City?
Total Male Population of Rapid City is 558.
What is the Total Female Population of Rapid City?
Total Female Population of Rapid City is 638.
What is the Ratio of Males per 100 Females in Rapid City?
There are 87.46 Males per 100 Females in Rapid City.
What is the Ratio of Females per 100 Males in Rapid City?
There are 114.34 Females per 100 Males in Rapid City.
What is the Median Population Age in Rapid City?
Median Population Age in Rapid City is 54.6 Years.
What is the Average Family Size in Rapid City
Average Family Size in Rapid City is 2.6 People.
What is the Average Household Size in Rapid City
Average Household Size in Rapid City is 2.2 People.
How Large is the Labor Force in Rapid City?
There are 504 People in the Labor Forcein in Rapid City.
What is the Percentage of People in the Labor Force in Rapid City?
50.0% of People are in the Labor Force in Rapid City.
What is the Unemployment Rate in Rapid City?
Unemployment Rate in Rapid City is 5.0%.