Onekama, MI Map & Demographics
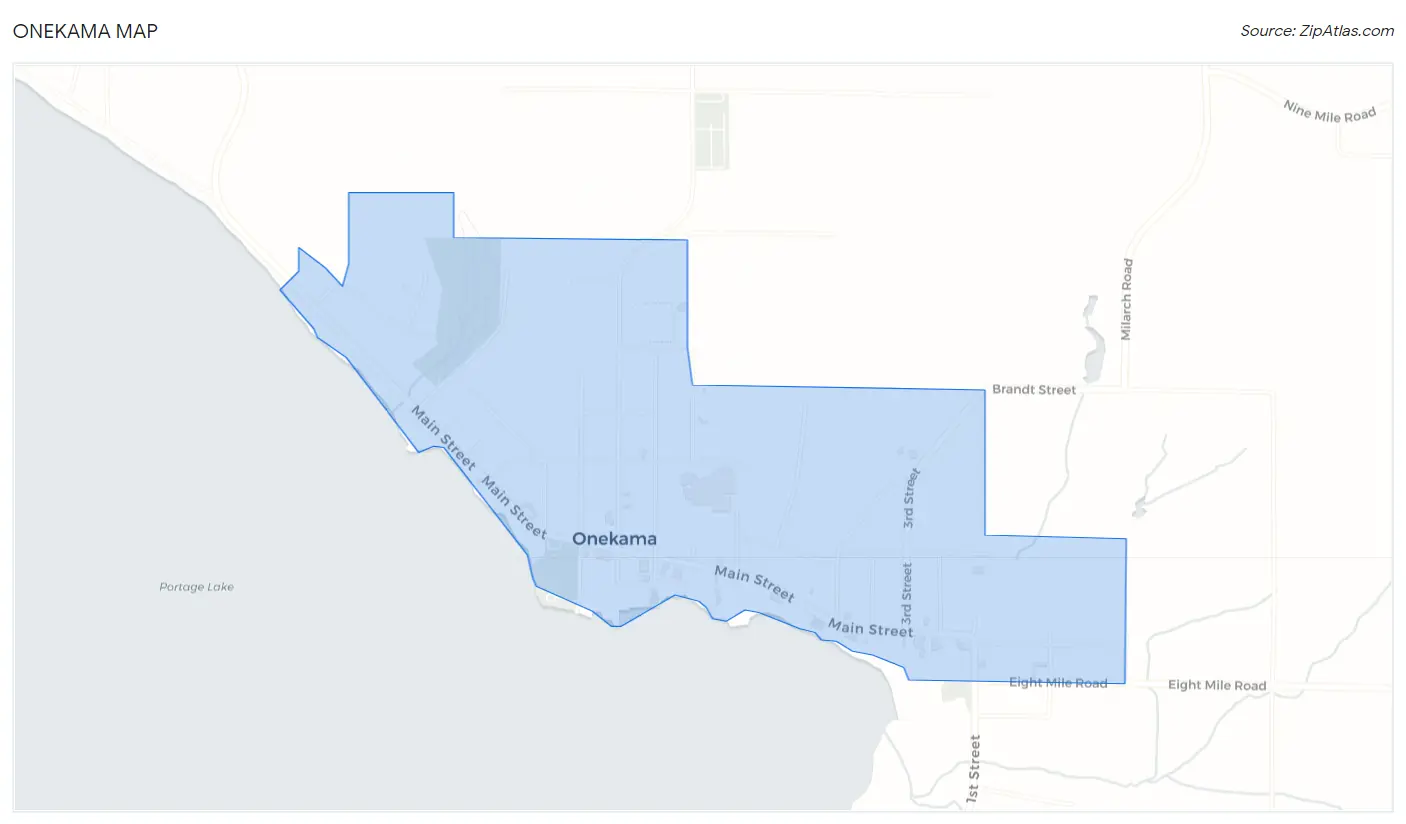
Onekama Map
Onekama Overview
$39,931
PER CAPITA INCOME
$99,205
AVG FAMILY INCOME
$50,417
AVG HOUSEHOLD INCOME
20.1%
WAGE / INCOME GAP [ % ]
79.9¢/ $1
WAGE / INCOME GAP [ $ ]
0.50
INEQUALITY / GINI INDEX
347
TOTAL POPULATION
135
MALE POPULATION
212
FEMALE POPULATION
63.68
MALES / 100 FEMALES
157.04
FEMALES / 100 MALES
54.6
MEDIAN AGE
2.9
AVG FAMILY SIZE
2.1
AVG HOUSEHOLD SIZE
166
LABOR FORCE [ PEOPLE ]
55.5%
PERCENT IN LABOR FORCE
Onekama Zip Codes
Onekama Area Codes
Income in Onekama
Income Overview in Onekama
Per Capita Income in Onekama is $39,931, while median incomes of families and households are $99,205 and $50,417 respectively.
| Characteristic | Number | Measure |
| Per Capita Income | 347 | $39,931 |
| Median Family Income | 89 | $99,205 |
| Mean Family Income | 89 | $101,812 |
| Median Household Income | 168 | $50,417 |
| Mean Household Income | 168 | $80,467 |
| Income Deficit | 89 | $0 |
| Wage / Income Gap (%) | 347 | 20.09% |
| Wage / Income Gap ($) | 347 | 79.91¢ per $1 |
| Gini / Inequality Index | 347 | 0.50 |
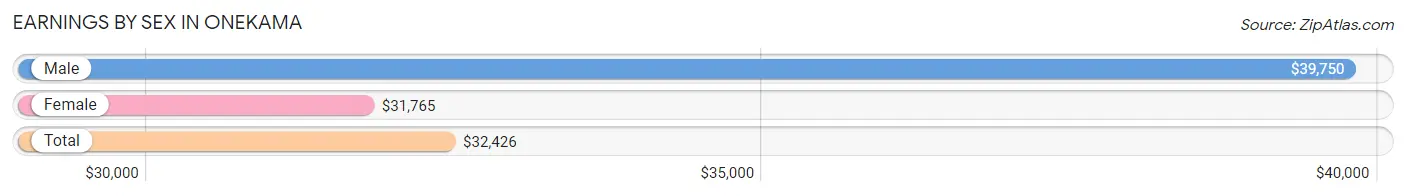
Earnings by Sex in Onekama
Average Earnings in Onekama are $32,426, $39,750 for men and $31,765 for women, a difference of 20.1%.
| Sex | Number | Average Earnings |
| Male | 81 (46.8%) | $39,750 |
| Female | 92 (53.2%) | $31,765 |
| Total | 173 (100.0%) | $32,426 |
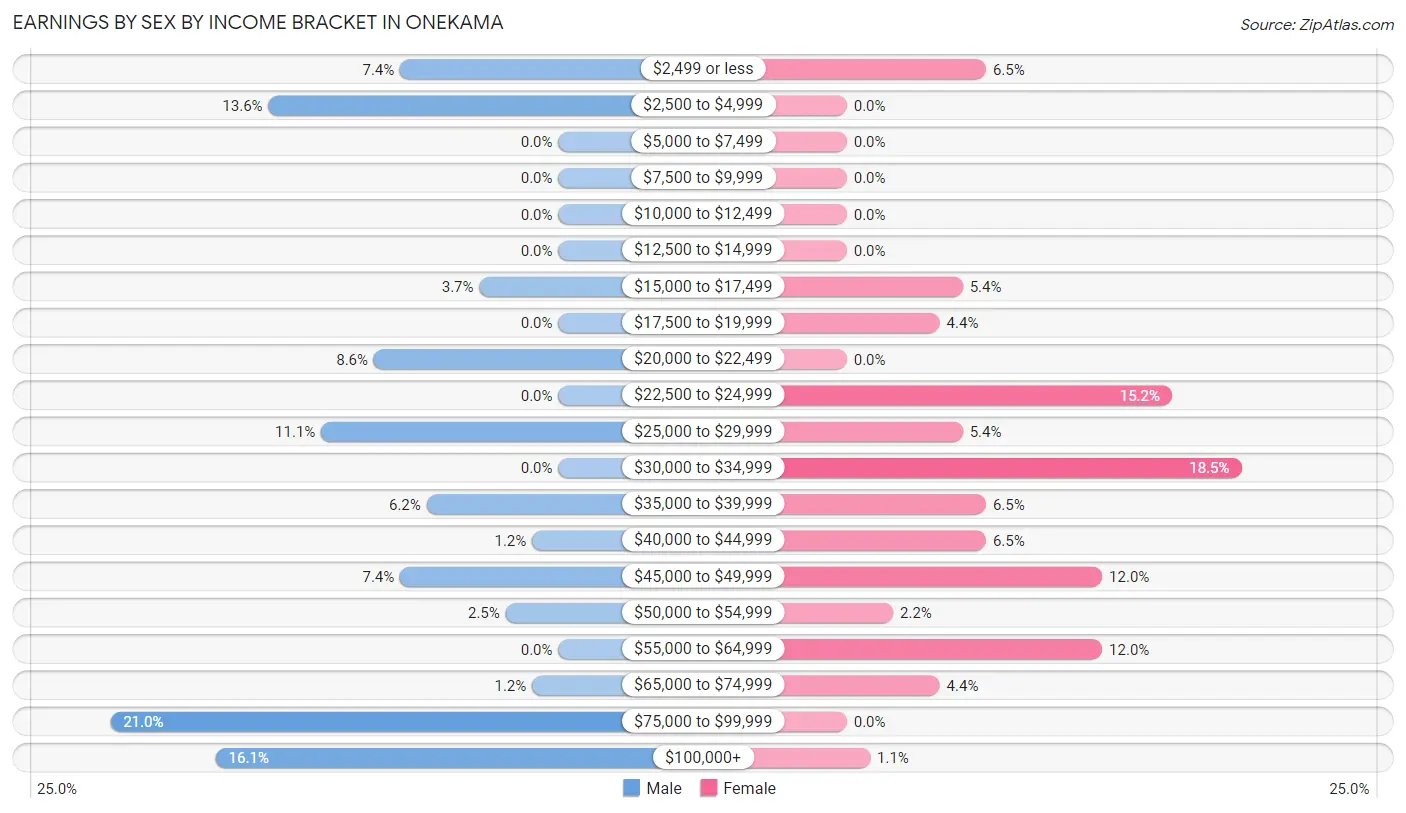
Earnings by Sex by Income Bracket in Onekama
The most common earnings brackets in Onekama are $75,000 to $99,999 for men (17 | 21.0%) and $30,000 to $34,999 for women (17 | 18.5%).
| Income | Male | Female |
| $2,499 or less | 6 (7.4%) | 6 (6.5%) |
| $2,500 to $4,999 | 11 (13.6%) | 0 (0.0%) |
| $5,000 to $7,499 | 0 (0.0%) | 0 (0.0%) |
| $7,500 to $9,999 | 0 (0.0%) | 0 (0.0%) |
| $10,000 to $12,499 | 0 (0.0%) | 0 (0.0%) |
| $12,500 to $14,999 | 0 (0.0%) | 0 (0.0%) |
| $15,000 to $17,499 | 3 (3.7%) | 5 (5.4%) |
| $17,500 to $19,999 | 0 (0.0%) | 4 (4.3%) |
| $20,000 to $22,499 | 7 (8.6%) | 0 (0.0%) |
| $22,500 to $24,999 | 0 (0.0%) | 14 (15.2%) |
| $25,000 to $29,999 | 9 (11.1%) | 5 (5.4%) |
| $30,000 to $34,999 | 0 (0.0%) | 17 (18.5%) |
| $35,000 to $39,999 | 5 (6.2%) | 6 (6.5%) |
| $40,000 to $44,999 | 1 (1.2%) | 6 (6.5%) |
| $45,000 to $49,999 | 6 (7.4%) | 11 (12.0%) |
| $50,000 to $54,999 | 2 (2.5%) | 2 (2.2%) |
| $55,000 to $64,999 | 0 (0.0%) | 11 (12.0%) |
| $65,000 to $74,999 | 1 (1.2%) | 4 (4.3%) |
| $75,000 to $99,999 | 17 (21.0%) | 0 (0.0%) |
| $100,000+ | 13 (16.1%) | 1 (1.1%) |
| Total | 81 (100.0%) | 92 (100.0%) |
Earnings by Sex by Educational Attainment in Onekama

| Educational Attainment | Male Income | Female Income |
| Less than High School | - | - |
| High School Diploma | - | - |
| College or Associate's Degree | $50,625 | $31,103 |
| Bachelor's Degree | $90,000 | $46,964 |
| Graduate Degree | - | - |
| Total | - | - |
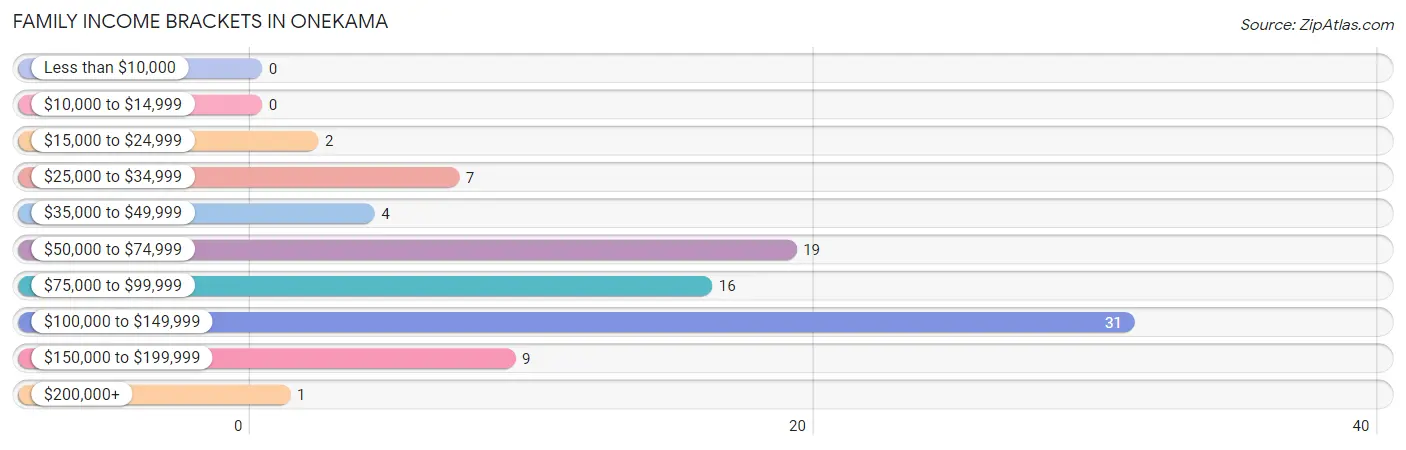
Family Income in Onekama
Family Income Brackets in Onekama
According to the Onekama family income data, there are 31 families falling into the $100,000 to $149,999 income range, which is the most common income bracket and makes up 34.8% of all families.
| Income Bracket | # Families | % Families |
| Less than $10,000 | 0 | 0.0% |
| $10,000 to $14,999 | 0 | 0.0% |
| $15,000 to $24,999 | 2 | 2.2% |
| $25,000 to $34,999 | 7 | 7.9% |
| $35,000 to $49,999 | 4 | 4.5% |
| $50,000 to $74,999 | 19 | 21.3% |
| $75,000 to $99,999 | 16 | 18.0% |
| $100,000 to $149,999 | 31 | 34.8% |
| $150,000 to $199,999 | 9 | 10.1% |
| $200,000+ | 1 | 1.1% |
Family Income by Famaliy Size in Onekama
3-person families (17 | 19.1%) account for the highest median family income in Onekama with $148,542 per family, while 3-person families (17 | 19.1%) have the highest median income of $49,514 per family member.
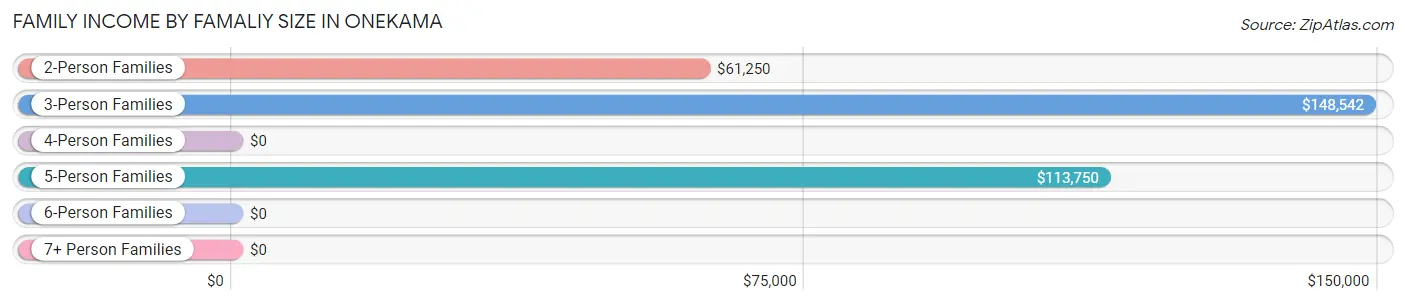
| Income Bracket | # Families | Median Income |
| 2-Person Families | 45 (50.6%) | $61,250 |
| 3-Person Families | 17 (19.1%) | $148,542 |
| 4-Person Families | 5 (5.6%) | $0 |
| 5-Person Families | 22 (24.7%) | $113,750 |
| 6-Person Families | 0 (0.0%) | $0 |
| 7+ Person Families | 0 (0.0%) | $0 |
| Total | 89 (100.0%) | $99,205 |
Family Income by Number of Earners in Onekama
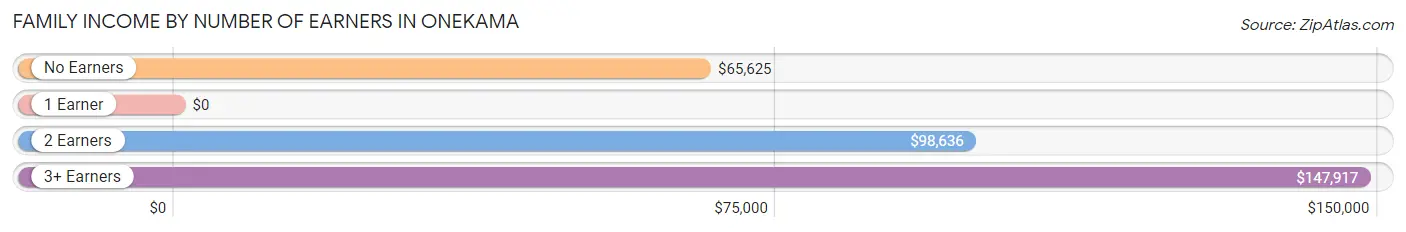
| Number of Earners | # Families | Median Income |
| No Earners | 24 (27.0%) | $65,625 |
| 1 Earner | 21 (23.6%) | $0 |
| 2 Earners | 26 (29.2%) | $98,636 |
| 3+ Earners | 18 (20.2%) | $147,917 |
| Total | 89 (100.0%) | $99,205 |
Household Income in Onekama
Household Income Brackets in Onekama
With 51 households falling in the category, the $15,000 to $24,999 income range is the most frequent in Onekama, accounting for 30.4% of all households.
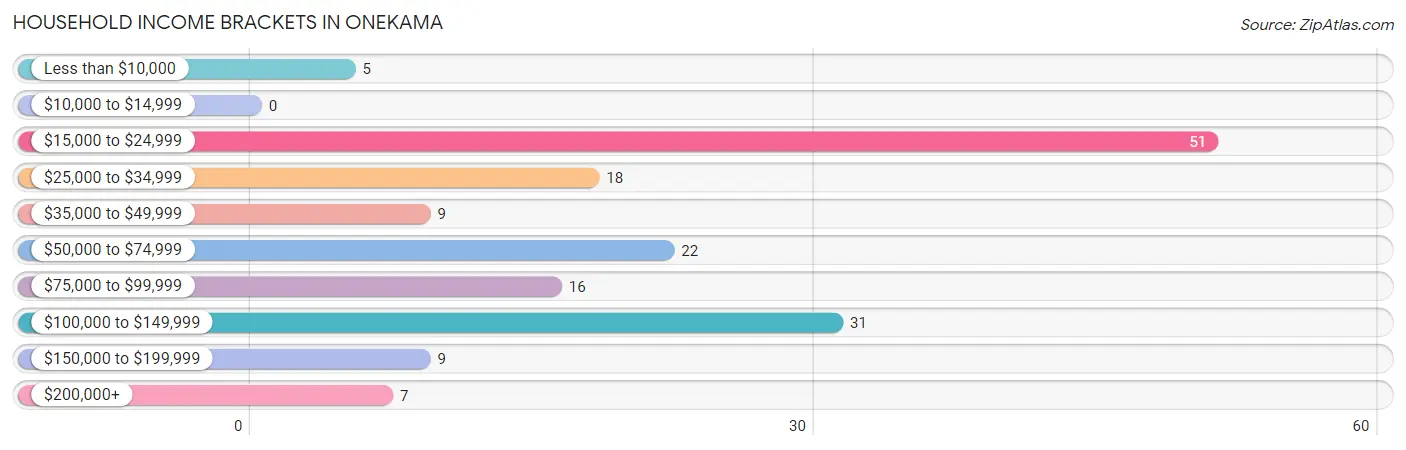
| Income Bracket | # Households | % Households |
| Less than $10,000 | 5 | 3.0% |
| $10,000 to $14,999 | 0 | 0.0% |
| $15,000 to $24,999 | 51 | 30.4% |
| $25,000 to $34,999 | 18 | 10.7% |
| $35,000 to $49,999 | 9 | 5.4% |
| $50,000 to $74,999 | 22 | 13.1% |
| $75,000 to $99,999 | 16 | 9.5% |
| $100,000 to $149,999 | 31 | 18.5% |
| $150,000 to $199,999 | 9 | 5.4% |
| $200,000+ | 7 | 4.2% |
Household Income by Householder Age in Onekama
The median household income in Onekama is $50,417, with the highest median household income of $99,659 found in the 25 to 44 years age bracket for the primary householder. A total of 19 households (11.3%) fall into this category. Meanwhile, the 15 to 24 years age bracket for the primary householder has the lowest median household income of $0, with 4 households (2.4%) in this group.
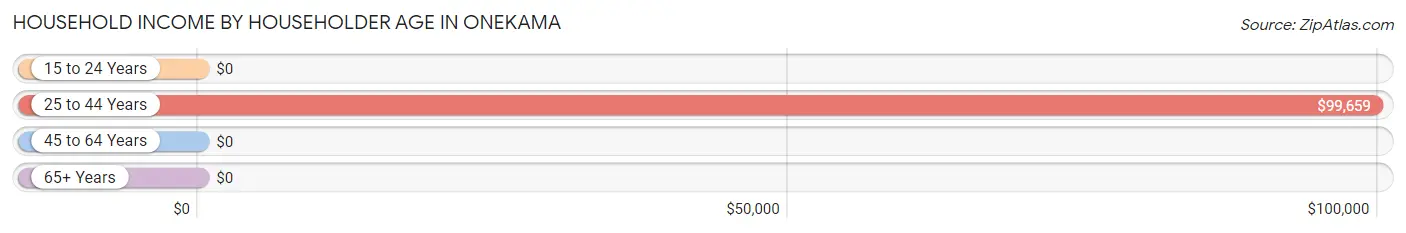
| Income Bracket | # Households | Median Income |
| 15 to 24 Years | 4 (2.4%) | $0 |
| 25 to 44 Years | 19 (11.3%) | $99,659 |
| 45 to 64 Years | 62 (36.9%) | $0 |
| 65+ Years | 83 (49.4%) | $0 |
| Total | 168 (100.0%) | $50,417 |
Poverty in Onekama
Income Below Poverty by Sex and Age in Onekama
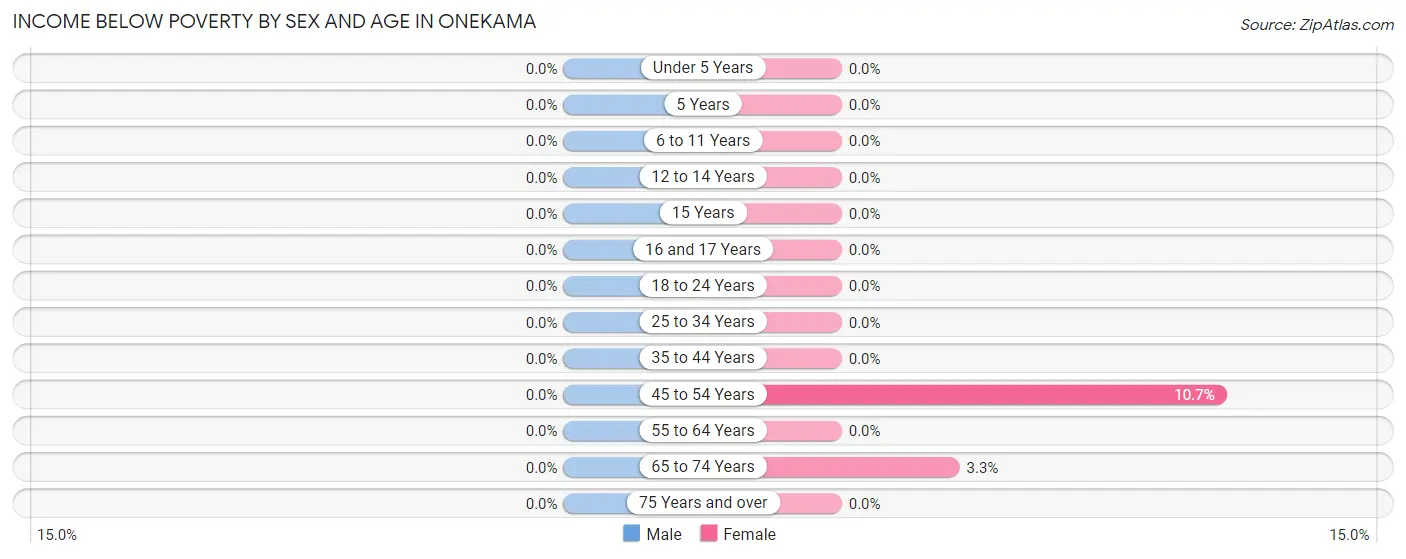
| Age Bracket | Male | Female |
| Under 5 Years | 0 (0.0%) | 0 (0.0%) |
| 5 Years | 0 (0.0%) | 0 (0.0%) |
| 6 to 11 Years | 0 (0.0%) | 0 (0.0%) |
| 12 to 14 Years | 0 (0.0%) | 0 (0.0%) |
| 15 Years | 0 (0.0%) | 0 (0.0%) |
| 16 and 17 Years | 0 (0.0%) | 0 (0.0%) |
| 18 to 24 Years | 0 (0.0%) | 0 (0.0%) |
| 25 to 34 Years | 0 (0.0%) | 0 (0.0%) |
| 35 to 44 Years | 0 (0.0%) | 0 (0.0%) |
| 45 to 54 Years | 0 (0.0%) | 3 (10.7%) |
| 55 to 64 Years | 0 (0.0%) | 0 (0.0%) |
| 65 to 74 Years | 0 (0.0%) | 2 (3.3%) |
| 75 Years and over | 0 (0.0%) | 0 (0.0%) |
| Total | 0 (0.0%) | 5 (2.4%) |
Income Above Poverty by Sex and Age in Onekama
According to the poverty statistics in Onekama, males aged 6 to 11 years and females aged under 5 years are the age groups that are most secure financially, with 100.0% of males and 100.0% of females in these age groups living above the poverty line.
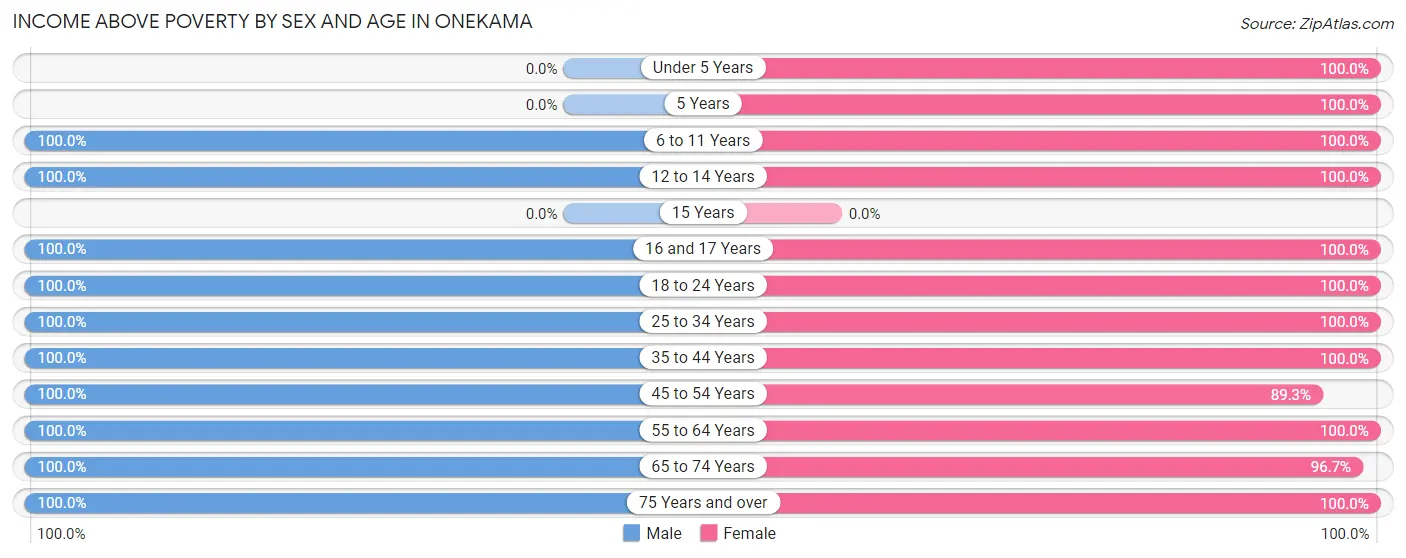
| Age Bracket | Male | Female |
| Under 5 Years | 0 (0.0%) | 5 (100.0%) |
| 5 Years | 0 (0.0%) | 8 (100.0%) |
| 6 to 11 Years | 15 (100.0%) | 3 (100.0%) |
| 12 to 14 Years | 2 (100.0%) | 15 (100.0%) |
| 15 Years | 0 (0.0%) | 0 (0.0%) |
| 16 and 17 Years | 10 (100.0%) | 6 (100.0%) |
| 18 to 24 Years | 7 (100.0%) | 4 (100.0%) |
| 25 to 34 Years | 15 (100.0%) | 27 (100.0%) |
| 35 to 44 Years | 3 (100.0%) | 8 (100.0%) |
| 45 to 54 Years | 26 (100.0%) | 25 (89.3%) |
| 55 to 64 Years | 18 (100.0%) | 36 (100.0%) |
| 65 to 74 Years | 26 (100.0%) | 59 (96.7%) |
| 75 Years and over | 13 (100.0%) | 11 (100.0%) |
| Total | 135 (100.0%) | 207 (97.6%) |
Income Below Poverty Among Married-Couple Families in Onekama
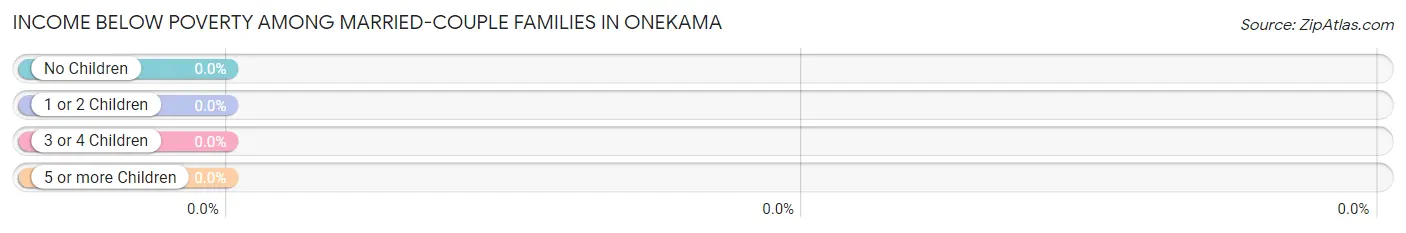
| Children | Above Poverty | Below Poverty |
| No Children | 52 (100.0%) | 0 (0.0%) |
| 1 or 2 Children | 7 (100.0%) | 0 (0.0%) |
| 3 or 4 Children | 22 (100.0%) | 0 (0.0%) |
| 5 or more Children | 0 (0.0%) | 0 (0.0%) |
| Total | 81 (100.0%) | 0 (0.0%) |
Income Below Poverty Among Single-Parent Households in Onekama
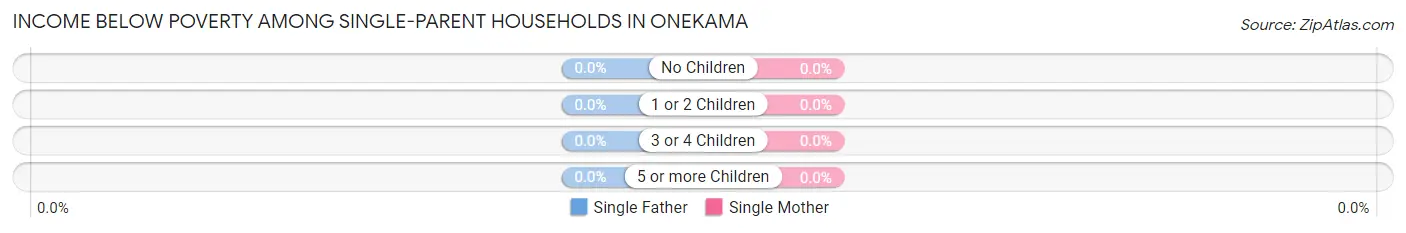
| Children | Single Father | Single Mother |
| No Children | 0 (0.0%) | 0 (0.0%) |
| 1 or 2 Children | 0 (0.0%) | 0 (0.0%) |
| 3 or 4 Children | 0 (0.0%) | 0 (0.0%) |
| 5 or more Children | 0 (0.0%) | 0 (0.0%) |
| Total | 0 (0.0%) | 0 (0.0%) |
Income Below Poverty Among Married-Couple vs Single-Parent Households in Onekama
| Children | Married-Couple Families | Single-Parent Households |
| No Children | 0 (0.0%) | 0 (0.0%) |
| 1 or 2 Children | 0 (0.0%) | 0 (0.0%) |
| 3 or 4 Children | 0 (0.0%) | 0 (0.0%) |
| 5 or more Children | 0 (0.0%) | 0 (0.0%) |
| Total | 0 (0.0%) | 0 (0.0%) |
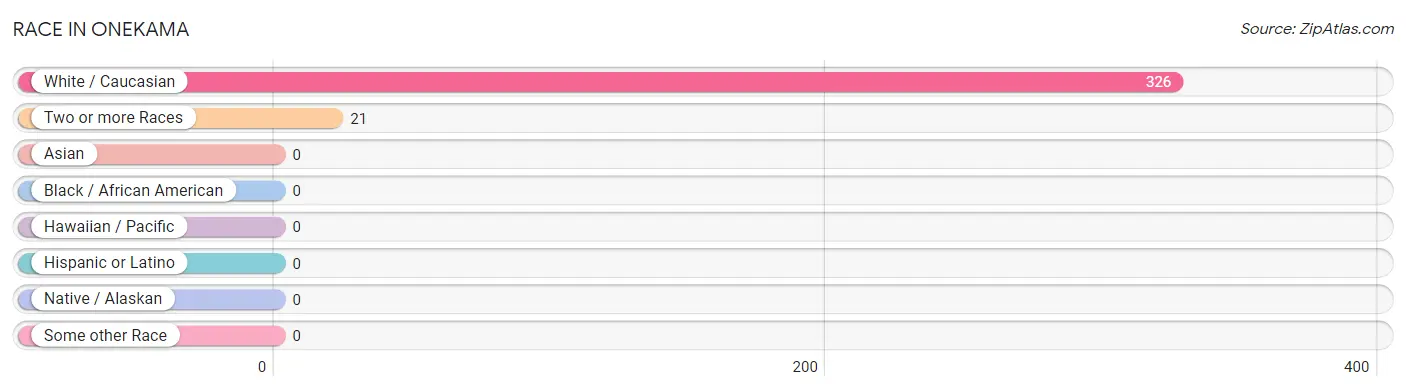
Race in Onekama
The most populous races in Onekama are White / Caucasian (326 | 94.0%), and Two or more Races (21 | 6.0%).
| Race | # Population | % Population |
| Asian | 0 | 0.0% |
| Black / African American | 0 | 0.0% |
| Hawaiian / Pacific | 0 | 0.0% |
| Hispanic or Latino | 0 | 0.0% |
| Native / Alaskan | 0 | 0.0% |
| White / Caucasian | 326 | 94.0% |
| Two or more Races | 21 | 6.0% |
| Some other Race | 0 | 0.0% |
| Total | 347 | 100.0% |
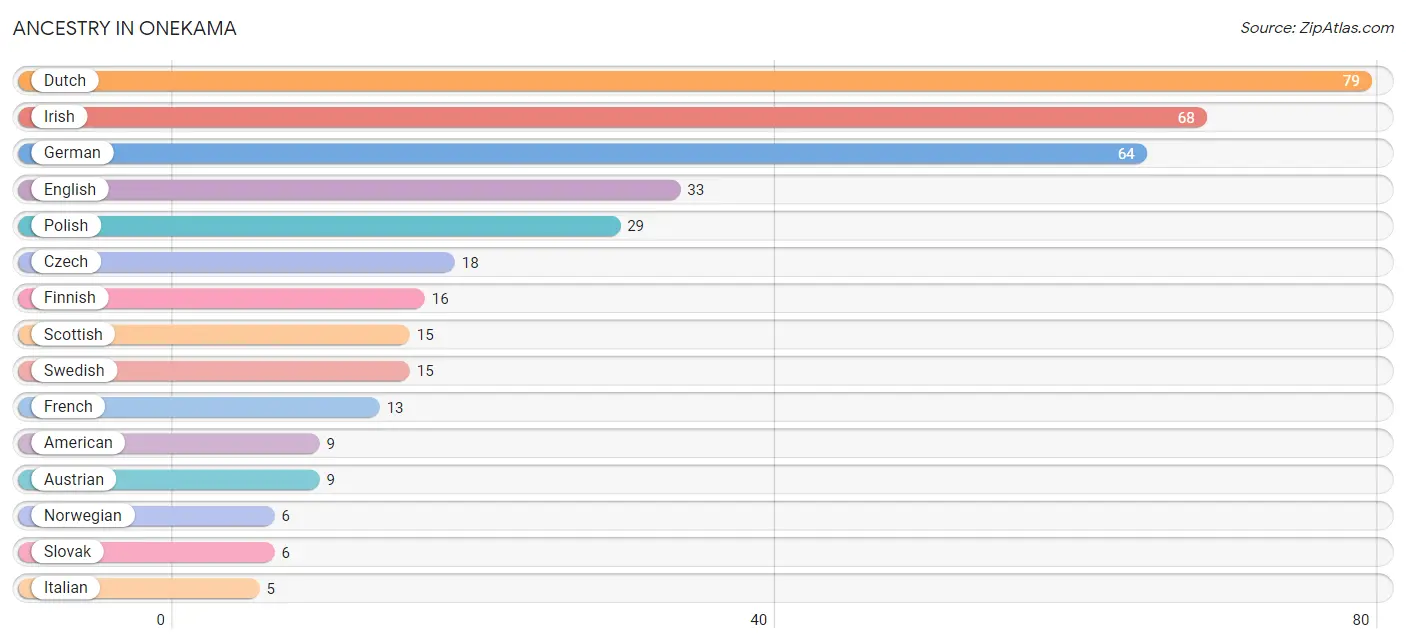
Ancestry in Onekama
The most populous ancestries reported in Onekama are Dutch (79 | 22.8%), Irish (68 | 19.6%), German (64 | 18.4%), English (33 | 9.5%), and Polish (29 | 8.4%), together accounting for 78.7% of all Onekama residents.
| Ancestry | # Population | % Population |
| American | 9 | 2.6% |
| Austrian | 9 | 2.6% |
| Czech | 18 | 5.2% |
| Dutch | 79 | 22.8% |
| English | 33 | 9.5% |
| European | 3 | 0.9% |
| Finnish | 16 | 4.6% |
| French | 13 | 3.7% |
| German | 64 | 18.4% |
| Irish | 68 | 19.6% |
| Italian | 5 | 1.4% |
| Norwegian | 6 | 1.7% |
| Polish | 29 | 8.4% |
| Scotch-Irish | 2 | 0.6% |
| Scottish | 15 | 4.3% |
| Slovak | 6 | 1.7% |
| Swedish | 15 | 4.3% |
| Welsh | 2 | 0.6% | View All 18 Rows |
Immigrants in Onekama

| Immigration Origin | # Population | % Population | View All 0 Rows |
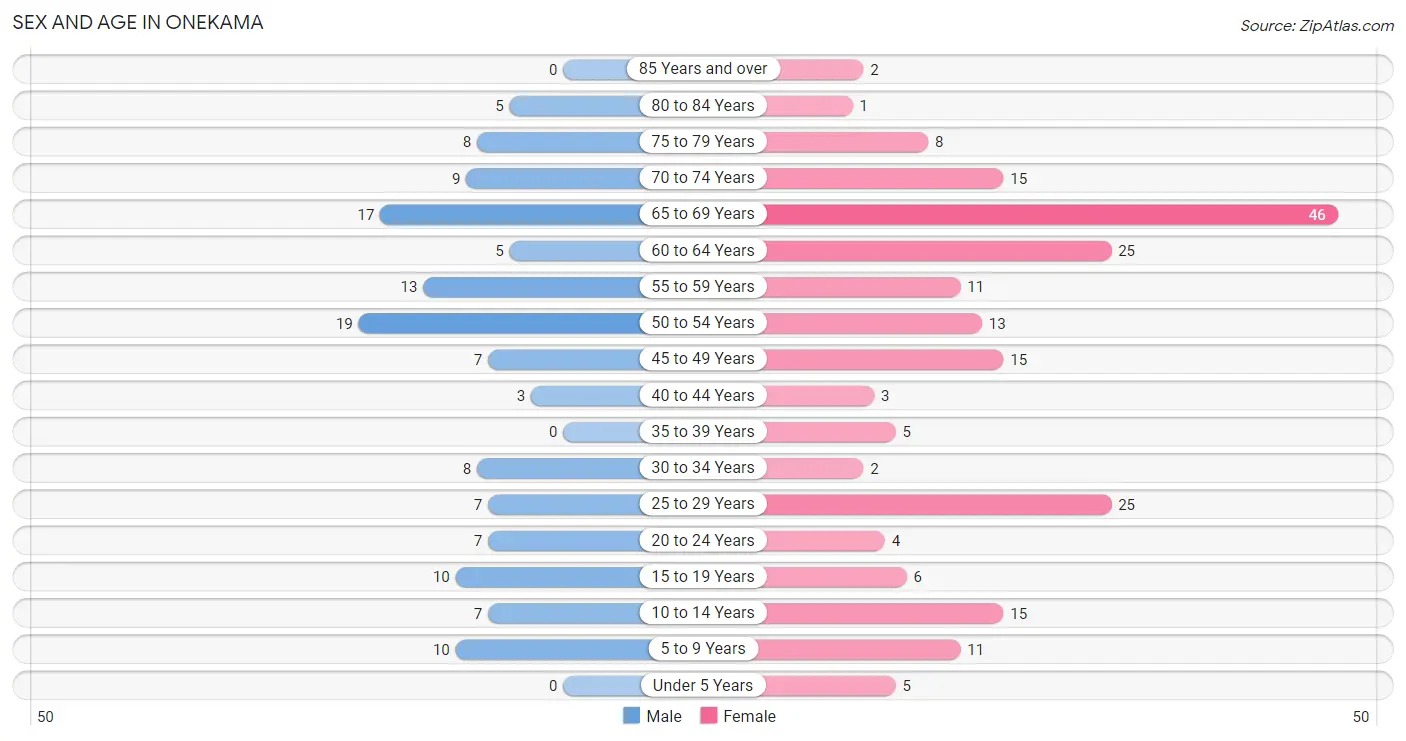
Sex and Age in Onekama
Sex and Age in Onekama
The most populous age groups in Onekama are 50 to 54 Years (19 | 14.1%) for men and 65 to 69 Years (46 | 21.7%) for women.
| Age Bracket | Male | Female |
| Under 5 Years | 0 (0.0%) | 5 (2.4%) |
| 5 to 9 Years | 10 (7.4%) | 11 (5.2%) |
| 10 to 14 Years | 7 (5.2%) | 15 (7.1%) |
| 15 to 19 Years | 10 (7.4%) | 6 (2.8%) |
| 20 to 24 Years | 7 (5.2%) | 4 (1.9%) |
| 25 to 29 Years | 7 (5.2%) | 25 (11.8%) |
| 30 to 34 Years | 8 (5.9%) | 2 (0.9%) |
| 35 to 39 Years | 0 (0.0%) | 5 (2.4%) |
| 40 to 44 Years | 3 (2.2%) | 3 (1.4%) |
| 45 to 49 Years | 7 (5.2%) | 15 (7.1%) |
| 50 to 54 Years | 19 (14.1%) | 13 (6.1%) |
| 55 to 59 Years | 13 (9.6%) | 11 (5.2%) |
| 60 to 64 Years | 5 (3.7%) | 25 (11.8%) |
| 65 to 69 Years | 17 (12.6%) | 46 (21.7%) |
| 70 to 74 Years | 9 (6.7%) | 15 (7.1%) |
| 75 to 79 Years | 8 (5.9%) | 8 (3.8%) |
| 80 to 84 Years | 5 (3.7%) | 1 (0.5%) |
| 85 Years and over | 0 (0.0%) | 2 (0.9%) |
| Total | 135 (100.0%) | 212 (100.0%) |
Families and Households in Onekama
Median Family Size in Onekama
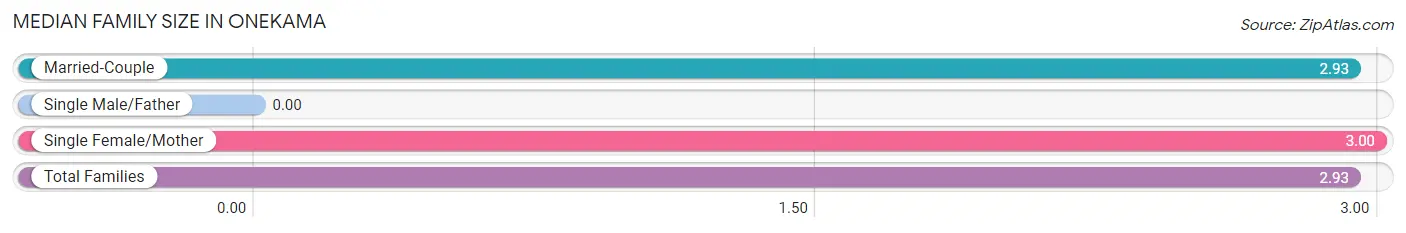
| Family Type | # Families | Family Size |
| Married-Couple | 81 (91.0%) | 2.93 |
| Single Male/Father | 0 (0.0%) | - |
| Single Female/Mother | 8 (9.0%) | 3.00 |
| Total Families | 89 (100.0%) | 2.93 |
Median Household Size in Onekama
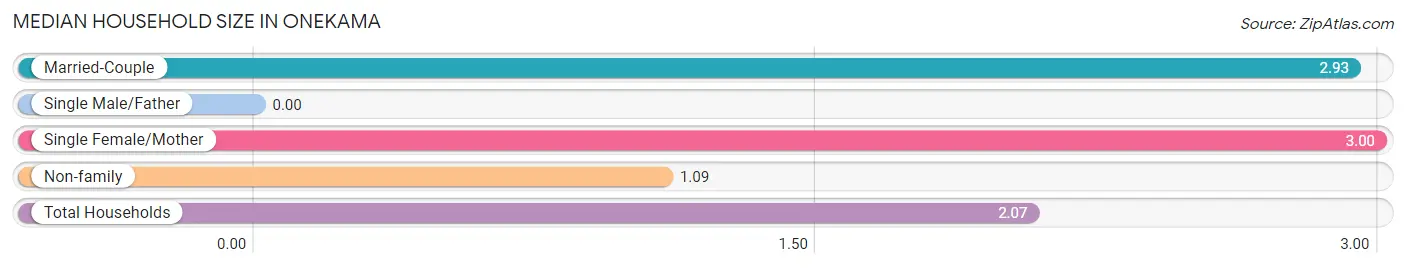
| Household Type | # Households | Household Size |
| Married-Couple | 81 (48.2%) | 2.93 |
| Single Male/Father | 0 (0.0%) | - |
| Single Female/Mother | 8 (4.8%) | 3.00 |
| Non-family | 79 (47.0%) | 1.09 |
| Total Households | 168 (100.0%) | 2.07 |
Household Size by Marriage Status in Onekama
Out of a total of 168 households in Onekama, 89 (53.0%) are family households, while 79 (47.0%) are nonfamily households. The most numerous type of family households are 2-person households, comprising 45, and the most common type of nonfamily households are 1-person households, comprising 73.
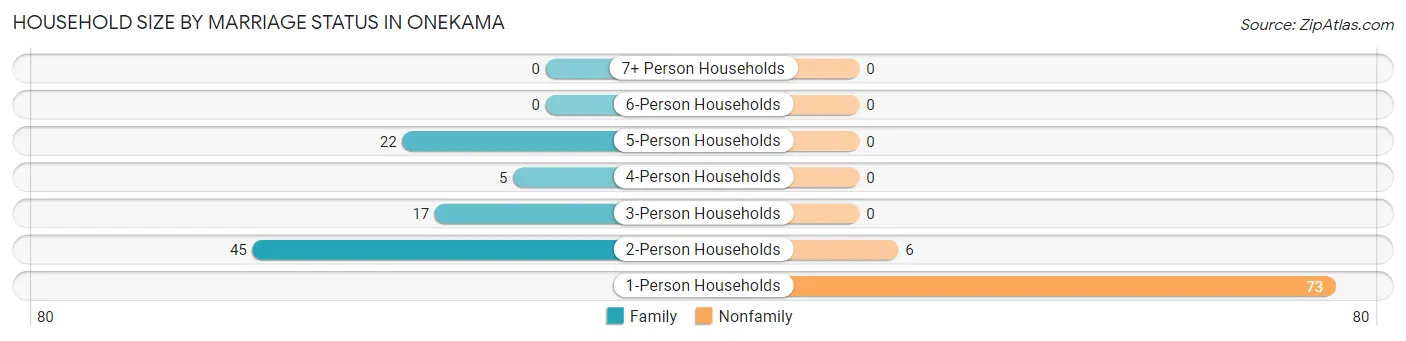
| Household Size | Family Households | Nonfamily Households |
| 1-Person Households | - | 73 (43.4%) |
| 2-Person Households | 45 (26.8%) | 6 (3.6%) |
| 3-Person Households | 17 (10.1%) | 0 (0.0%) |
| 4-Person Households | 5 (3.0%) | 0 (0.0%) |
| 5-Person Households | 22 (13.1%) | 0 (0.0%) |
| 6-Person Households | 0 (0.0%) | 0 (0.0%) |
| 7+ Person Households | 0 (0.0%) | 0 (0.0%) |
| Total | 89 (53.0%) | 79 (47.0%) |
Female Fertility in Onekama
Fertility by Age in Onekama
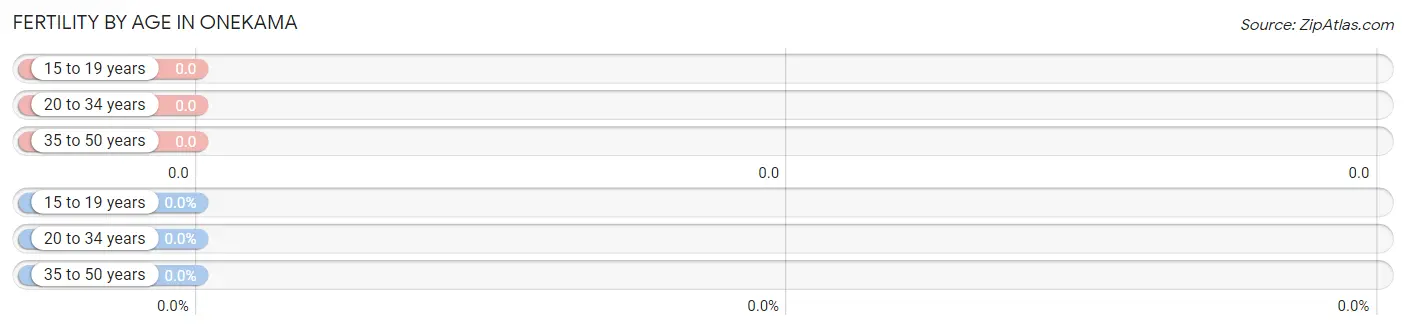
| Age Bracket | Women with Births | Births / 1,000 Women |
| 15 to 19 years | 0 (0.0%) | 0.0 |
| 20 to 34 years | 0 (0.0%) | 0.0 |
| 35 to 50 years | 0 (0.0%) | 0.0 |
| Total | 0 (0.0%) | 0.0 |
Fertility by Age by Marriage Status in Onekama
| Age Bracket | Married | Unmarried |
| 15 to 19 years | 0 (0.0%) | 0 (0.0%) |
| 20 to 34 years | 0 (0.0%) | 0 (0.0%) |
| 35 to 50 years | 0 (0.0%) | 0 (0.0%) |
| Total | 0 (0.0%) | 0 (0.0%) |
Fertility by Education in Onekama
| Educational Attainment | Women with Births | Births / 1,000 Women |
| Less than High School | 0 (0.0%) | 0.0 |
| High School Diploma | 0 (0.0%) | 0.0 |
| College or Associate's Degree | 0 (0.0%) | 0.0 |
| Bachelor's Degree | 0 (0.0%) | 0.0 |
| Graduate Degree | 0 (0.0%) | 0.0 |
| Total | 0 (0.0%) | 0.0 |
Fertility by Education by Marriage Status in Onekama
| Educational Attainment | Married | Unmarried |
| Less than High School | 0 (0.0%) | 0 (0.0%) |
| High School Diploma | 0 (0.0%) | 0 (0.0%) |
| College or Associate's Degree | 0 (0.0%) | 0 (0.0%) |
| Bachelor's Degree | 0 (0.0%) | 0 (0.0%) |
| Graduate Degree | 0 (0.0%) | 0 (0.0%) |
| Total | 0 (0.0%) | 0 (0.0%) |
Employment Characteristics in Onekama
Employment by Class of Employer in Onekama
Among the 165 employed individuals in Onekama, private company employees (106 | 64.2%), local government employees (16 | 9.7%), and state government employees (15 | 9.1%) make up the most common classes of employment.
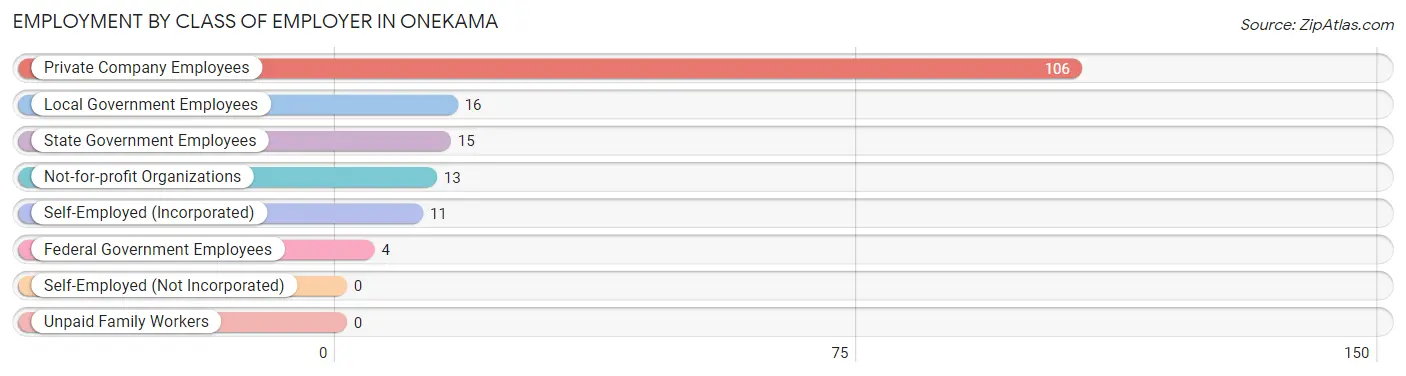
| Employer Class | # Employees | % Employees |
| Private Company Employees | 106 | 64.2% |
| Self-Employed (Incorporated) | 11 | 6.7% |
| Self-Employed (Not Incorporated) | 0 | 0.0% |
| Not-for-profit Organizations | 13 | 7.9% |
| Local Government Employees | 16 | 9.7% |
| State Government Employees | 15 | 9.1% |
| Federal Government Employees | 4 | 2.4% |
| Unpaid Family Workers | 0 | 0.0% |
| Total | 165 | 100.0% |
Employment Status by Age in Onekama
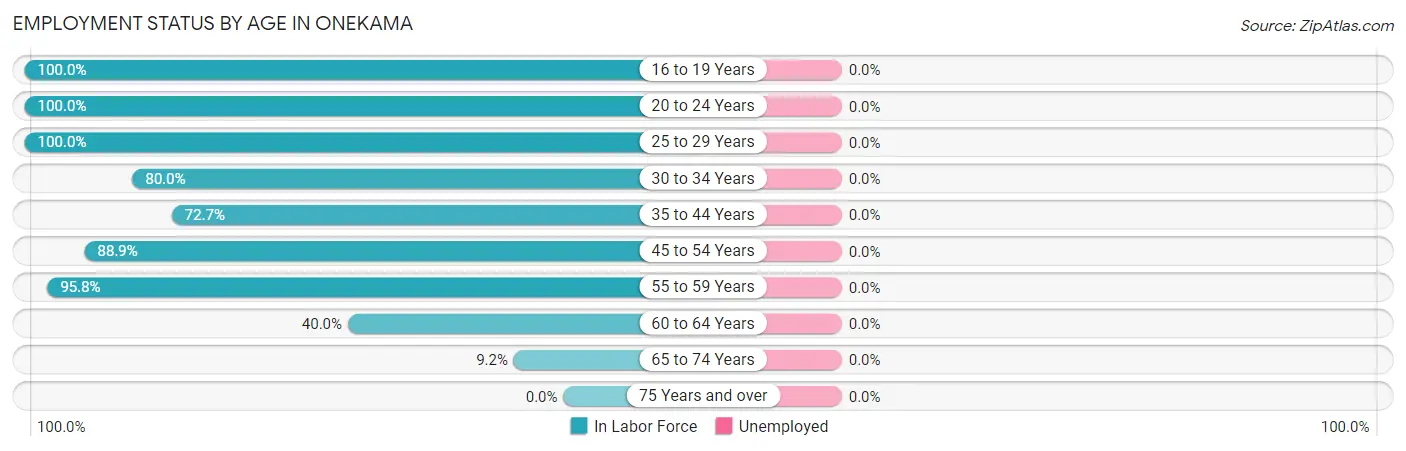
| Age Bracket | In Labor Force | Unemployed |
| 16 to 19 Years | 16 (100.0%) | 0 (0.0%) |
| 20 to 24 Years | 11 (100.0%) | 0 (0.0%) |
| 25 to 29 Years | 32 (100.0%) | 0 (0.0%) |
| 30 to 34 Years | 8 (80.0%) | 0 (0.0%) |
| 35 to 44 Years | 8 (72.7%) | 0 (0.0%) |
| 45 to 54 Years | 48 (88.9%) | 0 (0.0%) |
| 55 to 59 Years | 23 (95.8%) | 0 (0.0%) |
| 60 to 64 Years | 12 (40.0%) | 0 (0.0%) |
| 65 to 74 Years | 8 (9.2%) | 0 (0.0%) |
| 75 Years and over | 0 (0.0%) | 0 (0.0%) |
| Total | 166 (55.5%) | 0 (0.0%) |
Employment Status by Educational Attainment in Onekama
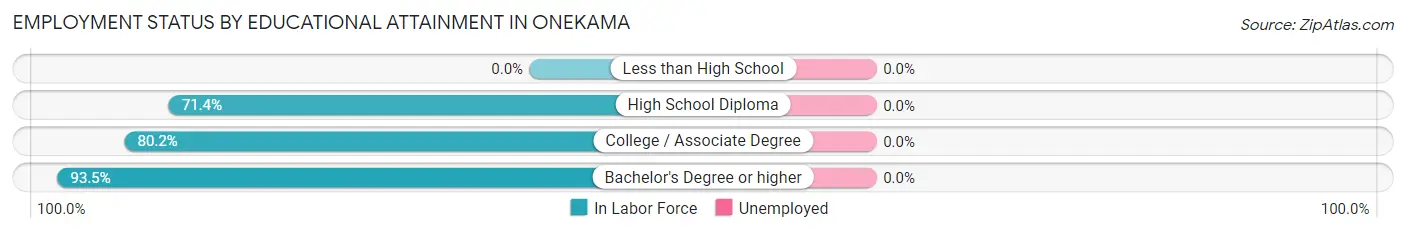
| Educational Attainment | In Labor Force | Unemployed |
| Less than High School | 0 (0.0%) | 0 (0.0%) |
| High School Diploma | 15 (71.4%) | 0 (0.0%) |
| College / Associate Degree | 73 (80.2%) | 0 (0.0%) |
| Bachelor's Degree or higher | 43 (93.5%) | 0 (0.0%) |
| Total | 131 (81.4%) | 0 (0.0%) |
Employment Occupations by Sex in Onekama
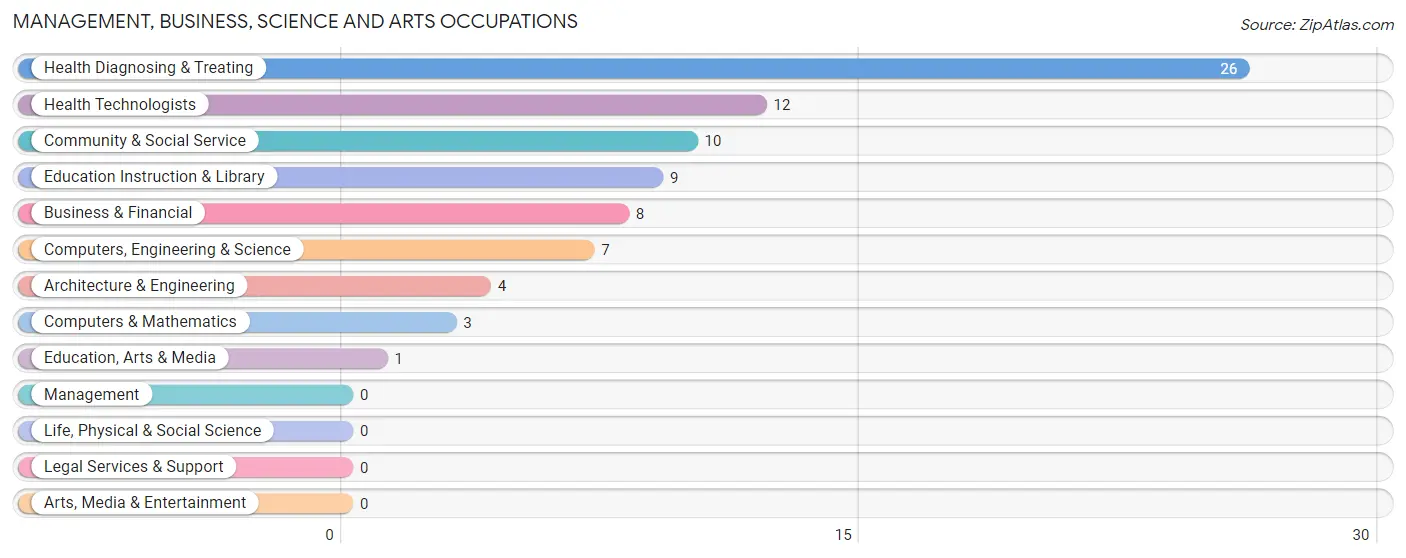
Management, Business, Science and Arts Occupations
The most common Management, Business, Science and Arts occupations in Onekama are Health Diagnosing & Treating (26 | 15.7%), Health Technologists (12 | 7.2%), Community & Social Service (10 | 6.0%), Education Instruction & Library (9 | 5.4%), and Business & Financial (8 | 4.8%).
Management, Business, Science and Arts Occupations by Sex
Within the Management, Business, Science and Arts occupations in Onekama, the most male-oriented occupations are Architecture & Engineering (50.0%), Computers, Engineering & Science (28.6%), and Business & Financial (25.0%), while the most female-oriented occupations are Computers & Mathematics (100.0%), Community & Social Service (100.0%), and Education, Arts & Media (100.0%).
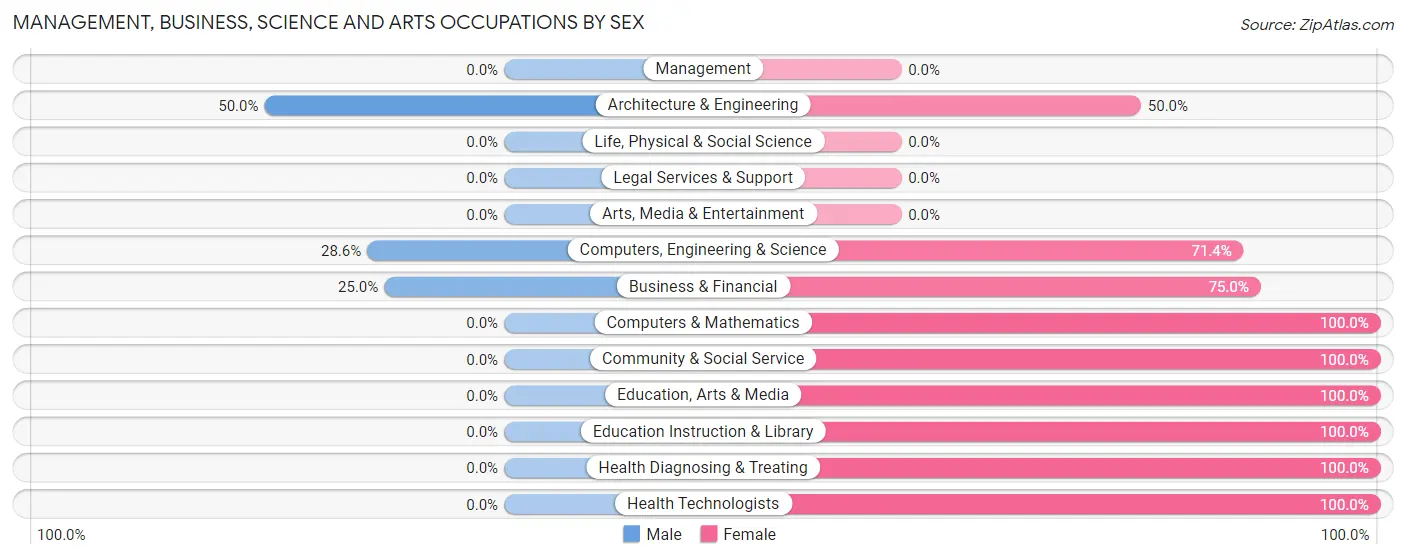
| Occupation | Male | Female |
| Management | 0 (0.0%) | 0 (0.0%) |
| Business & Financial | 2 (25.0%) | 6 (75.0%) |
| Computers, Engineering & Science | 2 (28.6%) | 5 (71.4%) |
| Computers & Mathematics | 0 (0.0%) | 3 (100.0%) |
| Architecture & Engineering | 2 (50.0%) | 2 (50.0%) |
| Life, Physical & Social Science | 0 (0.0%) | 0 (0.0%) |
| Community & Social Service | 0 (0.0%) | 10 (100.0%) |
| Education, Arts & Media | 0 (0.0%) | 1 (100.0%) |
| Legal Services & Support | 0 (0.0%) | 0 (0.0%) |
| Education Instruction & Library | 0 (0.0%) | 9 (100.0%) |
| Arts, Media & Entertainment | 0 (0.0%) | 0 (0.0%) |
| Health Diagnosing & Treating | 0 (0.0%) | 26 (100.0%) |
| Health Technologists | 0 (0.0%) | 12 (100.0%) |
| Total (Category) | 4 (7.8%) | 47 (92.2%) |
| Total (Overall) | 74 (44.6%) | 92 (55.4%) |
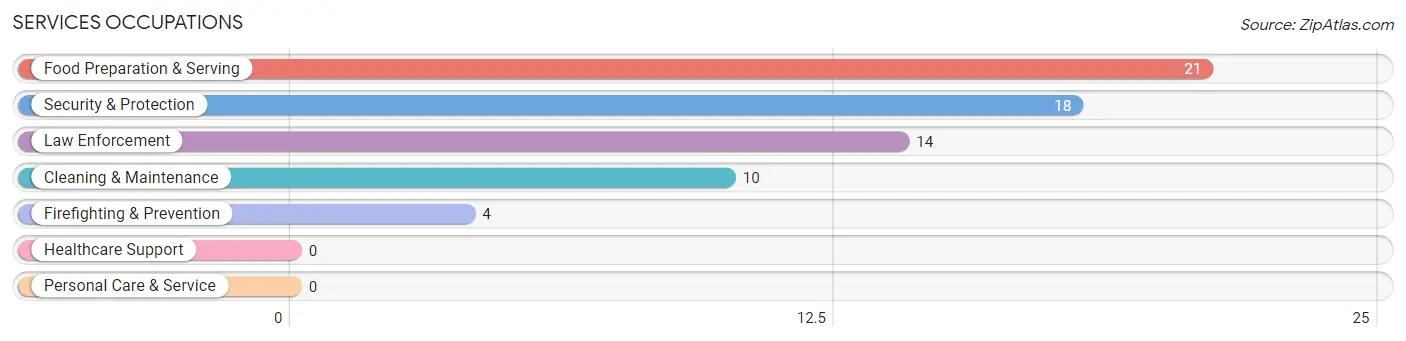
Services Occupations
The most common Services occupations in Onekama are Food Preparation & Serving (21 | 12.7%), Security & Protection (18 | 10.8%), Law Enforcement (14 | 8.4%), Cleaning & Maintenance (10 | 6.0%), and Firefighting & Prevention (4 | 2.4%).
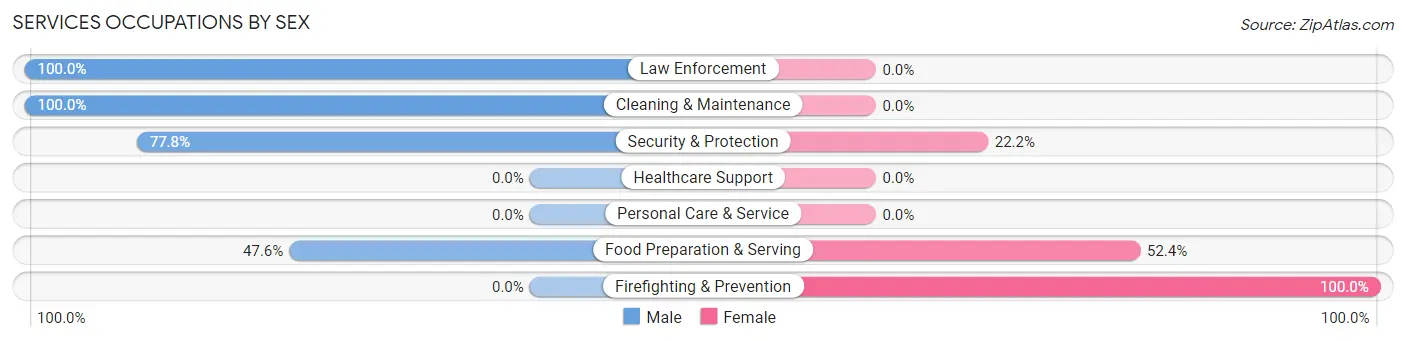
Services Occupations by Sex
Within the Services occupations in Onekama, the most male-oriented occupations are Law Enforcement (100.0%), Cleaning & Maintenance (100.0%), and Security & Protection (77.8%), while the most female-oriented occupations are Firefighting & Prevention (100.0%), Food Preparation & Serving (52.4%), and Security & Protection (22.2%).
| Occupation | Male | Female |
| Healthcare Support | 0 (0.0%) | 0 (0.0%) |
| Security & Protection | 14 (77.8%) | 4 (22.2%) |
| Firefighting & Prevention | 0 (0.0%) | 4 (100.0%) |
| Law Enforcement | 14 (100.0%) | 0 (0.0%) |
| Food Preparation & Serving | 10 (47.6%) | 11 (52.4%) |
| Cleaning & Maintenance | 10 (100.0%) | 0 (0.0%) |
| Personal Care & Service | 0 (0.0%) | 0 (0.0%) |
| Total (Category) | 34 (69.4%) | 15 (30.6%) |
| Total (Overall) | 74 (44.6%) | 92 (55.4%) |
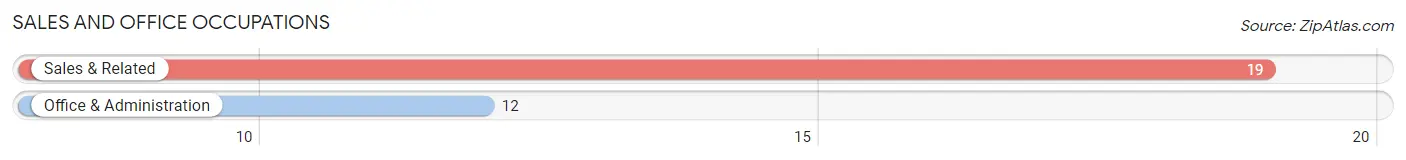
Sales and Office Occupations
The most common Sales and Office occupations in Onekama are Sales & Related (19 | 11.5%), and Office & Administration (12 | 7.2%).
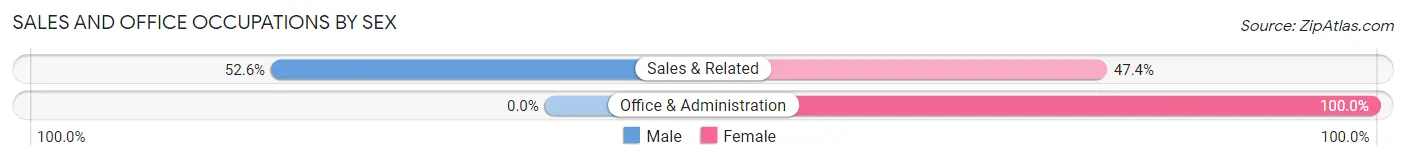
Sales and Office Occupations by Sex
| Occupation | Male | Female |
| Sales & Related | 10 (52.6%) | 9 (47.4%) |
| Office & Administration | 0 (0.0%) | 12 (100.0%) |
| Total (Category) | 10 (32.3%) | 21 (67.7%) |
| Total (Overall) | 74 (44.6%) | 92 (55.4%) |
Natural Resources, Construction and Maintenance Occupations
The most common Natural Resources, Construction and Maintenance occupations in Onekama are Construction & Extraction (10 | 6.0%), and Installation, Maintenance & Repair (3 | 1.8%).
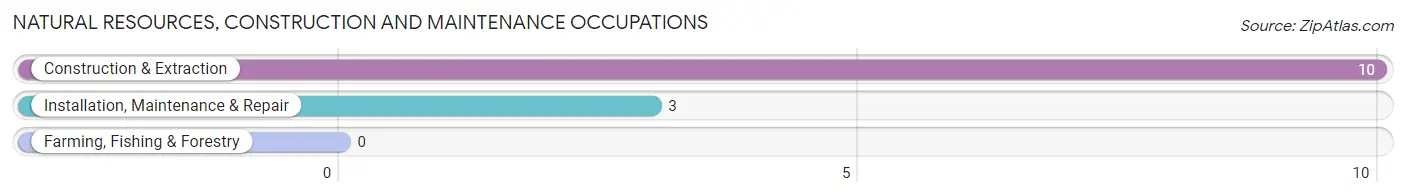
Natural Resources, Construction and Maintenance Occupations by Sex
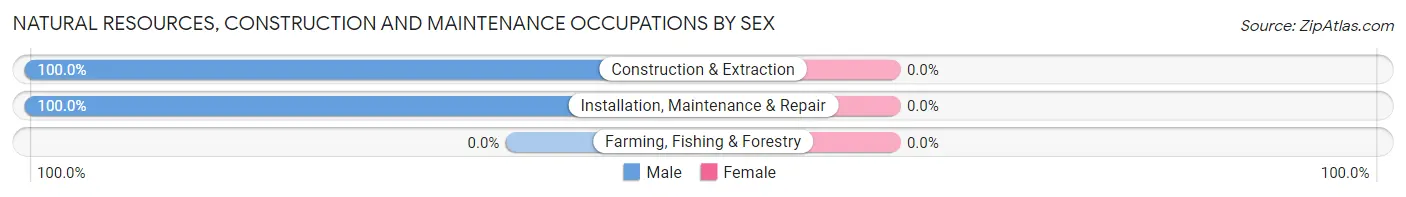
| Occupation | Male | Female |
| Farming, Fishing & Forestry | 0 (0.0%) | 0 (0.0%) |
| Construction & Extraction | 10 (100.0%) | 0 (0.0%) |
| Installation, Maintenance & Repair | 3 (100.0%) | 0 (0.0%) |
| Total (Category) | 13 (100.0%) | 0 (0.0%) |
| Total (Overall) | 74 (44.6%) | 92 (55.4%) |
Production, Transportation and Moving Occupations
The most common Production, Transportation and Moving occupations in Onekama are Production (19 | 11.5%), and Transportation (3 | 1.8%).
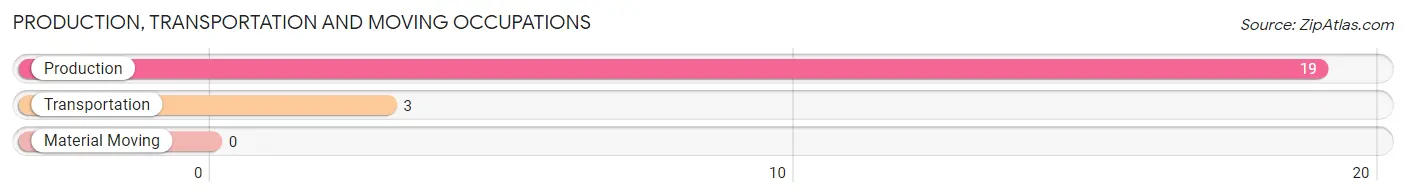
Production, Transportation and Moving Occupations by Sex
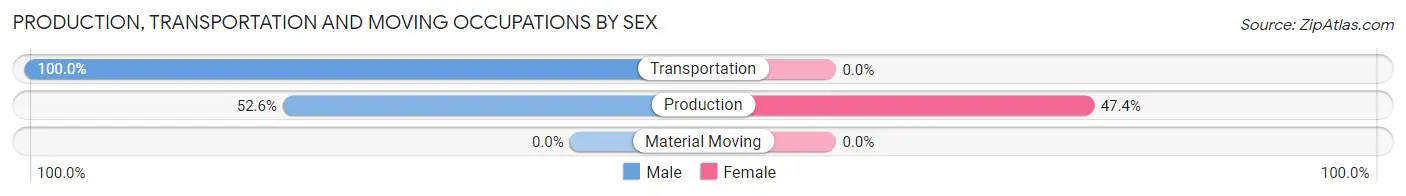
| Occupation | Male | Female |
| Production | 10 (52.6%) | 9 (47.4%) |
| Transportation | 3 (100.0%) | 0 (0.0%) |
| Material Moving | 0 (0.0%) | 0 (0.0%) |
| Total (Category) | 13 (59.1%) | 9 (40.9%) |
| Total (Overall) | 74 (44.6%) | 92 (55.4%) |
Employment Industries by Sex in Onekama
Employment Industries in Onekama
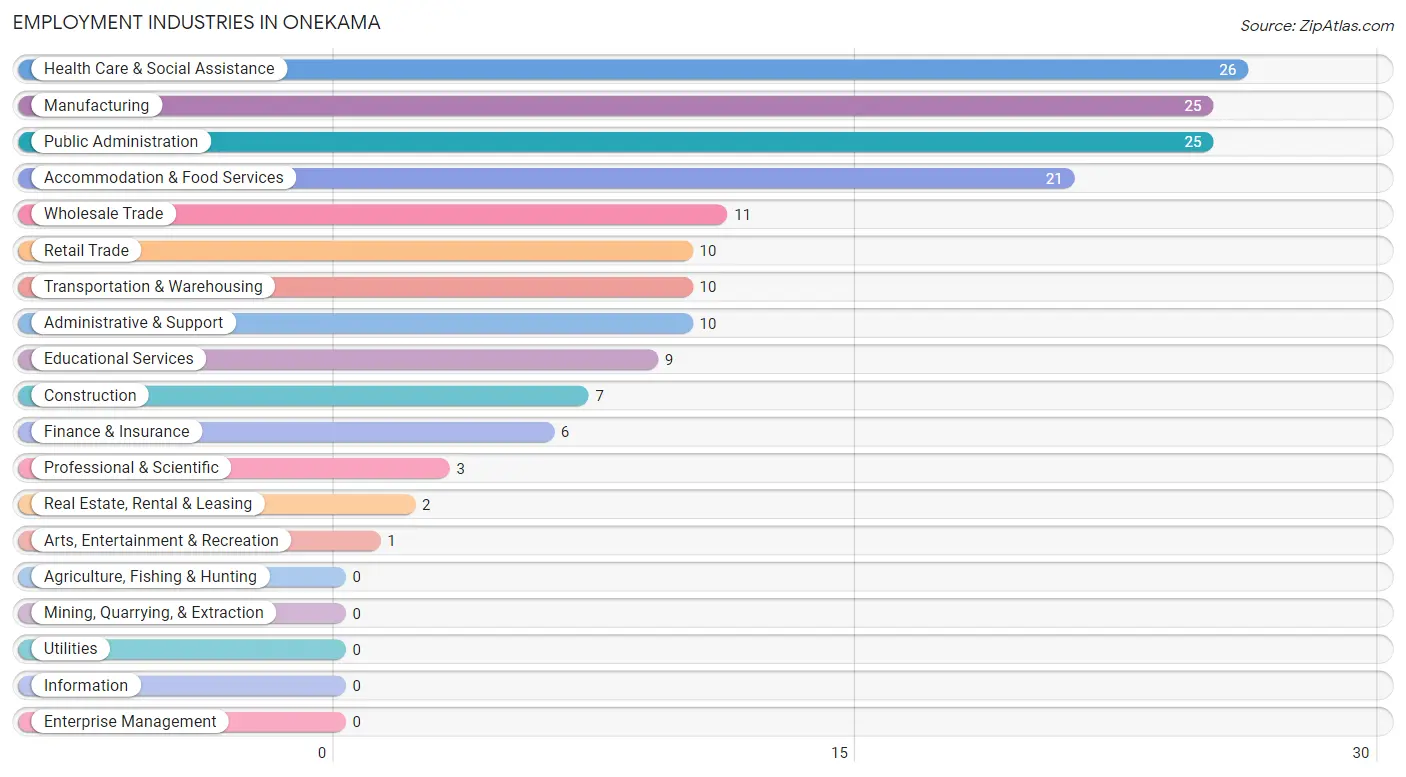
The major employment industries in Onekama include Health Care & Social Assistance (26 | 15.7%), Manufacturing (25 | 15.1%), Public Administration (25 | 15.1%), Accommodation & Food Services (21 | 12.7%), and Wholesale Trade (11 | 6.6%).
Employment Industries by Sex in Onekama
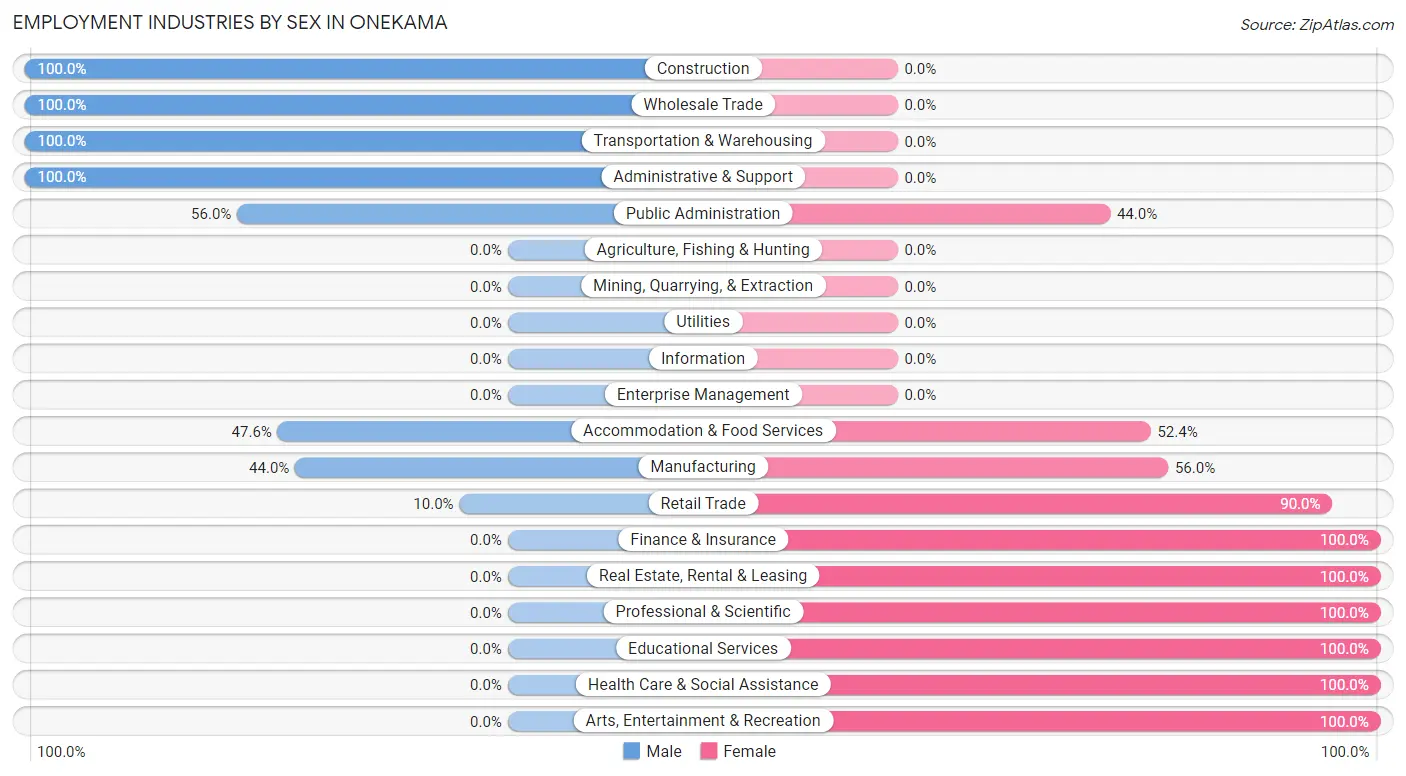
The Onekama industries that see more men than women are Construction (100.0%), Wholesale Trade (100.0%), and Transportation & Warehousing (100.0%), whereas the industries that tend to have a higher number of women are Finance & Insurance (100.0%), Real Estate, Rental & Leasing (100.0%), and Professional & Scientific (100.0%).
| Industry | Male | Female |
| Agriculture, Fishing & Hunting | 0 (0.0%) | 0 (0.0%) |
| Mining, Quarrying, & Extraction | 0 (0.0%) | 0 (0.0%) |
| Construction | 7 (100.0%) | 0 (0.0%) |
| Manufacturing | 11 (44.0%) | 14 (56.0%) |
| Wholesale Trade | 11 (100.0%) | 0 (0.0%) |
| Retail Trade | 1 (10.0%) | 9 (90.0%) |
| Transportation & Warehousing | 10 (100.0%) | 0 (0.0%) |
| Utilities | 0 (0.0%) | 0 (0.0%) |
| Information | 0 (0.0%) | 0 (0.0%) |
| Finance & Insurance | 0 (0.0%) | 6 (100.0%) |
| Real Estate, Rental & Leasing | 0 (0.0%) | 2 (100.0%) |
| Professional & Scientific | 0 (0.0%) | 3 (100.0%) |
| Enterprise Management | 0 (0.0%) | 0 (0.0%) |
| Administrative & Support | 10 (100.0%) | 0 (0.0%) |
| Educational Services | 0 (0.0%) | 9 (100.0%) |
| Health Care & Social Assistance | 0 (0.0%) | 26 (100.0%) |
| Arts, Entertainment & Recreation | 0 (0.0%) | 1 (100.0%) |
| Accommodation & Food Services | 10 (47.6%) | 11 (52.4%) |
| Public Administration | 14 (56.0%) | 11 (44.0%) |
| Total | 74 (44.6%) | 92 (55.4%) |
Education in Onekama
School Enrollment in Onekama
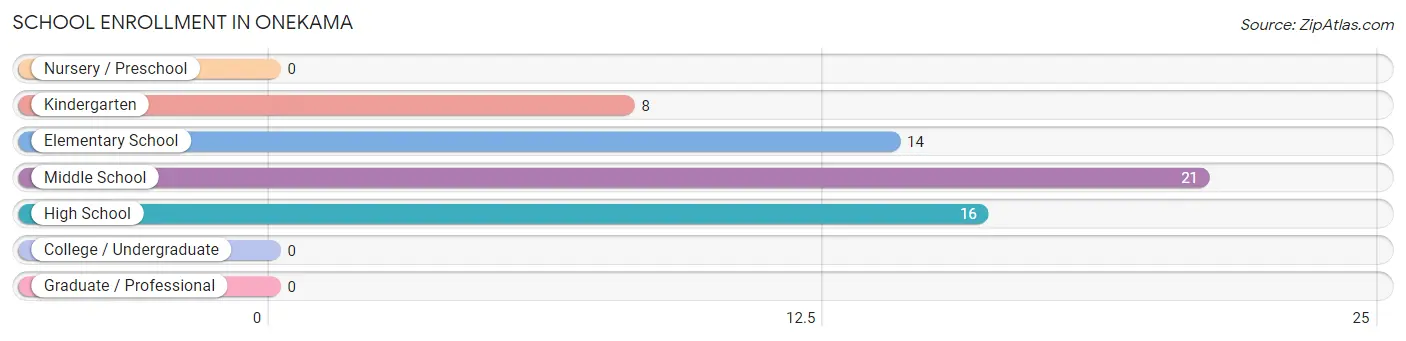
The most common levels of schooling among the 59 students in Onekama are middle school (21 | 35.6%), high school (16 | 27.1%), and elementary school (14 | 23.7%).
| School Level | # Students | % Students |
| Nursery / Preschool | 0 | 0.0% |
| Kindergarten | 8 | 13.6% |
| Elementary School | 14 | 23.7% |
| Middle School | 21 | 35.6% |
| High School | 16 | 27.1% |
| College / Undergraduate | 0 | 0.0% |
| Graduate / Professional | 0 | 0.0% |
| Total | 59 | 100.0% |
School Enrollment by Age by Funding Source in Onekama
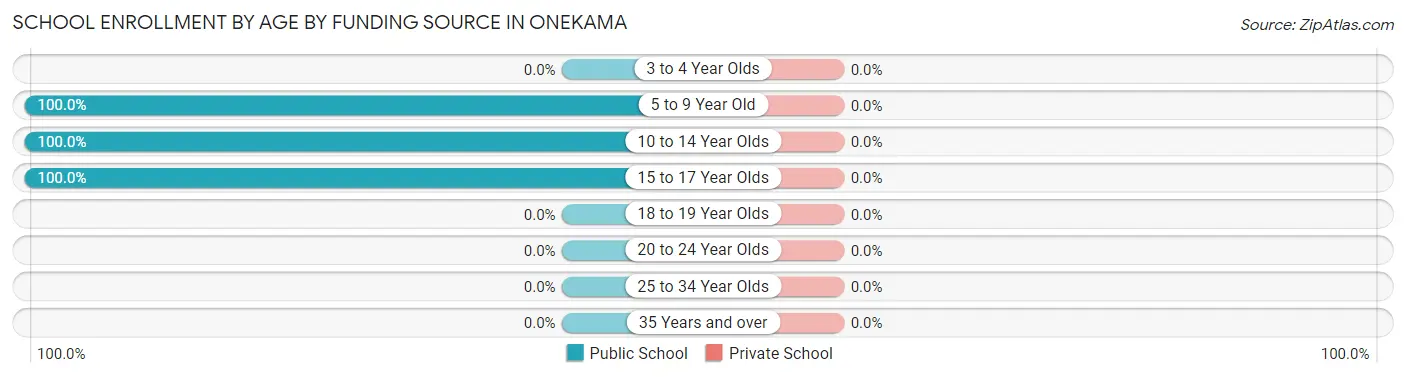
| Age Bracket | Public School | Private School |
| 3 to 4 Year Olds | 0 (0.0%) | 0 (0.0%) |
| 5 to 9 Year Old | 21 (100.0%) | 0 (0.0%) |
| 10 to 14 Year Olds | 22 (100.0%) | 0 (0.0%) |
| 15 to 17 Year Olds | 16 (100.0%) | 0 (0.0%) |
| 18 to 19 Year Olds | 0 (0.0%) | 0 (0.0%) |
| 20 to 24 Year Olds | 0 (0.0%) | 0 (0.0%) |
| 25 to 34 Year Olds | 0 (0.0%) | 0 (0.0%) |
| 35 Years and over | 0 (0.0%) | 0 (0.0%) |
| Total | 59 (100.0%) | 0 (0.0%) |
Educational Attainment by Field of Study in Onekama
Education (26 | 33.8%), science & technology (21 | 27.3%), literature & languages (8 | 10.4%), engineering (6 | 7.8%), and social sciences (4 | 5.2%) are the most common fields of study among 77 individuals in Onekama who have obtained a bachelor's degree or higher.
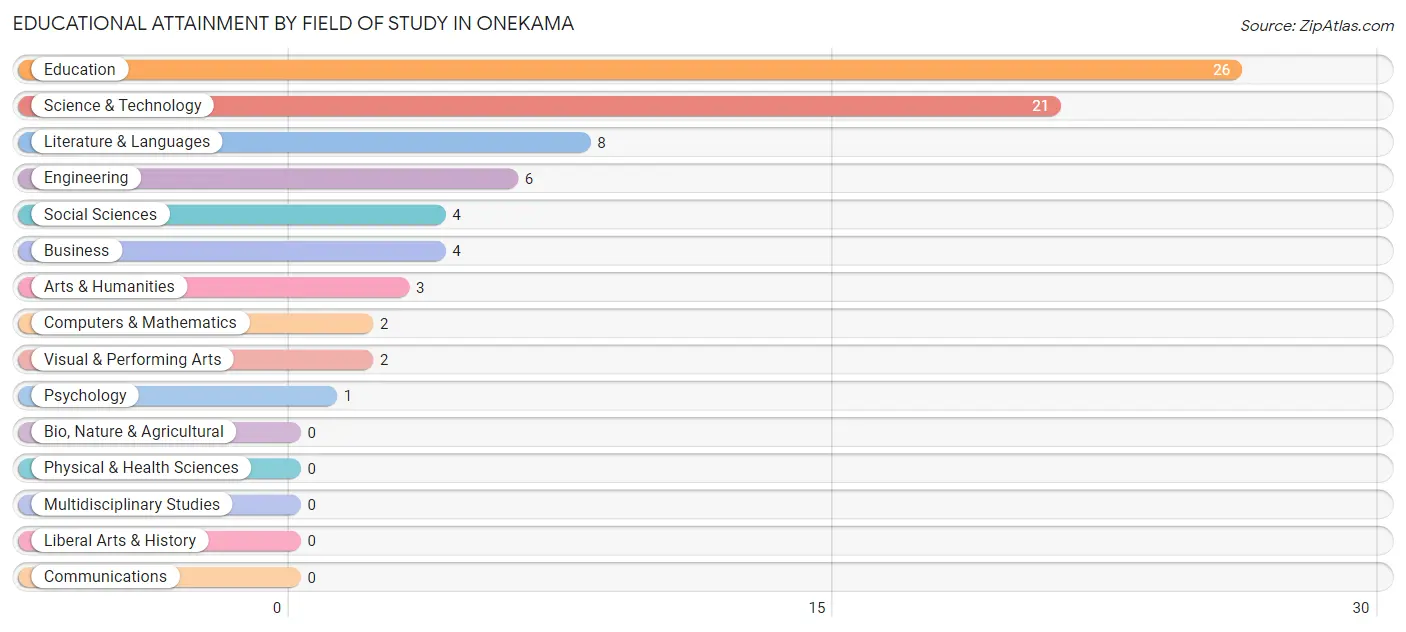
| Field of Study | # Graduates | % Graduates |
| Computers & Mathematics | 2 | 2.6% |
| Bio, Nature & Agricultural | 0 | 0.0% |
| Physical & Health Sciences | 0 | 0.0% |
| Psychology | 1 | 1.3% |
| Social Sciences | 4 | 5.2% |
| Engineering | 6 | 7.8% |
| Multidisciplinary Studies | 0 | 0.0% |
| Science & Technology | 21 | 27.3% |
| Business | 4 | 5.2% |
| Education | 26 | 33.8% |
| Literature & Languages | 8 | 10.4% |
| Liberal Arts & History | 0 | 0.0% |
| Visual & Performing Arts | 2 | 2.6% |
| Communications | 0 | 0.0% |
| Arts & Humanities | 3 | 3.9% |
| Total | 77 | 100.0% |
Transportation & Commute in Onekama
Vehicle Availability by Sex in Onekama
The most prevalent vehicle ownership categories in Onekama are males with 3 vehicles (42, accounting for 56.8%) and females with 3 vehicles (40, making up 46.2%).
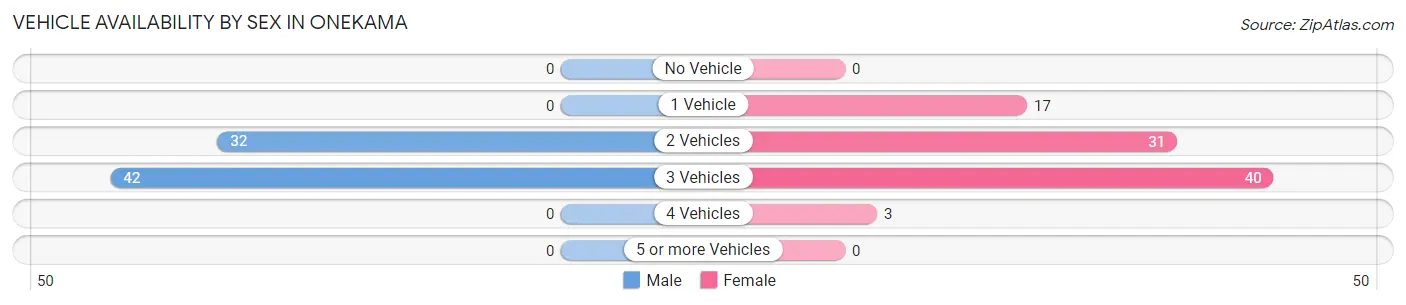
| Vehicles Available | Male | Female |
| No Vehicle | 0 (0.0%) | 0 (0.0%) |
| 1 Vehicle | 0 (0.0%) | 17 (18.7%) |
| 2 Vehicles | 32 (43.2%) | 31 (34.1%) |
| 3 Vehicles | 42 (56.8%) | 40 (44.0%) |
| 4 Vehicles | 0 (0.0%) | 3 (3.3%) |
| 5 or more Vehicles | 0 (0.0%) | 0 (0.0%) |
| Total | 74 (100.0%) | 91 (100.0%) |
Commute Time in Onekama
The most frequently occuring commute durations in Onekama are 15 to 19 minutes (40 commuters, 25.0%), 30 to 34 minutes (30 commuters, 18.8%), and less than 5 minutes (29 commuters, 18.1%).
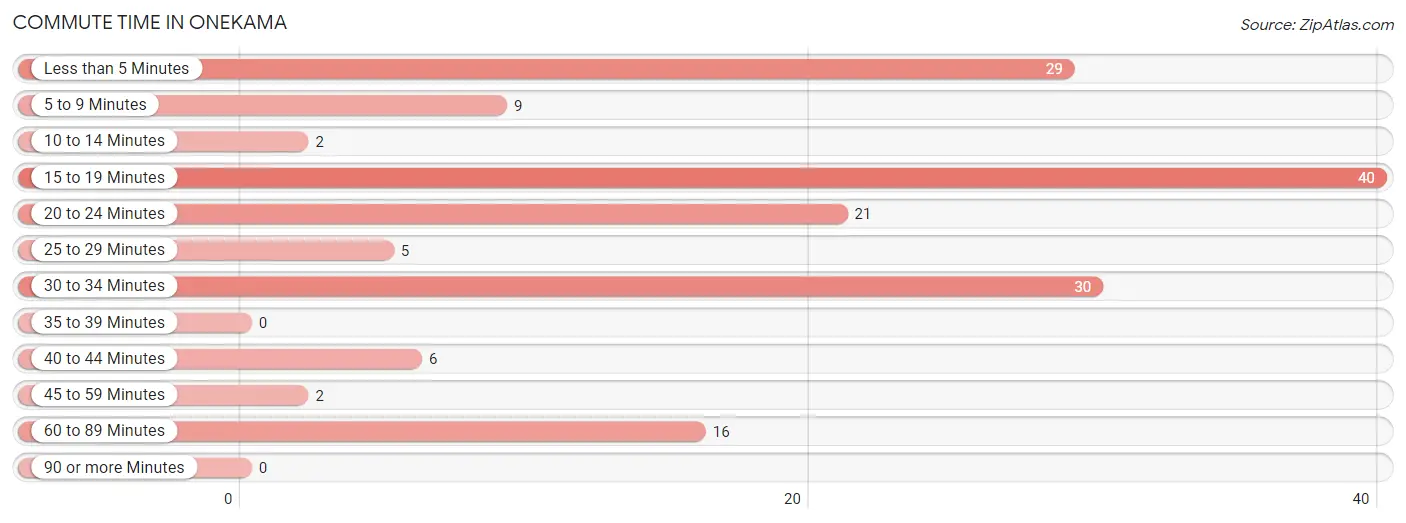
| Commute Time | # Commuters | % Commuters |
| Less than 5 Minutes | 29 | 18.1% |
| 5 to 9 Minutes | 9 | 5.6% |
| 10 to 14 Minutes | 2 | 1.3% |
| 15 to 19 Minutes | 40 | 25.0% |
| 20 to 24 Minutes | 21 | 13.1% |
| 25 to 29 Minutes | 5 | 3.1% |
| 30 to 34 Minutes | 30 | 18.8% |
| 35 to 39 Minutes | 0 | 0.0% |
| 40 to 44 Minutes | 6 | 3.7% |
| 45 to 59 Minutes | 2 | 1.3% |
| 60 to 89 Minutes | 16 | 10.0% |
| 90 or more Minutes | 0 | 0.0% |
Commute Time by Sex in Onekama
The most common commute times in Onekama are 30 to 34 minutes (29 commuters, 39.7%) for males and 15 to 19 minutes (26 commuters, 29.9%) for females.
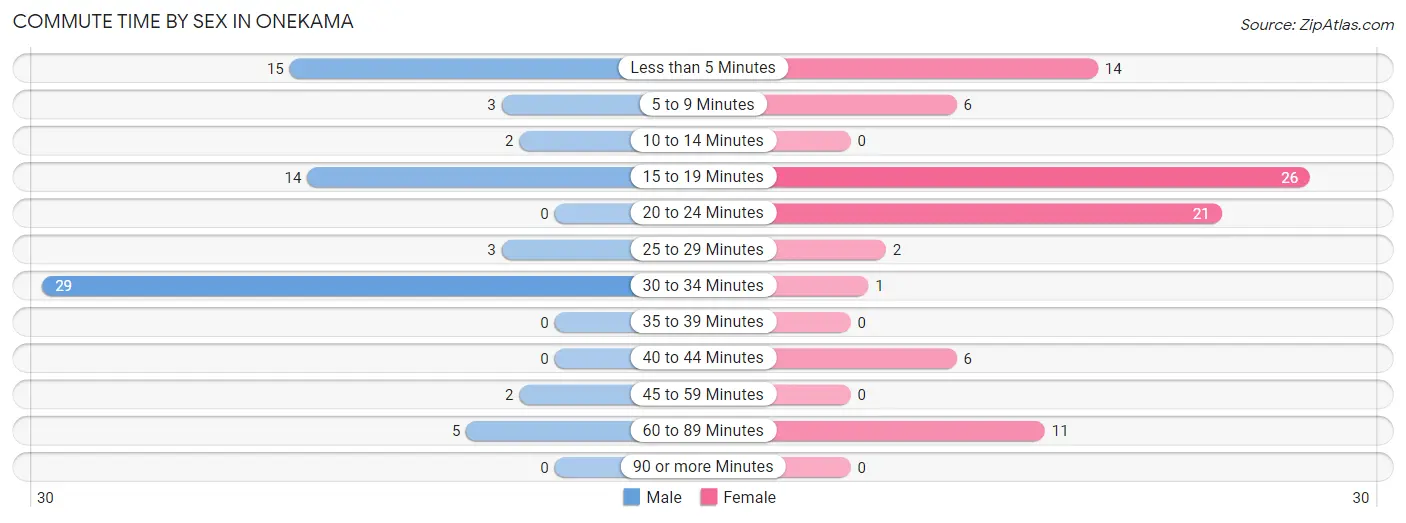
| Commute Time | Male | Female |
| Less than 5 Minutes | 15 (20.5%) | 14 (16.1%) |
| 5 to 9 Minutes | 3 (4.1%) | 6 (6.9%) |
| 10 to 14 Minutes | 2 (2.7%) | 0 (0.0%) |
| 15 to 19 Minutes | 14 (19.2%) | 26 (29.9%) |
| 20 to 24 Minutes | 0 (0.0%) | 21 (24.1%) |
| 25 to 29 Minutes | 3 (4.1%) | 2 (2.3%) |
| 30 to 34 Minutes | 29 (39.7%) | 1 (1.1%) |
| 35 to 39 Minutes | 0 (0.0%) | 0 (0.0%) |
| 40 to 44 Minutes | 0 (0.0%) | 6 (6.9%) |
| 45 to 59 Minutes | 2 (2.7%) | 0 (0.0%) |
| 60 to 89 Minutes | 5 (6.9%) | 11 (12.6%) |
| 90 or more Minutes | 0 (0.0%) | 0 (0.0%) |
Time of Departure to Work by Sex in Onekama
The most frequent times of departure to work in Onekama are 5:00 AM to 5:29 AM (21, 28.8%) for males and 6:30 AM to 6:59 AM (21, 24.1%) for females.
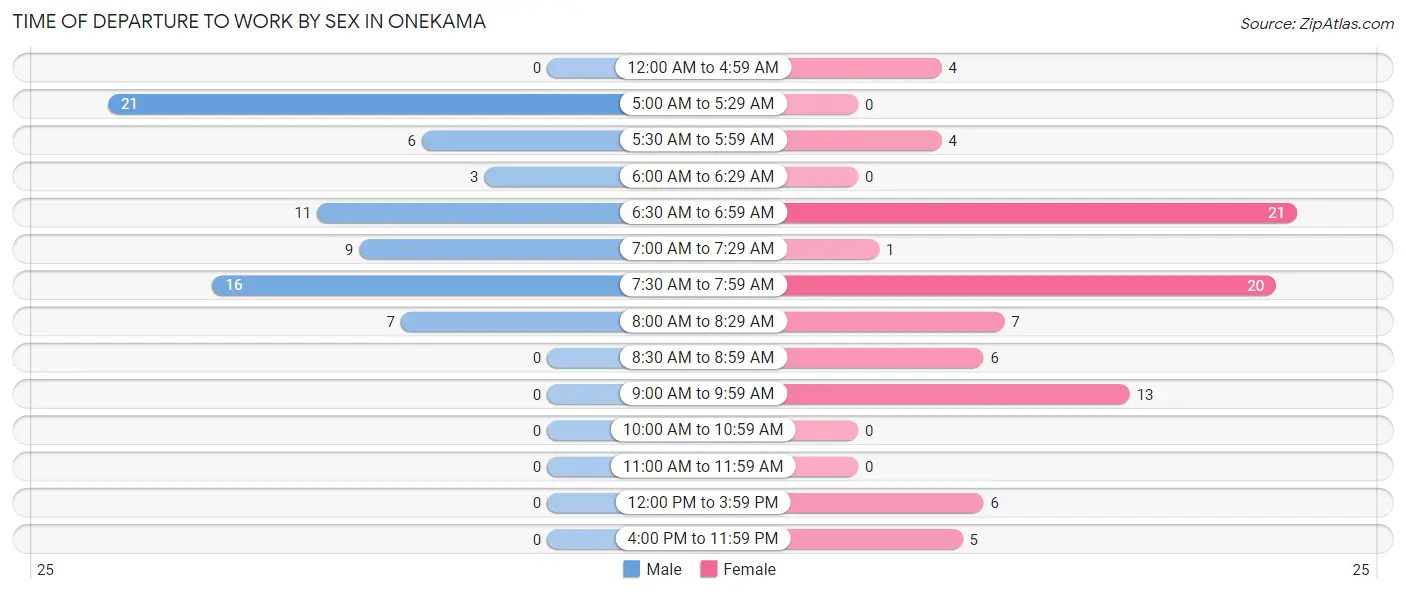
| Time of Departure | Male | Female |
| 12:00 AM to 4:59 AM | 0 (0.0%) | 4 (4.6%) |
| 5:00 AM to 5:29 AM | 21 (28.8%) | 0 (0.0%) |
| 5:30 AM to 5:59 AM | 6 (8.2%) | 4 (4.6%) |
| 6:00 AM to 6:29 AM | 3 (4.1%) | 0 (0.0%) |
| 6:30 AM to 6:59 AM | 11 (15.1%) | 21 (24.1%) |
| 7:00 AM to 7:29 AM | 9 (12.3%) | 1 (1.1%) |
| 7:30 AM to 7:59 AM | 16 (21.9%) | 20 (23.0%) |
| 8:00 AM to 8:29 AM | 7 (9.6%) | 7 (8.1%) |
| 8:30 AM to 8:59 AM | 0 (0.0%) | 6 (6.9%) |
| 9:00 AM to 9:59 AM | 0 (0.0%) | 13 (14.9%) |
| 10:00 AM to 10:59 AM | 0 (0.0%) | 0 (0.0%) |
| 11:00 AM to 11:59 AM | 0 (0.0%) | 0 (0.0%) |
| 12:00 PM to 3:59 PM | 0 (0.0%) | 6 (6.9%) |
| 4:00 PM to 11:59 PM | 0 (0.0%) | 5 (5.8%) |
| Total | 73 (100.0%) | 87 (100.0%) |
Housing Occupancy in Onekama
Occupancy by Ownership in Onekama
Of the total 168 dwellings in Onekama, owner-occupied units account for 152 (90.5%), while renter-occupied units make up 16 (9.5%).
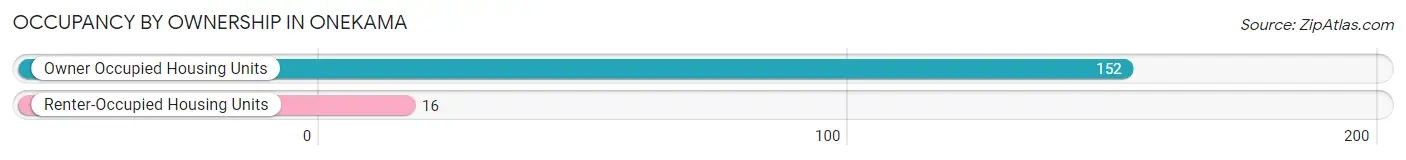
| Occupancy | # Housing Units | % Housing Units |
| Owner Occupied Housing Units | 152 | 90.5% |
| Renter-Occupied Housing Units | 16 | 9.5% |
| Total Occupied Housing Units | 168 | 100.0% |
Occupancy by Household Size in Onekama
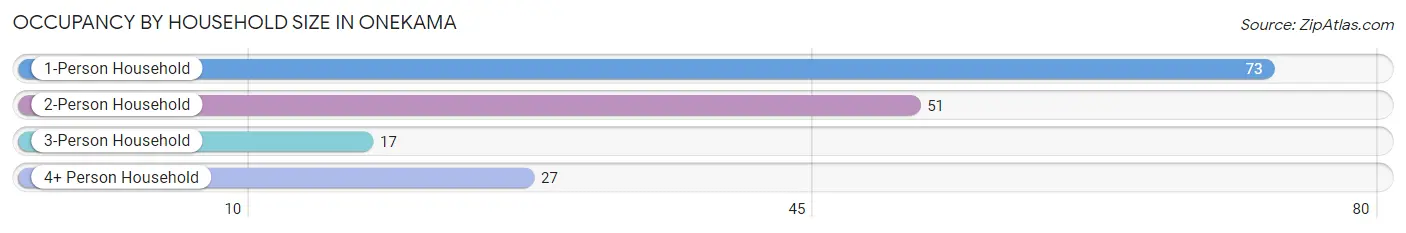
| Household Size | # Housing Units | % Housing Units |
| 1-Person Household | 73 | 43.4% |
| 2-Person Household | 51 | 30.4% |
| 3-Person Household | 17 | 10.1% |
| 4+ Person Household | 27 | 16.1% |
| Total Housing Units | 168 | 100.0% |
Occupancy by Ownership by Household Size in Onekama
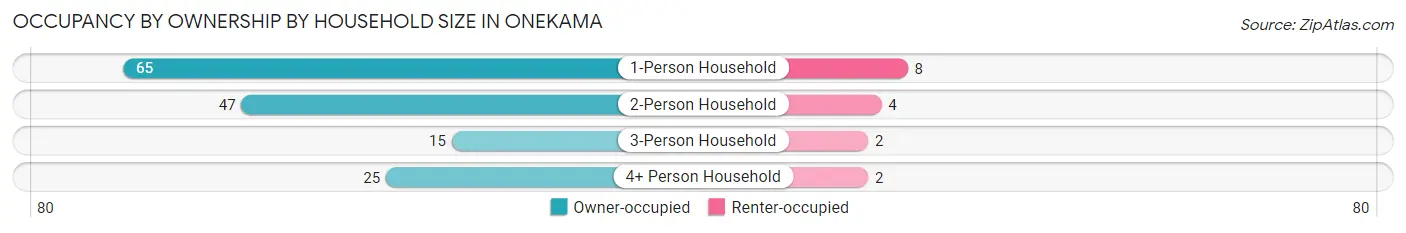
| Household Size | Owner-occupied | Renter-occupied |
| 1-Person Household | 65 (89.0%) | 8 (11.0%) |
| 2-Person Household | 47 (92.2%) | 4 (7.8%) |
| 3-Person Household | 15 (88.2%) | 2 (11.8%) |
| 4+ Person Household | 25 (92.6%) | 2 (7.4%) |
| Total Housing Units | 152 (90.5%) | 16 (9.5%) |
Occupancy by Educational Attainment in Onekama
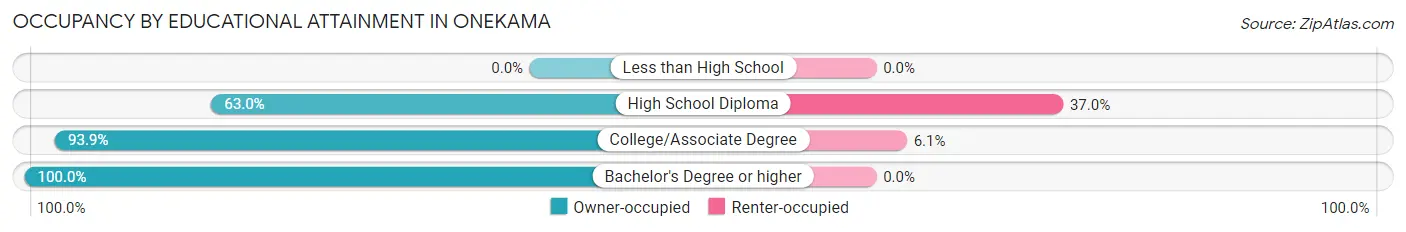
| Household Size | Owner-occupied | Renter-occupied |
| Less than High School | 0 (0.0%) | 0 (0.0%) |
| High School Diploma | 17 (63.0%) | 10 (37.0%) |
| College/Associate Degree | 93 (93.9%) | 6 (6.1%) |
| Bachelor's Degree or higher | 42 (100.0%) | 0 (0.0%) |
Occupancy by Age of Householder in Onekama
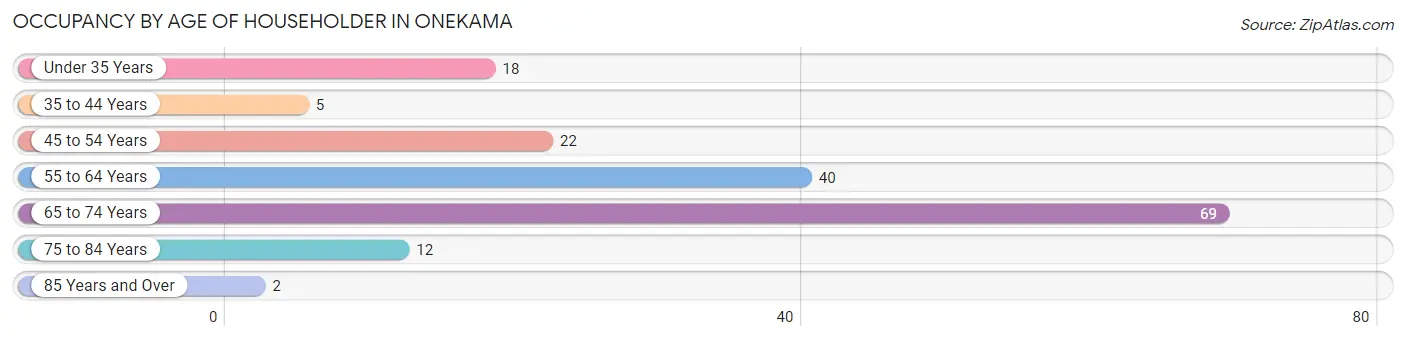
| Age Bracket | # Households | % Households |
| Under 35 Years | 18 | 10.7% |
| 35 to 44 Years | 5 | 3.0% |
| 45 to 54 Years | 22 | 13.1% |
| 55 to 64 Years | 40 | 23.8% |
| 65 to 74 Years | 69 | 41.1% |
| 75 to 84 Years | 12 | 7.1% |
| 85 Years and Over | 2 | 1.2% |
| Total | 168 | 100.0% |
Housing Finances in Onekama
Median Income by Occupancy in Onekama
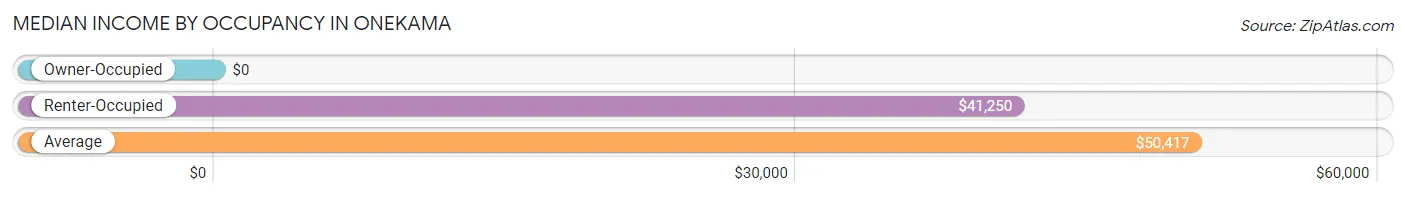
| Occupancy Type | # Households | Median Income |
| Owner-Occupied | 152 (90.5%) | $0 |
| Renter-Occupied | 16 (9.5%) | $41,250 |
| Average | 168 (100.0%) | $50,417 |
Occupancy by Householder Income Bracket in Onekama
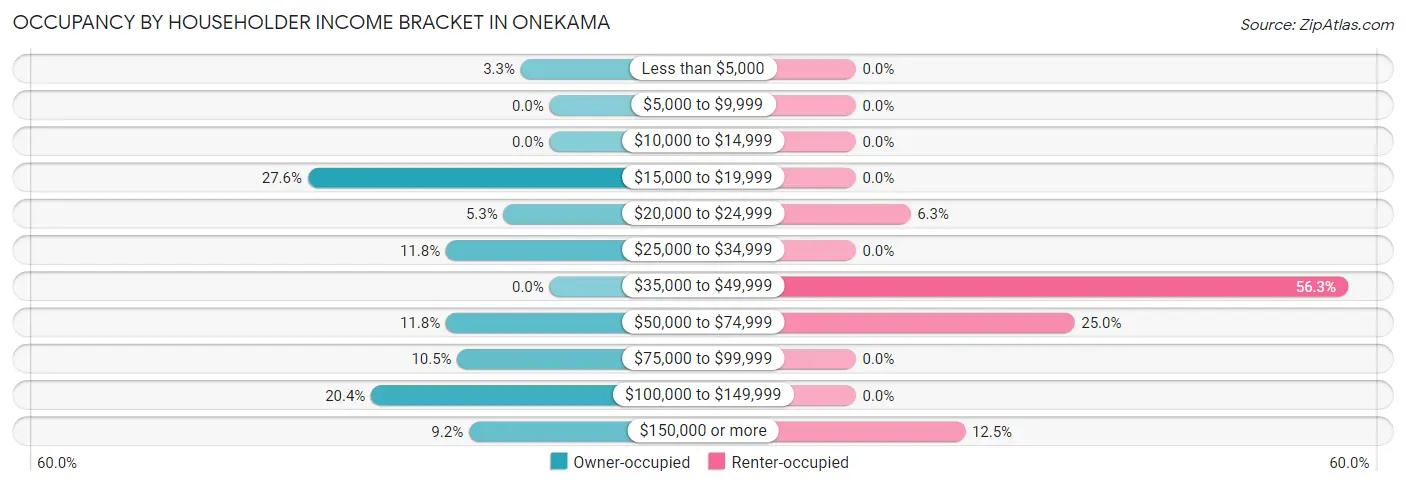
| Income Bracket | Owner-occupied | Renter-occupied |
| Less than $5,000 | 5 (3.3%) | 0 (0.0%) |
| $5,000 to $9,999 | 0 (0.0%) | 0 (0.0%) |
| $10,000 to $14,999 | 0 (0.0%) | 0 (0.0%) |
| $15,000 to $19,999 | 42 (27.6%) | 0 (0.0%) |
| $20,000 to $24,999 | 8 (5.3%) | 1 (6.2%) |
| $25,000 to $34,999 | 18 (11.8%) | 0 (0.0%) |
| $35,000 to $49,999 | 0 (0.0%) | 9 (56.2%) |
| $50,000 to $74,999 | 18 (11.8%) | 4 (25.0%) |
| $75,000 to $99,999 | 16 (10.5%) | 0 (0.0%) |
| $100,000 to $149,999 | 31 (20.4%) | 0 (0.0%) |
| $150,000 or more | 14 (9.2%) | 2 (12.5%) |
| Total | 152 (100.0%) | 16 (100.0%) |
Monthly Housing Cost Tiers in Onekama
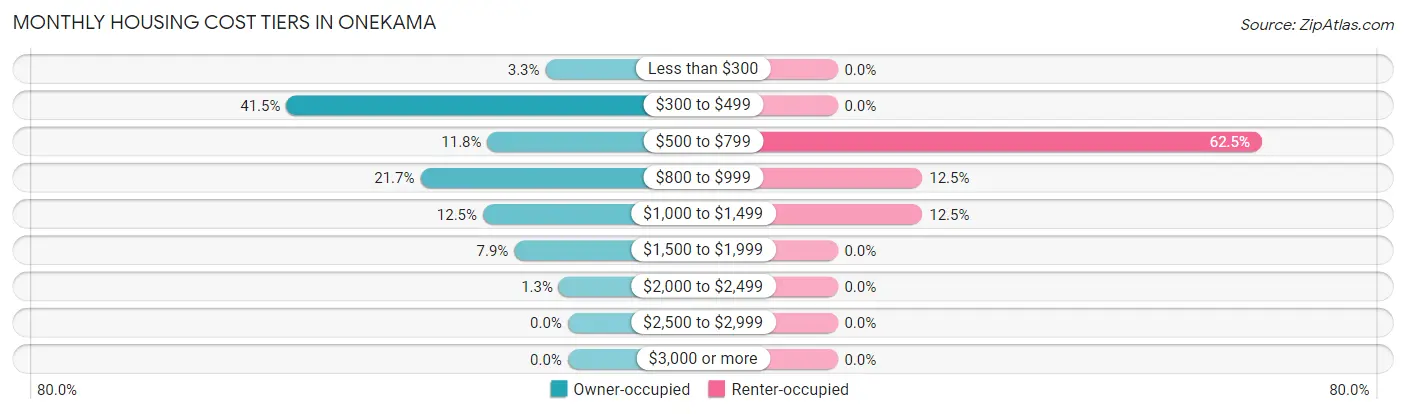
| Monthly Cost | Owner-occupied | Renter-occupied |
| Less than $300 | 5 (3.3%) | 0 (0.0%) |
| $300 to $499 | 63 (41.4%) | 0 (0.0%) |
| $500 to $799 | 18 (11.8%) | 10 (62.5%) |
| $800 to $999 | 33 (21.7%) | 2 (12.5%) |
| $1,000 to $1,499 | 19 (12.5%) | 2 (12.5%) |
| $1,500 to $1,999 | 12 (7.9%) | 0 (0.0%) |
| $2,000 to $2,499 | 2 (1.3%) | 0 (0.0%) |
| $2,500 to $2,999 | 0 (0.0%) | 0 (0.0%) |
| $3,000 or more | 0 (0.0%) | 0 (0.0%) |
| Total | 152 (100.0%) | 16 (100.0%) |
Physical Housing Characteristics in Onekama
Housing Structures in Onekama
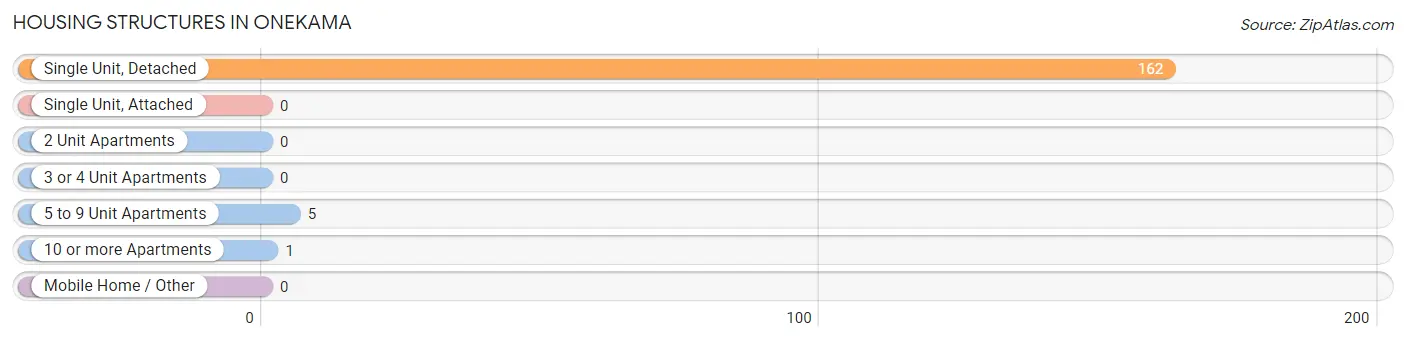
| Structure Type | # Housing Units | % Housing Units |
| Single Unit, Detached | 162 | 96.4% |
| Single Unit, Attached | 0 | 0.0% |
| 2 Unit Apartments | 0 | 0.0% |
| 3 or 4 Unit Apartments | 0 | 0.0% |
| 5 to 9 Unit Apartments | 5 | 3.0% |
| 10 or more Apartments | 1 | 0.6% |
| Mobile Home / Other | 0 | 0.0% |
| Total | 168 | 100.0% |
Housing Structures by Occupancy in Onekama
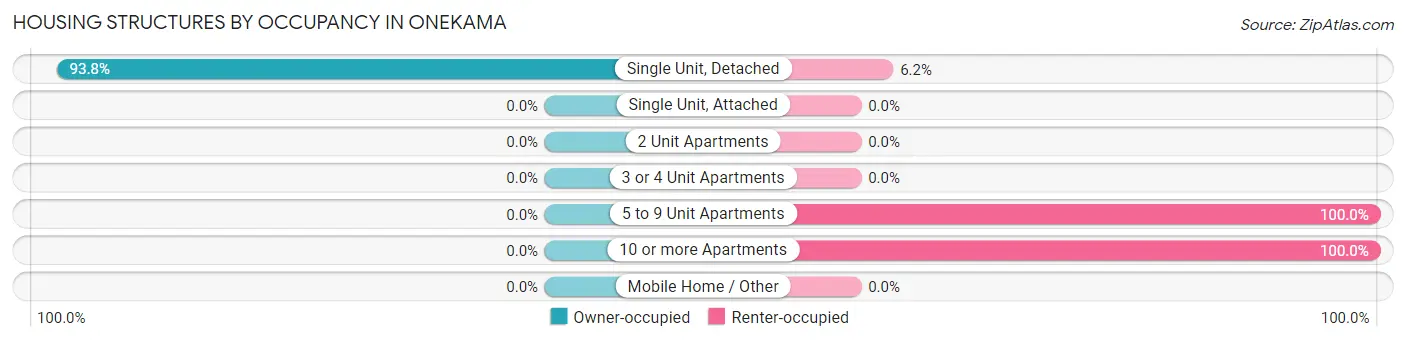
| Structure Type | Owner-occupied | Renter-occupied |
| Single Unit, Detached | 152 (93.8%) | 10 (6.2%) |
| Single Unit, Attached | 0 (0.0%) | 0 (0.0%) |
| 2 Unit Apartments | 0 (0.0%) | 0 (0.0%) |
| 3 or 4 Unit Apartments | 0 (0.0%) | 0 (0.0%) |
| 5 to 9 Unit Apartments | 0 (0.0%) | 5 (100.0%) |
| 10 or more Apartments | 0 (0.0%) | 1 (100.0%) |
| Mobile Home / Other | 0 (0.0%) | 0 (0.0%) |
| Total | 152 (90.5%) | 16 (9.5%) |
Housing Structures by Number of Rooms in Onekama
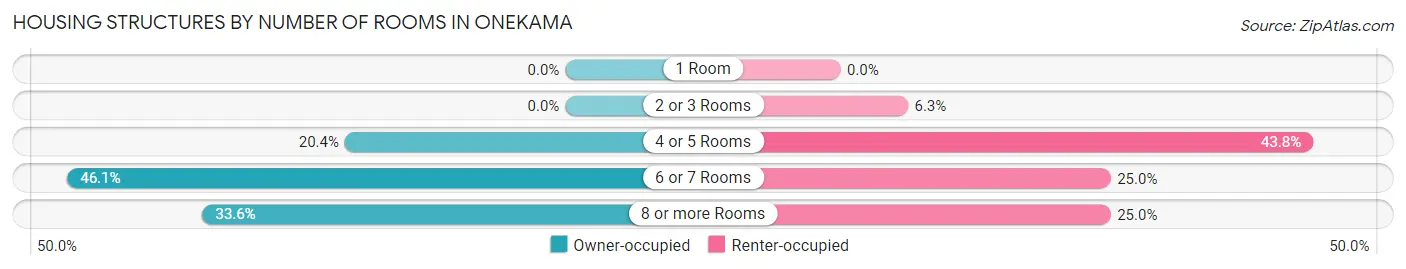
| Number of Rooms | Owner-occupied | Renter-occupied |
| 1 Room | 0 (0.0%) | 0 (0.0%) |
| 2 or 3 Rooms | 0 (0.0%) | 1 (6.2%) |
| 4 or 5 Rooms | 31 (20.4%) | 7 (43.8%) |
| 6 or 7 Rooms | 70 (46.1%) | 4 (25.0%) |
| 8 or more Rooms | 51 (33.6%) | 4 (25.0%) |
| Total | 152 (100.0%) | 16 (100.0%) |
Housing Structure by Heating Type in Onekama
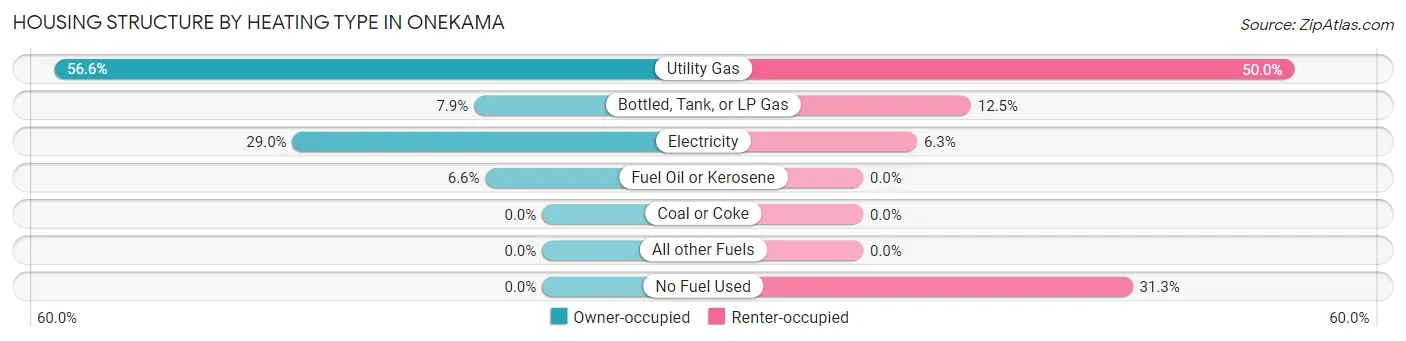
| Heating Type | Owner-occupied | Renter-occupied |
| Utility Gas | 86 (56.6%) | 8 (50.0%) |
| Bottled, Tank, or LP Gas | 12 (7.9%) | 2 (12.5%) |
| Electricity | 44 (28.9%) | 1 (6.2%) |
| Fuel Oil or Kerosene | 10 (6.6%) | 0 (0.0%) |
| Coal or Coke | 0 (0.0%) | 0 (0.0%) |
| All other Fuels | 0 (0.0%) | 0 (0.0%) |
| No Fuel Used | 0 (0.0%) | 5 (31.2%) |
| Total | 152 (100.0%) | 16 (100.0%) |
Household Vehicle Usage in Onekama
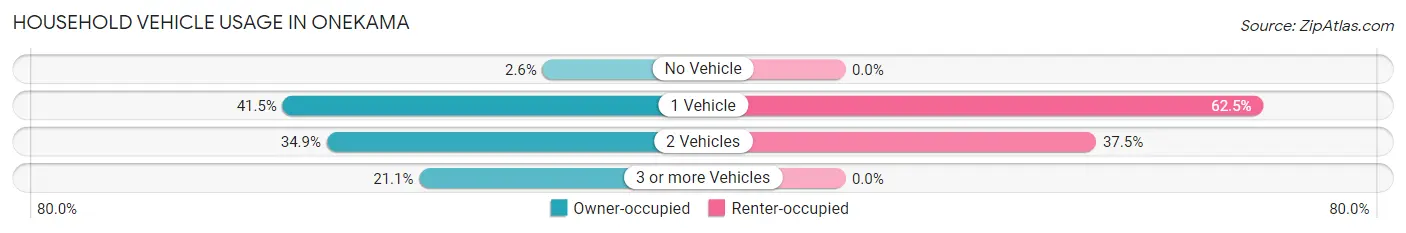
| Vehicles per Household | Owner-occupied | Renter-occupied |
| No Vehicle | 4 (2.6%) | 0 (0.0%) |
| 1 Vehicle | 63 (41.4%) | 10 (62.5%) |
| 2 Vehicles | 53 (34.9%) | 6 (37.5%) |
| 3 or more Vehicles | 32 (21.0%) | 0 (0.0%) |
| Total | 152 (100.0%) | 16 (100.0%) |
Real Estate & Mortgages in Onekama
Real Estate and Mortgage Overview in Onekama
| Characteristic | Without Mortgage | With Mortgage |
| Housing Units | 90 | 62 |
| Median Property Value | $165,100 | $130,600 |
| Median Household Income | - | - |
| Monthly Housing Costs | $455 | $0 |
| Real Estate Taxes | $1,382 | $0 |
Property Value by Mortgage Status in Onekama
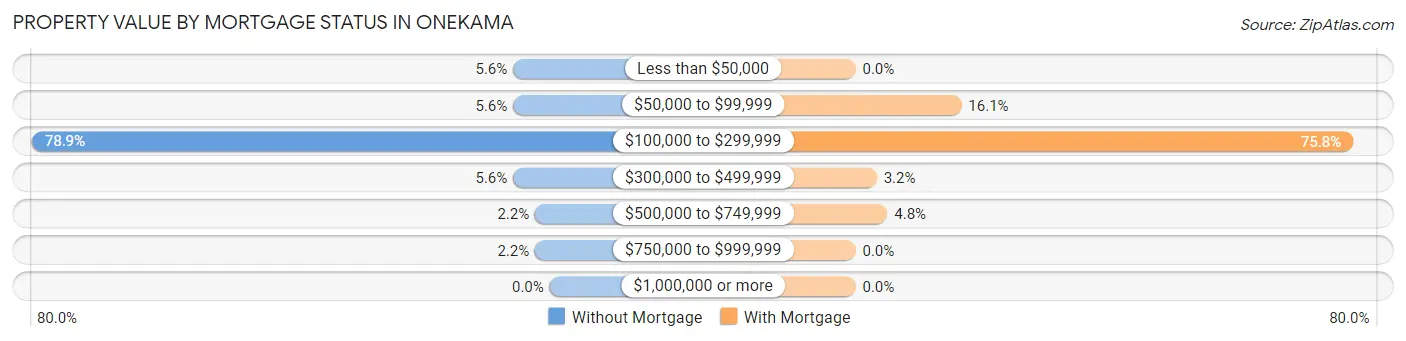
| Property Value | Without Mortgage | With Mortgage |
| Less than $50,000 | 5 (5.6%) | 0 (0.0%) |
| $50,000 to $99,999 | 5 (5.6%) | 10 (16.1%) |
| $100,000 to $299,999 | 71 (78.9%) | 47 (75.8%) |
| $300,000 to $499,999 | 5 (5.6%) | 2 (3.2%) |
| $500,000 to $749,999 | 2 (2.2%) | 3 (4.8%) |
| $750,000 to $999,999 | 2 (2.2%) | 0 (0.0%) |
| $1,000,000 or more | 0 (0.0%) | 0 (0.0%) |
| Total | 90 (100.0%) | 62 (100.0%) |
Household Income by Mortgage Status in Onekama
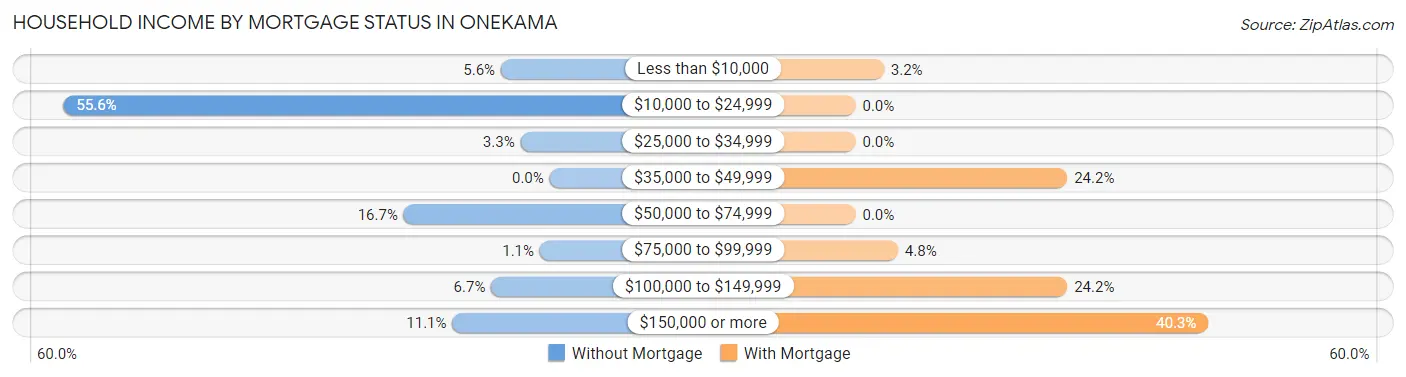
| Household Income | Without Mortgage | With Mortgage |
| Less than $10,000 | 5 (5.6%) | 2 (3.2%) |
| $10,000 to $24,999 | 50 (55.6%) | 0 (0.0%) |
| $25,000 to $34,999 | 3 (3.3%) | 0 (0.0%) |
| $35,000 to $49,999 | 0 (0.0%) | 15 (24.2%) |
| $50,000 to $74,999 | 15 (16.7%) | 0 (0.0%) |
| $75,000 to $99,999 | 1 (1.1%) | 3 (4.8%) |
| $100,000 to $149,999 | 6 (6.7%) | 15 (24.2%) |
| $150,000 or more | 10 (11.1%) | 25 (40.3%) |
| Total | 90 (100.0%) | 62 (100.0%) |
Property Value to Household Income Ratio in Onekama
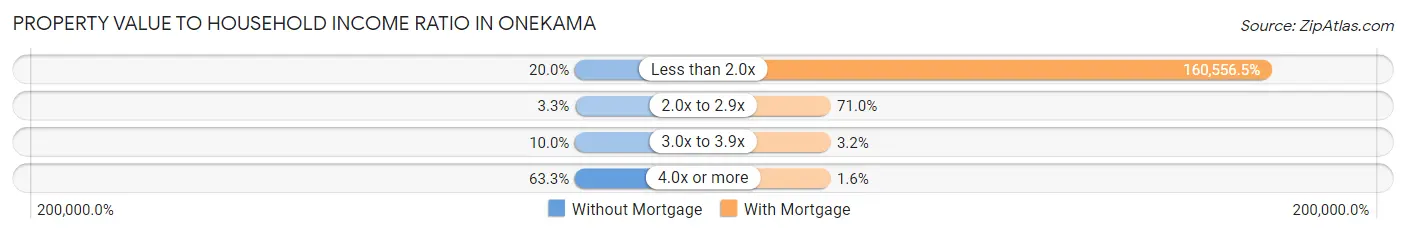
| Value-to-Income Ratio | Without Mortgage | With Mortgage |
| Less than 2.0x | 18 (20.0%) | 99,545 (160,556.4%) |
| 2.0x to 2.9x | 3 (3.3%) | 44 (71.0%) |
| 3.0x to 3.9x | 9 (10.0%) | 2 (3.2%) |
| 4.0x or more | 57 (63.3%) | 1 (1.6%) |
| Total | 90 (100.0%) | 62 (100.0%) |
Real Estate Taxes by Mortgage Status in Onekama
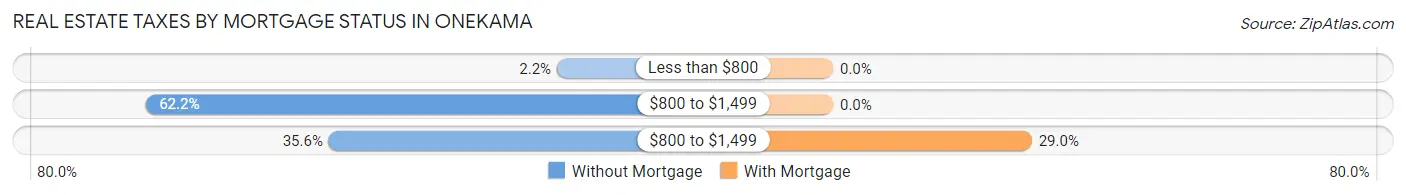
| Property Taxes | Without Mortgage | With Mortgage |
| Less than $800 | 2 (2.2%) | 0 (0.0%) |
| $800 to $1,499 | 56 (62.2%) | 0 (0.0%) |
| $800 to $1,499 | 32 (35.6%) | 18 (29.0%) |
| Total | 90 (100.0%) | 62 (100.0%) |
Health & Disability in Onekama
Health Insurance Coverage by Age in Onekama
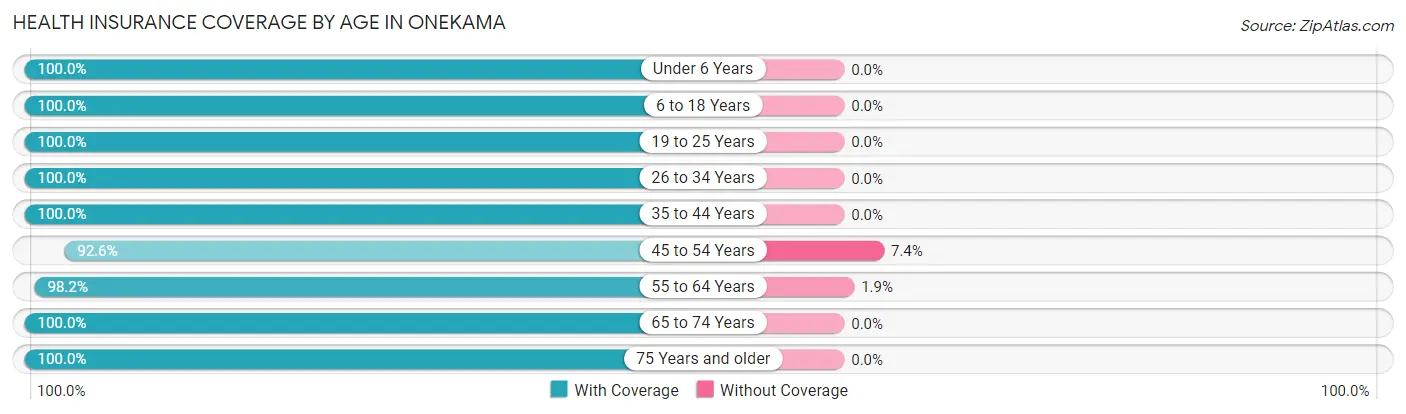
| Age Bracket | With Coverage | Without Coverage |
| Under 6 Years | 13 (100.0%) | 0 (0.0%) |
| 6 to 18 Years | 51 (100.0%) | 0 (0.0%) |
| 19 to 25 Years | 25 (100.0%) | 0 (0.0%) |
| 26 to 34 Years | 28 (100.0%) | 0 (0.0%) |
| 35 to 44 Years | 11 (100.0%) | 0 (0.0%) |
| 45 to 54 Years | 50 (92.6%) | 4 (7.4%) |
| 55 to 64 Years | 53 (98.2%) | 1 (1.8%) |
| 65 to 74 Years | 87 (100.0%) | 0 (0.0%) |
| 75 Years and older | 24 (100.0%) | 0 (0.0%) |
| Total | 342 (98.6%) | 5 (1.4%) |
Health Insurance Coverage by Citizenship Status in Onekama
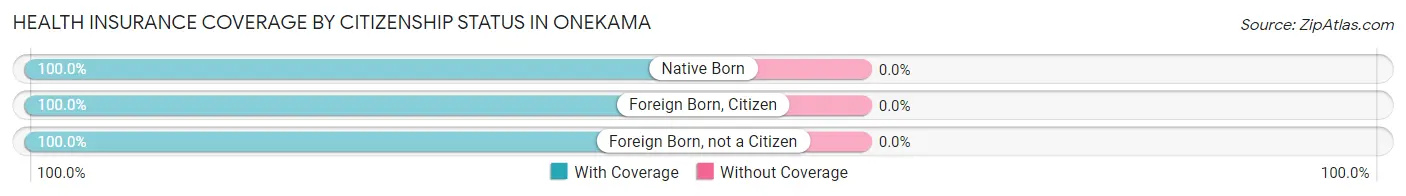
| Citizenship Status | With Coverage | Without Coverage |
| Native Born | 13 (100.0%) | 0 (0.0%) |
| Foreign Born, Citizen | 51 (100.0%) | 0 (0.0%) |
| Foreign Born, not a Citizen | 25 (100.0%) | 0 (0.0%) |
Health Insurance Coverage by Household Income in Onekama

| Household Income | With Coverage | Without Coverage |
| Under $25,000 | 54 (94.7%) | 3 (5.3%) |
| $25,000 to $49,999 | 40 (100.0%) | 0 (0.0%) |
| $50,000 to $74,999 | 44 (100.0%) | 0 (0.0%) |
| $75,000 to $99,999 | 43 (100.0%) | 0 (0.0%) |
| $100,000 and over | 161 (98.8%) | 2 (1.2%) |
Public vs Private Health Insurance Coverage by Age in Onekama
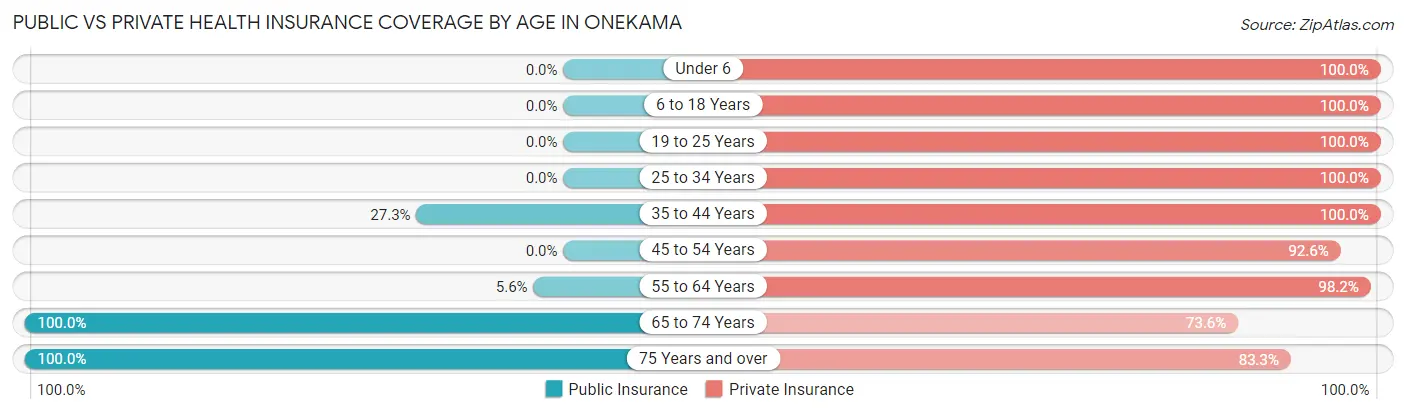
| Age Bracket | Public Insurance | Private Insurance |
| Under 6 | 0 (0.0%) | 13 (100.0%) |
| 6 to 18 Years | 0 (0.0%) | 51 (100.0%) |
| 19 to 25 Years | 0 (0.0%) | 25 (100.0%) |
| 25 to 34 Years | 0 (0.0%) | 28 (100.0%) |
| 35 to 44 Years | 3 (27.3%) | 11 (100.0%) |
| 45 to 54 Years | 0 (0.0%) | 50 (92.6%) |
| 55 to 64 Years | 3 (5.6%) | 53 (98.2%) |
| 65 to 74 Years | 87 (100.0%) | 64 (73.6%) |
| 75 Years and over | 24 (100.0%) | 20 (83.3%) |
| Total | 117 (33.7%) | 315 (90.8%) |
Disability Status by Sex by Age in Onekama
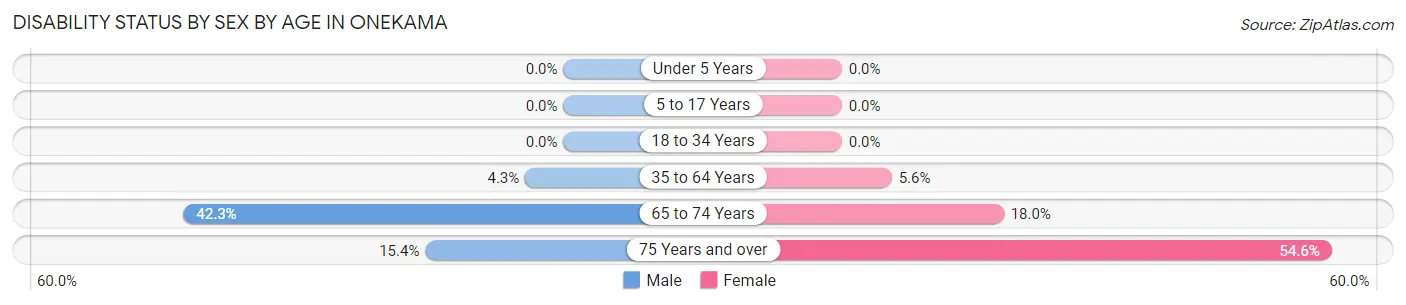
| Age Bracket | Male | Female |
| Under 5 Years | 0 (0.0%) | 0 (0.0%) |
| 5 to 17 Years | 0 (0.0%) | 0 (0.0%) |
| 18 to 34 Years | 0 (0.0%) | 0 (0.0%) |
| 35 to 64 Years | 2 (4.3%) | 4 (5.6%) |
| 65 to 74 Years | 11 (42.3%) | 11 (18.0%) |
| 75 Years and over | 2 (15.4%) | 6 (54.5%) |
Disability Class by Sex by Age in Onekama
Disability Class: Hearing Difficulty
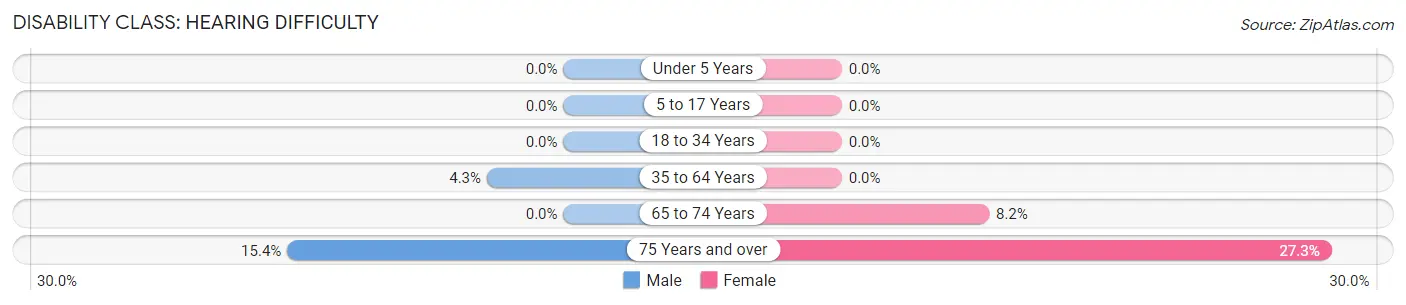
| Age Bracket | Male | Female |
| Under 5 Years | 0 (0.0%) | 0 (0.0%) |
| 5 to 17 Years | 0 (0.0%) | 0 (0.0%) |
| 18 to 34 Years | 0 (0.0%) | 0 (0.0%) |
| 35 to 64 Years | 2 (4.3%) | 0 (0.0%) |
| 65 to 74 Years | 0 (0.0%) | 5 (8.2%) |
| 75 Years and over | 2 (15.4%) | 3 (27.3%) |
Disability Class: Vision Difficulty
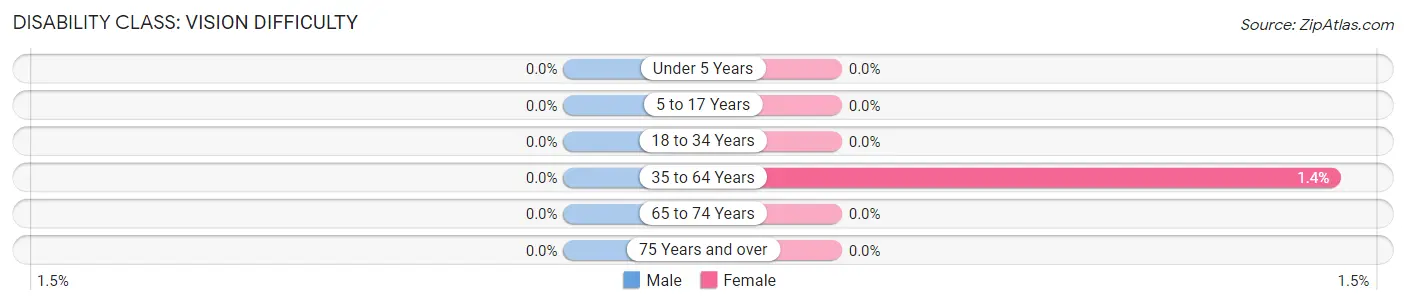
| Age Bracket | Male | Female |
| Under 5 Years | 0 (0.0%) | 0 (0.0%) |
| 5 to 17 Years | 0 (0.0%) | 0 (0.0%) |
| 18 to 34 Years | 0 (0.0%) | 0 (0.0%) |
| 35 to 64 Years | 0 (0.0%) | 1 (1.4%) |
| 65 to 74 Years | 0 (0.0%) | 0 (0.0%) |
| 75 Years and over | 0 (0.0%) | 0 (0.0%) |
Disability Class: Cognitive Difficulty
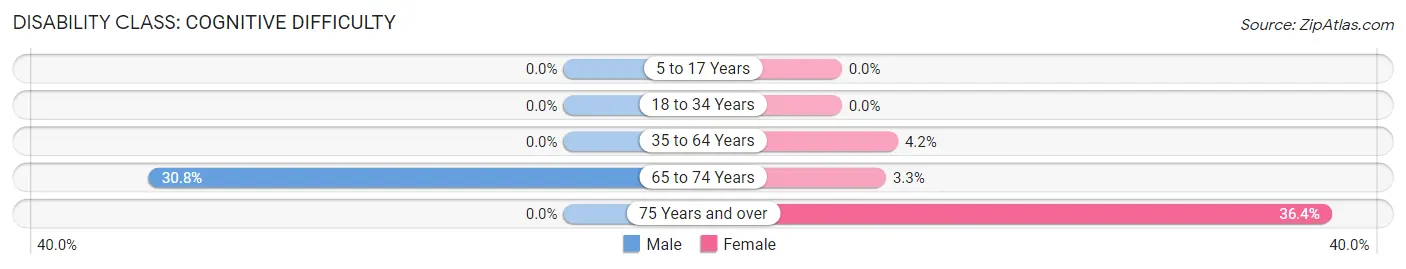
| Age Bracket | Male | Female |
| 5 to 17 Years | 0 (0.0%) | 0 (0.0%) |
| 18 to 34 Years | 0 (0.0%) | 0 (0.0%) |
| 35 to 64 Years | 0 (0.0%) | 3 (4.2%) |
| 65 to 74 Years | 8 (30.8%) | 2 (3.3%) |
| 75 Years and over | 0 (0.0%) | 4 (36.4%) |
Disability Class: Ambulatory Difficulty
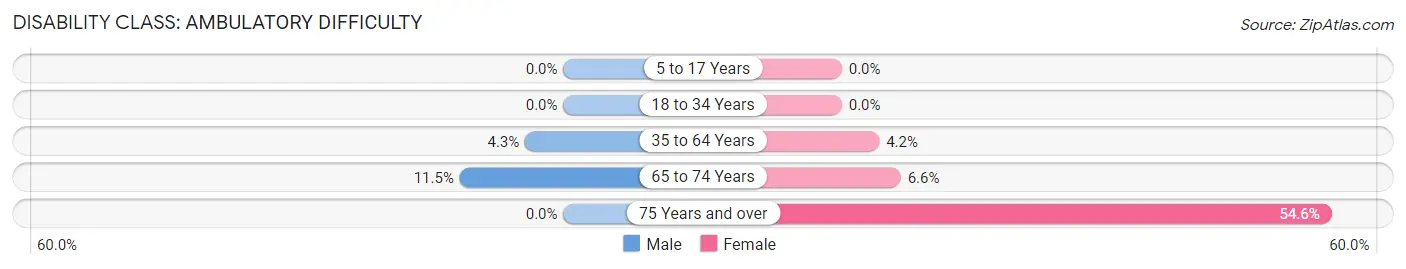
| Age Bracket | Male | Female |
| 5 to 17 Years | 0 (0.0%) | 0 (0.0%) |
| 18 to 34 Years | 0 (0.0%) | 0 (0.0%) |
| 35 to 64 Years | 2 (4.3%) | 3 (4.2%) |
| 65 to 74 Years | 3 (11.5%) | 4 (6.6%) |
| 75 Years and over | 0 (0.0%) | 6 (54.5%) |
Disability Class: Self-Care Difficulty
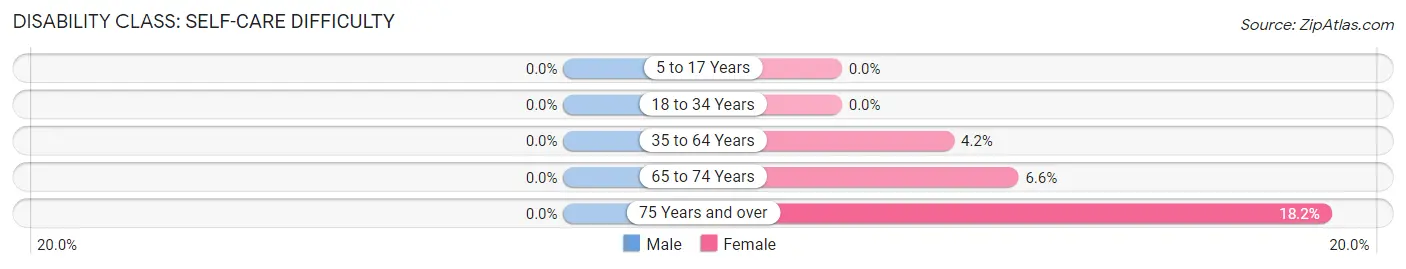
| Age Bracket | Male | Female |
| 5 to 17 Years | 0 (0.0%) | 0 (0.0%) |
| 18 to 34 Years | 0 (0.0%) | 0 (0.0%) |
| 35 to 64 Years | 0 (0.0%) | 3 (4.2%) |
| 65 to 74 Years | 0 (0.0%) | 4 (6.6%) |
| 75 Years and over | 0 (0.0%) | 2 (18.2%) |
Technology Access in Onekama
Computing Device Access in Onekama
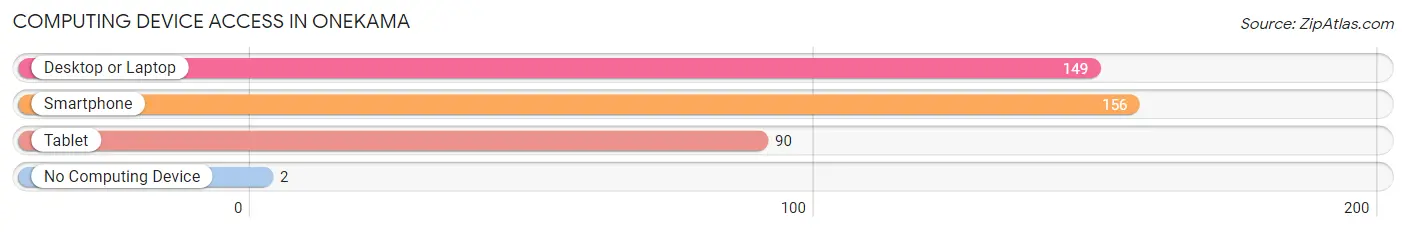
| Device Type | # Households | % Households |
| Desktop or Laptop | 149 | 88.7% |
| Smartphone | 156 | 92.9% |
| Tablet | 90 | 53.6% |
| No Computing Device | 2 | 1.2% |
| Total | 168 | 100.0% |
Internet Access in Onekama
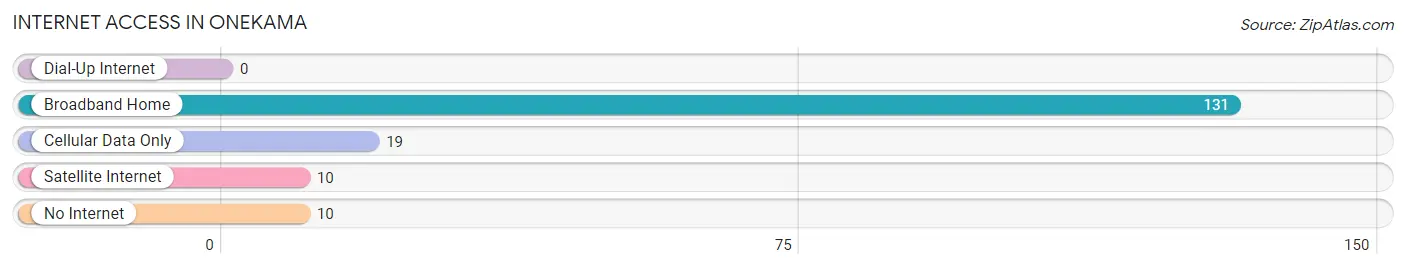
| Internet Type | # Households | % Households |
| Dial-Up Internet | 0 | 0.0% |
| Broadband Home | 131 | 78.0% |
| Cellular Data Only | 19 | 11.3% |
| Satellite Internet | 10 | 5.9% |
| No Internet | 10 | 5.9% |
| Total | 168 | 100.0% |
Onekama Summary
Onekama is a small village located in Manistee County, Michigan. It is situated on the shores of Lake Michigan and is part of the Manistee National Forest. The village has a population of approximately 500 people and is a popular tourist destination.
History
Onekama was first settled in 1854 by a group of settlers from New York. The village was originally known as “Portage” and was later renamed Onekama. The name is derived from the Ojibwe word “Onigamah” which means “portage”. The village was incorporated in 1891 and has remained a small, rural community ever since.
Geography
Onekama is located in the northwest corner of Manistee County, Michigan. It is situated on the shores of Lake Michigan and is part of the Manistee National Forest. The village is surrounded by rolling hills and forests and is home to several small lakes. The village is located approximately 30 miles from the city of Manistee and is accessible by car or boat.
Economy
Onekama’s economy is largely based on tourism. The village is a popular destination for fishing, boating, and camping. There are several marinas and boat launches in the area, as well as a number of restaurants and shops. The village also has a small commercial fishing industry.
Demographics
As of the 2010 census, the population of Onekama was 498. The racial makeup of the village was 97.2% White, 0.2% African American, 0.2% Native American, 0.4% Asian, 0.2% from other races, and 1.9% from two or more races. The median household income was $37,500 and the median family income was $45,000.
Conclusion
Onekama is a small village located in Manistee County, Michigan. It is situated on the shores of Lake Michigan and is part of the Manistee National Forest. The village has a population of approximately 500 people and is a popular tourist destination. The economy of Onekama is largely based on tourism and the village is home to several marinas, boat launches, restaurants, and shops. The racial makeup of the village is predominantly White, with a small percentage of African American, Native American, and Asian residents. The median household income is $37,500 and the median family income is $45,000.
Common Questions
What is Per Capita Income in Onekama?
Per Capita income in Onekama is $39,931.
What is the Median Family Income in Onekama?
Median Family Income in Onekama is $99,205.
What is the Median Household income in Onekama?
Median Household Income in Onekama is $50,417.
What is Income or Wage Gap in Onekama?
Income or Wage Gap in Onekama is 20.1%.
Women in Onekama earn 79.9 cents for every dollar earned by a man.
What is Inequality or Gini Index in Onekama?
Inequality or Gini Index in Onekama is 0.50.
What is the Total Population of Onekama?
Total Population of Onekama is 347.
What is the Total Male Population of Onekama?
Total Male Population of Onekama is 135.
What is the Total Female Population of Onekama?
Total Female Population of Onekama is 212.
What is the Ratio of Males per 100 Females in Onekama?
There are 63.68 Males per 100 Females in Onekama.
What is the Ratio of Females per 100 Males in Onekama?
There are 157.04 Females per 100 Males in Onekama.
What is the Median Population Age in Onekama?
Median Population Age in Onekama is 54.6 Years.
What is the Average Family Size in Onekama
Average Family Size in Onekama is 2.9 People.
What is the Average Household Size in Onekama
Average Household Size in Onekama is 2.1 People.
How Large is the Labor Force in Onekama?
There are 166 People in the Labor Forcein in Onekama.
What is the Percentage of People in the Labor Force in Onekama?
55.5% of People are in the Labor Force in Onekama.