Oden, MI Map & Demographics
Oden Map
Oden Overview
$18,790
PER CAPITA INCOME
$58,017
AVG HOUSEHOLD INCOME
0.17
INEQUALITY / GINI INDEX
315
TOTAL POPULATION
177
MALE POPULATION
138
FEMALE POPULATION
128.26
MALES / 100 FEMALES
77.97
FEMALES / 100 MALES
23.0
MEDIAN AGE
2.4
AVG FAMILY SIZE
2.3
AVG HOUSEHOLD SIZE
175
LABOR FORCE [ PEOPLE ]
82.9%
PERCENT IN LABOR FORCE
Oden Area Codes
Income in Oden
Income Overview in Oden
| Characteristic | Number | Measure |
| Per Capita Income | 315 | $18,790 |
| Median Family Income | 87 | $0 |
| Mean Family Income | 87 | $0 |
| Median Household Income | 138 | $58,017 |
| Mean Household Income | 138 | $47,317 |
| Income Deficit | 87 | $0 |
| Wage / Income Gap (%) | 315 | 0.00% |
| Wage / Income Gap ($) | 315 | 100.00¢ per $1 |
| Gini / Inequality Index | 315 | 0.17 |
Earnings by Sex in Oden
| Sex | Number | Average Earnings |
| Male | 73 (41.7%) | $0 |
| Female | 102 (58.3%) | $0 |
| Total | 175 (100.0%) | $0 |
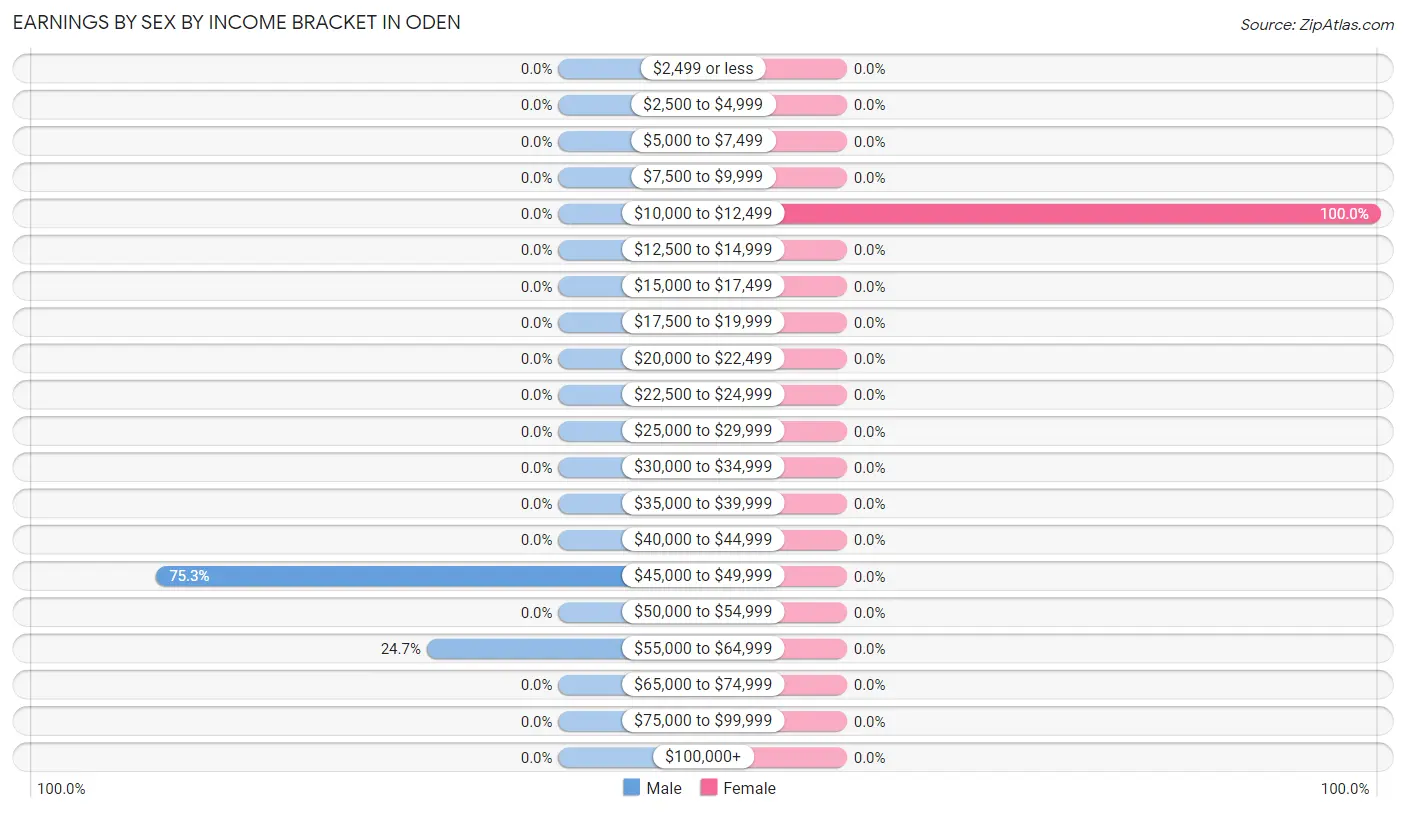
Earnings by Sex by Income Bracket in Oden
The most common earnings brackets in Oden are $45,000 to $49,999 for men (55 | 75.3%) and $10,000 to $12,499 for women (102 | 100.0%).
| Income | Male | Female |
| $2,499 or less | 0 (0.0%) | 0 (0.0%) |
| $2,500 to $4,999 | 0 (0.0%) | 0 (0.0%) |
| $5,000 to $7,499 | 0 (0.0%) | 0 (0.0%) |
| $7,500 to $9,999 | 0 (0.0%) | 0 (0.0%) |
| $10,000 to $12,499 | 0 (0.0%) | 102 (100.0%) |
| $12,500 to $14,999 | 0 (0.0%) | 0 (0.0%) |
| $15,000 to $17,499 | 0 (0.0%) | 0 (0.0%) |
| $17,500 to $19,999 | 0 (0.0%) | 0 (0.0%) |
| $20,000 to $22,499 | 0 (0.0%) | 0 (0.0%) |
| $22,500 to $24,999 | 0 (0.0%) | 0 (0.0%) |
| $25,000 to $29,999 | 0 (0.0%) | 0 (0.0%) |
| $30,000 to $34,999 | 0 (0.0%) | 0 (0.0%) |
| $35,000 to $39,999 | 0 (0.0%) | 0 (0.0%) |
| $40,000 to $44,999 | 0 (0.0%) | 0 (0.0%) |
| $45,000 to $49,999 | 55 (75.3%) | 0 (0.0%) |
| $50,000 to $54,999 | 0 (0.0%) | 0 (0.0%) |
| $55,000 to $64,999 | 18 (24.7%) | 0 (0.0%) |
| $65,000 to $74,999 | 0 (0.0%) | 0 (0.0%) |
| $75,000 to $99,999 | 0 (0.0%) | 0 (0.0%) |
| $100,000+ | 0 (0.0%) | 0 (0.0%) |
| Total | 73 (100.0%) | 102 (100.0%) |
Earnings by Sex by Educational Attainment in Oden
| Educational Attainment | Male Income | Female Income |
| Less than High School | - | - |
| High School Diploma | - | - |
| College or Associate's Degree | - | - |
| Bachelor's Degree | - | - |
| Graduate Degree | - | - |
| Total | - | - |
Family Income in Oden
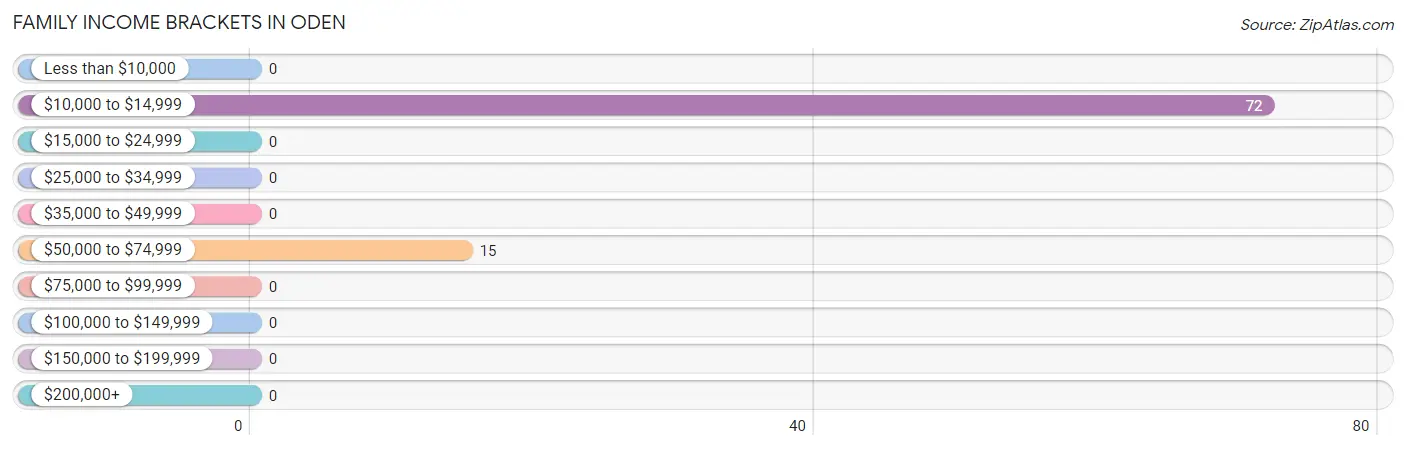
Family Income Brackets in Oden
According to the Oden family income data, there are 72 families falling into the $10,000 to $14,999 income range, which is the most common income bracket and makes up 82.8% of all families.
| Income Bracket | # Families | % Families |
| Less than $10,000 | 0 | 0.0% |
| $10,000 to $14,999 | 72 | 82.8% |
| $15,000 to $24,999 | 0 | 0.0% |
| $25,000 to $34,999 | 0 | 0.0% |
| $35,000 to $49,999 | 0 | 0.0% |
| $50,000 to $74,999 | 15 | 17.2% |
| $75,000 to $99,999 | 0 | 0.0% |
| $100,000 to $149,999 | 0 | 0.0% |
| $150,000 to $199,999 | 0 | 0.0% |
| $200,000+ | 0 | 0.0% |
Family Income by Famaliy Size in Oden
| Income Bracket | # Families | Median Income |
| 2-Person Families | 0 (0.0%) | $0 |
| 3-Person Families | 87 (100.0%) | $0 |
| 4-Person Families | 0 (0.0%) | $0 |
| 5-Person Families | 0 (0.0%) | $0 |
| 6-Person Families | 0 (0.0%) | $0 |
| 7+ Person Families | 0 (0.0%) | $0 |
| Total | 87 (100.0%) | $0 |
Family Income by Number of Earners in Oden
| Number of Earners | # Families | Median Income |
| No Earners | 0 (0.0%) | $0 |
| 1 Earner | 87 (100.0%) | $0 |
| 2 Earners | 0 (0.0%) | $0 |
| 3+ Earners | 0 (0.0%) | $0 |
| Total | 87 (100.0%) | $0 |
Household Income in Oden
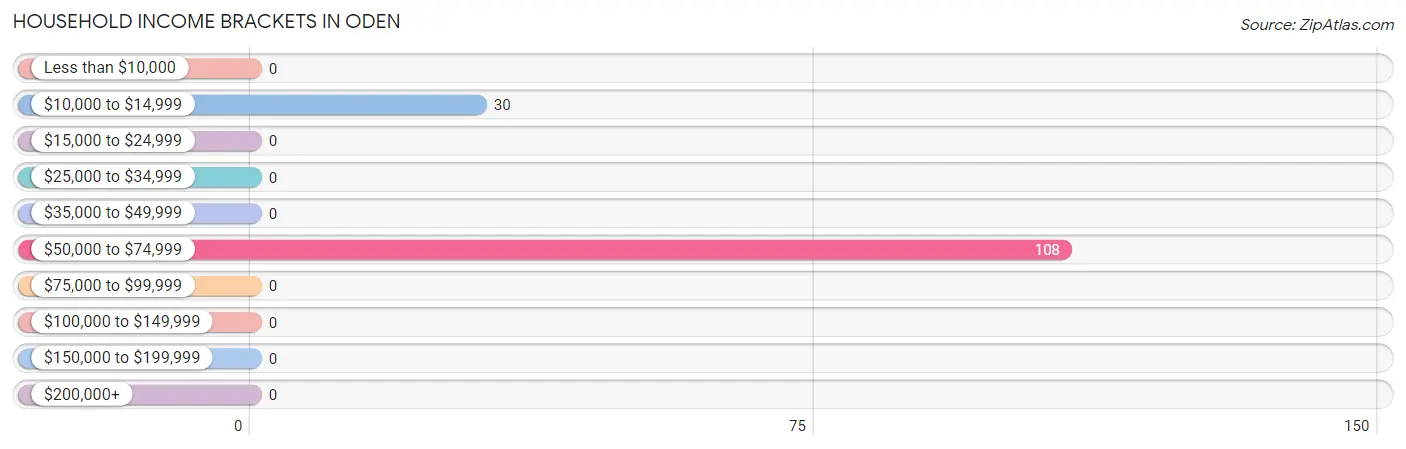
Household Income Brackets in Oden
With 108 households falling in the category, the $50,000 to $74,999 income range is the most frequent in Oden, accounting for 78.3% of all households.
| Income Bracket | # Households | % Households |
| Less than $10,000 | 0 | 0.0% |
| $10,000 to $14,999 | 30 | 21.7% |
| $15,000 to $24,999 | 0 | 0.0% |
| $25,000 to $34,999 | 0 | 0.0% |
| $35,000 to $49,999 | 0 | 0.0% |
| $50,000 to $74,999 | 108 | 78.3% |
| $75,000 to $99,999 | 0 | 0.0% |
| $100,000 to $149,999 | 0 | 0.0% |
| $150,000 to $199,999 | 0 | 0.0% |
| $200,000+ | 0 | 0.0% |
Household Income by Householder Age in Oden
| Income Bracket | # Households | Median Income |
| 15 to 24 Years | 0 (0.0%) | $0 |
| 25 to 44 Years | 87 (63.0%) | $0 |
| 45 to 64 Years | 30 (21.7%) | $0 |
| 65+ Years | 21 (15.2%) | $0 |
| Total | 138 (100.0%) | $58,017 |
Poverty in Oden
Income Below Poverty by Sex and Age in Oden
With 49.7% poverty level for males and 73.9% for females among the residents of Oden, under 5 year old males and 25 to 34 year old females are the most vulnerable to poverty, with 88 males (100.0%) and 72 females (100.0%) in their respective age groups living below the poverty level.
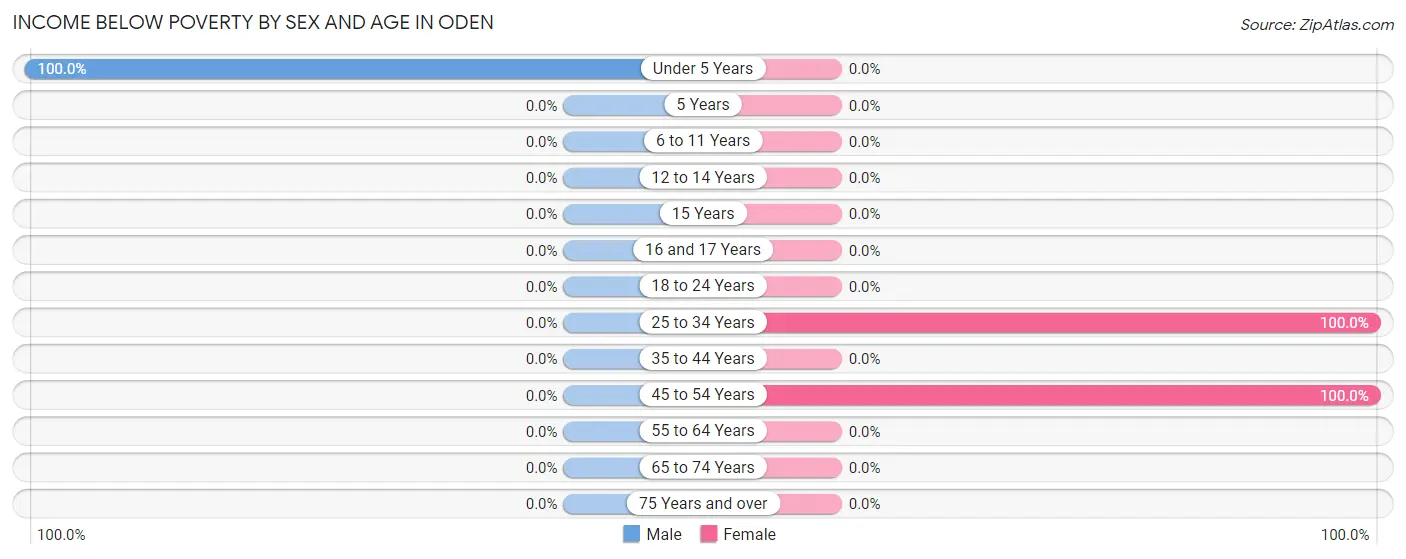
| Age Bracket | Male | Female |
| Under 5 Years | 88 (100.0%) | 0 (0.0%) |
| 5 Years | 0 (0.0%) | 0 (0.0%) |
| 6 to 11 Years | 0 (0.0%) | 0 (0.0%) |
| 12 to 14 Years | 0 (0.0%) | 0 (0.0%) |
| 15 Years | 0 (0.0%) | 0 (0.0%) |
| 16 and 17 Years | 0 (0.0%) | 0 (0.0%) |
| 18 to 24 Years | 0 (0.0%) | 0 (0.0%) |
| 25 to 34 Years | 0 (0.0%) | 72 (100.0%) |
| 35 to 44 Years | 0 (0.0%) | 0 (0.0%) |
| 45 to 54 Years | 0 (0.0%) | 30 (100.0%) |
| 55 to 64 Years | 0 (0.0%) | 0 (0.0%) |
| 65 to 74 Years | 0 (0.0%) | 0 (0.0%) |
| 75 Years and over | 0 (0.0%) | 0 (0.0%) |
| Total | 88 (49.7%) | 102 (73.9%) |
Income Above Poverty by Sex and Age in Oden
According to the poverty statistics in Oden, males aged 12 to 14 years and females aged 35 to 44 years are the age groups that are most secure financially, with 100.0% of males and 100.0% of females in these age groups living above the poverty line.
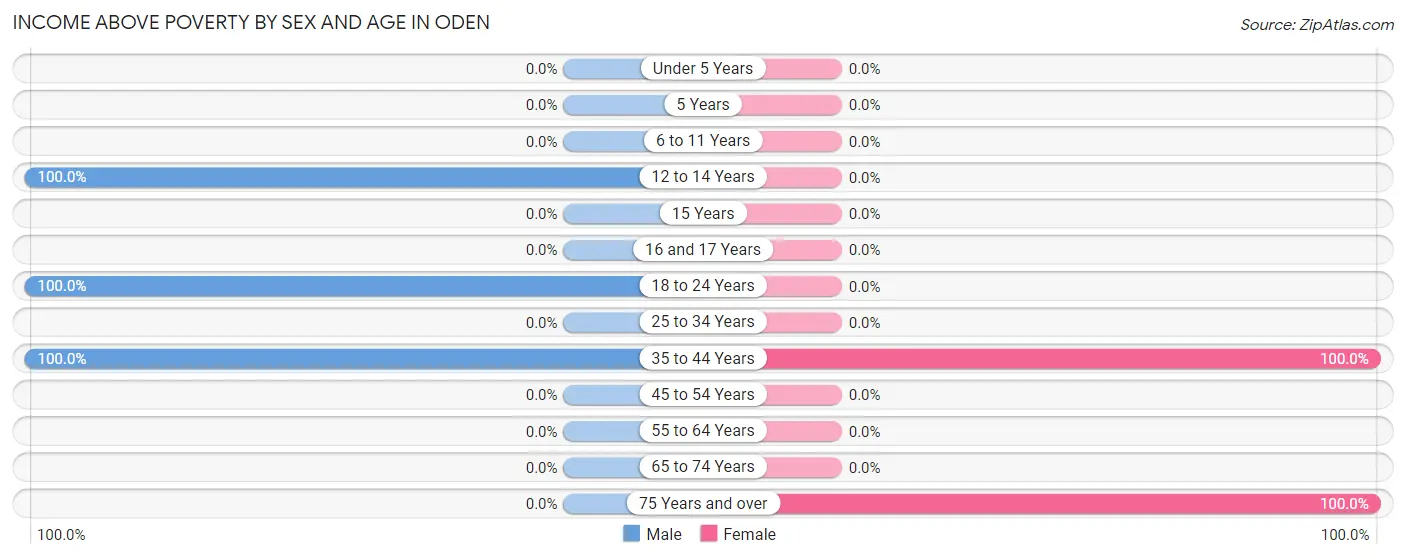
| Age Bracket | Male | Female |
| Under 5 Years | 0 (0.0%) | 0 (0.0%) |
| 5 Years | 0 (0.0%) | 0 (0.0%) |
| 6 to 11 Years | 0 (0.0%) | 0 (0.0%) |
| 12 to 14 Years | 16 (100.0%) | 0 (0.0%) |
| 15 Years | 0 (0.0%) | 0 (0.0%) |
| 16 and 17 Years | 0 (0.0%) | 0 (0.0%) |
| 18 to 24 Years | 55 (100.0%) | 0 (0.0%) |
| 25 to 34 Years | 0 (0.0%) | 0 (0.0%) |
| 35 to 44 Years | 18 (100.0%) | 15 (100.0%) |
| 45 to 54 Years | 0 (0.0%) | 0 (0.0%) |
| 55 to 64 Years | 0 (0.0%) | 0 (0.0%) |
| 65 to 74 Years | 0 (0.0%) | 0 (0.0%) |
| 75 Years and over | 0 (0.0%) | 21 (100.0%) |
| Total | 89 (50.3%) | 36 (26.1%) |
Income Below Poverty Among Married-Couple Families in Oden
| Children | Above Poverty | Below Poverty |
| No Children | 0 (0.0%) | 0 (0.0%) |
| 1 or 2 Children | 15 (100.0%) | 0 (0.0%) |
| 3 or 4 Children | 0 (0.0%) | 0 (0.0%) |
| 5 or more Children | 0 (0.0%) | 0 (0.0%) |
| Total | 15 (100.0%) | 0 (0.0%) |
Income Below Poverty Among Single-Parent Households in Oden
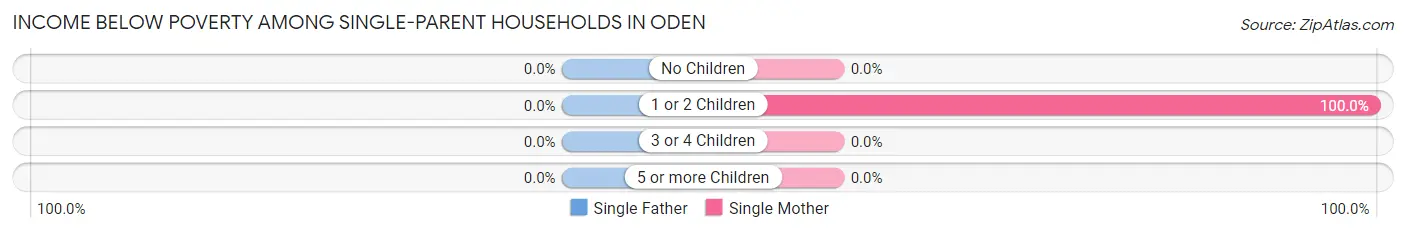
| Children | Single Father | Single Mother |
| No Children | 0 (0.0%) | 0 (0.0%) |
| 1 or 2 Children | 0 (0.0%) | 72 (100.0%) |
| 3 or 4 Children | 0 (0.0%) | 0 (0.0%) |
| 5 or more Children | 0 (0.0%) | 0 (0.0%) |
| Total | 0 (0.0%) | 72 (100.0%) |
Income Below Poverty Among Married-Couple vs Single-Parent Households in Oden
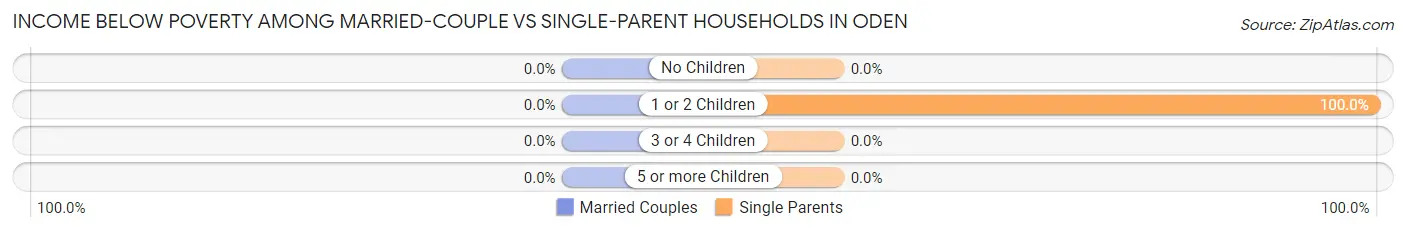
| Children | Married-Couple Families | Single-Parent Households |
| No Children | 0 (0.0%) | 0 (0.0%) |
| 1 or 2 Children | 0 (0.0%) | 72 (100.0%) |
| 3 or 4 Children | 0 (0.0%) | 0 (0.0%) |
| 5 or more Children | 0 (0.0%) | 0 (0.0%) |
| Total | 0 (0.0%) | 72 (100.0%) |
Race in Oden
The most populous races in Oden are , and White / Caucasian (315 | 100.0%).
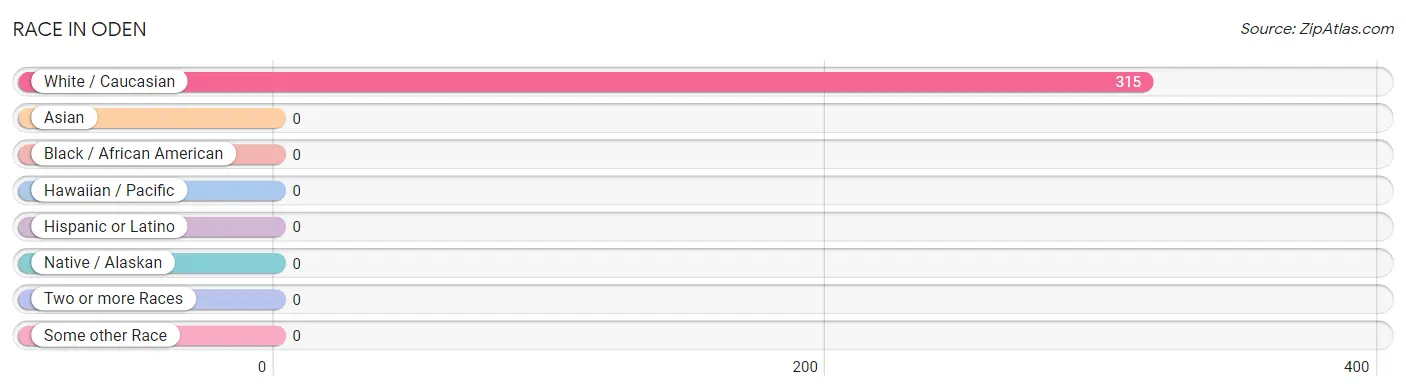
| Race | # Population | % Population |
| Asian | 0 | 0.0% |
| Black / African American | 0 | 0.0% |
| Hawaiian / Pacific | 0 | 0.0% |
| Hispanic or Latino | 0 | 0.0% |
| Native / Alaskan | 0 | 0.0% |
| White / Caucasian | 315 | 100.0% |
| Two or more Races | 0 | 0.0% |
| Some other Race | 0 | 0.0% |
| Total | 315 | 100.0% |
Ancestry in Oden
The most populous ancestries reported in Oden are Hungarian (160 | 50.8%), Italian (55 | 17.5%), American (49 | 15.6%), English (30 | 9.5%), and German (21 | 6.7%), together accounting for 100.0% of all Oden residents.
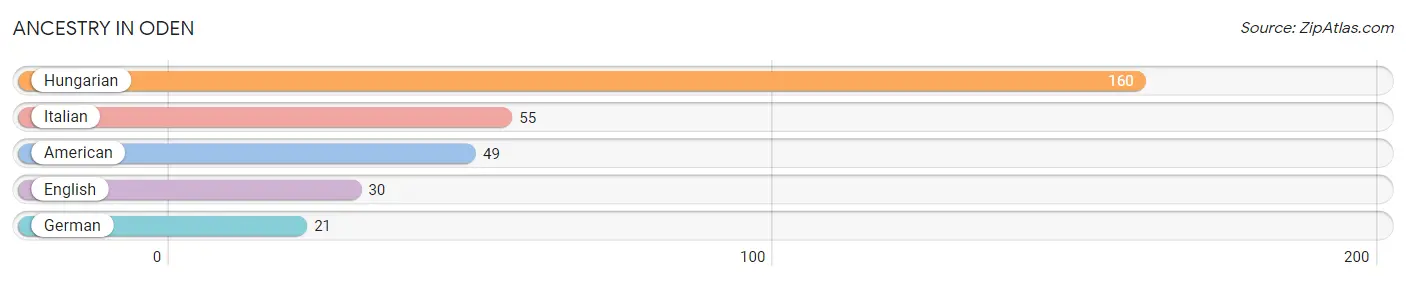
| Ancestry | # Population | % Population |
| American | 49 | 15.6% |
| English | 30 | 9.5% |
| German | 21 | 6.7% |
| Hungarian | 160 | 50.8% |
| Italian | 55 | 17.5% | View All 5 Rows |
Immigrants in Oden

| Immigration Origin | # Population | % Population | View All 0 Rows |
Sex and Age in Oden
Sex and Age in Oden
The most populous age groups in Oden are Under 5 Years (88 | 49.7%) for men and 25 to 29 Years (72 | 52.2%) for women.
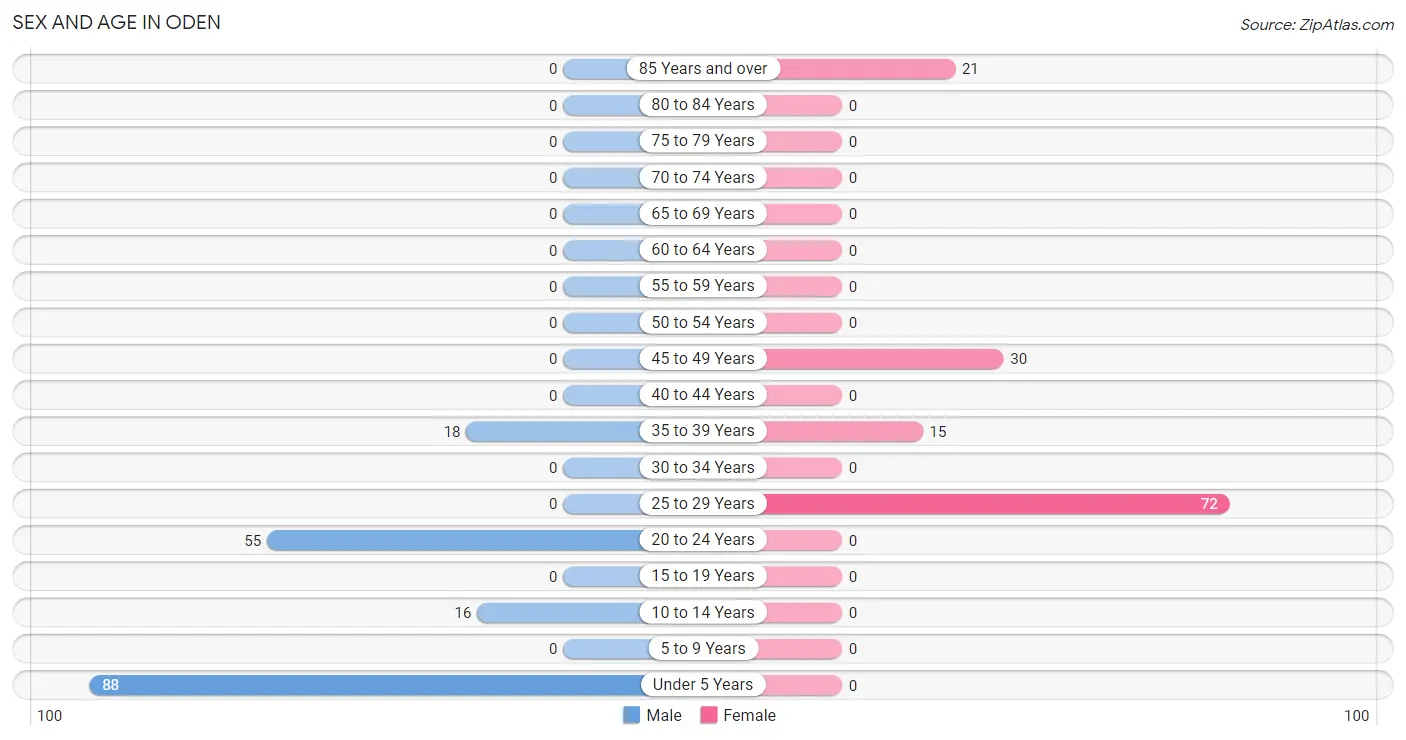
| Age Bracket | Male | Female |
| Under 5 Years | 88 (49.7%) | 0 (0.0%) |
| 5 to 9 Years | 0 (0.0%) | 0 (0.0%) |
| 10 to 14 Years | 16 (9.0%) | 0 (0.0%) |
| 15 to 19 Years | 0 (0.0%) | 0 (0.0%) |
| 20 to 24 Years | 55 (31.1%) | 0 (0.0%) |
| 25 to 29 Years | 0 (0.0%) | 72 (52.2%) |
| 30 to 34 Years | 0 (0.0%) | 0 (0.0%) |
| 35 to 39 Years | 18 (10.2%) | 15 (10.9%) |
| 40 to 44 Years | 0 (0.0%) | 0 (0.0%) |
| 45 to 49 Years | 0 (0.0%) | 30 (21.7%) |
| 50 to 54 Years | 0 (0.0%) | 0 (0.0%) |
| 55 to 59 Years | 0 (0.0%) | 0 (0.0%) |
| 60 to 64 Years | 0 (0.0%) | 0 (0.0%) |
| 65 to 69 Years | 0 (0.0%) | 0 (0.0%) |
| 70 to 74 Years | 0 (0.0%) | 0 (0.0%) |
| 75 to 79 Years | 0 (0.0%) | 0 (0.0%) |
| 80 to 84 Years | 0 (0.0%) | 0 (0.0%) |
| 85 Years and over | 0 (0.0%) | 21 (15.2%) |
| Total | 177 (100.0%) | 138 (100.0%) |
Families and Households in Oden
Median Family Size in Oden
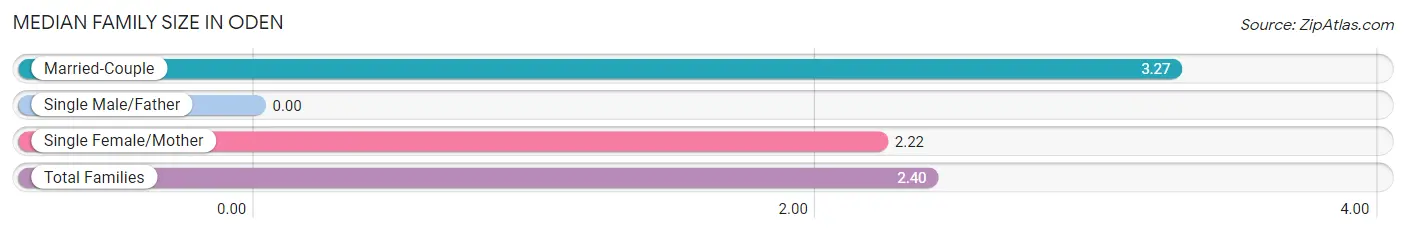
| Family Type | # Families | Family Size |
| Married-Couple | 15 (17.2%) | 3.27 |
| Single Male/Father | 0 (0.0%) | - |
| Single Female/Mother | 72 (82.8%) | 2.22 |
| Total Families | 87 (100.0%) | 2.40 |
Median Household Size in Oden
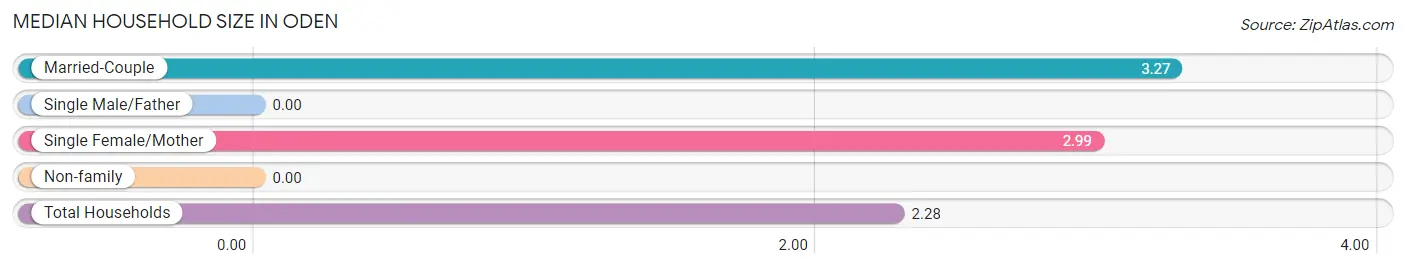
| Household Type | # Households | Household Size |
| Married-Couple | 15 (10.9%) | 3.27 |
| Single Male/Father | 0 (0.0%) | - |
| Single Female/Mother | 72 (52.2%) | 2.99 |
| Non-family | 51 (37.0%) | - |
| Total Households | 138 (100.0%) | 2.28 |
Household Size by Marriage Status in Oden
Out of a total of 138 households in Oden, 87 (63.0%) are family households, while 51 (37.0%) are nonfamily households. The most numerous type of family households are 4-person households, comprising 72, and the most common type of nonfamily households are 1-person households, comprising 51.
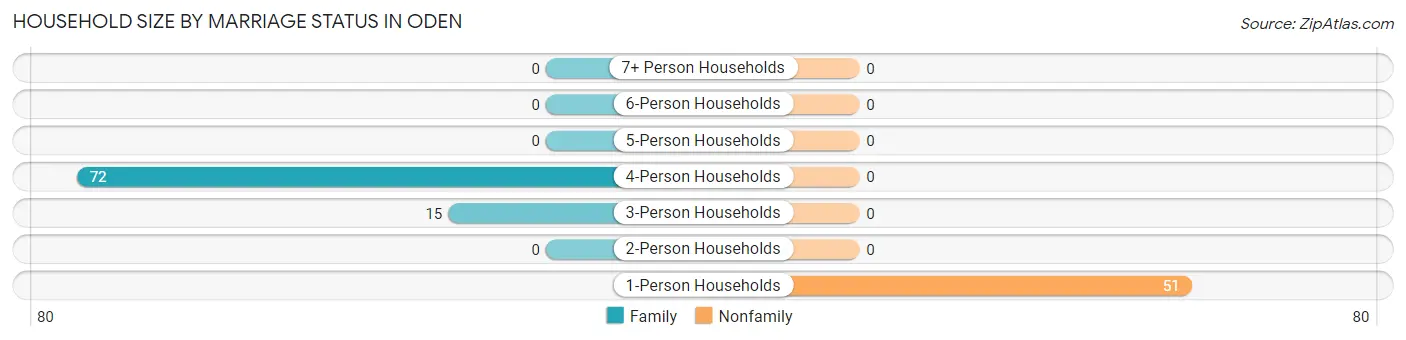
| Household Size | Family Households | Nonfamily Households |
| 1-Person Households | - | 51 (37.0%) |
| 2-Person Households | 0 (0.0%) | 0 (0.0%) |
| 3-Person Households | 15 (10.9%) | 0 (0.0%) |
| 4-Person Households | 72 (52.2%) | 0 (0.0%) |
| 5-Person Households | 0 (0.0%) | 0 (0.0%) |
| 6-Person Households | 0 (0.0%) | 0 (0.0%) |
| 7+ Person Households | 0 (0.0%) | 0 (0.0%) |
| Total | 87 (63.0%) | 51 (37.0%) |
Female Fertility in Oden
Fertility by Age in Oden
Average fertility rate in Oden is 615.0 births per 1,000 women. Women in the age bracket of 20 to 34 years have the highest fertility rate with 1,000.0 births per 1,000 women. Women in the age bracket of 20 to 34 years acount for 100.0% of all women with births.
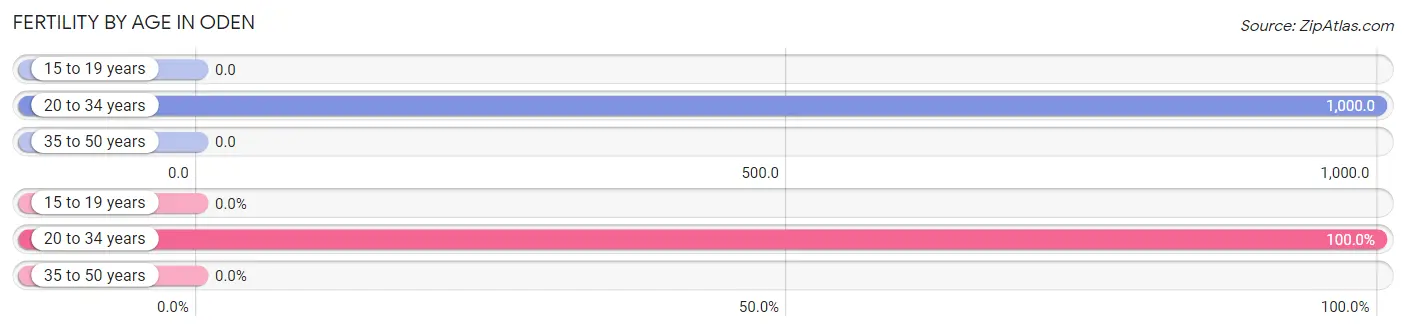
| Age Bracket | Women with Births | Births / 1,000 Women |
| 15 to 19 years | 0 (0.0%) | 0.0 |
| 20 to 34 years | 72 (100.0%) | 1,000.0 |
| 35 to 50 years | 0 (0.0%) | 0.0 |
| Total | 72 (100.0%) | 615.0 |
Fertility by Age by Marriage Status in Oden
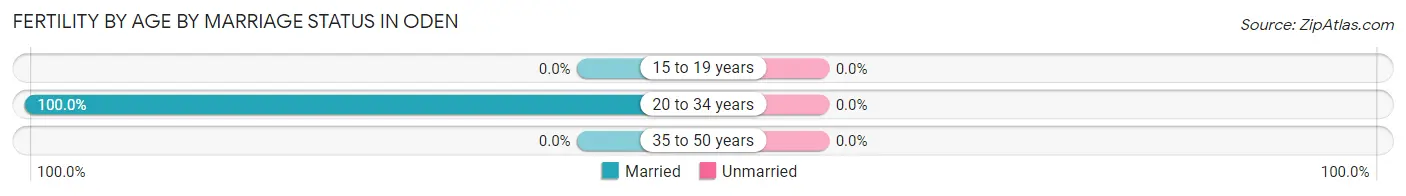
| Age Bracket | Married | Unmarried |
| 15 to 19 years | 0 (0.0%) | 0 (0.0%) |
| 20 to 34 years | 72 (100.0%) | 0 (0.0%) |
| 35 to 50 years | 0 (0.0%) | 0 (0.0%) |
| Total | 72 (100.0%) | 0 (0.0%) |
Fertility by Education in Oden
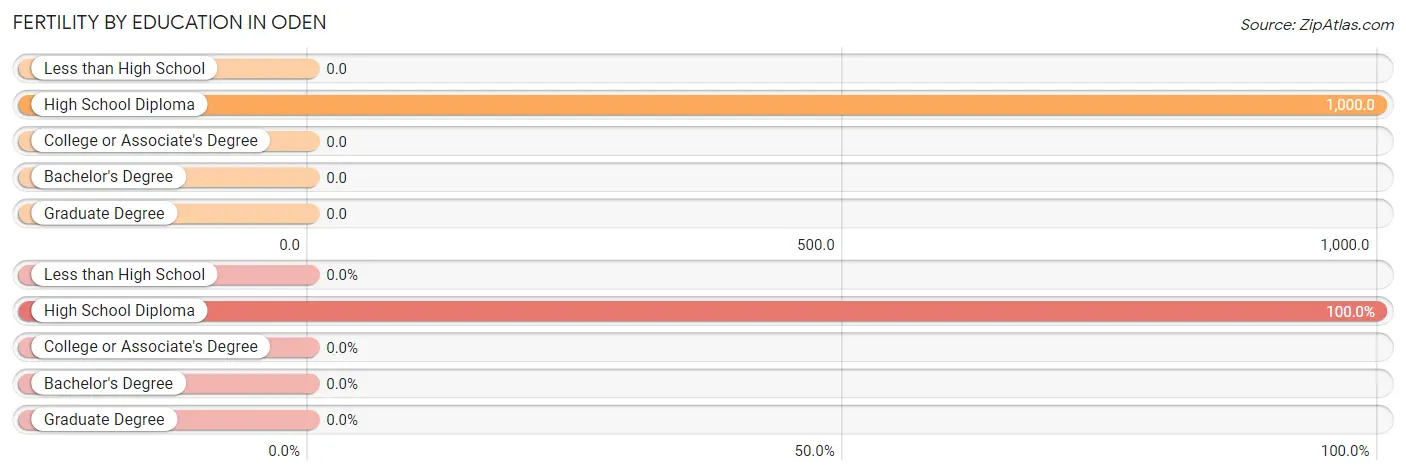
| Educational Attainment | Women with Births | Births / 1,000 Women |
| Less than High School | 0 (0.0%) | 0.0 |
| High School Diploma | 72 (100.0%) | 1,000.0 |
| College or Associate's Degree | 0 (0.0%) | 0.0 |
| Bachelor's Degree | 0 (0.0%) | 0.0 |
| Graduate Degree | 0 (0.0%) | 0.0 |
| Total | 72 (100.0%) | 615.0 |
Fertility by Education by Marriage Status in Oden
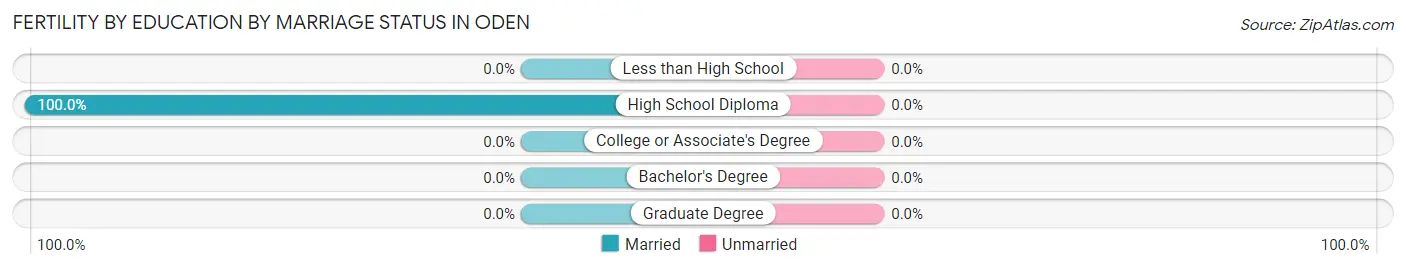
| Educational Attainment | Married | Unmarried |
| Less than High School | 0 (0.0%) | 0 (0.0%) |
| High School Diploma | 72 (100.0%) | 0 (0.0%) |
| College or Associate's Degree | 0 (0.0%) | 0 (0.0%) |
| Bachelor's Degree | 0 (0.0%) | 0 (0.0%) |
| Graduate Degree | 0 (0.0%) | 0 (0.0%) |
| Total | 72 (100.0%) | 0 (0.0%) |
Employment Characteristics in Oden
Employment by Class of Employer in Oden
Among the 175 employed individuals in Oden, , and private company employees (175 | 100.0%) make up the most common classes of employment.
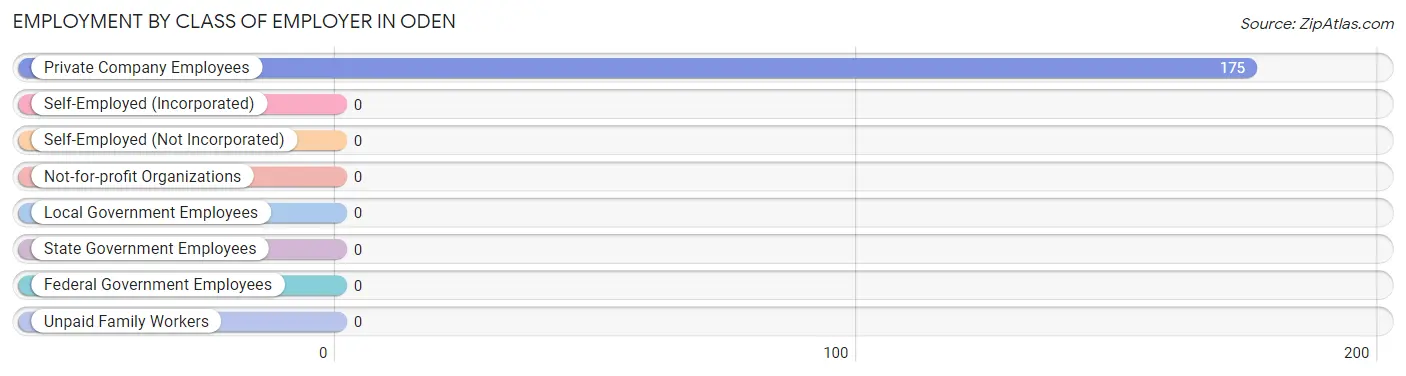
| Employer Class | # Employees | % Employees |
| Private Company Employees | 175 | 100.0% |
| Self-Employed (Incorporated) | 0 | 0.0% |
| Self-Employed (Not Incorporated) | 0 | 0.0% |
| Not-for-profit Organizations | 0 | 0.0% |
| Local Government Employees | 0 | 0.0% |
| State Government Employees | 0 | 0.0% |
| Federal Government Employees | 0 | 0.0% |
| Unpaid Family Workers | 0 | 0.0% |
| Total | 175 | 100.0% |
Employment Status by Age in Oden
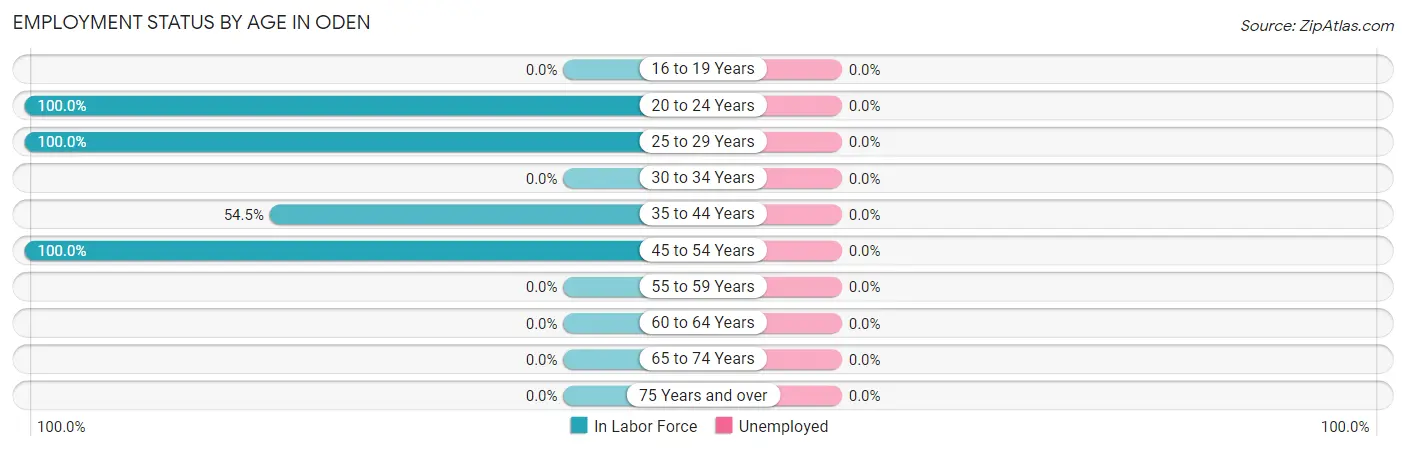
| Age Bracket | In Labor Force | Unemployed |
| 16 to 19 Years | 0 (0.0%) | 0 (0.0%) |
| 20 to 24 Years | 55 (100.0%) | 0 (0.0%) |
| 25 to 29 Years | 72 (100.0%) | 0 (0.0%) |
| 30 to 34 Years | 0 (0.0%) | 0 (0.0%) |
| 35 to 44 Years | 18 (54.5%) | 0 (0.0%) |
| 45 to 54 Years | 30 (100.0%) | 0 (0.0%) |
| 55 to 59 Years | 0 (0.0%) | 0 (0.0%) |
| 60 to 64 Years | 0 (0.0%) | 0 (0.0%) |
| 65 to 74 Years | 0 (0.0%) | 0 (0.0%) |
| 75 Years and over | 0 (0.0%) | 0 (0.0%) |
| Total | 175 (82.9%) | 0 (0.0%) |
Employment Status by Educational Attainment in Oden
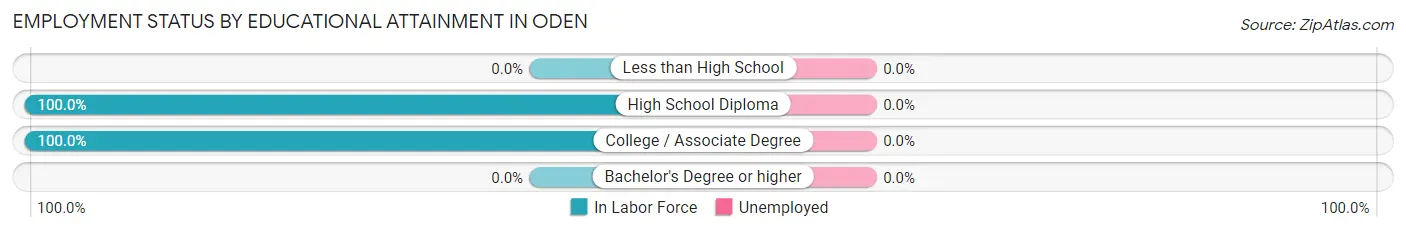
| Educational Attainment | In Labor Force | Unemployed |
| Less than High School | 0 (0.0%) | 0 (0.0%) |
| High School Diploma | 72 (100.0%) | 0 (0.0%) |
| College / Associate Degree | 48 (100.0%) | 0 (0.0%) |
| Bachelor's Degree or higher | 0 (0.0%) | 0 (0.0%) |
| Total | 120 (88.9%) | 0 (0.0%) |
Employment Occupations by Sex in Oden
Management, Business, Science and Arts Occupations
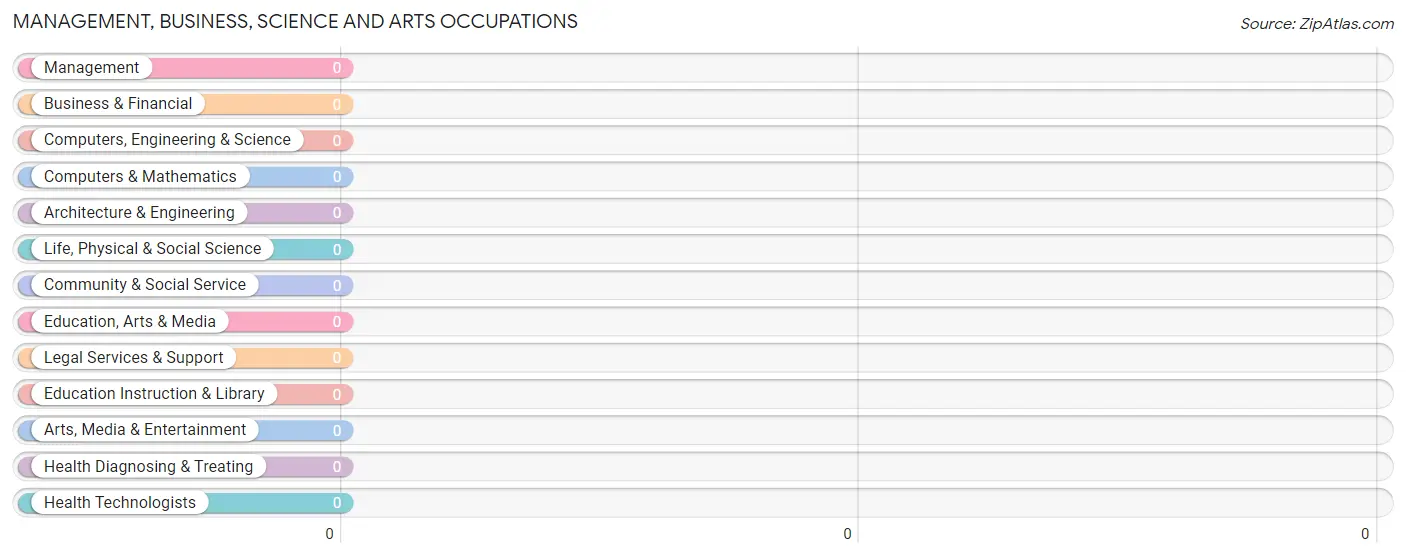
Management, Business, Science and Arts Occupations by Sex
| Occupation | Male | Female |
| Management | 0 (0.0%) | 0 (0.0%) |
| Business & Financial | 0 (0.0%) | 0 (0.0%) |
| Computers, Engineering & Science | 0 (0.0%) | 0 (0.0%) |
| Computers & Mathematics | 0 (0.0%) | 0 (0.0%) |
| Architecture & Engineering | 0 (0.0%) | 0 (0.0%) |
| Life, Physical & Social Science | 0 (0.0%) | 0 (0.0%) |
| Community & Social Service | 0 (0.0%) | 0 (0.0%) |
| Education, Arts & Media | 0 (0.0%) | 0 (0.0%) |
| Legal Services & Support | 0 (0.0%) | 0 (0.0%) |
| Education Instruction & Library | 0 (0.0%) | 0 (0.0%) |
| Arts, Media & Entertainment | 0 (0.0%) | 0 (0.0%) |
| Health Diagnosing & Treating | 0 (0.0%) | 0 (0.0%) |
| Health Technologists | 0 (0.0%) | 0 (0.0%) |
| Total (Category) | 0 (0.0%) | 0 (0.0%) |
| Total (Overall) | 73 (41.7%) | 102 (58.3%) |
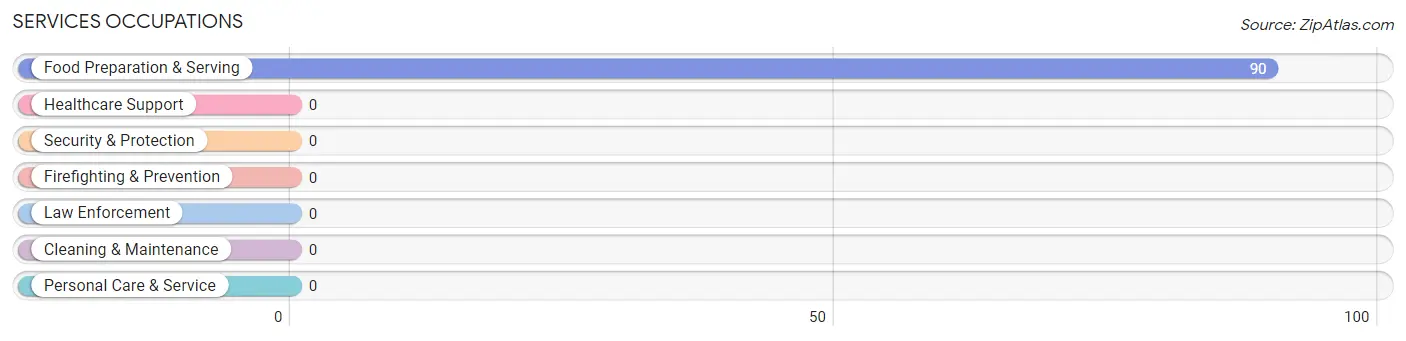
Services Occupations
The most common Services occupations in Oden are , and Food Preparation & Serving (90 | 51.4%).
Services Occupations by Sex
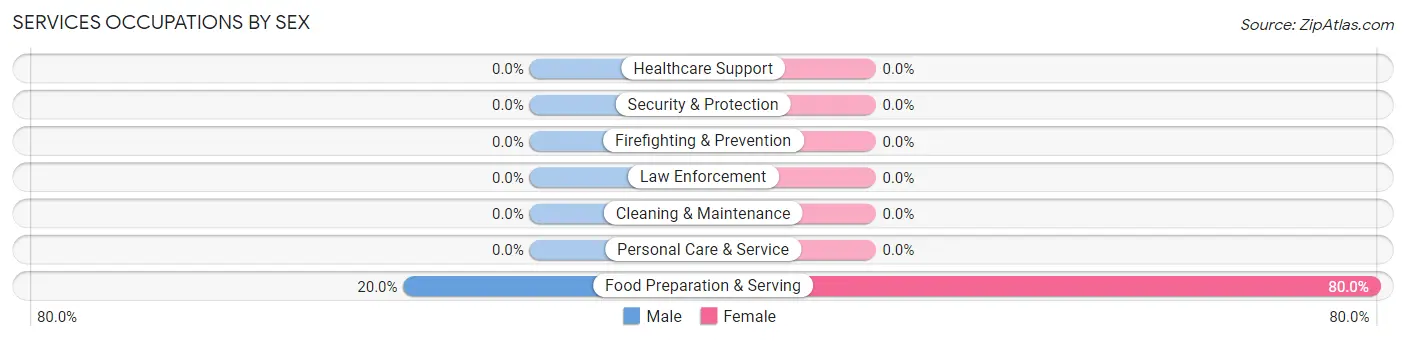
| Occupation | Male | Female |
| Healthcare Support | 0 (0.0%) | 0 (0.0%) |
| Security & Protection | 0 (0.0%) | 0 (0.0%) |
| Firefighting & Prevention | 0 (0.0%) | 0 (0.0%) |
| Law Enforcement | 0 (0.0%) | 0 (0.0%) |
| Food Preparation & Serving | 18 (20.0%) | 72 (80.0%) |
| Cleaning & Maintenance | 0 (0.0%) | 0 (0.0%) |
| Personal Care & Service | 0 (0.0%) | 0 (0.0%) |
| Total (Category) | 18 (20.0%) | 72 (80.0%) |
| Total (Overall) | 73 (41.7%) | 102 (58.3%) |
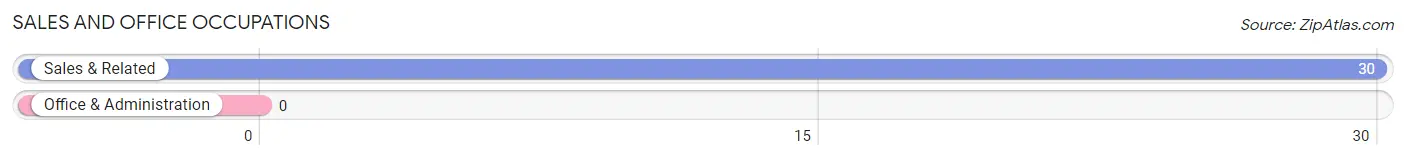
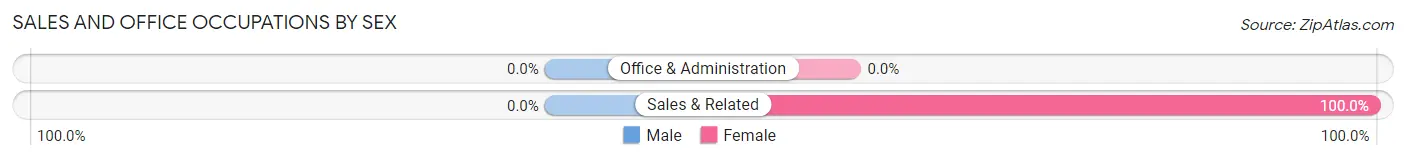
Sales and Office Occupations
The most common Sales and Office occupations in Oden are , and Sales & Related (30 | 17.1%).
Sales and Office Occupations by Sex
| Occupation | Male | Female |
| Sales & Related | 0 (0.0%) | 30 (100.0%) |
| Office & Administration | 0 (0.0%) | 0 (0.0%) |
| Total (Category) | 0 (0.0%) | 30 (100.0%) |
| Total (Overall) | 73 (41.7%) | 102 (58.3%) |
Natural Resources, Construction and Maintenance Occupations
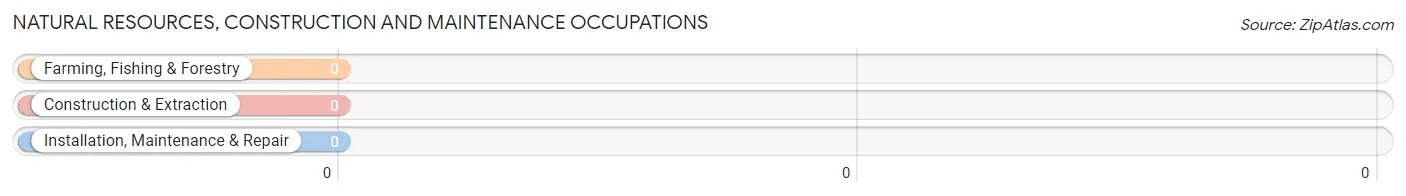
Natural Resources, Construction and Maintenance Occupations by Sex
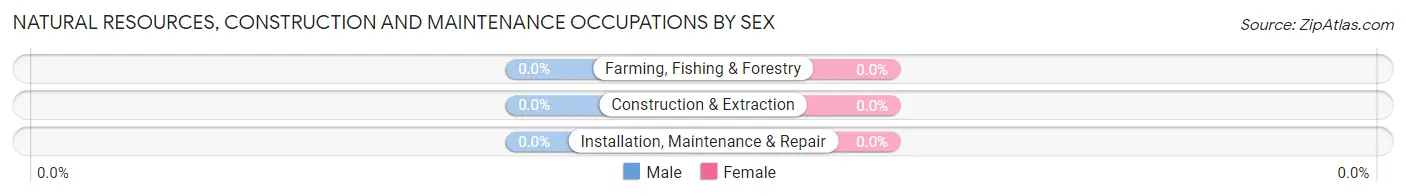
| Occupation | Male | Female |
| Farming, Fishing & Forestry | 0 (0.0%) | 0 (0.0%) |
| Construction & Extraction | 0 (0.0%) | 0 (0.0%) |
| Installation, Maintenance & Repair | 0 (0.0%) | 0 (0.0%) |
| Total (Category) | 0 (0.0%) | 0 (0.0%) |
| Total (Overall) | 73 (41.7%) | 102 (58.3%) |
Production, Transportation and Moving Occupations
The most common Production, Transportation and Moving occupations in Oden are , and Production (55 | 31.4%).
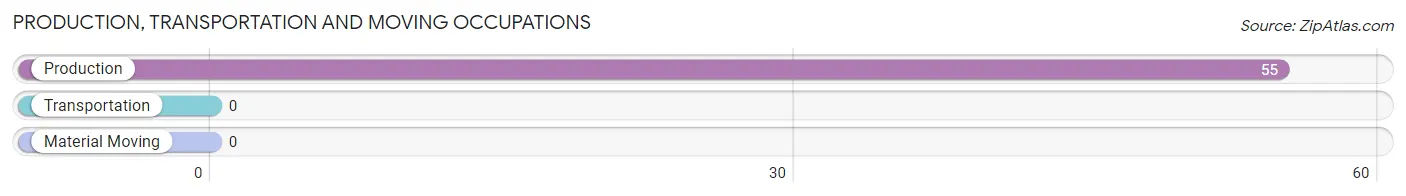
Production, Transportation and Moving Occupations by Sex
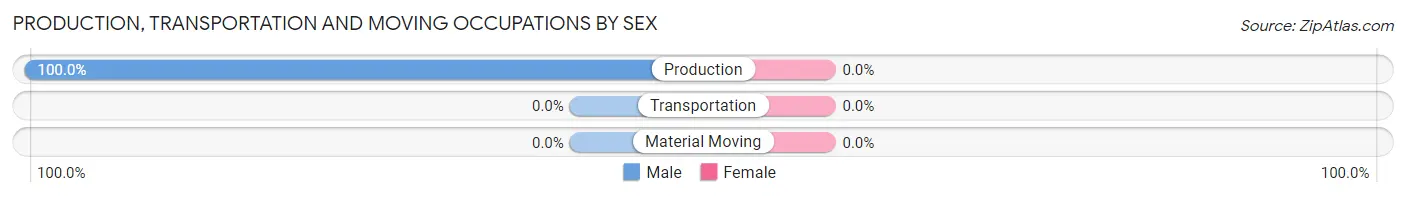
| Occupation | Male | Female |
| Production | 55 (100.0%) | 0 (0.0%) |
| Transportation | 0 (0.0%) | 0 (0.0%) |
| Material Moving | 0 (0.0%) | 0 (0.0%) |
| Total (Category) | 55 (100.0%) | 0 (0.0%) |
| Total (Overall) | 73 (41.7%) | 102 (58.3%) |
Employment Industries by Sex in Oden
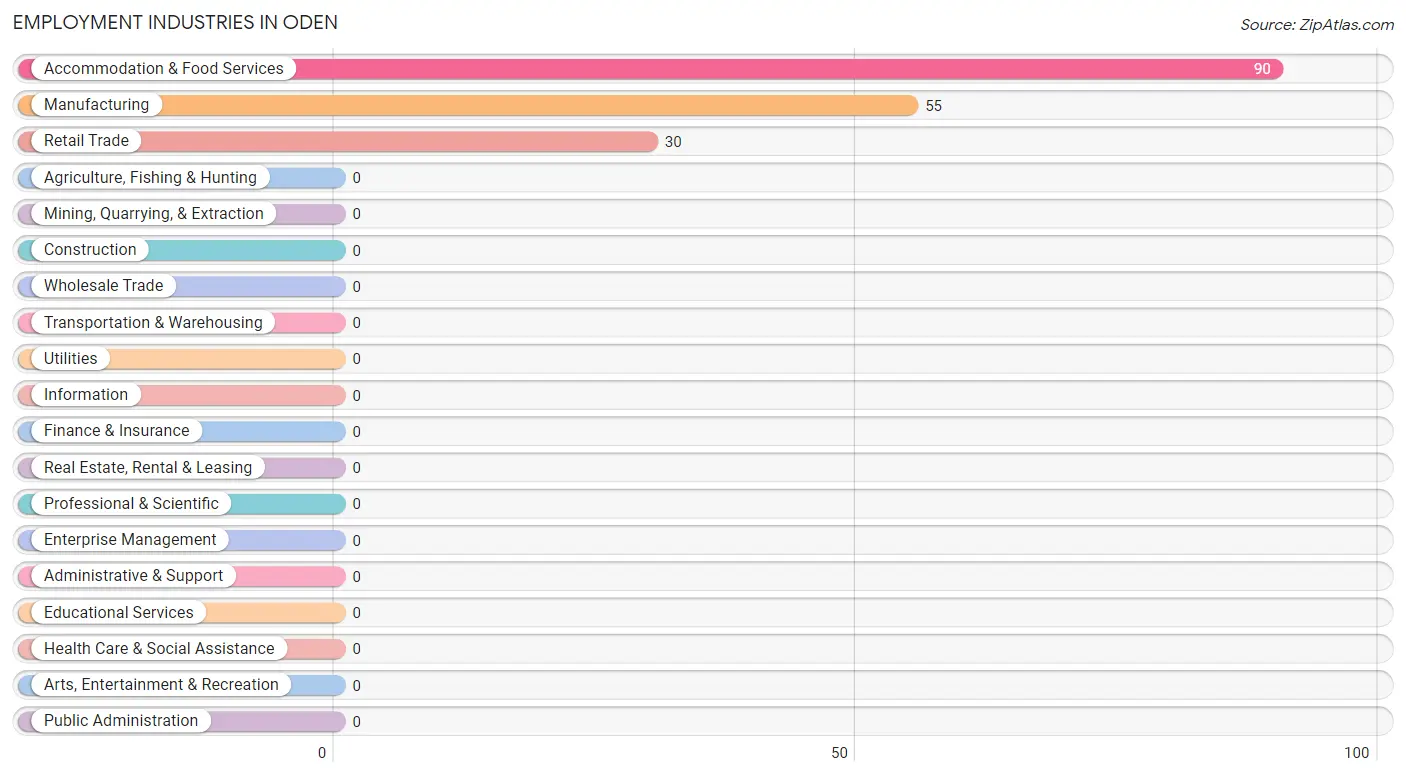
Employment Industries in Oden
The major employment industries in Oden include Accommodation & Food Services (90 | 51.4%), Manufacturing (55 | 31.4%), and Retail Trade (30 | 17.1%).
Employment Industries by Sex in Oden
The Oden industries that see more men than women are Manufacturing (100.0%), and Accommodation & Food Services (20.0%), whereas the industries that tend to have a higher number of women are Retail Trade (100.0%), and Accommodation & Food Services (80.0%).
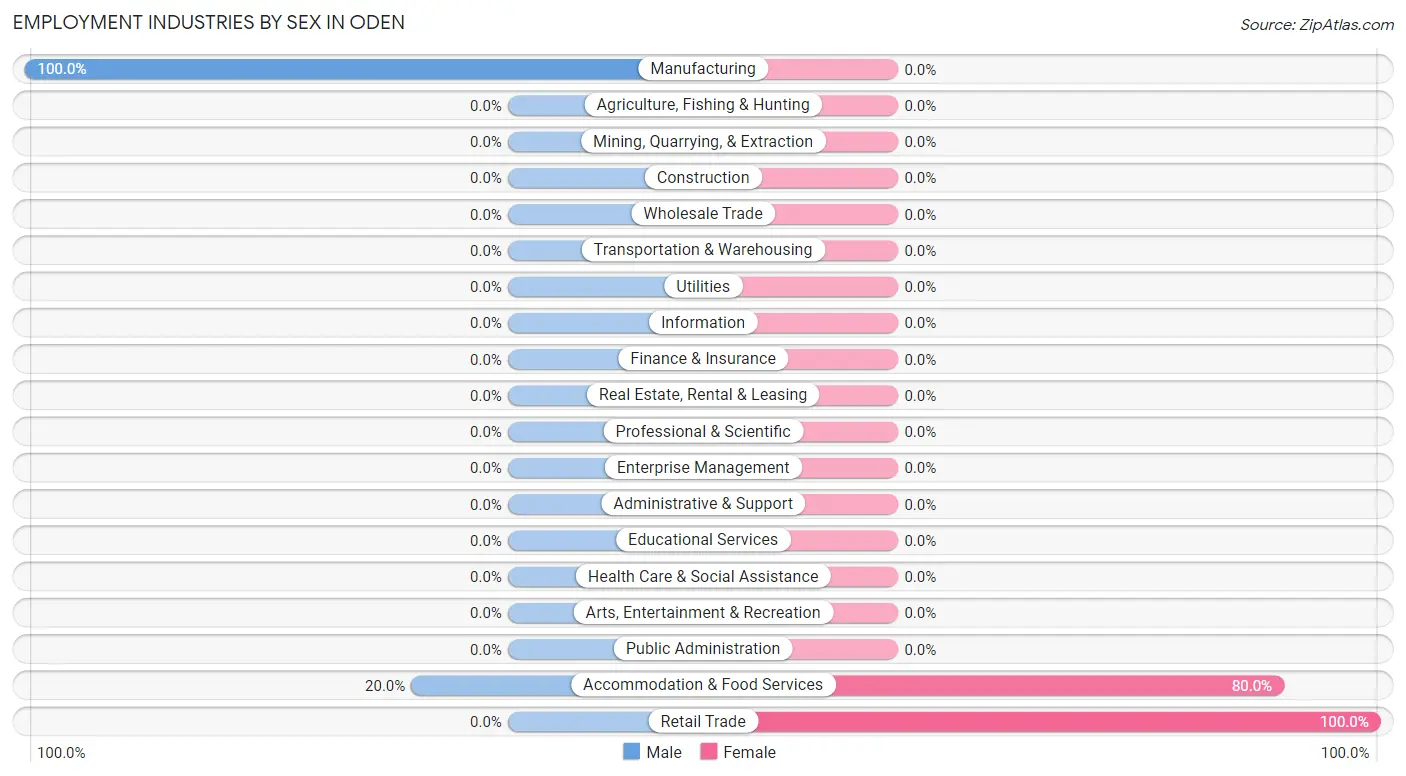
| Industry | Male | Female |
| Agriculture, Fishing & Hunting | 0 (0.0%) | 0 (0.0%) |
| Mining, Quarrying, & Extraction | 0 (0.0%) | 0 (0.0%) |
| Construction | 0 (0.0%) | 0 (0.0%) |
| Manufacturing | 55 (100.0%) | 0 (0.0%) |
| Wholesale Trade | 0 (0.0%) | 0 (0.0%) |
| Retail Trade | 0 (0.0%) | 30 (100.0%) |
| Transportation & Warehousing | 0 (0.0%) | 0 (0.0%) |
| Utilities | 0 (0.0%) | 0 (0.0%) |
| Information | 0 (0.0%) | 0 (0.0%) |
| Finance & Insurance | 0 (0.0%) | 0 (0.0%) |
| Real Estate, Rental & Leasing | 0 (0.0%) | 0 (0.0%) |
| Professional & Scientific | 0 (0.0%) | 0 (0.0%) |
| Enterprise Management | 0 (0.0%) | 0 (0.0%) |
| Administrative & Support | 0 (0.0%) | 0 (0.0%) |
| Educational Services | 0 (0.0%) | 0 (0.0%) |
| Health Care & Social Assistance | 0 (0.0%) | 0 (0.0%) |
| Arts, Entertainment & Recreation | 0 (0.0%) | 0 (0.0%) |
| Accommodation & Food Services | 18 (20.0%) | 72 (80.0%) |
| Public Administration | 0 (0.0%) | 0 (0.0%) |
| Total | 73 (41.7%) | 102 (58.3%) |
Education in Oden
School Enrollment in Oden
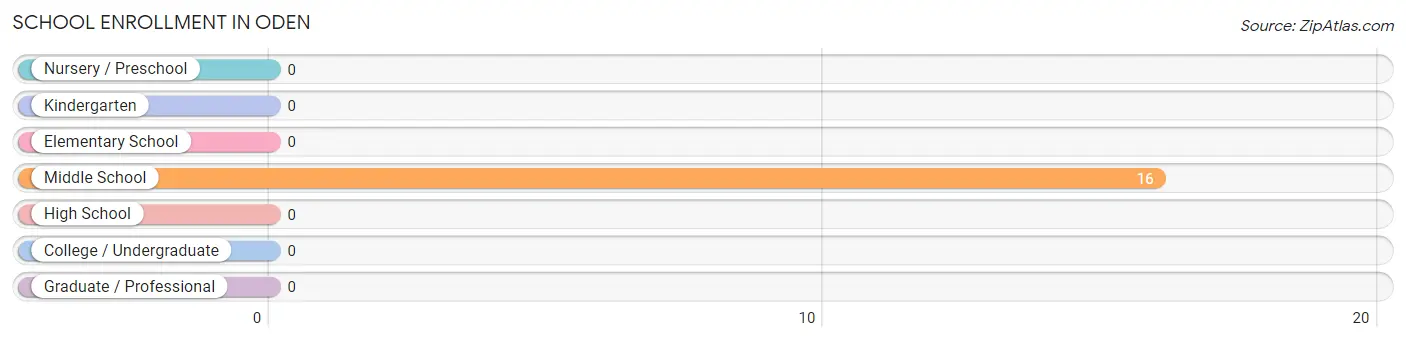
| School Level | # Students | % Students |
| Nursery / Preschool | 0 | 0.0% |
| Kindergarten | 0 | 0.0% |
| Elementary School | 0 | 0.0% |
| Middle School | 16 | 100.0% |
| High School | 0 | 0.0% |
| College / Undergraduate | 0 | 0.0% |
| Graduate / Professional | 0 | 0.0% |
| Total | 16 | 100.0% |
School Enrollment by Age by Funding Source in Oden
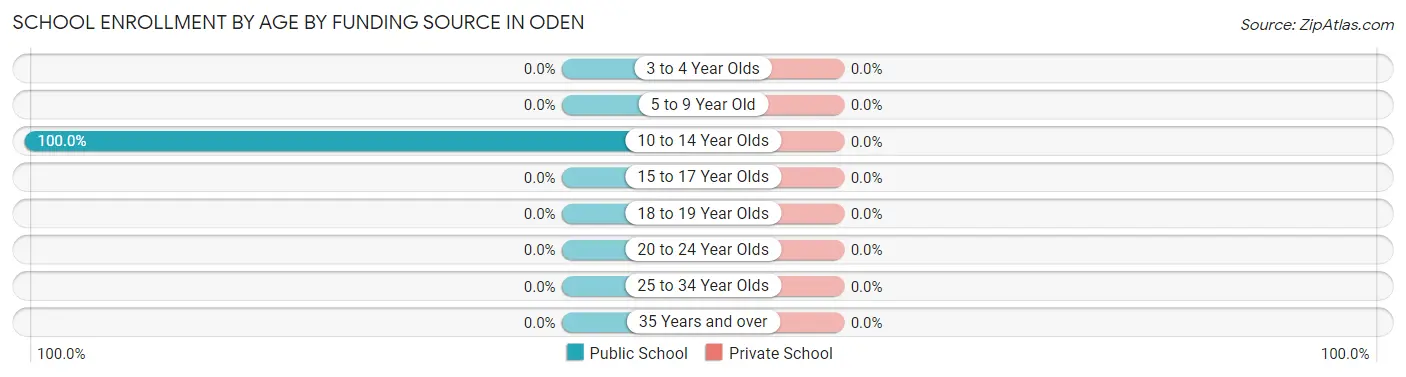
| Age Bracket | Public School | Private School |
| 3 to 4 Year Olds | 0 (0.0%) | 0 (0.0%) |
| 5 to 9 Year Old | 0 (0.0%) | 0 (0.0%) |
| 10 to 14 Year Olds | 16 (100.0%) | 0 (0.0%) |
| 15 to 17 Year Olds | 0 (0.0%) | 0 (0.0%) |
| 18 to 19 Year Olds | 0 (0.0%) | 0 (0.0%) |
| 20 to 24 Year Olds | 0 (0.0%) | 0 (0.0%) |
| 25 to 34 Year Olds | 0 (0.0%) | 0 (0.0%) |
| 35 Years and over | 0 (0.0%) | 0 (0.0%) |
| Total | 16 (100.0%) | 0 (0.0%) |
Educational Attainment by Field of Study in Oden
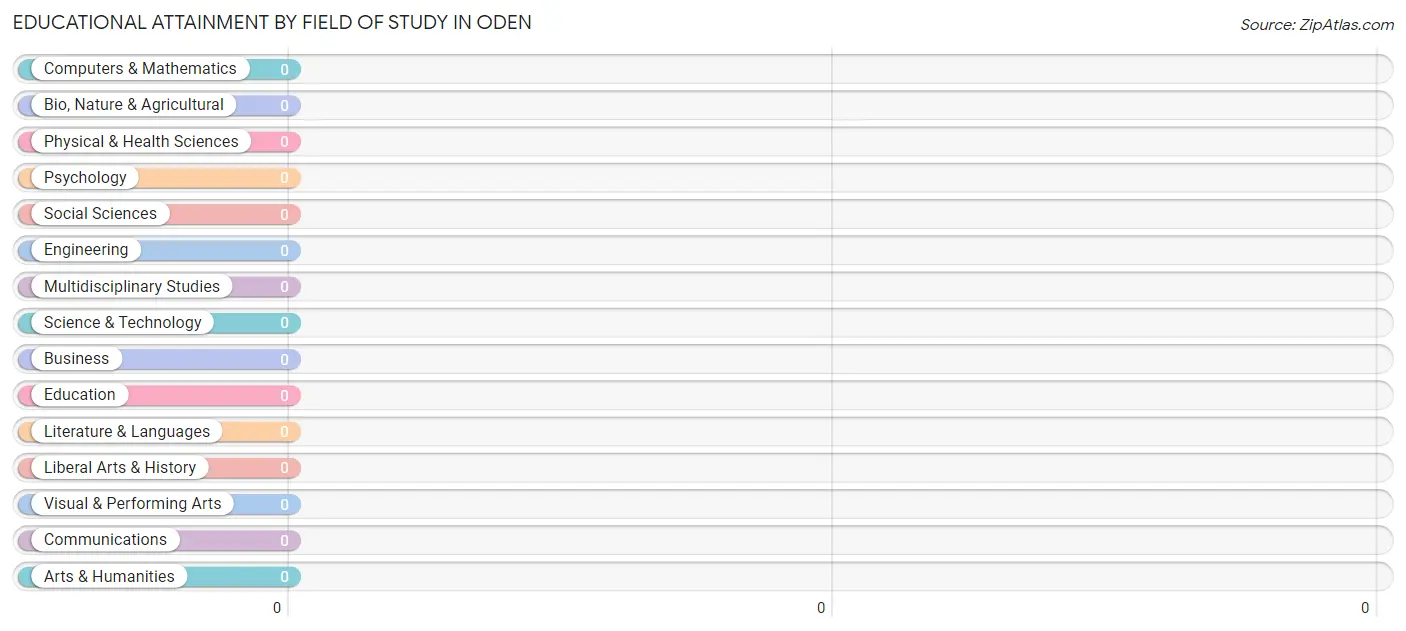
| Field of Study | # Graduates | % Graduates |
| Computers & Mathematics | 0 | 0.0% |
| Bio, Nature & Agricultural | 0 | 0.0% |
| Physical & Health Sciences | 0 | 0.0% |
| Psychology | 0 | 0.0% |
| Social Sciences | 0 | 0.0% |
| Engineering | 0 | 0.0% |
| Multidisciplinary Studies | 0 | 0.0% |
| Science & Technology | 0 | 0.0% |
| Business | 0 | 0.0% |
| Education | 0 | 0.0% |
| Literature & Languages | 0 | 0.0% |
| Liberal Arts & History | 0 | 0.0% |
| Visual & Performing Arts | 0 | 0.0% |
| Communications | 0 | 0.0% |
| Arts & Humanities | 0 | 0.0% |
| Total | 0 | 0.0% |
Transportation & Commute in Oden
Vehicle Availability by Sex in Oden
The most prevalent vehicle ownership categories in Oden are males with 1 vehicle (55, accounting for 75.3%) and females with 1 vehicle (102, making up 53.9%).
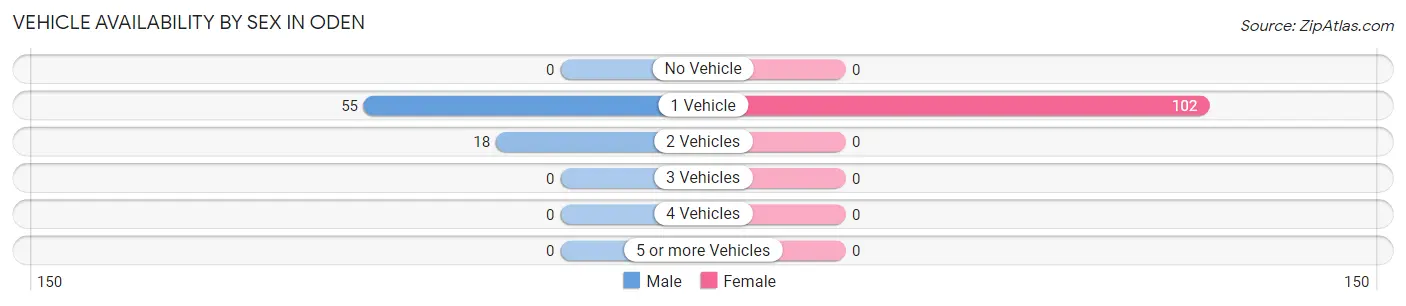
| Vehicles Available | Male | Female |
| No Vehicle | 0 (0.0%) | 0 (0.0%) |
| 1 Vehicle | 55 (75.3%) | 102 (100.0%) |
| 2 Vehicles | 18 (24.7%) | 0 (0.0%) |
| 3 Vehicles | 0 (0.0%) | 0 (0.0%) |
| 4 Vehicles | 0 (0.0%) | 0 (0.0%) |
| 5 or more Vehicles | 0 (0.0%) | 0 (0.0%) |
| Total | 73 (100.0%) | 102 (100.0%) |
Commute Time in Oden
The most frequently occuring commute durations in Oden are 15 to 19 minutes (127 commuters, 72.6%), 20 to 24 minutes (30 commuters, 17.1%), and 5 to 9 minutes (18 commuters, 10.3%).
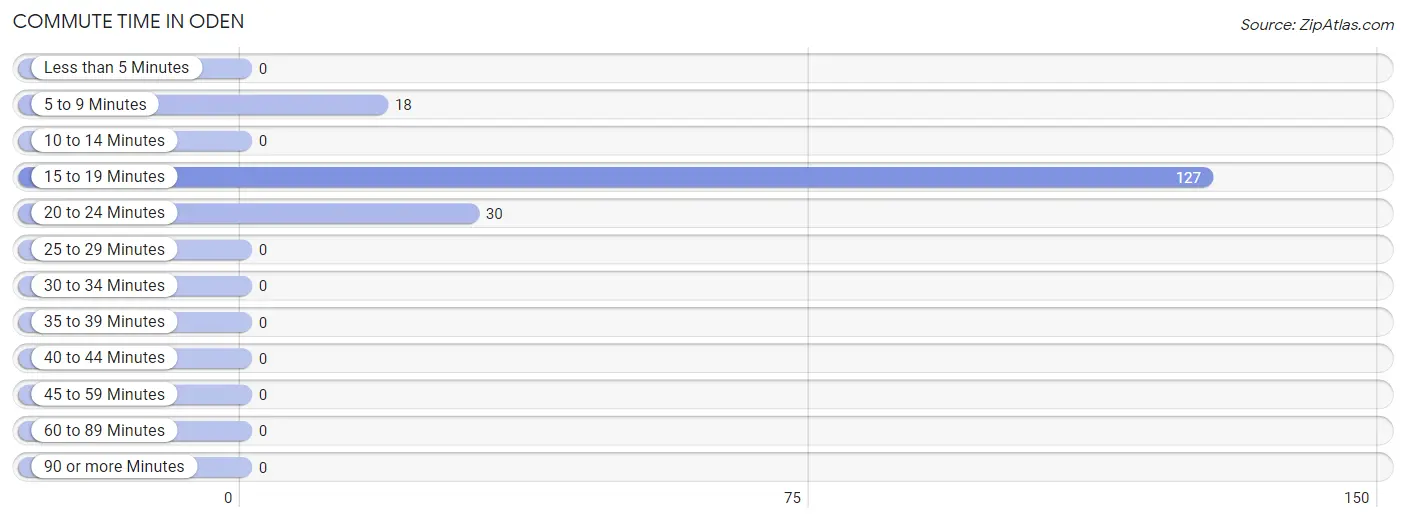
| Commute Time | # Commuters | % Commuters |
| Less than 5 Minutes | 0 | 0.0% |
| 5 to 9 Minutes | 18 | 10.3% |
| 10 to 14 Minutes | 0 | 0.0% |
| 15 to 19 Minutes | 127 | 72.6% |
| 20 to 24 Minutes | 30 | 17.1% |
| 25 to 29 Minutes | 0 | 0.0% |
| 30 to 34 Minutes | 0 | 0.0% |
| 35 to 39 Minutes | 0 | 0.0% |
| 40 to 44 Minutes | 0 | 0.0% |
| 45 to 59 Minutes | 0 | 0.0% |
| 60 to 89 Minutes | 0 | 0.0% |
| 90 or more Minutes | 0 | 0.0% |
Commute Time by Sex in Oden
The most common commute times in Oden are 15 to 19 minutes (55 commuters, 75.3%) for males and 15 to 19 minutes (72 commuters, 70.6%) for females.
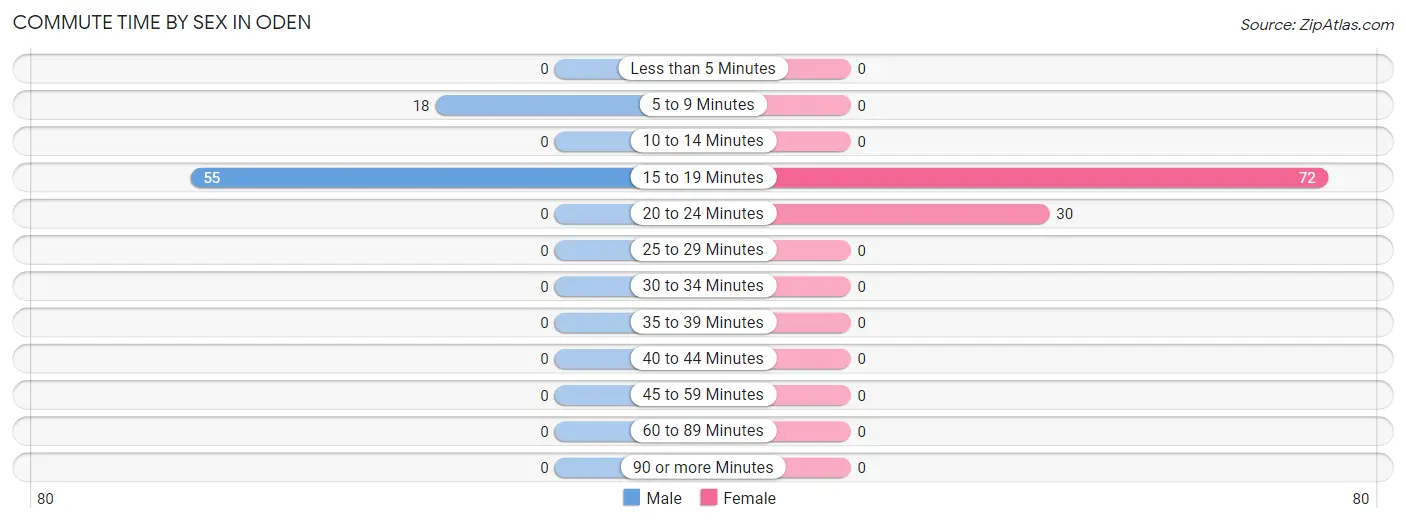
| Commute Time | Male | Female |
| Less than 5 Minutes | 0 (0.0%) | 0 (0.0%) |
| 5 to 9 Minutes | 18 (24.7%) | 0 (0.0%) |
| 10 to 14 Minutes | 0 (0.0%) | 0 (0.0%) |
| 15 to 19 Minutes | 55 (75.3%) | 72 (70.6%) |
| 20 to 24 Minutes | 0 (0.0%) | 30 (29.4%) |
| 25 to 29 Minutes | 0 (0.0%) | 0 (0.0%) |
| 30 to 34 Minutes | 0 (0.0%) | 0 (0.0%) |
| 35 to 39 Minutes | 0 (0.0%) | 0 (0.0%) |
| 40 to 44 Minutes | 0 (0.0%) | 0 (0.0%) |
| 45 to 59 Minutes | 0 (0.0%) | 0 (0.0%) |
| 60 to 89 Minutes | 0 (0.0%) | 0 (0.0%) |
| 90 or more Minutes | 0 (0.0%) | 0 (0.0%) |
Time of Departure to Work by Sex in Oden
The most frequent times of departure to work in Oden are 4:00 PM to 11:59 PM (55, 75.3%) for males and 6:30 AM to 6:59 AM (72, 70.6%) for females.
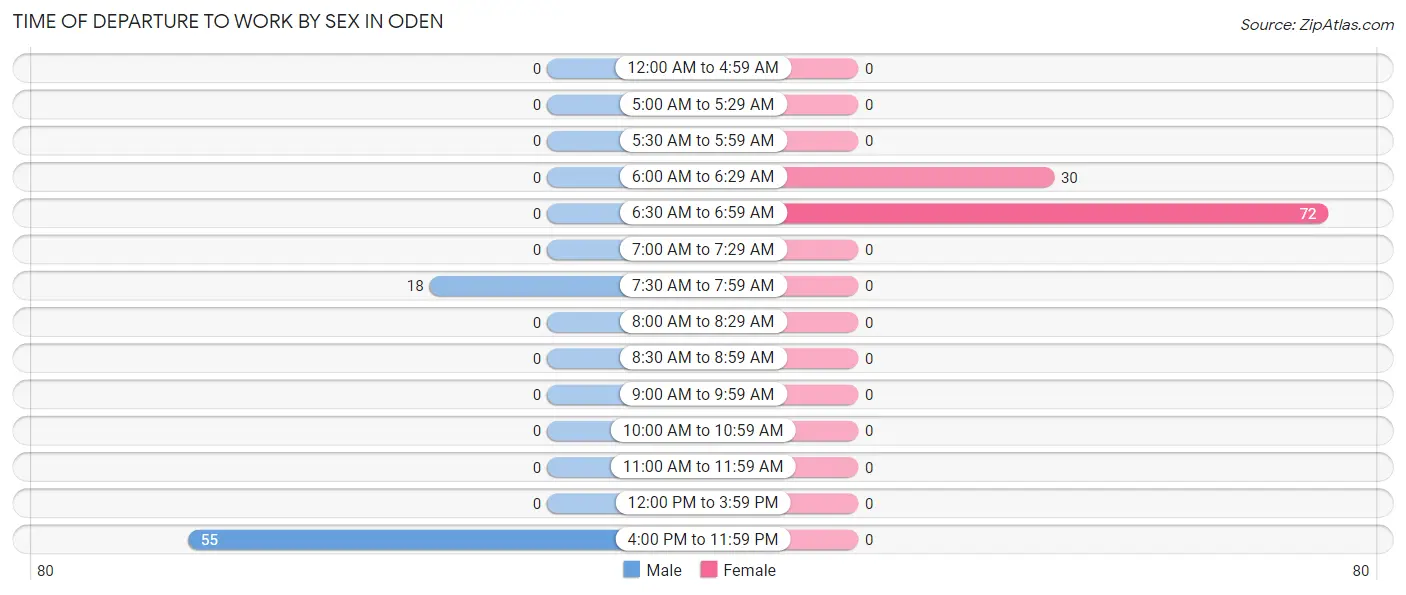
| Time of Departure | Male | Female |
| 12:00 AM to 4:59 AM | 0 (0.0%) | 0 (0.0%) |
| 5:00 AM to 5:29 AM | 0 (0.0%) | 0 (0.0%) |
| 5:30 AM to 5:59 AM | 0 (0.0%) | 0 (0.0%) |
| 6:00 AM to 6:29 AM | 0 (0.0%) | 30 (29.4%) |
| 6:30 AM to 6:59 AM | 0 (0.0%) | 72 (70.6%) |
| 7:00 AM to 7:29 AM | 0 (0.0%) | 0 (0.0%) |
| 7:30 AM to 7:59 AM | 18 (24.7%) | 0 (0.0%) |
| 8:00 AM to 8:29 AM | 0 (0.0%) | 0 (0.0%) |
| 8:30 AM to 8:59 AM | 0 (0.0%) | 0 (0.0%) |
| 9:00 AM to 9:59 AM | 0 (0.0%) | 0 (0.0%) |
| 10:00 AM to 10:59 AM | 0 (0.0%) | 0 (0.0%) |
| 11:00 AM to 11:59 AM | 0 (0.0%) | 0 (0.0%) |
| 12:00 PM to 3:59 PM | 0 (0.0%) | 0 (0.0%) |
| 4:00 PM to 11:59 PM | 55 (75.3%) | 0 (0.0%) |
| Total | 73 (100.0%) | 102 (100.0%) |
Housing Occupancy in Oden
Occupancy by Ownership in Oden
Of the total 138 dwellings in Oden, owner-occupied units account for 36 (26.1%), while renter-occupied units make up 102 (73.9%).
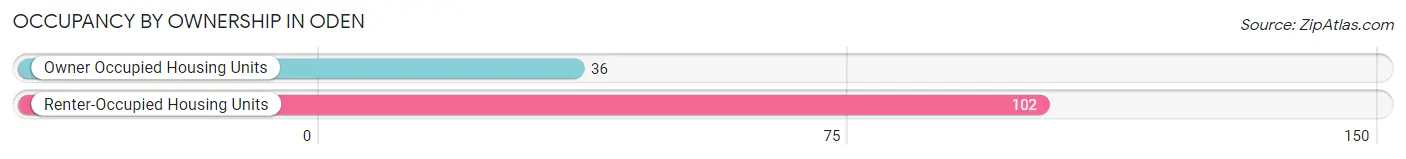
| Occupancy | # Housing Units | % Housing Units |
| Owner Occupied Housing Units | 36 | 26.1% |
| Renter-Occupied Housing Units | 102 | 73.9% |
| Total Occupied Housing Units | 138 | 100.0% |
Occupancy by Household Size in Oden
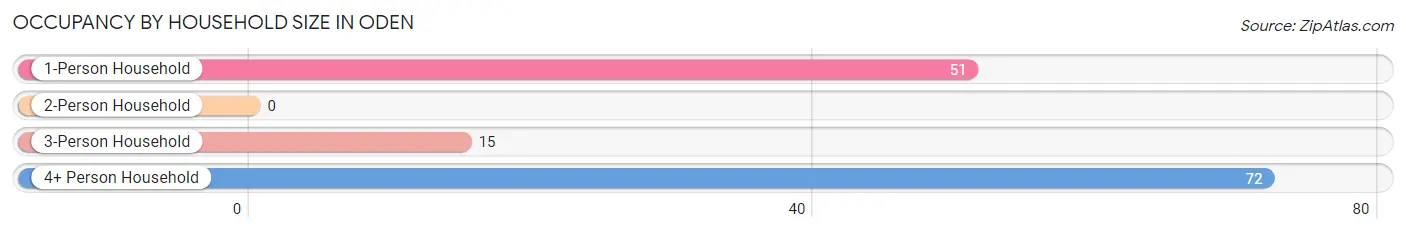
| Household Size | # Housing Units | % Housing Units |
| 1-Person Household | 51 | 37.0% |
| 2-Person Household | 0 | 0.0% |
| 3-Person Household | 15 | 10.9% |
| 4+ Person Household | 72 | 52.2% |
| Total Housing Units | 138 | 100.0% |
Occupancy by Ownership by Household Size in Oden
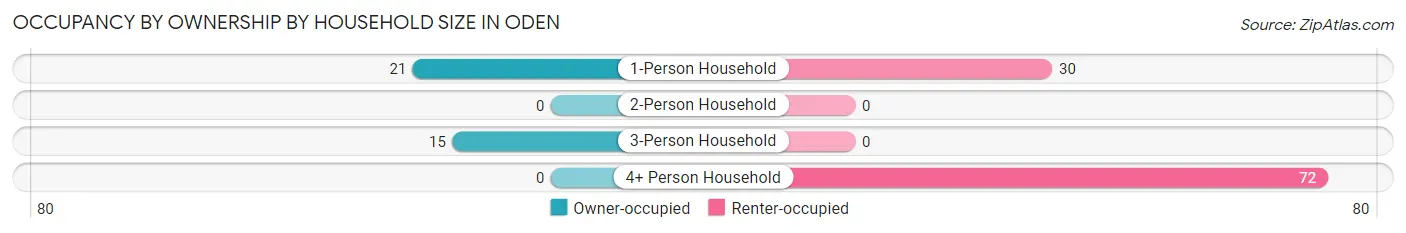
| Household Size | Owner-occupied | Renter-occupied |
| 1-Person Household | 21 (41.2%) | 30 (58.8%) |
| 2-Person Household | 0 (0.0%) | 0 (0.0%) |
| 3-Person Household | 15 (100.0%) | 0 (0.0%) |
| 4+ Person Household | 0 (0.0%) | 72 (100.0%) |
| Total Housing Units | 36 (26.1%) | 102 (73.9%) |
Occupancy by Educational Attainment in Oden
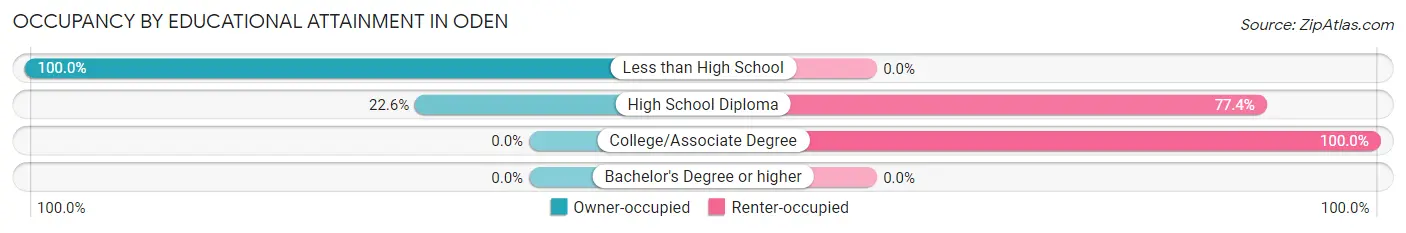
| Household Size | Owner-occupied | Renter-occupied |
| Less than High School | 15 (100.0%) | 0 (0.0%) |
| High School Diploma | 21 (22.6%) | 72 (77.4%) |
| College/Associate Degree | 0 (0.0%) | 30 (100.0%) |
| Bachelor's Degree or higher | 0 (0.0%) | 0 (0.0%) |
Occupancy by Age of Householder in Oden
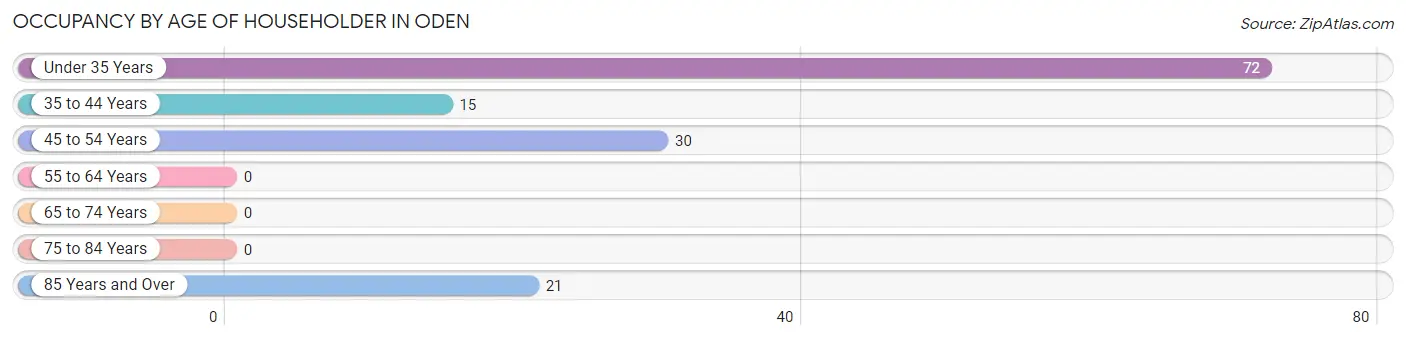
| Age Bracket | # Households | % Households |
| Under 35 Years | 72 | 52.2% |
| 35 to 44 Years | 15 | 10.9% |
| 45 to 54 Years | 30 | 21.7% |
| 55 to 64 Years | 0 | 0.0% |
| 65 to 74 Years | 0 | 0.0% |
| 75 to 84 Years | 0 | 0.0% |
| 85 Years and Over | 21 | 15.2% |
| Total | 138 | 100.0% |
Housing Finances in Oden
Median Income by Occupancy in Oden
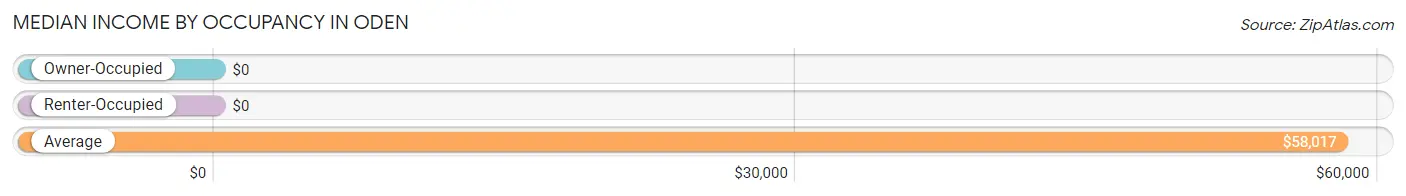
| Occupancy Type | # Households | Median Income |
| Owner-Occupied | 36 (26.1%) | $0 |
| Renter-Occupied | 102 (73.9%) | $0 |
| Average | 138 (100.0%) | $58,017 |
Occupancy by Householder Income Bracket in Oden
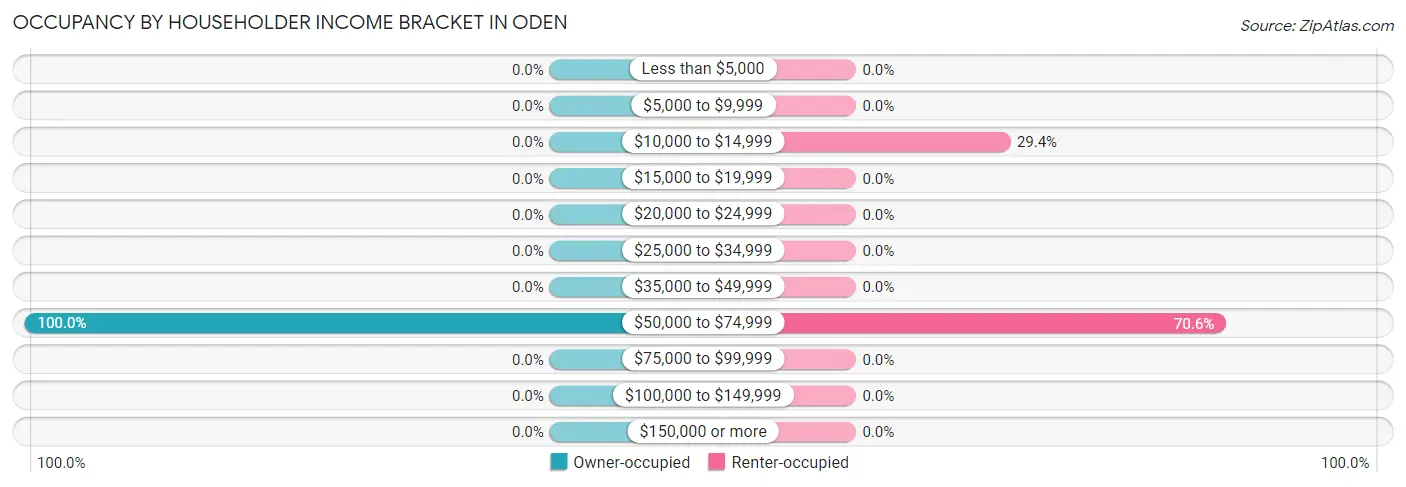
| Income Bracket | Owner-occupied | Renter-occupied |
| Less than $5,000 | 0 (0.0%) | 0 (0.0%) |
| $5,000 to $9,999 | 0 (0.0%) | 0 (0.0%) |
| $10,000 to $14,999 | 0 (0.0%) | 30 (29.4%) |
| $15,000 to $19,999 | 0 (0.0%) | 0 (0.0%) |
| $20,000 to $24,999 | 0 (0.0%) | 0 (0.0%) |
| $25,000 to $34,999 | 0 (0.0%) | 0 (0.0%) |
| $35,000 to $49,999 | 0 (0.0%) | 0 (0.0%) |
| $50,000 to $74,999 | 36 (100.0%) | 72 (70.6%) |
| $75,000 to $99,999 | 0 (0.0%) | 0 (0.0%) |
| $100,000 to $149,999 | 0 (0.0%) | 0 (0.0%) |
| $150,000 or more | 0 (0.0%) | 0 (0.0%) |
| Total | 36 (100.0%) | 102 (100.0%) |
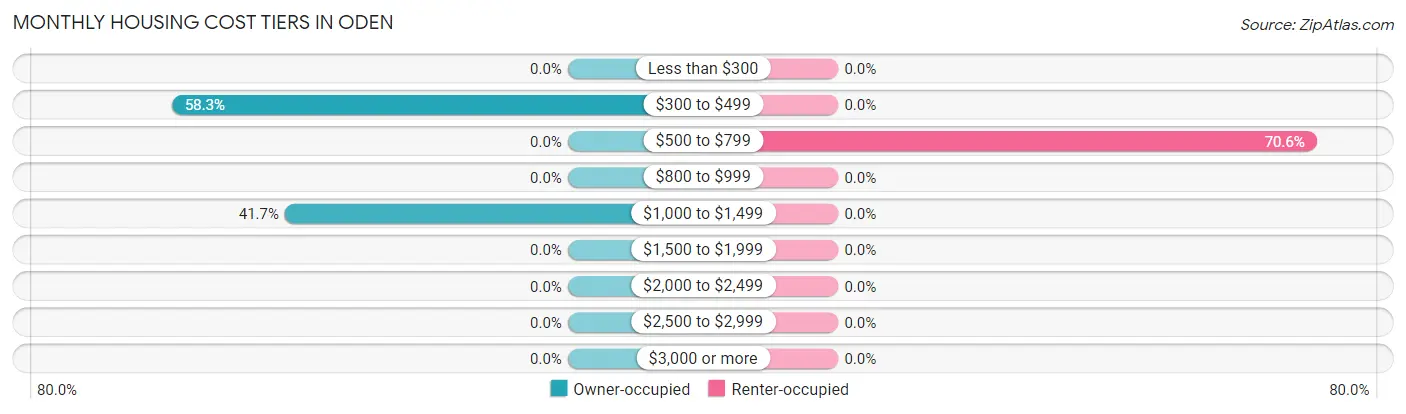
Monthly Housing Cost Tiers in Oden
| Monthly Cost | Owner-occupied | Renter-occupied |
| Less than $300 | 0 (0.0%) | 0 (0.0%) |
| $300 to $499 | 21 (58.3%) | 0 (0.0%) |
| $500 to $799 | 0 (0.0%) | 72 (70.6%) |
| $800 to $999 | 0 (0.0%) | 0 (0.0%) |
| $1,000 to $1,499 | 15 (41.7%) | 0 (0.0%) |
| $1,500 to $1,999 | 0 (0.0%) | 0 (0.0%) |
| $2,000 to $2,499 | 0 (0.0%) | 0 (0.0%) |
| $2,500 to $2,999 | 0 (0.0%) | 0 (0.0%) |
| $3,000 or more | 0 (0.0%) | 0 (0.0%) |
| Total | 36 (100.0%) | 102 (100.0%) |
Physical Housing Characteristics in Oden
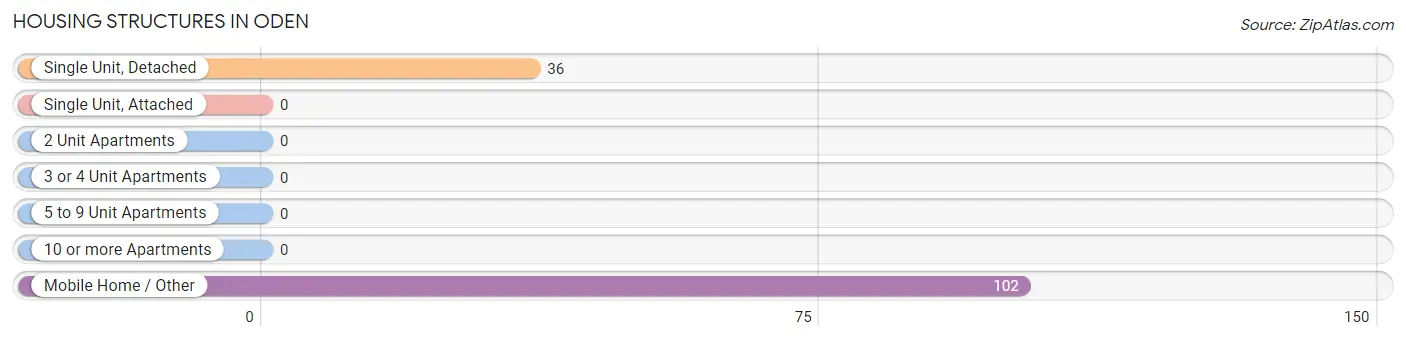
Housing Structures in Oden
| Structure Type | # Housing Units | % Housing Units |
| Single Unit, Detached | 36 | 26.1% |
| Single Unit, Attached | 0 | 0.0% |
| 2 Unit Apartments | 0 | 0.0% |
| 3 or 4 Unit Apartments | 0 | 0.0% |
| 5 to 9 Unit Apartments | 0 | 0.0% |
| 10 or more Apartments | 0 | 0.0% |
| Mobile Home / Other | 102 | 73.9% |
| Total | 138 | 100.0% |
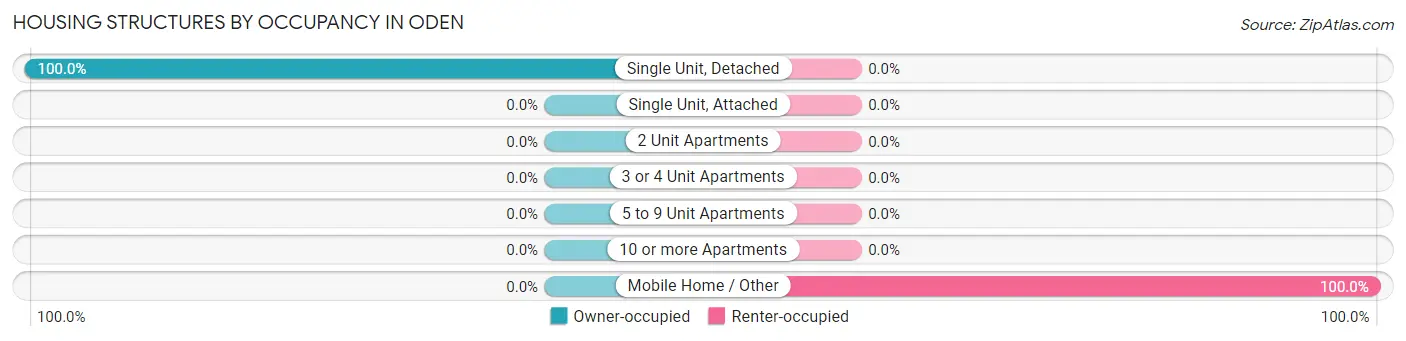
Housing Structures by Occupancy in Oden
| Structure Type | Owner-occupied | Renter-occupied |
| Single Unit, Detached | 36 (100.0%) | 0 (0.0%) |
| Single Unit, Attached | 0 (0.0%) | 0 (0.0%) |
| 2 Unit Apartments | 0 (0.0%) | 0 (0.0%) |
| 3 or 4 Unit Apartments | 0 (0.0%) | 0 (0.0%) |
| 5 to 9 Unit Apartments | 0 (0.0%) | 0 (0.0%) |
| 10 or more Apartments | 0 (0.0%) | 0 (0.0%) |
| Mobile Home / Other | 0 (0.0%) | 102 (100.0%) |
| Total | 36 (26.1%) | 102 (73.9%) |
Housing Structures by Number of Rooms in Oden
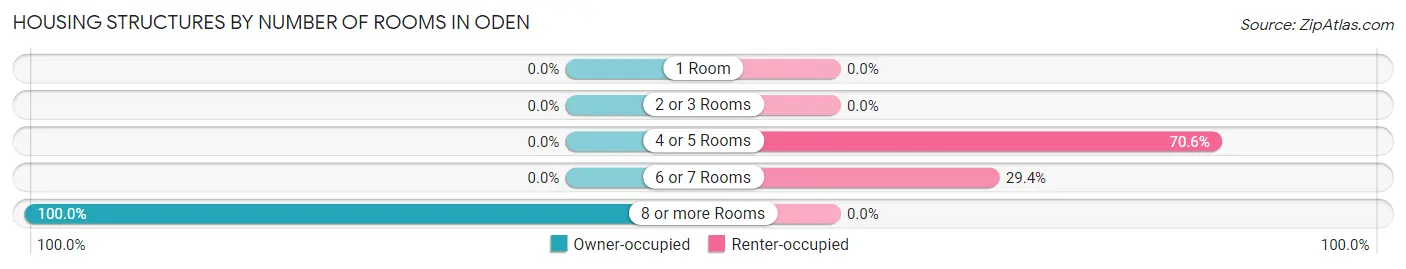
| Number of Rooms | Owner-occupied | Renter-occupied |
| 1 Room | 0 (0.0%) | 0 (0.0%) |
| 2 or 3 Rooms | 0 (0.0%) | 0 (0.0%) |
| 4 or 5 Rooms | 0 (0.0%) | 72 (70.6%) |
| 6 or 7 Rooms | 0 (0.0%) | 30 (29.4%) |
| 8 or more Rooms | 36 (100.0%) | 0 (0.0%) |
| Total | 36 (100.0%) | 102 (100.0%) |
Housing Structure by Heating Type in Oden
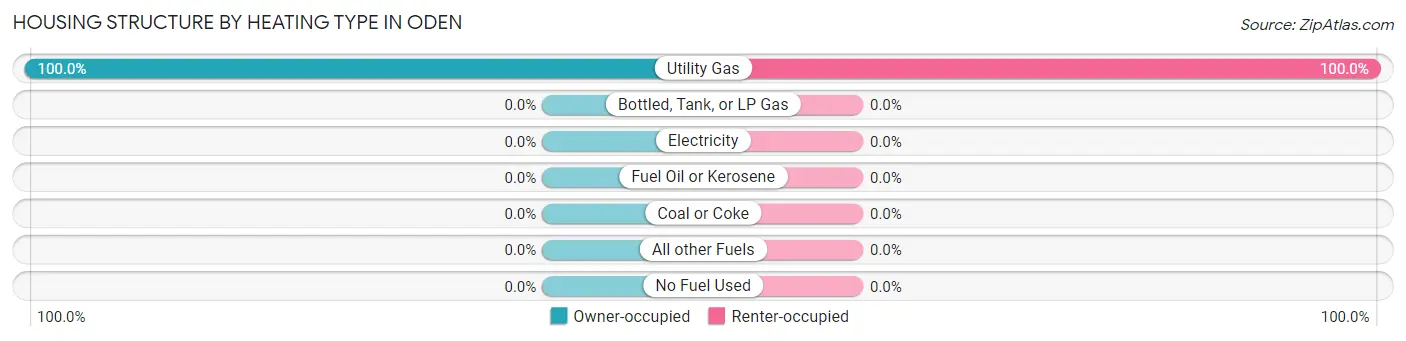
| Heating Type | Owner-occupied | Renter-occupied |
| Utility Gas | 36 (100.0%) | 102 (100.0%) |
| Bottled, Tank, or LP Gas | 0 (0.0%) | 0 (0.0%) |
| Electricity | 0 (0.0%) | 0 (0.0%) |
| Fuel Oil or Kerosene | 0 (0.0%) | 0 (0.0%) |
| Coal or Coke | 0 (0.0%) | 0 (0.0%) |
| All other Fuels | 0 (0.0%) | 0 (0.0%) |
| No Fuel Used | 0 (0.0%) | 0 (0.0%) |
| Total | 36 (100.0%) | 102 (100.0%) |
Household Vehicle Usage in Oden
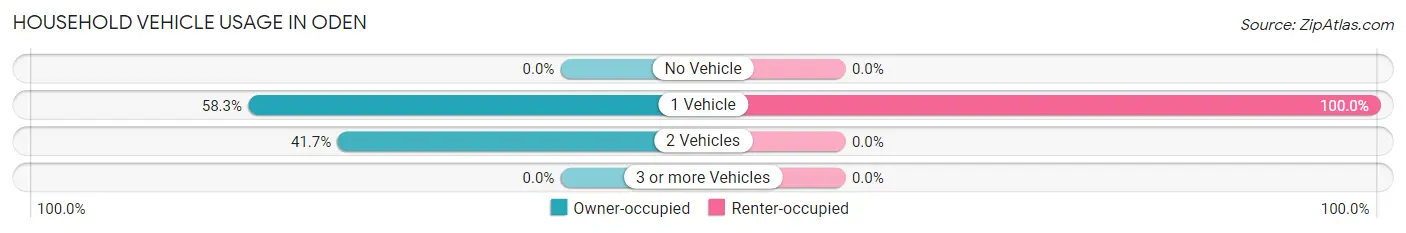
| Vehicles per Household | Owner-occupied | Renter-occupied |
| No Vehicle | 0 (0.0%) | 0 (0.0%) |
| 1 Vehicle | 21 (58.3%) | 102 (100.0%) |
| 2 Vehicles | 15 (41.7%) | 0 (0.0%) |
| 3 or more Vehicles | 0 (0.0%) | 0 (0.0%) |
| Total | 36 (100.0%) | 102 (100.0%) |
Real Estate & Mortgages in Oden
Real Estate and Mortgage Overview in Oden
| Characteristic | Without Mortgage | With Mortgage |
| Housing Units | 21 | 15 |
| Median Property Value | - | - |
| Median Household Income | - | - |
| Monthly Housing Costs | - | - |
| Real Estate Taxes | - | - |
Property Value by Mortgage Status in Oden
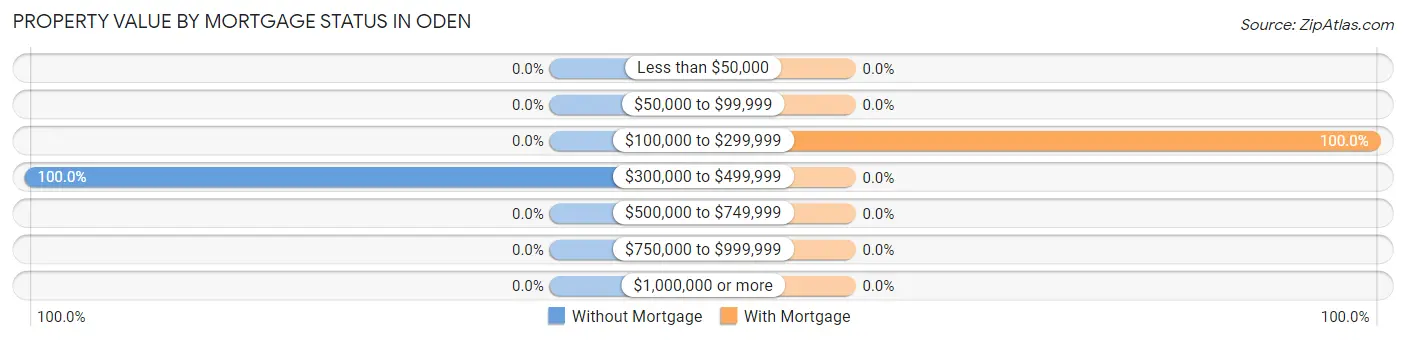
| Property Value | Without Mortgage | With Mortgage |
| Less than $50,000 | 0 (0.0%) | 0 (0.0%) |
| $50,000 to $99,999 | 0 (0.0%) | 0 (0.0%) |
| $100,000 to $299,999 | 0 (0.0%) | 15 (100.0%) |
| $300,000 to $499,999 | 21 (100.0%) | 0 (0.0%) |
| $500,000 to $749,999 | 0 (0.0%) | 0 (0.0%) |
| $750,000 to $999,999 | 0 (0.0%) | 0 (0.0%) |
| $1,000,000 or more | 0 (0.0%) | 0 (0.0%) |
| Total | 21 (100.0%) | 15 (100.0%) |
Household Income by Mortgage Status in Oden
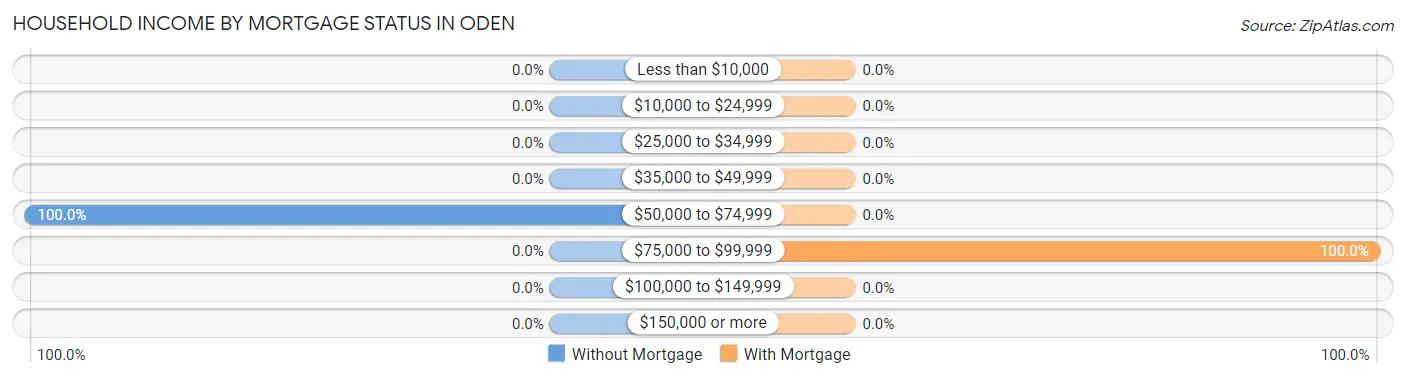
| Household Income | Without Mortgage | With Mortgage |
| Less than $10,000 | 0 (0.0%) | 0 (0.0%) |
| $10,000 to $24,999 | 0 (0.0%) | 0 (0.0%) |
| $25,000 to $34,999 | 0 (0.0%) | 0 (0.0%) |
| $35,000 to $49,999 | 0 (0.0%) | 0 (0.0%) |
| $50,000 to $74,999 | 21 (100.0%) | 0 (0.0%) |
| $75,000 to $99,999 | 0 (0.0%) | 15 (100.0%) |
| $100,000 to $149,999 | 0 (0.0%) | 0 (0.0%) |
| $150,000 or more | 0 (0.0%) | 0 (0.0%) |
| Total | 21 (100.0%) | 15 (100.0%) |
Property Value to Household Income Ratio in Oden
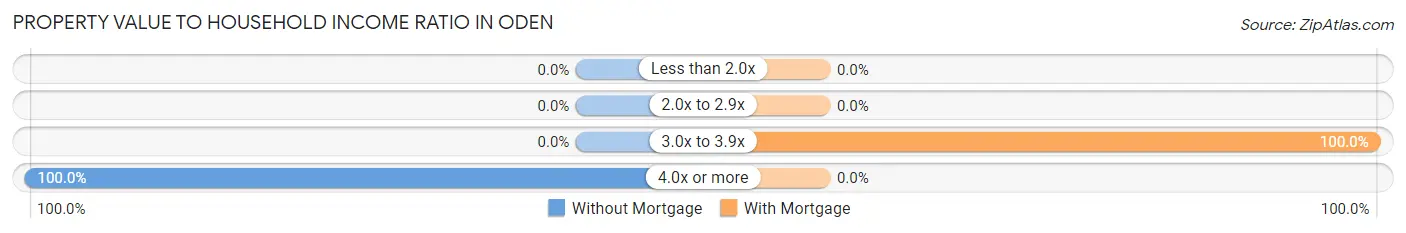
| Value-to-Income Ratio | Without Mortgage | With Mortgage |
| Less than 2.0x | 0 (0.0%) | 0 (0.0%) |
| 2.0x to 2.9x | 0 (0.0%) | 0 (0.0%) |
| 3.0x to 3.9x | 0 (0.0%) | 15 (100.0%) |
| 4.0x or more | 21 (100.0%) | 0 (0.0%) |
| Total | 21 (100.0%) | 15 (100.0%) |
Real Estate Taxes by Mortgage Status in Oden
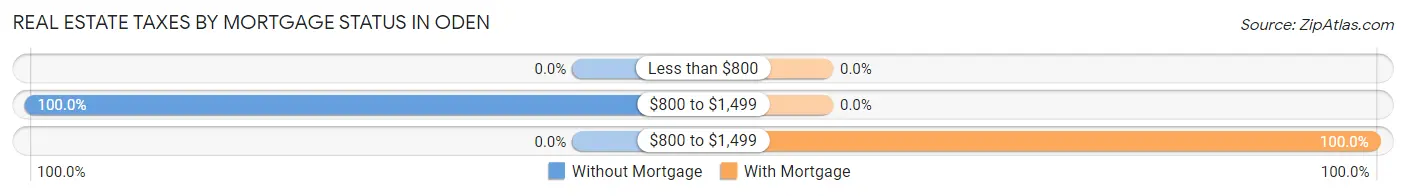
| Property Taxes | Without Mortgage | With Mortgage |
| Less than $800 | 0 (0.0%) | 0 (0.0%) |
| $800 to $1,499 | 21 (100.0%) | 0 (0.0%) |
| $800 to $1,499 | 0 (0.0%) | 15 (100.0%) |
| Total | 21 (100.0%) | 15 (100.0%) |
Health & Disability in Oden
Health Insurance Coverage by Age in Oden
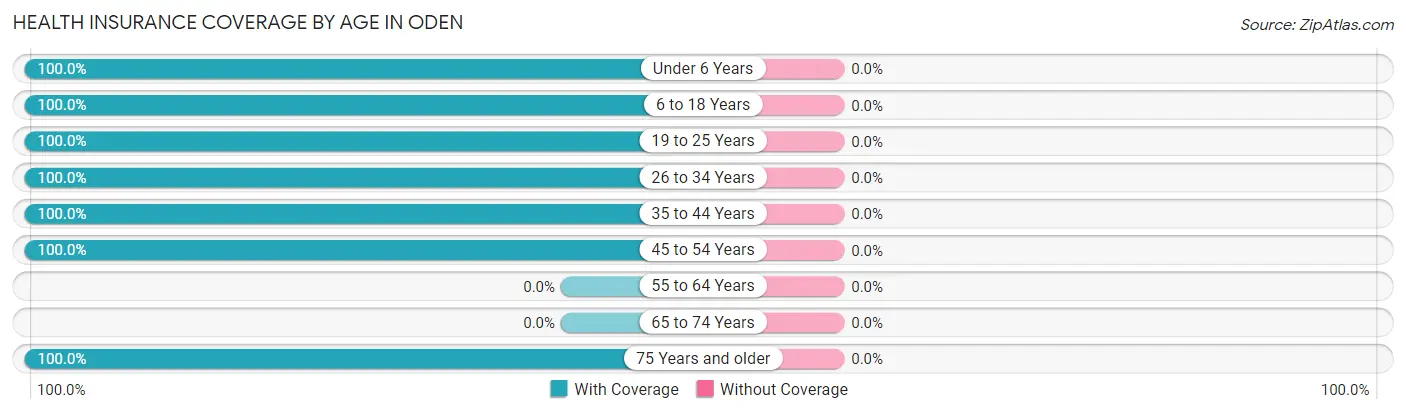
| Age Bracket | With Coverage | Without Coverage |
| Under 6 Years | 88 (100.0%) | 0 (0.0%) |
| 6 to 18 Years | 16 (100.0%) | 0 (0.0%) |
| 19 to 25 Years | 55 (100.0%) | 0 (0.0%) |
| 26 to 34 Years | 72 (100.0%) | 0 (0.0%) |
| 35 to 44 Years | 33 (100.0%) | 0 (0.0%) |
| 45 to 54 Years | 30 (100.0%) | 0 (0.0%) |
| 55 to 64 Years | 0 (0.0%) | 0 (0.0%) |
| 65 to 74 Years | 0 (0.0%) | 0 (0.0%) |
| 75 Years and older | 21 (100.0%) | 0 (0.0%) |
| Total | 315 (100.0%) | 0 (0.0%) |
Health Insurance Coverage by Citizenship Status in Oden
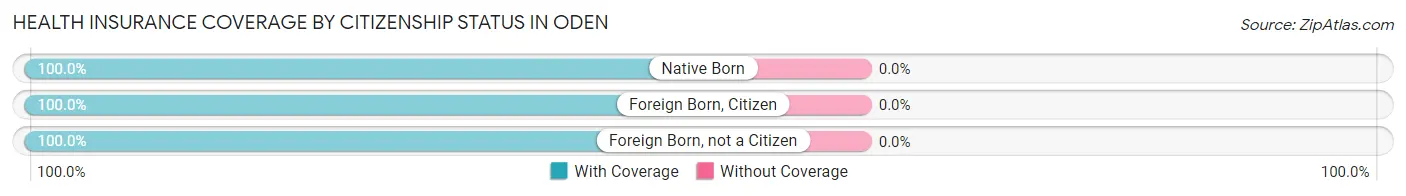
| Citizenship Status | With Coverage | Without Coverage |
| Native Born | 88 (100.0%) | 0 (0.0%) |
| Foreign Born, Citizen | 16 (100.0%) | 0 (0.0%) |
| Foreign Born, not a Citizen | 55 (100.0%) | 0 (0.0%) |
Health Insurance Coverage by Household Income in Oden
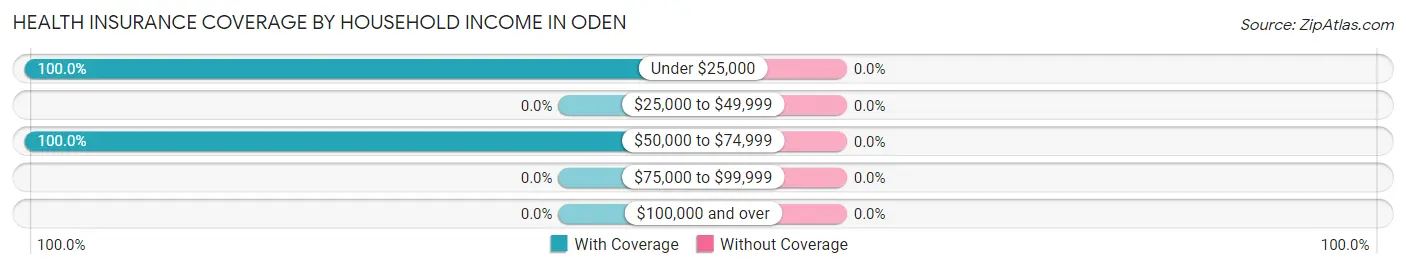
| Household Income | With Coverage | Without Coverage |
| Under $25,000 | 30 (100.0%) | 0 (0.0%) |
| $25,000 to $49,999 | 0 (0.0%) | 0 (0.0%) |
| $50,000 to $74,999 | 285 (100.0%) | 0 (0.0%) |
| $75,000 to $99,999 | 0 (0.0%) | 0 (0.0%) |
| $100,000 and over | 0 (0.0%) | 0 (0.0%) |
Public vs Private Health Insurance Coverage by Age in Oden
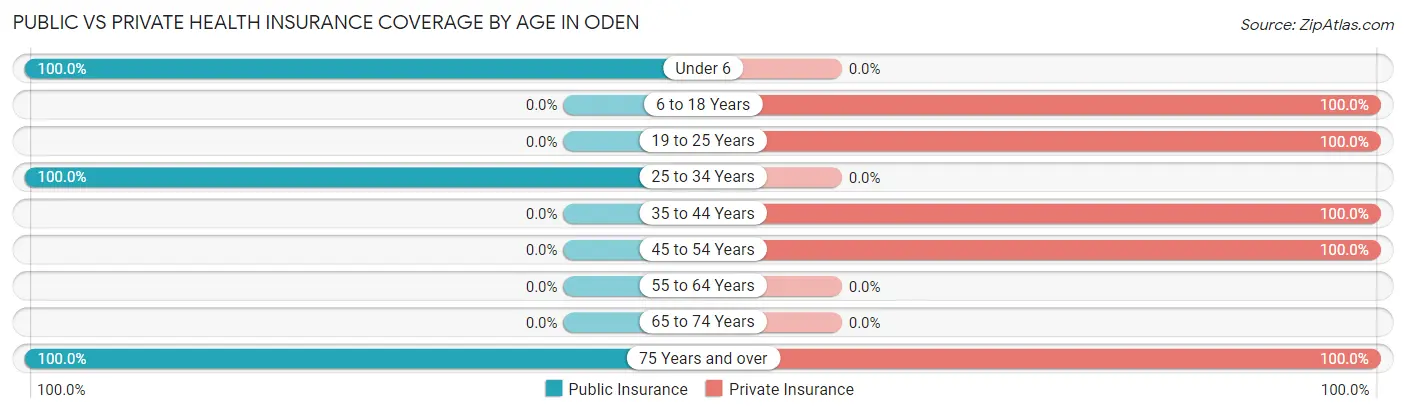
| Age Bracket | Public Insurance | Private Insurance |
| Under 6 | 88 (100.0%) | 0 (0.0%) |
| 6 to 18 Years | 0 (0.0%) | 16 (100.0%) |
| 19 to 25 Years | 0 (0.0%) | 55 (100.0%) |
| 25 to 34 Years | 72 (100.0%) | 0 (0.0%) |
| 35 to 44 Years | 0 (0.0%) | 33 (100.0%) |
| 45 to 54 Years | 0 (0.0%) | 30 (100.0%) |
| 55 to 64 Years | 0 (0.0%) | 0 (0.0%) |
| 65 to 74 Years | 0 (0.0%) | 0 (0.0%) |
| 75 Years and over | 21 (100.0%) | 21 (100.0%) |
| Total | 181 (57.5%) | 155 (49.2%) |
Disability Status by Sex by Age in Oden
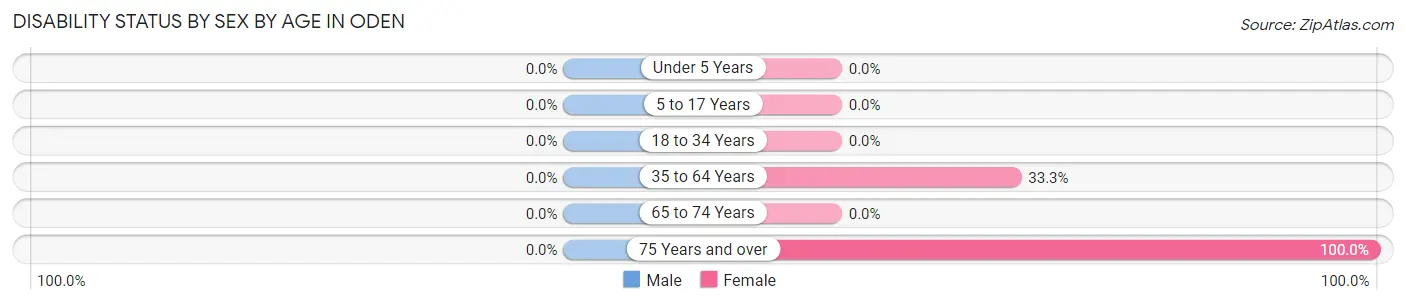
| Age Bracket | Male | Female |
| Under 5 Years | 0 (0.0%) | 0 (0.0%) |
| 5 to 17 Years | 0 (0.0%) | 0 (0.0%) |
| 18 to 34 Years | 0 (0.0%) | 0 (0.0%) |
| 35 to 64 Years | 0 (0.0%) | 15 (33.3%) |
| 65 to 74 Years | 0 (0.0%) | 0 (0.0%) |
| 75 Years and over | 0 (0.0%) | 21 (100.0%) |
Disability Class by Sex by Age in Oden
Disability Class: Hearing Difficulty
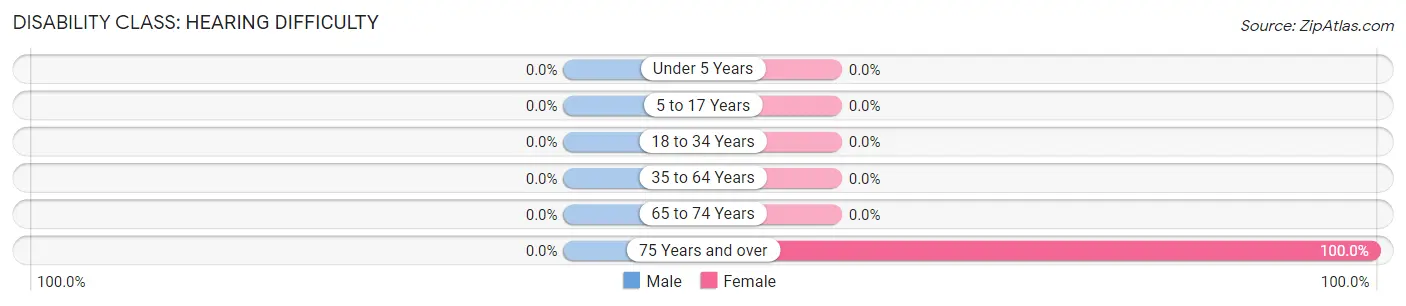
| Age Bracket | Male | Female |
| Under 5 Years | 0 (0.0%) | 0 (0.0%) |
| 5 to 17 Years | 0 (0.0%) | 0 (0.0%) |
| 18 to 34 Years | 0 (0.0%) | 0 (0.0%) |
| 35 to 64 Years | 0 (0.0%) | 0 (0.0%) |
| 65 to 74 Years | 0 (0.0%) | 0 (0.0%) |
| 75 Years and over | 0 (0.0%) | 21 (100.0%) |
Disability Class: Vision Difficulty
| Age Bracket | Male | Female |
| Under 5 Years | 0 (0.0%) | 0 (0.0%) |
| 5 to 17 Years | 0 (0.0%) | 0 (0.0%) |
| 18 to 34 Years | 0 (0.0%) | 0 (0.0%) |
| 35 to 64 Years | 0 (0.0%) | 0 (0.0%) |
| 65 to 74 Years | 0 (0.0%) | 0 (0.0%) |
| 75 Years and over | 0 (0.0%) | 0 (0.0%) |
Disability Class: Cognitive Difficulty
| Age Bracket | Male | Female |
| 5 to 17 Years | 0 (0.0%) | 0 (0.0%) |
| 18 to 34 Years | 0 (0.0%) | 0 (0.0%) |
| 35 to 64 Years | 0 (0.0%) | 0 (0.0%) |
| 65 to 74 Years | 0 (0.0%) | 0 (0.0%) |
| 75 Years and over | 0 (0.0%) | 0 (0.0%) |
Disability Class: Ambulatory Difficulty
| Age Bracket | Male | Female |
| 5 to 17 Years | 0 (0.0%) | 0 (0.0%) |
| 18 to 34 Years | 0 (0.0%) | 0 (0.0%) |
| 35 to 64 Years | 0 (0.0%) | 0 (0.0%) |
| 65 to 74 Years | 0 (0.0%) | 0 (0.0%) |
| 75 Years and over | 0 (0.0%) | 0 (0.0%) |
Disability Class: Self-Care Difficulty
| Age Bracket | Male | Female |
| 5 to 17 Years | 0 (0.0%) | 0 (0.0%) |
| 18 to 34 Years | 0 (0.0%) | 0 (0.0%) |
| 35 to 64 Years | 0 (0.0%) | 0 (0.0%) |
| 65 to 74 Years | 0 (0.0%) | 0 (0.0%) |
| 75 Years and over | 0 (0.0%) | 0 (0.0%) |
Technology Access in Oden
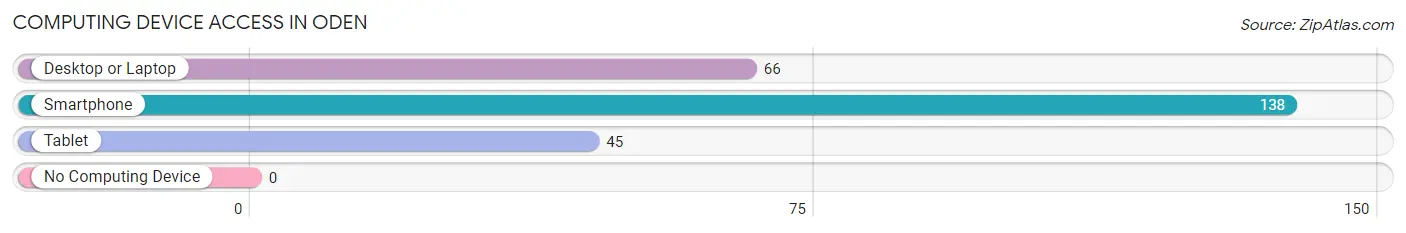
Computing Device Access in Oden
| Device Type | # Households | % Households |
| Desktop or Laptop | 66 | 47.8% |
| Smartphone | 138 | 100.0% |
| Tablet | 45 | 32.6% |
| No Computing Device | 0 | 0.0% |
| Total | 138 | 100.0% |
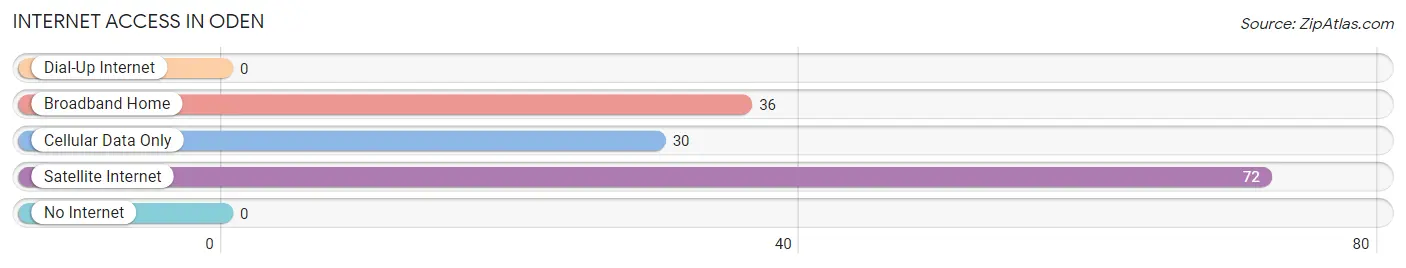
Internet Access in Oden
| Internet Type | # Households | % Households |
| Dial-Up Internet | 0 | 0.0% |
| Broadband Home | 36 | 26.1% |
| Cellular Data Only | 30 | 21.7% |
| Satellite Internet | 72 | 52.2% |
| No Internet | 0 | 0.0% |
| Total | 138 | 100.0% |
Oden Summary
Oden is a small unincorporated community located in Charlevoix County, Michigan. It is situated on the shores of Lake Michigan, about 10 miles south of Charlevoix. The community is home to about 200 people and is known for its picturesque views of the lake and its surrounding countryside.
History
Oden was first settled in the late 1800s by a group of Swedish immigrants. The settlers were attracted to the area by the abundance of natural resources, including timber and fish. The community was originally known as “Odensvik”, which translates to “Oden’s Bay”. The name was changed to Oden in the early 1900s.
The community grew slowly over the years, and by the mid-1900s, it had become a popular summer destination for tourists. The area was known for its beautiful scenery and its abundance of outdoor activities, such as fishing, boating, and swimming.
In the late 1900s, Oden began to experience a decline in population as people moved away from the area in search of better economic opportunities. However, the community has seen a resurgence in recent years, as people have begun to move back to the area and take advantage of its natural beauty and recreational opportunities.
Geography
Oden is located in Charlevoix County, Michigan, on the shores of Lake Michigan. The community is situated on the eastern side of the lake, about 10 miles south of Charlevoix. The area is known for its picturesque views of the lake and its surrounding countryside.
The area is mostly flat, with some rolling hills and valleys. The terrain is mostly covered in forests, with some open fields and meadows. The area is home to a variety of wildlife, including deer, foxes, and other small animals.
Economy
The economy of Oden is largely based on tourism and recreation. The area is known for its beautiful scenery and its abundance of outdoor activities, such as fishing, boating, and swimming. The community also has a few small businesses, such as a general store and a restaurant.
The area is also home to a few small farms, which produce a variety of crops, such as apples, cherries, and other fruits and vegetables. The farms also raise livestock, such as cows, pigs, and chickens.
Demographics
As of the 2010 census, the population of Oden was estimated to be around 200 people. The population is mostly white, with a small percentage of African Americans and Native Americans. The median age of the population is around 40 years old.
The median household income in Oden is around $40,000, which is slightly lower than the national average. The unemployment rate in the area is also slightly higher than the national average.
Conclusion
Oden is a small unincorporated community located in Charlevoix County, Michigan. It is situated on the shores of Lake Michigan, about 10 miles south of Charlevoix. The community is home to about 200 people and is known for its picturesque views of the lake and its surrounding countryside. The economy of Oden is largely based on tourism and recreation, and the population is mostly white, with a small percentage of African Americans and Native Americans. The area is known for its beautiful scenery and its abundance of outdoor activities, making it a popular destination for tourists and locals alike.
Common Questions
What is Per Capita Income in Oden?
Per Capita income in Oden is $18,790.
What is the Median Household income in Oden?
Median Household Income in Oden is $58,017.
What is Inequality or Gini Index in Oden?
Inequality or Gini Index in Oden is 0.17.
What is the Total Population of Oden?
Total Population of Oden is 315.
What is the Total Male Population of Oden?
Total Male Population of Oden is 177.
What is the Total Female Population of Oden?
Total Female Population of Oden is 138.
What is the Ratio of Males per 100 Females in Oden?
There are 128.26 Males per 100 Females in Oden.
What is the Ratio of Females per 100 Males in Oden?
There are 77.97 Females per 100 Males in Oden.
What is the Median Population Age in Oden?
Median Population Age in Oden is 23.0 Years.
What is the Average Family Size in Oden
Average Family Size in Oden is 2.4 People.
What is the Average Household Size in Oden
Average Household Size in Oden is 2.3 People.
How Large is the Labor Force in Oden?
There are 175 People in the Labor Forcein in Oden.
What is the Percentage of People in the Labor Force in Oden?
82.9% of People are in the Labor Force in Oden.