Northport, MI Map & Demographics
Northport Map
Northport Overview
$64,150
PER CAPITA INCOME
$82,917
AVG FAMILY INCOME
$68,393
AVG HOUSEHOLD INCOME
19.7%
WAGE / INCOME GAP [ % ]
80.3¢/ $1
WAGE / INCOME GAP [ $ ]
0.56
INEQUALITY / GINI INDEX
427
TOTAL POPULATION
185
MALE POPULATION
242
FEMALE POPULATION
76.45
MALES / 100 FEMALES
130.81
FEMALES / 100 MALES
65.6
MEDIAN AGE
2.9
AVG FAMILY SIZE
2.0
AVG HOUSEHOLD SIZE
157
LABOR FORCE [ PEOPLE ]
41.9%
PERCENT IN LABOR FORCE
2.5%
UNEMPLOYMENT RATE
Northport Zip Codes
Northport Area Codes
Income in Northport
Income Overview in Northport
Per Capita Income in Northport is $64,150, while median incomes of families and households are $82,917 and $68,393 respectively.
| Characteristic | Number | Measure |
| Per Capita Income | 427 | $64,150 |
| Median Family Income | 106 | $82,917 |
| Mean Family Income | 106 | $174,429 |
| Median Household Income | 209 | $68,393 |
| Mean Household Income | 209 | $129,635 |
| Income Deficit | 106 | $0 |
| Wage / Income Gap (%) | 427 | 19.74% |
| Wage / Income Gap ($) | 427 | 80.26¢ per $1 |
| Gini / Inequality Index | 427 | 0.56 |
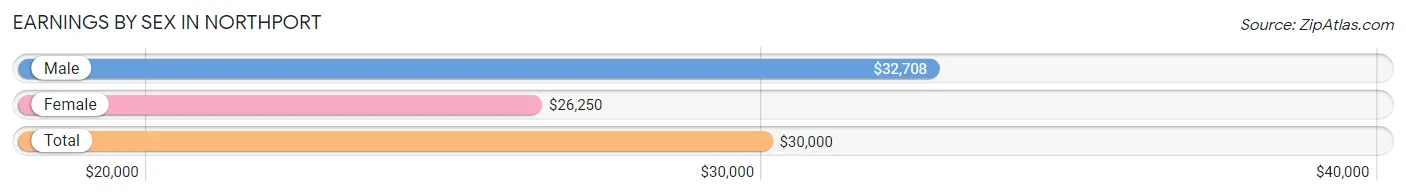
Earnings by Sex in Northport
Average Earnings in Northport are $30,000, $32,708 for men and $26,250 for women, a difference of 19.7%.
| Sex | Number | Average Earnings |
| Male | 81 (47.6%) | $32,708 |
| Female | 89 (52.3%) | $26,250 |
| Total | 170 (100.0%) | $30,000 |
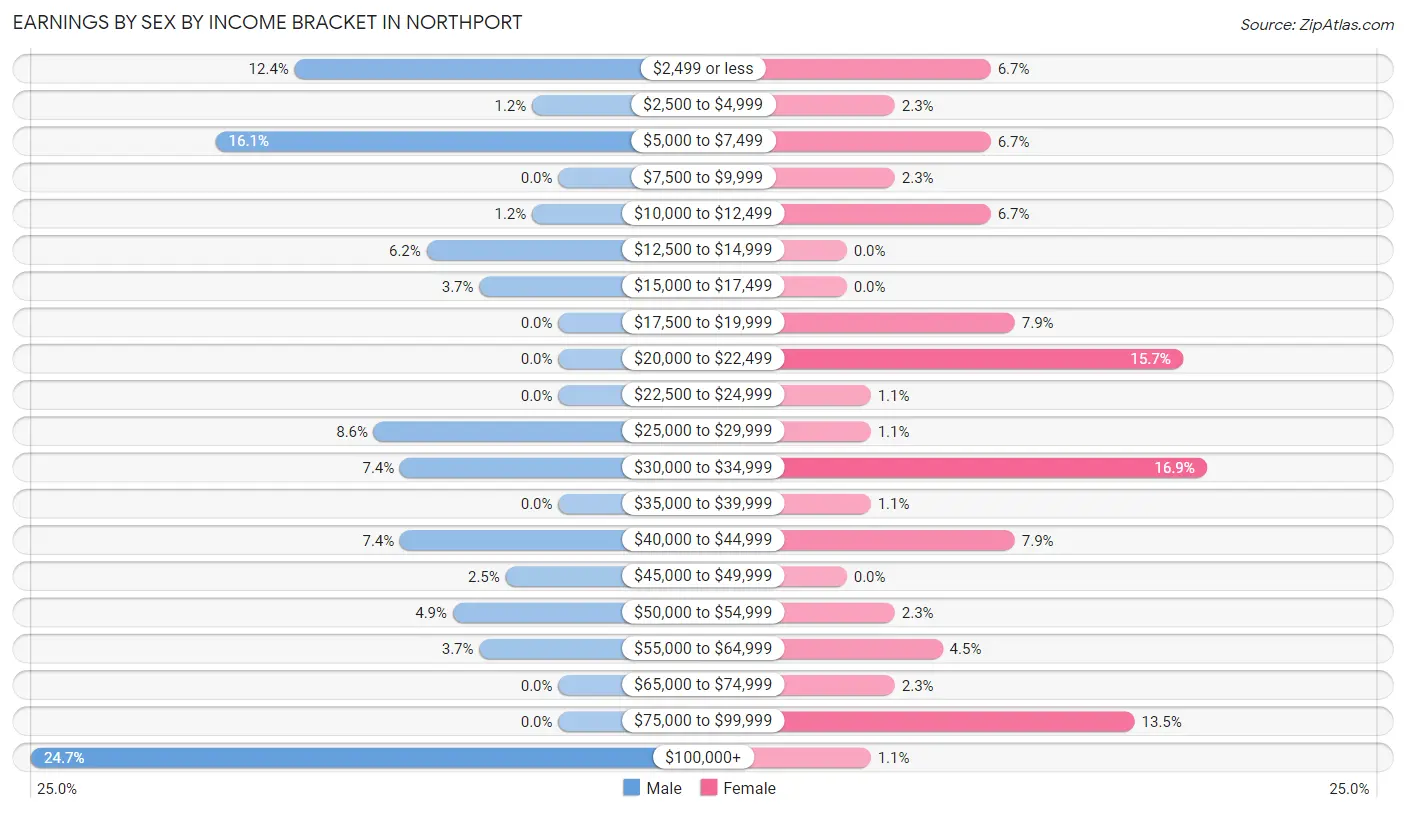
Earnings by Sex by Income Bracket in Northport
The most common earnings brackets in Northport are $100,000+ for men (20 | 24.7%) and $30,000 to $34,999 for women (15 | 16.9%).
| Income | Male | Female |
| $2,499 or less | 10 (12.3%) | 6 (6.7%) |
| $2,500 to $4,999 | 1 (1.2%) | 2 (2.2%) |
| $5,000 to $7,499 | 13 (16.1%) | 6 (6.7%) |
| $7,500 to $9,999 | 0 (0.0%) | 2 (2.2%) |
| $10,000 to $12,499 | 1 (1.2%) | 6 (6.7%) |
| $12,500 to $14,999 | 5 (6.2%) | 0 (0.0%) |
| $15,000 to $17,499 | 3 (3.7%) | 0 (0.0%) |
| $17,500 to $19,999 | 0 (0.0%) | 7 (7.9%) |
| $20,000 to $22,499 | 0 (0.0%) | 14 (15.7%) |
| $22,500 to $24,999 | 0 (0.0%) | 1 (1.1%) |
| $25,000 to $29,999 | 7 (8.6%) | 1 (1.1%) |
| $30,000 to $34,999 | 6 (7.4%) | 15 (16.9%) |
| $35,000 to $39,999 | 0 (0.0%) | 1 (1.1%) |
| $40,000 to $44,999 | 6 (7.4%) | 7 (7.9%) |
| $45,000 to $49,999 | 2 (2.5%) | 0 (0.0%) |
| $50,000 to $54,999 | 4 (4.9%) | 2 (2.2%) |
| $55,000 to $64,999 | 3 (3.7%) | 4 (4.5%) |
| $65,000 to $74,999 | 0 (0.0%) | 2 (2.2%) |
| $75,000 to $99,999 | 0 (0.0%) | 12 (13.5%) |
| $100,000+ | 20 (24.7%) | 1 (1.1%) |
| Total | 81 (100.0%) | 89 (100.0%) |
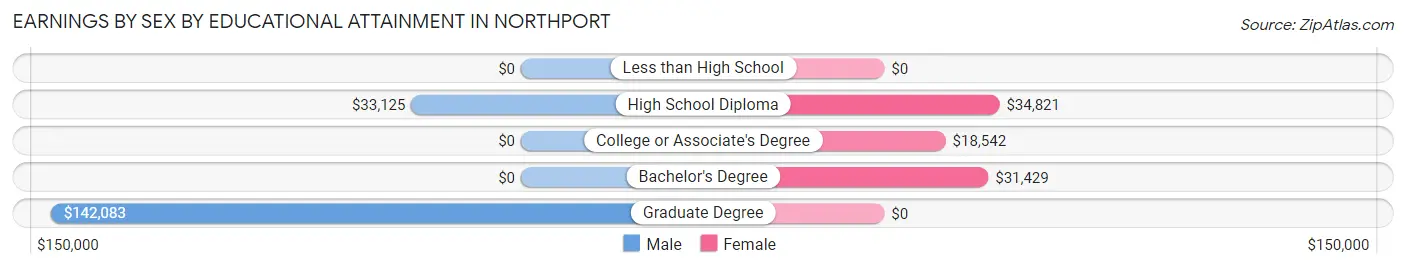
Earnings by Sex by Educational Attainment in Northport
Average earnings in Northport are $34,375 for men and $31,786 for women, a difference of 7.5%. Men with an educational attainment of graduate degree enjoy the highest average annual earnings of $142,083, while those with high school diploma education earn the least with $33,125. Women with an educational attainment of high school diploma earn the most with the average annual earnings of $34,821, while those with college or associate's degree education have the smallest earnings of $18,542.
| Educational Attainment | Male Income | Female Income |
| Less than High School | - | - |
| High School Diploma | $33,125 | $34,821 |
| College or Associate's Degree | - | - |
| Bachelor's Degree | - | - |
| Graduate Degree | $142,083 | $0 |
| Total | $34,375 | $31,786 |
Family Income in Northport
Family Income Brackets in Northport
According to the Northport family income data, there are 19 families falling into the $75,000 to $99,999 income range, which is the most common income bracket and makes up 17.9% of all families.
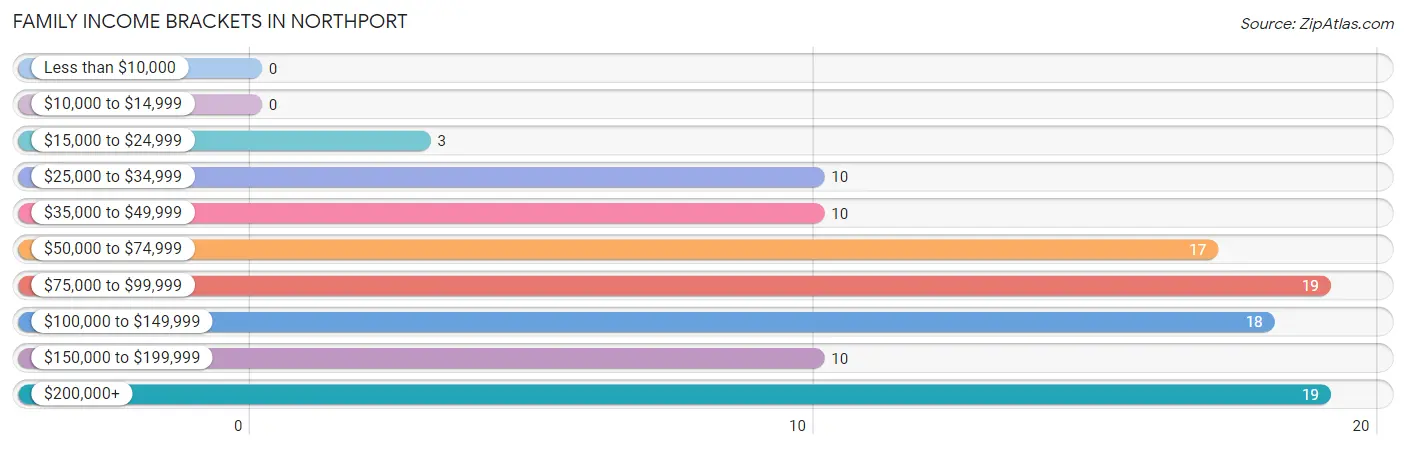
| Income Bracket | # Families | % Families |
| Less than $10,000 | 0 | 0.0% |
| $10,000 to $14,999 | 0 | 0.0% |
| $15,000 to $24,999 | 3 | 2.8% |
| $25,000 to $34,999 | 10 | 9.4% |
| $35,000 to $49,999 | 10 | 9.4% |
| $50,000 to $74,999 | 17 | 16.0% |
| $75,000 to $99,999 | 19 | 17.9% |
| $100,000 to $149,999 | 18 | 17.0% |
| $150,000 to $199,999 | 10 | 9.4% |
| $200,000+ | 19 | 17.9% |
Family Income by Famaliy Size in Northport
2-person families (67 | 63.2%) account for the highest median family income in Northport with $123,542 per family, while 2-person families (67 | 63.2%) have the highest median income of $61,771 per family member.
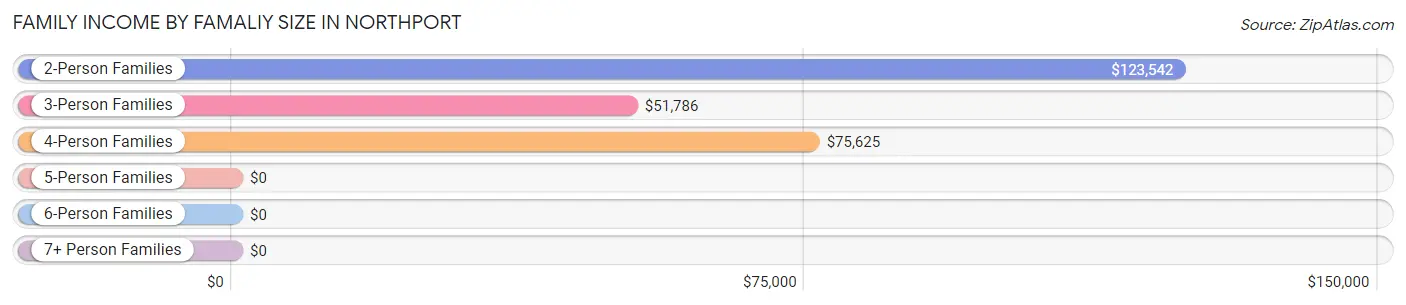
| Income Bracket | # Families | Median Income |
| 2-Person Families | 67 (63.2%) | $123,542 |
| 3-Person Families | 10 (9.4%) | $51,786 |
| 4-Person Families | 22 (20.7%) | $75,625 |
| 5-Person Families | 4 (3.8%) | $0 |
| 6-Person Families | 3 (2.8%) | $0 |
| 7+ Person Families | 0 (0.0%) | $0 |
| Total | 106 (100.0%) | $82,917 |
Family Income by Number of Earners in Northport
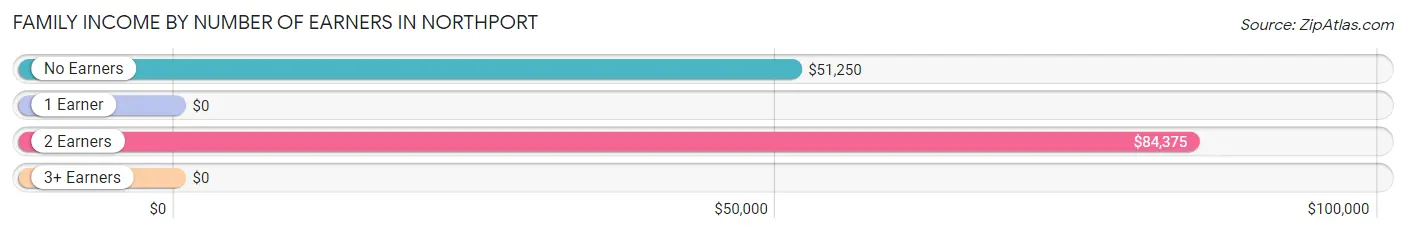
| Number of Earners | # Families | Median Income |
| No Earners | 35 (33.0%) | $51,250 |
| 1 Earner | 22 (20.7%) | $0 |
| 2 Earners | 47 (44.3%) | $84,375 |
| 3+ Earners | 2 (1.9%) | $0 |
| Total | 106 (100.0%) | $82,917 |
Household Income in Northport
Household Income Brackets in Northport
With 42 households falling in the category, the $50,000 to $74,999 income range is the most frequent in Northport, accounting for 20.1% of all households.
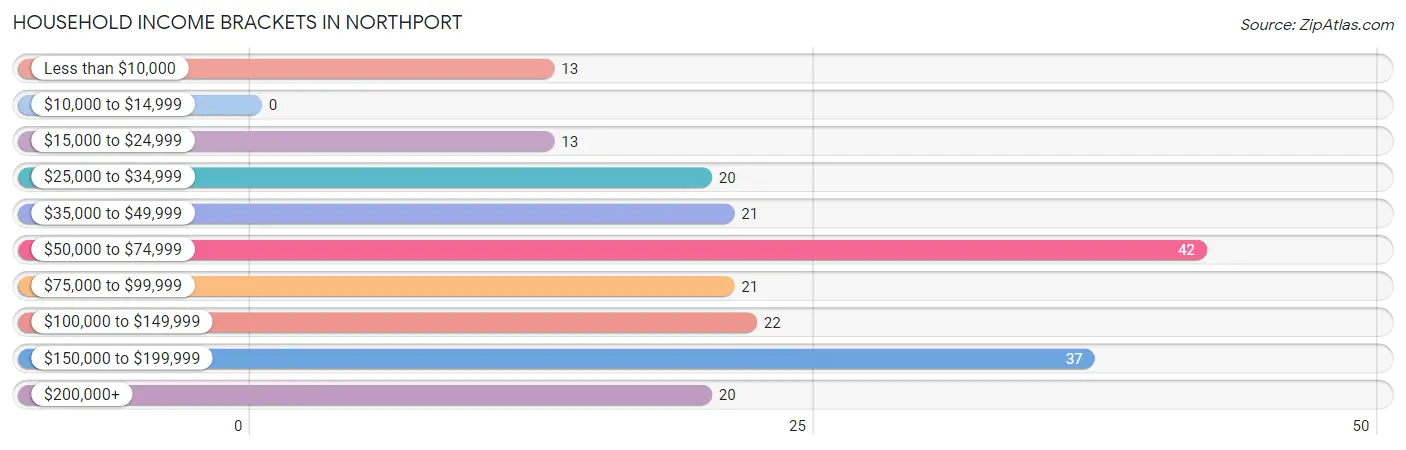
| Income Bracket | # Households | % Households |
| Less than $10,000 | 13 | 6.2% |
| $10,000 to $14,999 | 0 | 0.0% |
| $15,000 to $24,999 | 13 | 6.2% |
| $25,000 to $34,999 | 20 | 9.6% |
| $35,000 to $49,999 | 21 | 10.0% |
| $50,000 to $74,999 | 42 | 20.1% |
| $75,000 to $99,999 | 21 | 10.0% |
| $100,000 to $149,999 | 22 | 10.5% |
| $150,000 to $199,999 | 37 | 17.7% |
| $200,000+ | 20 | 9.6% |
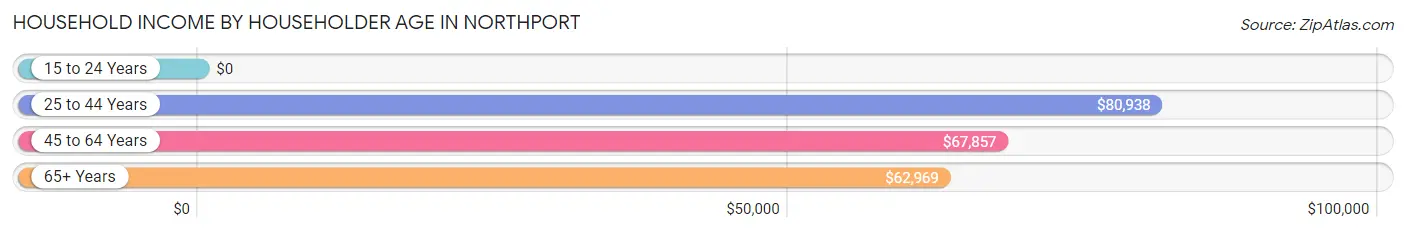
Household Income by Householder Age in Northport
The median household income in Northport is $68,393, with the highest median household income of $80,938 found in the 25 to 44 years age bracket for the primary householder. A total of 28 households (13.4%) fall into this category. Meanwhile, the 15 to 24 years age bracket for the primary householder has the lowest median household income of $0, with 4 households (1.9%) in this group.
| Income Bracket | # Households | Median Income |
| 15 to 24 Years | 4 (1.9%) | $0 |
| 25 to 44 Years | 28 (13.4%) | $80,938 |
| 45 to 64 Years | 32 (15.3%) | $67,857 |
| 65+ Years | 145 (69.4%) | $62,969 |
| Total | 209 (100.0%) | $68,393 |
Poverty in Northport
Income Below Poverty by Sex and Age in Northport
With 11.4% poverty level for males and 12.0% for females among the residents of Northport, 18 to 24 year old males and 16 and 17 year old females are the most vulnerable to poverty, with 5 males (62.5%) and 4 females (100.0%) in their respective age groups living below the poverty level.
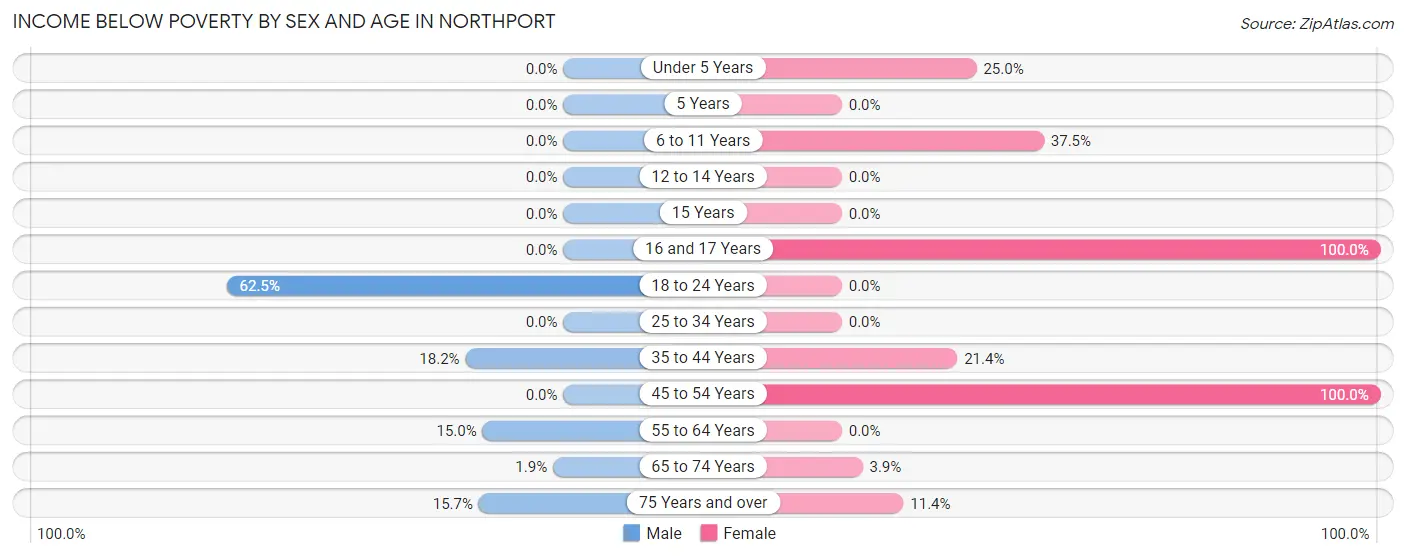
| Age Bracket | Male | Female |
| Under 5 Years | 0 (0.0%) | 4 (25.0%) |
| 5 Years | 0 (0.0%) | 0 (0.0%) |
| 6 to 11 Years | 0 (0.0%) | 6 (37.5%) |
| 12 to 14 Years | 0 (0.0%) | 0 (0.0%) |
| 15 Years | 0 (0.0%) | 0 (0.0%) |
| 16 and 17 Years | 0 (0.0%) | 4 (100.0%) |
| 18 to 24 Years | 5 (62.5%) | 0 (0.0%) |
| 25 to 34 Years | 0 (0.0%) | 0 (0.0%) |
| 35 to 44 Years | 4 (18.2%) | 3 (21.4%) |
| 45 to 54 Years | 0 (0.0%) | 4 (100.0%) |
| 55 to 64 Years | 3 (15.0%) | 0 (0.0%) |
| 65 to 74 Years | 1 (1.9%) | 3 (3.8%) |
| 75 Years and over | 8 (15.7%) | 4 (11.4%) |
| Total | 21 (11.4%) | 28 (12.0%) |
Income Above Poverty by Sex and Age in Northport
According to the poverty statistics in Northport, males aged under 5 years and females aged 5 years are the age groups that are most secure financially, with 100.0% of males and 100.0% of females in these age groups living above the poverty line.
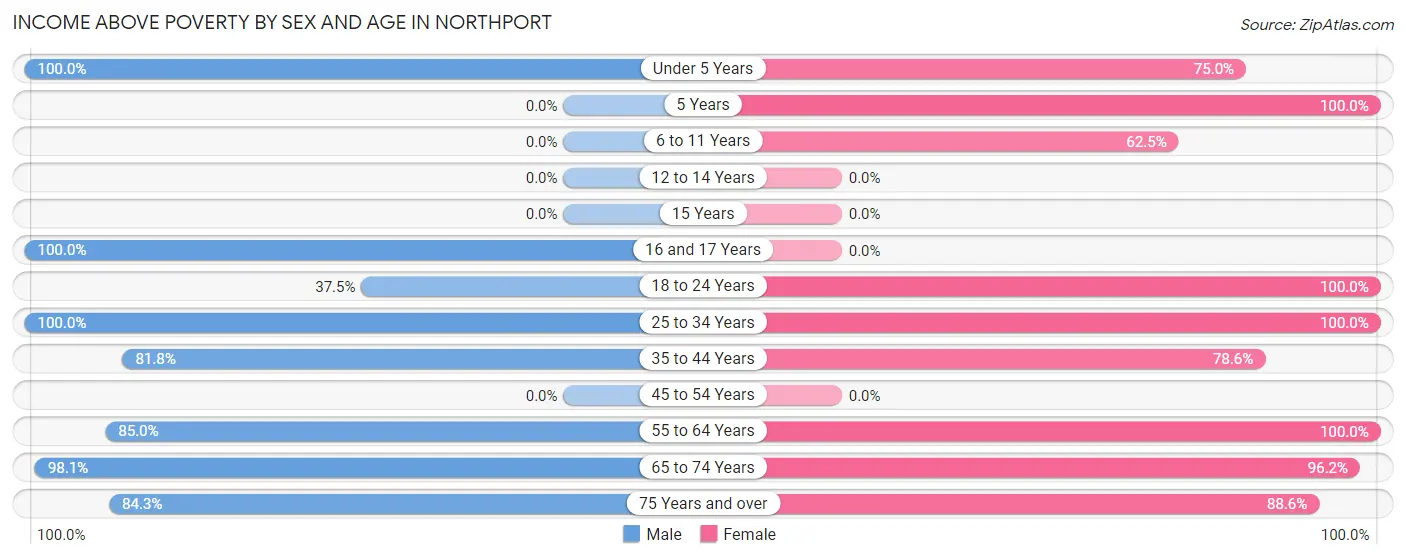
| Age Bracket | Male | Female |
| Under 5 Years | 16 (100.0%) | 12 (75.0%) |
| 5 Years | 0 (0.0%) | 4 (100.0%) |
| 6 to 11 Years | 0 (0.0%) | 10 (62.5%) |
| 12 to 14 Years | 0 (0.0%) | 0 (0.0%) |
| 15 Years | 0 (0.0%) | 0 (0.0%) |
| 16 and 17 Years | 2 (100.0%) | 0 (0.0%) |
| 18 to 24 Years | 3 (37.5%) | 19 (100.0%) |
| 25 to 34 Years | 14 (100.0%) | 8 (100.0%) |
| 35 to 44 Years | 18 (81.8%) | 11 (78.6%) |
| 45 to 54 Years | 0 (0.0%) | 0 (0.0%) |
| 55 to 64 Years | 17 (85.0%) | 36 (100.0%) |
| 65 to 74 Years | 51 (98.1%) | 75 (96.2%) |
| 75 Years and over | 43 (84.3%) | 31 (88.6%) |
| Total | 164 (88.6%) | 206 (88.0%) |
Income Below Poverty Among Married-Couple Families in Northport
The poverty statistics for married-couple families in Northport show that 3.2% or 3 of the total 94 families live below the poverty line. Families with 1 or 2 children have the highest poverty rate of 13.6%, comprising of 3 families. On the other hand, families with no children have the lowest poverty rate of 0.0%, which includes 0 families.
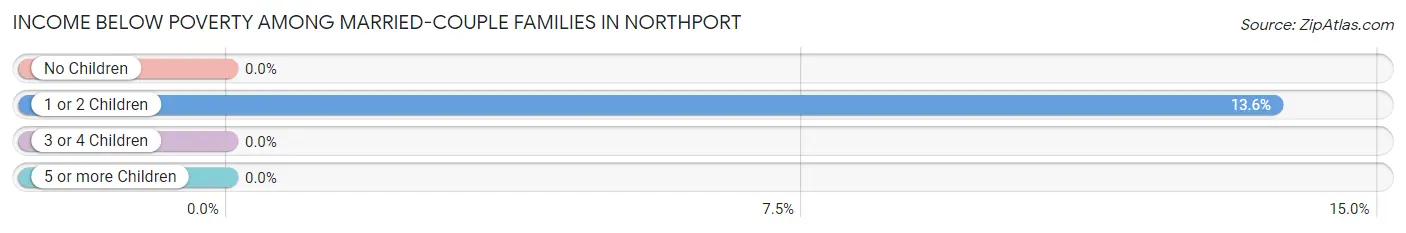
| Children | Above Poverty | Below Poverty |
| No Children | 68 (100.0%) | 0 (0.0%) |
| 1 or 2 Children | 19 (86.4%) | 3 (13.6%) |
| 3 or 4 Children | 4 (100.0%) | 0 (0.0%) |
| 5 or more Children | 0 (0.0%) | 0 (0.0%) |
| Total | 91 (96.8%) | 3 (3.2%) |
Income Below Poverty Among Single-Parent Households in Northport
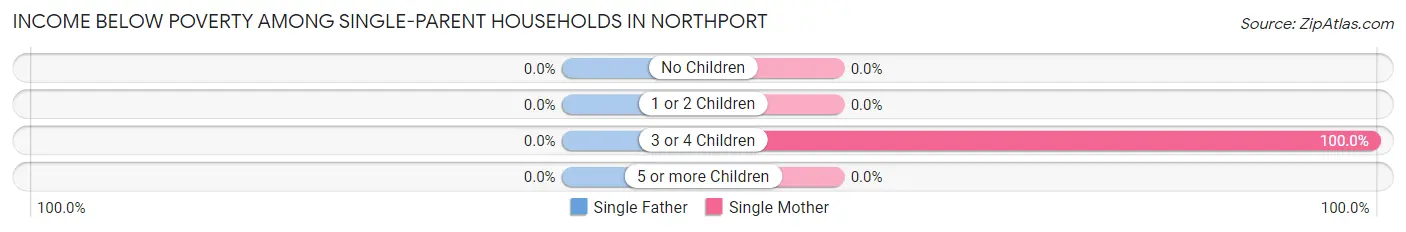
| Children | Single Father | Single Mother |
| No Children | 0 (0.0%) | 0 (0.0%) |
| 1 or 2 Children | 0 (0.0%) | 0 (0.0%) |
| 3 or 4 Children | 0 (0.0%) | 3 (100.0%) |
| 5 or more Children | 0 (0.0%) | 0 (0.0%) |
| Total | 0 (0.0%) | 3 (25.0%) |
Income Below Poverty Among Married-Couple vs Single-Parent Households in Northport
The poverty data for Northport shows that 3 of the married-couple family households (3.2%) and 3 of the single-parent households (25.0%) are living below the poverty level. Within the married-couple family households, those with 1 or 2 children have the highest poverty rate, with 3 households (13.6%) falling below the poverty line. Among the single-parent households, those with 3 or 4 children have the highest poverty rate, with 3 household (100.0%) living below poverty.
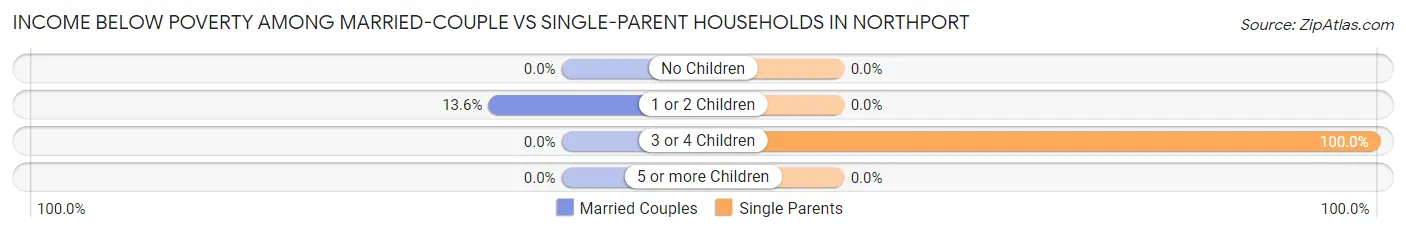
| Children | Married-Couple Families | Single-Parent Households |
| No Children | 0 (0.0%) | 0 (0.0%) |
| 1 or 2 Children | 3 (13.6%) | 0 (0.0%) |
| 3 or 4 Children | 0 (0.0%) | 3 (100.0%) |
| 5 or more Children | 0 (0.0%) | 0 (0.0%) |
| Total | 3 (3.2%) | 3 (25.0%) |
Race in Northport
The most populous races in Northport are White / Caucasian (426 | 99.8%), Hispanic or Latino (18 | 4.2%), and Two or more Races (1 | 0.2%).
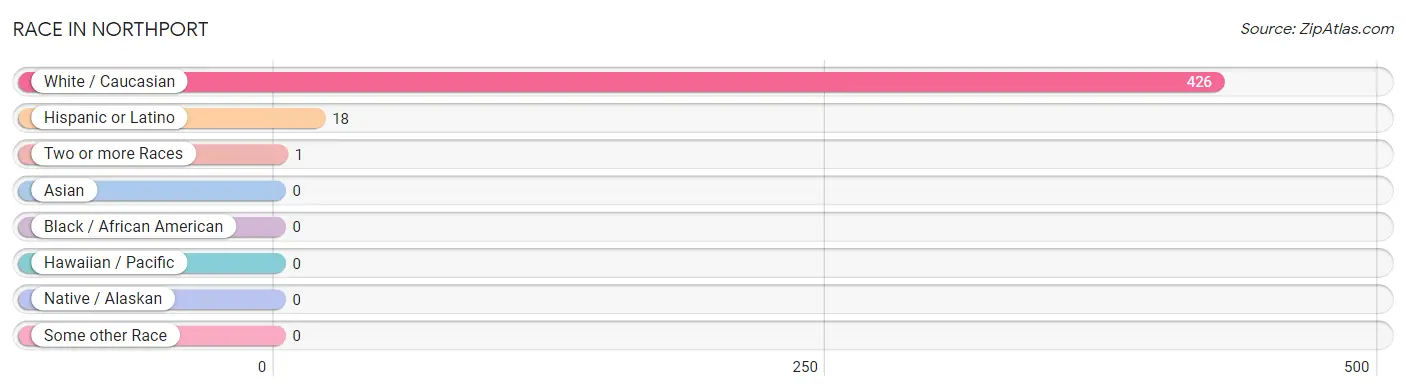
| Race | # Population | % Population |
| Asian | 0 | 0.0% |
| Black / African American | 0 | 0.0% |
| Hawaiian / Pacific | 0 | 0.0% |
| Hispanic or Latino | 18 | 4.2% |
| Native / Alaskan | 0 | 0.0% |
| White / Caucasian | 426 | 99.8% |
| Two or more Races | 1 | 0.2% |
| Some other Race | 0 | 0.0% |
| Total | 427 | 100.0% |
Ancestry in Northport
The most populous ancestries reported in Northport are German (84 | 19.7%), English (83 | 19.4%), Irish (76 | 17.8%), Polish (61 | 14.3%), and Norwegian (40 | 9.4%), together accounting for 80.6% of all Northport residents.
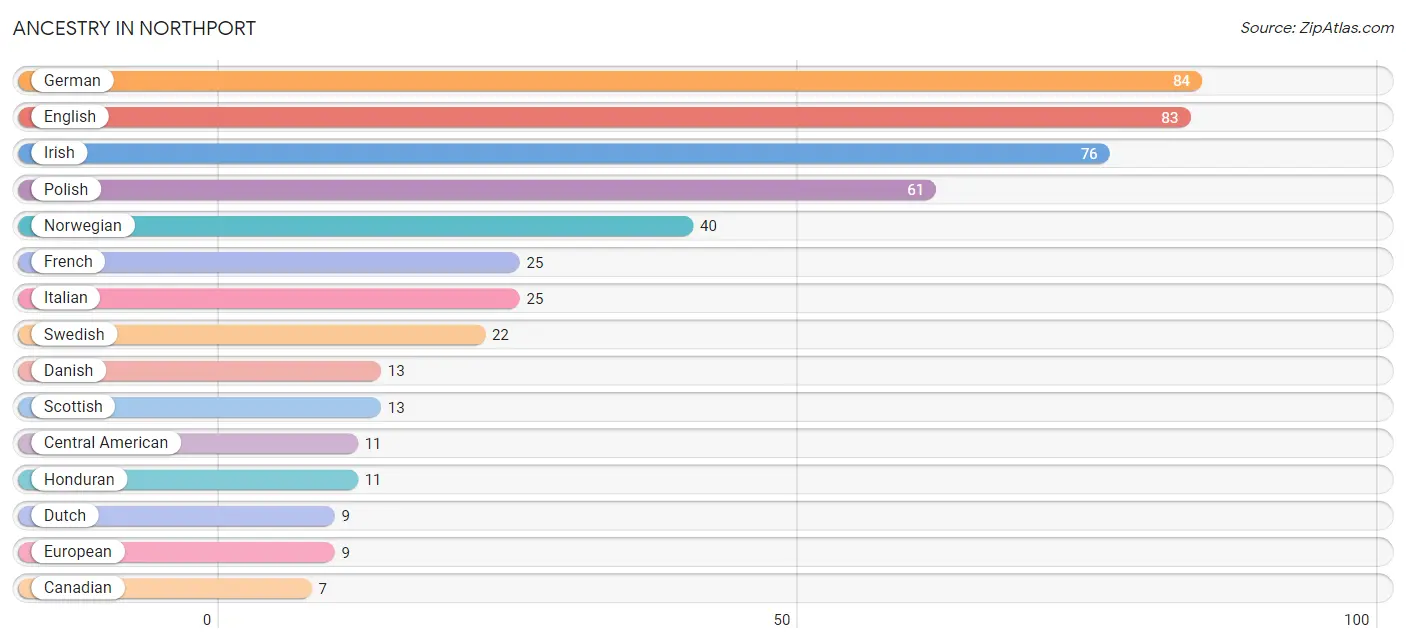
| Ancestry | # Population | % Population |
| American | 1 | 0.2% |
| Arab | 1 | 0.2% |
| British | 2 | 0.5% |
| Canadian | 7 | 1.6% |
| Central American | 11 | 2.6% |
| Croatian | 1 | 0.2% |
| Czech | 5 | 1.2% |
| Czechoslovakian | 3 | 0.7% |
| Danish | 13 | 3.0% |
| Dutch | 9 | 2.1% |
| Eastern European | 3 | 0.7% |
| English | 83 | 19.4% |
| European | 9 | 2.1% |
| French | 25 | 5.9% |
| French American Indian | 1 | 0.2% |
| French Canadian | 2 | 0.5% |
| German | 84 | 19.7% |
| Honduran | 11 | 2.6% |
| Irish | 76 | 17.8% |
| Italian | 25 | 5.9% |
| Lebanese | 1 | 0.2% |
| Lithuanian | 2 | 0.5% |
| Mexican | 1 | 0.2% |
| Norwegian | 40 | 9.4% |
| Polish | 61 | 14.3% |
| Portuguese | 1 | 0.2% |
| Russian | 1 | 0.2% |
| Scotch-Irish | 3 | 0.7% |
| Scottish | 13 | 3.0% |
| Swedish | 22 | 5.1% |
| Swiss | 5 | 1.2% |
| Welsh | 2 | 0.5% | View All 32 Rows |
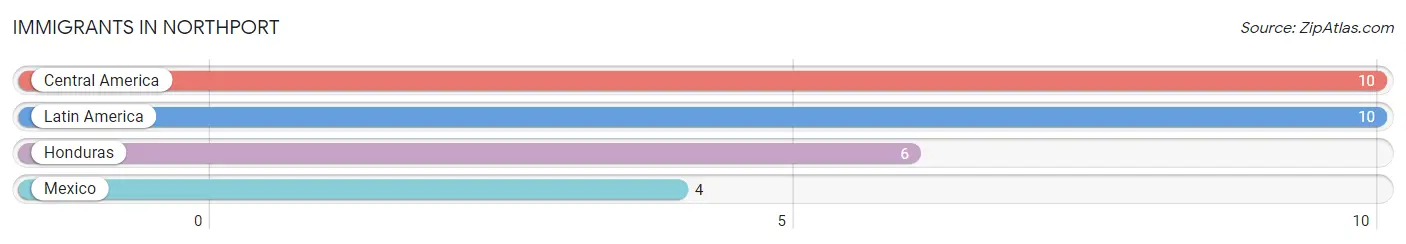
Immigrants in Northport
The most numerous immigrant groups reported in Northport came from Central America (10 | 2.3%), Latin America (10 | 2.3%), Honduras (6 | 1.4%), and Mexico (4 | 0.9%), together accounting for 7.0% of all Northport residents.
| Immigration Origin | # Population | % Population |
| Central America | 10 | 2.3% |
| Honduras | 6 | 1.4% |
| Latin America | 10 | 2.3% |
| Mexico | 4 | 0.9% | View All 4 Rows |
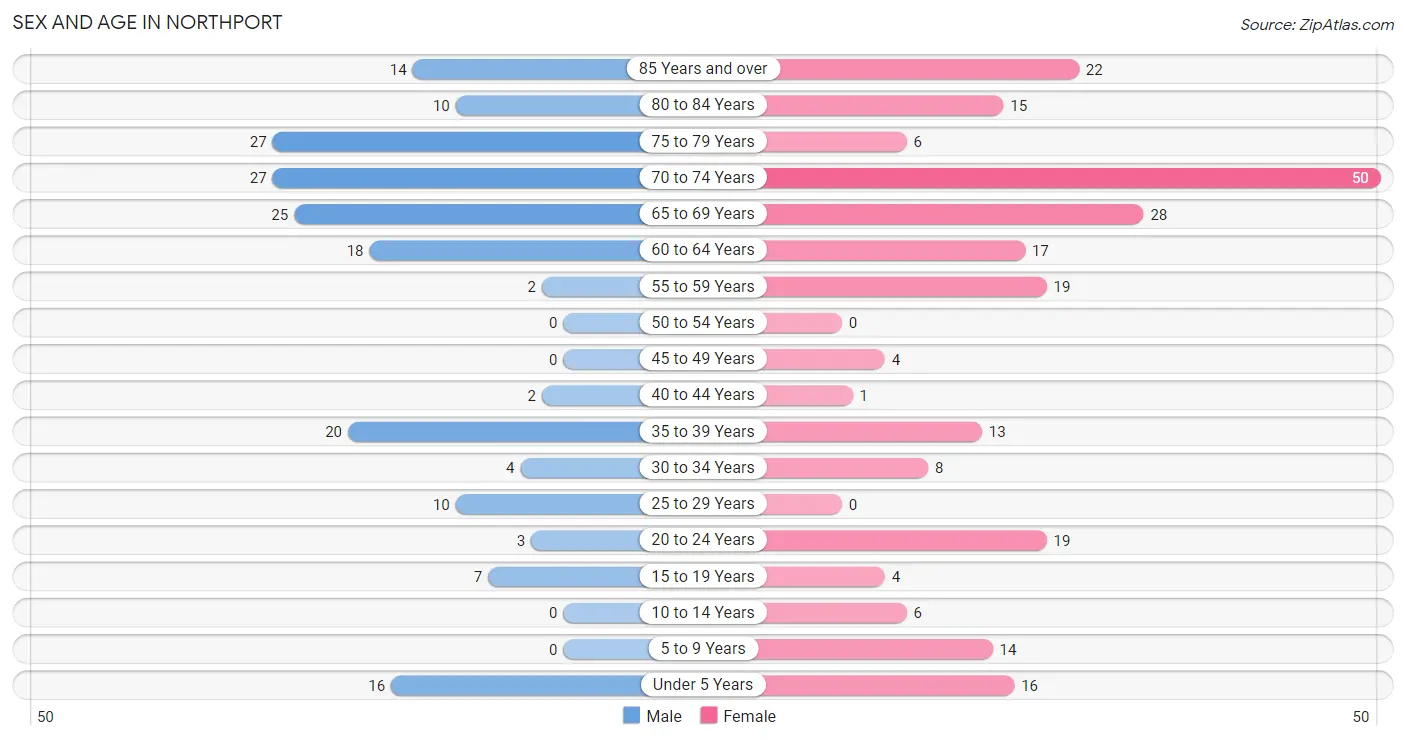
Sex and Age in Northport
Sex and Age in Northport
The most populous age groups in Northport are 70 to 74 Years (27 | 14.6%) for men and 70 to 74 Years (50 | 20.7%) for women.
| Age Bracket | Male | Female |
| Under 5 Years | 16 (8.6%) | 16 (6.6%) |
| 5 to 9 Years | 0 (0.0%) | 14 (5.8%) |
| 10 to 14 Years | 0 (0.0%) | 6 (2.5%) |
| 15 to 19 Years | 7 (3.8%) | 4 (1.7%) |
| 20 to 24 Years | 3 (1.6%) | 19 (7.9%) |
| 25 to 29 Years | 10 (5.4%) | 0 (0.0%) |
| 30 to 34 Years | 4 (2.2%) | 8 (3.3%) |
| 35 to 39 Years | 20 (10.8%) | 13 (5.4%) |
| 40 to 44 Years | 2 (1.1%) | 1 (0.4%) |
| 45 to 49 Years | 0 (0.0%) | 4 (1.7%) |
| 50 to 54 Years | 0 (0.0%) | 0 (0.0%) |
| 55 to 59 Years | 2 (1.1%) | 19 (7.9%) |
| 60 to 64 Years | 18 (9.7%) | 17 (7.0%) |
| 65 to 69 Years | 25 (13.5%) | 28 (11.6%) |
| 70 to 74 Years | 27 (14.6%) | 50 (20.7%) |
| 75 to 79 Years | 27 (14.6%) | 6 (2.5%) |
| 80 to 84 Years | 10 (5.4%) | 15 (6.2%) |
| 85 Years and over | 14 (7.6%) | 22 (9.1%) |
| Total | 185 (100.0%) | 242 (100.0%) |
Families and Households in Northport
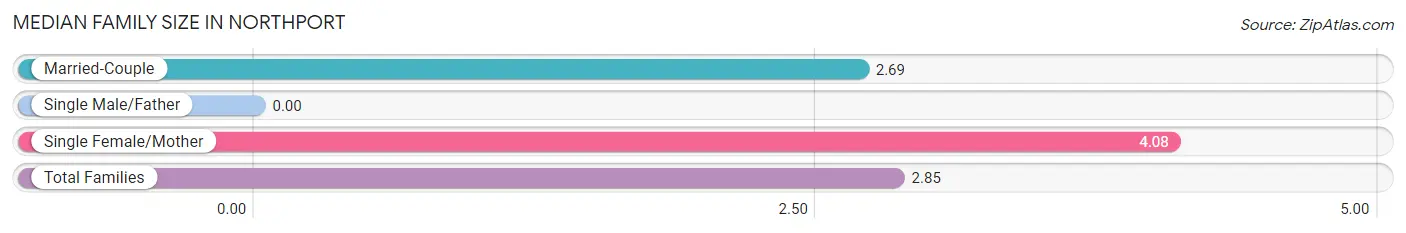
Median Family Size in Northport
| Family Type | # Families | Family Size |
| Married-Couple | 94 (88.7%) | 2.69 |
| Single Male/Father | 0 (0.0%) | - |
| Single Female/Mother | 12 (11.3%) | 4.08 |
| Total Families | 106 (100.0%) | 2.85 |
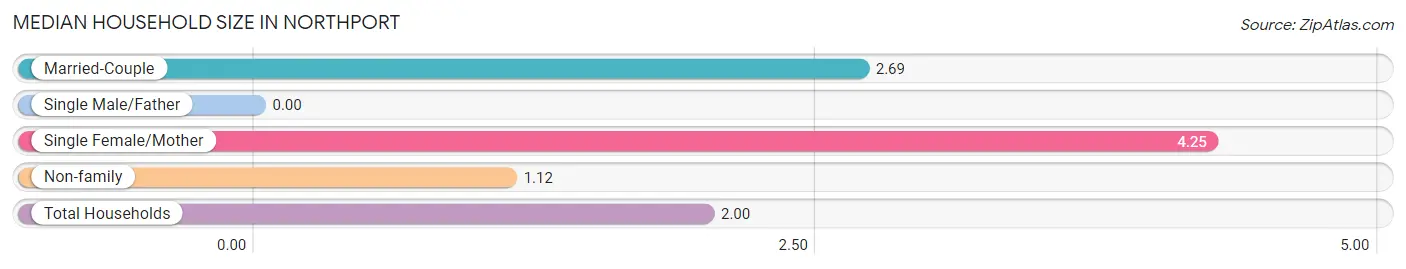
Median Household Size in Northport
| Household Type | # Households | Household Size |
| Married-Couple | 94 (45.0%) | 2.69 |
| Single Male/Father | 0 (0.0%) | - |
| Single Female/Mother | 12 (5.7%) | 4.25 |
| Non-family | 103 (49.3%) | 1.12 |
| Total Households | 209 (100.0%) | 2.00 |
Household Size by Marriage Status in Northport
Out of a total of 209 households in Northport, 106 (50.7%) are family households, while 103 (49.3%) are nonfamily households. The most numerous type of family households are 2-person households, comprising 66, and the most common type of nonfamily households are 1-person households, comprising 90.
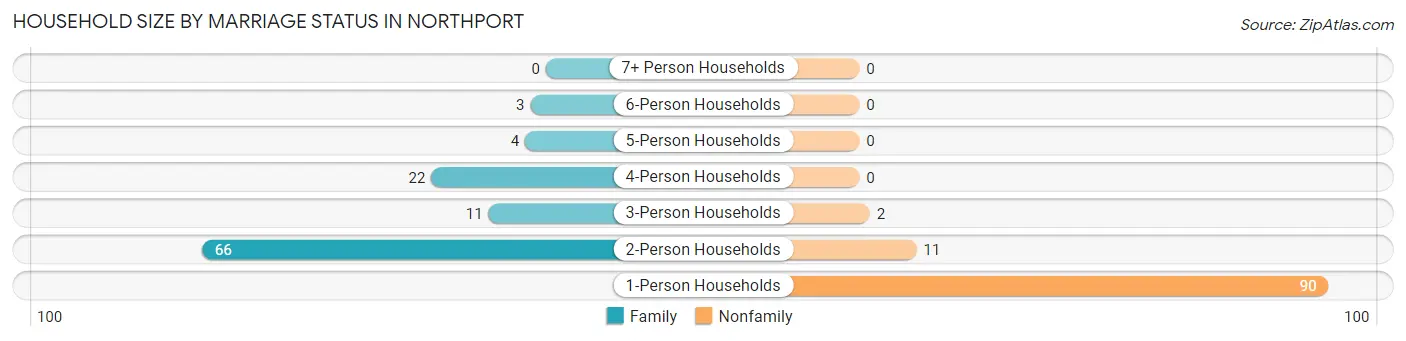
| Household Size | Family Households | Nonfamily Households |
| 1-Person Households | - | 90 (43.1%) |
| 2-Person Households | 66 (31.6%) | 11 (5.3%) |
| 3-Person Households | 11 (5.3%) | 2 (1.0%) |
| 4-Person Households | 22 (10.5%) | 0 (0.0%) |
| 5-Person Households | 4 (1.9%) | 0 (0.0%) |
| 6-Person Households | 3 (1.4%) | 0 (0.0%) |
| 7+ Person Households | 0 (0.0%) | 0 (0.0%) |
| Total | 106 (50.7%) | 103 (49.3%) |
Female Fertility in Northport
Fertility by Age in Northport
Average fertility rate in Northport is 82.0 births per 1,000 women. Women in the age bracket of 35 to 50 years have the highest fertility rate with 222.0 births per 1,000 women. Women in the age bracket of 35 to 50 years acount for 100.0% of all women with births.
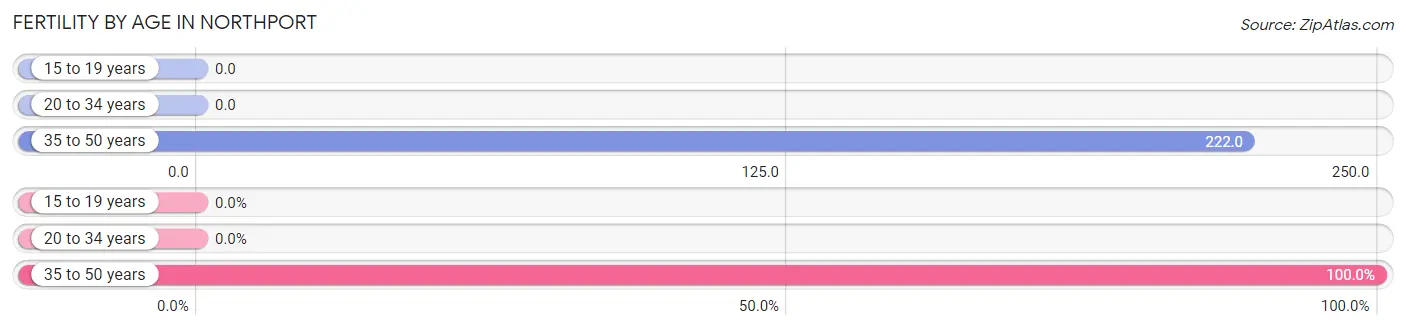
| Age Bracket | Women with Births | Births / 1,000 Women |
| 15 to 19 years | 0 (0.0%) | 0.0 |
| 20 to 34 years | 0 (0.0%) | 0.0 |
| 35 to 50 years | 4 (100.0%) | 222.0 |
| Total | 4 (100.0%) | 82.0 |
Fertility by Age by Marriage Status in Northport
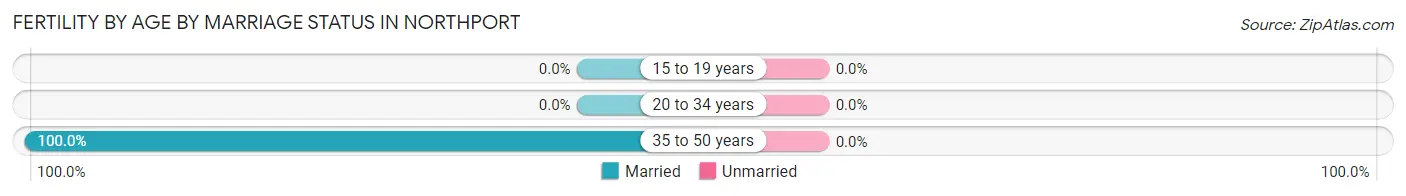
| Age Bracket | Married | Unmarried |
| 15 to 19 years | 0 (0.0%) | 0 (0.0%) |
| 20 to 34 years | 0 (0.0%) | 0 (0.0%) |
| 35 to 50 years | 4 (100.0%) | 0 (0.0%) |
| Total | 4 (100.0%) | 0 (0.0%) |
Fertility by Education in Northport
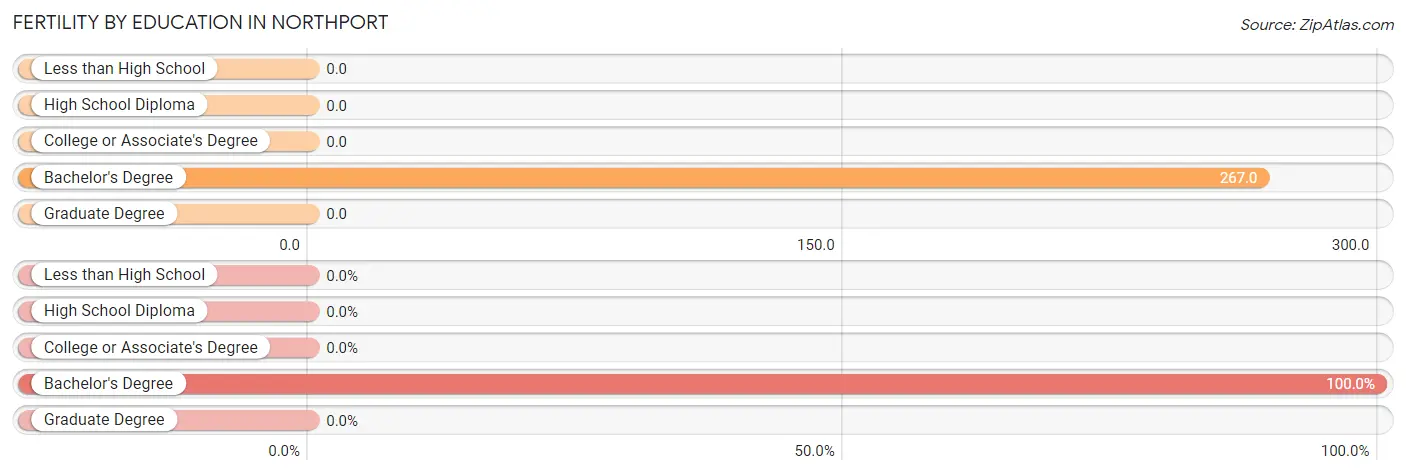
| Educational Attainment | Women with Births | Births / 1,000 Women |
| Less than High School | 0 (0.0%) | 0.0 |
| High School Diploma | 0 (0.0%) | 0.0 |
| College or Associate's Degree | 0 (0.0%) | 0.0 |
| Bachelor's Degree | 4 (100.0%) | 267.0 |
| Graduate Degree | 0 (0.0%) | 0.0 |
| Total | 4 (100.0%) | 82.0 |
Fertility by Education by Marriage Status in Northport
| Educational Attainment | Married | Unmarried |
| Less than High School | 0 (0.0%) | 0 (0.0%) |
| High School Diploma | 0 (0.0%) | 0 (0.0%) |
| College or Associate's Degree | 0 (0.0%) | 0 (0.0%) |
| Bachelor's Degree | 4 (100.0%) | 0 (0.0%) |
| Graduate Degree | 0 (0.0%) | 0 (0.0%) |
| Total | 4 (100.0%) | 0 (0.0%) |
Employment Characteristics in Northport
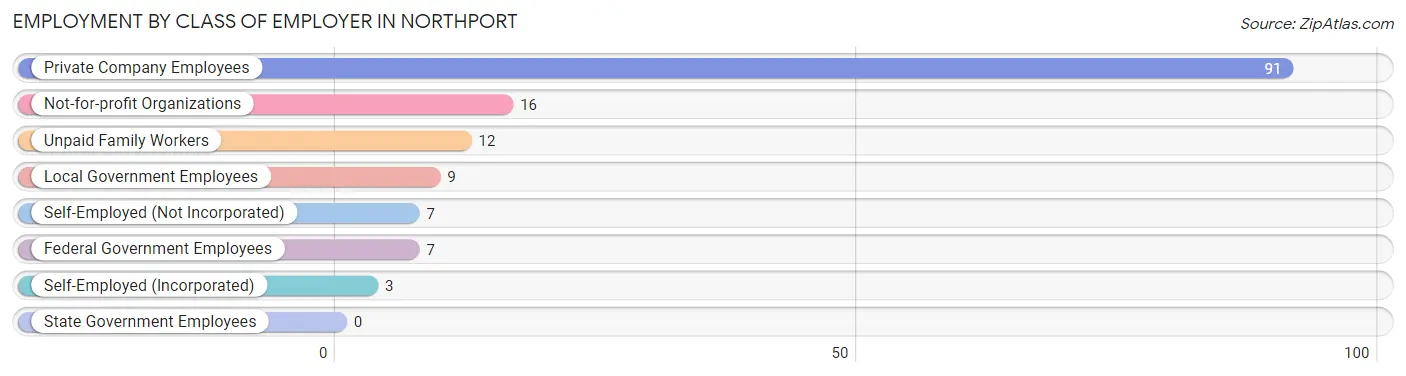
Employment by Class of Employer in Northport
Among the 145 employed individuals in Northport, private company employees (91 | 62.8%), not-for-profit organizations (16 | 11.0%), and unpaid family workers (12 | 8.3%) make up the most common classes of employment.
| Employer Class | # Employees | % Employees |
| Private Company Employees | 91 | 62.8% |
| Self-Employed (Incorporated) | 3 | 2.1% |
| Self-Employed (Not Incorporated) | 7 | 4.8% |
| Not-for-profit Organizations | 16 | 11.0% |
| Local Government Employees | 9 | 6.2% |
| State Government Employees | 0 | 0.0% |
| Federal Government Employees | 7 | 4.8% |
| Unpaid Family Workers | 12 | 8.3% |
| Total | 145 | 100.0% |
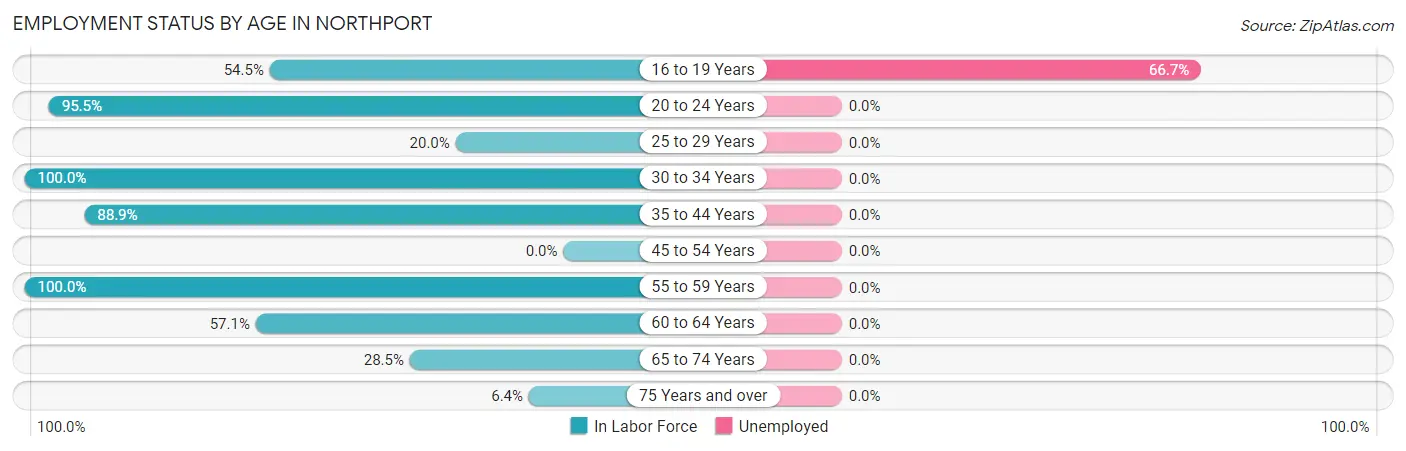
Employment Status by Age in Northport
According to the labor force statistics for Northport, out of the total population over 16 years of age (375), 41.9% or 157 individuals are in the labor force, with 2.5% or 4 of them unemployed. The age group with the highest labor force participation rate is 30 to 34 years, with 100.0% or 12 individuals in the labor force. Within the labor force, the 16 to 19 years age range has the highest percentage of unemployed individuals, with 66.7% or 4 of them being unemployed.
| Age Bracket | In Labor Force | Unemployed |
| 16 to 19 Years | 6 (54.5%) | 4 (66.7%) |
| 20 to 24 Years | 21 (95.5%) | 0 (0.0%) |
| 25 to 29 Years | 2 (20.0%) | 0 (0.0%) |
| 30 to 34 Years | 12 (100.0%) | 0 (0.0%) |
| 35 to 44 Years | 32 (88.9%) | 0 (0.0%) |
| 45 to 54 Years | 0 (0.0%) | 0 (0.0%) |
| 55 to 59 Years | 21 (100.0%) | 0 (0.0%) |
| 60 to 64 Years | 20 (57.1%) | 0 (0.0%) |
| 65 to 74 Years | 37 (28.5%) | 0 (0.0%) |
| 75 Years and over | 6 (6.4%) | 0 (0.0%) |
| Total | 157 (41.9%) | 4 (2.5%) |
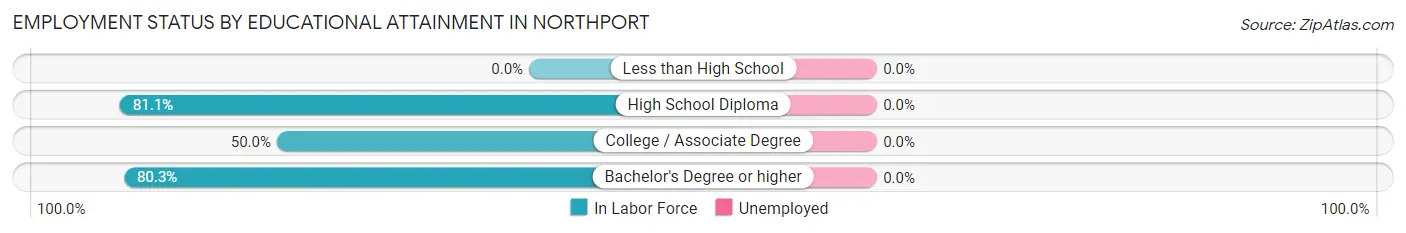
Employment Status by Educational Attainment in Northport
| Educational Attainment | In Labor Force | Unemployed |
| Less than High School | 0 (0.0%) | 0 (0.0%) |
| High School Diploma | 30 (81.1%) | 0 (0.0%) |
| College / Associate Degree | 8 (50.0%) | 0 (0.0%) |
| Bachelor's Degree or higher | 49 (80.3%) | 0 (0.0%) |
| Total | 87 (73.7%) | 0 (0.0%) |
Employment Occupations by Sex in Northport
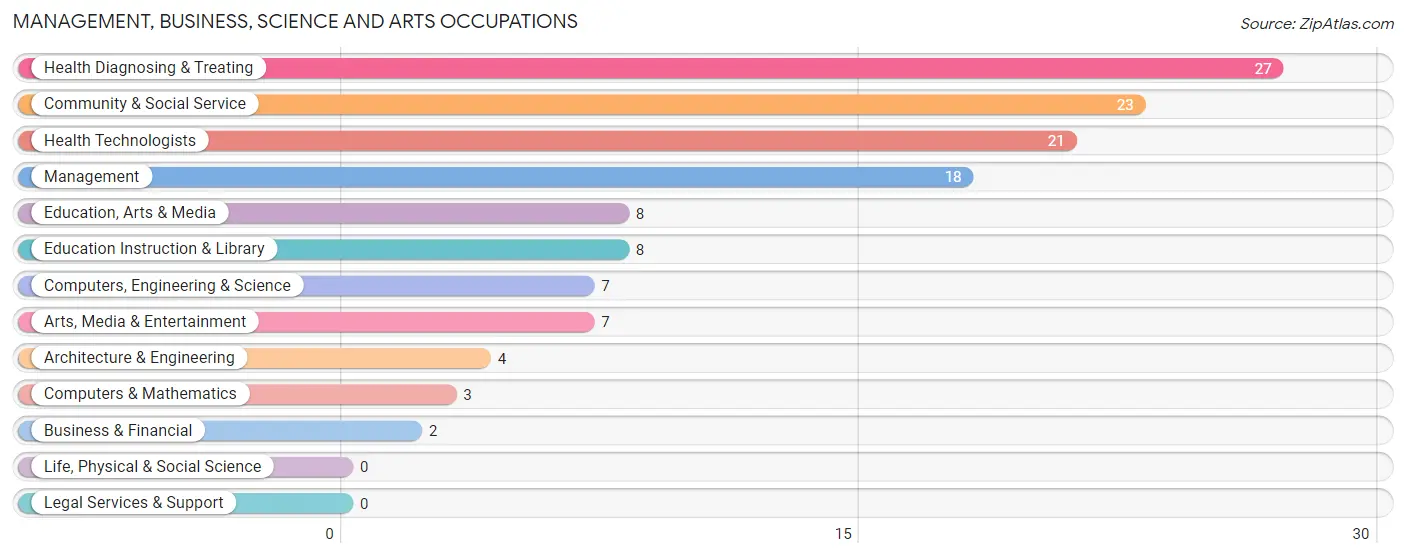
Management, Business, Science and Arts Occupations
The most common Management, Business, Science and Arts occupations in Northport are Health Diagnosing & Treating (27 | 17.6%), Community & Social Service (23 | 15.0%), Health Technologists (21 | 13.7%), Management (18 | 11.8%), and Education, Arts & Media (8 | 5.2%).
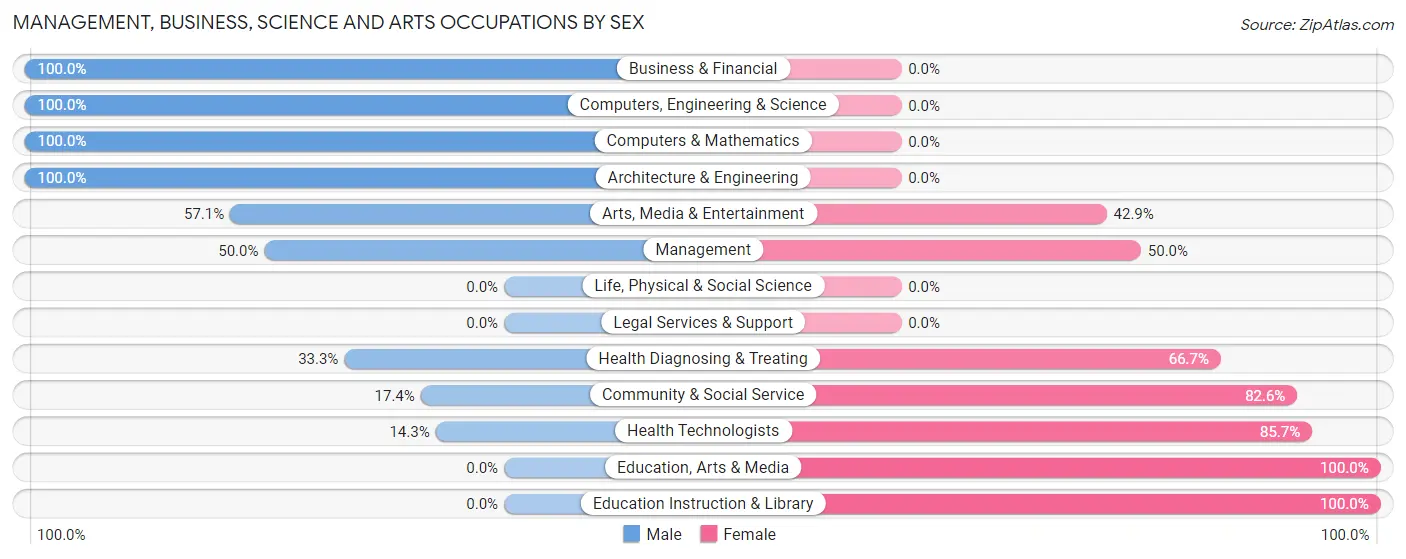
Management, Business, Science and Arts Occupations by Sex
Within the Management, Business, Science and Arts occupations in Northport, the most male-oriented occupations are Business & Financial (100.0%), Computers, Engineering & Science (100.0%), and Computers & Mathematics (100.0%), while the most female-oriented occupations are Education, Arts & Media (100.0%), Education Instruction & Library (100.0%), and Health Technologists (85.7%).
| Occupation | Male | Female |
| Management | 9 (50.0%) | 9 (50.0%) |
| Business & Financial | 2 (100.0%) | 0 (0.0%) |
| Computers, Engineering & Science | 7 (100.0%) | 0 (0.0%) |
| Computers & Mathematics | 3 (100.0%) | 0 (0.0%) |
| Architecture & Engineering | 4 (100.0%) | 0 (0.0%) |
| Life, Physical & Social Science | 0 (0.0%) | 0 (0.0%) |
| Community & Social Service | 4 (17.4%) | 19 (82.6%) |
| Education, Arts & Media | 0 (0.0%) | 8 (100.0%) |
| Legal Services & Support | 0 (0.0%) | 0 (0.0%) |
| Education Instruction & Library | 0 (0.0%) | 8 (100.0%) |
| Arts, Media & Entertainment | 4 (57.1%) | 3 (42.9%) |
| Health Diagnosing & Treating | 9 (33.3%) | 18 (66.7%) |
| Health Technologists | 3 (14.3%) | 18 (85.7%) |
| Total (Category) | 31 (40.3%) | 46 (59.7%) |
| Total (Overall) | 66 (43.1%) | 87 (56.9%) |
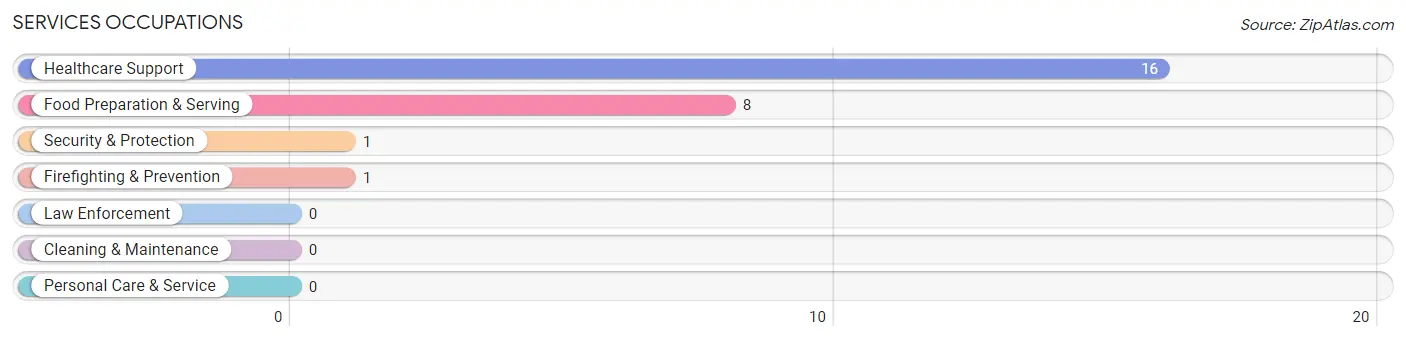
Services Occupations
The most common Services occupations in Northport are Healthcare Support (16 | 10.5%), Food Preparation & Serving (8 | 5.2%), Security & Protection (1 | 0.6%), and Firefighting & Prevention (1 | 0.6%).
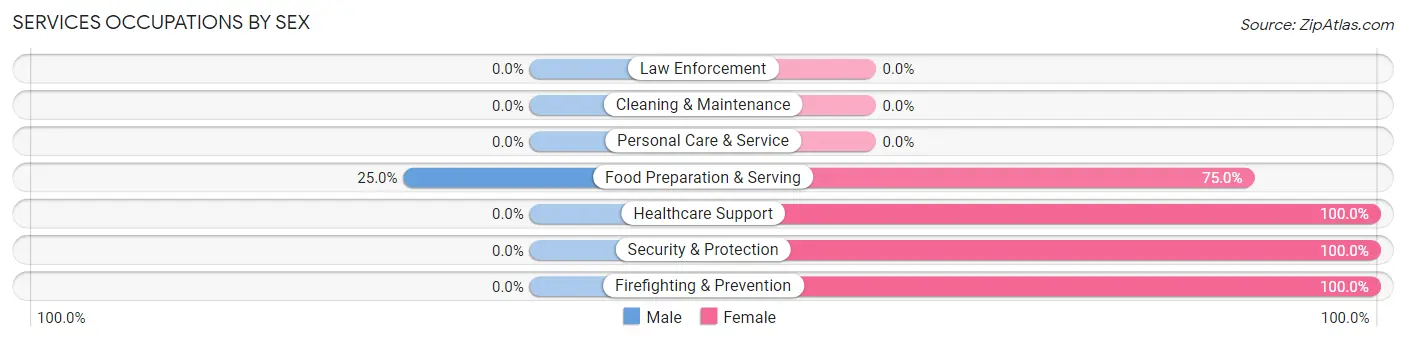
Services Occupations by Sex
| Occupation | Male | Female |
| Healthcare Support | 0 (0.0%) | 16 (100.0%) |
| Security & Protection | 0 (0.0%) | 1 (100.0%) |
| Firefighting & Prevention | 0 (0.0%) | 1 (100.0%) |
| Law Enforcement | 0 (0.0%) | 0 (0.0%) |
| Food Preparation & Serving | 2 (25.0%) | 6 (75.0%) |
| Cleaning & Maintenance | 0 (0.0%) | 0 (0.0%) |
| Personal Care & Service | 0 (0.0%) | 0 (0.0%) |
| Total (Category) | 2 (8.0%) | 23 (92.0%) |
| Total (Overall) | 66 (43.1%) | 87 (56.9%) |
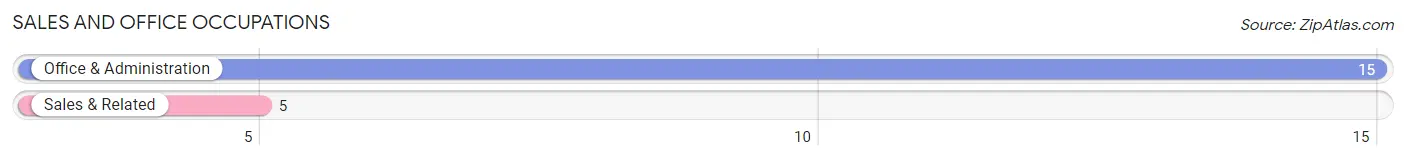
Sales and Office Occupations
The most common Sales and Office occupations in Northport are Office & Administration (15 | 9.8%), and Sales & Related (5 | 3.3%).
Sales and Office Occupations by Sex
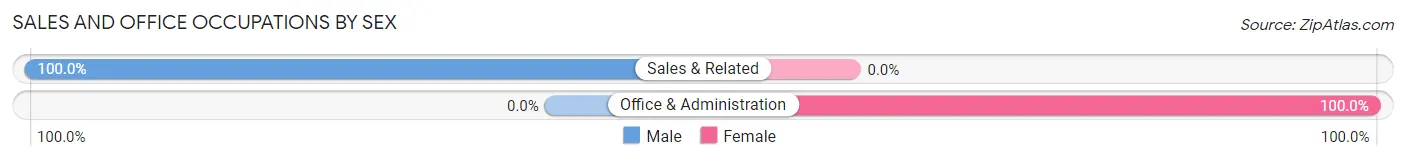
| Occupation | Male | Female |
| Sales & Related | 5 (100.0%) | 0 (0.0%) |
| Office & Administration | 0 (0.0%) | 15 (100.0%) |
| Total (Category) | 5 (25.0%) | 15 (75.0%) |
| Total (Overall) | 66 (43.1%) | 87 (56.9%) |
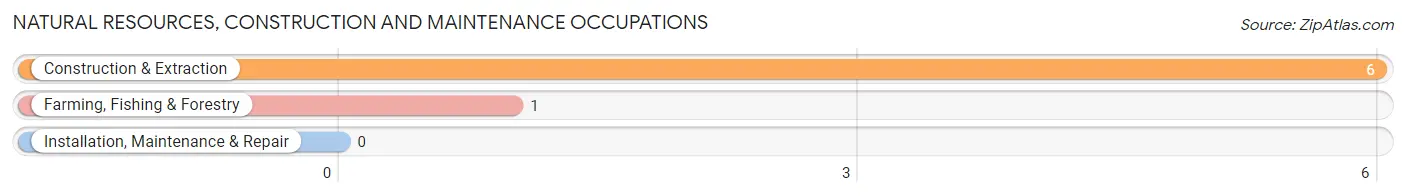
Natural Resources, Construction and Maintenance Occupations
The most common Natural Resources, Construction and Maintenance occupations in Northport are Construction & Extraction (6 | 3.9%), and Farming, Fishing & Forestry (1 | 0.6%).
Natural Resources, Construction and Maintenance Occupations by Sex
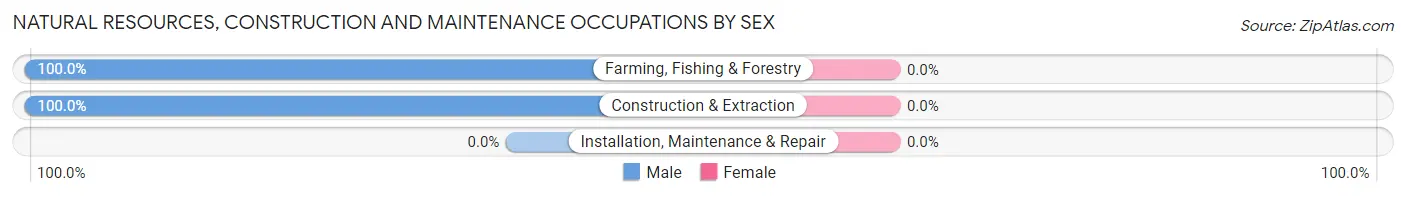
| Occupation | Male | Female |
| Farming, Fishing & Forestry | 1 (100.0%) | 0 (0.0%) |
| Construction & Extraction | 6 (100.0%) | 0 (0.0%) |
| Installation, Maintenance & Repair | 0 (0.0%) | 0 (0.0%) |
| Total (Category) | 7 (100.0%) | 0 (0.0%) |
| Total (Overall) | 66 (43.1%) | 87 (56.9%) |
Production, Transportation and Moving Occupations
The most common Production, Transportation and Moving occupations in Northport are Transportation (14 | 9.1%), Material Moving (9 | 5.9%), and Production (1 | 0.6%).
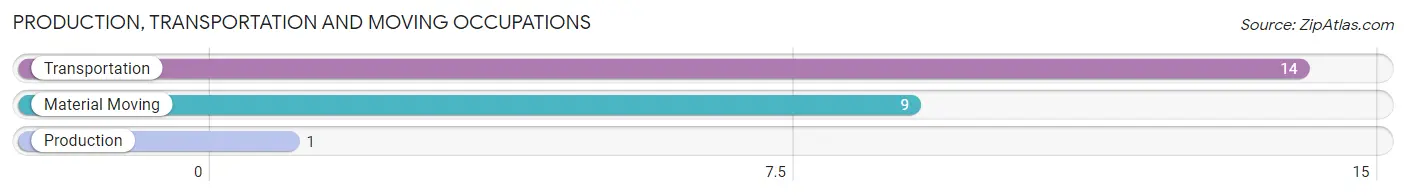
Production, Transportation and Moving Occupations by Sex
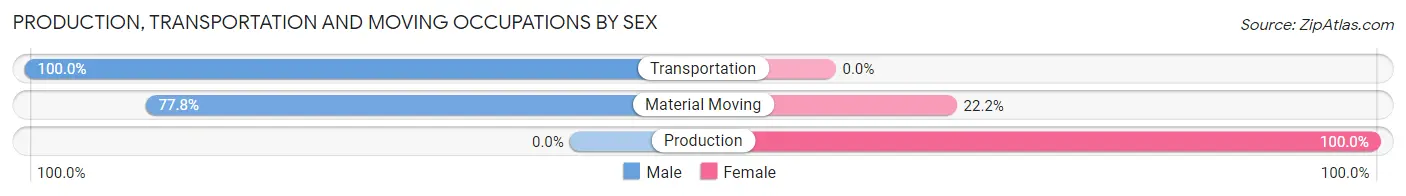
| Occupation | Male | Female |
| Production | 0 (0.0%) | 1 (100.0%) |
| Transportation | 14 (100.0%) | 0 (0.0%) |
| Material Moving | 7 (77.8%) | 2 (22.2%) |
| Total (Category) | 21 (87.5%) | 3 (12.5%) |
| Total (Overall) | 66 (43.1%) | 87 (56.9%) |
Employment Industries by Sex in Northport
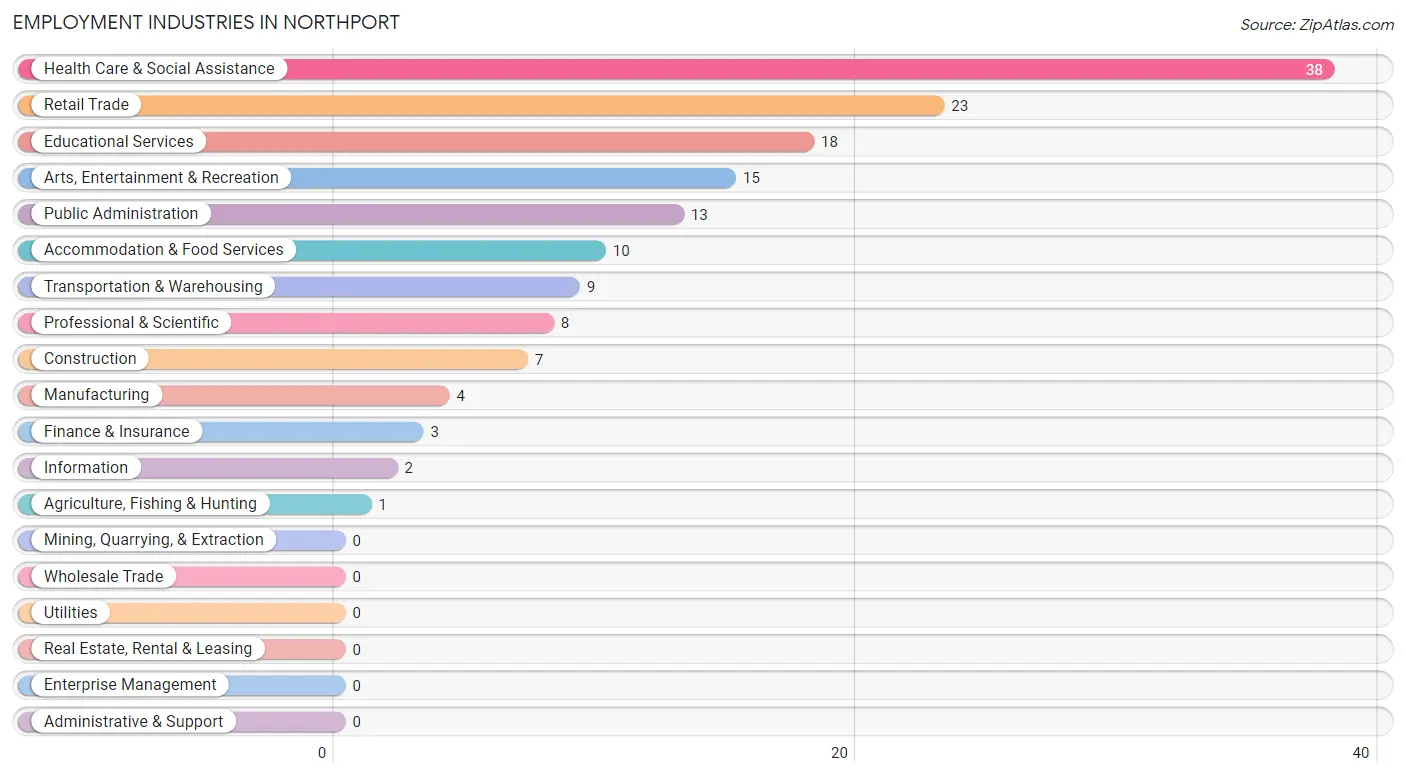
Employment Industries in Northport
The major employment industries in Northport include Health Care & Social Assistance (38 | 24.8%), Retail Trade (23 | 15.0%), Educational Services (18 | 11.8%), Arts, Entertainment & Recreation (15 | 9.8%), and Public Administration (13 | 8.5%).
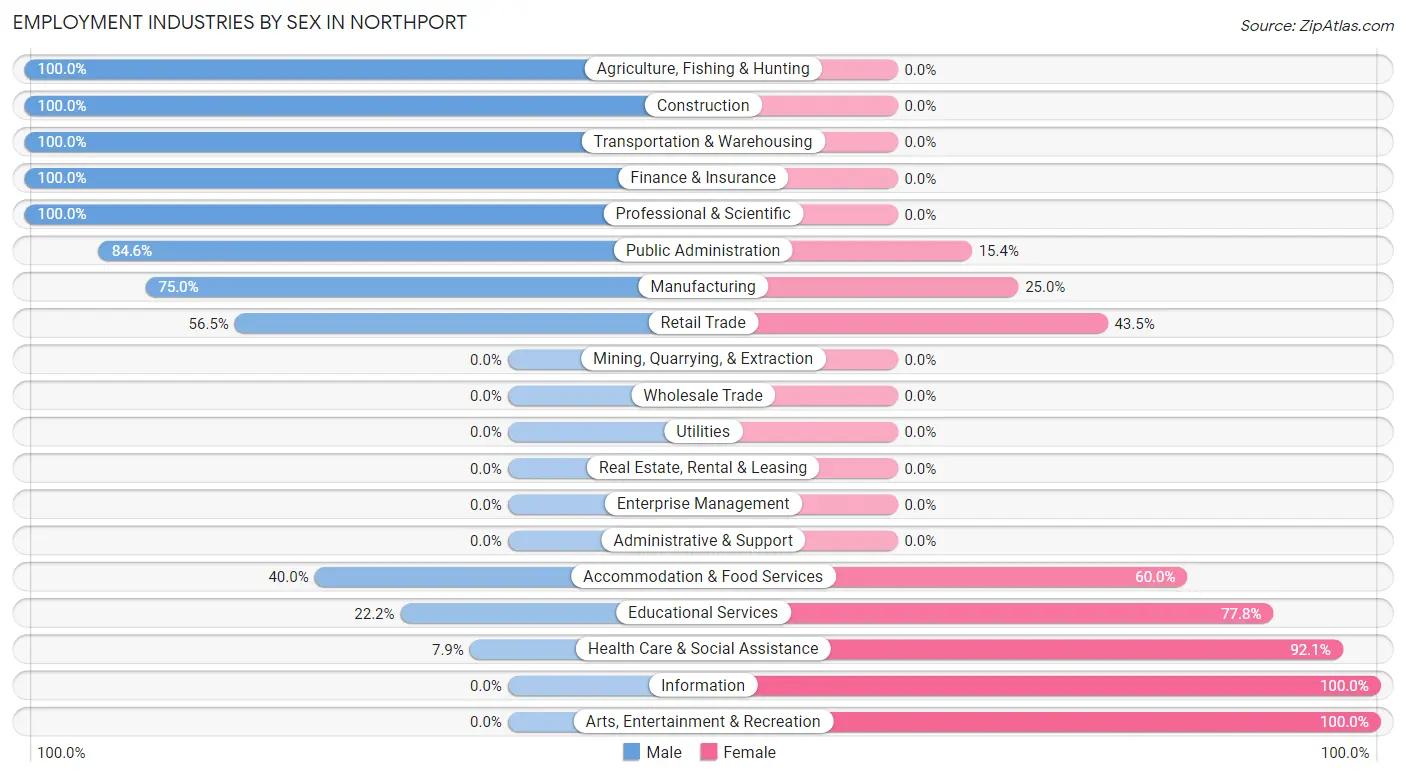
Employment Industries by Sex in Northport
The Northport industries that see more men than women are Agriculture, Fishing & Hunting (100.0%), Construction (100.0%), and Transportation & Warehousing (100.0%), whereas the industries that tend to have a higher number of women are Information (100.0%), Arts, Entertainment & Recreation (100.0%), and Health Care & Social Assistance (92.1%).
| Industry | Male | Female |
| Agriculture, Fishing & Hunting | 1 (100.0%) | 0 (0.0%) |
| Mining, Quarrying, & Extraction | 0 (0.0%) | 0 (0.0%) |
| Construction | 7 (100.0%) | 0 (0.0%) |
| Manufacturing | 3 (75.0%) | 1 (25.0%) |
| Wholesale Trade | 0 (0.0%) | 0 (0.0%) |
| Retail Trade | 13 (56.5%) | 10 (43.5%) |
| Transportation & Warehousing | 9 (100.0%) | 0 (0.0%) |
| Utilities | 0 (0.0%) | 0 (0.0%) |
| Information | 0 (0.0%) | 2 (100.0%) |
| Finance & Insurance | 3 (100.0%) | 0 (0.0%) |
| Real Estate, Rental & Leasing | 0 (0.0%) | 0 (0.0%) |
| Professional & Scientific | 8 (100.0%) | 0 (0.0%) |
| Enterprise Management | 0 (0.0%) | 0 (0.0%) |
| Administrative & Support | 0 (0.0%) | 0 (0.0%) |
| Educational Services | 4 (22.2%) | 14 (77.8%) |
| Health Care & Social Assistance | 3 (7.9%) | 35 (92.1%) |
| Arts, Entertainment & Recreation | 0 (0.0%) | 15 (100.0%) |
| Accommodation & Food Services | 4 (40.0%) | 6 (60.0%) |
| Public Administration | 11 (84.6%) | 2 (15.4%) |
| Total | 66 (43.1%) | 87 (56.9%) |
Education in Northport
School Enrollment in Northport
The most common levels of schooling among the 80 students in Northport are graduate / professional (32 | 40.0%), college / undergraduate (18 | 22.5%), and elementary school (9 | 11.3%).
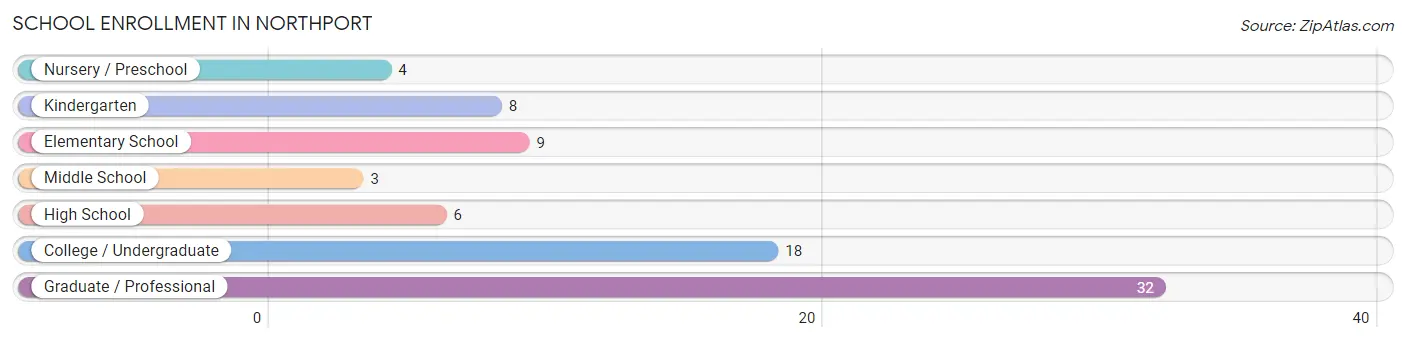
| School Level | # Students | % Students |
| Nursery / Preschool | 4 | 5.0% |
| Kindergarten | 8 | 10.0% |
| Elementary School | 9 | 11.3% |
| Middle School | 3 | 3.7% |
| High School | 6 | 7.5% |
| College / Undergraduate | 18 | 22.5% |
| Graduate / Professional | 32 | 40.0% |
| Total | 80 | 100.0% |
School Enrollment by Age by Funding Source in Northport
Out of a total of 80 students who are enrolled in schools in Northport, 11 (13.8%) attend a private institution, while the remaining 69 (86.2%) are enrolled in public schools. The age group of 25 to 34 year olds has the highest likelihood of being enrolled in private schools, with 8 (100.0% in the age bracket) enrolled. Conversely, the age group of 3 to 4 year olds has the lowest likelihood of being enrolled in a private school, with 4 (100.0% in the age bracket) attending a public institution.
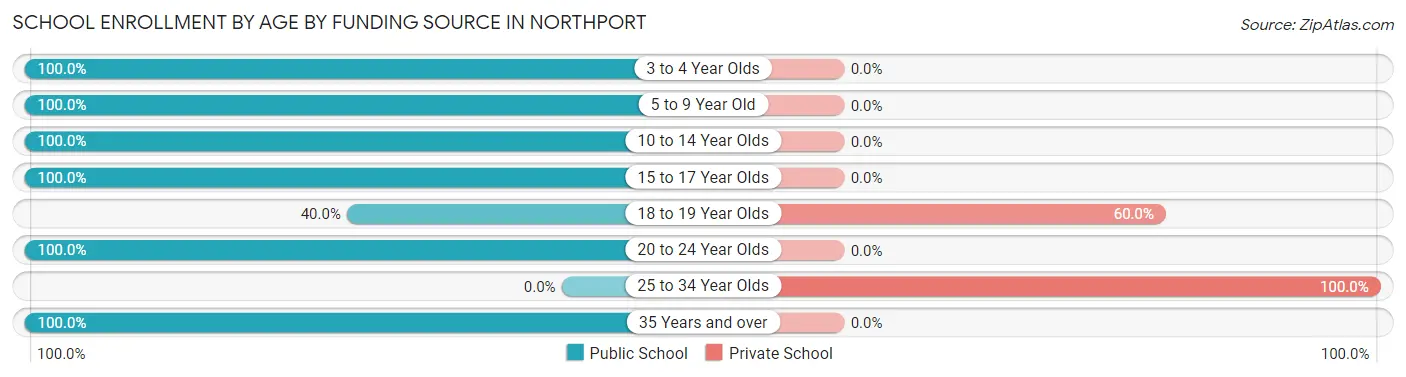
| Age Bracket | Public School | Private School |
| 3 to 4 Year Olds | 4 (100.0%) | 0 (0.0%) |
| 5 to 9 Year Old | 14 (100.0%) | 0 (0.0%) |
| 10 to 14 Year Olds | 6 (100.0%) | 0 (0.0%) |
| 15 to 17 Year Olds | 6 (100.0%) | 0 (0.0%) |
| 18 to 19 Year Olds | 2 (40.0%) | 3 (60.0%) |
| 20 to 24 Year Olds | 2 (100.0%) | 0 (0.0%) |
| 25 to 34 Year Olds | 0 (0.0%) | 8 (100.0%) |
| 35 Years and over | 35 (100.0%) | 0 (0.0%) |
| Total | 69 (86.3%) | 11 (13.8%) |
Educational Attainment by Field of Study in Northport
Communications (36 | 18.5%), education (29 | 14.9%), business (26 | 13.3%), engineering (23 | 11.8%), and science & technology (22 | 11.3%) are the most common fields of study among 195 individuals in Northport who have obtained a bachelor's degree or higher.
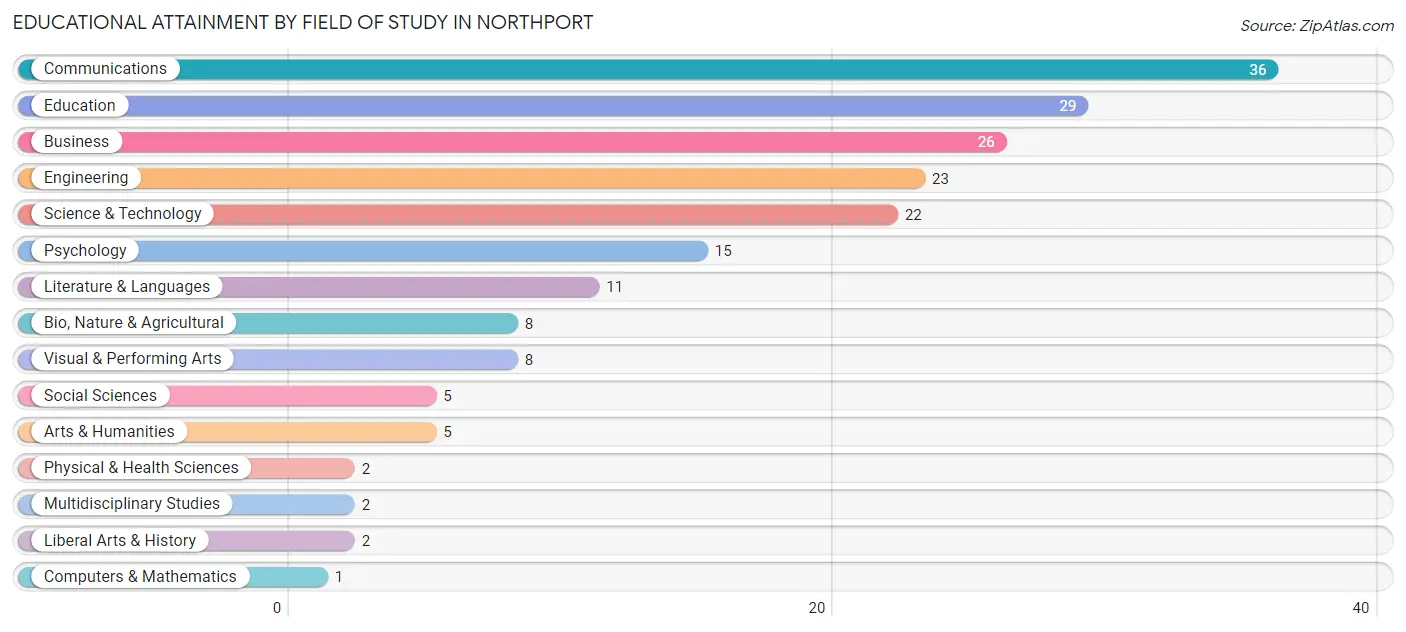
| Field of Study | # Graduates | % Graduates |
| Computers & Mathematics | 1 | 0.5% |
| Bio, Nature & Agricultural | 8 | 4.1% |
| Physical & Health Sciences | 2 | 1.0% |
| Psychology | 15 | 7.7% |
| Social Sciences | 5 | 2.6% |
| Engineering | 23 | 11.8% |
| Multidisciplinary Studies | 2 | 1.0% |
| Science & Technology | 22 | 11.3% |
| Business | 26 | 13.3% |
| Education | 29 | 14.9% |
| Literature & Languages | 11 | 5.6% |
| Liberal Arts & History | 2 | 1.0% |
| Visual & Performing Arts | 8 | 4.1% |
| Communications | 36 | 18.5% |
| Arts & Humanities | 5 | 2.6% |
| Total | 195 | 100.0% |
Transportation & Commute in Northport
Vehicle Availability by Sex in Northport
The most prevalent vehicle ownership categories in Northport are males with 3 vehicles (24, accounting for 40.0%) and females with 3 vehicles (14, making up 28.2%).
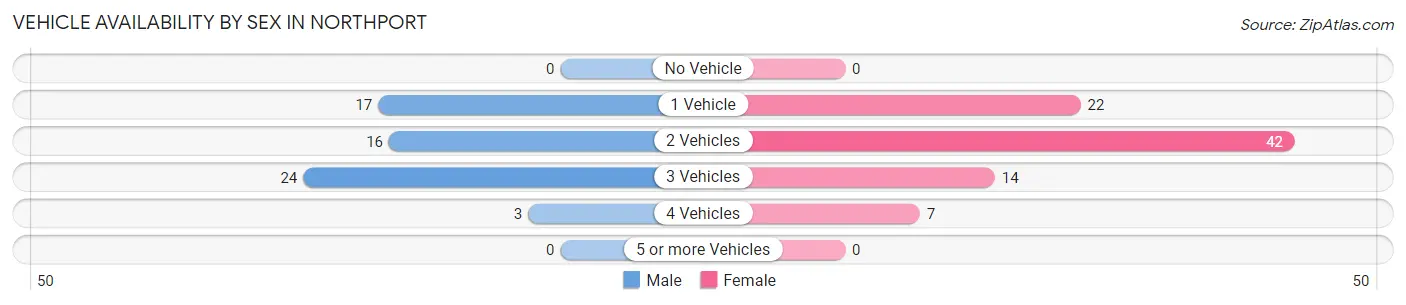
| Vehicles Available | Male | Female |
| No Vehicle | 0 (0.0%) | 0 (0.0%) |
| 1 Vehicle | 17 (28.3%) | 22 (25.9%) |
| 2 Vehicles | 16 (26.7%) | 42 (49.4%) |
| 3 Vehicles | 24 (40.0%) | 14 (16.5%) |
| 4 Vehicles | 3 (5.0%) | 7 (8.2%) |
| 5 or more Vehicles | 0 (0.0%) | 0 (0.0%) |
| Total | 60 (100.0%) | 85 (100.0%) |
Commute Time in Northport
The most frequently occuring commute durations in Northport are 5 to 9 minutes (39 commuters, 32.5%), less than 5 minutes (25 commuters, 20.8%), and 25 to 29 minutes (14 commuters, 11.7%).
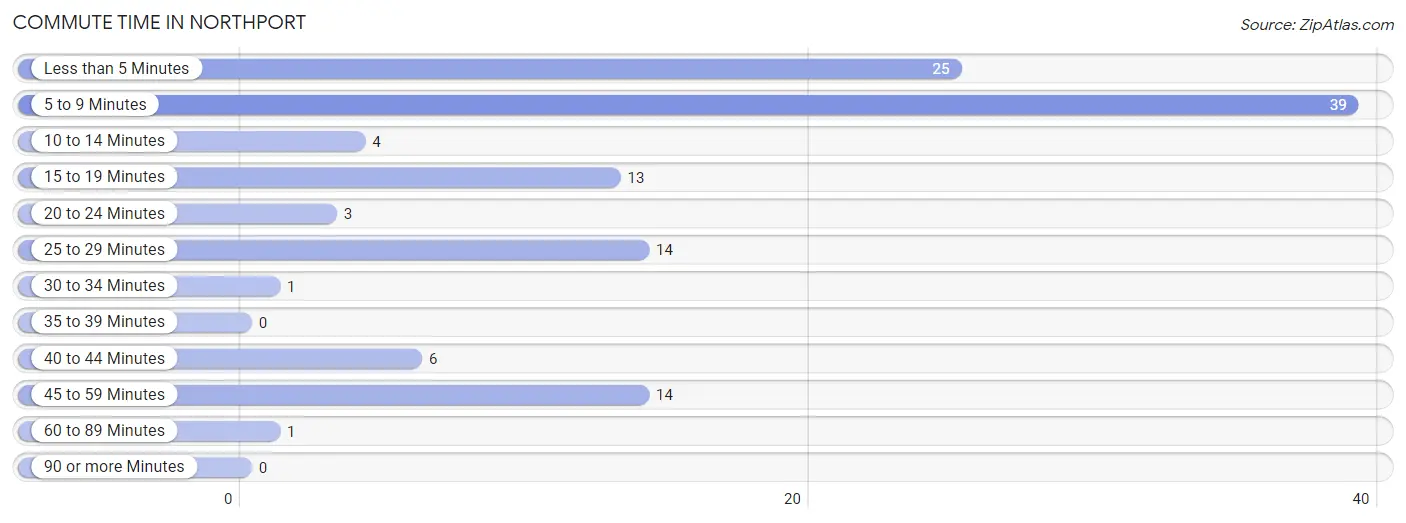
| Commute Time | # Commuters | % Commuters |
| Less than 5 Minutes | 25 | 20.8% |
| 5 to 9 Minutes | 39 | 32.5% |
| 10 to 14 Minutes | 4 | 3.3% |
| 15 to 19 Minutes | 13 | 10.8% |
| 20 to 24 Minutes | 3 | 2.5% |
| 25 to 29 Minutes | 14 | 11.7% |
| 30 to 34 Minutes | 1 | 0.8% |
| 35 to 39 Minutes | 0 | 0.0% |
| 40 to 44 Minutes | 6 | 5.0% |
| 45 to 59 Minutes | 14 | 11.7% |
| 60 to 89 Minutes | 1 | 0.8% |
| 90 or more Minutes | 0 | 0.0% |
Commute Time by Sex in Northport
The most common commute times in Northport are 5 to 9 minutes (16 commuters, 33.3%) for males and 5 to 9 minutes (23 commuters, 31.9%) for females.
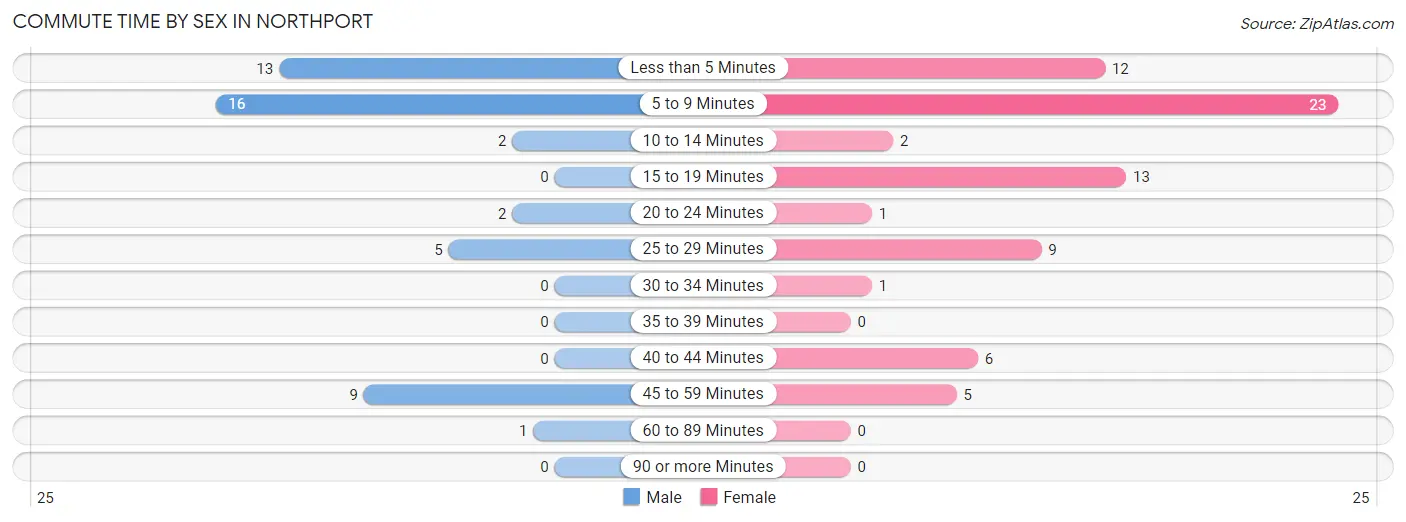
| Commute Time | Male | Female |
| Less than 5 Minutes | 13 (27.1%) | 12 (16.7%) |
| 5 to 9 Minutes | 16 (33.3%) | 23 (31.9%) |
| 10 to 14 Minutes | 2 (4.2%) | 2 (2.8%) |
| 15 to 19 Minutes | 0 (0.0%) | 13 (18.1%) |
| 20 to 24 Minutes | 2 (4.2%) | 1 (1.4%) |
| 25 to 29 Minutes | 5 (10.4%) | 9 (12.5%) |
| 30 to 34 Minutes | 0 (0.0%) | 1 (1.4%) |
| 35 to 39 Minutes | 0 (0.0%) | 0 (0.0%) |
| 40 to 44 Minutes | 0 (0.0%) | 6 (8.3%) |
| 45 to 59 Minutes | 9 (18.8%) | 5 (6.9%) |
| 60 to 89 Minutes | 1 (2.1%) | 0 (0.0%) |
| 90 or more Minutes | 0 (0.0%) | 0 (0.0%) |
Time of Departure to Work by Sex in Northport
The most frequent times of departure to work in Northport are 7:30 AM to 7:59 AM (17, 35.4%) for males and 7:00 AM to 7:29 AM (13, 18.1%) for females.
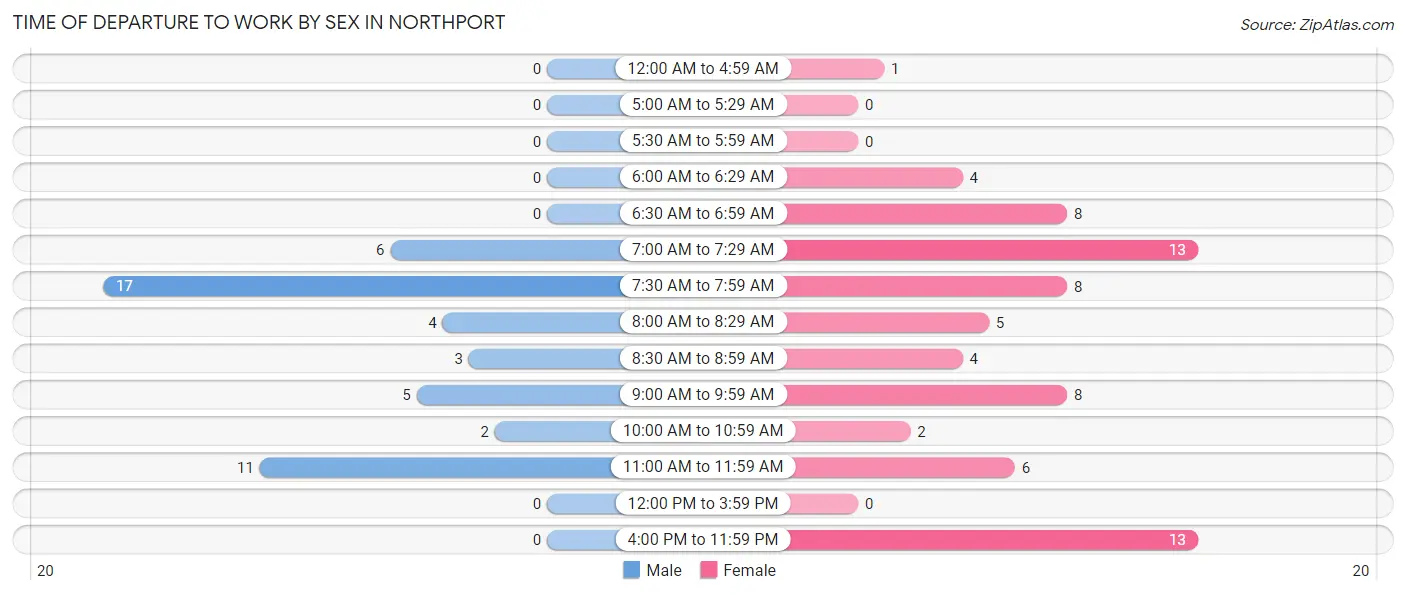
| Time of Departure | Male | Female |
| 12:00 AM to 4:59 AM | 0 (0.0%) | 1 (1.4%) |
| 5:00 AM to 5:29 AM | 0 (0.0%) | 0 (0.0%) |
| 5:30 AM to 5:59 AM | 0 (0.0%) | 0 (0.0%) |
| 6:00 AM to 6:29 AM | 0 (0.0%) | 4 (5.6%) |
| 6:30 AM to 6:59 AM | 0 (0.0%) | 8 (11.1%) |
| 7:00 AM to 7:29 AM | 6 (12.5%) | 13 (18.1%) |
| 7:30 AM to 7:59 AM | 17 (35.4%) | 8 (11.1%) |
| 8:00 AM to 8:29 AM | 4 (8.3%) | 5 (6.9%) |
| 8:30 AM to 8:59 AM | 3 (6.2%) | 4 (5.6%) |
| 9:00 AM to 9:59 AM | 5 (10.4%) | 8 (11.1%) |
| 10:00 AM to 10:59 AM | 2 (4.2%) | 2 (2.8%) |
| 11:00 AM to 11:59 AM | 11 (22.9%) | 6 (8.3%) |
| 12:00 PM to 3:59 PM | 0 (0.0%) | 0 (0.0%) |
| 4:00 PM to 11:59 PM | 0 (0.0%) | 13 (18.1%) |
| Total | 48 (100.0%) | 72 (100.0%) |
Housing Occupancy in Northport
Occupancy by Ownership in Northport
Of the total 209 dwellings in Northport, owner-occupied units account for 185 (88.5%), while renter-occupied units make up 24 (11.5%).
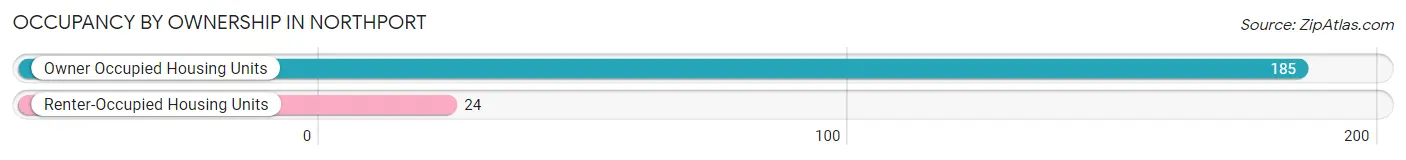
| Occupancy | # Housing Units | % Housing Units |
| Owner Occupied Housing Units | 185 | 88.5% |
| Renter-Occupied Housing Units | 24 | 11.5% |
| Total Occupied Housing Units | 209 | 100.0% |
Occupancy by Household Size in Northport
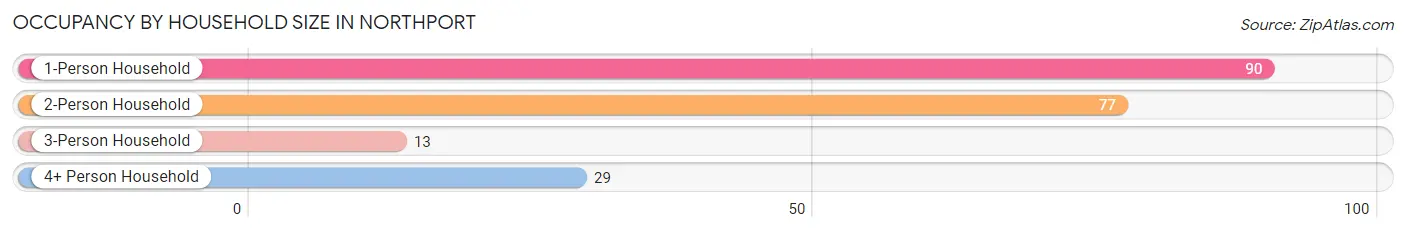
| Household Size | # Housing Units | % Housing Units |
| 1-Person Household | 90 | 43.1% |
| 2-Person Household | 77 | 36.8% |
| 3-Person Household | 13 | 6.2% |
| 4+ Person Household | 29 | 13.9% |
| Total Housing Units | 209 | 100.0% |
Occupancy by Ownership by Household Size in Northport
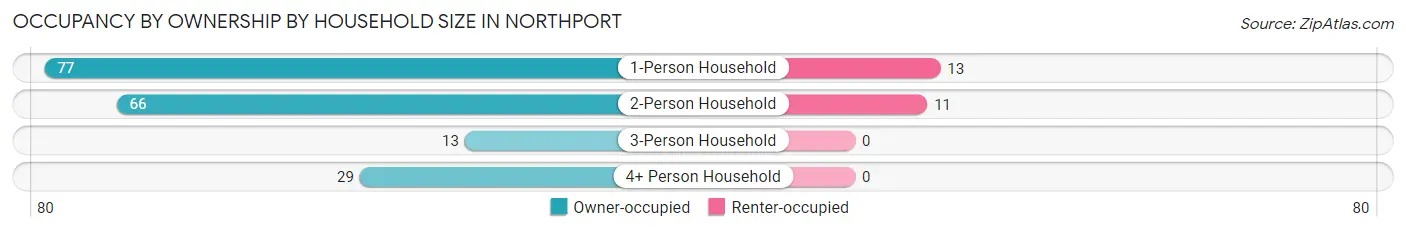
| Household Size | Owner-occupied | Renter-occupied |
| 1-Person Household | 77 (85.6%) | 13 (14.4%) |
| 2-Person Household | 66 (85.7%) | 11 (14.3%) |
| 3-Person Household | 13 (100.0%) | 0 (0.0%) |
| 4+ Person Household | 29 (100.0%) | 0 (0.0%) |
| Total Housing Units | 185 (88.5%) | 24 (11.5%) |
Occupancy by Educational Attainment in Northport
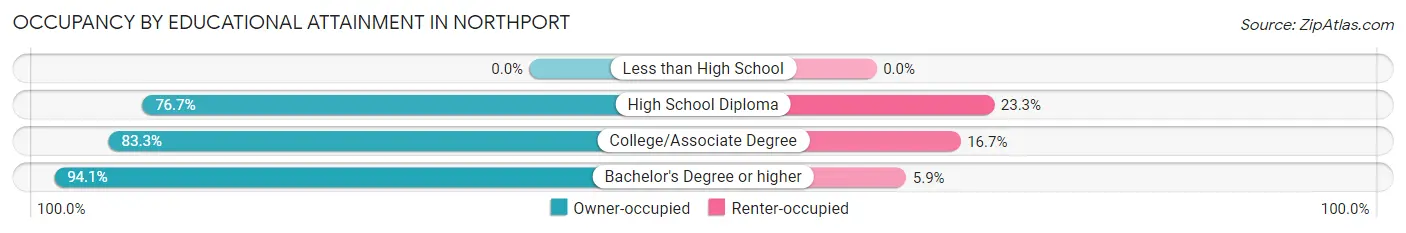
| Household Size | Owner-occupied | Renter-occupied |
| Less than High School | 0 (0.0%) | 0 (0.0%) |
| High School Diploma | 23 (76.7%) | 7 (23.3%) |
| College/Associate Degree | 50 (83.3%) | 10 (16.7%) |
| Bachelor's Degree or higher | 112 (94.1%) | 7 (5.9%) |
Occupancy by Age of Householder in Northport
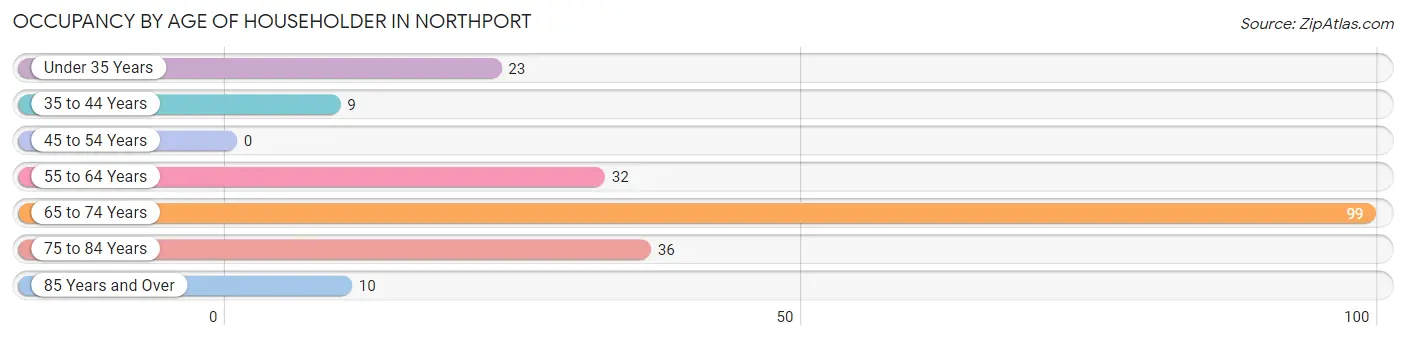
| Age Bracket | # Households | % Households |
| Under 35 Years | 23 | 11.0% |
| 35 to 44 Years | 9 | 4.3% |
| 45 to 54 Years | 0 | 0.0% |
| 55 to 64 Years | 32 | 15.3% |
| 65 to 74 Years | 99 | 47.4% |
| 75 to 84 Years | 36 | 17.2% |
| 85 Years and Over | 10 | 4.8% |
| Total | 209 | 100.0% |
Housing Finances in Northport
Median Income by Occupancy in Northport
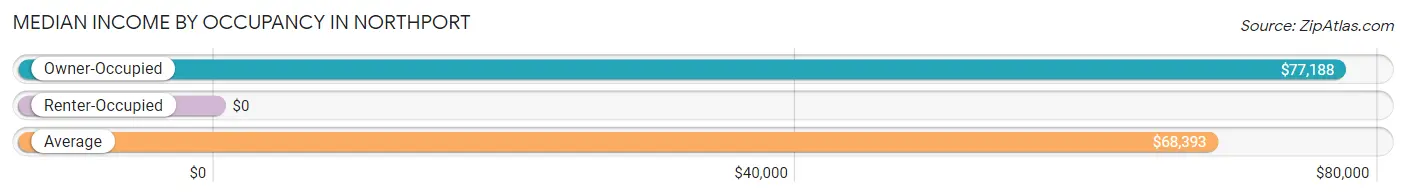
| Occupancy Type | # Households | Median Income |
| Owner-Occupied | 185 (88.5%) | $77,188 |
| Renter-Occupied | 24 (11.5%) | $0 |
| Average | 209 (100.0%) | $68,393 |
Occupancy by Householder Income Bracket in Northport
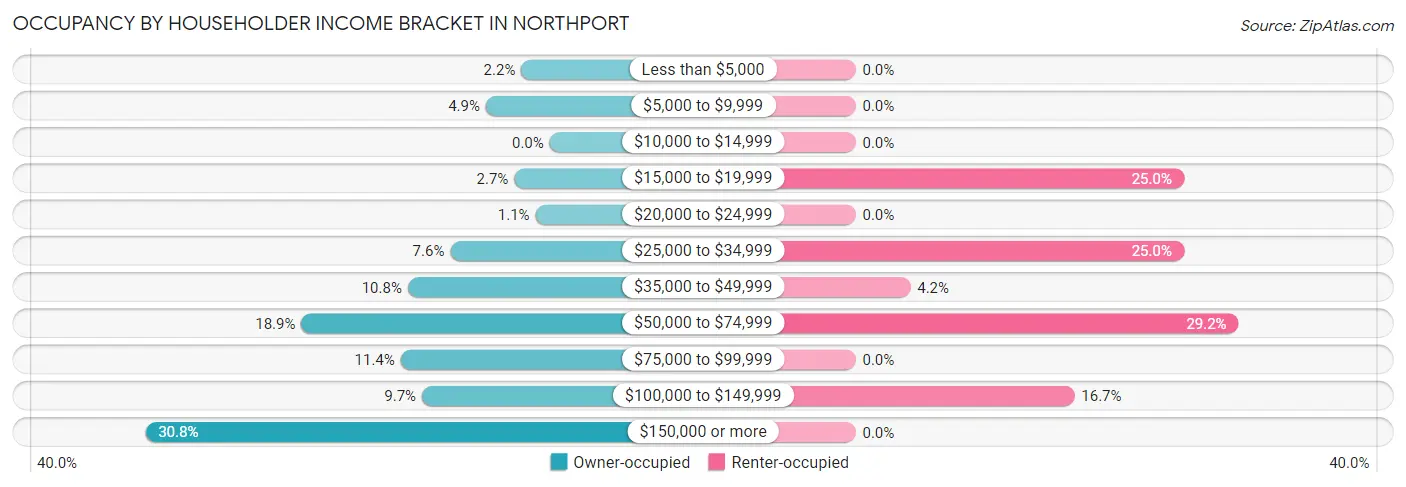
| Income Bracket | Owner-occupied | Renter-occupied |
| Less than $5,000 | 4 (2.2%) | 0 (0.0%) |
| $5,000 to $9,999 | 9 (4.9%) | 0 (0.0%) |
| $10,000 to $14,999 | 0 (0.0%) | 0 (0.0%) |
| $15,000 to $19,999 | 5 (2.7%) | 6 (25.0%) |
| $20,000 to $24,999 | 2 (1.1%) | 0 (0.0%) |
| $25,000 to $34,999 | 14 (7.6%) | 6 (25.0%) |
| $35,000 to $49,999 | 20 (10.8%) | 1 (4.2%) |
| $50,000 to $74,999 | 35 (18.9%) | 7 (29.2%) |
| $75,000 to $99,999 | 21 (11.4%) | 0 (0.0%) |
| $100,000 to $149,999 | 18 (9.7%) | 4 (16.7%) |
| $150,000 or more | 57 (30.8%) | 0 (0.0%) |
| Total | 185 (100.0%) | 24 (100.0%) |
Monthly Housing Cost Tiers in Northport
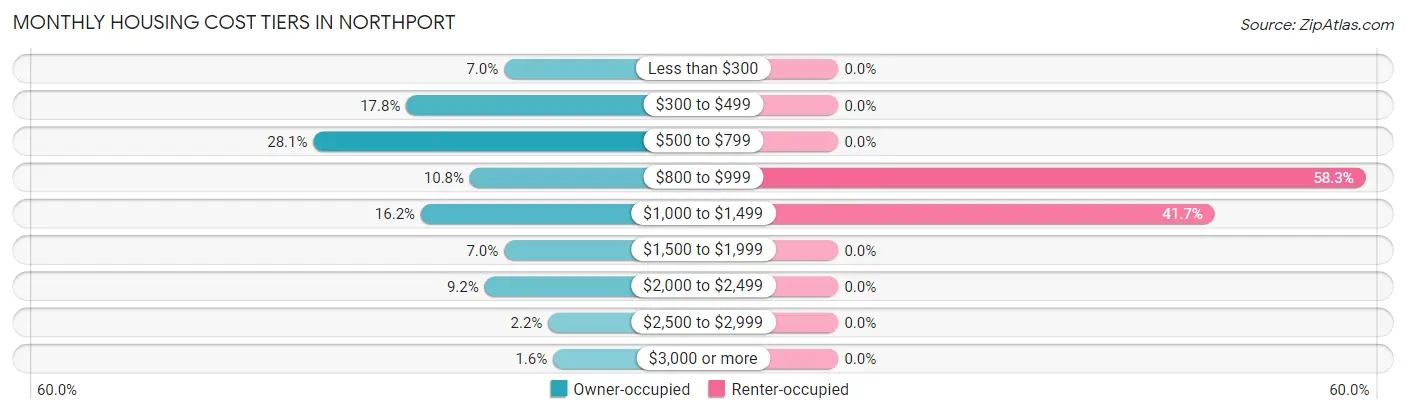
| Monthly Cost | Owner-occupied | Renter-occupied |
| Less than $300 | 13 (7.0%) | 0 (0.0%) |
| $300 to $499 | 33 (17.8%) | 0 (0.0%) |
| $500 to $799 | 52 (28.1%) | 0 (0.0%) |
| $800 to $999 | 20 (10.8%) | 14 (58.3%) |
| $1,000 to $1,499 | 30 (16.2%) | 10 (41.7%) |
| $1,500 to $1,999 | 13 (7.0%) | 0 (0.0%) |
| $2,000 to $2,499 | 17 (9.2%) | 0 (0.0%) |
| $2,500 to $2,999 | 4 (2.2%) | 0 (0.0%) |
| $3,000 or more | 3 (1.6%) | 0 (0.0%) |
| Total | 185 (100.0%) | 24 (100.0%) |
Physical Housing Characteristics in Northport
Housing Structures in Northport
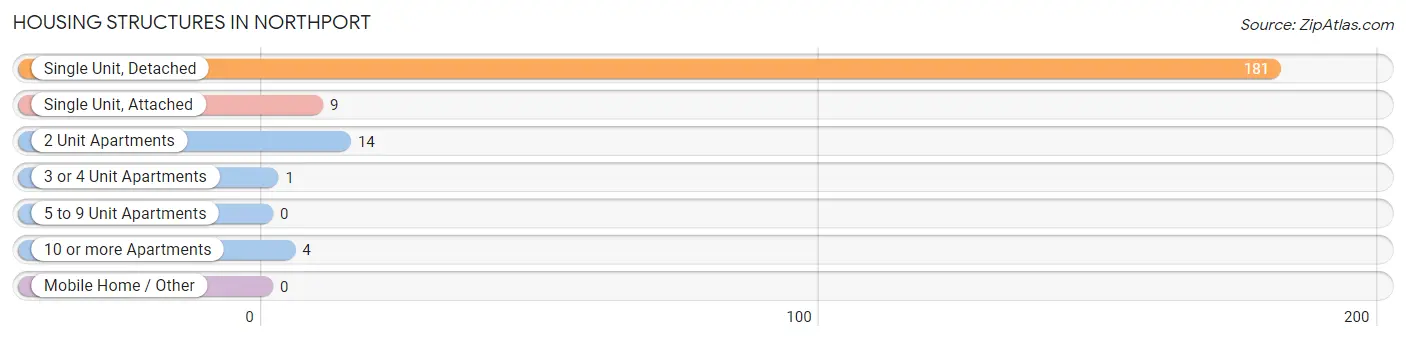
| Structure Type | # Housing Units | % Housing Units |
| Single Unit, Detached | 181 | 86.6% |
| Single Unit, Attached | 9 | 4.3% |
| 2 Unit Apartments | 14 | 6.7% |
| 3 or 4 Unit Apartments | 1 | 0.5% |
| 5 to 9 Unit Apartments | 0 | 0.0% |
| 10 or more Apartments | 4 | 1.9% |
| Mobile Home / Other | 0 | 0.0% |
| Total | 209 | 100.0% |
Housing Structures by Occupancy in Northport
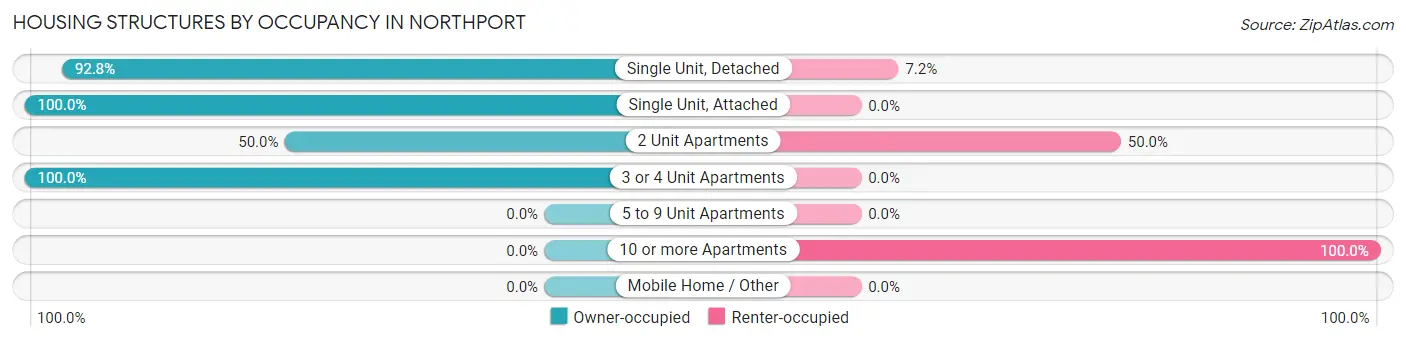
| Structure Type | Owner-occupied | Renter-occupied |
| Single Unit, Detached | 168 (92.8%) | 13 (7.2%) |
| Single Unit, Attached | 9 (100.0%) | 0 (0.0%) |
| 2 Unit Apartments | 7 (50.0%) | 7 (50.0%) |
| 3 or 4 Unit Apartments | 1 (100.0%) | 0 (0.0%) |
| 5 to 9 Unit Apartments | 0 (0.0%) | 0 (0.0%) |
| 10 or more Apartments | 0 (0.0%) | 4 (100.0%) |
| Mobile Home / Other | 0 (0.0%) | 0 (0.0%) |
| Total | 185 (88.5%) | 24 (11.5%) |
Housing Structures by Number of Rooms in Northport
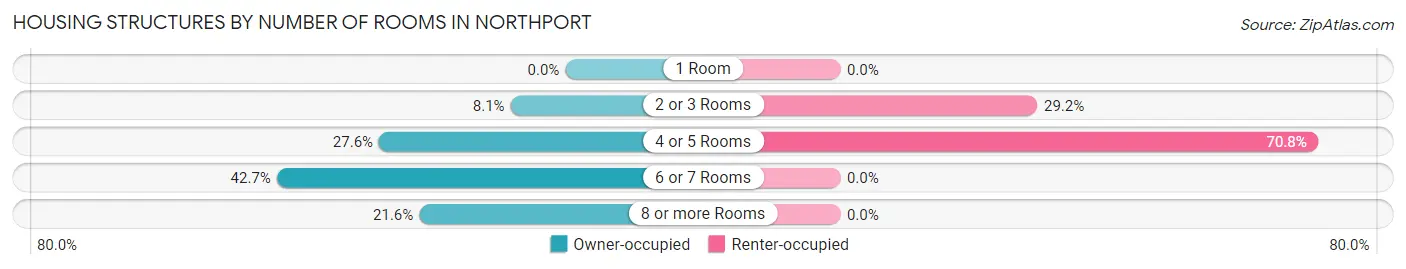
| Number of Rooms | Owner-occupied | Renter-occupied |
| 1 Room | 0 (0.0%) | 0 (0.0%) |
| 2 or 3 Rooms | 15 (8.1%) | 7 (29.2%) |
| 4 or 5 Rooms | 51 (27.6%) | 17 (70.8%) |
| 6 or 7 Rooms | 79 (42.7%) | 0 (0.0%) |
| 8 or more Rooms | 40 (21.6%) | 0 (0.0%) |
| Total | 185 (100.0%) | 24 (100.0%) |
Housing Structure by Heating Type in Northport
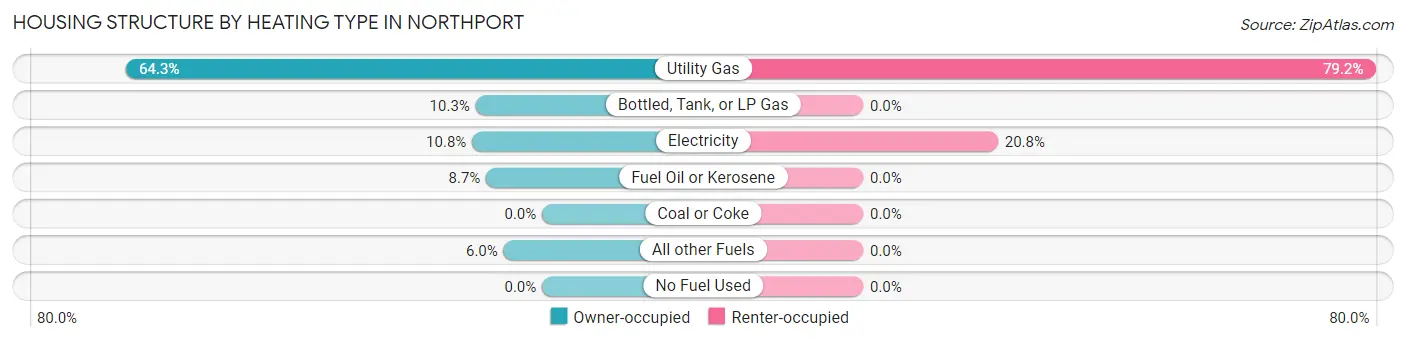
| Heating Type | Owner-occupied | Renter-occupied |
| Utility Gas | 119 (64.3%) | 19 (79.2%) |
| Bottled, Tank, or LP Gas | 19 (10.3%) | 0 (0.0%) |
| Electricity | 20 (10.8%) | 5 (20.8%) |
| Fuel Oil or Kerosene | 16 (8.6%) | 0 (0.0%) |
| Coal or Coke | 0 (0.0%) | 0 (0.0%) |
| All other Fuels | 11 (5.9%) | 0 (0.0%) |
| No Fuel Used | 0 (0.0%) | 0 (0.0%) |
| Total | 185 (100.0%) | 24 (100.0%) |
Household Vehicle Usage in Northport
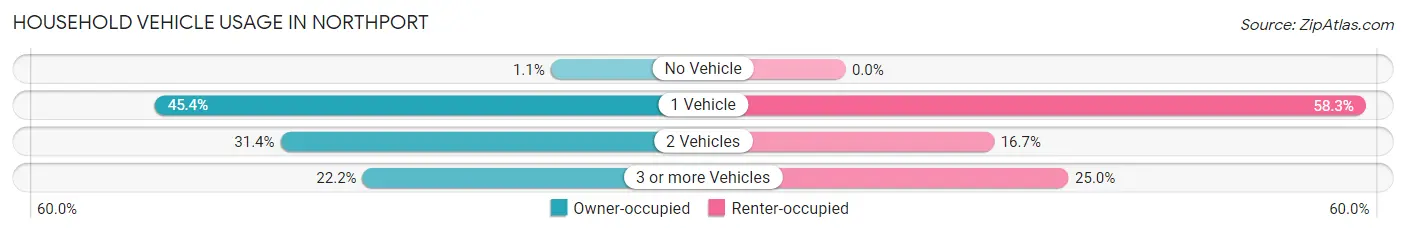
| Vehicles per Household | Owner-occupied | Renter-occupied |
| No Vehicle | 2 (1.1%) | 0 (0.0%) |
| 1 Vehicle | 84 (45.4%) | 14 (58.3%) |
| 2 Vehicles | 58 (31.4%) | 4 (16.7%) |
| 3 or more Vehicles | 41 (22.2%) | 6 (25.0%) |
| Total | 185 (100.0%) | 24 (100.0%) |
Real Estate & Mortgages in Northport
Real Estate and Mortgage Overview in Northport
| Characteristic | Without Mortgage | With Mortgage |
| Housing Units | 122 | 63 |
| Median Property Value | $227,300 | $241,300 |
| Median Household Income | - | - |
| Monthly Housing Costs | $676 | $3 |
| Real Estate Taxes | $2,962 | $7 |
Property Value by Mortgage Status in Northport
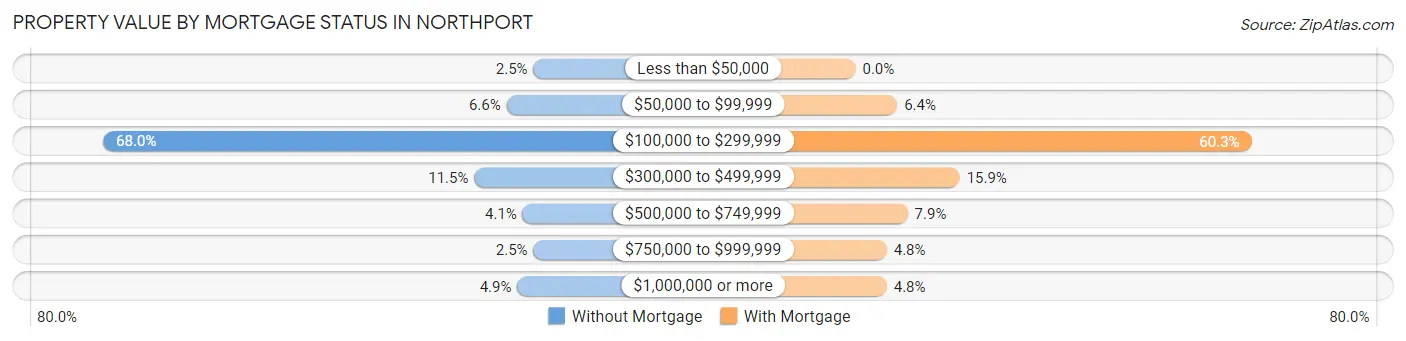
| Property Value | Without Mortgage | With Mortgage |
| Less than $50,000 | 3 (2.5%) | 0 (0.0%) |
| $50,000 to $99,999 | 8 (6.6%) | 4 (6.4%) |
| $100,000 to $299,999 | 83 (68.0%) | 38 (60.3%) |
| $300,000 to $499,999 | 14 (11.5%) | 10 (15.9%) |
| $500,000 to $749,999 | 5 (4.1%) | 5 (7.9%) |
| $750,000 to $999,999 | 3 (2.5%) | 3 (4.8%) |
| $1,000,000 or more | 6 (4.9%) | 3 (4.8%) |
| Total | 122 (100.0%) | 63 (100.0%) |
Household Income by Mortgage Status in Northport
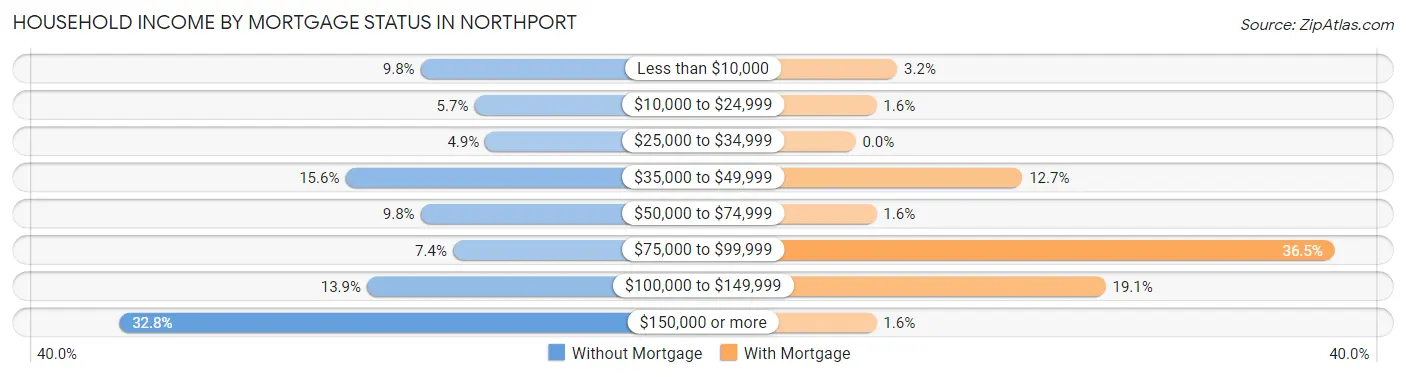
| Household Income | Without Mortgage | With Mortgage |
| Less than $10,000 | 12 (9.8%) | 2 (3.2%) |
| $10,000 to $24,999 | 7 (5.7%) | 1 (1.6%) |
| $25,000 to $34,999 | 6 (4.9%) | 0 (0.0%) |
| $35,000 to $49,999 | 19 (15.6%) | 8 (12.7%) |
| $50,000 to $74,999 | 12 (9.8%) | 1 (1.6%) |
| $75,000 to $99,999 | 9 (7.4%) | 23 (36.5%) |
| $100,000 to $149,999 | 17 (13.9%) | 12 (19.1%) |
| $150,000 or more | 40 (32.8%) | 1 (1.6%) |
| Total | 122 (100.0%) | 63 (100.0%) |
Property Value to Household Income Ratio in Northport
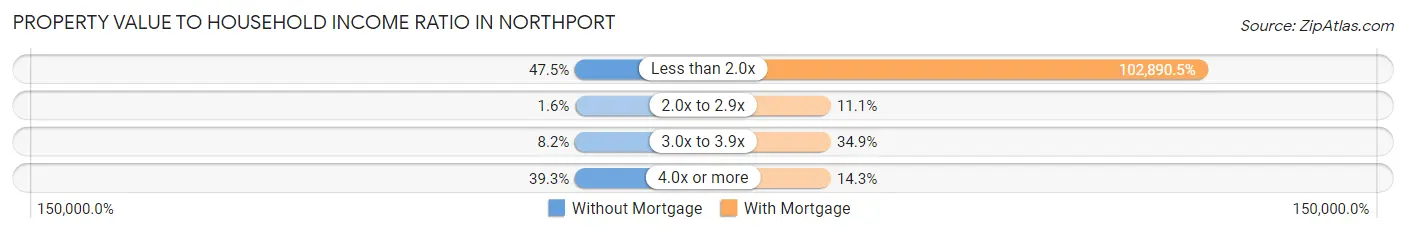
| Value-to-Income Ratio | Without Mortgage | With Mortgage |
| Less than 2.0x | 58 (47.5%) | 64,821 (102,890.5%) |
| 2.0x to 2.9x | 2 (1.6%) | 7 (11.1%) |
| 3.0x to 3.9x | 10 (8.2%) | 22 (34.9%) |
| 4.0x or more | 48 (39.3%) | 9 (14.3%) |
| Total | 122 (100.0%) | 63 (100.0%) |
Real Estate Taxes by Mortgage Status in Northport
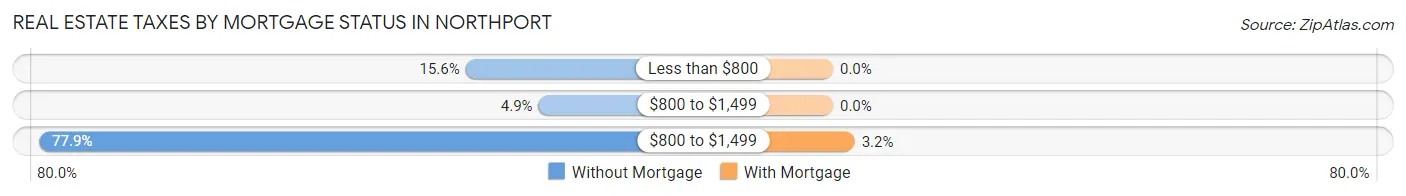
| Property Taxes | Without Mortgage | With Mortgage |
| Less than $800 | 19 (15.6%) | 0 (0.0%) |
| $800 to $1,499 | 6 (4.9%) | 0 (0.0%) |
| $800 to $1,499 | 95 (77.9%) | 2 (3.2%) |
| Total | 122 (100.0%) | 63 (100.0%) |
Health & Disability in Northport
Health Insurance Coverage by Age in Northport
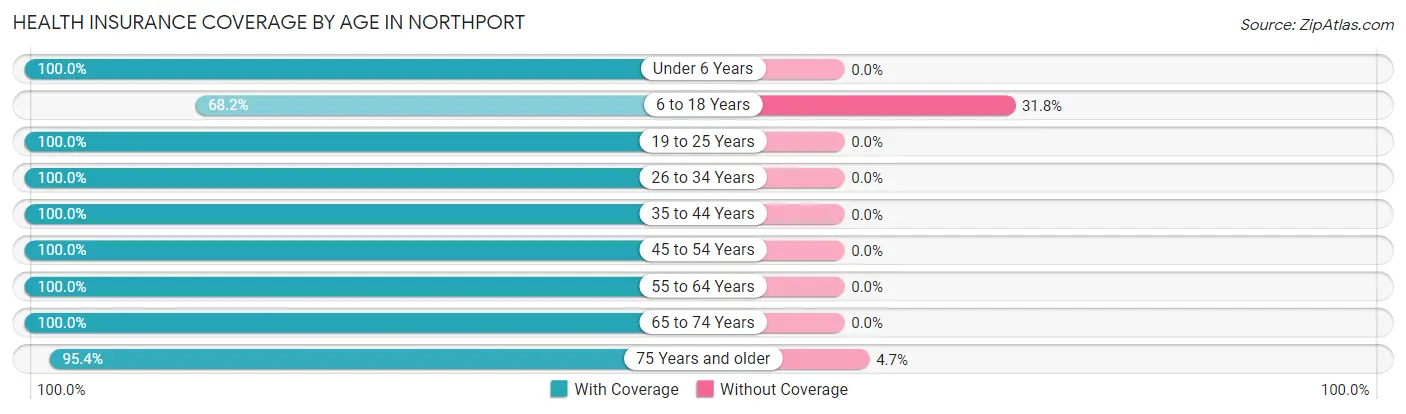
| Age Bracket | With Coverage | Without Coverage |
| Under 6 Years | 36 (100.0%) | 0 (0.0%) |
| 6 to 18 Years | 15 (68.2%) | 7 (31.8%) |
| 19 to 25 Years | 27 (100.0%) | 0 (0.0%) |
| 26 to 34 Years | 22 (100.0%) | 0 (0.0%) |
| 35 to 44 Years | 36 (100.0%) | 0 (0.0%) |
| 45 to 54 Years | 4 (100.0%) | 0 (0.0%) |
| 55 to 64 Years | 56 (100.0%) | 0 (0.0%) |
| 65 to 74 Years | 130 (100.0%) | 0 (0.0%) |
| 75 Years and older | 82 (95.4%) | 4 (4.6%) |
| Total | 408 (97.4%) | 11 (2.6%) |
Health Insurance Coverage by Citizenship Status in Northport
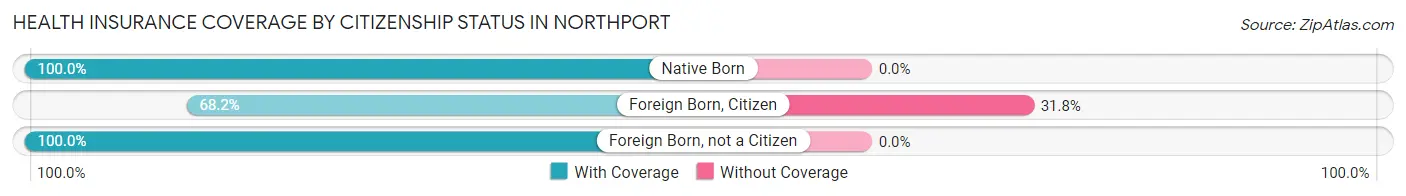
| Citizenship Status | With Coverage | Without Coverage |
| Native Born | 36 (100.0%) | 0 (0.0%) |
| Foreign Born, Citizen | 15 (68.2%) | 7 (31.8%) |
| Foreign Born, not a Citizen | 27 (100.0%) | 0 (0.0%) |
Health Insurance Coverage by Household Income in Northport
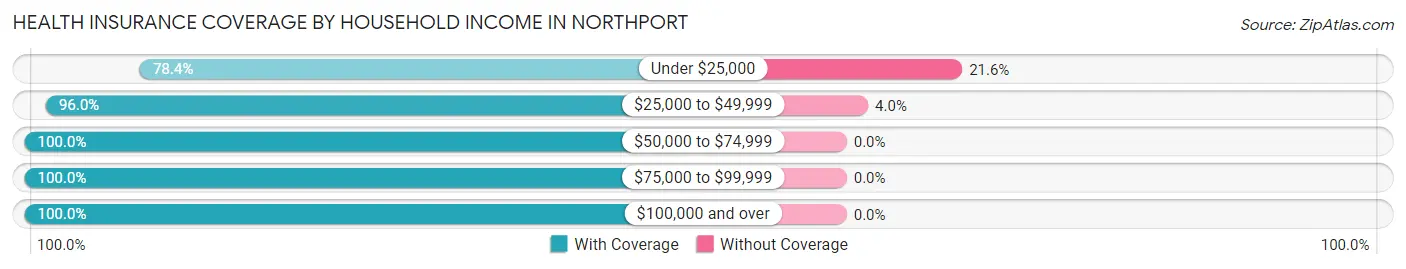
| Household Income | With Coverage | Without Coverage |
| Under $25,000 | 29 (78.4%) | 8 (21.6%) |
| $25,000 to $49,999 | 72 (96.0%) | 3 (4.0%) |
| $50,000 to $74,999 | 84 (100.0%) | 0 (0.0%) |
| $75,000 to $99,999 | 75 (100.0%) | 0 (0.0%) |
| $100,000 and over | 148 (100.0%) | 0 (0.0%) |
Public vs Private Health Insurance Coverage by Age in Northport
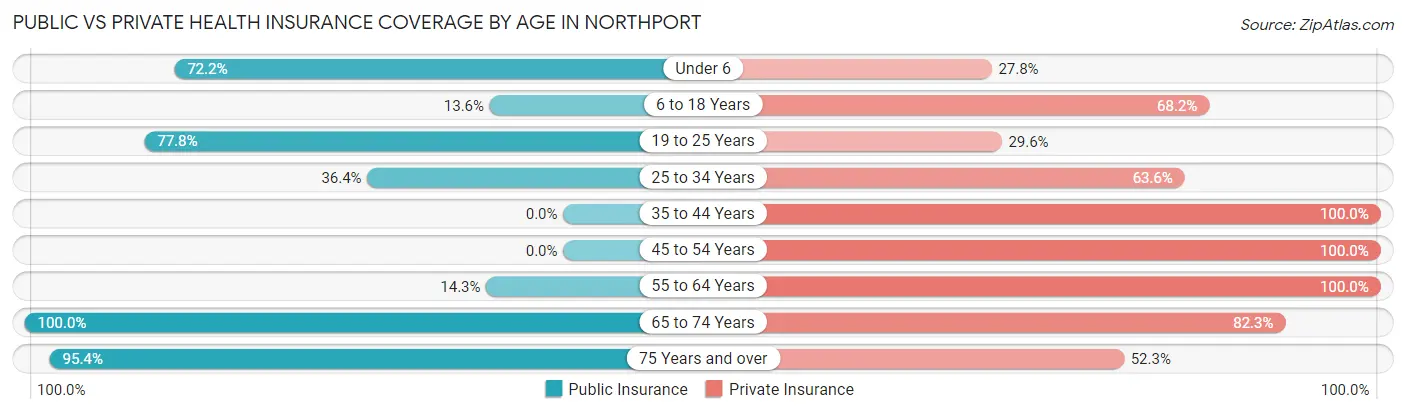
| Age Bracket | Public Insurance | Private Insurance |
| Under 6 | 26 (72.2%) | 10 (27.8%) |
| 6 to 18 Years | 3 (13.6%) | 15 (68.2%) |
| 19 to 25 Years | 21 (77.8%) | 8 (29.6%) |
| 25 to 34 Years | 8 (36.4%) | 14 (63.6%) |
| 35 to 44 Years | 0 (0.0%) | 36 (100.0%) |
| 45 to 54 Years | 0 (0.0%) | 4 (100.0%) |
| 55 to 64 Years | 8 (14.3%) | 56 (100.0%) |
| 65 to 74 Years | 130 (100.0%) | 107 (82.3%) |
| 75 Years and over | 82 (95.4%) | 45 (52.3%) |
| Total | 278 (66.3%) | 295 (70.4%) |
Disability Status by Sex by Age in Northport
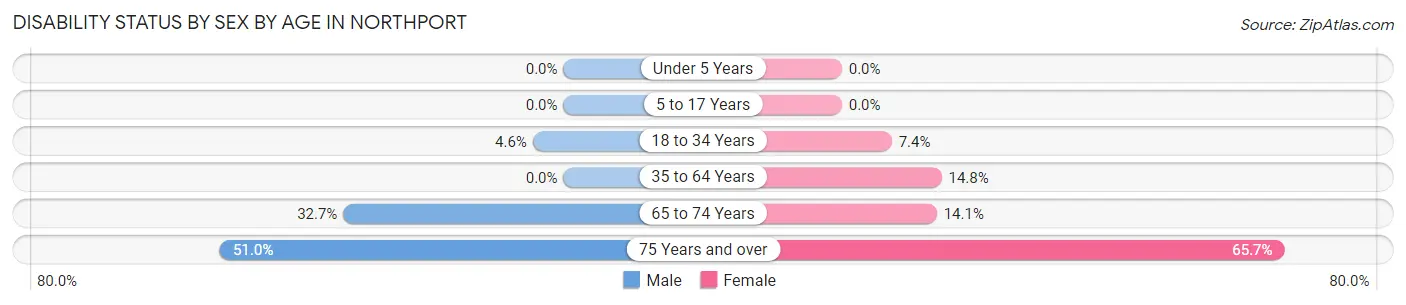
| Age Bracket | Male | Female |
| Under 5 Years | 0 (0.0%) | 0 (0.0%) |
| 5 to 17 Years | 0 (0.0%) | 0 (0.0%) |
| 18 to 34 Years | 1 (4.5%) | 2 (7.4%) |
| 35 to 64 Years | 0 (0.0%) | 8 (14.8%) |
| 65 to 74 Years | 17 (32.7%) | 11 (14.1%) |
| 75 Years and over | 26 (51.0%) | 23 (65.7%) |
Disability Class by Sex by Age in Northport
Disability Class: Hearing Difficulty
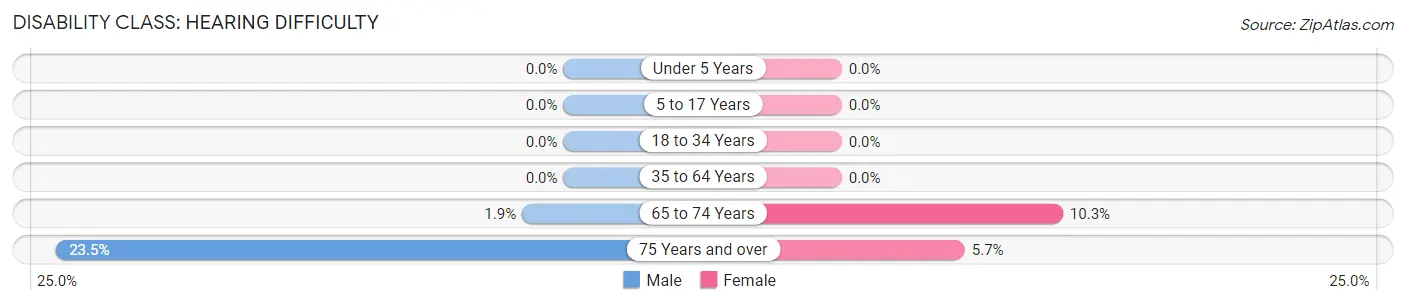
| Age Bracket | Male | Female |
| Under 5 Years | 0 (0.0%) | 0 (0.0%) |
| 5 to 17 Years | 0 (0.0%) | 0 (0.0%) |
| 18 to 34 Years | 0 (0.0%) | 0 (0.0%) |
| 35 to 64 Years | 0 (0.0%) | 0 (0.0%) |
| 65 to 74 Years | 1 (1.9%) | 8 (10.3%) |
| 75 Years and over | 12 (23.5%) | 2 (5.7%) |
Disability Class: Vision Difficulty
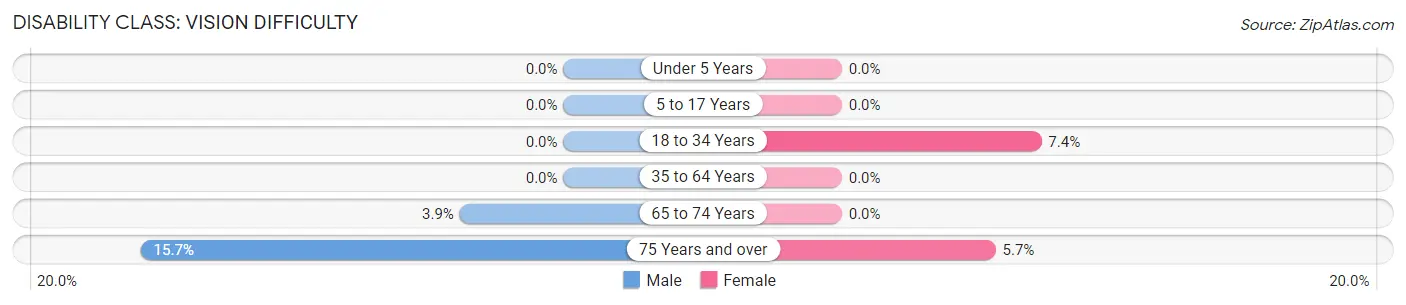
| Age Bracket | Male | Female |
| Under 5 Years | 0 (0.0%) | 0 (0.0%) |
| 5 to 17 Years | 0 (0.0%) | 0 (0.0%) |
| 18 to 34 Years | 0 (0.0%) | 2 (7.4%) |
| 35 to 64 Years | 0 (0.0%) | 0 (0.0%) |
| 65 to 74 Years | 2 (3.8%) | 0 (0.0%) |
| 75 Years and over | 8 (15.7%) | 2 (5.7%) |
Disability Class: Cognitive Difficulty
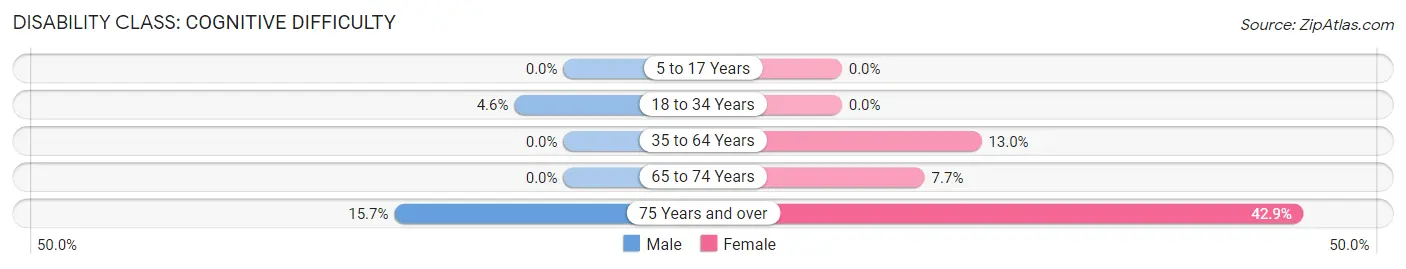
| Age Bracket | Male | Female |
| 5 to 17 Years | 0 (0.0%) | 0 (0.0%) |
| 18 to 34 Years | 1 (4.5%) | 0 (0.0%) |
| 35 to 64 Years | 0 (0.0%) | 7 (13.0%) |
| 65 to 74 Years | 0 (0.0%) | 6 (7.7%) |
| 75 Years and over | 8 (15.7%) | 15 (42.9%) |
Disability Class: Ambulatory Difficulty
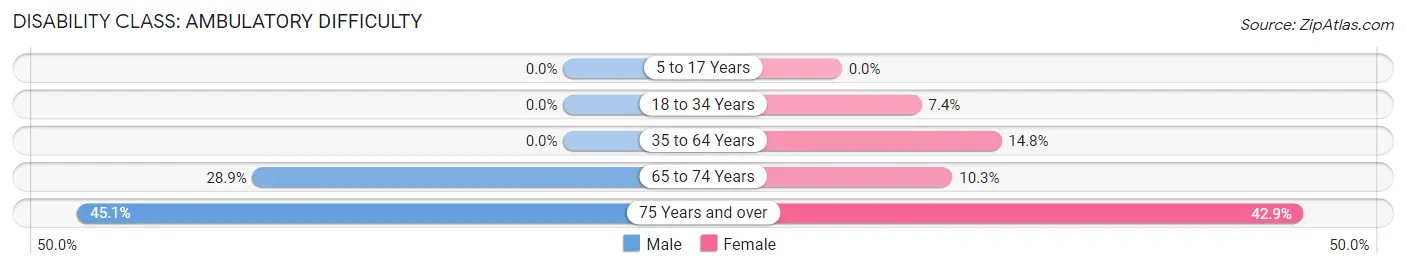
| Age Bracket | Male | Female |
| 5 to 17 Years | 0 (0.0%) | 0 (0.0%) |
| 18 to 34 Years | 0 (0.0%) | 2 (7.4%) |
| 35 to 64 Years | 0 (0.0%) | 8 (14.8%) |
| 65 to 74 Years | 15 (28.8%) | 8 (10.3%) |
| 75 Years and over | 23 (45.1%) | 15 (42.9%) |
Disability Class: Self-Care Difficulty
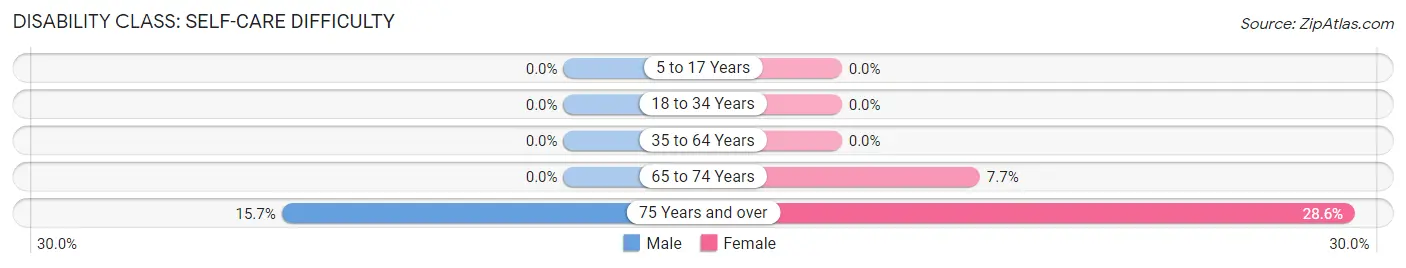
| Age Bracket | Male | Female |
| 5 to 17 Years | 0 (0.0%) | 0 (0.0%) |
| 18 to 34 Years | 0 (0.0%) | 0 (0.0%) |
| 35 to 64 Years | 0 (0.0%) | 0 (0.0%) |
| 65 to 74 Years | 0 (0.0%) | 6 (7.7%) |
| 75 Years and over | 8 (15.7%) | 10 (28.6%) |
Technology Access in Northport
Computing Device Access in Northport
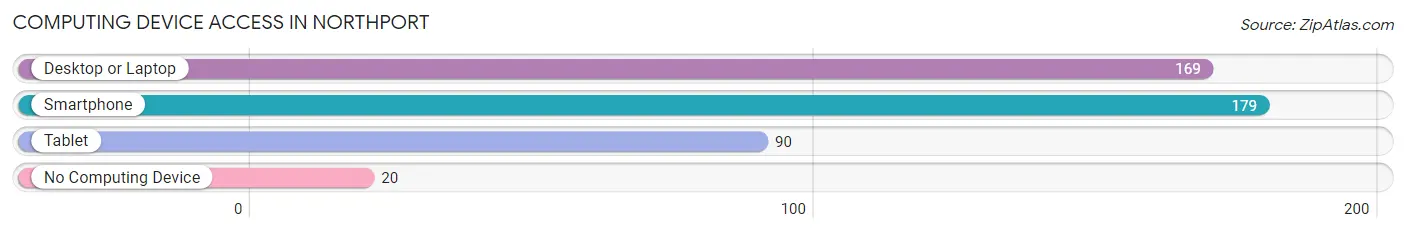
| Device Type | # Households | % Households |
| Desktop or Laptop | 169 | 80.9% |
| Smartphone | 179 | 85.7% |
| Tablet | 90 | 43.1% |
| No Computing Device | 20 | 9.6% |
| Total | 209 | 100.0% |
Internet Access in Northport
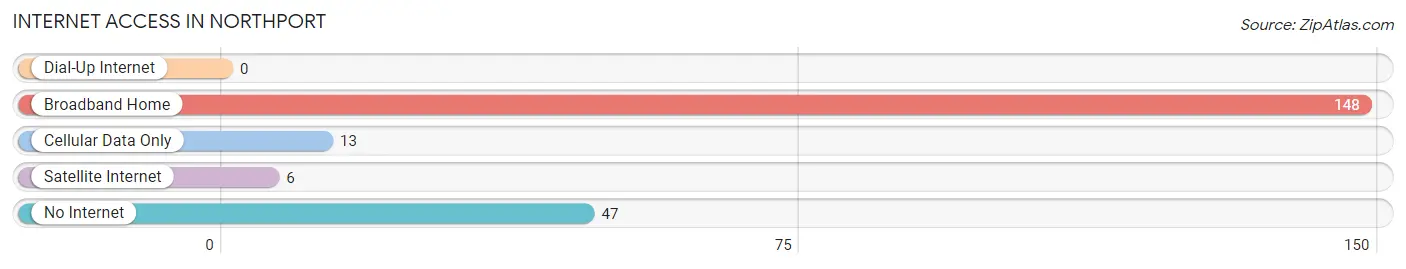
| Internet Type | # Households | % Households |
| Dial-Up Internet | 0 | 0.0% |
| Broadband Home | 148 | 70.8% |
| Cellular Data Only | 13 | 6.2% |
| Satellite Internet | 6 | 2.9% |
| No Internet | 47 | 22.5% |
| Total | 209 | 100.0% |
Northport Summary
Northport is a small village located in Leelanau County, Michigan. It is situated on the Leelanau Peninsula, which is a popular tourist destination in the state. The village is located on the shores of Grand Traverse Bay, and is home to a population of just over 500 people.
History
Northport was first settled in 1855 by a group of settlers from New York. The village was originally known as Northport Station, and was a stop on the Grand Rapids and Indiana Railroad. The village was officially incorporated in 1891.
In the early 1900s, Northport was a popular tourist destination, with many visitors coming to the area to enjoy the natural beauty of the Leelanau Peninsula. The village was also home to a number of resorts, including the Northport Hotel, which was built in 1906.
In the 1950s, Northport began to experience a decline in tourism, as more people began to visit other parts of the state. This decline continued until the late 1970s, when the village began to experience a resurgence in popularity. Today, Northport is a popular tourist destination, with many visitors coming to the area to enjoy the natural beauty of the Leelanau Peninsula.
Geography
Northport is located on the Leelanau Peninsula, which is a popular tourist destination in the state. The village is situated on the shores of Grand Traverse Bay, and is home to a population of just over 500 people.
The village is located in the northwest corner of Leelanau County, and is bordered by the townships of Leland, Bingham, and Solon. The village is located approximately 25 miles north of Traverse City, and is accessible by US-31.
Economy
The economy of Northport is largely based on tourism. The village is home to a number of resorts, restaurants, and other businesses that cater to visitors. The village is also home to a number of wineries, which attract visitors from all over the state.
In addition to tourism, Northport is also home to a number of small businesses, including a grocery store, a hardware store, and a number of other retail establishments. The village is also home to a number of art galleries, which showcase the work of local artists.
Demographics
As of the 2010 census, the population of Northport was 514. The racial makeup of the village was 97.3% White, 0.6% African American, 0.2% Native American, 0.4% Asian, 0.2% from other races, and 1.3% from two or more races. Hispanic or Latino of any race were 1.2% of the population.
The median income for a household in the village was $41,250, and the median income for a family was $50,000. The per capita income for the village was $20,945. About 8.3% of families and 11.2% of the population were below the poverty line, including 16.7% of those under age 18 and 4.3% of those age 65 or over.
Common Questions
What is Per Capita Income in Northport?
Per Capita income in Northport is $64,150.
What is the Median Family Income in Northport?
Median Family Income in Northport is $82,917.
What is the Median Household income in Northport?
Median Household Income in Northport is $68,393.
What is Income or Wage Gap in Northport?
Income or Wage Gap in Northport is 19.7%.
Women in Northport earn 80.3 cents for every dollar earned by a man.
What is Inequality or Gini Index in Northport?
Inequality or Gini Index in Northport is 0.56.
What is the Total Population of Northport?
Total Population of Northport is 427.
What is the Total Male Population of Northport?
Total Male Population of Northport is 185.
What is the Total Female Population of Northport?
Total Female Population of Northport is 242.
What is the Ratio of Males per 100 Females in Northport?
There are 76.45 Males per 100 Females in Northport.
What is the Ratio of Females per 100 Males in Northport?
There are 130.81 Females per 100 Males in Northport.
What is the Median Population Age in Northport?
Median Population Age in Northport is 65.6 Years.
What is the Average Family Size in Northport
Average Family Size in Northport is 2.9 People.
What is the Average Household Size in Northport
Average Household Size in Northport is 2.0 People.
How Large is the Labor Force in Northport?
There are 157 People in the Labor Forcein in Northport.
What is the Percentage of People in the Labor Force in Northport?
41.9% of People are in the Labor Force in Northport.
What is the Unemployment Rate in Northport?
Unemployment Rate in Northport is 2.5%.