Newaygo, MI Map & Demographics
Newaygo Map
Newaygo Overview
$29,400
PER CAPITA INCOME
$64,833
AVG FAMILY INCOME
$45,733
AVG HOUSEHOLD INCOME
10.6%
WAGE / INCOME GAP [ % ]
89.4¢/ $1
WAGE / INCOME GAP [ $ ]
0.53
INEQUALITY / GINI INDEX
2,458
TOTAL POPULATION
1,240
MALE POPULATION
1,218
FEMALE POPULATION
101.81
MALES / 100 FEMALES
98.23
FEMALES / 100 MALES
35.2
MEDIAN AGE
3.3
AVG FAMILY SIZE
2.6
AVG HOUSEHOLD SIZE
1,128
LABOR FORCE [ PEOPLE ]
58.7%
PERCENT IN LABOR FORCE
5.9%
UNEMPLOYMENT RATE
Newaygo Zip Codes
Newaygo Area Codes
Income in Newaygo
Income Overview in Newaygo
Per Capita Income in Newaygo is $29,400, while median incomes of families and households are $64,833 and $45,733 respectively.
| Characteristic | Number | Measure |
| Per Capita Income | 2,458 | $29,400 |
| Median Family Income | 618 | $64,833 |
| Mean Family Income | 618 | $88,961 |
| Median Household Income | 957 | $45,733 |
| Mean Household Income | 957 | $66,200 |
| Income Deficit | 618 | $0 |
| Wage / Income Gap (%) | 2,458 | 10.63% |
| Wage / Income Gap ($) | 2,458 | 89.37¢ per $1 |
| Gini / Inequality Index | 2,458 | 0.53 |
Earnings by Sex in Newaygo
Average Earnings in Newaygo are $32,257, $33,667 for men and $30,089 for women, a difference of 10.6%.
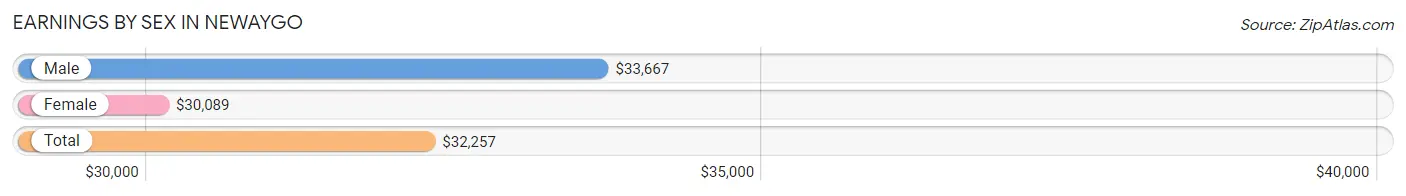
| Sex | Number | Average Earnings |
| Male | 626 (55.9%) | $33,667 |
| Female | 493 (44.1%) | $30,089 |
| Total | 1,119 (100.0%) | $32,257 |
Earnings by Sex by Income Bracket in Newaygo
The most common earnings brackets in Newaygo are $35,000 to $39,999 for men (79 | 12.6%) and $55,000 to $64,999 for women (78 | 15.8%).
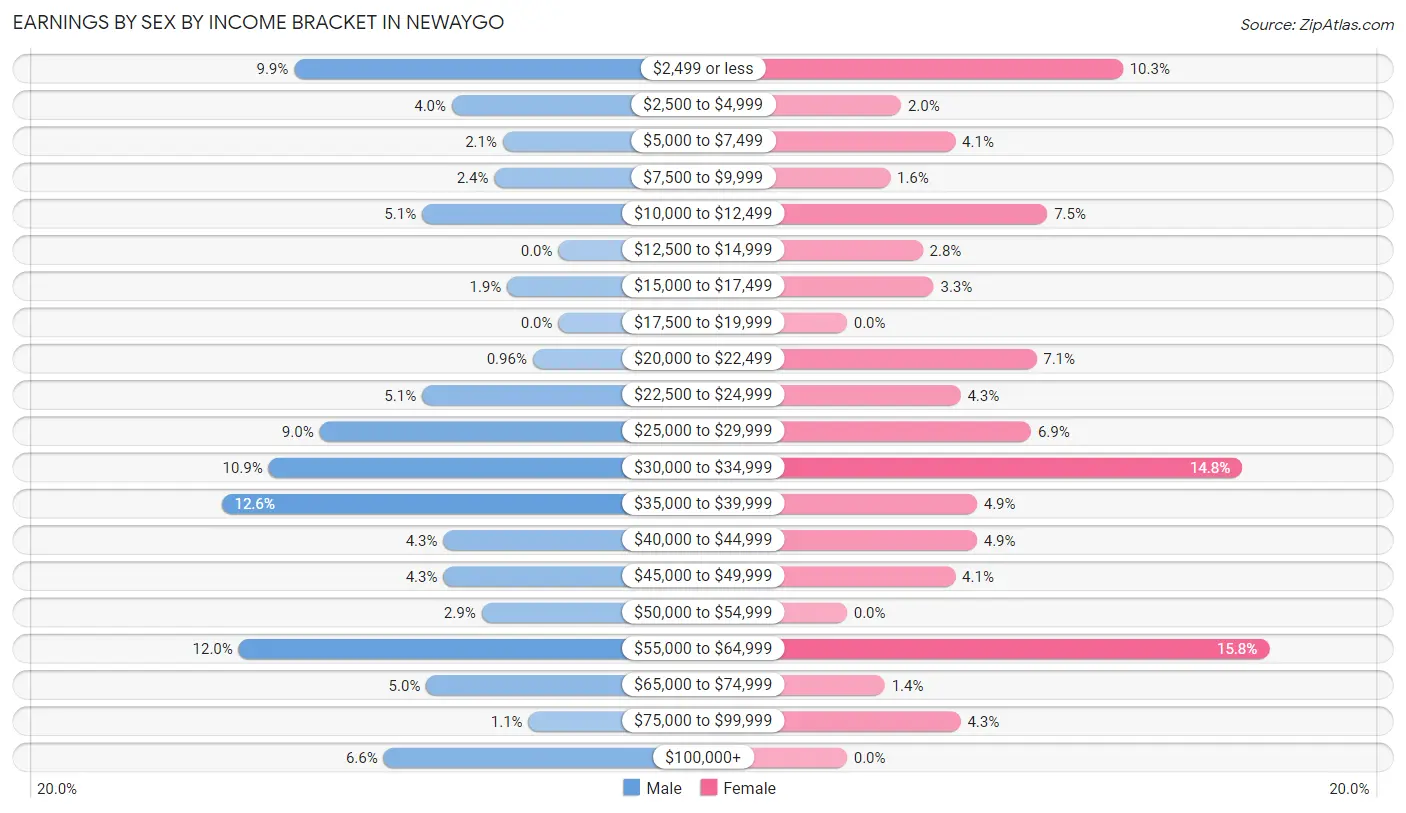
| Income | Male | Female |
| $2,499 or less | 62 (9.9%) | 51 (10.3%) |
| $2,500 to $4,999 | 25 (4.0%) | 10 (2.0%) |
| $5,000 to $7,499 | 13 (2.1%) | 20 (4.1%) |
| $7,500 to $9,999 | 15 (2.4%) | 8 (1.6%) |
| $10,000 to $12,499 | 32 (5.1%) | 37 (7.5%) |
| $12,500 to $14,999 | 0 (0.0%) | 14 (2.8%) |
| $15,000 to $17,499 | 12 (1.9%) | 16 (3.3%) |
| $17,500 to $19,999 | 0 (0.0%) | 0 (0.0%) |
| $20,000 to $22,499 | 6 (1.0%) | 35 (7.1%) |
| $22,500 to $24,999 | 32 (5.1%) | 21 (4.3%) |
| $25,000 to $29,999 | 56 (8.9%) | 34 (6.9%) |
| $30,000 to $34,999 | 68 (10.9%) | 73 (14.8%) |
| $35,000 to $39,999 | 79 (12.6%) | 24 (4.9%) |
| $40,000 to $44,999 | 27 (4.3%) | 24 (4.9%) |
| $45,000 to $49,999 | 27 (4.3%) | 20 (4.1%) |
| $50,000 to $54,999 | 18 (2.9%) | 0 (0.0%) |
| $55,000 to $64,999 | 75 (12.0%) | 78 (15.8%) |
| $65,000 to $74,999 | 31 (5.0%) | 7 (1.4%) |
| $75,000 to $99,999 | 7 (1.1%) | 21 (4.3%) |
| $100,000+ | 41 (6.6%) | 0 (0.0%) |
| Total | 626 (100.0%) | 493 (100.0%) |
Earnings by Sex by Educational Attainment in Newaygo
Average earnings in Newaygo are $38,750 for men and $32,733 for women, a difference of 15.5%. Men with an educational attainment of bachelor's degree enjoy the highest average annual earnings of $100,536, while those with high school diploma education earn the least with $29,870. Women with an educational attainment of college or associate's degree earn the most with the average annual earnings of $34,250, while those with high school diploma education have the smallest earnings of $26,010.
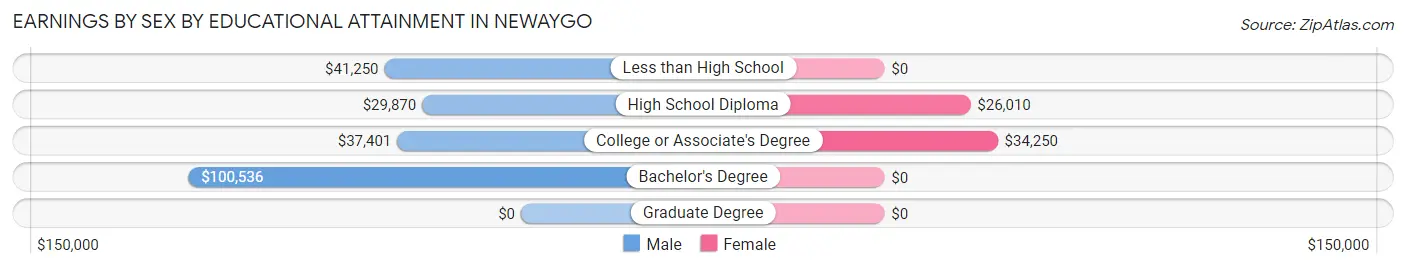
| Educational Attainment | Male Income | Female Income |
| Less than High School | $41,250 | $0 |
| High School Diploma | $29,870 | $26,010 |
| College or Associate's Degree | $37,401 | $34,250 |
| Bachelor's Degree | $100,536 | $0 |
| Graduate Degree | - | - |
| Total | $38,750 | $32,733 |
Family Income in Newaygo
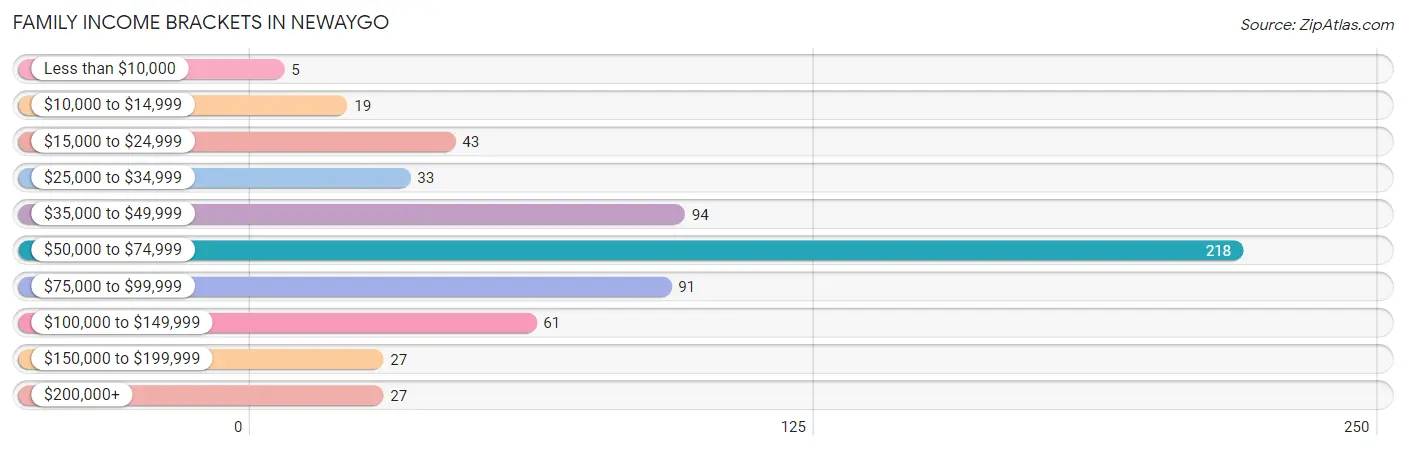
Family Income Brackets in Newaygo
According to the Newaygo family income data, there are 218 families falling into the $50,000 to $74,999 income range, which is the most common income bracket and makes up 35.3% of all families. Conversely, the less than $10,000 income bracket is the least frequent group with only 5 families (0.8%) belonging to this category.
| Income Bracket | # Families | % Families |
| Less than $10,000 | 5 | 0.8% |
| $10,000 to $14,999 | 19 | 3.1% |
| $15,000 to $24,999 | 43 | 7.0% |
| $25,000 to $34,999 | 33 | 5.3% |
| $35,000 to $49,999 | 94 | 15.2% |
| $50,000 to $74,999 | 218 | 35.3% |
| $75,000 to $99,999 | 91 | 14.7% |
| $100,000 to $149,999 | 61 | 9.9% |
| $150,000 to $199,999 | 27 | 4.4% |
| $200,000+ | 27 | 4.4% |
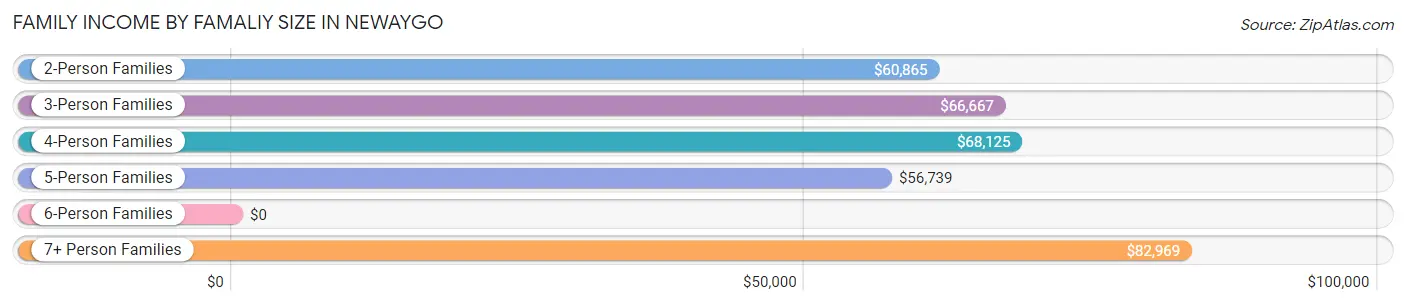
Family Income by Famaliy Size in Newaygo
7+ person families (29 | 4.7%) account for the highest median family income in Newaygo with $82,969 per family, while 2-person families (249 | 40.3%) have the highest median income of $30,432 per family member.
| Income Bracket | # Families | Median Income |
| 2-Person Families | 249 (40.3%) | $60,865 |
| 3-Person Families | 176 (28.5%) | $66,667 |
| 4-Person Families | 120 (19.4%) | $68,125 |
| 5-Person Families | 32 (5.2%) | $56,739 |
| 6-Person Families | 12 (1.9%) | $0 |
| 7+ Person Families | 29 (4.7%) | $82,969 |
| Total | 618 (100.0%) | $64,833 |
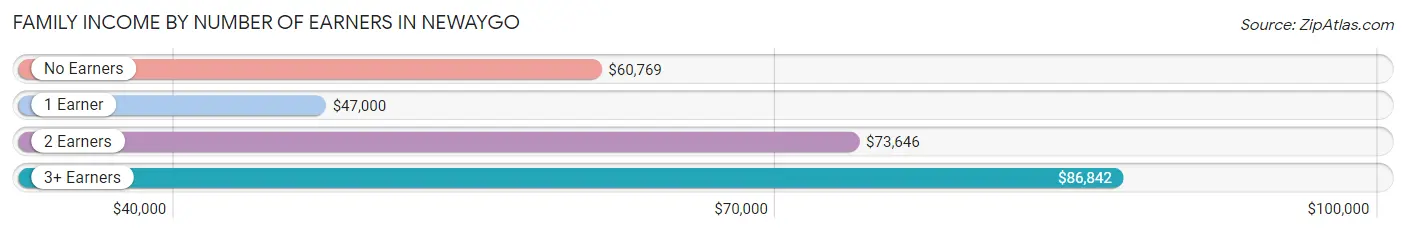
Family Income by Number of Earners in Newaygo
The median family income in Newaygo is $64,833, with families comprising 3+ earners (72) having the highest median family income of $86,842, while families with 1 earner (198) have the lowest median family income of $47,000, accounting for 11.7% and 32.0% of families, respectively.
| Number of Earners | # Families | Median Income |
| No Earners | 112 (18.1%) | $60,769 |
| 1 Earner | 198 (32.0%) | $47,000 |
| 2 Earners | 236 (38.2%) | $73,646 |
| 3+ Earners | 72 (11.7%) | $86,842 |
| Total | 618 (100.0%) | $64,833 |
Household Income in Newaygo
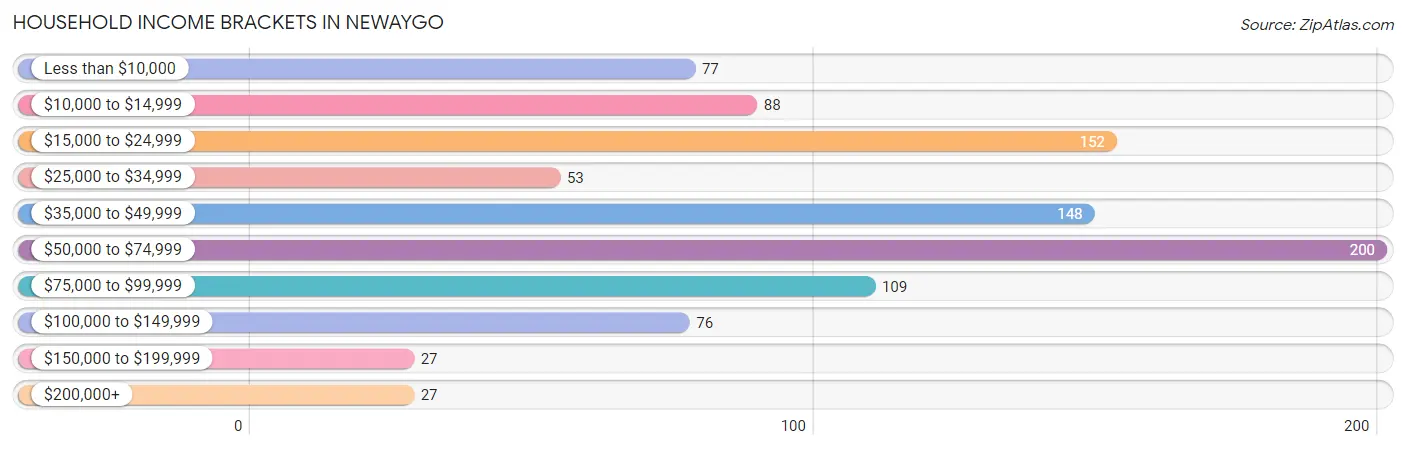
Household Income Brackets in Newaygo
With 200 households falling in the category, the $50,000 to $74,999 income range is the most frequent in Newaygo, accounting for 20.9% of all households. In contrast, only 27 households (2.8%) fall into the $150,000 to $199,999 income bracket, making it the least populous group.
| Income Bracket | # Households | % Households |
| Less than $10,000 | 77 | 8.0% |
| $10,000 to $14,999 | 88 | 9.2% |
| $15,000 to $24,999 | 152 | 15.9% |
| $25,000 to $34,999 | 53 | 5.5% |
| $35,000 to $49,999 | 148 | 15.5% |
| $50,000 to $74,999 | 200 | 20.9% |
| $75,000 to $99,999 | 109 | 11.4% |
| $100,000 to $149,999 | 76 | 7.9% |
| $150,000 to $199,999 | 27 | 2.8% |
| $200,000+ | 27 | 2.8% |
Household Income by Householder Age in Newaygo
The median household income in Newaygo is $45,733, with the highest median household income of $57,724 found in the 25 to 44 years age bracket for the primary householder. A total of 335 households (35.0%) fall into this category. Meanwhile, the 65+ years age bracket for the primary householder has the lowest median household income of $25,536, with 231 households (24.1%) in this group.
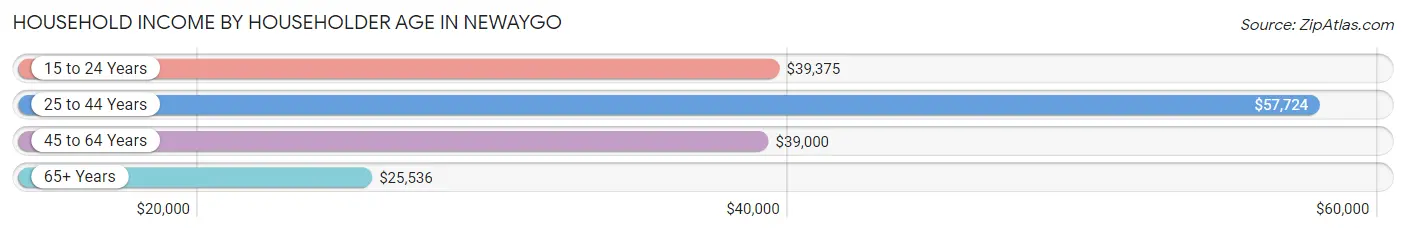
| Income Bracket | # Households | Median Income |
| 15 to 24 Years | 29 (3.0%) | $39,375 |
| 25 to 44 Years | 335 (35.0%) | $57,724 |
| 45 to 64 Years | 362 (37.8%) | $39,000 |
| 65+ Years | 231 (24.1%) | $25,536 |
| Total | 957 (100.0%) | $45,733 |
Poverty in Newaygo
Income Below Poverty by Sex and Age in Newaygo
With 11.7% poverty level for males and 21.3% for females among the residents of Newaygo, 5 year old males and under 5 year old females are the most vulnerable to poverty, with 14 males (100.0%) and 23 females (44.2%) in their respective age groups living below the poverty level.
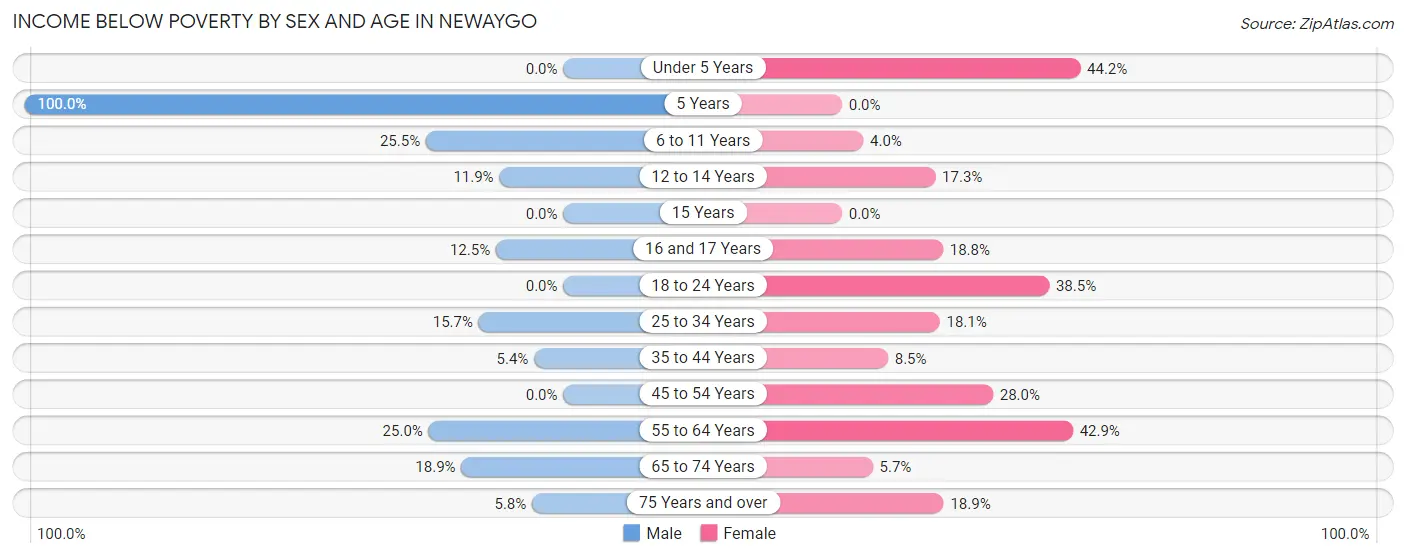
| Age Bracket | Male | Female |
| Under 5 Years | 0 (0.0%) | 23 (44.2%) |
| 5 Years | 14 (100.0%) | 0 (0.0%) |
| 6 to 11 Years | 38 (25.5%) | 4 (4.0%) |
| 12 to 14 Years | 7 (11.9%) | 13 (17.3%) |
| 15 Years | 0 (0.0%) | 0 (0.0%) |
| 16 and 17 Years | 8 (12.5%) | 6 (18.8%) |
| 18 to 24 Years | 0 (0.0%) | 35 (38.5%) |
| 25 to 34 Years | 19 (15.7%) | 37 (18.1%) |
| 35 to 44 Years | 10 (5.4%) | 14 (8.5%) |
| 45 to 54 Years | 0 (0.0%) | 37 (28.0%) |
| 55 to 64 Years | 31 (25.0%) | 63 (42.9%) |
| 65 to 74 Years | 14 (18.9%) | 6 (5.7%) |
| 75 Years and over | 4 (5.8%) | 20 (18.9%) |
| Total | 145 (11.7%) | 258 (21.3%) |
Income Above Poverty by Sex and Age in Newaygo
According to the poverty statistics in Newaygo, males aged under 5 years and females aged 6 to 11 years are the age groups that are most secure financially, with 100.0% of males and 96.0% of females in these age groups living above the poverty line.
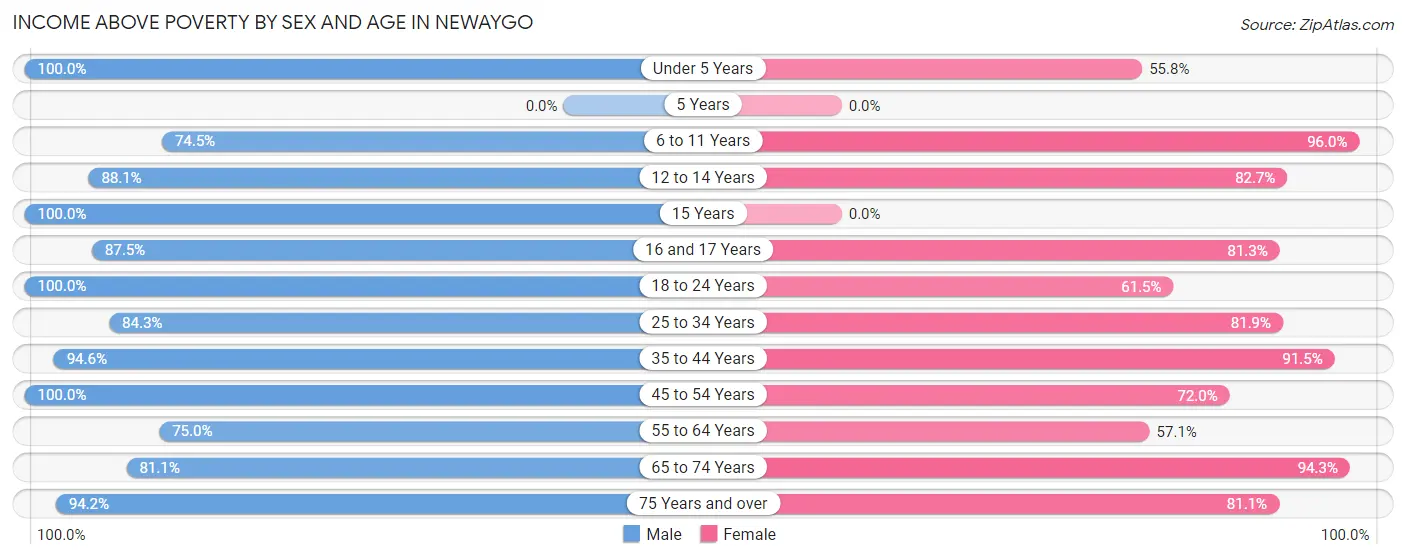
| Age Bracket | Male | Female |
| Under 5 Years | 59 (100.0%) | 29 (55.8%) |
| 5 Years | 0 (0.0%) | 0 (0.0%) |
| 6 to 11 Years | 111 (74.5%) | 97 (96.0%) |
| 12 to 14 Years | 52 (88.1%) | 62 (82.7%) |
| 15 Years | 23 (100.0%) | 0 (0.0%) |
| 16 and 17 Years | 56 (87.5%) | 26 (81.2%) |
| 18 to 24 Years | 176 (100.0%) | 56 (61.5%) |
| 25 to 34 Years | 102 (84.3%) | 167 (81.9%) |
| 35 to 44 Years | 175 (94.6%) | 150 (91.5%) |
| 45 to 54 Years | 118 (100.0%) | 95 (72.0%) |
| 55 to 64 Years | 93 (75.0%) | 84 (57.1%) |
| 65 to 74 Years | 60 (81.1%) | 99 (94.3%) |
| 75 Years and over | 65 (94.2%) | 86 (81.1%) |
| Total | 1,090 (88.3%) | 951 (78.7%) |
Income Below Poverty Among Married-Couple Families in Newaygo
The poverty statistics for married-couple families in Newaygo show that 6.4% or 25 of the total 392 families live below the poverty line. Families with 1 or 2 children have the highest poverty rate of 14.3%, comprising of 17 families. On the other hand, families with no children have the lowest poverty rate of 2.2%, which includes 5 families.
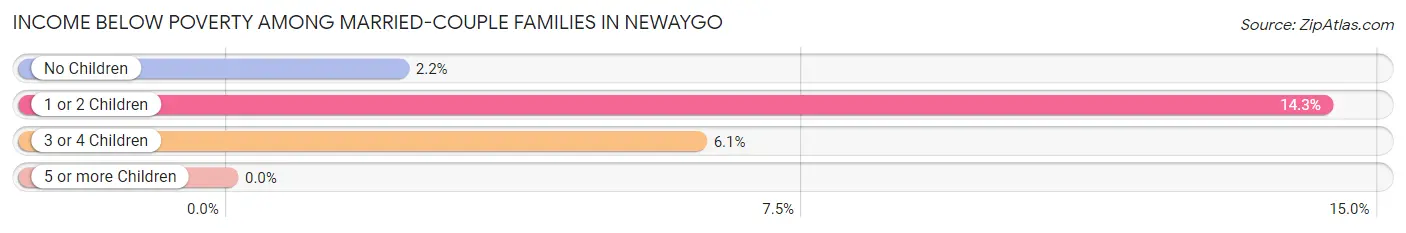
| Children | Above Poverty | Below Poverty |
| No Children | 219 (97.8%) | 5 (2.2%) |
| 1 or 2 Children | 102 (85.7%) | 17 (14.3%) |
| 3 or 4 Children | 46 (93.9%) | 3 (6.1%) |
| 5 or more Children | 0 (0.0%) | 0 (0.0%) |
| Total | 367 (93.6%) | 25 (6.4%) |
Income Below Poverty Among Single-Parent Households in Newaygo
According to the poverty data in Newaygo, 7.2% or 8 single-father households and 18.3% or 21 single-mother households are living below the poverty line. Among single-father households, those with 1 or 2 children have the highest poverty rate, with 8 households (17.0%) experiencing poverty. Likewise, among single-mother households, those with 3 or 4 children have the highest poverty rate, with 16 households (29.1%) falling below the poverty line.
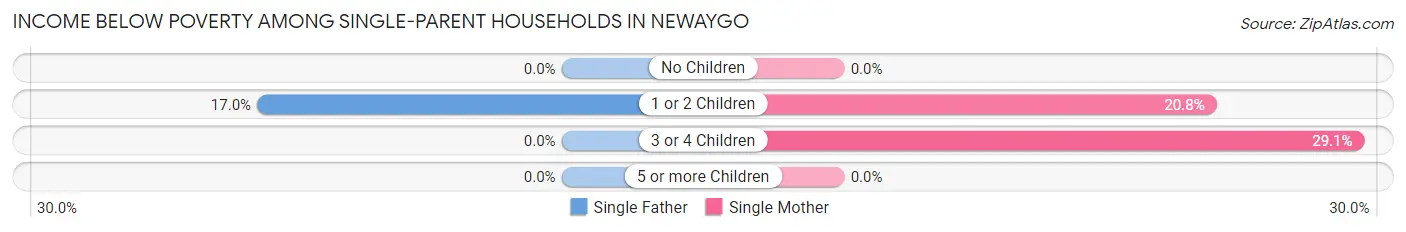
| Children | Single Father | Single Mother |
| No Children | 0 (0.0%) | 0 (0.0%) |
| 1 or 2 Children | 8 (17.0%) | 5 (20.8%) |
| 3 or 4 Children | 0 (0.0%) | 16 (29.1%) |
| 5 or more Children | 0 (0.0%) | 0 (0.0%) |
| Total | 8 (7.2%) | 21 (18.3%) |
Income Below Poverty Among Married-Couple vs Single-Parent Households in Newaygo
The poverty data for Newaygo shows that 25 of the married-couple family households (6.4%) and 29 of the single-parent households (12.8%) are living below the poverty level. Within the married-couple family households, those with 1 or 2 children have the highest poverty rate, with 17 households (14.3%) falling below the poverty line. Among the single-parent households, those with 3 or 4 children have the highest poverty rate, with 16 household (29.1%) living below poverty.
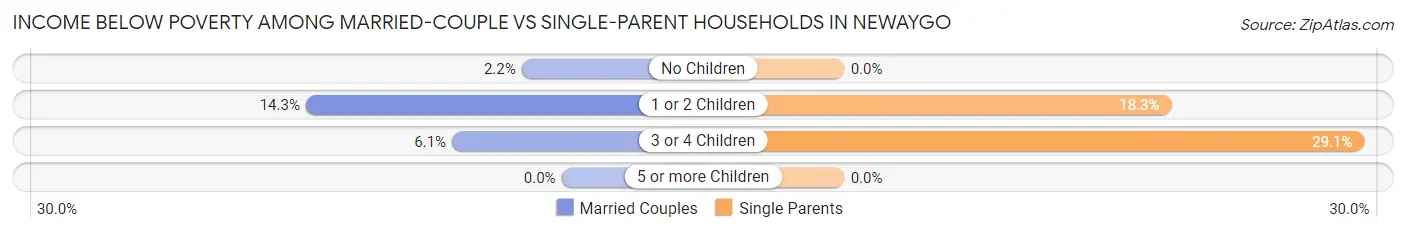
| Children | Married-Couple Families | Single-Parent Households |
| No Children | 5 (2.2%) | 0 (0.0%) |
| 1 or 2 Children | 17 (14.3%) | 13 (18.3%) |
| 3 or 4 Children | 3 (6.1%) | 16 (29.1%) |
| 5 or more Children | 0 (0.0%) | 0 (0.0%) |
| Total | 25 (6.4%) | 29 (12.8%) |
Race in Newaygo
The most populous races in Newaygo are White / Caucasian (2,234 | 90.9%), Two or more Races (166 | 6.8%), and Hispanic or Latino (133 | 5.4%).
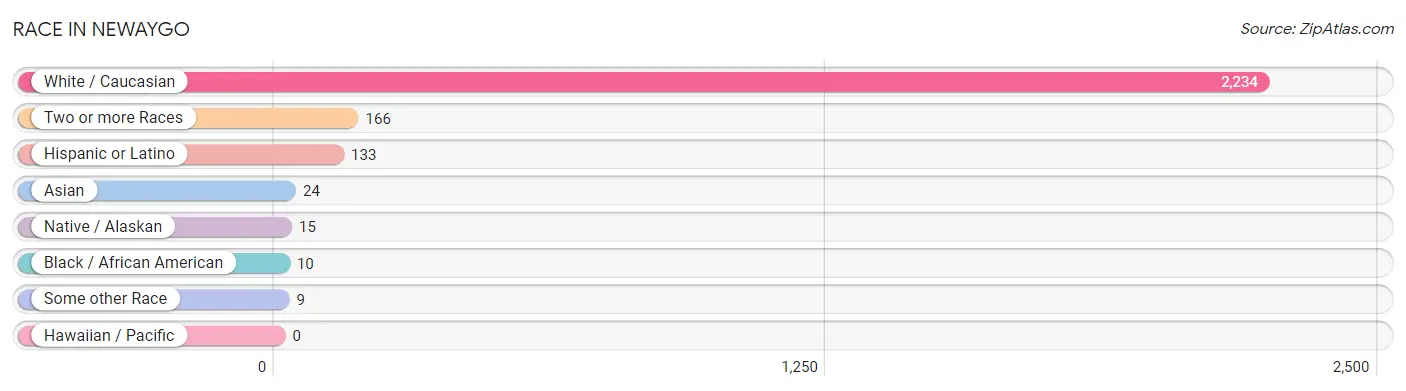
| Race | # Population | % Population |
| Asian | 24 | 1.0% |
| Black / African American | 10 | 0.4% |
| Hawaiian / Pacific | 0 | 0.0% |
| Hispanic or Latino | 133 | 5.4% |
| Native / Alaskan | 15 | 0.6% |
| White / Caucasian | 2,234 | 90.9% |
| Two or more Races | 166 | 6.8% |
| Some other Race | 9 | 0.4% |
| Total | 2,458 | 100.0% |
Ancestry in Newaygo
The most populous ancestries reported in Newaygo are German (369 | 15.0%), English (217 | 8.8%), French (157 | 6.4%), Irish (151 | 6.1%), and Mexican (119 | 4.8%), together accounting for 41.2% of all Newaygo residents.
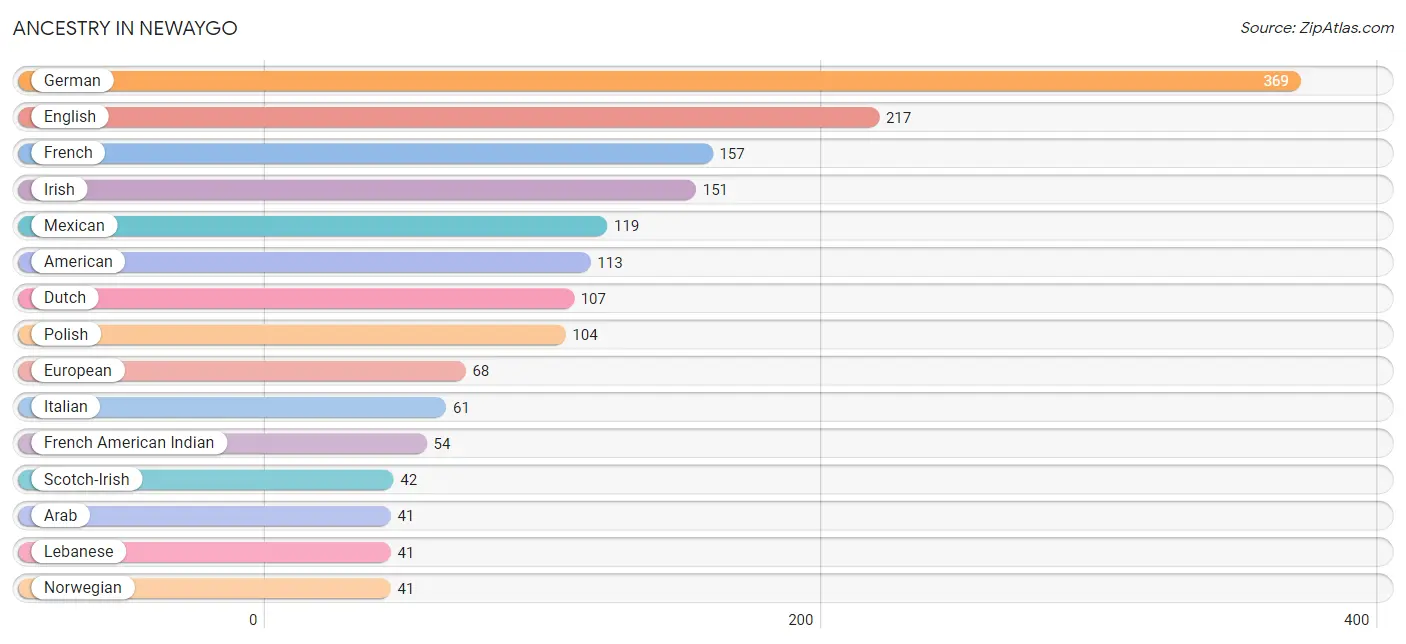
| Ancestry | # Population | % Population |
| American | 113 | 4.6% |
| Arab | 41 | 1.7% |
| Austrian | 19 | 0.8% |
| Czech | 33 | 1.3% |
| Czechoslovakian | 5 | 0.2% |
| Danish | 6 | 0.2% |
| Dutch | 107 | 4.3% |
| English | 217 | 8.8% |
| European | 68 | 2.8% |
| French | 157 | 6.4% |
| French American Indian | 54 | 2.2% |
| French Canadian | 16 | 0.6% |
| German | 369 | 15.0% |
| Irish | 151 | 6.1% |
| Italian | 61 | 2.5% |
| Korean | 35 | 1.4% |
| Lebanese | 41 | 1.7% |
| Mexican | 119 | 4.8% |
| Norwegian | 41 | 1.7% |
| Polish | 104 | 4.2% |
| Puerto Rican | 14 | 0.6% |
| Scotch-Irish | 42 | 1.7% |
| Scottish | 25 | 1.0% |
| Swedish | 28 | 1.1% |
| Thai | 15 | 0.6% |
| Welsh | 6 | 0.2% |
| Yugoslavian | 5 | 0.2% | View All 27 Rows |
Immigrants in Newaygo
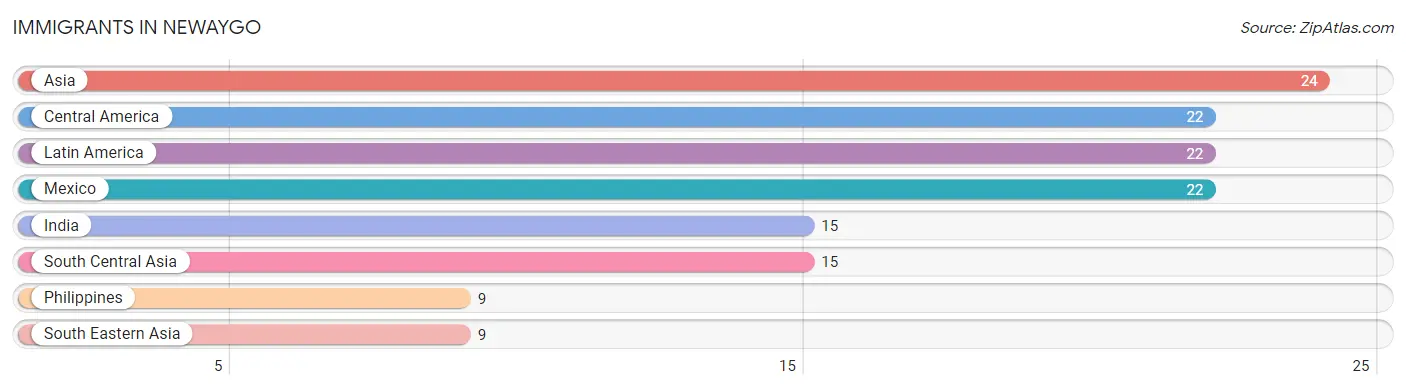
The most numerous immigrant groups reported in Newaygo came from Asia (24 | 1.0%), Central America (22 | 0.9%), Latin America (22 | 0.9%), Mexico (22 | 0.9%), and India (15 | 0.6%), together accounting for 4.3% of all Newaygo residents.
| Immigration Origin | # Population | % Population |
| Asia | 24 | 1.0% |
| Central America | 22 | 0.9% |
| India | 15 | 0.6% |
| Latin America | 22 | 0.9% |
| Mexico | 22 | 0.9% |
| Philippines | 9 | 0.4% |
| South Central Asia | 15 | 0.6% |
| South Eastern Asia | 9 | 0.4% | View All 8 Rows |
Sex and Age in Newaygo
Sex and Age in Newaygo
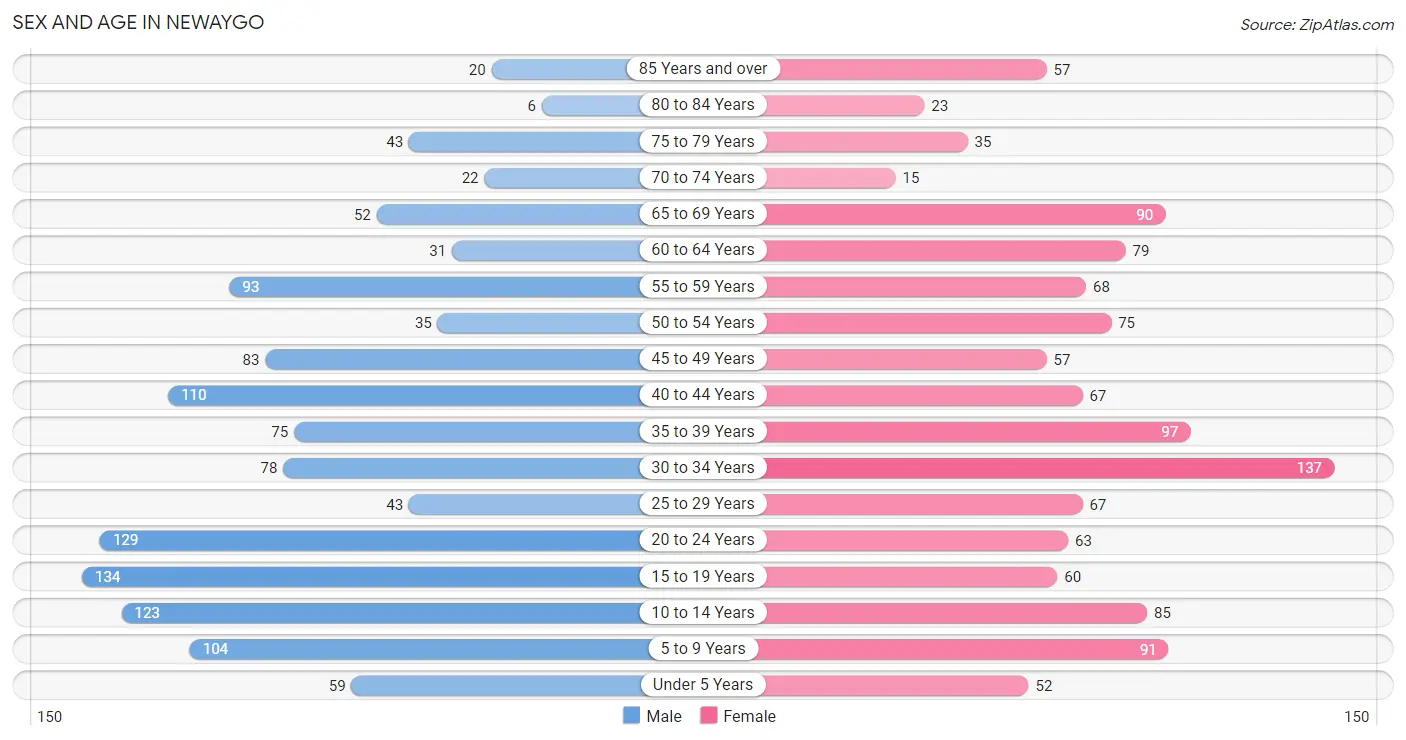
The most populous age groups in Newaygo are 15 to 19 Years (134 | 10.8%) for men and 30 to 34 Years (137 | 11.3%) for women.
| Age Bracket | Male | Female |
| Under 5 Years | 59 (4.8%) | 52 (4.3%) |
| 5 to 9 Years | 104 (8.4%) | 91 (7.5%) |
| 10 to 14 Years | 123 (9.9%) | 85 (7.0%) |
| 15 to 19 Years | 134 (10.8%) | 60 (4.9%) |
| 20 to 24 Years | 129 (10.4%) | 63 (5.2%) |
| 25 to 29 Years | 43 (3.5%) | 67 (5.5%) |
| 30 to 34 Years | 78 (6.3%) | 137 (11.3%) |
| 35 to 39 Years | 75 (6.0%) | 97 (8.0%) |
| 40 to 44 Years | 110 (8.9%) | 67 (5.5%) |
| 45 to 49 Years | 83 (6.7%) | 57 (4.7%) |
| 50 to 54 Years | 35 (2.8%) | 75 (6.2%) |
| 55 to 59 Years | 93 (7.5%) | 68 (5.6%) |
| 60 to 64 Years | 31 (2.5%) | 79 (6.5%) |
| 65 to 69 Years | 52 (4.2%) | 90 (7.4%) |
| 70 to 74 Years | 22 (1.8%) | 15 (1.2%) |
| 75 to 79 Years | 43 (3.5%) | 35 (2.9%) |
| 80 to 84 Years | 6 (0.5%) | 23 (1.9%) |
| 85 Years and over | 20 (1.6%) | 57 (4.7%) |
| Total | 1,240 (100.0%) | 1,218 (100.0%) |
Families and Households in Newaygo
Median Family Size in Newaygo
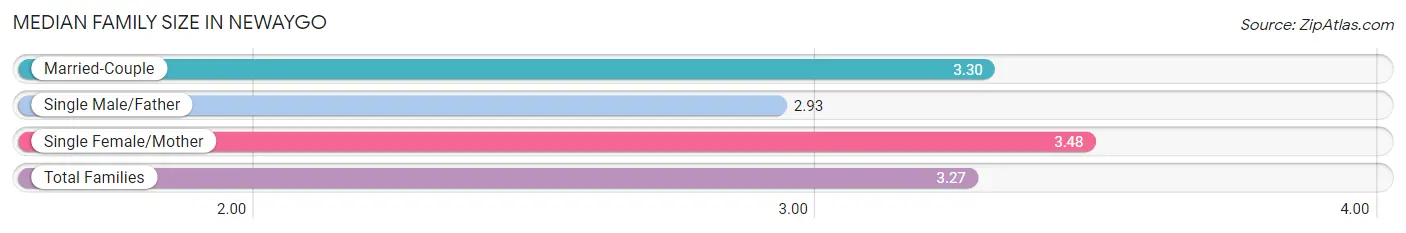
The median family size in Newaygo is 3.27 persons per family, with single female/mother families (115 | 18.6%) accounting for the largest median family size of 3.48 persons per family. On the other hand, single male/father families (111 | 18.0%) represent the smallest median family size with 2.93 persons per family.
| Family Type | # Families | Family Size |
| Married-Couple | 392 (63.4%) | 3.30 |
| Single Male/Father | 111 (18.0%) | 2.93 |
| Single Female/Mother | 115 (18.6%) | 3.48 |
| Total Families | 618 (100.0%) | 3.27 |
Median Household Size in Newaygo
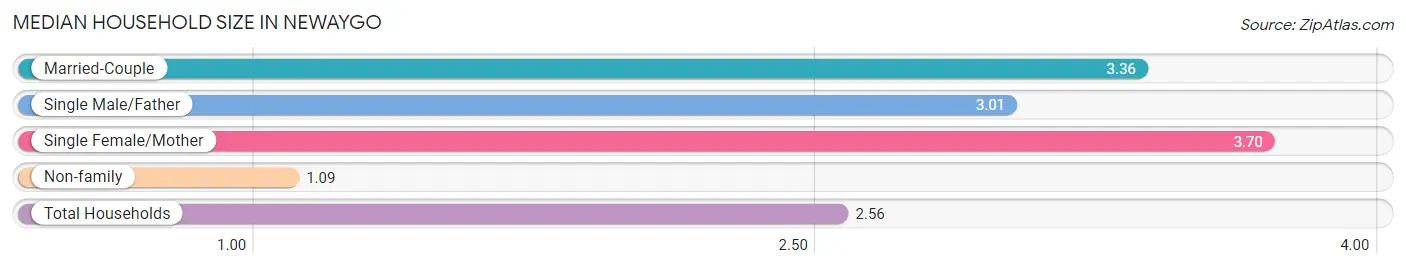
The median household size in Newaygo is 2.56 persons per household, with single female/mother households (115 | 12.0%) accounting for the largest median household size of 3.7 persons per household. non-family households (339 | 35.4%) represent the smallest median household size with 1.09 persons per household.
| Household Type | # Households | Household Size |
| Married-Couple | 392 (41.0%) | 3.36 |
| Single Male/Father | 111 (11.6%) | 3.01 |
| Single Female/Mother | 115 (12.0%) | 3.70 |
| Non-family | 339 (35.4%) | 1.09 |
| Total Households | 957 (100.0%) | 2.56 |
Household Size by Marriage Status in Newaygo
Out of a total of 957 households in Newaygo, 618 (64.6%) are family households, while 339 (35.4%) are nonfamily households. The most numerous type of family households are 2-person households, comprising 242, and the most common type of nonfamily households are 1-person households, comprising 313.
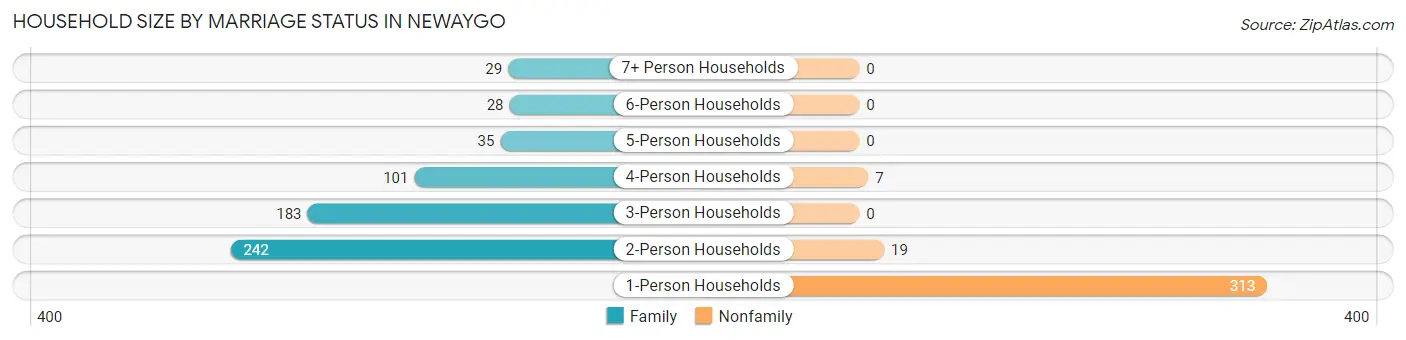
| Household Size | Family Households | Nonfamily Households |
| 1-Person Households | - | 313 (32.7%) |
| 2-Person Households | 242 (25.3%) | 19 (2.0%) |
| 3-Person Households | 183 (19.1%) | 0 (0.0%) |
| 4-Person Households | 101 (10.5%) | 7 (0.7%) |
| 5-Person Households | 35 (3.7%) | 0 (0.0%) |
| 6-Person Households | 28 (2.9%) | 0 (0.0%) |
| 7+ Person Households | 29 (3.0%) | 0 (0.0%) |
| Total | 618 (64.6%) | 339 (35.4%) |
Female Fertility in Newaygo
Fertility by Age in Newaygo
Average fertility rate in Newaygo is 16.0 births per 1,000 women. Women in the age bracket of 20 to 34 years have the highest fertility rate with 34.0 births per 1,000 women. Women in the age bracket of 20 to 34 years acount for 100.0% of all women with births.
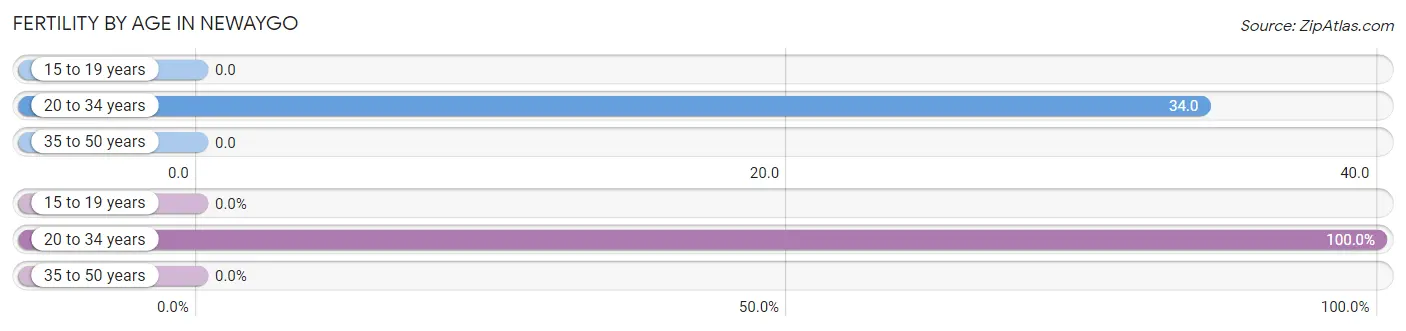
| Age Bracket | Women with Births | Births / 1,000 Women |
| 15 to 19 years | 0 (0.0%) | 0.0 |
| 20 to 34 years | 9 (100.0%) | 34.0 |
| 35 to 50 years | 0 (0.0%) | 0.0 |
| Total | 9 (100.0%) | 16.0 |
Fertility by Age by Marriage Status in Newaygo
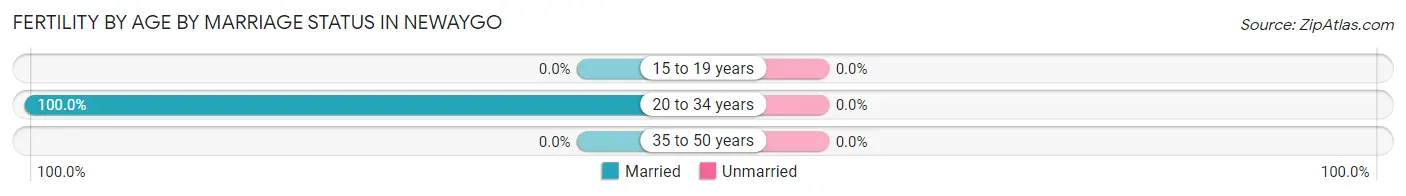
| Age Bracket | Married | Unmarried |
| 15 to 19 years | 0 (0.0%) | 0 (0.0%) |
| 20 to 34 years | 9 (100.0%) | 0 (0.0%) |
| 35 to 50 years | 0 (0.0%) | 0 (0.0%) |
| Total | 9 (100.0%) | 0 (0.0%) |
Fertility by Education in Newaygo
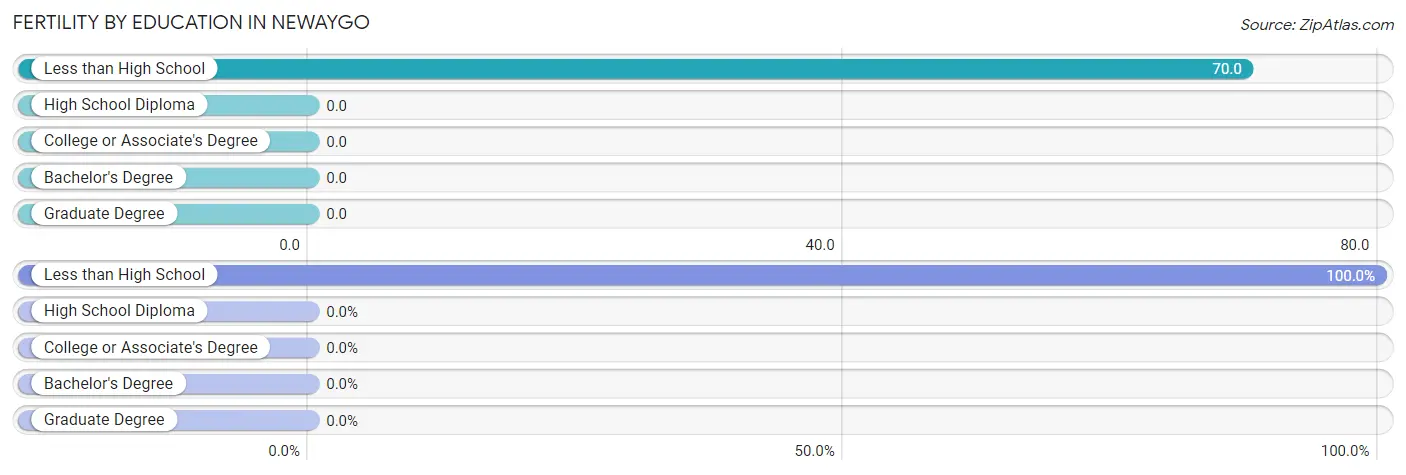
| Educational Attainment | Women with Births | Births / 1,000 Women |
| Less than High School | 9 (100.0%) | 70.0 |
| High School Diploma | 0 (0.0%) | 0.0 |
| College or Associate's Degree | 0 (0.0%) | 0.0 |
| Bachelor's Degree | 0 (0.0%) | 0.0 |
| Graduate Degree | 0 (0.0%) | 0.0 |
| Total | 9 (100.0%) | 16.0 |
Fertility by Education by Marriage Status in Newaygo
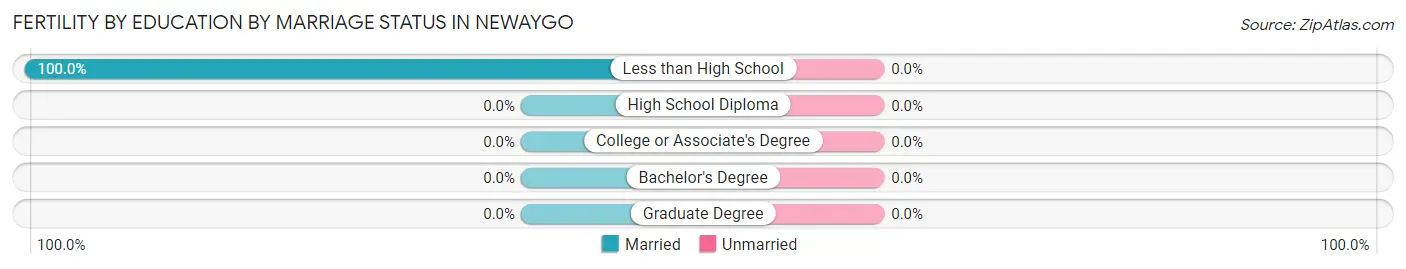
| Educational Attainment | Married | Unmarried |
| Less than High School | 9 (100.0%) | 0 (0.0%) |
| High School Diploma | 0 (0.0%) | 0 (0.0%) |
| College or Associate's Degree | 0 (0.0%) | 0 (0.0%) |
| Bachelor's Degree | 0 (0.0%) | 0 (0.0%) |
| Graduate Degree | 0 (0.0%) | 0 (0.0%) |
| Total | 9 (100.0%) | 0 (0.0%) |
Employment Characteristics in Newaygo
Employment by Class of Employer in Newaygo
Among the 998 employed individuals in Newaygo, private company employees (747 | 74.9%), not-for-profit organizations (91 | 9.1%), and local government employees (44 | 4.4%) make up the most common classes of employment.
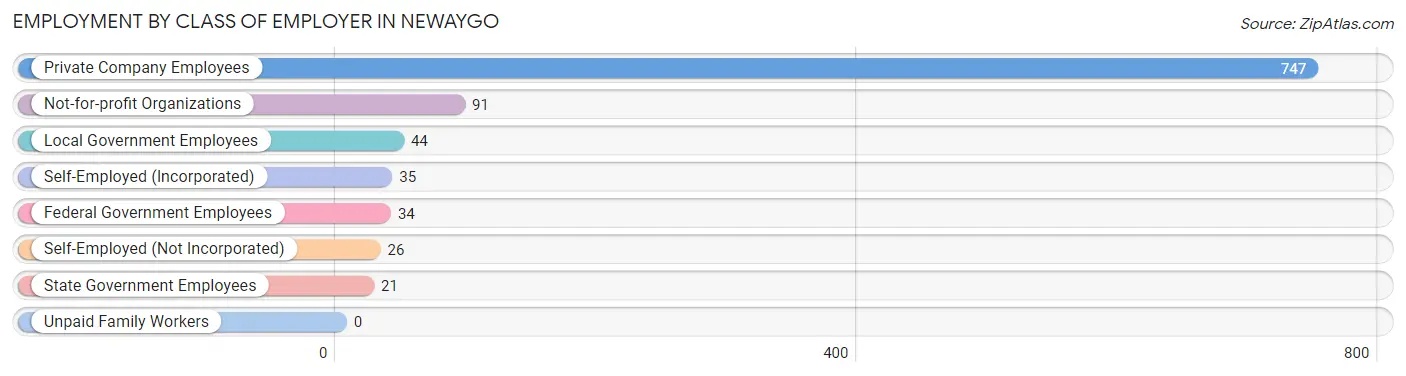
| Employer Class | # Employees | % Employees |
| Private Company Employees | 747 | 74.9% |
| Self-Employed (Incorporated) | 35 | 3.5% |
| Self-Employed (Not Incorporated) | 26 | 2.6% |
| Not-for-profit Organizations | 91 | 9.1% |
| Local Government Employees | 44 | 4.4% |
| State Government Employees | 21 | 2.1% |
| Federal Government Employees | 34 | 3.4% |
| Unpaid Family Workers | 0 | 0.0% |
| Total | 998 | 100.0% |
Employment Status by Age in Newaygo
According to the labor force statistics for Newaygo, out of the total population over 16 years of age (1,921), 58.7% or 1,128 individuals are in the labor force, with 5.9% or 67 of them unemployed. The age group with the highest labor force participation rate is 25 to 29 years, with 95.5% or 105 individuals in the labor force. Within the labor force, the 16 to 19 years age range has the highest percentage of unemployed individuals, with 32.1% or 27 of them being unemployed.
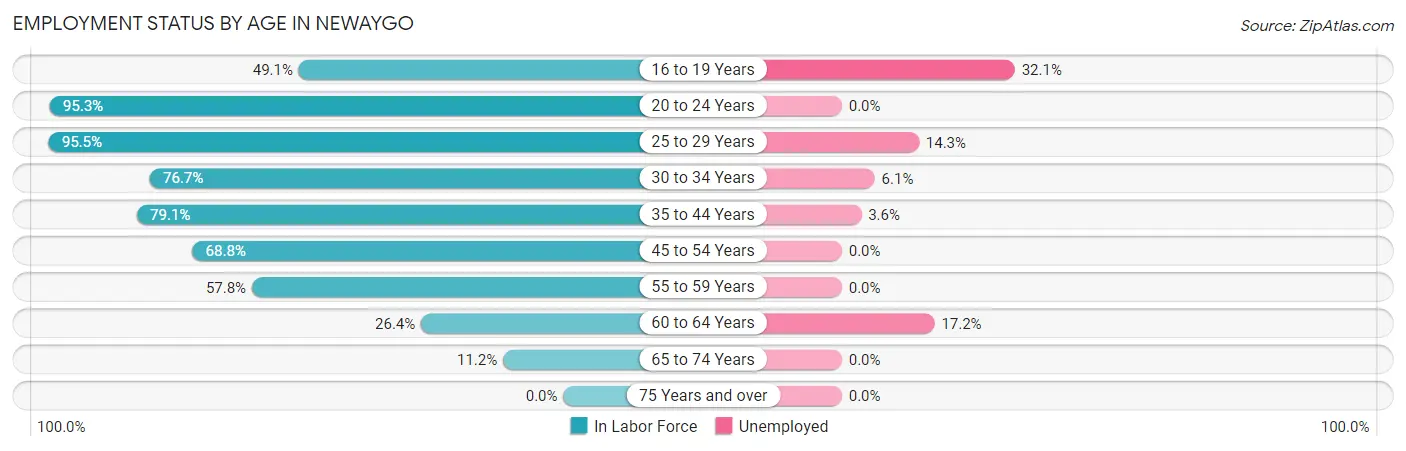
| Age Bracket | In Labor Force | Unemployed |
| 16 to 19 Years | 84 (49.1%) | 27 (32.1%) |
| 20 to 24 Years | 183 (95.3%) | 0 (0.0%) |
| 25 to 29 Years | 105 (95.5%) | 15 (14.3%) |
| 30 to 34 Years | 165 (76.7%) | 10 (6.1%) |
| 35 to 44 Years | 276 (79.1%) | 10 (3.6%) |
| 45 to 54 Years | 172 (68.8%) | 0 (0.0%) |
| 55 to 59 Years | 93 (57.8%) | 0 (0.0%) |
| 60 to 64 Years | 29 (26.4%) | 5 (17.2%) |
| 65 to 74 Years | 20 (11.2%) | 0 (0.0%) |
| 75 Years and over | 0 (0.0%) | 0 (0.0%) |
| Total | 1,128 (58.7%) | 67 (5.9%) |
Employment Status by Educational Attainment in Newaygo
According to labor force statistics for Newaygo, 70.3% of individuals (840) out of the total population between 25 and 64 years of age (1,195) are in the labor force, with 4.8% or 40 of them being unemployed. The group with the highest labor force participation rate are those with the educational attainment of bachelor's degree or higher, with 84.5% or 93 individuals in the labor force. Within the labor force, individuals with high school diploma education have the highest percentage of unemployment, with 8.2% or 25 of them being unemployed.
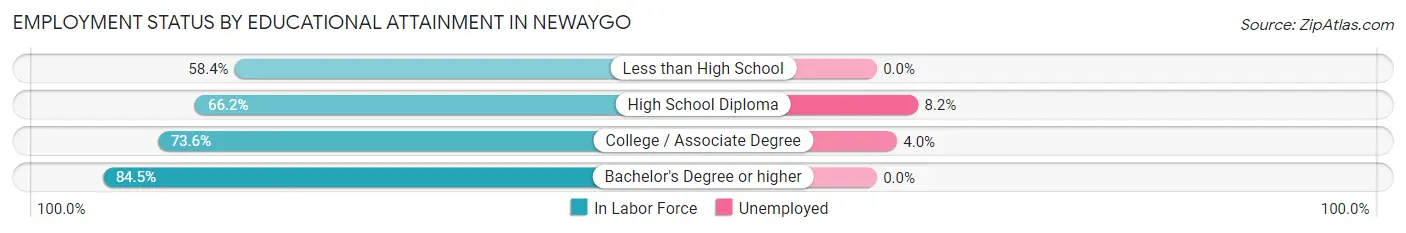
| Educational Attainment | In Labor Force | Unemployed |
| Less than High School | 66 (58.4%) | 0 (0.0%) |
| High School Diploma | 305 (66.2%) | 38 (8.2%) |
| College / Associate Degree | 376 (73.6%) | 20 (4.0%) |
| Bachelor's Degree or higher | 93 (84.5%) | 0 (0.0%) |
| Total | 840 (70.3%) | 57 (4.8%) |
Employment Occupations by Sex in Newaygo
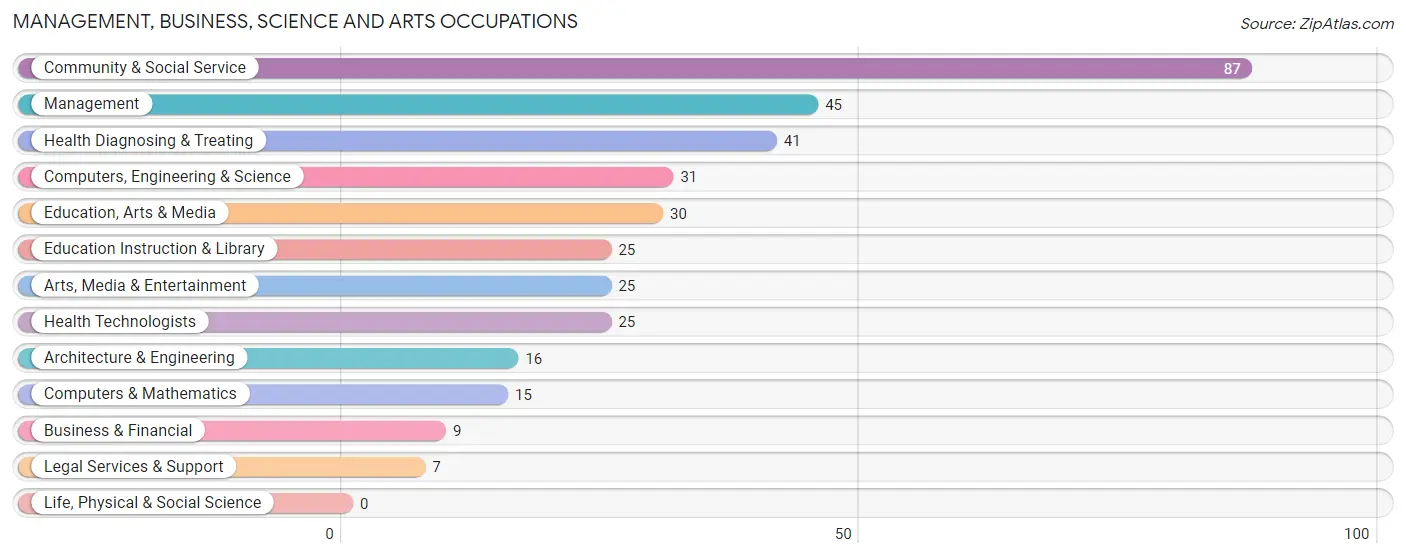
Management, Business, Science and Arts Occupations
The most common Management, Business, Science and Arts occupations in Newaygo are Community & Social Service (87 | 8.2%), Management (45 | 4.3%), Health Diagnosing & Treating (41 | 3.9%), Computers, Engineering & Science (31 | 2.9%), and Education, Arts & Media (30 | 2.8%).
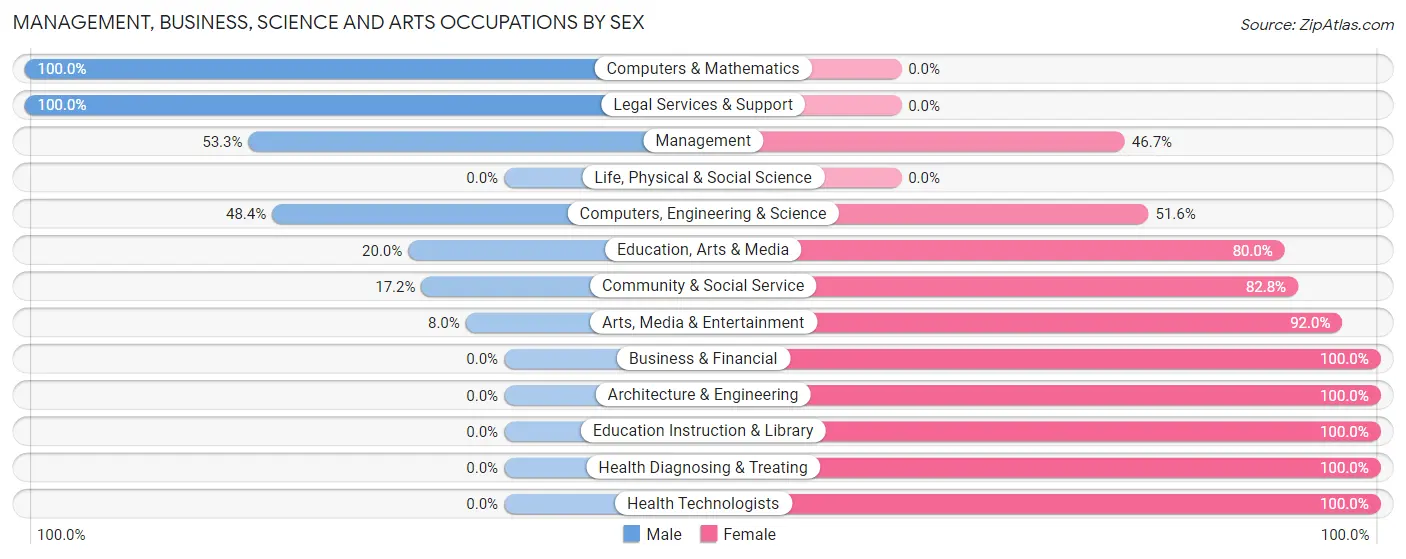
Management, Business, Science and Arts Occupations by Sex
Within the Management, Business, Science and Arts occupations in Newaygo, the most male-oriented occupations are Computers & Mathematics (100.0%), Legal Services & Support (100.0%), and Management (53.3%), while the most female-oriented occupations are Business & Financial (100.0%), Architecture & Engineering (100.0%), and Education Instruction & Library (100.0%).
| Occupation | Male | Female |
| Management | 24 (53.3%) | 21 (46.7%) |
| Business & Financial | 0 (0.0%) | 9 (100.0%) |
| Computers, Engineering & Science | 15 (48.4%) | 16 (51.6%) |
| Computers & Mathematics | 15 (100.0%) | 0 (0.0%) |
| Architecture & Engineering | 0 (0.0%) | 16 (100.0%) |
| Life, Physical & Social Science | 0 (0.0%) | 0 (0.0%) |
| Community & Social Service | 15 (17.2%) | 72 (82.8%) |
| Education, Arts & Media | 6 (20.0%) | 24 (80.0%) |
| Legal Services & Support | 7 (100.0%) | 0 (0.0%) |
| Education Instruction & Library | 0 (0.0%) | 25 (100.0%) |
| Arts, Media & Entertainment | 2 (8.0%) | 23 (92.0%) |
| Health Diagnosing & Treating | 0 (0.0%) | 41 (100.0%) |
| Health Technologists | 0 (0.0%) | 25 (100.0%) |
| Total (Category) | 54 (25.4%) | 159 (74.7%) |
| Total (Overall) | 572 (54.0%) | 488 (46.0%) |
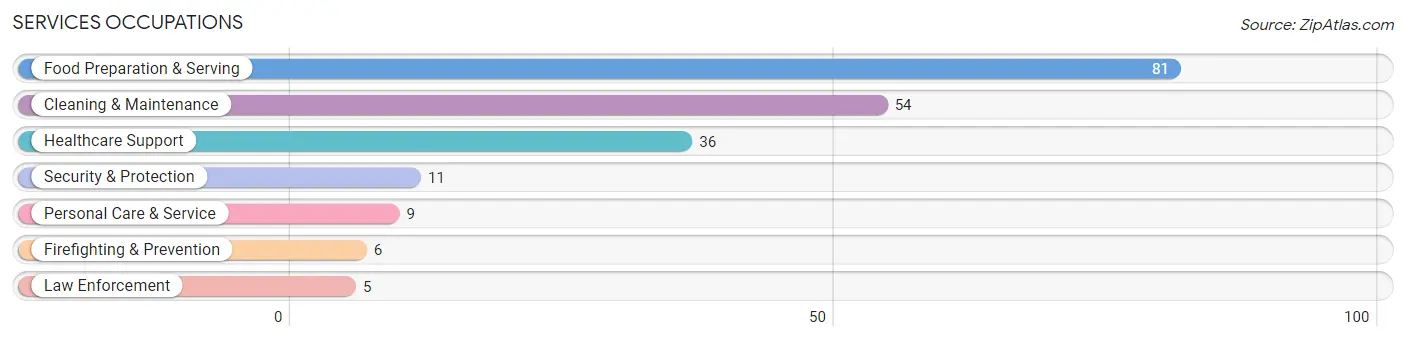
Services Occupations
The most common Services occupations in Newaygo are Food Preparation & Serving (81 | 7.6%), Cleaning & Maintenance (54 | 5.1%), Healthcare Support (36 | 3.4%), Security & Protection (11 | 1.0%), and Personal Care & Service (9 | 0.9%).
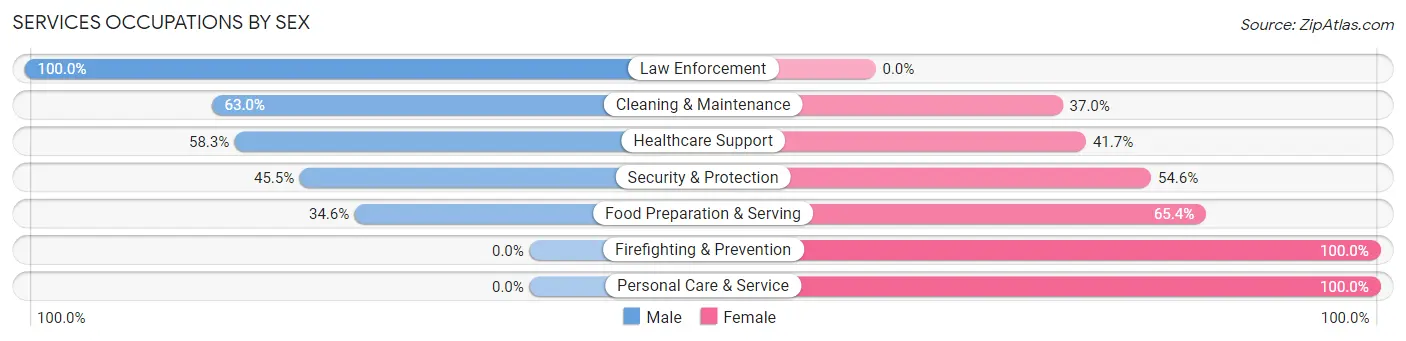
Services Occupations by Sex
Within the Services occupations in Newaygo, the most male-oriented occupations are Law Enforcement (100.0%), Cleaning & Maintenance (63.0%), and Healthcare Support (58.3%), while the most female-oriented occupations are Firefighting & Prevention (100.0%), Personal Care & Service (100.0%), and Food Preparation & Serving (65.4%).
| Occupation | Male | Female |
| Healthcare Support | 21 (58.3%) | 15 (41.7%) |
| Security & Protection | 5 (45.5%) | 6 (54.5%) |
| Firefighting & Prevention | 0 (0.0%) | 6 (100.0%) |
| Law Enforcement | 5 (100.0%) | 0 (0.0%) |
| Food Preparation & Serving | 28 (34.6%) | 53 (65.4%) |
| Cleaning & Maintenance | 34 (63.0%) | 20 (37.0%) |
| Personal Care & Service | 0 (0.0%) | 9 (100.0%) |
| Total (Category) | 88 (46.1%) | 103 (53.9%) |
| Total (Overall) | 572 (54.0%) | 488 (46.0%) |
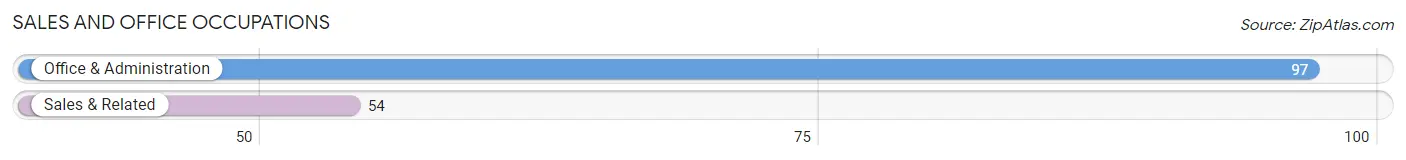
Sales and Office Occupations
The most common Sales and Office occupations in Newaygo are Office & Administration (97 | 9.1%), and Sales & Related (54 | 5.1%).
Sales and Office Occupations by Sex
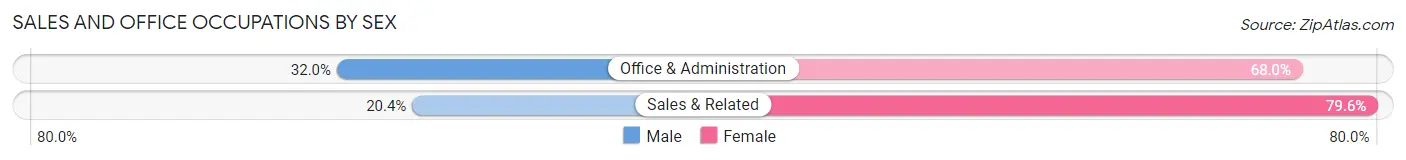
| Occupation | Male | Female |
| Sales & Related | 11 (20.4%) | 43 (79.6%) |
| Office & Administration | 31 (32.0%) | 66 (68.0%) |
| Total (Category) | 42 (27.8%) | 109 (72.2%) |
| Total (Overall) | 572 (54.0%) | 488 (46.0%) |
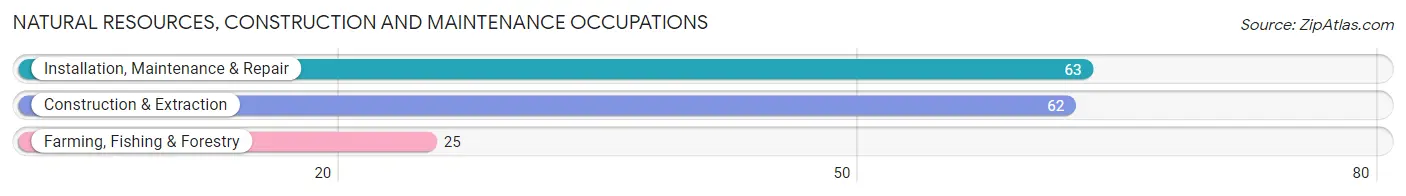
Natural Resources, Construction and Maintenance Occupations
The most common Natural Resources, Construction and Maintenance occupations in Newaygo are Installation, Maintenance & Repair (63 | 5.9%), Construction & Extraction (62 | 5.9%), and Farming, Fishing & Forestry (25 | 2.4%).
Natural Resources, Construction and Maintenance Occupations by Sex
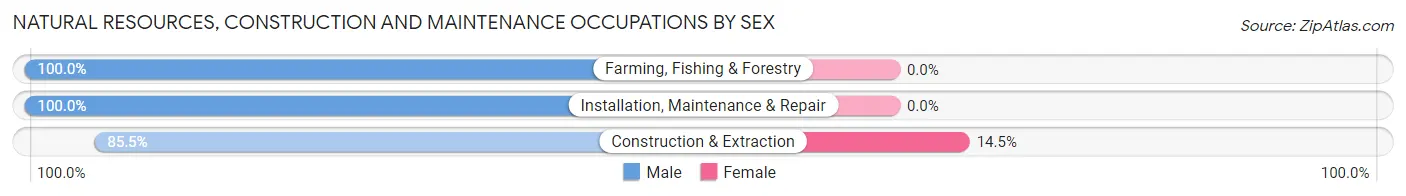
| Occupation | Male | Female |
| Farming, Fishing & Forestry | 25 (100.0%) | 0 (0.0%) |
| Construction & Extraction | 53 (85.5%) | 9 (14.5%) |
| Installation, Maintenance & Repair | 63 (100.0%) | 0 (0.0%) |
| Total (Category) | 141 (94.0%) | 9 (6.0%) |
| Total (Overall) | 572 (54.0%) | 488 (46.0%) |
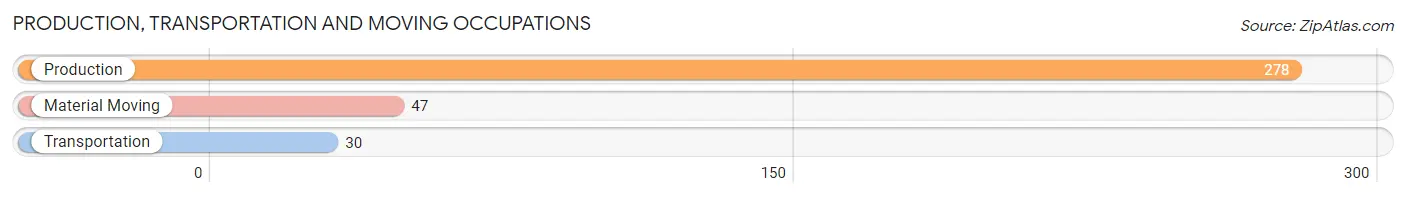
Production, Transportation and Moving Occupations
The most common Production, Transportation and Moving occupations in Newaygo are Production (278 | 26.2%), Material Moving (47 | 4.4%), and Transportation (30 | 2.8%).
Production, Transportation and Moving Occupations by Sex
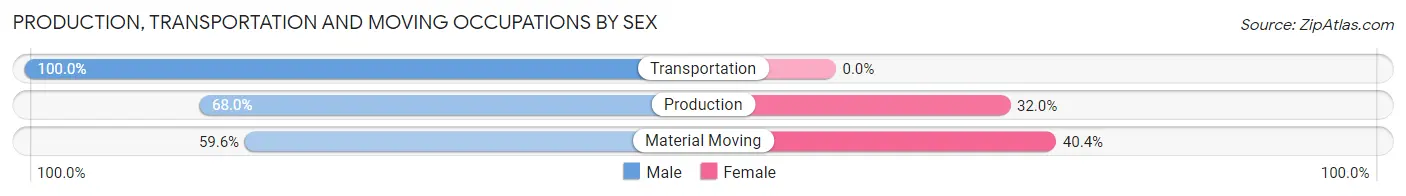
| Occupation | Male | Female |
| Production | 189 (68.0%) | 89 (32.0%) |
| Transportation | 30 (100.0%) | 0 (0.0%) |
| Material Moving | 28 (59.6%) | 19 (40.4%) |
| Total (Category) | 247 (69.6%) | 108 (30.4%) |
| Total (Overall) | 572 (54.0%) | 488 (46.0%) |
Employment Industries by Sex in Newaygo
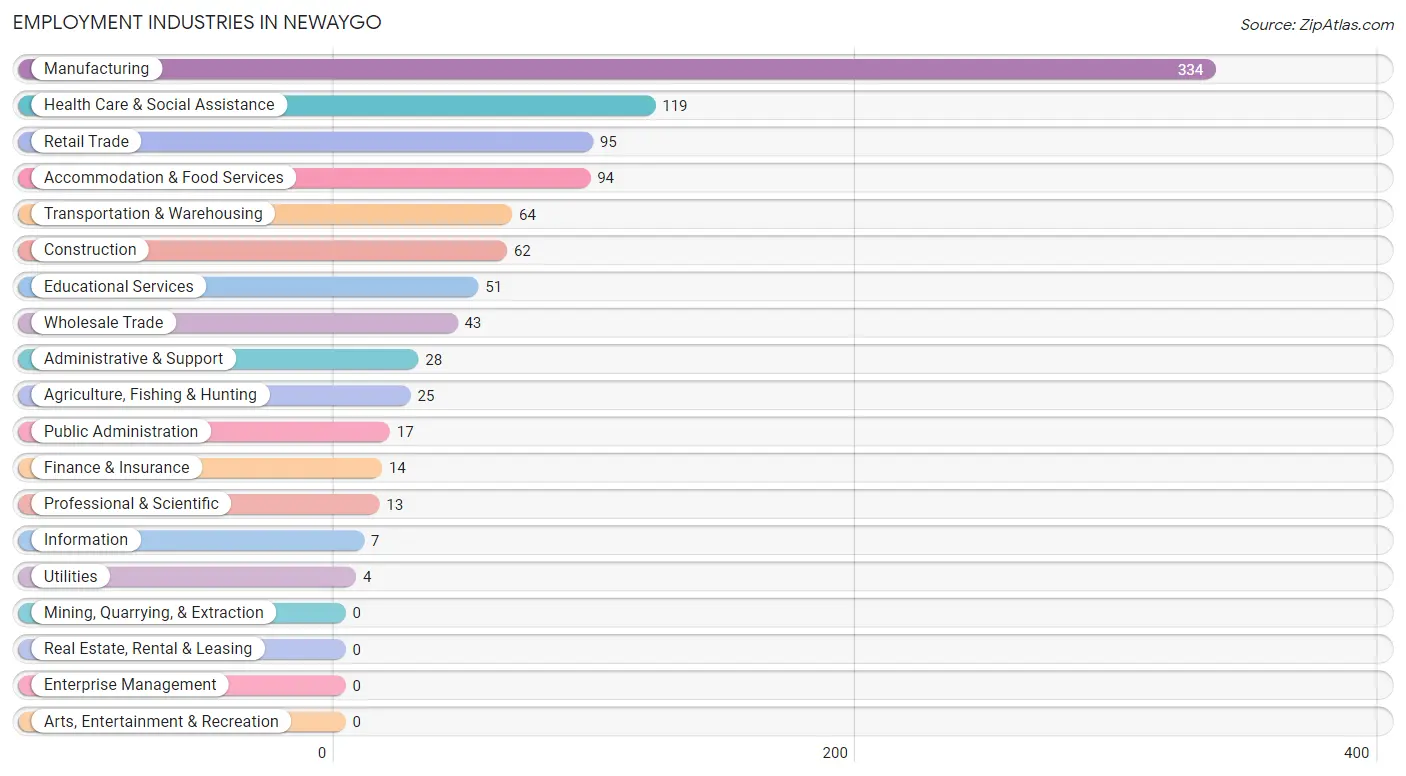
Employment Industries in Newaygo
The major employment industries in Newaygo include Manufacturing (334 | 31.5%), Health Care & Social Assistance (119 | 11.2%), Retail Trade (95 | 9.0%), Accommodation & Food Services (94 | 8.9%), and Transportation & Warehousing (64 | 6.0%).
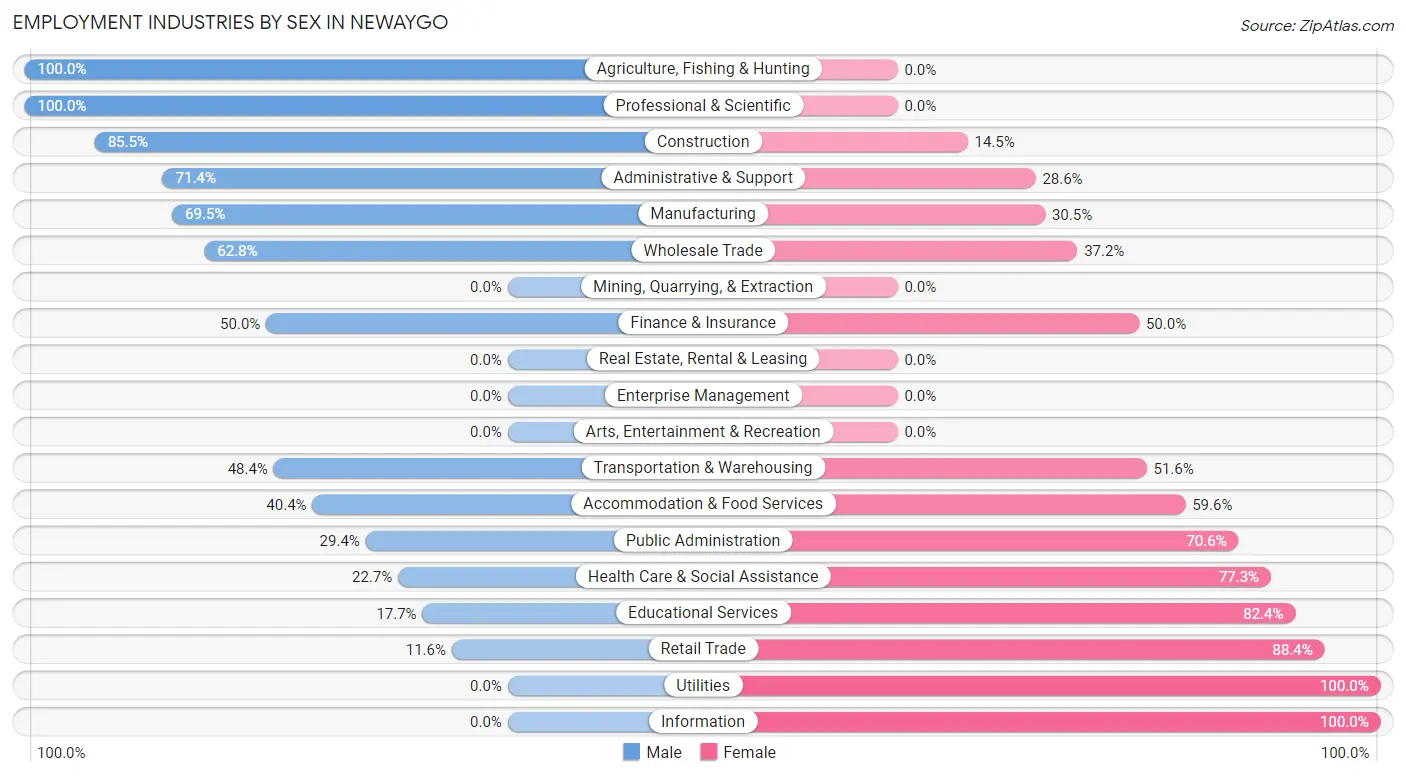
Employment Industries by Sex in Newaygo
The Newaygo industries that see more men than women are Agriculture, Fishing & Hunting (100.0%), Professional & Scientific (100.0%), and Construction (85.5%), whereas the industries that tend to have a higher number of women are Utilities (100.0%), Information (100.0%), and Retail Trade (88.4%).
| Industry | Male | Female |
| Agriculture, Fishing & Hunting | 25 (100.0%) | 0 (0.0%) |
| Mining, Quarrying, & Extraction | 0 (0.0%) | 0 (0.0%) |
| Construction | 53 (85.5%) | 9 (14.5%) |
| Manufacturing | 232 (69.5%) | 102 (30.5%) |
| Wholesale Trade | 27 (62.8%) | 16 (37.2%) |
| Retail Trade | 11 (11.6%) | 84 (88.4%) |
| Transportation & Warehousing | 31 (48.4%) | 33 (51.6%) |
| Utilities | 0 (0.0%) | 4 (100.0%) |
| Information | 0 (0.0%) | 7 (100.0%) |
| Finance & Insurance | 7 (50.0%) | 7 (50.0%) |
| Real Estate, Rental & Leasing | 0 (0.0%) | 0 (0.0%) |
| Professional & Scientific | 13 (100.0%) | 0 (0.0%) |
| Enterprise Management | 0 (0.0%) | 0 (0.0%) |
| Administrative & Support | 20 (71.4%) | 8 (28.6%) |
| Educational Services | 9 (17.6%) | 42 (82.4%) |
| Health Care & Social Assistance | 27 (22.7%) | 92 (77.3%) |
| Arts, Entertainment & Recreation | 0 (0.0%) | 0 (0.0%) |
| Accommodation & Food Services | 38 (40.4%) | 56 (59.6%) |
| Public Administration | 5 (29.4%) | 12 (70.6%) |
| Total | 572 (54.0%) | 488 (46.0%) |
Education in Newaygo
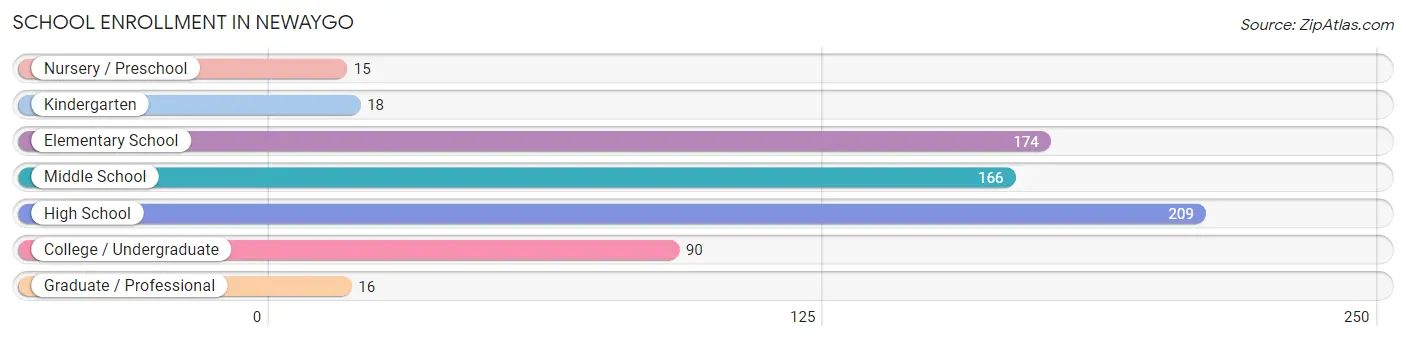
School Enrollment in Newaygo
The most common levels of schooling among the 688 students in Newaygo are high school (209 | 30.4%), elementary school (174 | 25.3%), and middle school (166 | 24.1%).
| School Level | # Students | % Students |
| Nursery / Preschool | 15 | 2.2% |
| Kindergarten | 18 | 2.6% |
| Elementary School | 174 | 25.3% |
| Middle School | 166 | 24.1% |
| High School | 209 | 30.4% |
| College / Undergraduate | 90 | 13.1% |
| Graduate / Professional | 16 | 2.3% |
| Total | 688 | 100.0% |
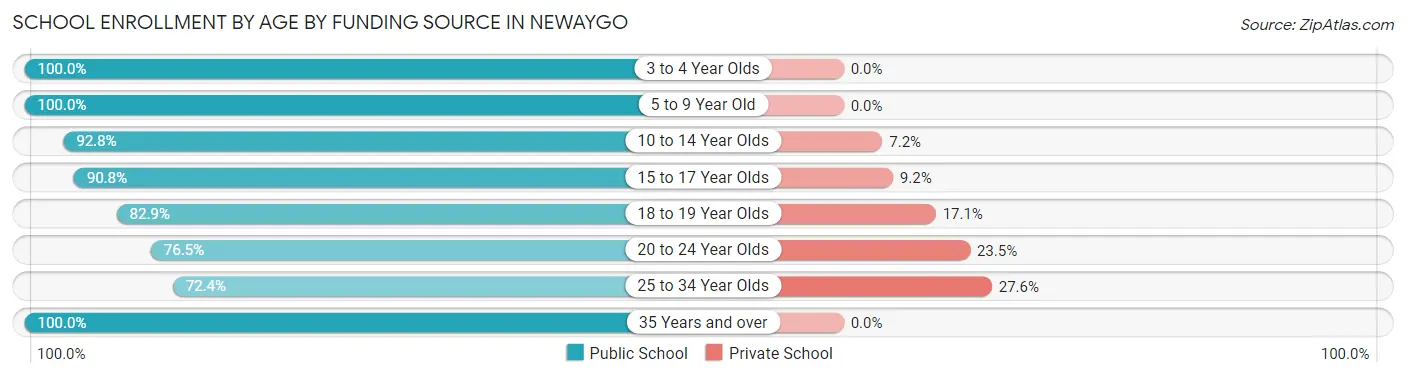
School Enrollment by Age by Funding Source in Newaygo
Out of a total of 688 students who are enrolled in schools in Newaygo, 53 (7.7%) attend a private institution, while the remaining 635 (92.3%) are enrolled in public schools. The age group of 25 to 34 year olds has the highest likelihood of being enrolled in private schools, with 8 (27.6% in the age bracket) enrolled. Conversely, the age group of 3 to 4 year olds has the lowest likelihood of being enrolled in a private school, with 15 (100.0% in the age bracket) attending a public institution.
| Age Bracket | Public School | Private School |
| 3 to 4 Year Olds | 15 (100.0%) | 0 (0.0%) |
| 5 to 9 Year Old | 188 (100.0%) | 0 (0.0%) |
| 10 to 14 Year Olds | 193 (92.8%) | 15 (7.2%) |
| 15 to 17 Year Olds | 99 (90.8%) | 10 (9.2%) |
| 18 to 19 Year Olds | 58 (82.9%) | 12 (17.1%) |
| 20 to 24 Year Olds | 26 (76.5%) | 8 (23.5%) |
| 25 to 34 Year Olds | 21 (72.4%) | 8 (27.6%) |
| 35 Years and over | 35 (100.0%) | 0 (0.0%) |
| Total | 635 (92.3%) | 53 (7.7%) |
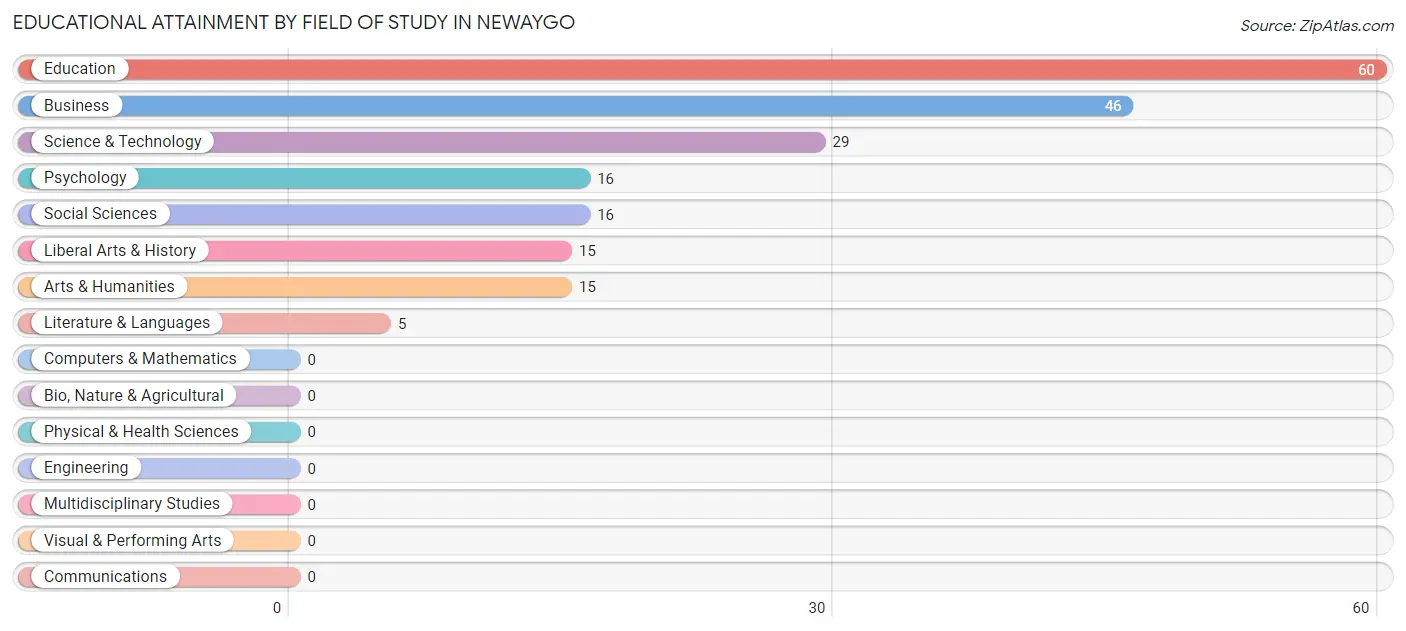
Educational Attainment by Field of Study in Newaygo
Education (60 | 29.7%), business (46 | 22.8%), science & technology (29 | 14.4%), psychology (16 | 7.9%), and social sciences (16 | 7.9%) are the most common fields of study among 202 individuals in Newaygo who have obtained a bachelor's degree or higher.
| Field of Study | # Graduates | % Graduates |
| Computers & Mathematics | 0 | 0.0% |
| Bio, Nature & Agricultural | 0 | 0.0% |
| Physical & Health Sciences | 0 | 0.0% |
| Psychology | 16 | 7.9% |
| Social Sciences | 16 | 7.9% |
| Engineering | 0 | 0.0% |
| Multidisciplinary Studies | 0 | 0.0% |
| Science & Technology | 29 | 14.4% |
| Business | 46 | 22.8% |
| Education | 60 | 29.7% |
| Literature & Languages | 5 | 2.5% |
| Liberal Arts & History | 15 | 7.4% |
| Visual & Performing Arts | 0 | 0.0% |
| Communications | 0 | 0.0% |
| Arts & Humanities | 15 | 7.4% |
| Total | 202 | 100.0% |
Transportation & Commute in Newaygo
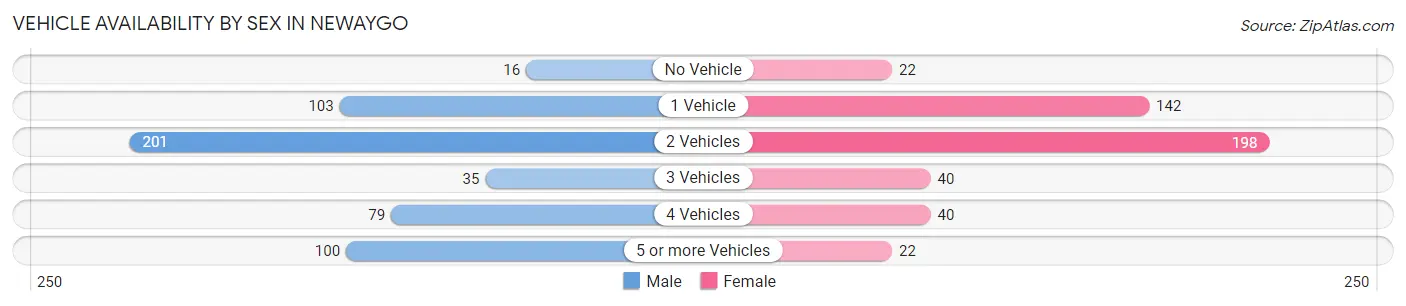
Vehicle Availability by Sex in Newaygo
The most prevalent vehicle ownership categories in Newaygo are males with 2 vehicles (201, accounting for 37.6%) and females with 2 vehicles (198, making up 43.3%).
| Vehicles Available | Male | Female |
| No Vehicle | 16 (3.0%) | 22 (4.7%) |
| 1 Vehicle | 103 (19.3%) | 142 (30.6%) |
| 2 Vehicles | 201 (37.6%) | 198 (42.7%) |
| 3 Vehicles | 35 (6.6%) | 40 (8.6%) |
| 4 Vehicles | 79 (14.8%) | 40 (8.6%) |
| 5 or more Vehicles | 100 (18.7%) | 22 (4.7%) |
| Total | 534 (100.0%) | 464 (100.0%) |
Commute Time in Newaygo
The most frequently occuring commute durations in Newaygo are 5 to 9 minutes (169 commuters, 17.2%), less than 5 minutes (159 commuters, 16.2%), and 15 to 19 minutes (154 commuters, 15.7%).
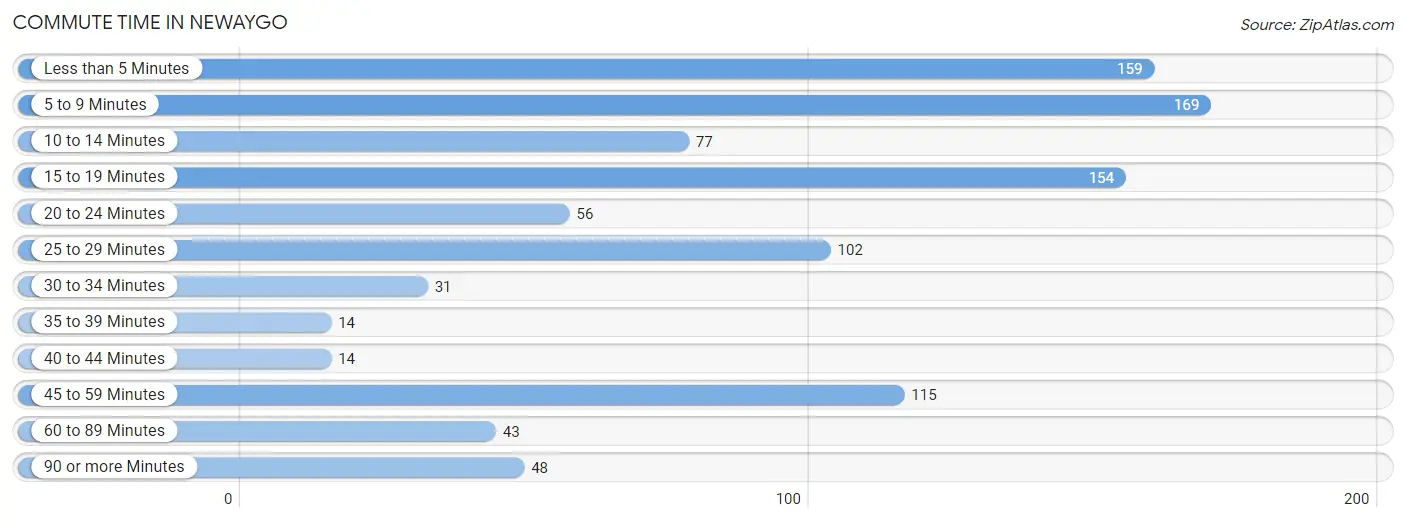
| Commute Time | # Commuters | % Commuters |
| Less than 5 Minutes | 159 | 16.2% |
| 5 to 9 Minutes | 169 | 17.2% |
| 10 to 14 Minutes | 77 | 7.8% |
| 15 to 19 Minutes | 154 | 15.7% |
| 20 to 24 Minutes | 56 | 5.7% |
| 25 to 29 Minutes | 102 | 10.4% |
| 30 to 34 Minutes | 31 | 3.2% |
| 35 to 39 Minutes | 14 | 1.4% |
| 40 to 44 Minutes | 14 | 1.4% |
| 45 to 59 Minutes | 115 | 11.7% |
| 60 to 89 Minutes | 43 | 4.4% |
| 90 or more Minutes | 48 | 4.9% |
Commute Time by Sex in Newaygo
The most common commute times in Newaygo are less than 5 minutes (107 commuters, 20.0%) for males and 5 to 9 minutes (123 commuters, 27.5%) for females.
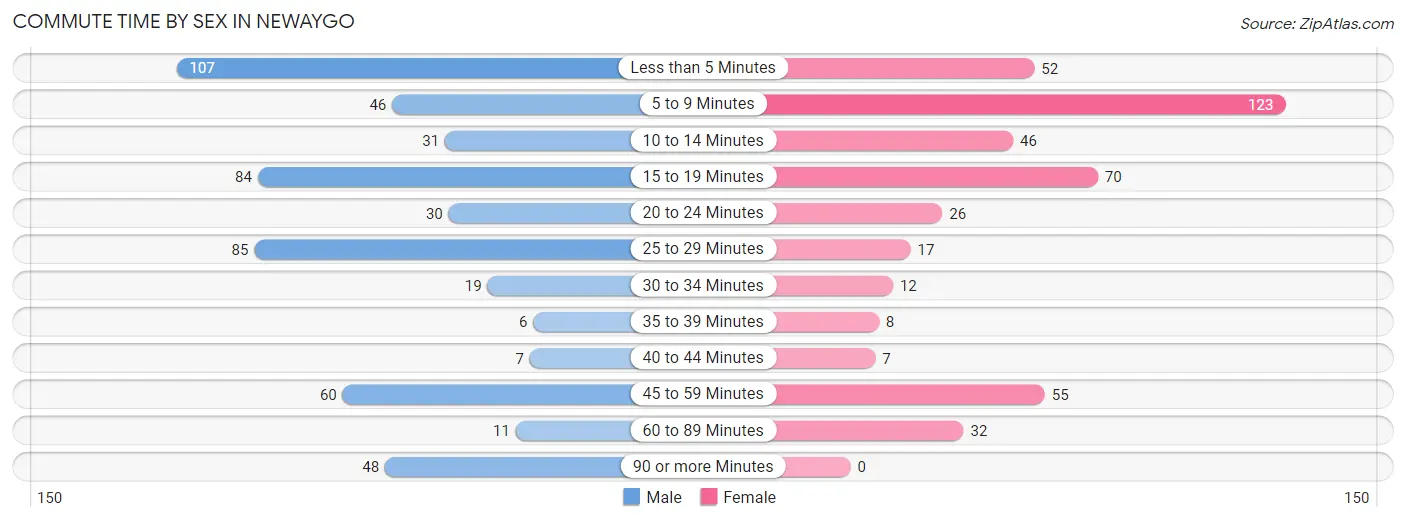
| Commute Time | Male | Female |
| Less than 5 Minutes | 107 (20.0%) | 52 (11.6%) |
| 5 to 9 Minutes | 46 (8.6%) | 123 (27.5%) |
| 10 to 14 Minutes | 31 (5.8%) | 46 (10.3%) |
| 15 to 19 Minutes | 84 (15.7%) | 70 (15.6%) |
| 20 to 24 Minutes | 30 (5.6%) | 26 (5.8%) |
| 25 to 29 Minutes | 85 (15.9%) | 17 (3.8%) |
| 30 to 34 Minutes | 19 (3.6%) | 12 (2.7%) |
| 35 to 39 Minutes | 6 (1.1%) | 8 (1.8%) |
| 40 to 44 Minutes | 7 (1.3%) | 7 (1.6%) |
| 45 to 59 Minutes | 60 (11.2%) | 55 (12.3%) |
| 60 to 89 Minutes | 11 (2.1%) | 32 (7.1%) |
| 90 or more Minutes | 48 (9.0%) | 0 (0.0%) |
Time of Departure to Work by Sex in Newaygo
The most frequent times of departure to work in Newaygo are 12:00 AM to 4:59 AM (102, 19.1%) for males and 6:00 AM to 6:29 AM (62, 13.8%) for females.
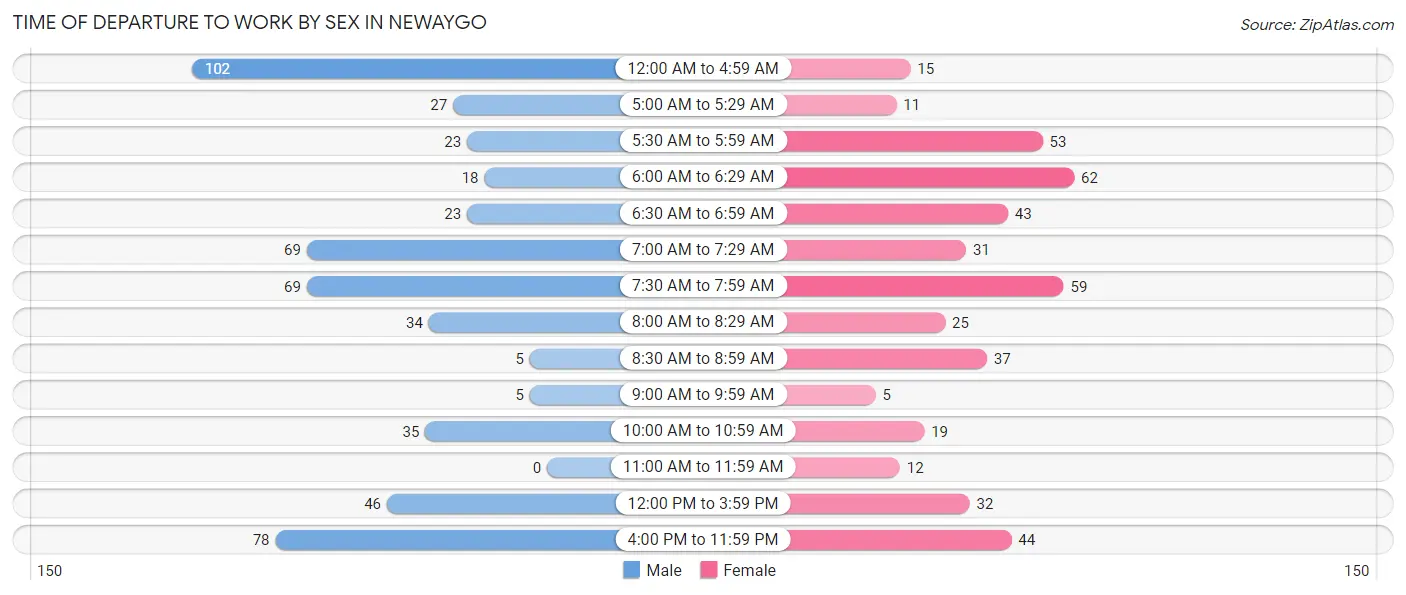
| Time of Departure | Male | Female |
| 12:00 AM to 4:59 AM | 102 (19.1%) | 15 (3.4%) |
| 5:00 AM to 5:29 AM | 27 (5.1%) | 11 (2.5%) |
| 5:30 AM to 5:59 AM | 23 (4.3%) | 53 (11.8%) |
| 6:00 AM to 6:29 AM | 18 (3.4%) | 62 (13.8%) |
| 6:30 AM to 6:59 AM | 23 (4.3%) | 43 (9.6%) |
| 7:00 AM to 7:29 AM | 69 (12.9%) | 31 (6.9%) |
| 7:30 AM to 7:59 AM | 69 (12.9%) | 59 (13.2%) |
| 8:00 AM to 8:29 AM | 34 (6.4%) | 25 (5.6%) |
| 8:30 AM to 8:59 AM | 5 (0.9%) | 37 (8.3%) |
| 9:00 AM to 9:59 AM | 5 (0.9%) | 5 (1.1%) |
| 10:00 AM to 10:59 AM | 35 (6.6%) | 19 (4.2%) |
| 11:00 AM to 11:59 AM | 0 (0.0%) | 12 (2.7%) |
| 12:00 PM to 3:59 PM | 46 (8.6%) | 32 (7.1%) |
| 4:00 PM to 11:59 PM | 78 (14.6%) | 44 (9.8%) |
| Total | 534 (100.0%) | 448 (100.0%) |
Housing Occupancy in Newaygo
Occupancy by Ownership in Newaygo
Of the total 957 dwellings in Newaygo, owner-occupied units account for 563 (58.8%), while renter-occupied units make up 394 (41.2%).
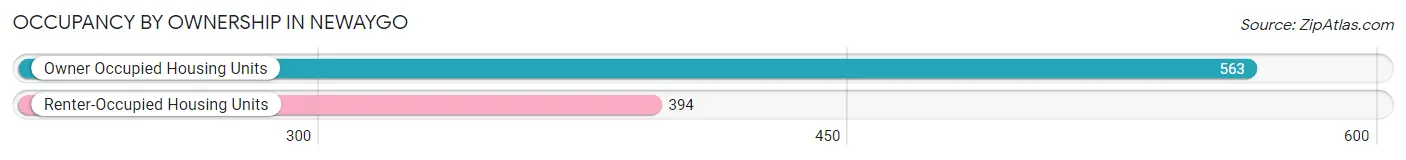
| Occupancy | # Housing Units | % Housing Units |
| Owner Occupied Housing Units | 563 | 58.8% |
| Renter-Occupied Housing Units | 394 | 41.2% |
| Total Occupied Housing Units | 957 | 100.0% |
Occupancy by Household Size in Newaygo
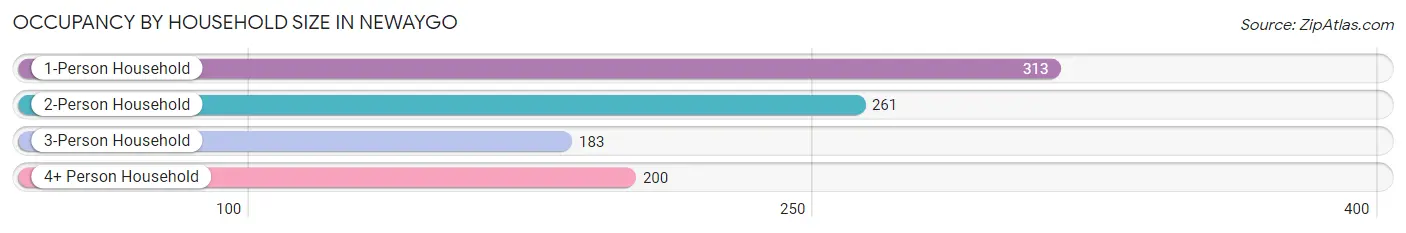
| Household Size | # Housing Units | % Housing Units |
| 1-Person Household | 313 | 32.7% |
| 2-Person Household | 261 | 27.3% |
| 3-Person Household | 183 | 19.1% |
| 4+ Person Household | 200 | 20.9% |
| Total Housing Units | 957 | 100.0% |
Occupancy by Ownership by Household Size in Newaygo
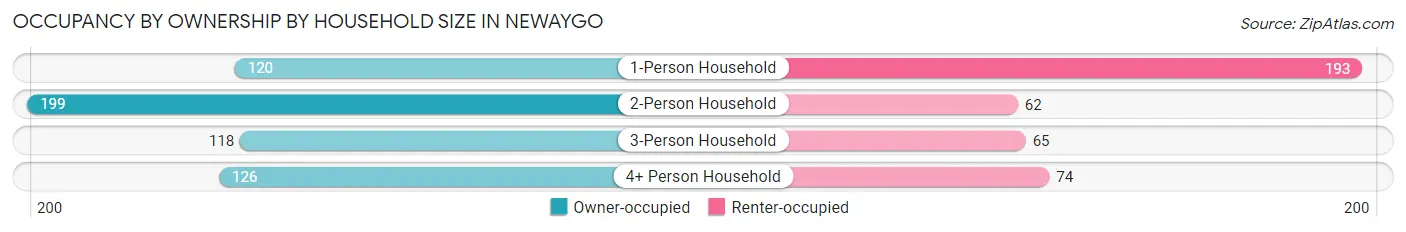
| Household Size | Owner-occupied | Renter-occupied |
| 1-Person Household | 120 (38.3%) | 193 (61.7%) |
| 2-Person Household | 199 (76.2%) | 62 (23.7%) |
| 3-Person Household | 118 (64.5%) | 65 (35.5%) |
| 4+ Person Household | 126 (63.0%) | 74 (37.0%) |
| Total Housing Units | 563 (58.8%) | 394 (41.2%) |
Occupancy by Educational Attainment in Newaygo
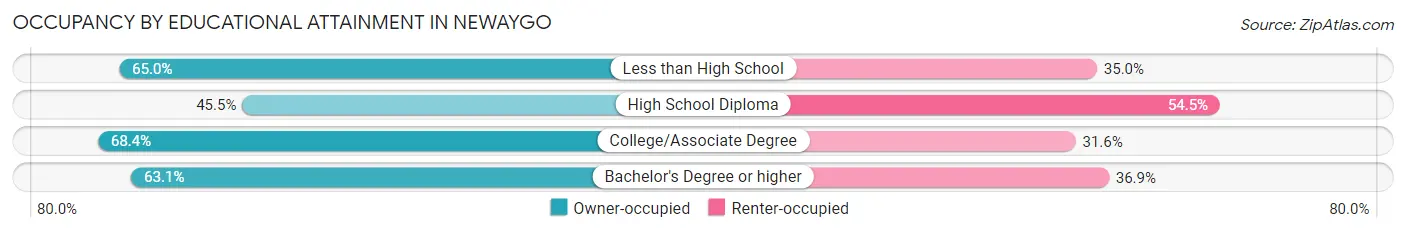
| Household Size | Owner-occupied | Renter-occupied |
| Less than High School | 65 (65.0%) | 35 (35.0%) |
| High School Diploma | 166 (45.5%) | 199 (54.5%) |
| College/Associate Degree | 279 (68.4%) | 129 (31.6%) |
| Bachelor's Degree or higher | 53 (63.1%) | 31 (36.9%) |
Occupancy by Age of Householder in Newaygo
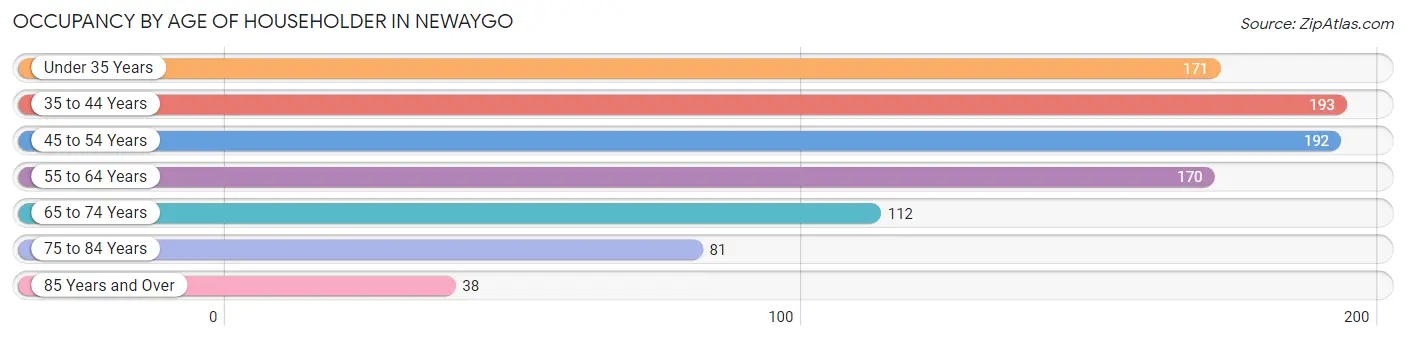
| Age Bracket | # Households | % Households |
| Under 35 Years | 171 | 17.9% |
| 35 to 44 Years | 193 | 20.2% |
| 45 to 54 Years | 192 | 20.1% |
| 55 to 64 Years | 170 | 17.8% |
| 65 to 74 Years | 112 | 11.7% |
| 75 to 84 Years | 81 | 8.5% |
| 85 Years and Over | 38 | 4.0% |
| Total | 957 | 100.0% |
Housing Finances in Newaygo
Median Income by Occupancy in Newaygo
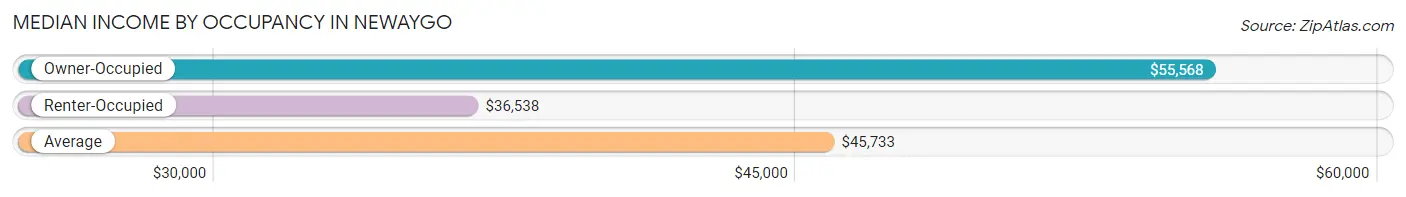
| Occupancy Type | # Households | Median Income |
| Owner-Occupied | 563 (58.8%) | $55,568 |
| Renter-Occupied | 394 (41.2%) | $36,538 |
| Average | 957 (100.0%) | $45,733 |
Occupancy by Householder Income Bracket in Newaygo
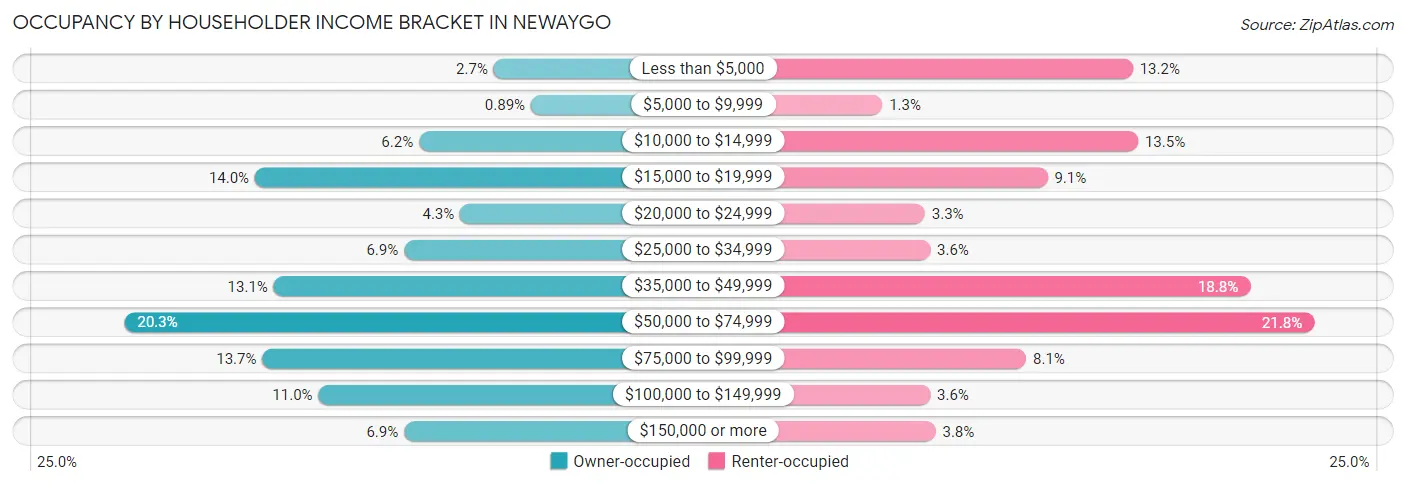
| Income Bracket | Owner-occupied | Renter-occupied |
| Less than $5,000 | 15 (2.7%) | 52 (13.2%) |
| $5,000 to $9,999 | 5 (0.9%) | 5 (1.3%) |
| $10,000 to $14,999 | 35 (6.2%) | 53 (13.5%) |
| $15,000 to $19,999 | 79 (14.0%) | 36 (9.1%) |
| $20,000 to $24,999 | 24 (4.3%) | 13 (3.3%) |
| $25,000 to $34,999 | 39 (6.9%) | 14 (3.5%) |
| $35,000 to $49,999 | 74 (13.1%) | 74 (18.8%) |
| $50,000 to $74,999 | 114 (20.3%) | 86 (21.8%) |
| $75,000 to $99,999 | 77 (13.7%) | 32 (8.1%) |
| $100,000 to $149,999 | 62 (11.0%) | 14 (3.5%) |
| $150,000 or more | 39 (6.9%) | 15 (3.8%) |
| Total | 563 (100.0%) | 394 (100.0%) |
Monthly Housing Cost Tiers in Newaygo
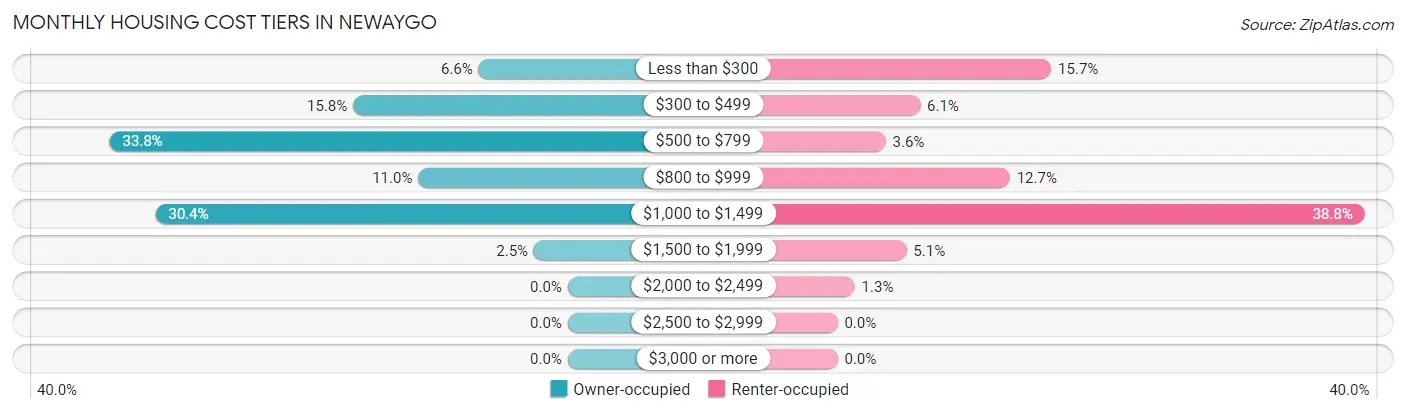
| Monthly Cost | Owner-occupied | Renter-occupied |
| Less than $300 | 37 (6.6%) | 62 (15.7%) |
| $300 to $499 | 89 (15.8%) | 24 (6.1%) |
| $500 to $799 | 190 (33.8%) | 14 (3.5%) |
| $800 to $999 | 62 (11.0%) | 50 (12.7%) |
| $1,000 to $1,499 | 171 (30.4%) | 153 (38.8%) |
| $1,500 to $1,999 | 14 (2.5%) | 20 (5.1%) |
| $2,000 to $2,499 | 0 (0.0%) | 5 (1.3%) |
| $2,500 to $2,999 | 0 (0.0%) | 0 (0.0%) |
| $3,000 or more | 0 (0.0%) | 0 (0.0%) |
| Total | 563 (100.0%) | 394 (100.0%) |
Physical Housing Characteristics in Newaygo
Housing Structures in Newaygo
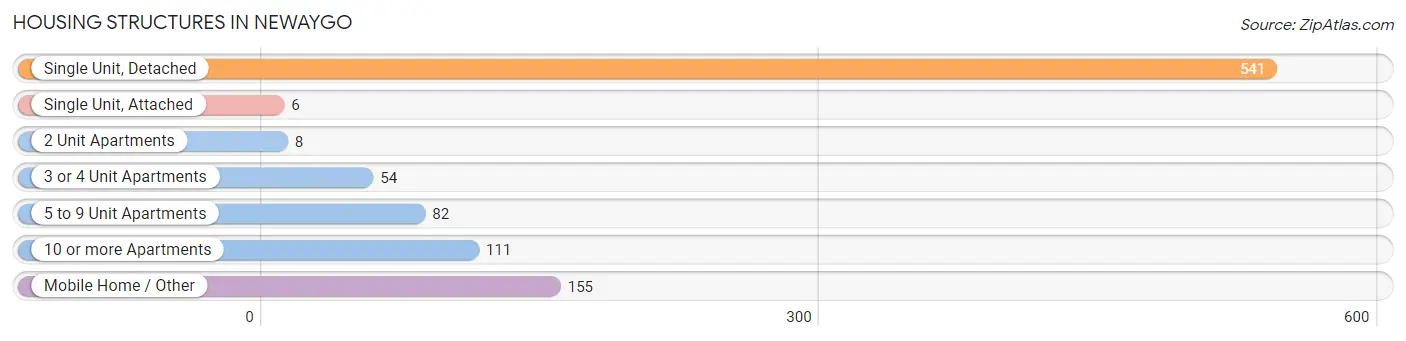
| Structure Type | # Housing Units | % Housing Units |
| Single Unit, Detached | 541 | 56.5% |
| Single Unit, Attached | 6 | 0.6% |
| 2 Unit Apartments | 8 | 0.8% |
| 3 or 4 Unit Apartments | 54 | 5.6% |
| 5 to 9 Unit Apartments | 82 | 8.6% |
| 10 or more Apartments | 111 | 11.6% |
| Mobile Home / Other | 155 | 16.2% |
| Total | 957 | 100.0% |
Housing Structures by Occupancy in Newaygo
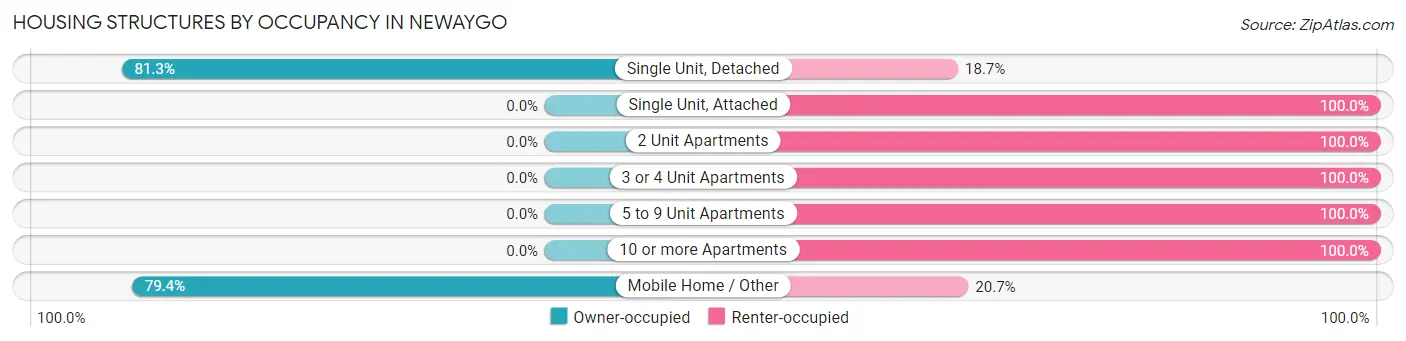
| Structure Type | Owner-occupied | Renter-occupied |
| Single Unit, Detached | 440 (81.3%) | 101 (18.7%) |
| Single Unit, Attached | 0 (0.0%) | 6 (100.0%) |
| 2 Unit Apartments | 0 (0.0%) | 8 (100.0%) |
| 3 or 4 Unit Apartments | 0 (0.0%) | 54 (100.0%) |
| 5 to 9 Unit Apartments | 0 (0.0%) | 82 (100.0%) |
| 10 or more Apartments | 0 (0.0%) | 111 (100.0%) |
| Mobile Home / Other | 123 (79.3%) | 32 (20.6%) |
| Total | 563 (58.8%) | 394 (41.2%) |
Housing Structures by Number of Rooms in Newaygo
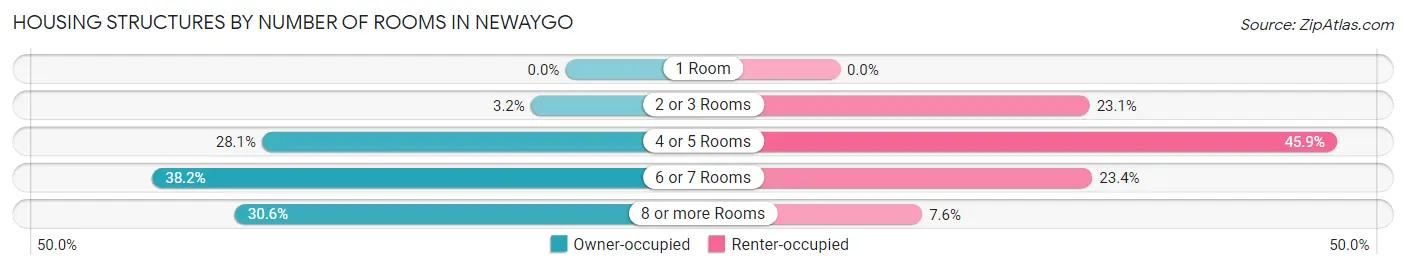
| Number of Rooms | Owner-occupied | Renter-occupied |
| 1 Room | 0 (0.0%) | 0 (0.0%) |
| 2 or 3 Rooms | 18 (3.2%) | 91 (23.1%) |
| 4 or 5 Rooms | 158 (28.1%) | 181 (45.9%) |
| 6 or 7 Rooms | 215 (38.2%) | 92 (23.4%) |
| 8 or more Rooms | 172 (30.5%) | 30 (7.6%) |
| Total | 563 (100.0%) | 394 (100.0%) |
Housing Structure by Heating Type in Newaygo
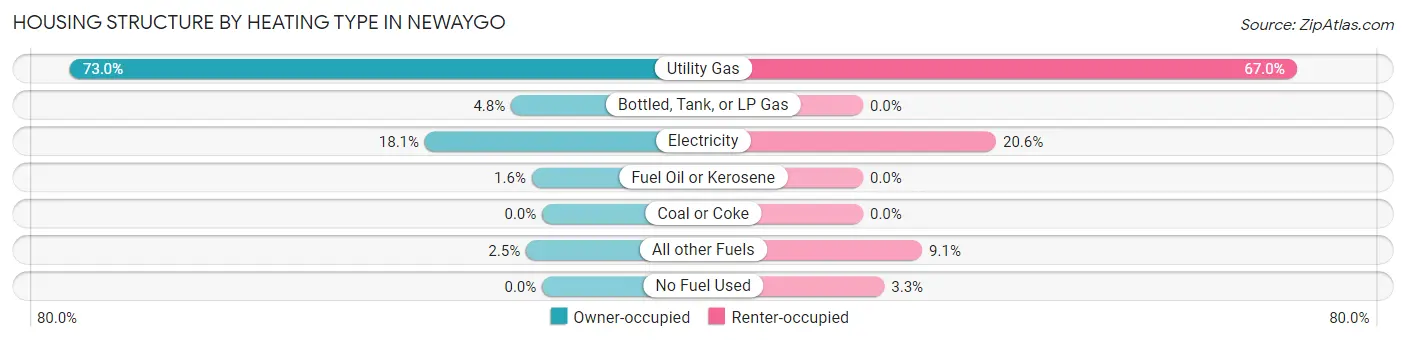
| Heating Type | Owner-occupied | Renter-occupied |
| Utility Gas | 411 (73.0%) | 264 (67.0%) |
| Bottled, Tank, or LP Gas | 27 (4.8%) | 0 (0.0%) |
| Electricity | 102 (18.1%) | 81 (20.6%) |
| Fuel Oil or Kerosene | 9 (1.6%) | 0 (0.0%) |
| Coal or Coke | 0 (0.0%) | 0 (0.0%) |
| All other Fuels | 14 (2.5%) | 36 (9.1%) |
| No Fuel Used | 0 (0.0%) | 13 (3.3%) |
| Total | 563 (100.0%) | 394 (100.0%) |
Household Vehicle Usage in Newaygo
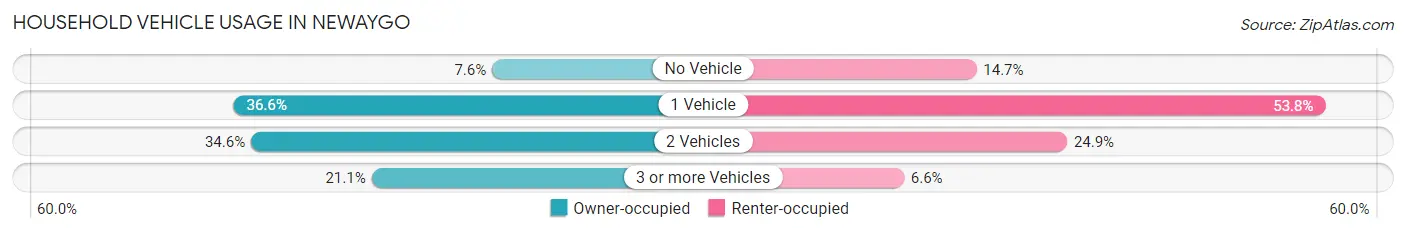
| Vehicles per Household | Owner-occupied | Renter-occupied |
| No Vehicle | 43 (7.6%) | 58 (14.7%) |
| 1 Vehicle | 206 (36.6%) | 212 (53.8%) |
| 2 Vehicles | 195 (34.6%) | 98 (24.9%) |
| 3 or more Vehicles | 119 (21.1%) | 26 (6.6%) |
| Total | 563 (100.0%) | 394 (100.0%) |
Real Estate & Mortgages in Newaygo
Real Estate and Mortgage Overview in Newaygo
| Characteristic | Without Mortgage | With Mortgage |
| Housing Units | 231 | 332 |
| Median Property Value | $55,000 | $113,800 |
| Median Household Income | $46,250 | $32 |
| Monthly Housing Costs | $490 | $0 |
| Real Estate Taxes | $1,900 | $51 |
Property Value by Mortgage Status in Newaygo
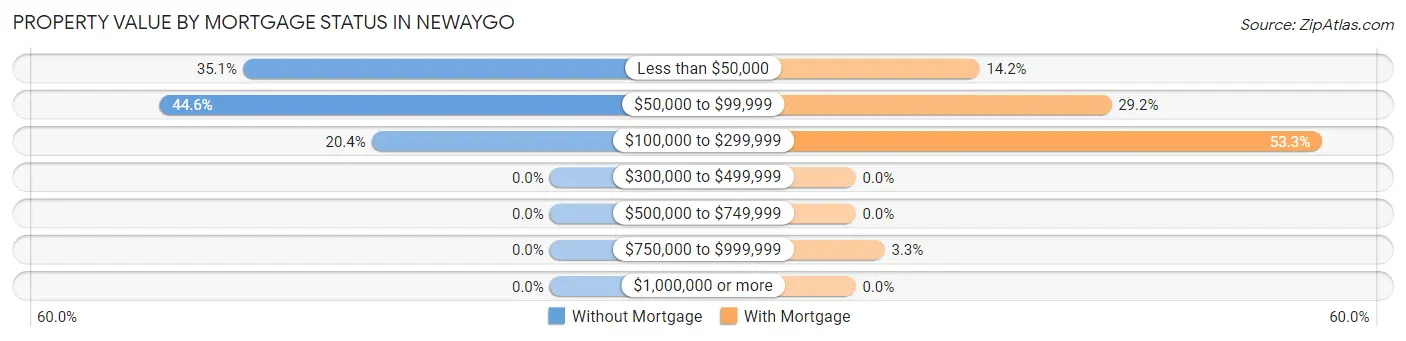
| Property Value | Without Mortgage | With Mortgage |
| Less than $50,000 | 81 (35.1%) | 47 (14.2%) |
| $50,000 to $99,999 | 103 (44.6%) | 97 (29.2%) |
| $100,000 to $299,999 | 47 (20.3%) | 177 (53.3%) |
| $300,000 to $499,999 | 0 (0.0%) | 0 (0.0%) |
| $500,000 to $749,999 | 0 (0.0%) | 0 (0.0%) |
| $750,000 to $999,999 | 0 (0.0%) | 11 (3.3%) |
| $1,000,000 or more | 0 (0.0%) | 0 (0.0%) |
| Total | 231 (100.0%) | 332 (100.0%) |
Household Income by Mortgage Status in Newaygo
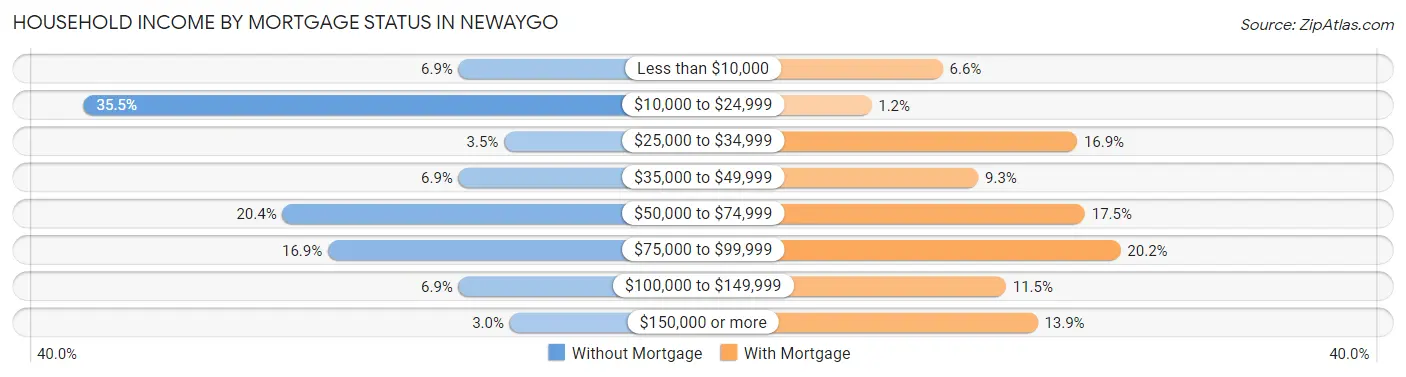
| Household Income | Without Mortgage | With Mortgage |
| Less than $10,000 | 16 (6.9%) | 22 (6.6%) |
| $10,000 to $24,999 | 82 (35.5%) | 4 (1.2%) |
| $25,000 to $34,999 | 8 (3.5%) | 56 (16.9%) |
| $35,000 to $49,999 | 16 (6.9%) | 31 (9.3%) |
| $50,000 to $74,999 | 47 (20.3%) | 58 (17.5%) |
| $75,000 to $99,999 | 39 (16.9%) | 67 (20.2%) |
| $100,000 to $149,999 | 16 (6.9%) | 38 (11.5%) |
| $150,000 or more | 7 (3.0%) | 46 (13.9%) |
| Total | 231 (100.0%) | 332 (100.0%) |
Property Value to Household Income Ratio in Newaygo
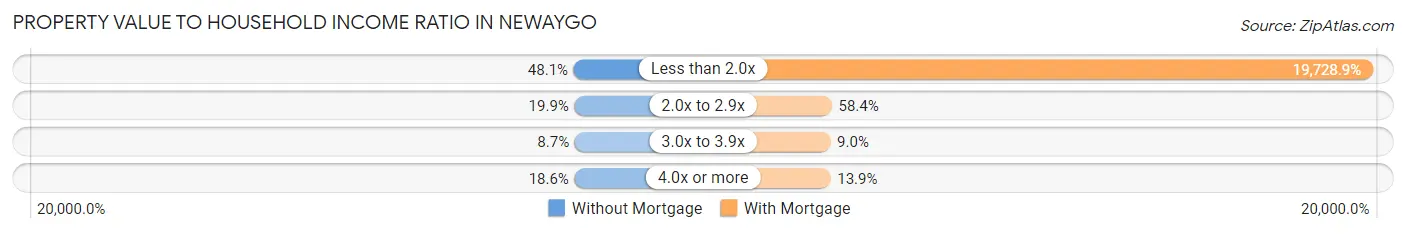
| Value-to-Income Ratio | Without Mortgage | With Mortgage |
| Less than 2.0x | 111 (48.0%) | 65,500 (19,728.9%) |
| 2.0x to 2.9x | 46 (19.9%) | 194 (58.4%) |
| 3.0x to 3.9x | 20 (8.7%) | 30 (9.0%) |
| 4.0x or more | 43 (18.6%) | 46 (13.9%) |
| Total | 231 (100.0%) | 332 (100.0%) |
Real Estate Taxes by Mortgage Status in Newaygo
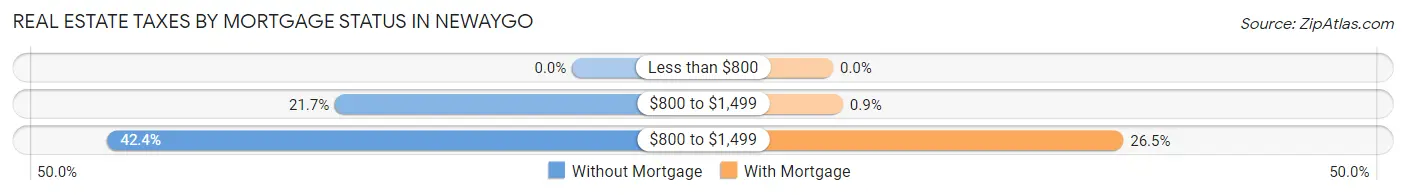
| Property Taxes | Without Mortgage | With Mortgage |
| Less than $800 | 0 (0.0%) | 0 (0.0%) |
| $800 to $1,499 | 50 (21.6%) | 3 (0.9%) |
| $800 to $1,499 | 98 (42.4%) | 88 (26.5%) |
| Total | 231 (100.0%) | 332 (100.0%) |
Health & Disability in Newaygo
Health Insurance Coverage by Age in Newaygo
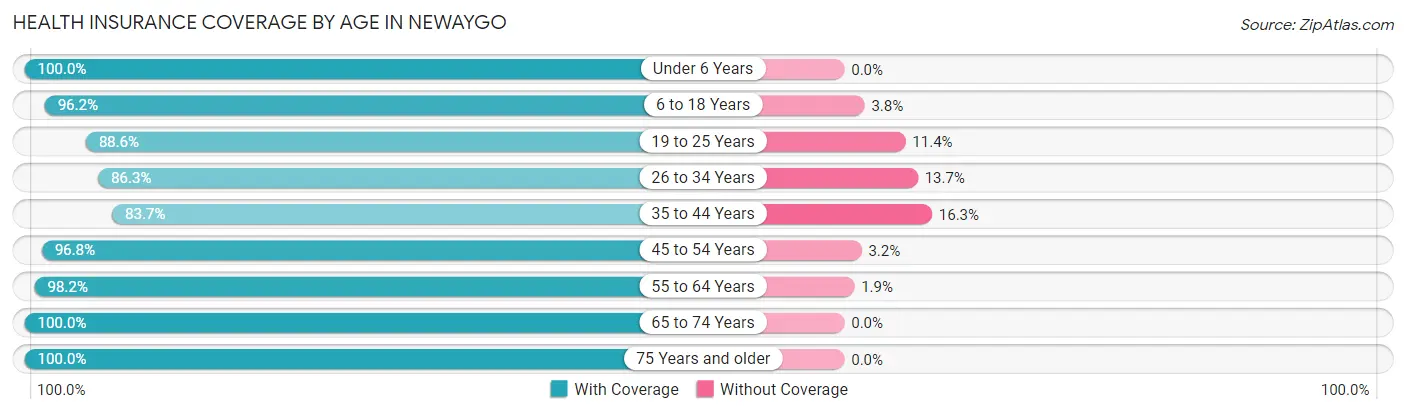
| Age Bracket | With Coverage | Without Coverage |
| Under 6 Years | 125 (100.0%) | 0 (0.0%) |
| 6 to 18 Years | 537 (96.2%) | 21 (3.8%) |
| 19 to 25 Years | 202 (88.6%) | 26 (11.4%) |
| 26 to 34 Years | 271 (86.3%) | 43 (13.7%) |
| 35 to 44 Years | 292 (83.7%) | 57 (16.3%) |
| 45 to 54 Years | 242 (96.8%) | 8 (3.2%) |
| 55 to 64 Years | 266 (98.2%) | 5 (1.8%) |
| 65 to 74 Years | 179 (100.0%) | 0 (0.0%) |
| 75 Years and older | 175 (100.0%) | 0 (0.0%) |
| Total | 2,289 (93.5%) | 160 (6.5%) |
Health Insurance Coverage by Citizenship Status in Newaygo
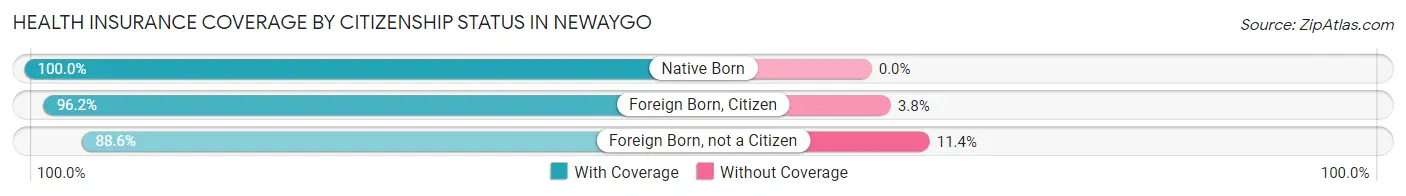
| Citizenship Status | With Coverage | Without Coverage |
| Native Born | 125 (100.0%) | 0 (0.0%) |
| Foreign Born, Citizen | 537 (96.2%) | 21 (3.8%) |
| Foreign Born, not a Citizen | 202 (88.6%) | 26 (11.4%) |
Health Insurance Coverage by Household Income in Newaygo
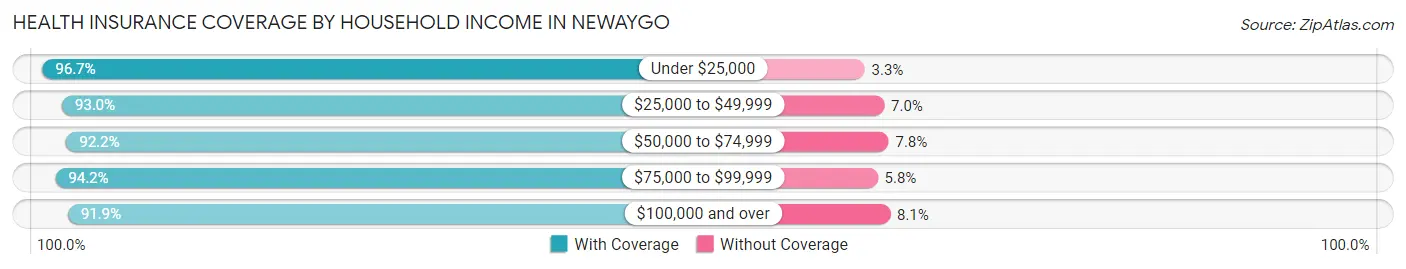
| Household Income | With Coverage | Without Coverage |
| Under $25,000 | 435 (96.7%) | 15 (3.3%) |
| $25,000 to $49,999 | 426 (93.0%) | 32 (7.0%) |
| $50,000 to $74,999 | 566 (92.2%) | 48 (7.8%) |
| $75,000 to $99,999 | 408 (94.2%) | 25 (5.8%) |
| $100,000 and over | 454 (91.9%) | 40 (8.1%) |
Public vs Private Health Insurance Coverage by Age in Newaygo
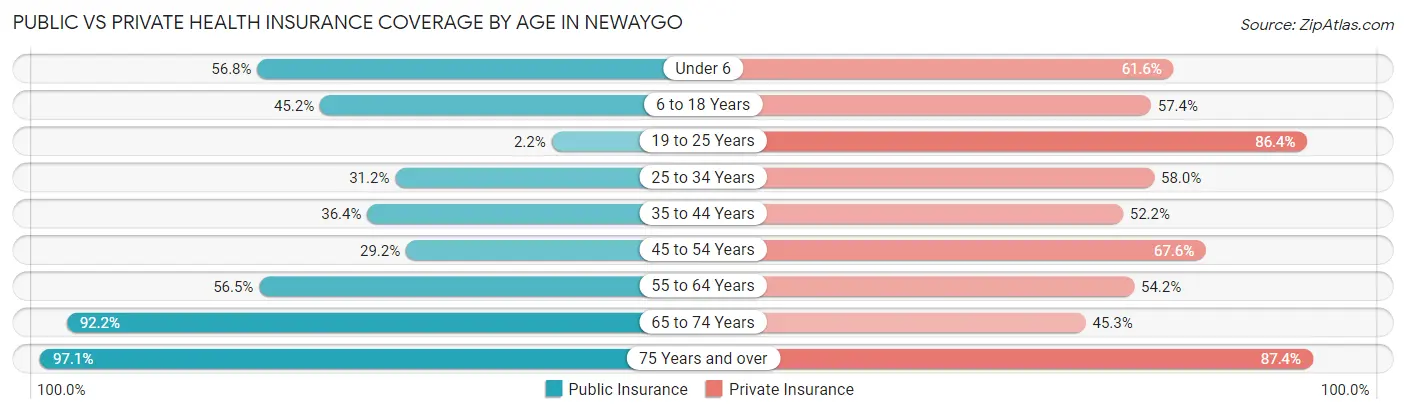
| Age Bracket | Public Insurance | Private Insurance |
| Under 6 | 71 (56.8%) | 77 (61.6%) |
| 6 to 18 Years | 252 (45.2%) | 320 (57.4%) |
| 19 to 25 Years | 5 (2.2%) | 197 (86.4%) |
| 25 to 34 Years | 98 (31.2%) | 182 (58.0%) |
| 35 to 44 Years | 127 (36.4%) | 182 (52.1%) |
| 45 to 54 Years | 73 (29.2%) | 169 (67.6%) |
| 55 to 64 Years | 153 (56.5%) | 147 (54.2%) |
| 65 to 74 Years | 165 (92.2%) | 81 (45.3%) |
| 75 Years and over | 170 (97.1%) | 153 (87.4%) |
| Total | 1,114 (45.5%) | 1,508 (61.6%) |
Disability Status by Sex by Age in Newaygo
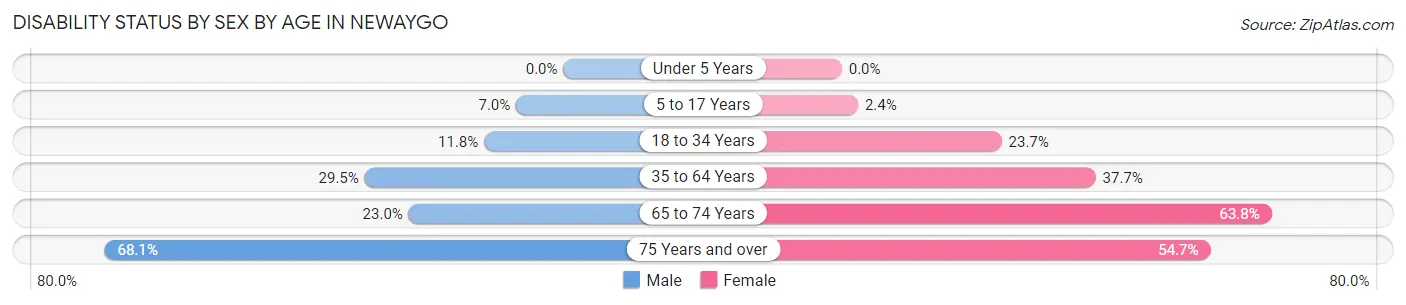
| Age Bracket | Male | Female |
| Under 5 Years | 0 (0.0%) | 0 (0.0%) |
| 5 to 17 Years | 22 (7.0%) | 5 (2.4%) |
| 18 to 34 Years | 35 (11.8%) | 70 (23.7%) |
| 35 to 64 Years | 126 (29.5%) | 167 (37.7%) |
| 65 to 74 Years | 17 (23.0%) | 67 (63.8%) |
| 75 Years and over | 47 (68.1%) | 58 (54.7%) |
Disability Class by Sex by Age in Newaygo
Disability Class: Hearing Difficulty
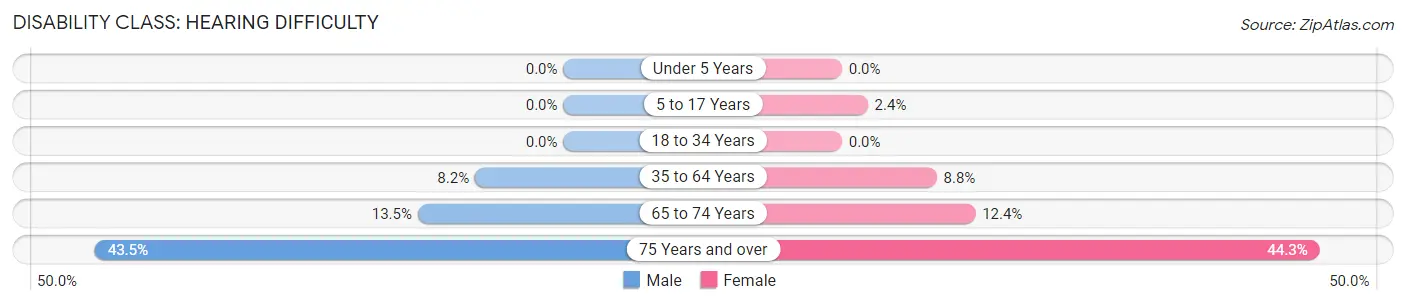
| Age Bracket | Male | Female |
| Under 5 Years | 0 (0.0%) | 0 (0.0%) |
| 5 to 17 Years | 0 (0.0%) | 5 (2.4%) |
| 18 to 34 Years | 0 (0.0%) | 0 (0.0%) |
| 35 to 64 Years | 35 (8.2%) | 39 (8.8%) |
| 65 to 74 Years | 10 (13.5%) | 13 (12.4%) |
| 75 Years and over | 30 (43.5%) | 47 (44.3%) |
Disability Class: Vision Difficulty
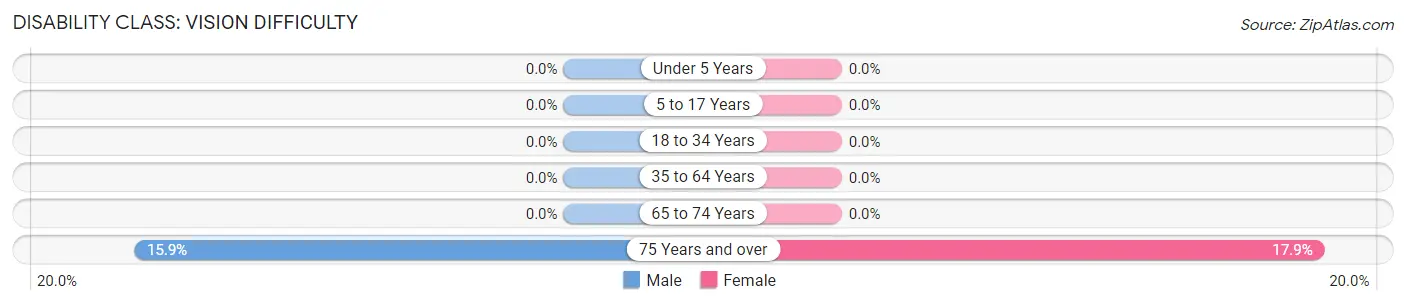
| Age Bracket | Male | Female |
| Under 5 Years | 0 (0.0%) | 0 (0.0%) |
| 5 to 17 Years | 0 (0.0%) | 0 (0.0%) |
| 18 to 34 Years | 0 (0.0%) | 0 (0.0%) |
| 35 to 64 Years | 0 (0.0%) | 0 (0.0%) |
| 65 to 74 Years | 0 (0.0%) | 0 (0.0%) |
| 75 Years and over | 11 (15.9%) | 19 (17.9%) |
Disability Class: Cognitive Difficulty
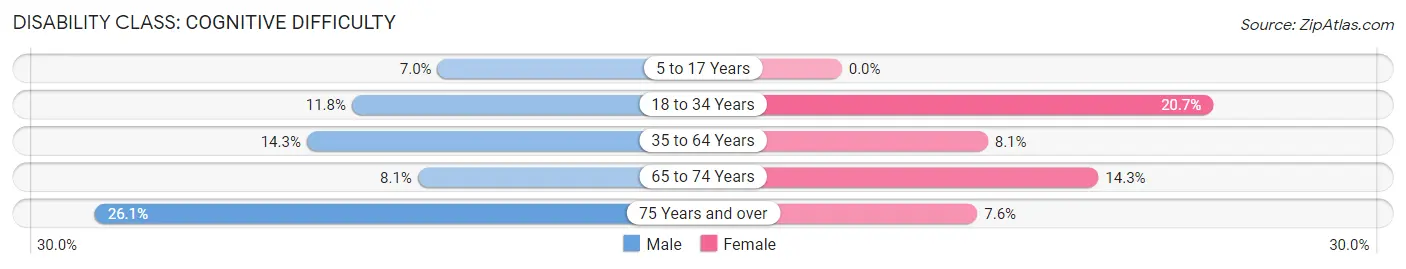
| Age Bracket | Male | Female |
| 5 to 17 Years | 22 (7.0%) | 0 (0.0%) |
| 18 to 34 Years | 35 (11.8%) | 61 (20.7%) |
| 35 to 64 Years | 61 (14.3%) | 36 (8.1%) |
| 65 to 74 Years | 6 (8.1%) | 15 (14.3%) |
| 75 Years and over | 18 (26.1%) | 8 (7.5%) |
Disability Class: Ambulatory Difficulty
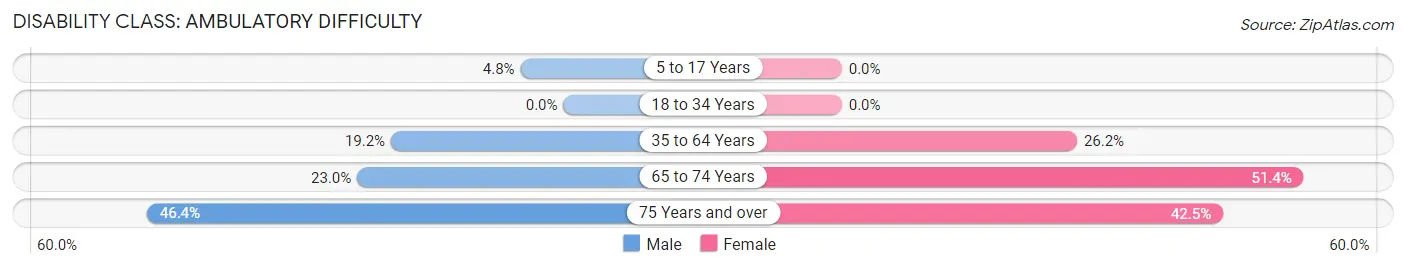
| Age Bracket | Male | Female |
| 5 to 17 Years | 15 (4.8%) | 0 (0.0%) |
| 18 to 34 Years | 0 (0.0%) | 0 (0.0%) |
| 35 to 64 Years | 82 (19.2%) | 116 (26.2%) |
| 65 to 74 Years | 17 (23.0%) | 54 (51.4%) |
| 75 Years and over | 32 (46.4%) | 45 (42.4%) |
Disability Class: Self-Care Difficulty
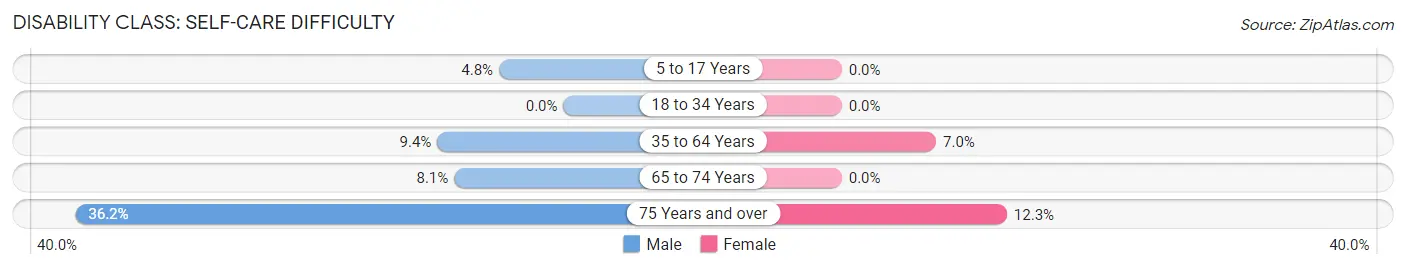
| Age Bracket | Male | Female |
| 5 to 17 Years | 15 (4.8%) | 0 (0.0%) |
| 18 to 34 Years | 0 (0.0%) | 0 (0.0%) |
| 35 to 64 Years | 40 (9.4%) | 31 (7.0%) |
| 65 to 74 Years | 6 (8.1%) | 0 (0.0%) |
| 75 Years and over | 25 (36.2%) | 13 (12.3%) |
Technology Access in Newaygo
Computing Device Access in Newaygo
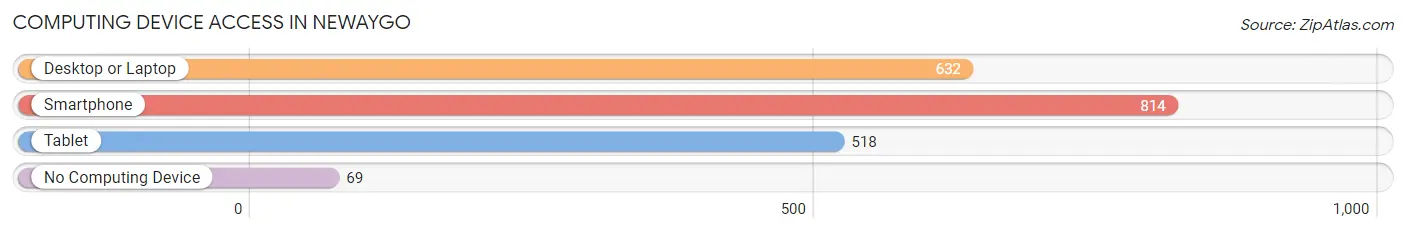
| Device Type | # Households | % Households |
| Desktop or Laptop | 632 | 66.0% |
| Smartphone | 814 | 85.1% |
| Tablet | 518 | 54.1% |
| No Computing Device | 69 | 7.2% |
| Total | 957 | 100.0% |
Internet Access in Newaygo
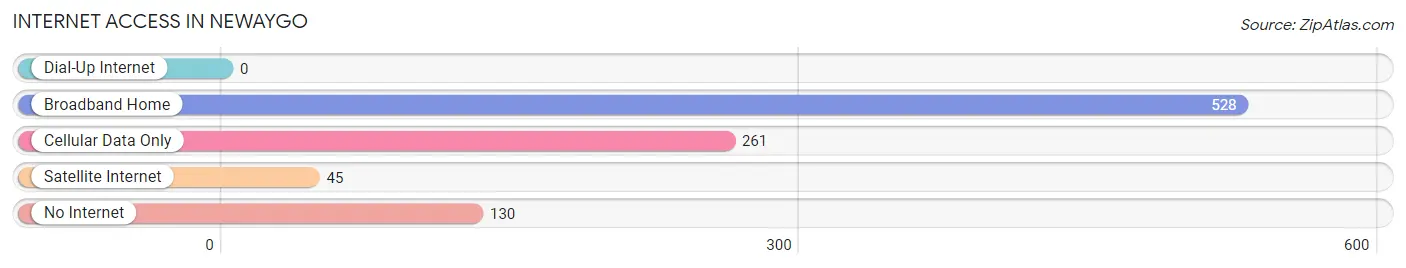
| Internet Type | # Households | % Households |
| Dial-Up Internet | 0 | 0.0% |
| Broadband Home | 528 | 55.2% |
| Cellular Data Only | 261 | 27.3% |
| Satellite Internet | 45 | 4.7% |
| No Internet | 130 | 13.6% |
| Total | 957 | 100.0% |
Newaygo Summary
Newaygo is a city located in the U.S. state of Michigan. It is the county seat of Newaygo County and is situated along the Muskegon River. The city is located in the central part of the state, about 40 miles northeast of Grand Rapids. As of the 2010 census, the city had a population of 4,844.
History
The area that is now Newaygo was first settled in 1837 by a group of settlers from New York. The settlement was originally known as "New York Settlement" and was later changed to "Newaygo" in 1851. The name is derived from the Ojibwe word "Nawe-we-go" which means "far away".
The city was incorporated in 1867 and was designated as the county seat of Newaygo County in 1873. The city grew rapidly in the late 19th and early 20th centuries, becoming a center for lumber and paper production. The city was also home to several factories, including a paper mill, a sawmill, and a furniture factory.
Geography
Newaygo is located at 43°25'N 85°48'W (43.4139, -85.7983). According to the United States Census Bureau, the city has a total area of 4.2 square miles (10.8 km2), all land.
The city is situated along the Muskegon River, which flows through the city from north to south. The city is surrounded by several lakes, including Big Star Lake, Croton Pond, and Little Star Lake.
Economy
Newaygo's economy is largely based on manufacturing and tourism. The city is home to several factories, including a paper mill, a sawmill, and a furniture factory. The city is also home to several tourist attractions, including the Newaygo County Historical Museum, the Newaygo County Fairgrounds, and the Newaygo County Park.
Demographics
As of the 2010 census, there were 4,844 people, 1,945 households, and 1,269 families residing in the city. The population density was 1,154.3 people per square mile (446.3/km2). There were 2,093 housing units at an average density of 498.3 per square mile (192.2/km2). The racial makeup of the city was 94.2% White, 0.7% African American, 0.7% Native American, 0.4% Asian, 0.1% Pacific Islander, 1.7% from other races, and 2.2% from two or more races. Hispanic or Latino of any race were 4.2% of the population.
There were 1,945 households, out of which 32.2% had children under the age of 18 living with them, 46.2% were married couples living together, 14.2% had a female householder with no husband present, and 34.2% were non-families. 28.3% of all households were made up of individuals, and 11.2% had someone living alone who was 65 years of age or older. The average household size was 2.48 and the average family size was 3.02.
In the city, the population was spread out, with 26.2% under the age of 18, 8.2% from 18 to 24, 28.7% from 25 to 44, 22.3% from 45 to 64, and 14.6% who were 65 years of age or older. The median age was 36 years. For every 100 females, there were 93.2 males. For every 100 females age 18 and over, there were 89.2 males.
The median income for a household in the city was $35,938, and the median income for a family was $43,958. Males had a median income of $35,938 versus $25,938 for females. The per capita income for the city was $17,945. About 9.2% of families and 11.7% of the population were below the poverty line, including 15.2% of those under age 18 and 8.2% of those age 65 or over.
Common Questions
What is Per Capita Income in Newaygo?
Per Capita income in Newaygo is $29,400.
What is the Median Family Income in Newaygo?
Median Family Income in Newaygo is $64,833.
What is the Median Household income in Newaygo?
Median Household Income in Newaygo is $45,733.
What is Income or Wage Gap in Newaygo?
Income or Wage Gap in Newaygo is 10.6%.
Women in Newaygo earn 89.4 cents for every dollar earned by a man.
What is Inequality or Gini Index in Newaygo?
Inequality or Gini Index in Newaygo is 0.53.
What is the Total Population of Newaygo?
Total Population of Newaygo is 2,458.
What is the Total Male Population of Newaygo?
Total Male Population of Newaygo is 1,240.
What is the Total Female Population of Newaygo?
Total Female Population of Newaygo is 1,218.
What is the Ratio of Males per 100 Females in Newaygo?
There are 101.81 Males per 100 Females in Newaygo.
What is the Ratio of Females per 100 Males in Newaygo?
There are 98.23 Females per 100 Males in Newaygo.
What is the Median Population Age in Newaygo?
Median Population Age in Newaygo is 35.2 Years.
What is the Average Family Size in Newaygo
Average Family Size in Newaygo is 3.3 People.
What is the Average Household Size in Newaygo
Average Household Size in Newaygo is 2.6 People.
How Large is the Labor Force in Newaygo?
There are 1,128 People in the Labor Forcein in Newaygo.
What is the Percentage of People in the Labor Force in Newaygo?
58.7% of People are in the Labor Force in Newaygo.
What is the Unemployment Rate in Newaygo?
Unemployment Rate in Newaygo is 5.9%.