Luther, MI Map & Demographics
Luther Map
Luther Overview
$26,270
PER CAPITA INCOME
$55,313
AVG FAMILY INCOME
$50,278
AVG HOUSEHOLD INCOME
6.4%
WAGE / INCOME GAP [ % ]
93.6¢/ $1
WAGE / INCOME GAP [ $ ]
0.39
INEQUALITY / GINI INDEX
269
TOTAL POPULATION
152
MALE POPULATION
117
FEMALE POPULATION
129.91
MALES / 100 FEMALES
76.97
FEMALES / 100 MALES
48.5
MEDIAN AGE
2.9
AVG FAMILY SIZE
2.3
AVG HOUSEHOLD SIZE
118
LABOR FORCE [ PEOPLE ]
50.9%
PERCENT IN LABOR FORCE
8.5%
UNEMPLOYMENT RATE
Luther Zip Codes
Luther Area Codes
Income in Luther
Income Overview in Luther
Per Capita Income in Luther is $26,270, while median incomes of families and households are $55,313 and $50,278 respectively.
| Characteristic | Number | Measure |
| Per Capita Income | 269 | $26,270 |
| Median Family Income | 76 | $55,313 |
| Mean Family Income | 76 | $65,663 |
| Median Household Income | 116 | $50,278 |
| Mean Household Income | 116 | $51,391 |
| Income Deficit | 76 | $0 |
| Wage / Income Gap (%) | 269 | 6.35% |
| Wage / Income Gap ($) | 269 | 93.65¢ per $1 |
| Gini / Inequality Index | 269 | 0.39 |
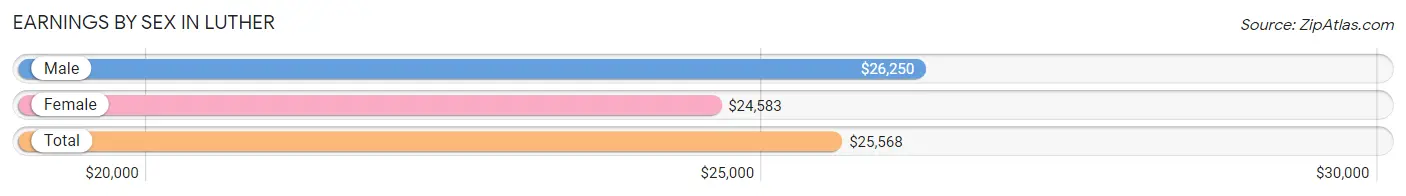
Earnings by Sex in Luther
Average Earnings in Luther are $25,568, $26,250 for men and $24,583 for women, a difference of 6.4%.
| Sex | Number | Average Earnings |
| Male | 86 (61.9%) | $26,250 |
| Female | 53 (38.1%) | $24,583 |
| Total | 139 (100.0%) | $25,568 |
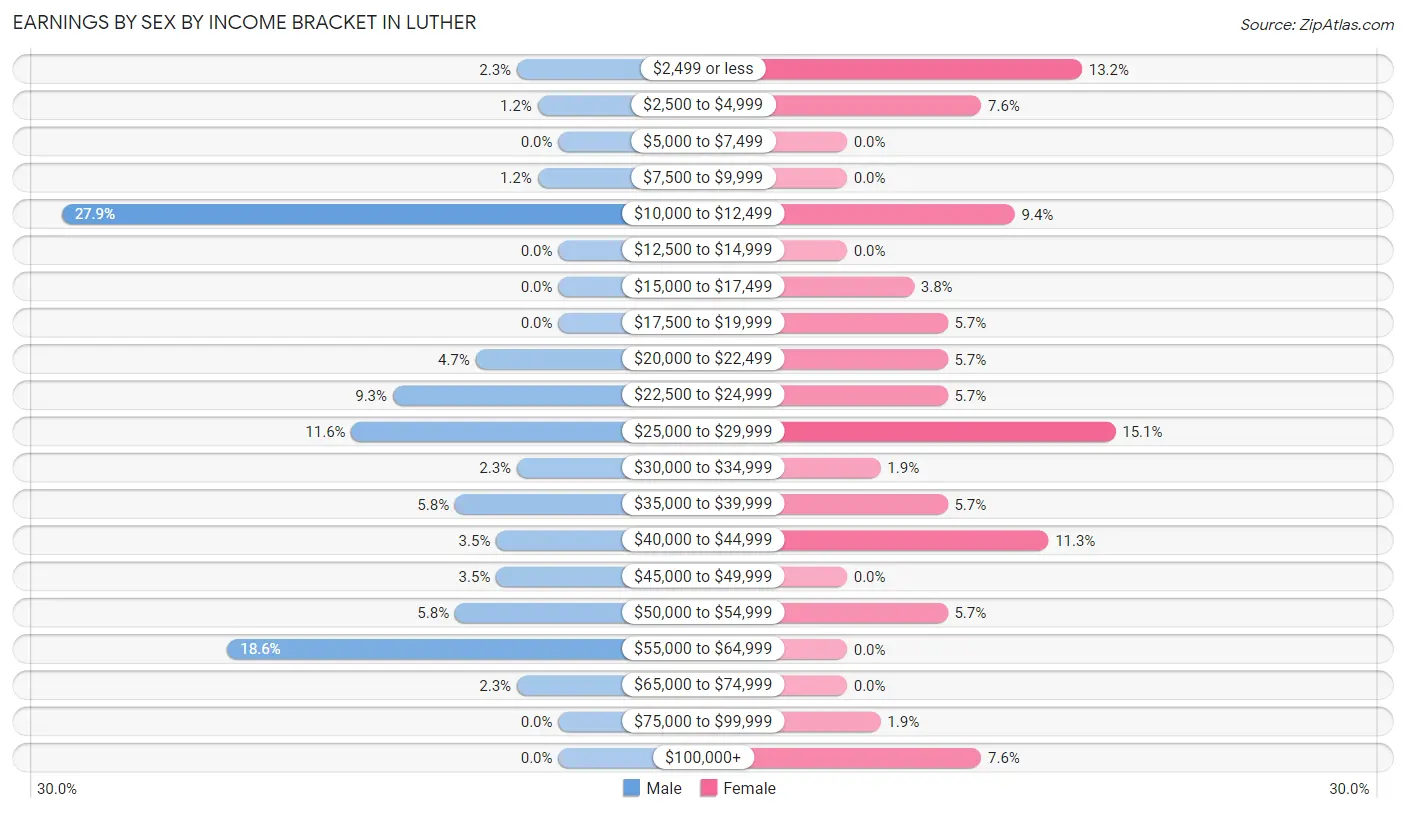
Earnings by Sex by Income Bracket in Luther
The most common earnings brackets in Luther are $10,000 to $12,499 for men (24 | 27.9%) and $25,000 to $29,999 for women (8 | 15.1%).
| Income | Male | Female |
| $2,499 or less | 2 (2.3%) | 7 (13.2%) |
| $2,500 to $4,999 | 1 (1.2%) | 4 (7.5%) |
| $5,000 to $7,499 | 0 (0.0%) | 0 (0.0%) |
| $7,500 to $9,999 | 1 (1.2%) | 0 (0.0%) |
| $10,000 to $12,499 | 24 (27.9%) | 5 (9.4%) |
| $12,500 to $14,999 | 0 (0.0%) | 0 (0.0%) |
| $15,000 to $17,499 | 0 (0.0%) | 2 (3.8%) |
| $17,500 to $19,999 | 0 (0.0%) | 3 (5.7%) |
| $20,000 to $22,499 | 4 (4.6%) | 3 (5.7%) |
| $22,500 to $24,999 | 8 (9.3%) | 3 (5.7%) |
| $25,000 to $29,999 | 10 (11.6%) | 8 (15.1%) |
| $30,000 to $34,999 | 2 (2.3%) | 1 (1.9%) |
| $35,000 to $39,999 | 5 (5.8%) | 3 (5.7%) |
| $40,000 to $44,999 | 3 (3.5%) | 6 (11.3%) |
| $45,000 to $49,999 | 3 (3.5%) | 0 (0.0%) |
| $50,000 to $54,999 | 5 (5.8%) | 3 (5.7%) |
| $55,000 to $64,999 | 16 (18.6%) | 0 (0.0%) |
| $65,000 to $74,999 | 2 (2.3%) | 0 (0.0%) |
| $75,000 to $99,999 | 0 (0.0%) | 1 (1.9%) |
| $100,000+ | 0 (0.0%) | 4 (7.5%) |
| Total | 86 (100.0%) | 53 (100.0%) |
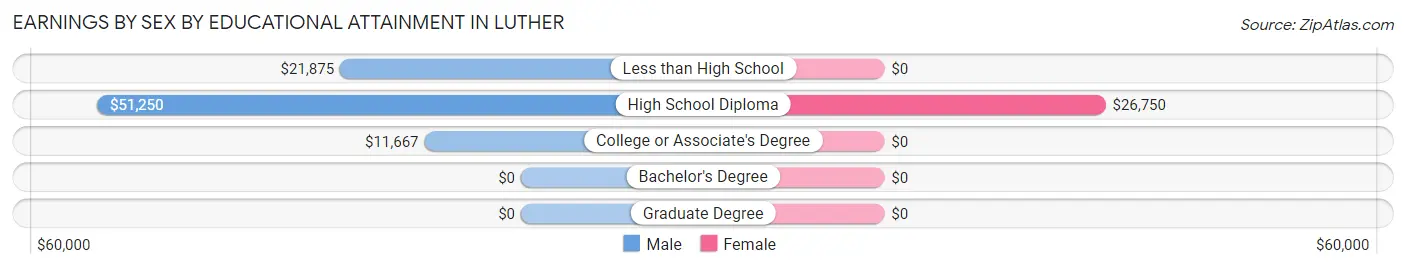
Earnings by Sex by Educational Attainment in Luther
Average earnings in Luther are $22,679 for men and $26,250 for women, a difference of 13.6%. Men with an educational attainment of high school diploma enjoy the highest average annual earnings of $51,250, while those with college or associate's degree education earn the least with $11,667. Women with an educational attainment of high school diploma earn the most with the average annual earnings of $26,750, while those with high school diploma education have the smallest earnings of $26,750.
| Educational Attainment | Male Income | Female Income |
| Less than High School | $21,875 | $0 |
| High School Diploma | $51,250 | $26,750 |
| College or Associate's Degree | $11,667 | $0 |
| Bachelor's Degree | - | - |
| Graduate Degree | - | - |
| Total | $22,679 | $26,250 |
Family Income in Luther
Family Income Brackets in Luther
According to the Luther family income data, there are 36 families falling into the $50,000 to $74,999 income range, which is the most common income bracket and makes up 47.4% of all families.
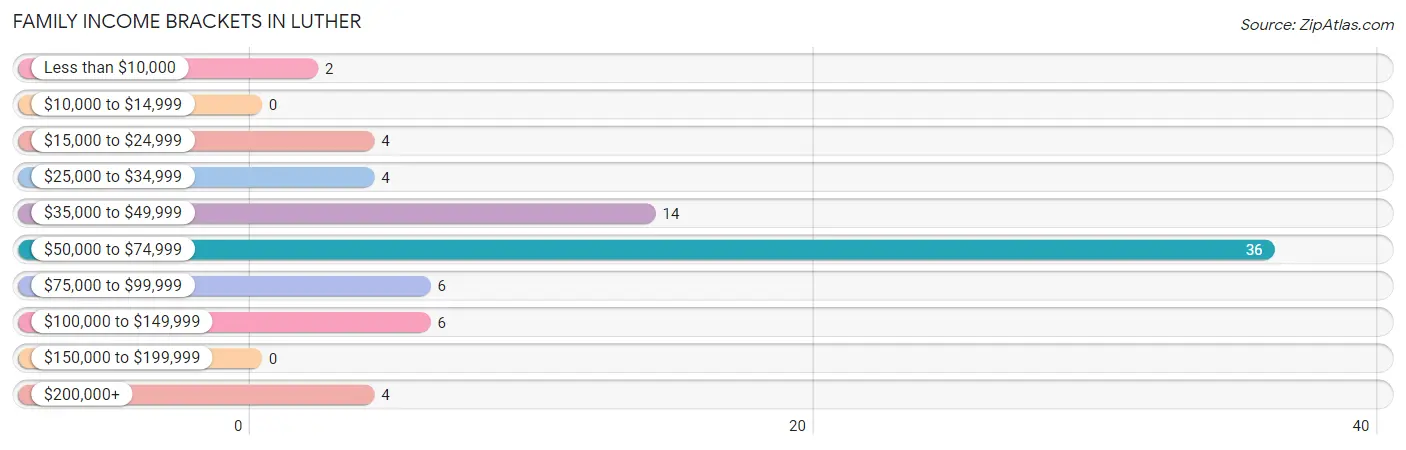
| Income Bracket | # Families | % Families |
| Less than $10,000 | 2 | 2.6% |
| $10,000 to $14,999 | 0 | 0.0% |
| $15,000 to $24,999 | 4 | 5.3% |
| $25,000 to $34,999 | 4 | 5.3% |
| $35,000 to $49,999 | 14 | 18.4% |
| $50,000 to $74,999 | 36 | 47.4% |
| $75,000 to $99,999 | 6 | 7.9% |
| $100,000 to $149,999 | 6 | 7.9% |
| $150,000 to $199,999 | 0 | 0.0% |
| $200,000+ | 4 | 5.3% |
Family Income by Famaliy Size in Luther
3-person families (13 | 17.1%) account for the highest median family income in Luther with $57,917 per family, while 2-person families (56 | 73.7%) have the highest median income of $27,734 per family member.
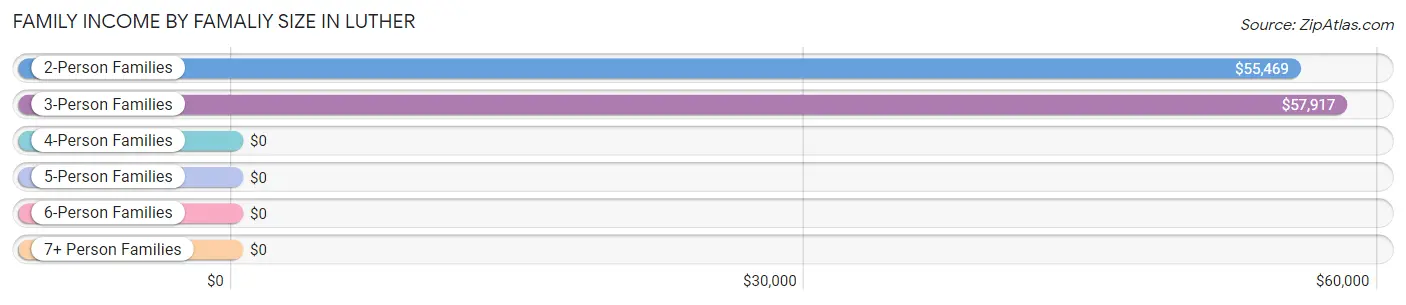
| Income Bracket | # Families | Median Income |
| 2-Person Families | 56 (73.7%) | $55,469 |
| 3-Person Families | 13 (17.1%) | $57,917 |
| 4-Person Families | 3 (4.0%) | $0 |
| 5-Person Families | 2 (2.6%) | $0 |
| 6-Person Families | 0 (0.0%) | $0 |
| 7+ Person Families | 2 (2.6%) | $0 |
| Total | 76 (100.0%) | $55,313 |
Family Income by Number of Earners in Luther
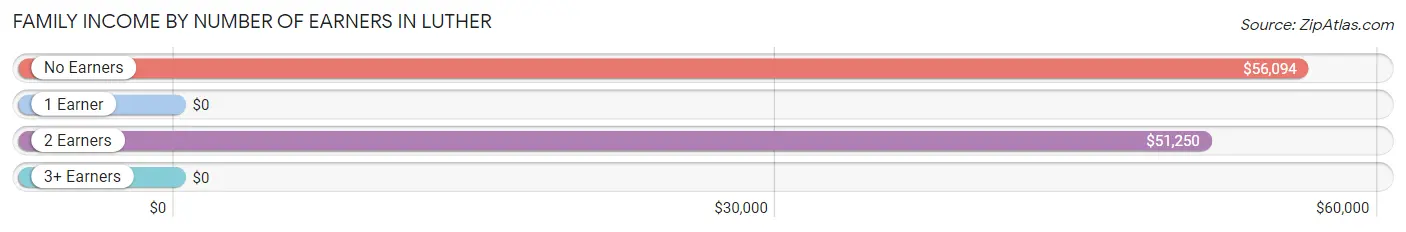
| Number of Earners | # Families | Median Income |
| No Earners | 28 (36.8%) | $56,094 |
| 1 Earner | 17 (22.4%) | $0 |
| 2 Earners | 28 (36.8%) | $51,250 |
| 3+ Earners | 3 (4.0%) | $0 |
| Total | 76 (100.0%) | $55,313 |
Household Income in Luther
Household Income Brackets in Luther
With 43 households falling in the category, the $50,000 to $74,999 income range is the most frequent in Luther, accounting for 37.1% of all households.
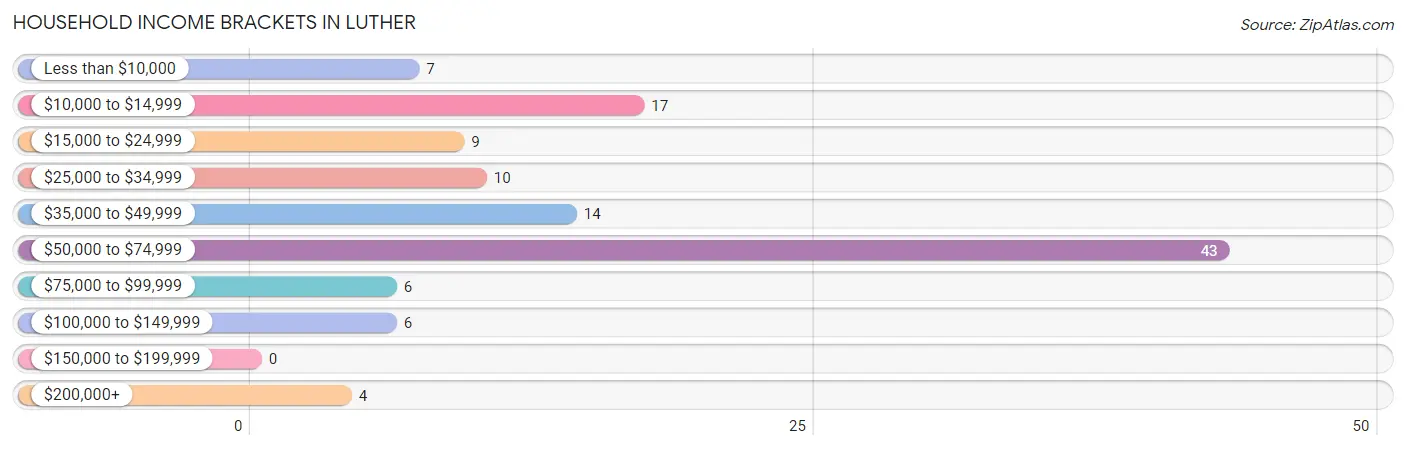
| Income Bracket | # Households | % Households |
| Less than $10,000 | 7 | 6.0% |
| $10,000 to $14,999 | 17 | 14.7% |
| $15,000 to $24,999 | 9 | 7.8% |
| $25,000 to $34,999 | 10 | 8.6% |
| $35,000 to $49,999 | 14 | 12.1% |
| $50,000 to $74,999 | 43 | 37.1% |
| $75,000 to $99,999 | 6 | 5.2% |
| $100,000 to $149,999 | 6 | 5.2% |
| $150,000 to $199,999 | 0 | 0.0% |
| $200,000+ | 4 | 3.4% |
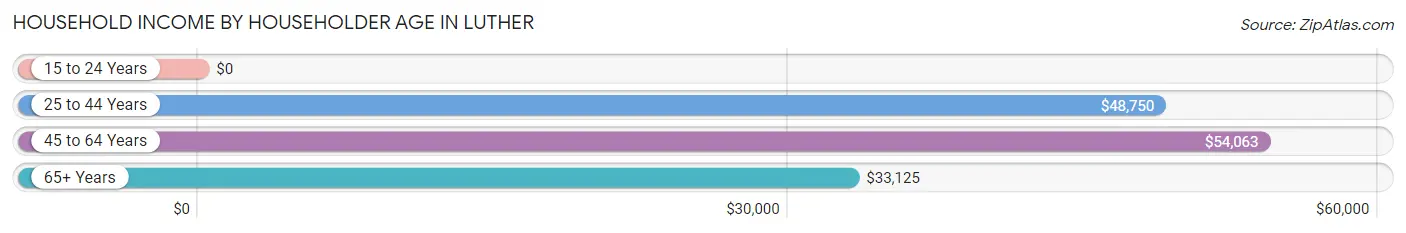
Household Income by Householder Age in Luther
The median household income in Luther is $50,278, with the highest median household income of $54,063 found in the 45 to 64 years age bracket for the primary householder. A total of 61 households (52.6%) fall into this category. Meanwhile, the 15 to 24 years age bracket for the primary householder has the lowest median household income of $0, with 1 households (0.9%) in this group.
| Income Bracket | # Households | Median Income |
| 15 to 24 Years | 1 (0.9%) | $0 |
| 25 to 44 Years | 22 (19.0%) | $48,750 |
| 45 to 64 Years | 61 (52.6%) | $54,063 |
| 65+ Years | 32 (27.6%) | $33,125 |
| Total | 116 (100.0%) | $50,278 |
Poverty in Luther
Income Below Poverty by Sex and Age in Luther
With 22.4% poverty level for males and 22.2% for females among the residents of Luther, under 5 year old males and 25 to 34 year old females are the most vulnerable to poverty, with 6 males (100.0%) and 7 females (100.0%) in their respective age groups living below the poverty level.
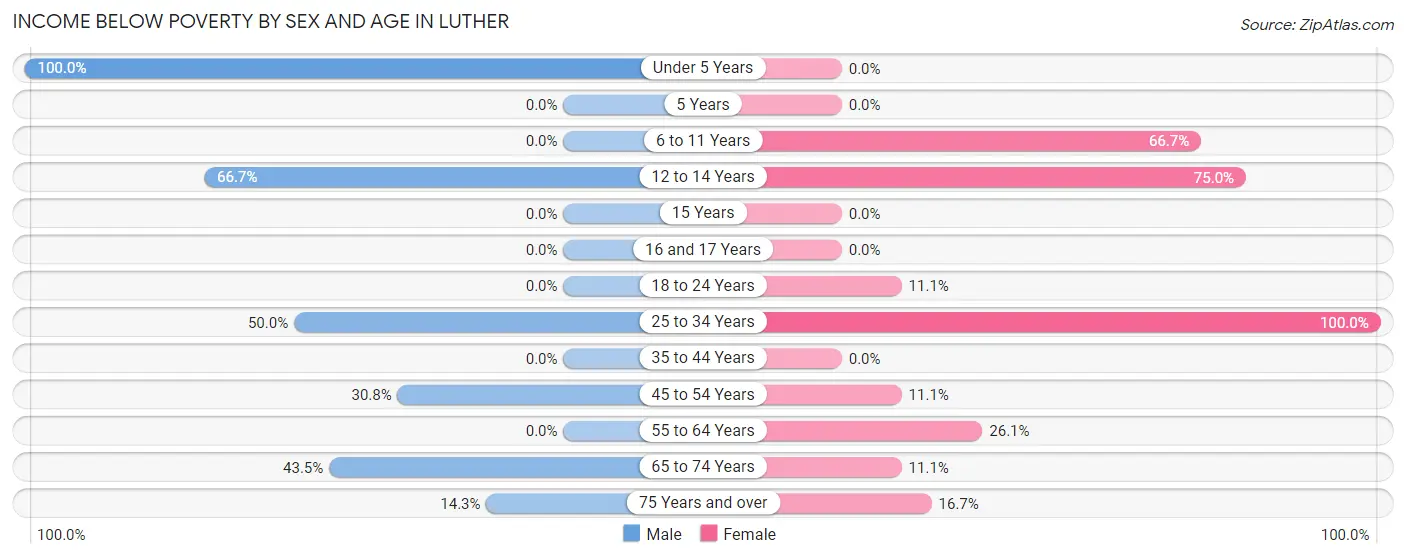
| Age Bracket | Male | Female |
| Under 5 Years | 6 (100.0%) | 0 (0.0%) |
| 5 Years | 0 (0.0%) | 0 (0.0%) |
| 6 to 11 Years | 0 (0.0%) | 4 (66.7%) |
| 12 to 14 Years | 4 (66.7%) | 3 (75.0%) |
| 15 Years | 0 (0.0%) | 0 (0.0%) |
| 16 and 17 Years | 0 (0.0%) | 0 (0.0%) |
| 18 to 24 Years | 0 (0.0%) | 1 (11.1%) |
| 25 to 34 Years | 1 (50.0%) | 7 (100.0%) |
| 35 to 44 Years | 0 (0.0%) | 0 (0.0%) |
| 45 to 54 Years | 12 (30.8%) | 2 (11.1%) |
| 55 to 64 Years | 0 (0.0%) | 6 (26.1%) |
| 65 to 74 Years | 10 (43.5%) | 1 (11.1%) |
| 75 Years and over | 1 (14.3%) | 2 (16.7%) |
| Total | 34 (22.4%) | 26 (22.2%) |
Income Above Poverty by Sex and Age in Luther
According to the poverty statistics in Luther, males aged 5 years and females aged under 5 years are the age groups that are most secure financially, with 100.0% of males and 100.0% of females in these age groups living above the poverty line.
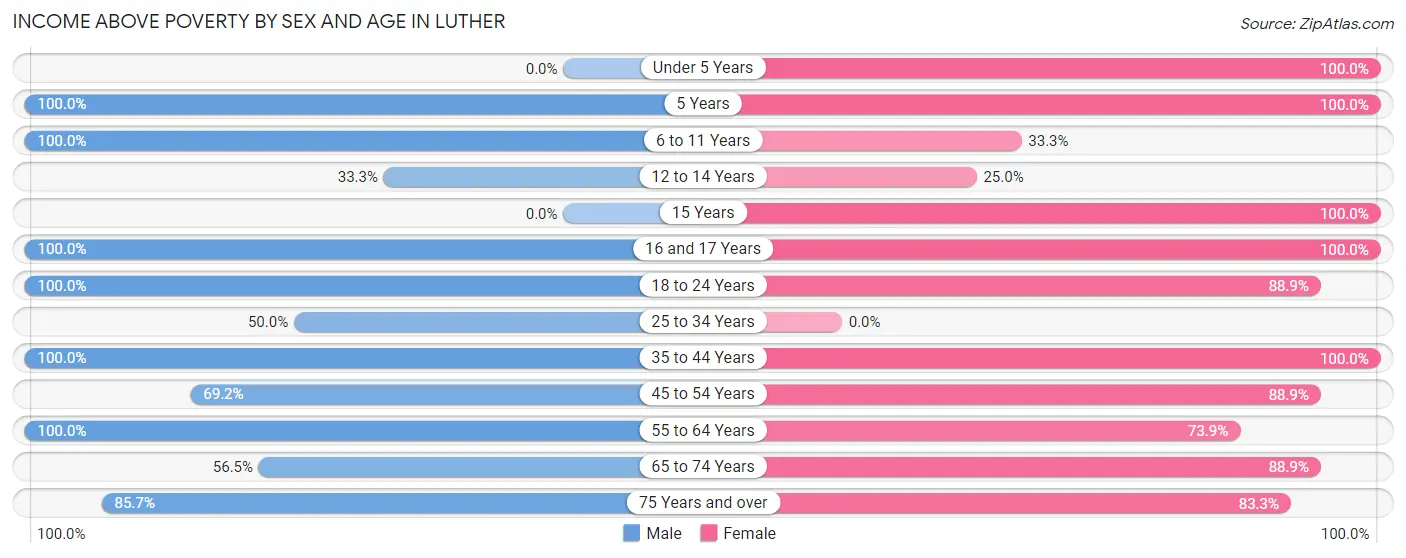
| Age Bracket | Male | Female |
| Under 5 Years | 0 (0.0%) | 9 (100.0%) |
| 5 Years | 2 (100.0%) | 1 (100.0%) |
| 6 to 11 Years | 2 (100.0%) | 2 (33.3%) |
| 12 to 14 Years | 2 (33.3%) | 1 (25.0%) |
| 15 Years | 0 (0.0%) | 1 (100.0%) |
| 16 and 17 Years | 1 (100.0%) | 5 (100.0%) |
| 18 to 24 Years | 22 (100.0%) | 8 (88.9%) |
| 25 to 34 Years | 1 (50.0%) | 0 (0.0%) |
| 35 to 44 Years | 31 (100.0%) | 13 (100.0%) |
| 45 to 54 Years | 27 (69.2%) | 16 (88.9%) |
| 55 to 64 Years | 11 (100.0%) | 17 (73.9%) |
| 65 to 74 Years | 13 (56.5%) | 8 (88.9%) |
| 75 Years and over | 6 (85.7%) | 10 (83.3%) |
| Total | 118 (77.6%) | 91 (77.8%) |
Income Below Poverty Among Married-Couple Families in Luther
The poverty statistics for married-couple families in Luther show that 5.3% or 3 of the total 57 families live below the poverty line. Families with 1 or 2 children have the highest poverty rate of 50.0%, comprising of 3 families. On the other hand, families with no children have the lowest poverty rate of 0.0%, which includes 0 families.
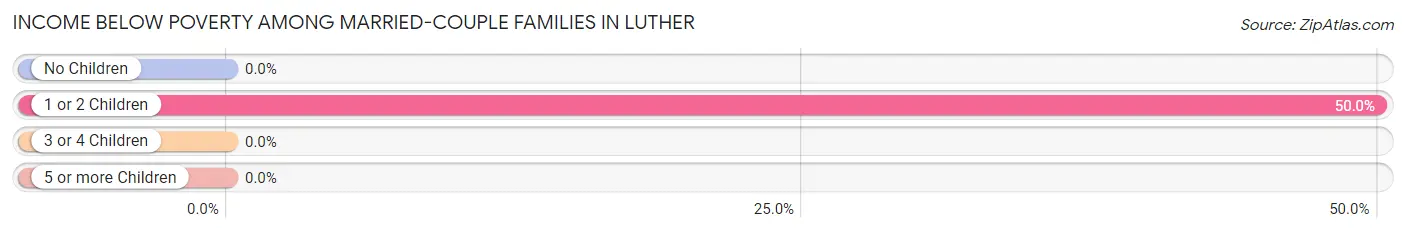
| Children | Above Poverty | Below Poverty |
| No Children | 49 (100.0%) | 0 (0.0%) |
| 1 or 2 Children | 3 (50.0%) | 3 (50.0%) |
| 3 or 4 Children | 2 (100.0%) | 0 (0.0%) |
| 5 or more Children | 0 (0.0%) | 0 (0.0%) |
| Total | 54 (94.7%) | 3 (5.3%) |
Income Below Poverty Among Single-Parent Households in Luther
According to the poverty data in Luther, 16.7% or 1 single-father households and 30.8% or 4 single-mother households are living below the poverty line. Among single-father households, those with no children have the highest poverty rate, with 1 households (100.0%) experiencing poverty. Likewise, among single-mother households, those with 1 or 2 children have the highest poverty rate, with 3 households (100.0%) falling below the poverty line.
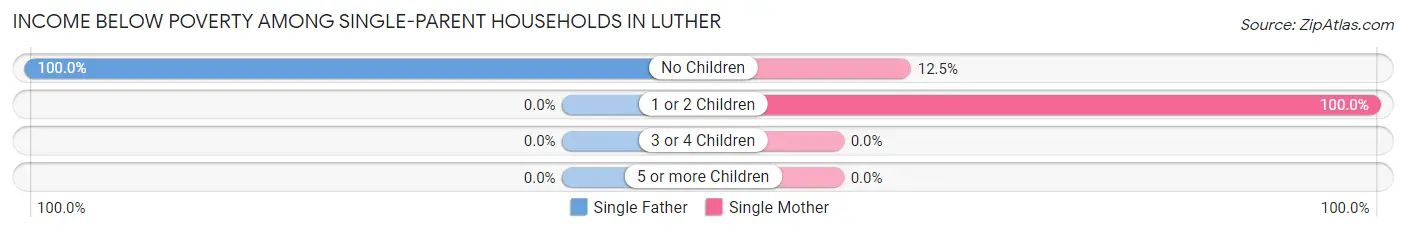
| Children | Single Father | Single Mother |
| No Children | 1 (100.0%) | 1 (12.5%) |
| 1 or 2 Children | 0 (0.0%) | 3 (100.0%) |
| 3 or 4 Children | 0 (0.0%) | 0 (0.0%) |
| 5 or more Children | 0 (0.0%) | 0 (0.0%) |
| Total | 1 (16.7%) | 4 (30.8%) |
Income Below Poverty Among Married-Couple vs Single-Parent Households in Luther
The poverty data for Luther shows that 3 of the married-couple family households (5.3%) and 5 of the single-parent households (26.3%) are living below the poverty level. Within the married-couple family households, those with 1 or 2 children have the highest poverty rate, with 3 households (50.0%) falling below the poverty line. Among the single-parent households, those with 1 or 2 children have the highest poverty rate, with 3 household (37.5%) living below poverty.
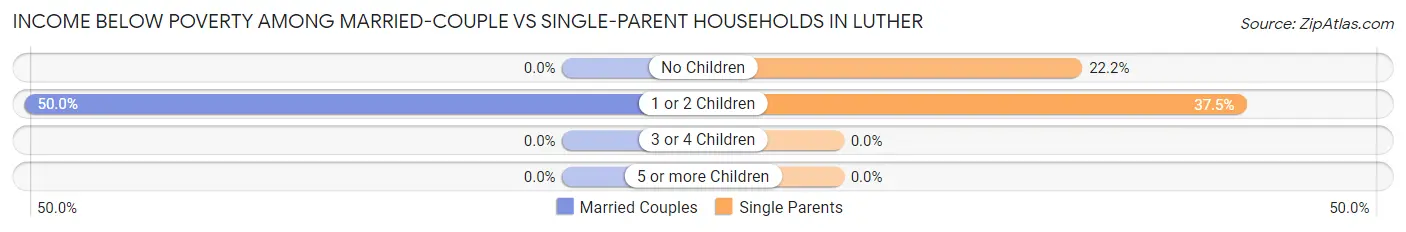
| Children | Married-Couple Families | Single-Parent Households |
| No Children | 0 (0.0%) | 2 (22.2%) |
| 1 or 2 Children | 3 (50.0%) | 3 (37.5%) |
| 3 or 4 Children | 0 (0.0%) | 0 (0.0%) |
| 5 or more Children | 0 (0.0%) | 0 (0.0%) |
| Total | 3 (5.3%) | 5 (26.3%) |
Race in Luther
The most populous races in Luther are White / Caucasian (260 | 96.7%), Hispanic or Latino (31 | 11.5%), and Two or more Races (5 | 1.9%).
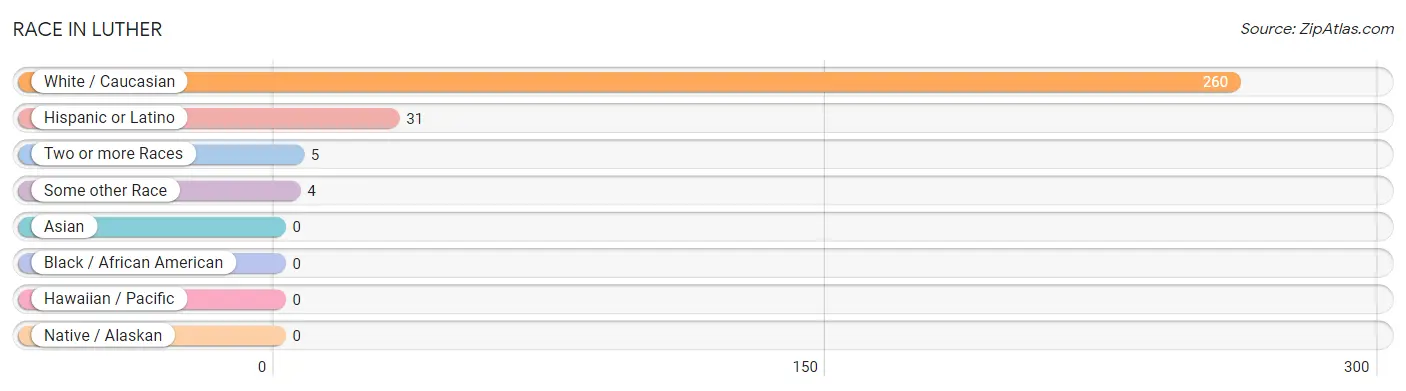
| Race | # Population | % Population |
| Asian | 0 | 0.0% |
| Black / African American | 0 | 0.0% |
| Hawaiian / Pacific | 0 | 0.0% |
| Hispanic or Latino | 31 | 11.5% |
| Native / Alaskan | 0 | 0.0% |
| White / Caucasian | 260 | 96.7% |
| Two or more Races | 5 | 1.9% |
| Some other Race | 4 | 1.5% |
| Total | 269 | 100.0% |
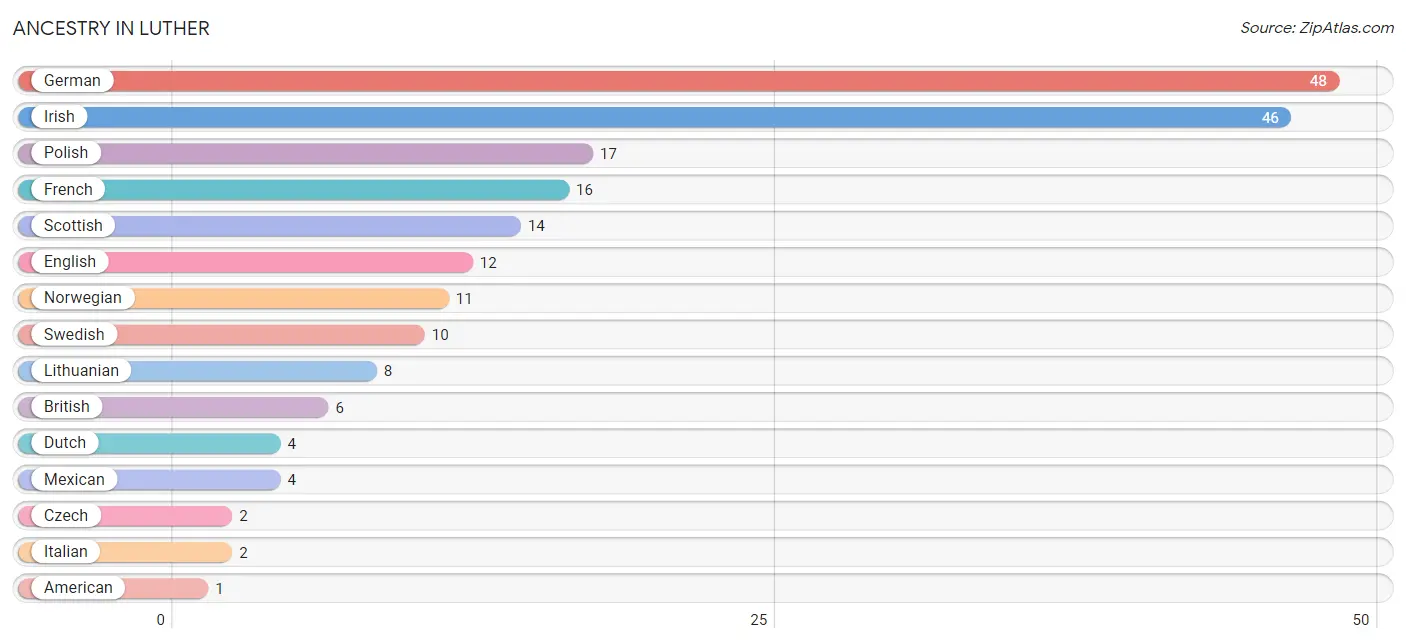
Ancestry in Luther
The most populous ancestries reported in Luther are German (48 | 17.8%), Irish (46 | 17.1%), Polish (17 | 6.3%), French (16 | 5.9%), and Scottish (14 | 5.2%), together accounting for 52.4% of all Luther residents.
| Ancestry | # Population | % Population |
| American | 1 | 0.4% |
| Belgian | 1 | 0.4% |
| British | 6 | 2.2% |
| Czech | 2 | 0.7% |
| Dutch | 4 | 1.5% |
| English | 12 | 4.5% |
| French | 16 | 5.9% |
| German | 48 | 17.8% |
| Irish | 46 | 17.1% |
| Italian | 2 | 0.7% |
| Lithuanian | 8 | 3.0% |
| Mexican | 4 | 1.5% |
| Norwegian | 11 | 4.1% |
| Polish | 17 | 6.3% |
| Romanian | 1 | 0.4% |
| Scotch-Irish | 1 | 0.4% |
| Scottish | 14 | 5.2% |
| Swedish | 10 | 3.7% | View All 18 Rows |
Immigrants in Luther

| Immigration Origin | # Population | % Population | View All 0 Rows |
Sex and Age in Luther
Sex and Age in Luther
The most populous age groups in Luther are 50 to 54 Years (33 | 21.7%) for men and 60 to 64 Years (12 | 10.3%) for women.
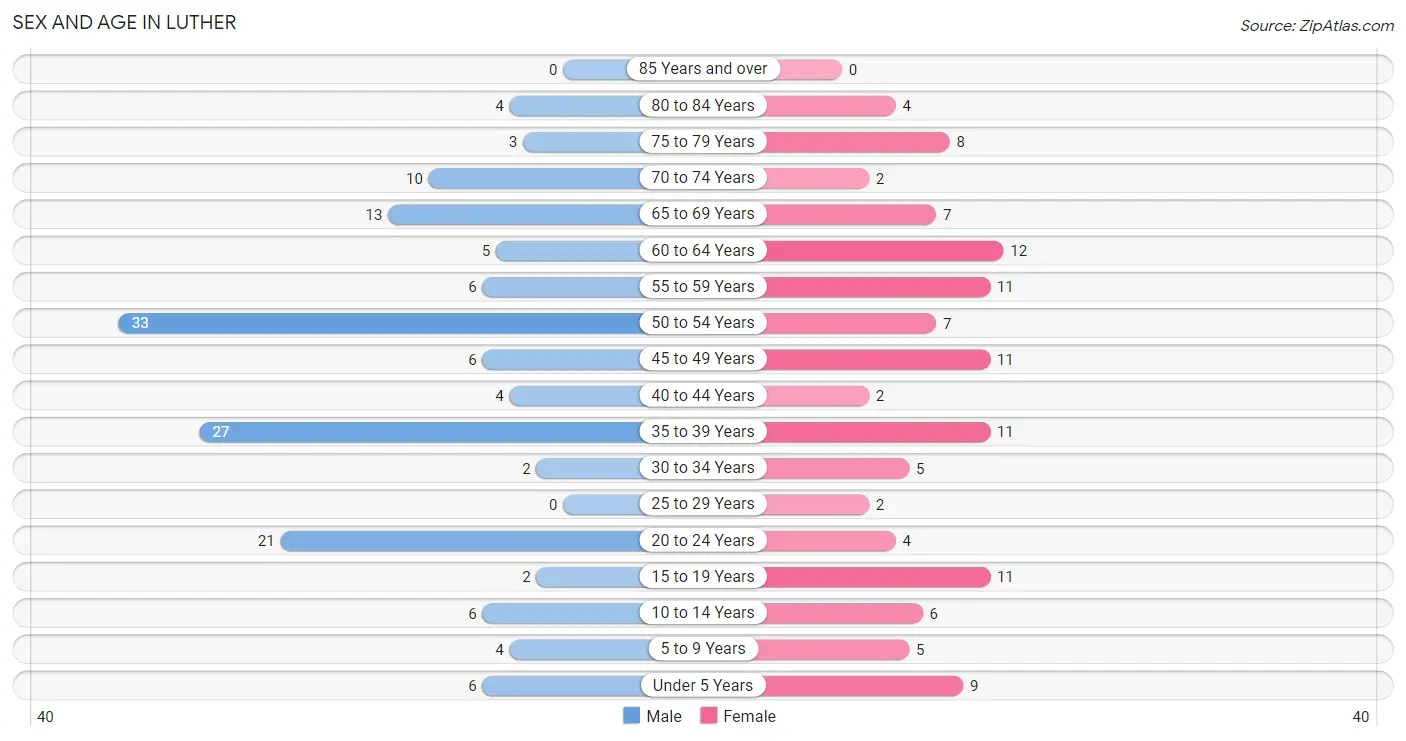
| Age Bracket | Male | Female |
| Under 5 Years | 6 (4.0%) | 9 (7.7%) |
| 5 to 9 Years | 4 (2.6%) | 5 (4.3%) |
| 10 to 14 Years | 6 (4.0%) | 6 (5.1%) |
| 15 to 19 Years | 2 (1.3%) | 11 (9.4%) |
| 20 to 24 Years | 21 (13.8%) | 4 (3.4%) |
| 25 to 29 Years | 0 (0.0%) | 2 (1.7%) |
| 30 to 34 Years | 2 (1.3%) | 5 (4.3%) |
| 35 to 39 Years | 27 (17.8%) | 11 (9.4%) |
| 40 to 44 Years | 4 (2.6%) | 2 (1.7%) |
| 45 to 49 Years | 6 (4.0%) | 11 (9.4%) |
| 50 to 54 Years | 33 (21.7%) | 7 (6.0%) |
| 55 to 59 Years | 6 (4.0%) | 11 (9.4%) |
| 60 to 64 Years | 5 (3.3%) | 12 (10.3%) |
| 65 to 69 Years | 13 (8.6%) | 7 (6.0%) |
| 70 to 74 Years | 10 (6.6%) | 2 (1.7%) |
| 75 to 79 Years | 3 (2.0%) | 8 (6.8%) |
| 80 to 84 Years | 4 (2.6%) | 4 (3.4%) |
| 85 Years and over | 0 (0.0%) | 0 (0.0%) |
| Total | 152 (100.0%) | 117 (100.0%) |
Families and Households in Luther
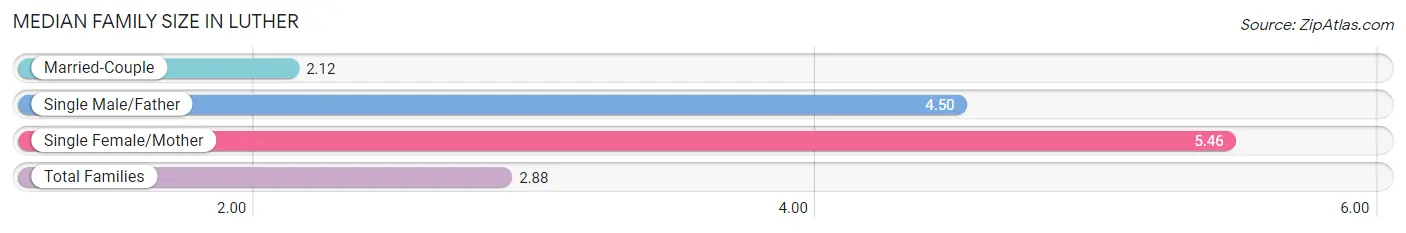
Median Family Size in Luther
The median family size in Luther is 2.88 persons per family, with single female/mother families (13 | 17.1%) accounting for the largest median family size of 5.46 persons per family. On the other hand, married-couple families (57 | 75.0%) represent the smallest median family size with 2.12 persons per family.
| Family Type | # Families | Family Size |
| Married-Couple | 57 (75.0%) | 2.12 |
| Single Male/Father | 6 (7.9%) | 4.50 |
| Single Female/Mother | 13 (17.1%) | 5.46 |
| Total Families | 76 (100.0%) | 2.88 |
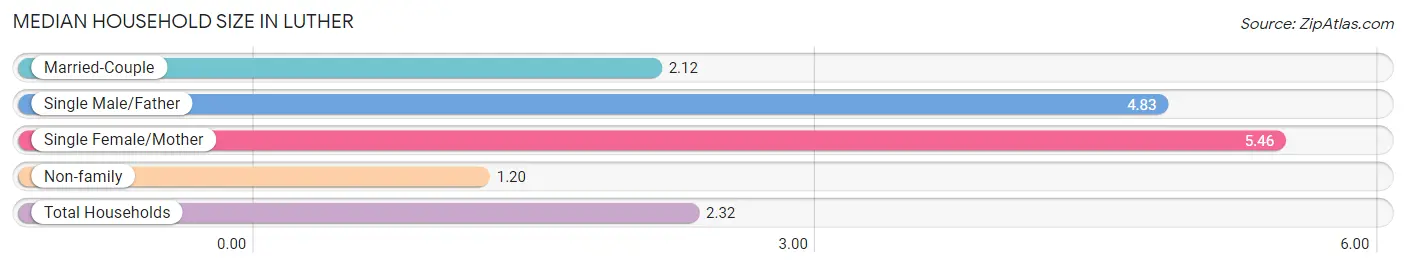
Median Household Size in Luther
The median household size in Luther is 2.32 persons per household, with single female/mother households (13 | 11.2%) accounting for the largest median household size of 5.46 persons per household. non-family households (40 | 34.5%) represent the smallest median household size with 1.20 persons per household.
| Household Type | # Households | Household Size |
| Married-Couple | 57 (49.1%) | 2.12 |
| Single Male/Father | 6 (5.2%) | 4.83 |
| Single Female/Mother | 13 (11.2%) | 5.46 |
| Non-family | 40 (34.5%) | 1.20 |
| Total Households | 116 (100.0%) | 2.32 |
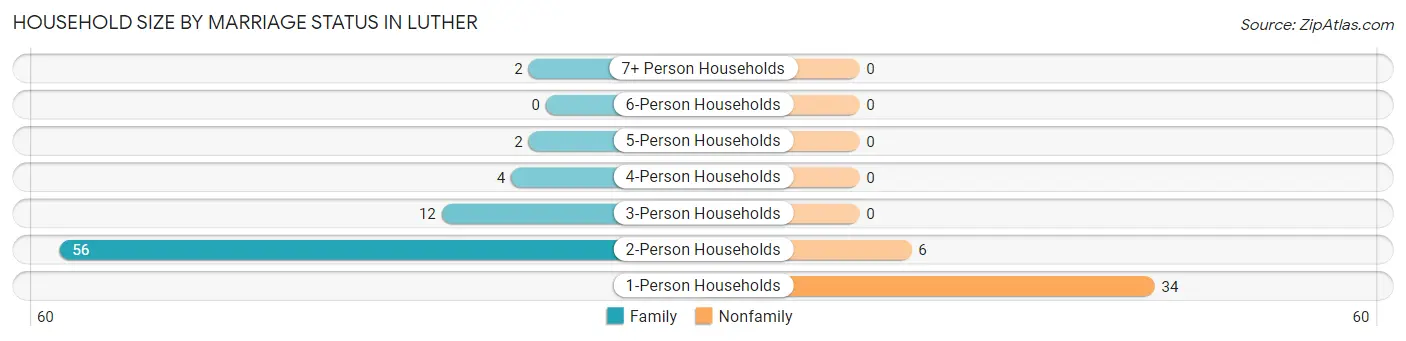
Household Size by Marriage Status in Luther
Out of a total of 116 households in Luther, 76 (65.5%) are family households, while 40 (34.5%) are nonfamily households. The most numerous type of family households are 2-person households, comprising 56, and the most common type of nonfamily households are 1-person households, comprising 34.
| Household Size | Family Households | Nonfamily Households |
| 1-Person Households | - | 34 (29.3%) |
| 2-Person Households | 56 (48.3%) | 6 (5.2%) |
| 3-Person Households | 12 (10.3%) | 0 (0.0%) |
| 4-Person Households | 4 (3.5%) | 0 (0.0%) |
| 5-Person Households | 2 (1.7%) | 0 (0.0%) |
| 6-Person Households | 0 (0.0%) | 0 (0.0%) |
| 7+ Person Households | 2 (1.7%) | 0 (0.0%) |
| Total | 76 (65.5%) | 40 (34.5%) |
Female Fertility in Luther
Fertility by Age in Luther
Average fertility rate in Luther is 43.0 births per 1,000 women. Women in the age bracket of 20 to 34 years have the highest fertility rate with 182.0 births per 1,000 women. Women in the age bracket of 20 to 34 years acount for 100.0% of all women with births.
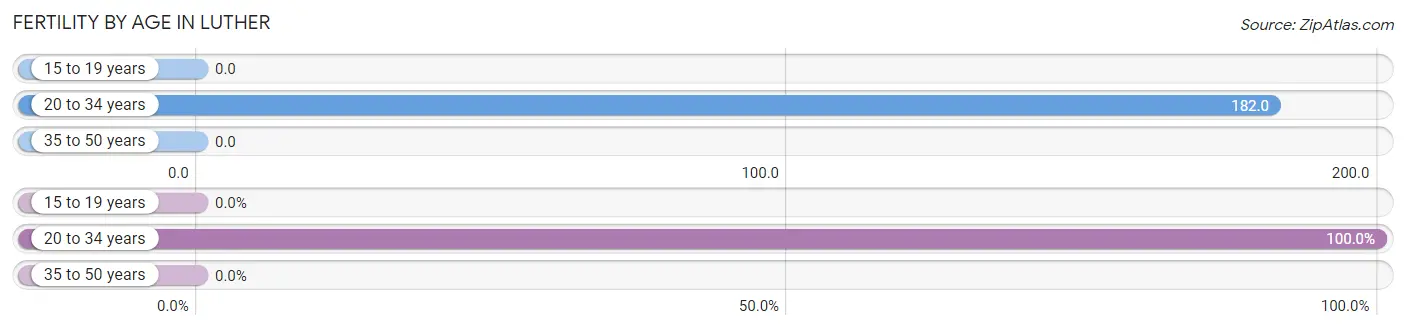
| Age Bracket | Women with Births | Births / 1,000 Women |
| 15 to 19 years | 0 (0.0%) | 0.0 |
| 20 to 34 years | 2 (100.0%) | 182.0 |
| 35 to 50 years | 0 (0.0%) | 0.0 |
| Total | 2 (100.0%) | 43.0 |
Fertility by Age by Marriage Status in Luther
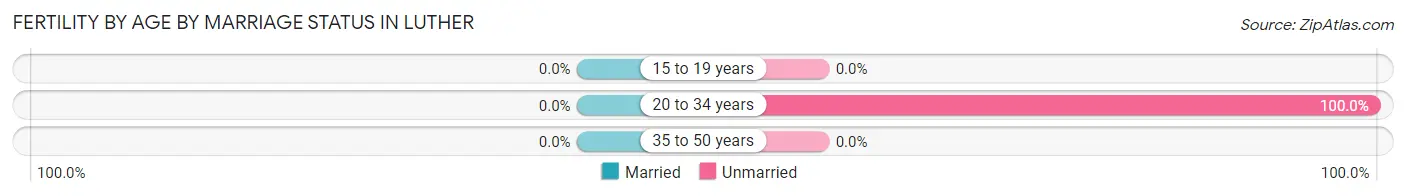
| Age Bracket | Married | Unmarried |
| 15 to 19 years | 0 (0.0%) | 0 (0.0%) |
| 20 to 34 years | 0 (0.0%) | 2 (100.0%) |
| 35 to 50 years | 0 (0.0%) | 0 (0.0%) |
| Total | 0 (0.0%) | 2 (100.0%) |
Fertility by Education in Luther
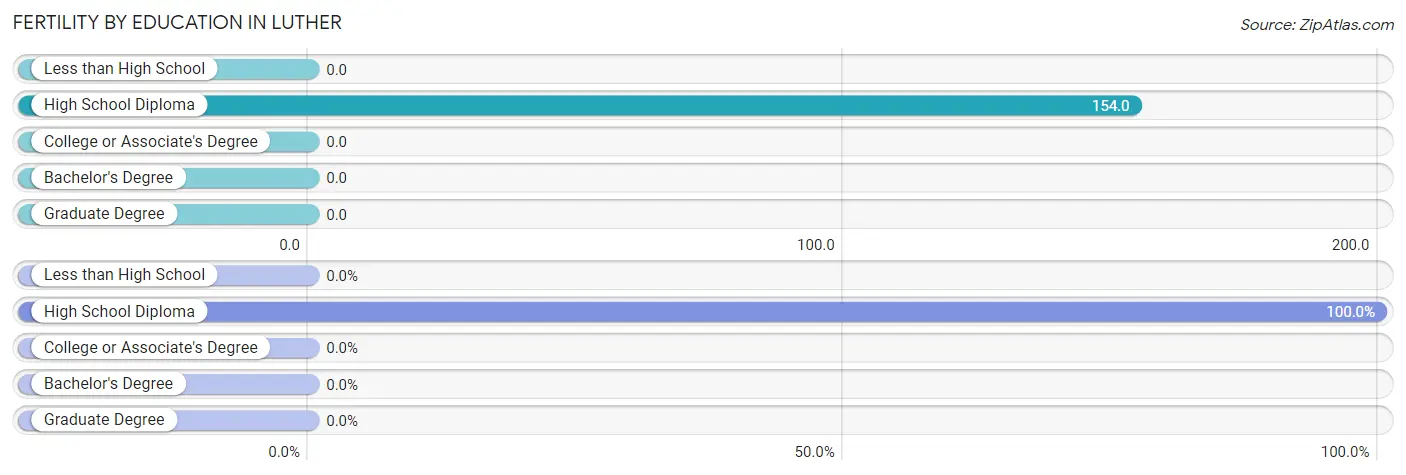
| Educational Attainment | Women with Births | Births / 1,000 Women |
| Less than High School | 0 (0.0%) | 0.0 |
| High School Diploma | 2 (100.0%) | 154.0 |
| College or Associate's Degree | 0 (0.0%) | 0.0 |
| Bachelor's Degree | 0 (0.0%) | 0.0 |
| Graduate Degree | 0 (0.0%) | 0.0 |
| Total | 2 (100.0%) | 43.0 |
Fertility by Education by Marriage Status in Luther
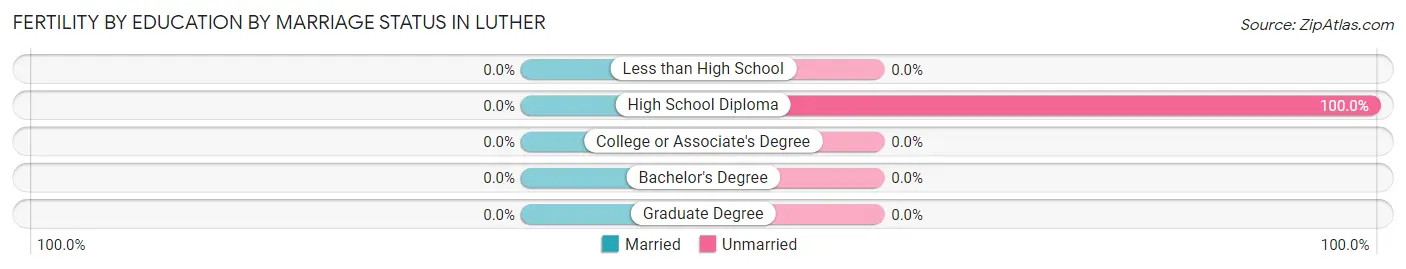
| Educational Attainment | Married | Unmarried |
| Less than High School | 0 (0.0%) | 0 (0.0%) |
| High School Diploma | 0 (0.0%) | 2 (100.0%) |
| College or Associate's Degree | 0 (0.0%) | 0 (0.0%) |
| Bachelor's Degree | 0 (0.0%) | 0 (0.0%) |
| Graduate Degree | 0 (0.0%) | 0 (0.0%) |
| Total | 0 (0.0%) | 2 (100.0%) |
Employment Characteristics in Luther
Employment by Class of Employer in Luther
Among the 105 employed individuals in Luther, private company employees (89 | 84.8%), not-for-profit organizations (8 | 7.6%), and self-employed (incorporated) (6 | 5.7%) make up the most common classes of employment.
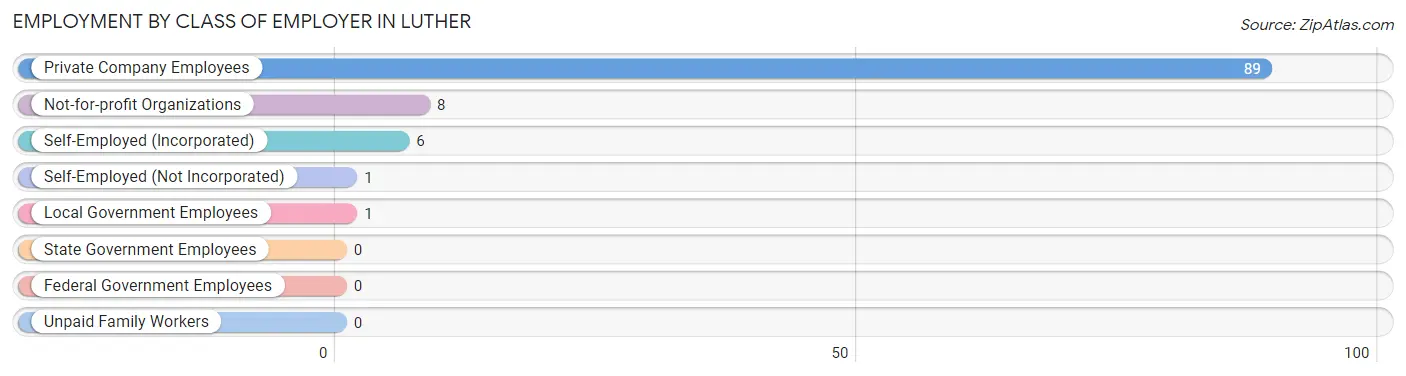
| Employer Class | # Employees | % Employees |
| Private Company Employees | 89 | 84.8% |
| Self-Employed (Incorporated) | 6 | 5.7% |
| Self-Employed (Not Incorporated) | 1 | 0.9% |
| Not-for-profit Organizations | 8 | 7.6% |
| Local Government Employees | 1 | 0.9% |
| State Government Employees | 0 | 0.0% |
| Federal Government Employees | 0 | 0.0% |
| Unpaid Family Workers | 0 | 0.0% |
| Total | 105 | 100.0% |
Employment Status by Age in Luther
According to the labor force statistics for Luther, out of the total population over 16 years of age (232), 50.9% or 118 individuals are in the labor force, with 8.5% or 10 of them unemployed. The age group with the highest labor force participation rate is 20 to 24 years, with 100.0% or 25 individuals in the labor force. Within the labor force, the 30 to 34 years age range has the highest percentage of unemployed individuals, with 42.9% or 3 of them being unemployed.
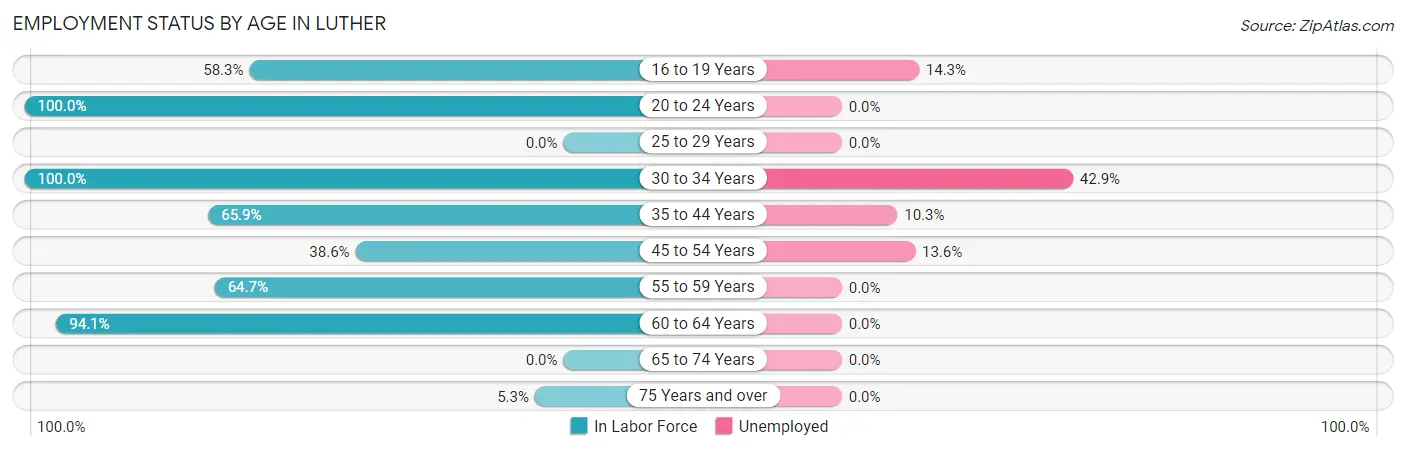
| Age Bracket | In Labor Force | Unemployed |
| 16 to 19 Years | 7 (58.3%) | 1 (14.3%) |
| 20 to 24 Years | 25 (100.0%) | 0 (0.0%) |
| 25 to 29 Years | 0 (0.0%) | 0 (0.0%) |
| 30 to 34 Years | 7 (100.0%) | 3 (42.9%) |
| 35 to 44 Years | 29 (65.9%) | 3 (10.3%) |
| 45 to 54 Years | 22 (38.6%) | 3 (13.6%) |
| 55 to 59 Years | 11 (64.7%) | 0 (0.0%) |
| 60 to 64 Years | 16 (94.1%) | 0 (0.0%) |
| 65 to 74 Years | 0 (0.0%) | 0 (0.0%) |
| 75 Years and over | 1 (5.3%) | 0 (0.0%) |
| Total | 118 (50.9%) | 10 (8.5%) |
Employment Status by Educational Attainment in Luther
According to labor force statistics for Luther, 59.0% of individuals (85) out of the total population between 25 and 64 years of age (144) are in the labor force, with 10.6% or 9 of them being unemployed. The group with the highest labor force participation rate are those with the educational attainment of less than high school, with 67.4% or 31 individuals in the labor force. Within the labor force, individuals with high school diploma education have the highest percentage of unemployment, with 18.4% or 7 of them being unemployed.
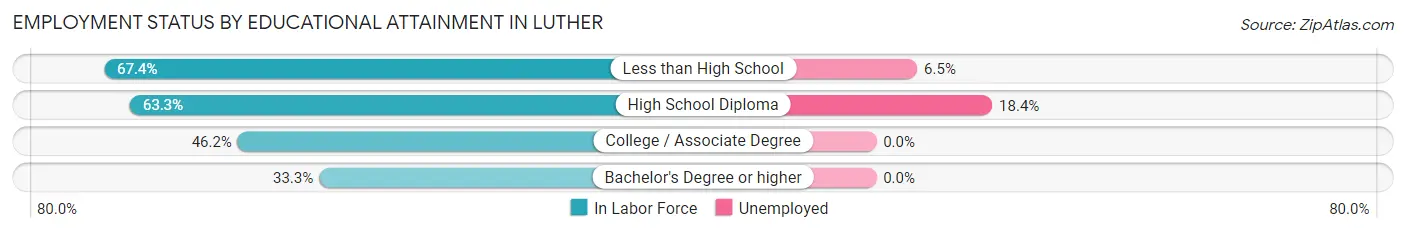
| Educational Attainment | In Labor Force | Unemployed |
| Less than High School | 31 (67.4%) | 3 (6.5%) |
| High School Diploma | 38 (63.3%) | 11 (18.4%) |
| College / Associate Degree | 12 (46.2%) | 0 (0.0%) |
| Bachelor's Degree or higher | 4 (33.3%) | 0 (0.0%) |
| Total | 85 (59.0%) | 15 (10.6%) |
Employment Occupations by Sex in Luther
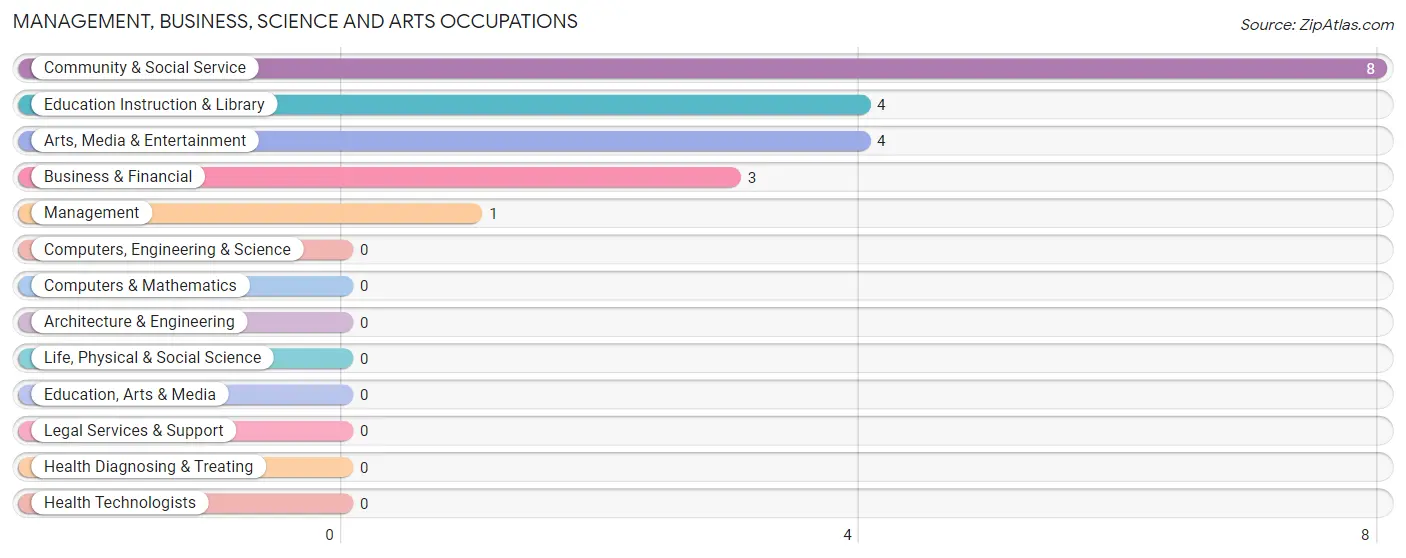
Management, Business, Science and Arts Occupations
The most common Management, Business, Science and Arts occupations in Luther are Community & Social Service (8 | 7.4%), Education Instruction & Library (4 | 3.7%), Arts, Media & Entertainment (4 | 3.7%), Business & Financial (3 | 2.8%), and Management (1 | 0.9%).
Management, Business, Science and Arts Occupations by Sex
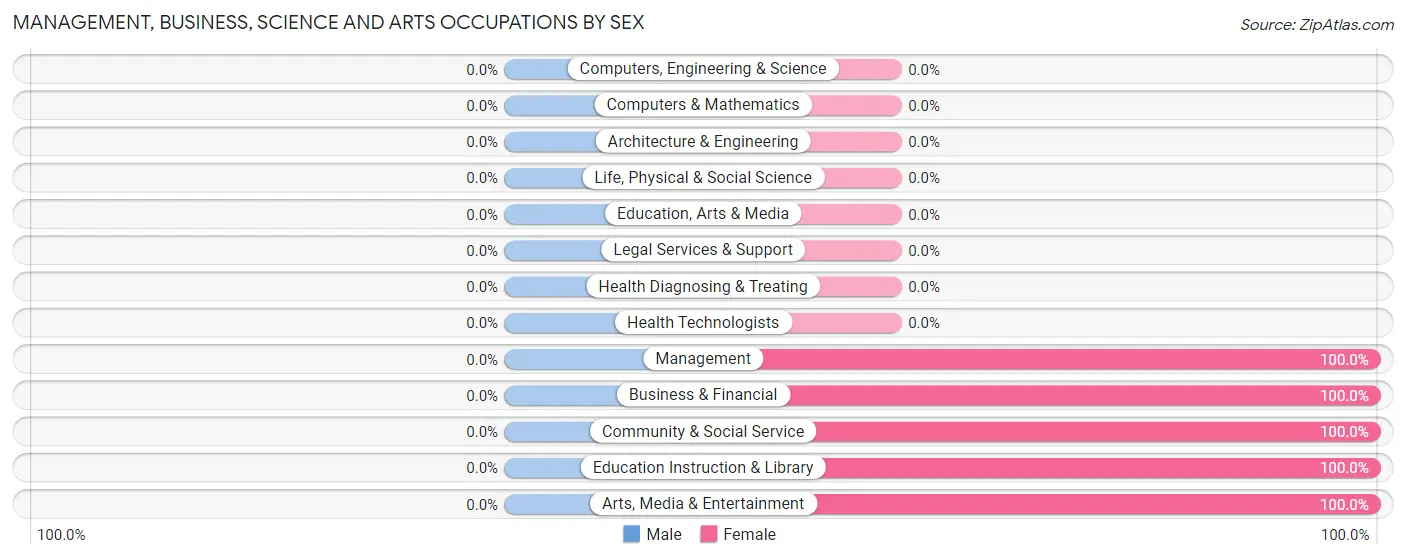
| Occupation | Male | Female |
| Management | 0 (0.0%) | 1 (100.0%) |
| Business & Financial | 0 (0.0%) | 3 (100.0%) |
| Computers, Engineering & Science | 0 (0.0%) | 0 (0.0%) |
| Computers & Mathematics | 0 (0.0%) | 0 (0.0%) |
| Architecture & Engineering | 0 (0.0%) | 0 (0.0%) |
| Life, Physical & Social Science | 0 (0.0%) | 0 (0.0%) |
| Community & Social Service | 0 (0.0%) | 8 (100.0%) |
| Education, Arts & Media | 0 (0.0%) | 0 (0.0%) |
| Legal Services & Support | 0 (0.0%) | 0 (0.0%) |
| Education Instruction & Library | 0 (0.0%) | 4 (100.0%) |
| Arts, Media & Entertainment | 0 (0.0%) | 4 (100.0%) |
| Health Diagnosing & Treating | 0 (0.0%) | 0 (0.0%) |
| Health Technologists | 0 (0.0%) | 0 (0.0%) |
| Total (Category) | 0 (0.0%) | 12 (100.0%) |
| Total (Overall) | 58 (53.7%) | 50 (46.3%) |
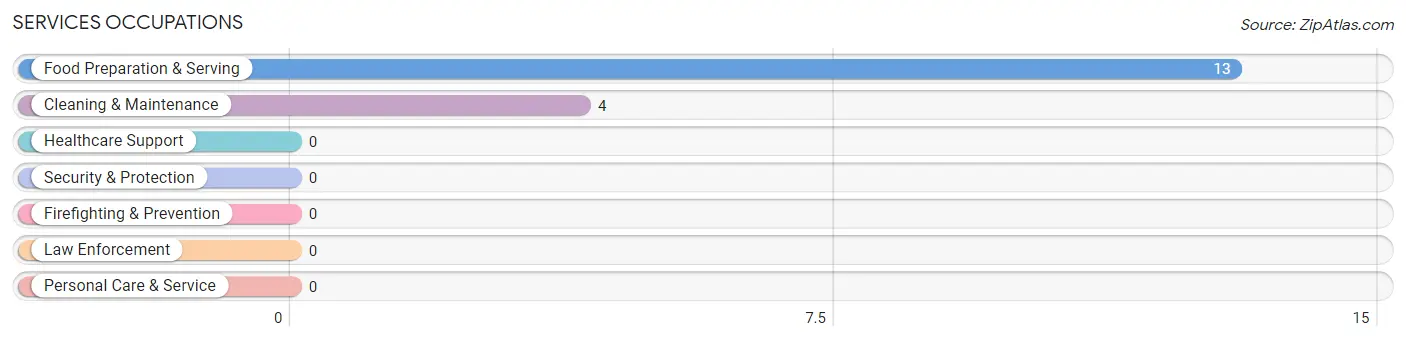
Services Occupations
The most common Services occupations in Luther are Food Preparation & Serving (13 | 12.0%), and Cleaning & Maintenance (4 | 3.7%).
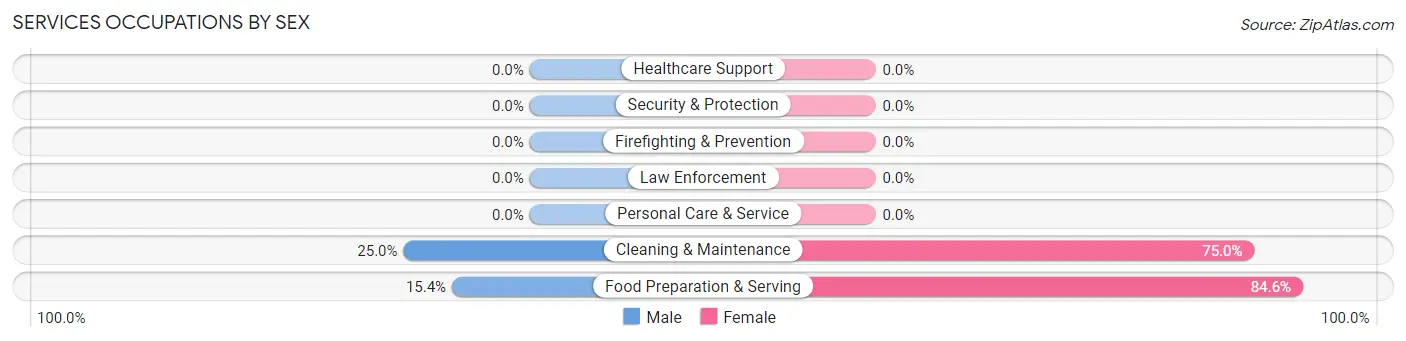
Services Occupations by Sex
Within the Services occupations in Luther, the most male-oriented occupations are Cleaning & Maintenance (25.0%), and Food Preparation & Serving (15.4%), while the most female-oriented occupations are Food Preparation & Serving (84.6%), and Cleaning & Maintenance (75.0%).
| Occupation | Male | Female |
| Healthcare Support | 0 (0.0%) | 0 (0.0%) |
| Security & Protection | 0 (0.0%) | 0 (0.0%) |
| Firefighting & Prevention | 0 (0.0%) | 0 (0.0%) |
| Law Enforcement | 0 (0.0%) | 0 (0.0%) |
| Food Preparation & Serving | 2 (15.4%) | 11 (84.6%) |
| Cleaning & Maintenance | 1 (25.0%) | 3 (75.0%) |
| Personal Care & Service | 0 (0.0%) | 0 (0.0%) |
| Total (Category) | 3 (17.6%) | 14 (82.4%) |
| Total (Overall) | 58 (53.7%) | 50 (46.3%) |
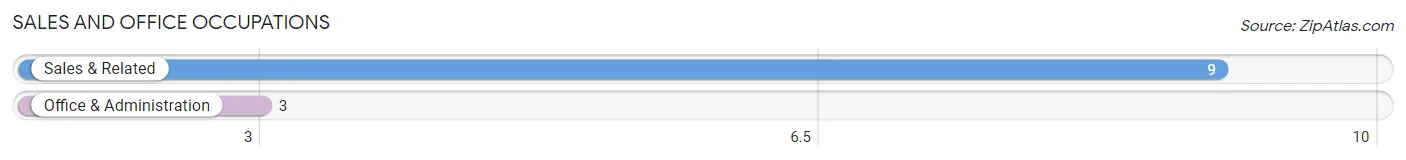
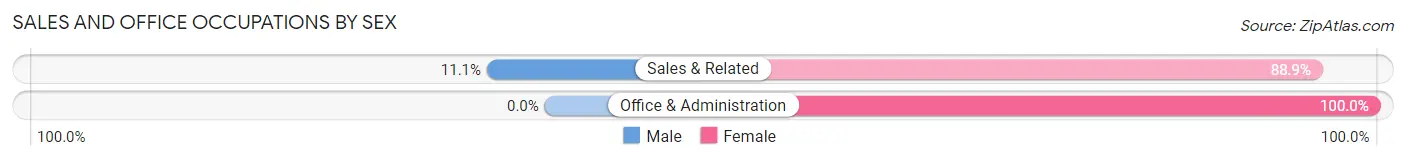
Sales and Office Occupations
The most common Sales and Office occupations in Luther are Sales & Related (9 | 8.3%), and Office & Administration (3 | 2.8%).
Sales and Office Occupations by Sex
| Occupation | Male | Female |
| Sales & Related | 1 (11.1%) | 8 (88.9%) |
| Office & Administration | 0 (0.0%) | 3 (100.0%) |
| Total (Category) | 1 (8.3%) | 11 (91.7%) |
| Total (Overall) | 58 (53.7%) | 50 (46.3%) |
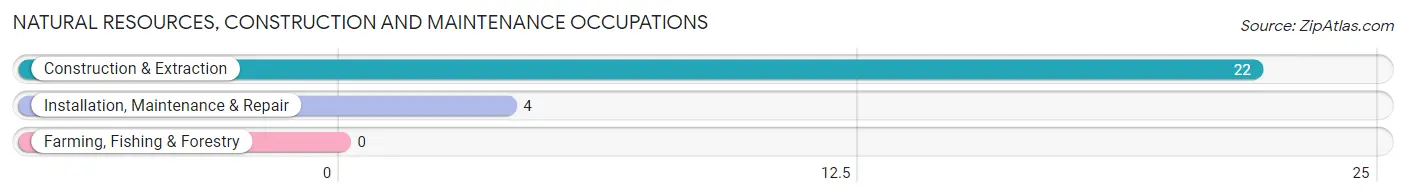
Natural Resources, Construction and Maintenance Occupations
The most common Natural Resources, Construction and Maintenance occupations in Luther are Construction & Extraction (22 | 20.4%), and Installation, Maintenance & Repair (4 | 3.7%).
Natural Resources, Construction and Maintenance Occupations by Sex
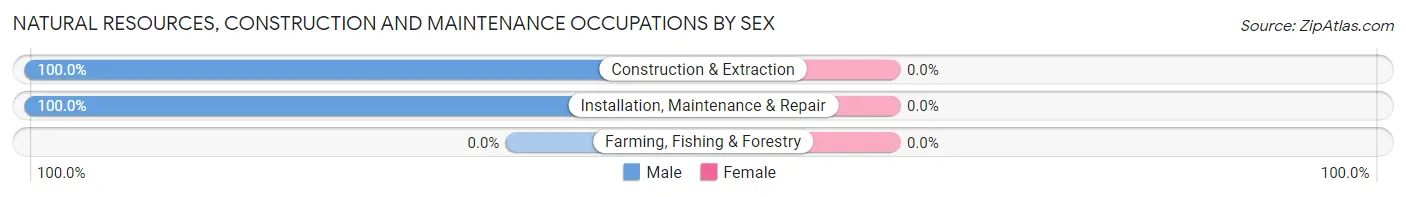
| Occupation | Male | Female |
| Farming, Fishing & Forestry | 0 (0.0%) | 0 (0.0%) |
| Construction & Extraction | 22 (100.0%) | 0 (0.0%) |
| Installation, Maintenance & Repair | 4 (100.0%) | 0 (0.0%) |
| Total (Category) | 26 (100.0%) | 0 (0.0%) |
| Total (Overall) | 58 (53.7%) | 50 (46.3%) |
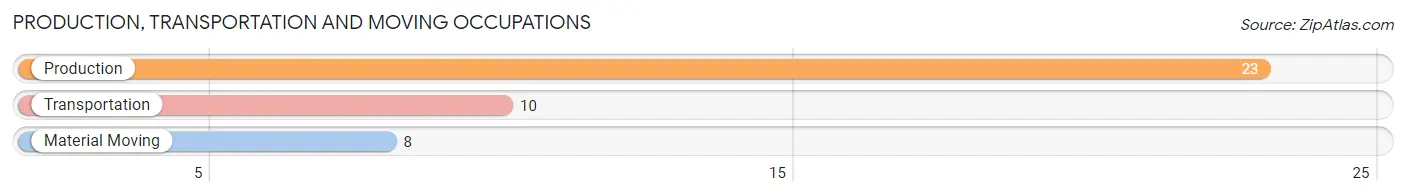
Production, Transportation and Moving Occupations
The most common Production, Transportation and Moving occupations in Luther are Production (23 | 21.3%), Transportation (10 | 9.3%), and Material Moving (8 | 7.4%).
Production, Transportation and Moving Occupations by Sex
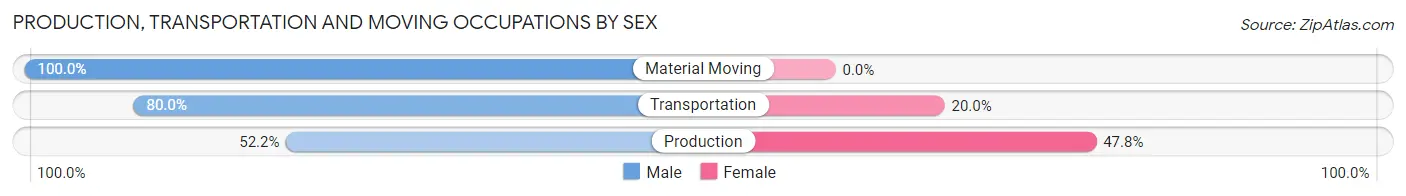
| Occupation | Male | Female |
| Production | 12 (52.2%) | 11 (47.8%) |
| Transportation | 8 (80.0%) | 2 (20.0%) |
| Material Moving | 8 (100.0%) | 0 (0.0%) |
| Total (Category) | 28 (68.3%) | 13 (31.7%) |
| Total (Overall) | 58 (53.7%) | 50 (46.3%) |
Employment Industries by Sex in Luther
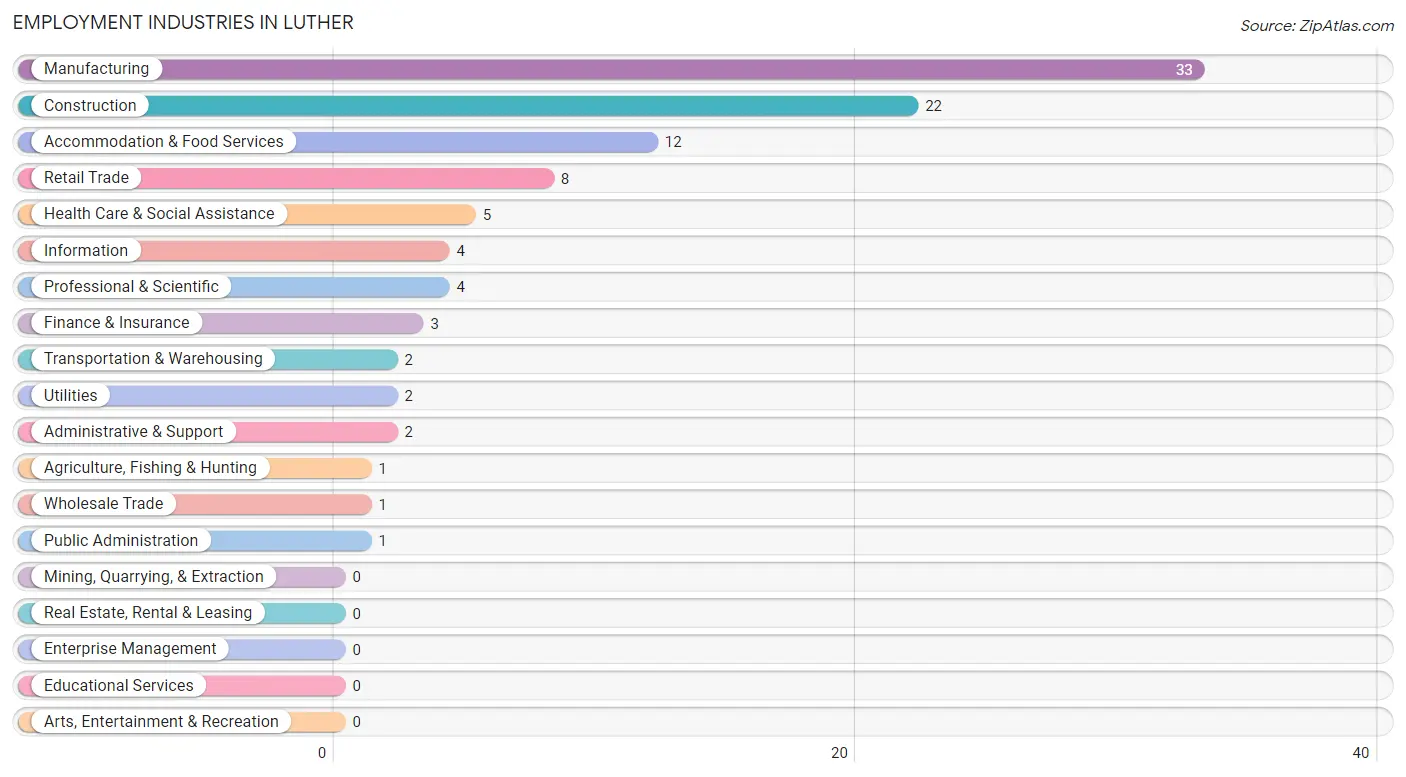
Employment Industries in Luther
The major employment industries in Luther include Manufacturing (33 | 30.6%), Construction (22 | 20.4%), Accommodation & Food Services (12 | 11.1%), Retail Trade (8 | 7.4%), and Health Care & Social Assistance (5 | 4.6%).
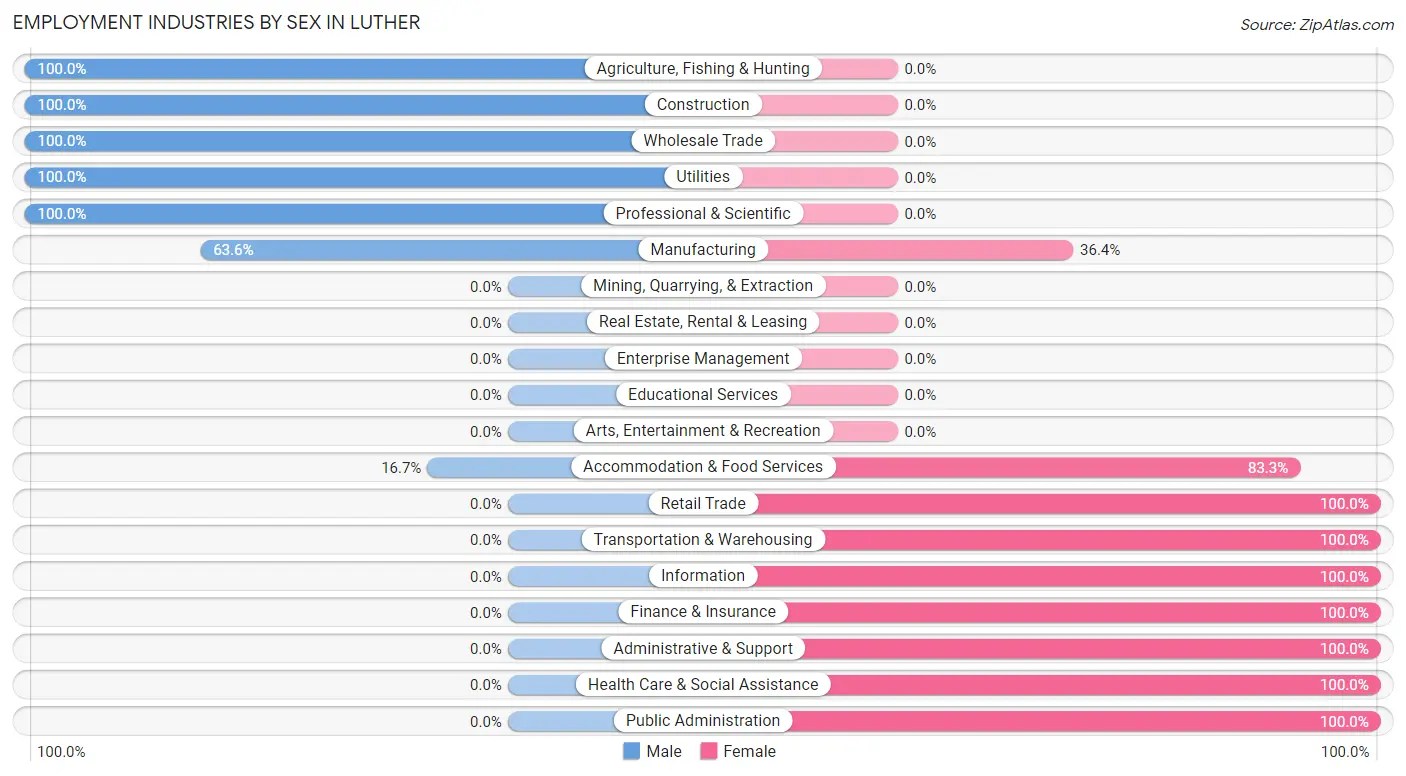
Employment Industries by Sex in Luther
The Luther industries that see more men than women are Agriculture, Fishing & Hunting (100.0%), Construction (100.0%), and Wholesale Trade (100.0%), whereas the industries that tend to have a higher number of women are Retail Trade (100.0%), Transportation & Warehousing (100.0%), and Information (100.0%).
| Industry | Male | Female |
| Agriculture, Fishing & Hunting | 1 (100.0%) | 0 (0.0%) |
| Mining, Quarrying, & Extraction | 0 (0.0%) | 0 (0.0%) |
| Construction | 22 (100.0%) | 0 (0.0%) |
| Manufacturing | 21 (63.6%) | 12 (36.4%) |
| Wholesale Trade | 1 (100.0%) | 0 (0.0%) |
| Retail Trade | 0 (0.0%) | 8 (100.0%) |
| Transportation & Warehousing | 0 (0.0%) | 2 (100.0%) |
| Utilities | 2 (100.0%) | 0 (0.0%) |
| Information | 0 (0.0%) | 4 (100.0%) |
| Finance & Insurance | 0 (0.0%) | 3 (100.0%) |
| Real Estate, Rental & Leasing | 0 (0.0%) | 0 (0.0%) |
| Professional & Scientific | 4 (100.0%) | 0 (0.0%) |
| Enterprise Management | 0 (0.0%) | 0 (0.0%) |
| Administrative & Support | 0 (0.0%) | 2 (100.0%) |
| Educational Services | 0 (0.0%) | 0 (0.0%) |
| Health Care & Social Assistance | 0 (0.0%) | 5 (100.0%) |
| Arts, Entertainment & Recreation | 0 (0.0%) | 0 (0.0%) |
| Accommodation & Food Services | 2 (16.7%) | 10 (83.3%) |
| Public Administration | 0 (0.0%) | 1 (100.0%) |
| Total | 58 (53.7%) | 50 (46.3%) |
Education in Luther
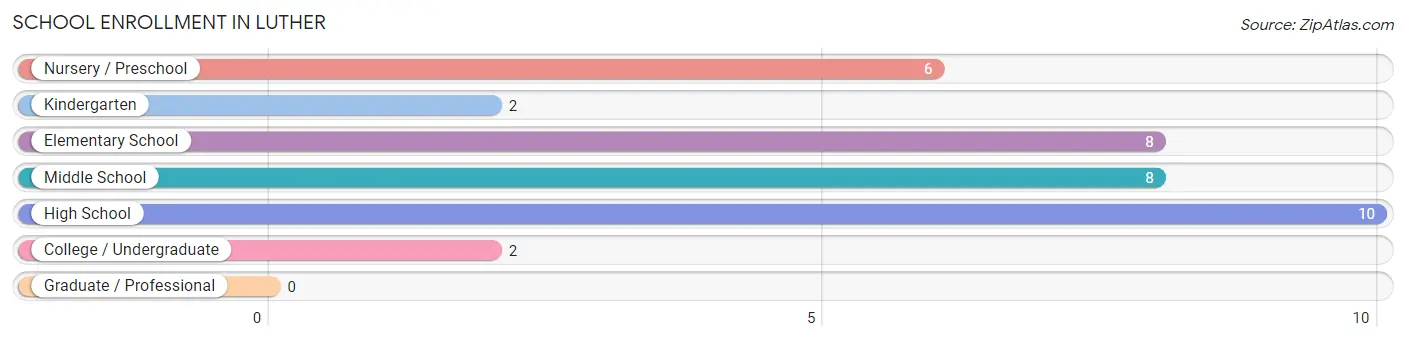
School Enrollment in Luther
The most common levels of schooling among the 36 students in Luther are high school (10 | 27.8%), elementary school (8 | 22.2%), and middle school (8 | 22.2%).
| School Level | # Students | % Students |
| Nursery / Preschool | 6 | 16.7% |
| Kindergarten | 2 | 5.6% |
| Elementary School | 8 | 22.2% |
| Middle School | 8 | 22.2% |
| High School | 10 | 27.8% |
| College / Undergraduate | 2 | 5.6% |
| Graduate / Professional | 0 | 0.0% |
| Total | 36 | 100.0% |
School Enrollment by Age by Funding Source in Luther
Out of a total of 36 students who are enrolled in schools in Luther, 6 (16.7%) attend a private institution, while the remaining 30 (83.3%) are enrolled in public schools. The age group of 15 to 17 year olds has the highest likelihood of being enrolled in private schools, with 4 (57.1% in the age bracket) enrolled. Conversely, the age group of 3 to 4 year olds has the lowest likelihood of being enrolled in a private school, with 6 (100.0% in the age bracket) attending a public institution.
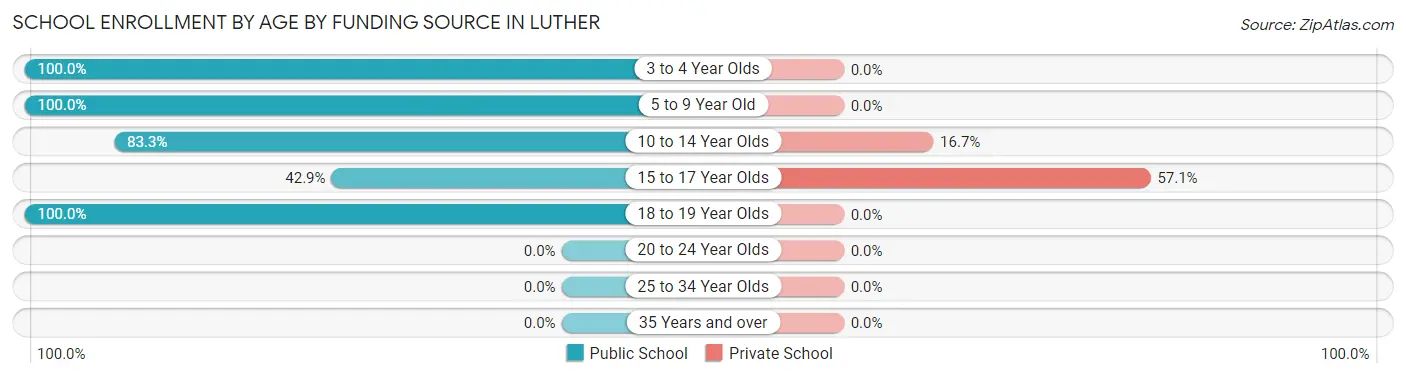
| Age Bracket | Public School | Private School |
| 3 to 4 Year Olds | 6 (100.0%) | 0 (0.0%) |
| 5 to 9 Year Old | 8 (100.0%) | 0 (0.0%) |
| 10 to 14 Year Olds | 10 (83.3%) | 2 (16.7%) |
| 15 to 17 Year Olds | 3 (42.9%) | 4 (57.1%) |
| 18 to 19 Year Olds | 3 (100.0%) | 0 (0.0%) |
| 20 to 24 Year Olds | 0 (0.0%) | 0 (0.0%) |
| 25 to 34 Year Olds | 0 (0.0%) | 0 (0.0%) |
| 35 Years and over | 0 (0.0%) | 0 (0.0%) |
| Total | 30 (83.3%) | 6 (16.7%) |
Educational Attainment by Field of Study in Luther
Liberal arts & history (6 | 33.3%), social sciences (4 | 22.2%), communications (4 | 22.2%), psychology (1 | 5.6%), and business (1 | 5.6%) are the most common fields of study among 18 individuals in Luther who have obtained a bachelor's degree or higher.
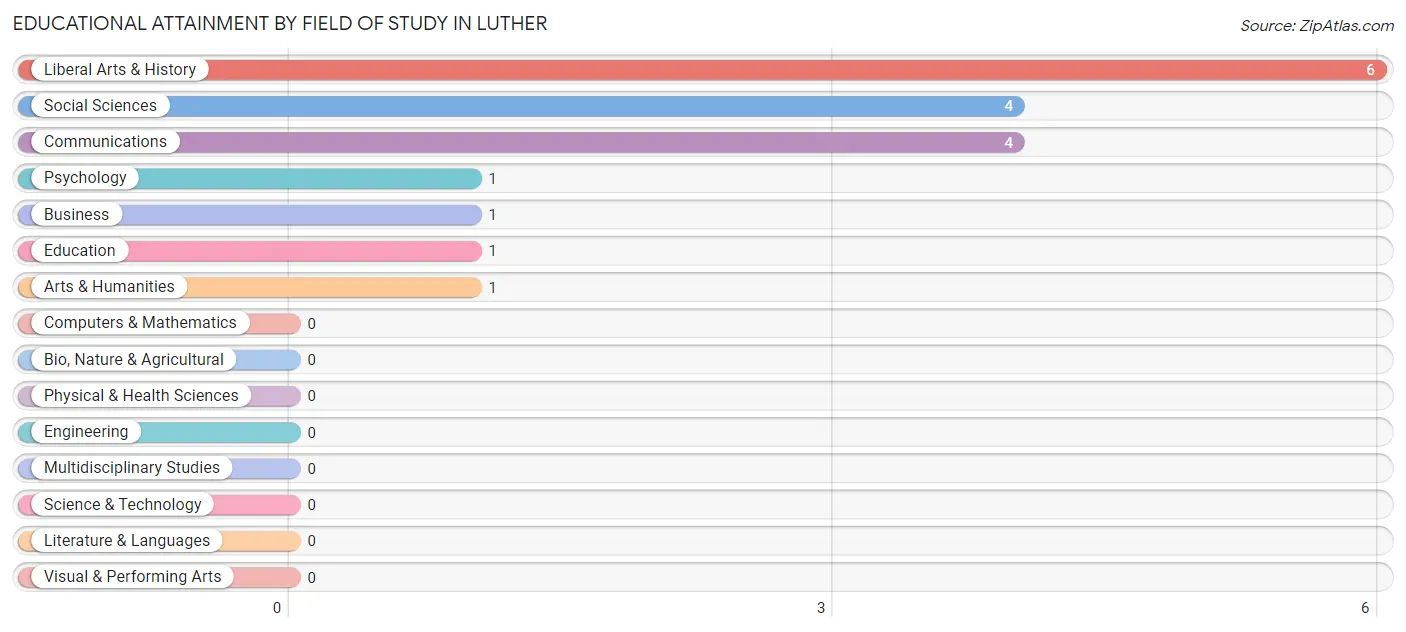
| Field of Study | # Graduates | % Graduates |
| Computers & Mathematics | 0 | 0.0% |
| Bio, Nature & Agricultural | 0 | 0.0% |
| Physical & Health Sciences | 0 | 0.0% |
| Psychology | 1 | 5.6% |
| Social Sciences | 4 | 22.2% |
| Engineering | 0 | 0.0% |
| Multidisciplinary Studies | 0 | 0.0% |
| Science & Technology | 0 | 0.0% |
| Business | 1 | 5.6% |
| Education | 1 | 5.6% |
| Literature & Languages | 0 | 0.0% |
| Liberal Arts & History | 6 | 33.3% |
| Visual & Performing Arts | 0 | 0.0% |
| Communications | 4 | 22.2% |
| Arts & Humanities | 1 | 5.6% |
| Total | 18 | 100.0% |
Transportation & Commute in Luther
Vehicle Availability by Sex in Luther
The most prevalent vehicle ownership categories in Luther are males with 2 vehicles (30, accounting for 51.7%) and females with 2 vehicles (22, making up 63.8%).
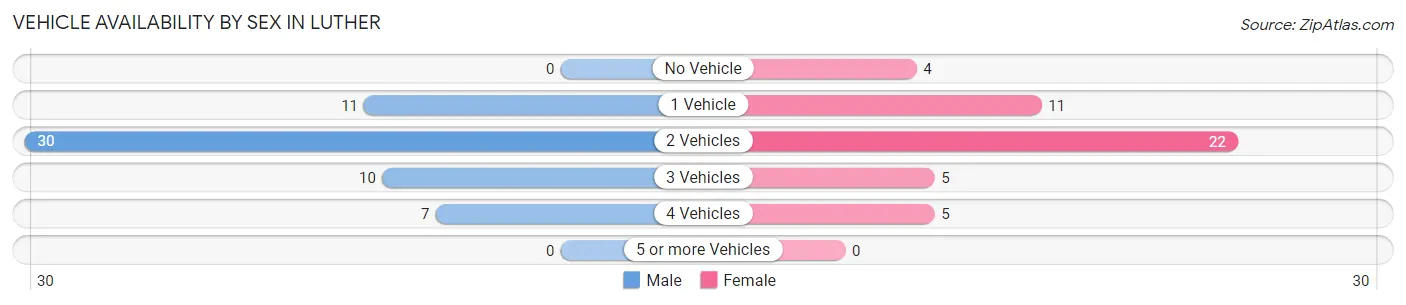
| Vehicles Available | Male | Female |
| No Vehicle | 0 (0.0%) | 4 (8.5%) |
| 1 Vehicle | 11 (19.0%) | 11 (23.4%) |
| 2 Vehicles | 30 (51.7%) | 22 (46.8%) |
| 3 Vehicles | 10 (17.2%) | 5 (10.6%) |
| 4 Vehicles | 7 (12.1%) | 5 (10.6%) |
| 5 or more Vehicles | 0 (0.0%) | 0 (0.0%) |
| Total | 58 (100.0%) | 47 (100.0%) |
Commute Time in Luther
The most frequently occuring commute durations in Luther are 35 to 39 minutes (29 commuters, 27.6%), 5 to 9 minutes (17 commuters, 16.2%), and 30 to 34 minutes (15 commuters, 14.3%).
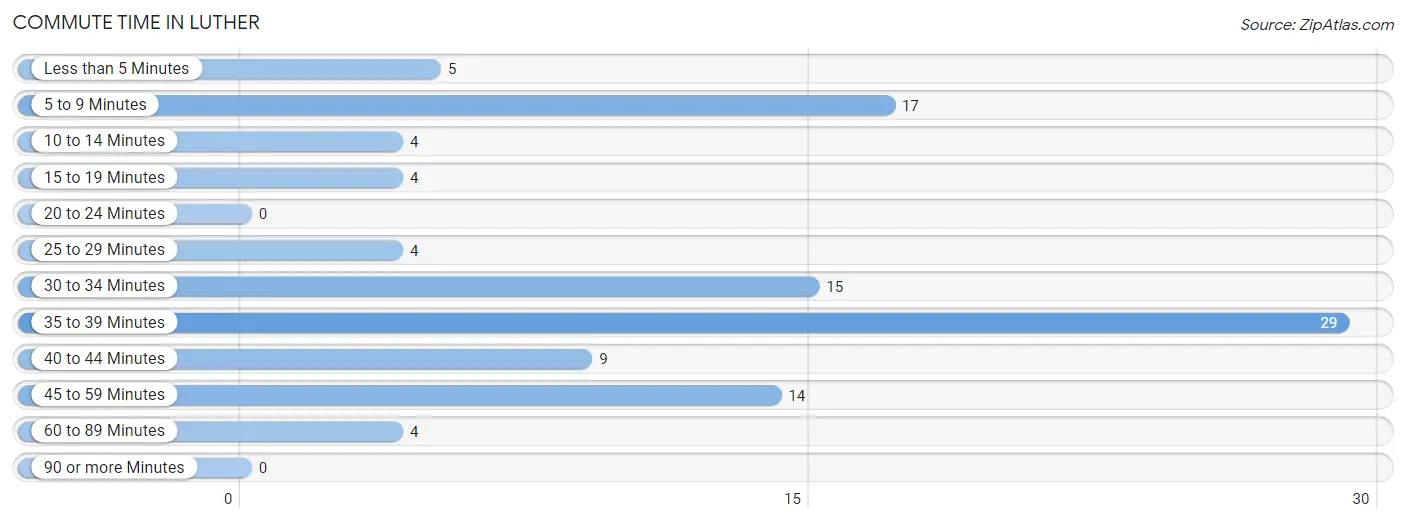
| Commute Time | # Commuters | % Commuters |
| Less than 5 Minutes | 5 | 4.8% |
| 5 to 9 Minutes | 17 | 16.2% |
| 10 to 14 Minutes | 4 | 3.8% |
| 15 to 19 Minutes | 4 | 3.8% |
| 20 to 24 Minutes | 0 | 0.0% |
| 25 to 29 Minutes | 4 | 3.8% |
| 30 to 34 Minutes | 15 | 14.3% |
| 35 to 39 Minutes | 29 | 27.6% |
| 40 to 44 Minutes | 9 | 8.6% |
| 45 to 59 Minutes | 14 | 13.3% |
| 60 to 89 Minutes | 4 | 3.8% |
| 90 or more Minutes | 0 | 0.0% |
Commute Time by Sex in Luther
The most common commute times in Luther are 35 to 39 minutes (21 commuters, 36.2%) for males and 5 to 9 minutes (8 commuters, 17.0%) for females.
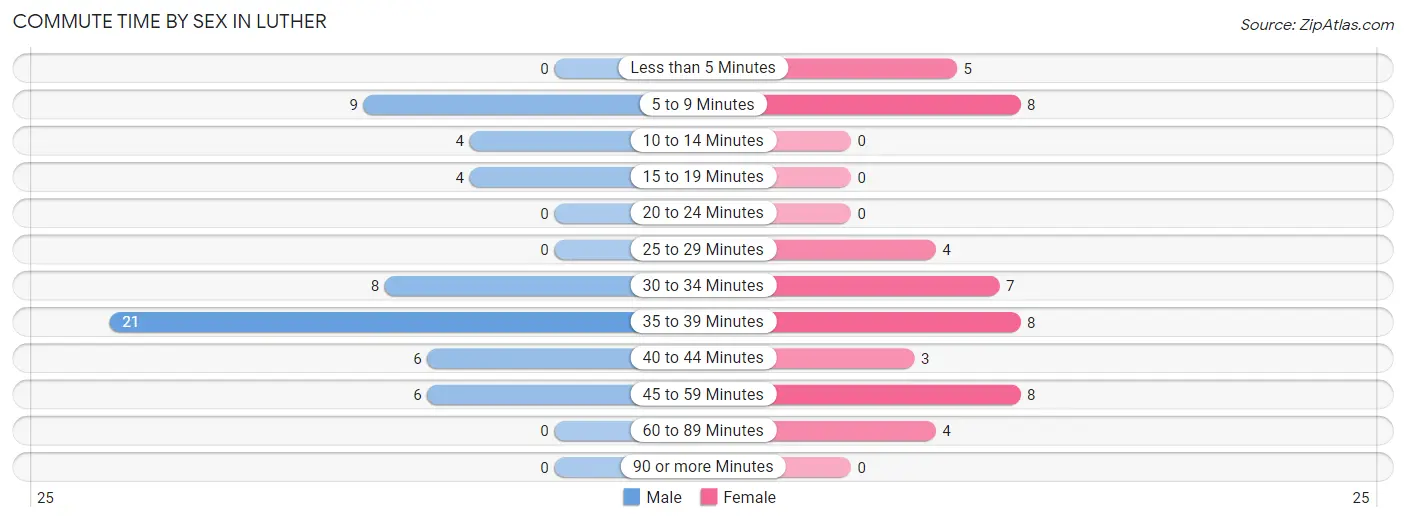
| Commute Time | Male | Female |
| Less than 5 Minutes | 0 (0.0%) | 5 (10.6%) |
| 5 to 9 Minutes | 9 (15.5%) | 8 (17.0%) |
| 10 to 14 Minutes | 4 (6.9%) | 0 (0.0%) |
| 15 to 19 Minutes | 4 (6.9%) | 0 (0.0%) |
| 20 to 24 Minutes | 0 (0.0%) | 0 (0.0%) |
| 25 to 29 Minutes | 0 (0.0%) | 4 (8.5%) |
| 30 to 34 Minutes | 8 (13.8%) | 7 (14.9%) |
| 35 to 39 Minutes | 21 (36.2%) | 8 (17.0%) |
| 40 to 44 Minutes | 6 (10.3%) | 3 (6.4%) |
| 45 to 59 Minutes | 6 (10.3%) | 8 (17.0%) |
| 60 to 89 Minutes | 0 (0.0%) | 4 (8.5%) |
| 90 or more Minutes | 0 (0.0%) | 0 (0.0%) |
Time of Departure to Work by Sex in Luther
The most frequent times of departure to work in Luther are 7:30 AM to 7:59 AM (15, 25.9%) for males and 9:00 AM to 9:59 AM (11, 23.4%) for females.
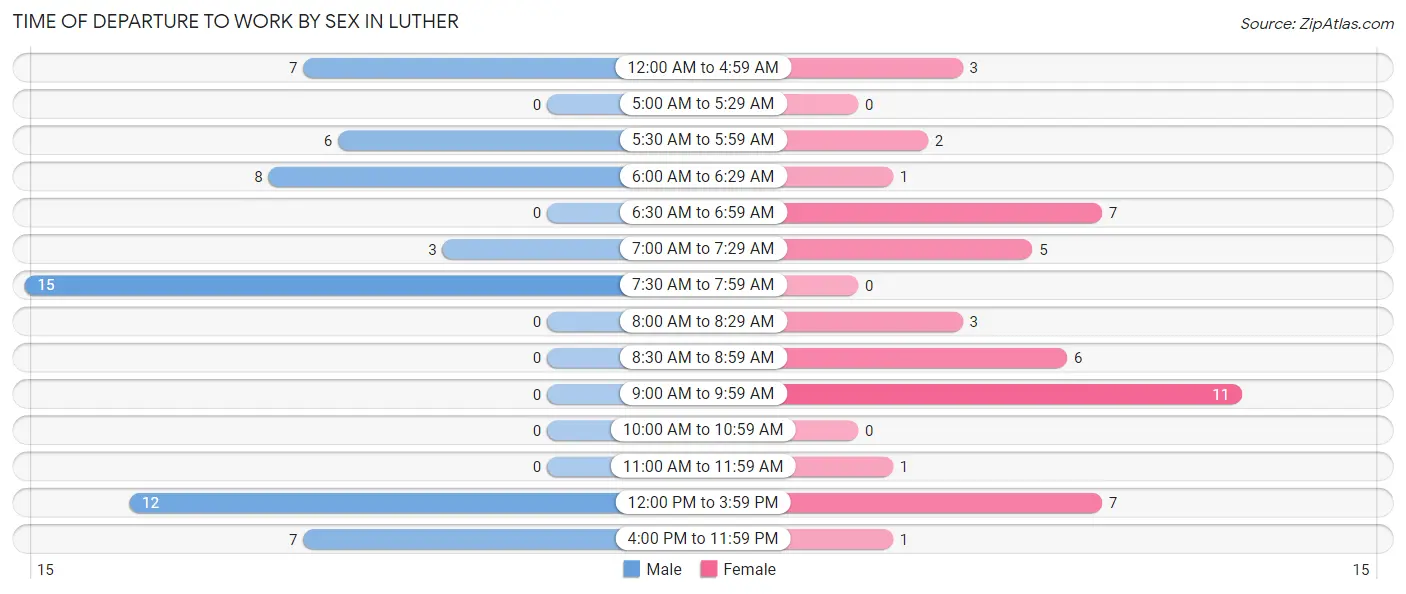
| Time of Departure | Male | Female |
| 12:00 AM to 4:59 AM | 7 (12.1%) | 3 (6.4%) |
| 5:00 AM to 5:29 AM | 0 (0.0%) | 0 (0.0%) |
| 5:30 AM to 5:59 AM | 6 (10.3%) | 2 (4.3%) |
| 6:00 AM to 6:29 AM | 8 (13.8%) | 1 (2.1%) |
| 6:30 AM to 6:59 AM | 0 (0.0%) | 7 (14.9%) |
| 7:00 AM to 7:29 AM | 3 (5.2%) | 5 (10.6%) |
| 7:30 AM to 7:59 AM | 15 (25.9%) | 0 (0.0%) |
| 8:00 AM to 8:29 AM | 0 (0.0%) | 3 (6.4%) |
| 8:30 AM to 8:59 AM | 0 (0.0%) | 6 (12.8%) |
| 9:00 AM to 9:59 AM | 0 (0.0%) | 11 (23.4%) |
| 10:00 AM to 10:59 AM | 0 (0.0%) | 0 (0.0%) |
| 11:00 AM to 11:59 AM | 0 (0.0%) | 1 (2.1%) |
| 12:00 PM to 3:59 PM | 12 (20.7%) | 7 (14.9%) |
| 4:00 PM to 11:59 PM | 7 (12.1%) | 1 (2.1%) |
| Total | 58 (100.0%) | 47 (100.0%) |
Housing Occupancy in Luther
Occupancy by Ownership in Luther
Of the total 116 dwellings in Luther, owner-occupied units account for 81 (69.8%), while renter-occupied units make up 35 (30.2%).
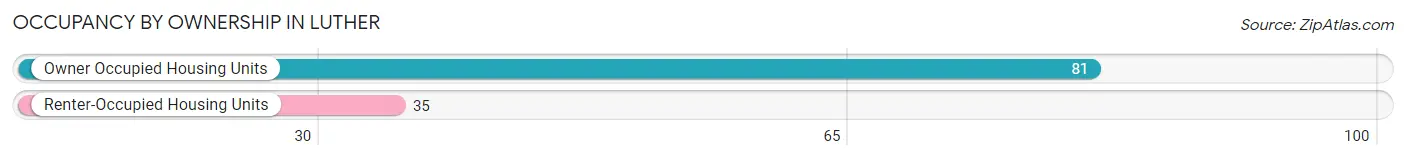
| Occupancy | # Housing Units | % Housing Units |
| Owner Occupied Housing Units | 81 | 69.8% |
| Renter-Occupied Housing Units | 35 | 30.2% |
| Total Occupied Housing Units | 116 | 100.0% |
Occupancy by Household Size in Luther
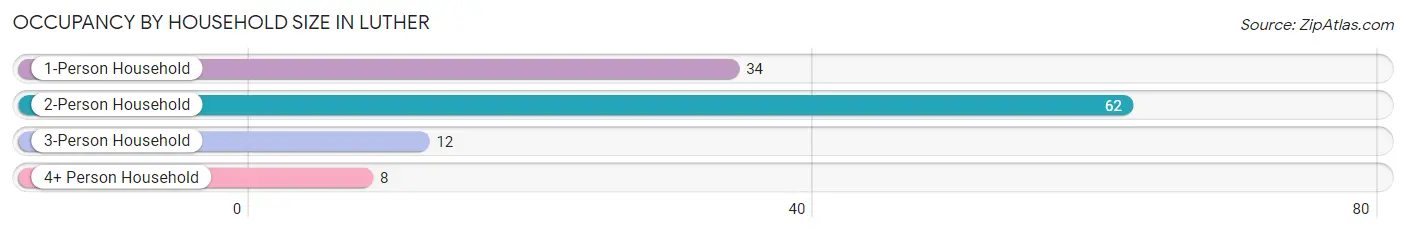
| Household Size | # Housing Units | % Housing Units |
| 1-Person Household | 34 | 29.3% |
| 2-Person Household | 62 | 53.4% |
| 3-Person Household | 12 | 10.3% |
| 4+ Person Household | 8 | 6.9% |
| Total Housing Units | 116 | 100.0% |
Occupancy by Ownership by Household Size in Luther
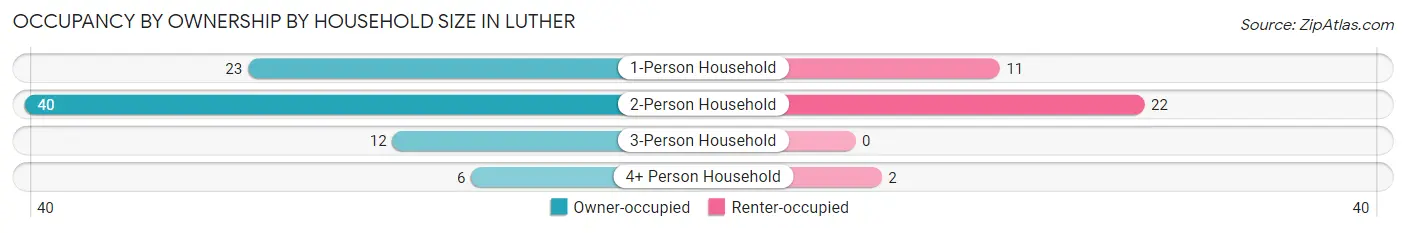
| Household Size | Owner-occupied | Renter-occupied |
| 1-Person Household | 23 (67.6%) | 11 (32.4%) |
| 2-Person Household | 40 (64.5%) | 22 (35.5%) |
| 3-Person Household | 12 (100.0%) | 0 (0.0%) |
| 4+ Person Household | 6 (75.0%) | 2 (25.0%) |
| Total Housing Units | 81 (69.8%) | 35 (30.2%) |
Occupancy by Educational Attainment in Luther
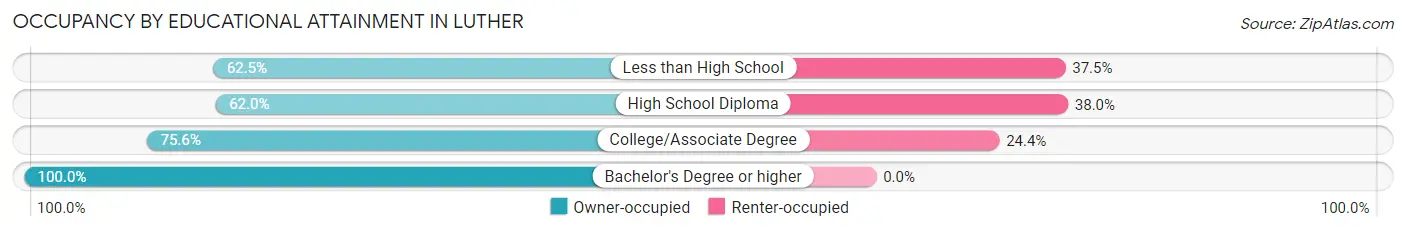
| Household Size | Owner-occupied | Renter-occupied |
| Less than High School | 10 (62.5%) | 6 (37.5%) |
| High School Diploma | 31 (62.0%) | 19 (38.0%) |
| College/Associate Degree | 31 (75.6%) | 10 (24.4%) |
| Bachelor's Degree or higher | 9 (100.0%) | 0 (0.0%) |
Occupancy by Age of Householder in Luther
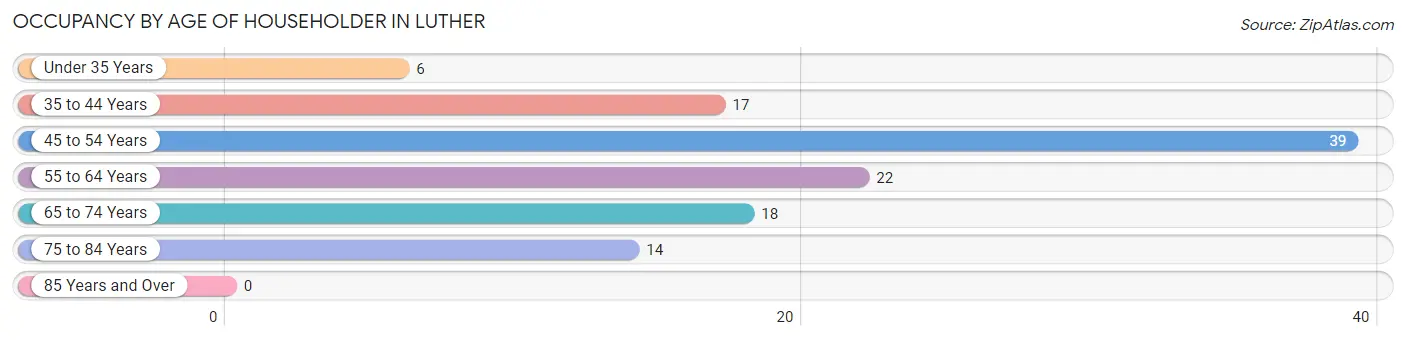
| Age Bracket | # Households | % Households |
| Under 35 Years | 6 | 5.2% |
| 35 to 44 Years | 17 | 14.7% |
| 45 to 54 Years | 39 | 33.6% |
| 55 to 64 Years | 22 | 19.0% |
| 65 to 74 Years | 18 | 15.5% |
| 75 to 84 Years | 14 | 12.1% |
| 85 Years and Over | 0 | 0.0% |
| Total | 116 | 100.0% |
Housing Finances in Luther
Median Income by Occupancy in Luther
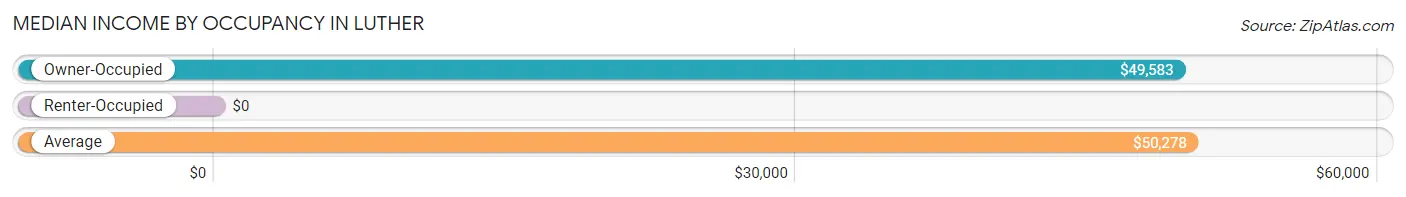
| Occupancy Type | # Households | Median Income |
| Owner-Occupied | 81 (69.8%) | $49,583 |
| Renter-Occupied | 35 (30.2%) | $0 |
| Average | 116 (100.0%) | $50,278 |
Occupancy by Householder Income Bracket in Luther
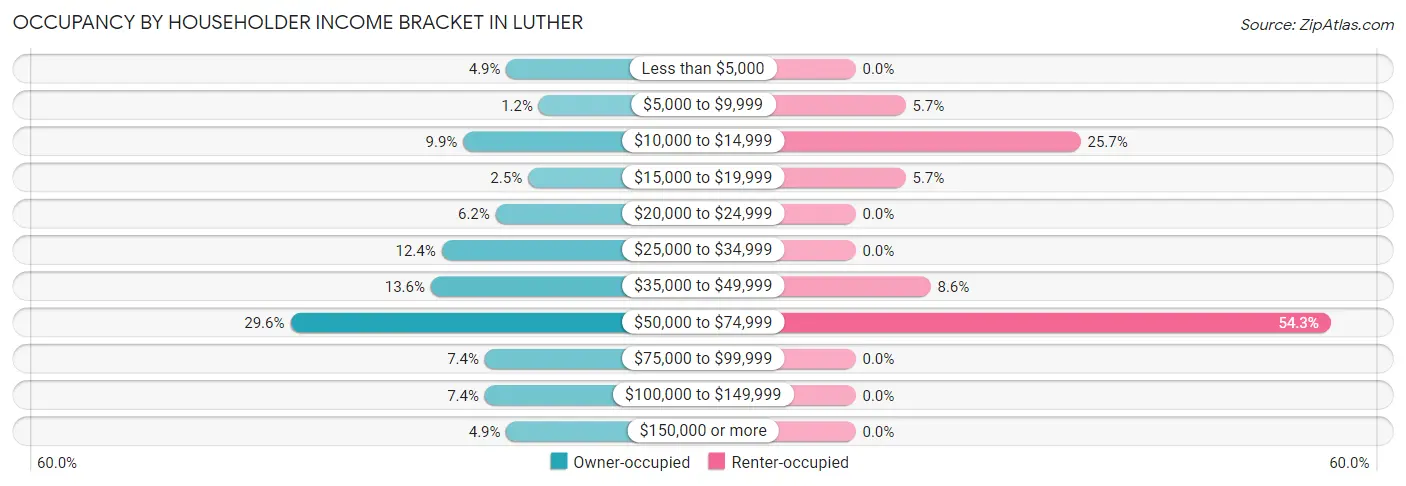
| Income Bracket | Owner-occupied | Renter-occupied |
| Less than $5,000 | 4 (4.9%) | 0 (0.0%) |
| $5,000 to $9,999 | 1 (1.2%) | 2 (5.7%) |
| $10,000 to $14,999 | 8 (9.9%) | 9 (25.7%) |
| $15,000 to $19,999 | 2 (2.5%) | 2 (5.7%) |
| $20,000 to $24,999 | 5 (6.2%) | 0 (0.0%) |
| $25,000 to $34,999 | 10 (12.3%) | 0 (0.0%) |
| $35,000 to $49,999 | 11 (13.6%) | 3 (8.6%) |
| $50,000 to $74,999 | 24 (29.6%) | 19 (54.3%) |
| $75,000 to $99,999 | 6 (7.4%) | 0 (0.0%) |
| $100,000 to $149,999 | 6 (7.4%) | 0 (0.0%) |
| $150,000 or more | 4 (4.9%) | 0 (0.0%) |
| Total | 81 (100.0%) | 35 (100.0%) |
Monthly Housing Cost Tiers in Luther
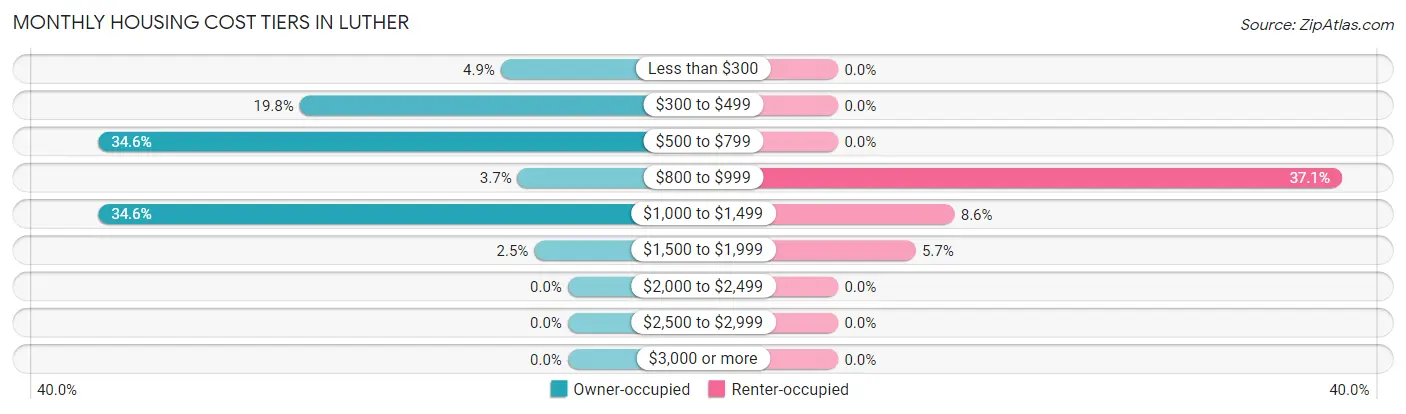
| Monthly Cost | Owner-occupied | Renter-occupied |
| Less than $300 | 4 (4.9%) | 0 (0.0%) |
| $300 to $499 | 16 (19.8%) | 0 (0.0%) |
| $500 to $799 | 28 (34.6%) | 0 (0.0%) |
| $800 to $999 | 3 (3.7%) | 13 (37.1%) |
| $1,000 to $1,499 | 28 (34.6%) | 3 (8.6%) |
| $1,500 to $1,999 | 2 (2.5%) | 2 (5.7%) |
| $2,000 to $2,499 | 0 (0.0%) | 0 (0.0%) |
| $2,500 to $2,999 | 0 (0.0%) | 0 (0.0%) |
| $3,000 or more | 0 (0.0%) | 0 (0.0%) |
| Total | 81 (100.0%) | 35 (100.0%) |
Physical Housing Characteristics in Luther
Housing Structures in Luther
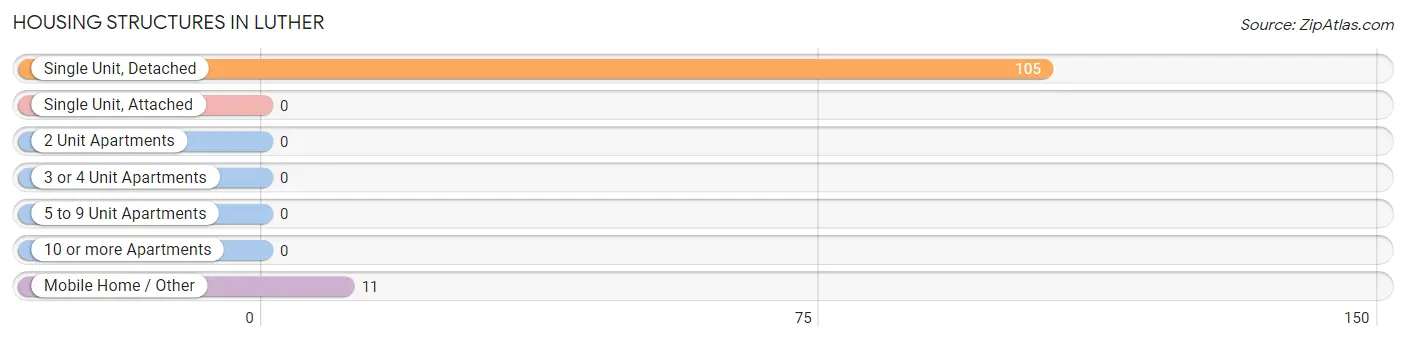
| Structure Type | # Housing Units | % Housing Units |
| Single Unit, Detached | 105 | 90.5% |
| Single Unit, Attached | 0 | 0.0% |
| 2 Unit Apartments | 0 | 0.0% |
| 3 or 4 Unit Apartments | 0 | 0.0% |
| 5 to 9 Unit Apartments | 0 | 0.0% |
| 10 or more Apartments | 0 | 0.0% |
| Mobile Home / Other | 11 | 9.5% |
| Total | 116 | 100.0% |
Housing Structures by Occupancy in Luther
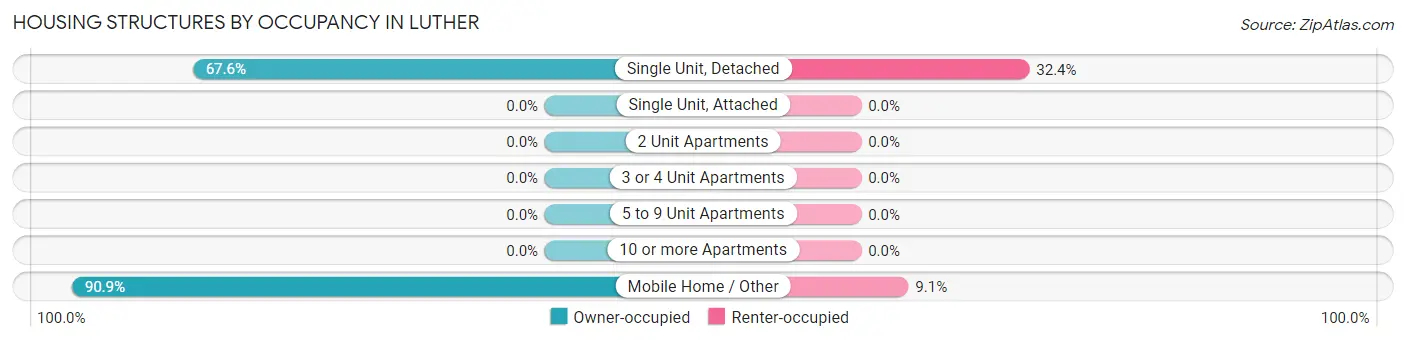
| Structure Type | Owner-occupied | Renter-occupied |
| Single Unit, Detached | 71 (67.6%) | 34 (32.4%) |
| Single Unit, Attached | 0 (0.0%) | 0 (0.0%) |
| 2 Unit Apartments | 0 (0.0%) | 0 (0.0%) |
| 3 or 4 Unit Apartments | 0 (0.0%) | 0 (0.0%) |
| 5 to 9 Unit Apartments | 0 (0.0%) | 0 (0.0%) |
| 10 or more Apartments | 0 (0.0%) | 0 (0.0%) |
| Mobile Home / Other | 10 (90.9%) | 1 (9.1%) |
| Total | 81 (69.8%) | 35 (30.2%) |
Housing Structures by Number of Rooms in Luther
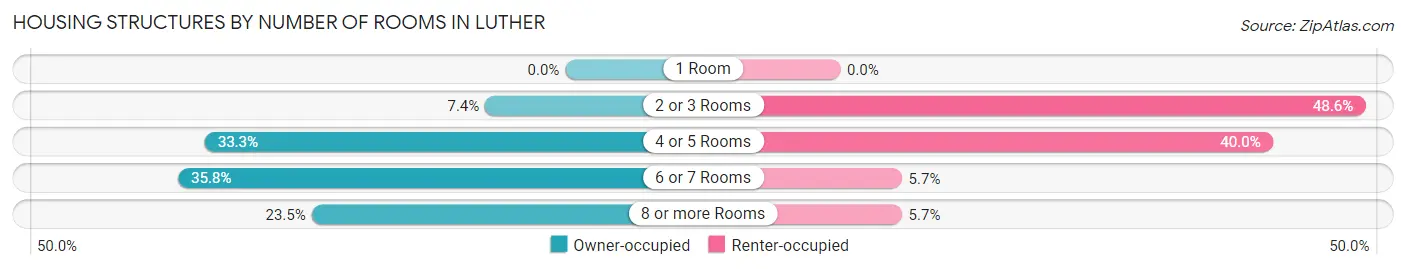
| Number of Rooms | Owner-occupied | Renter-occupied |
| 1 Room | 0 (0.0%) | 0 (0.0%) |
| 2 or 3 Rooms | 6 (7.4%) | 17 (48.6%) |
| 4 or 5 Rooms | 27 (33.3%) | 14 (40.0%) |
| 6 or 7 Rooms | 29 (35.8%) | 2 (5.7%) |
| 8 or more Rooms | 19 (23.5%) | 2 (5.7%) |
| Total | 81 (100.0%) | 35 (100.0%) |
Housing Structure by Heating Type in Luther
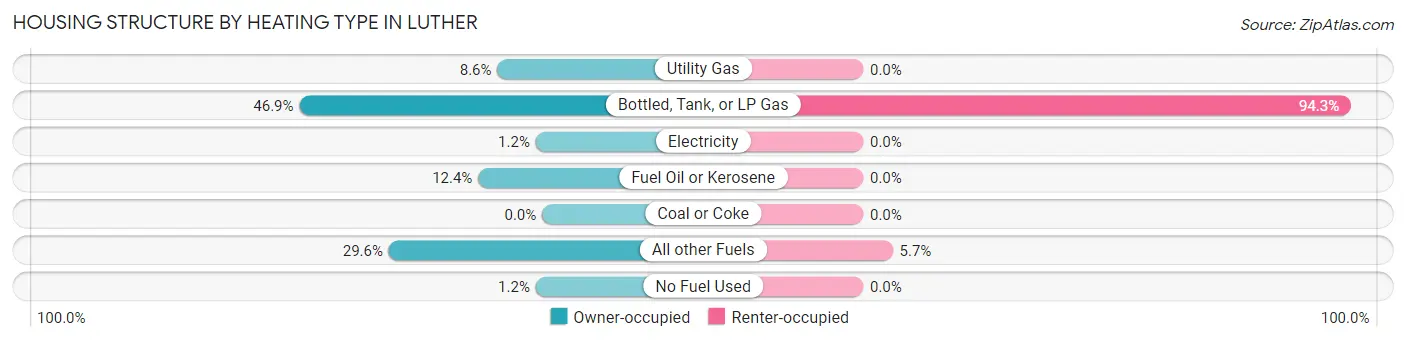
| Heating Type | Owner-occupied | Renter-occupied |
| Utility Gas | 7 (8.6%) | 0 (0.0%) |
| Bottled, Tank, or LP Gas | 38 (46.9%) | 33 (94.3%) |
| Electricity | 1 (1.2%) | 0 (0.0%) |
| Fuel Oil or Kerosene | 10 (12.3%) | 0 (0.0%) |
| Coal or Coke | 0 (0.0%) | 0 (0.0%) |
| All other Fuels | 24 (29.6%) | 2 (5.7%) |
| No Fuel Used | 1 (1.2%) | 0 (0.0%) |
| Total | 81 (100.0%) | 35 (100.0%) |
Household Vehicle Usage in Luther
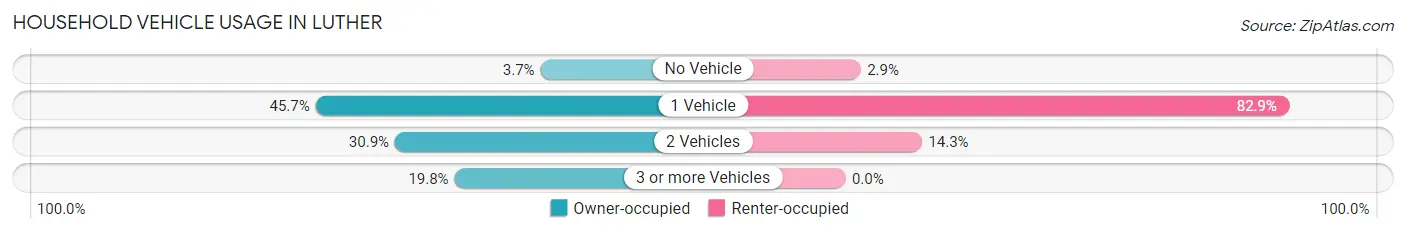
| Vehicles per Household | Owner-occupied | Renter-occupied |
| No Vehicle | 3 (3.7%) | 1 (2.9%) |
| 1 Vehicle | 37 (45.7%) | 29 (82.9%) |
| 2 Vehicles | 25 (30.9%) | 5 (14.3%) |
| 3 or more Vehicles | 16 (19.8%) | 0 (0.0%) |
| Total | 81 (100.0%) | 35 (100.0%) |
Real Estate & Mortgages in Luther
Real Estate and Mortgage Overview in Luther
| Characteristic | Without Mortgage | With Mortgage |
| Housing Units | 44 | 37 |
| Median Property Value | $108,300 | $72,900 |
| Median Household Income | $50,000 | $0 |
| Monthly Housing Costs | $533 | $0 |
| Real Estate Taxes | $1,596 | $0 |
Property Value by Mortgage Status in Luther
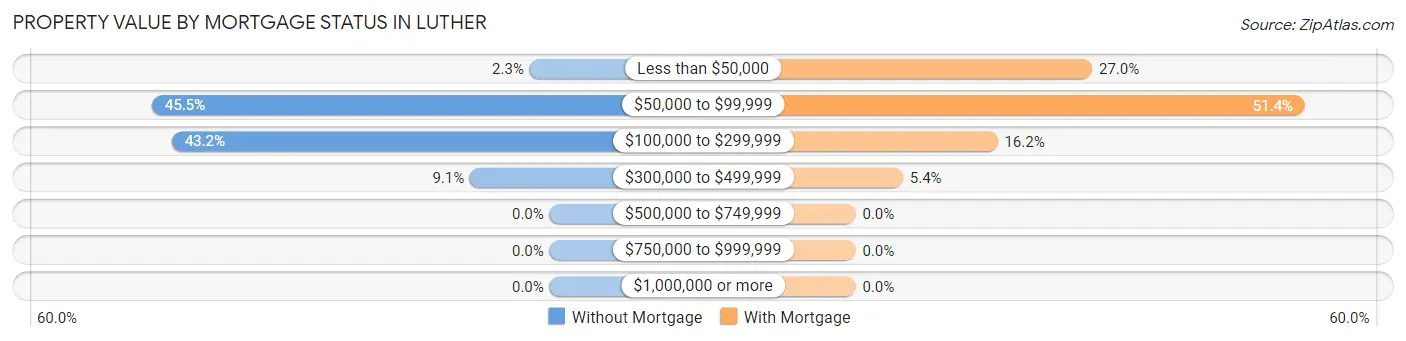
| Property Value | Without Mortgage | With Mortgage |
| Less than $50,000 | 1 (2.3%) | 10 (27.0%) |
| $50,000 to $99,999 | 20 (45.5%) | 19 (51.3%) |
| $100,000 to $299,999 | 19 (43.2%) | 6 (16.2%) |
| $300,000 to $499,999 | 4 (9.1%) | 2 (5.4%) |
| $500,000 to $749,999 | 0 (0.0%) | 0 (0.0%) |
| $750,000 to $999,999 | 0 (0.0%) | 0 (0.0%) |
| $1,000,000 or more | 0 (0.0%) | 0 (0.0%) |
| Total | 44 (100.0%) | 37 (100.0%) |
Household Income by Mortgage Status in Luther
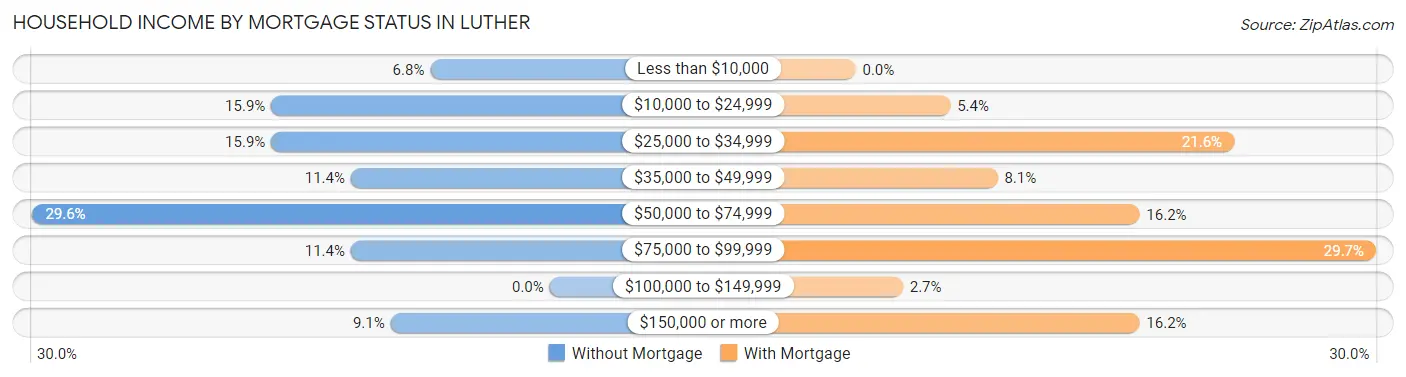
| Household Income | Without Mortgage | With Mortgage |
| Less than $10,000 | 3 (6.8%) | 0 (0.0%) |
| $10,000 to $24,999 | 7 (15.9%) | 2 (5.4%) |
| $25,000 to $34,999 | 7 (15.9%) | 8 (21.6%) |
| $35,000 to $49,999 | 5 (11.4%) | 3 (8.1%) |
| $50,000 to $74,999 | 13 (29.5%) | 6 (16.2%) |
| $75,000 to $99,999 | 5 (11.4%) | 11 (29.7%) |
| $100,000 to $149,999 | 0 (0.0%) | 1 (2.7%) |
| $150,000 or more | 4 (9.1%) | 6 (16.2%) |
| Total | 44 (100.0%) | 37 (100.0%) |
Property Value to Household Income Ratio in Luther
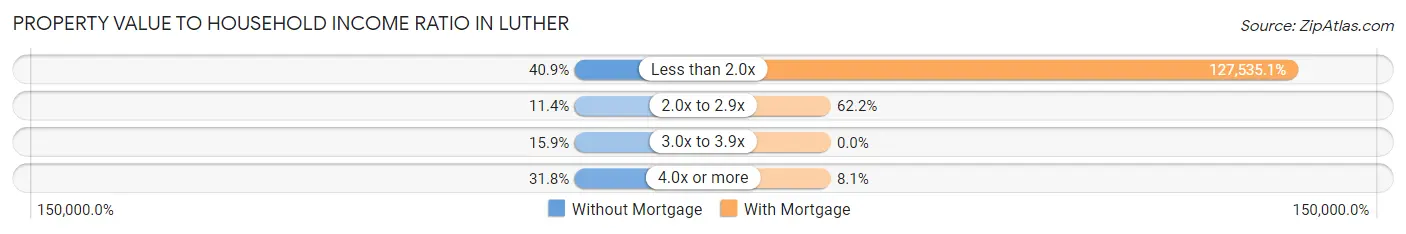
| Value-to-Income Ratio | Without Mortgage | With Mortgage |
| Less than 2.0x | 18 (40.9%) | 47,188 (127,535.1%) |
| 2.0x to 2.9x | 5 (11.4%) | 23 (62.2%) |
| 3.0x to 3.9x | 7 (15.9%) | 0 (0.0%) |
| 4.0x or more | 14 (31.8%) | 3 (8.1%) |
| Total | 44 (100.0%) | 37 (100.0%) |
Real Estate Taxes by Mortgage Status in Luther
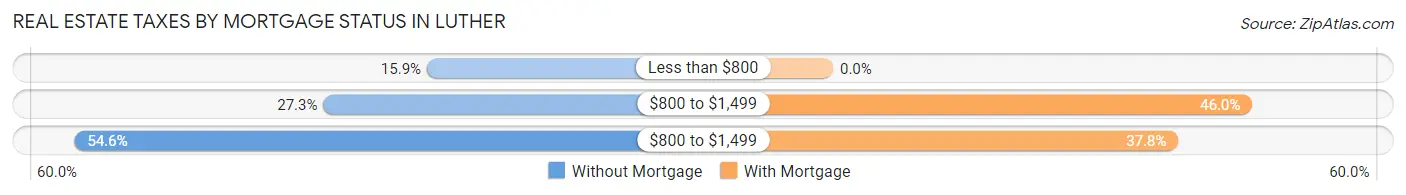
| Property Taxes | Without Mortgage | With Mortgage |
| Less than $800 | 7 (15.9%) | 0 (0.0%) |
| $800 to $1,499 | 12 (27.3%) | 17 (46.0%) |
| $800 to $1,499 | 24 (54.5%) | 14 (37.8%) |
| Total | 44 (100.0%) | 37 (100.0%) |
Health & Disability in Luther
Health Insurance Coverage by Age in Luther
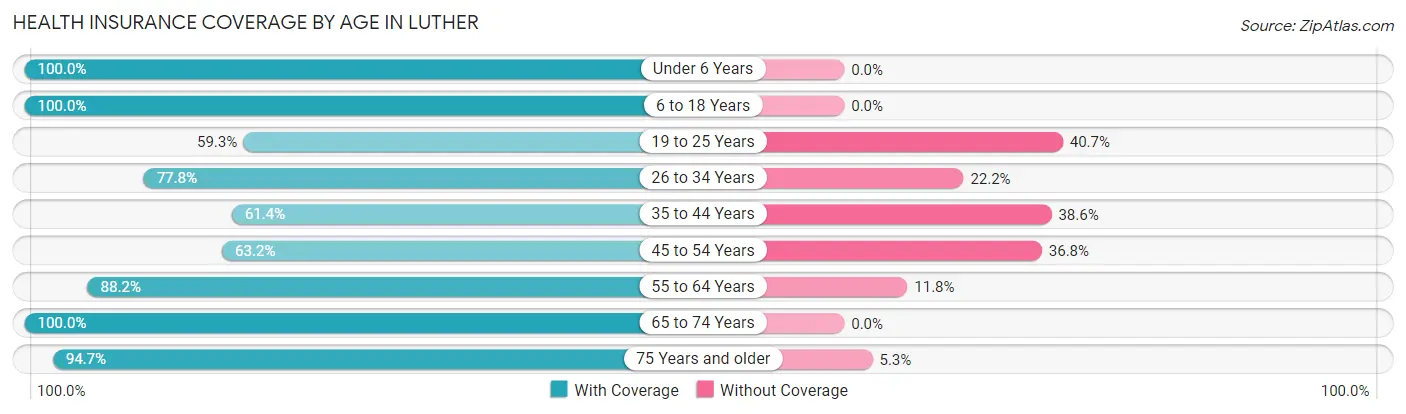
| Age Bracket | With Coverage | Without Coverage |
| Under 6 Years | 18 (100.0%) | 0 (0.0%) |
| 6 to 18 Years | 29 (100.0%) | 0 (0.0%) |
| 19 to 25 Years | 16 (59.3%) | 11 (40.7%) |
| 26 to 34 Years | 7 (77.8%) | 2 (22.2%) |
| 35 to 44 Years | 27 (61.4%) | 17 (38.6%) |
| 45 to 54 Years | 36 (63.2%) | 21 (36.8%) |
| 55 to 64 Years | 30 (88.2%) | 4 (11.8%) |
| 65 to 74 Years | 32 (100.0%) | 0 (0.0%) |
| 75 Years and older | 18 (94.7%) | 1 (5.3%) |
| Total | 213 (79.2%) | 56 (20.8%) |
Health Insurance Coverage by Citizenship Status in Luther
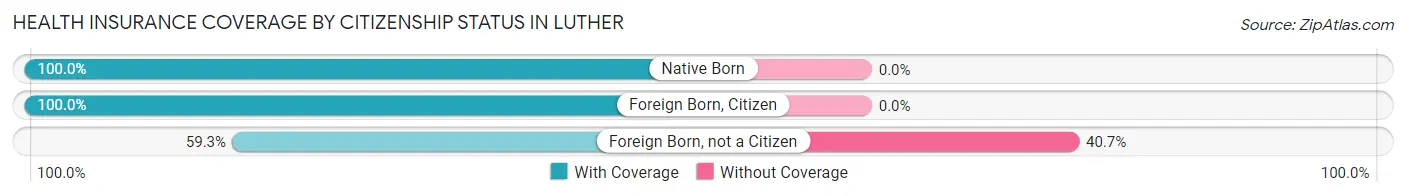
| Citizenship Status | With Coverage | Without Coverage |
| Native Born | 18 (100.0%) | 0 (0.0%) |
| Foreign Born, Citizen | 29 (100.0%) | 0 (0.0%) |
| Foreign Born, not a Citizen | 16 (59.3%) | 11 (40.7%) |
Health Insurance Coverage by Household Income in Luther
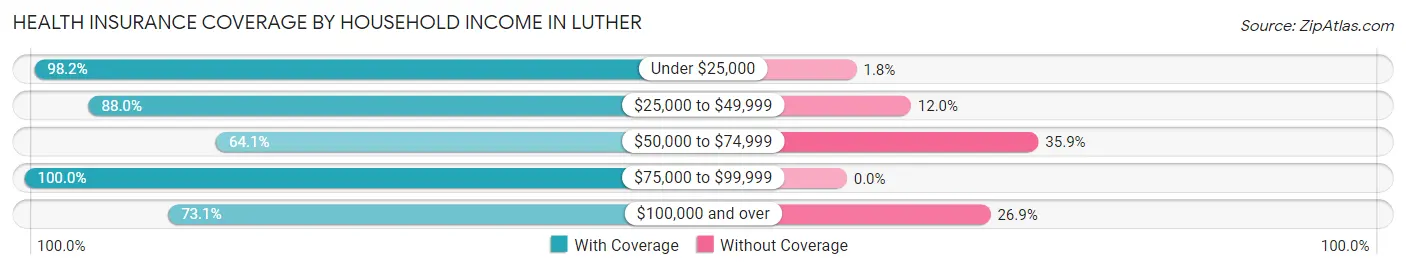
| Household Income | With Coverage | Without Coverage |
| Under $25,000 | 54 (98.2%) | 1 (1.8%) |
| $25,000 to $49,999 | 44 (88.0%) | 6 (12.0%) |
| $50,000 to $74,999 | 75 (64.1%) | 42 (35.9%) |
| $75,000 to $99,999 | 21 (100.0%) | 0 (0.0%) |
| $100,000 and over | 19 (73.1%) | 7 (26.9%) |
Public vs Private Health Insurance Coverage by Age in Luther
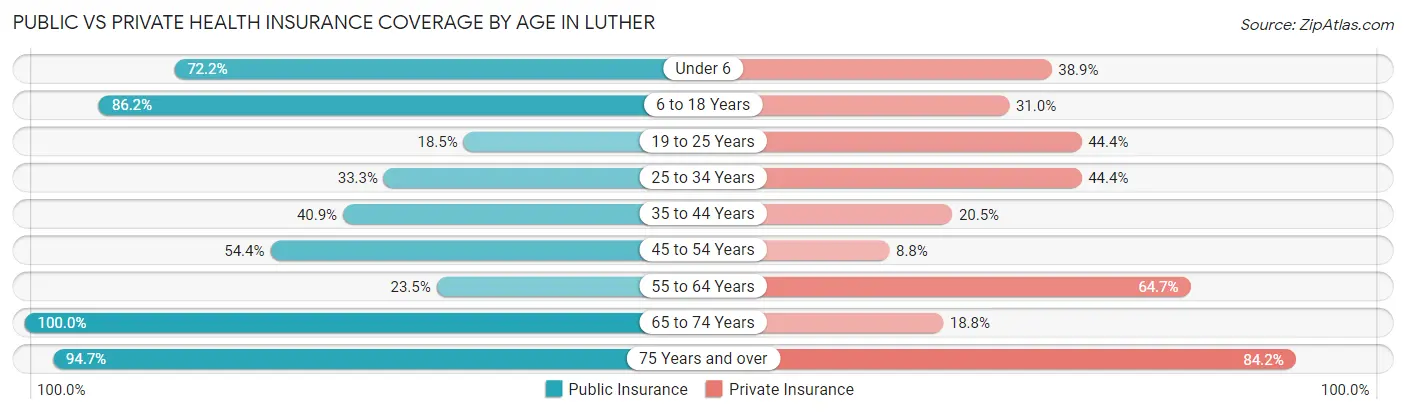
| Age Bracket | Public Insurance | Private Insurance |
| Under 6 | 13 (72.2%) | 7 (38.9%) |
| 6 to 18 Years | 25 (86.2%) | 9 (31.0%) |
| 19 to 25 Years | 5 (18.5%) | 12 (44.4%) |
| 25 to 34 Years | 3 (33.3%) | 4 (44.4%) |
| 35 to 44 Years | 18 (40.9%) | 9 (20.4%) |
| 45 to 54 Years | 31 (54.4%) | 5 (8.8%) |
| 55 to 64 Years | 8 (23.5%) | 22 (64.7%) |
| 65 to 74 Years | 32 (100.0%) | 6 (18.8%) |
| 75 Years and over | 18 (94.7%) | 16 (84.2%) |
| Total | 153 (56.9%) | 90 (33.5%) |
Disability Status by Sex by Age in Luther
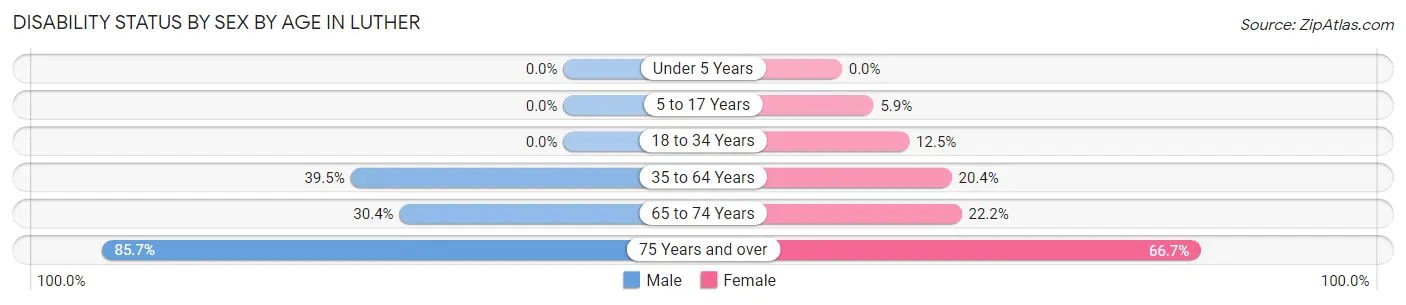
| Age Bracket | Male | Female |
| Under 5 Years | 0 (0.0%) | 0 (0.0%) |
| 5 to 17 Years | 0 (0.0%) | 1 (5.9%) |
| 18 to 34 Years | 0 (0.0%) | 2 (12.5%) |
| 35 to 64 Years | 32 (39.5%) | 11 (20.4%) |
| 65 to 74 Years | 7 (30.4%) | 2 (22.2%) |
| 75 Years and over | 6 (85.7%) | 8 (66.7%) |
Disability Class by Sex by Age in Luther
Disability Class: Hearing Difficulty
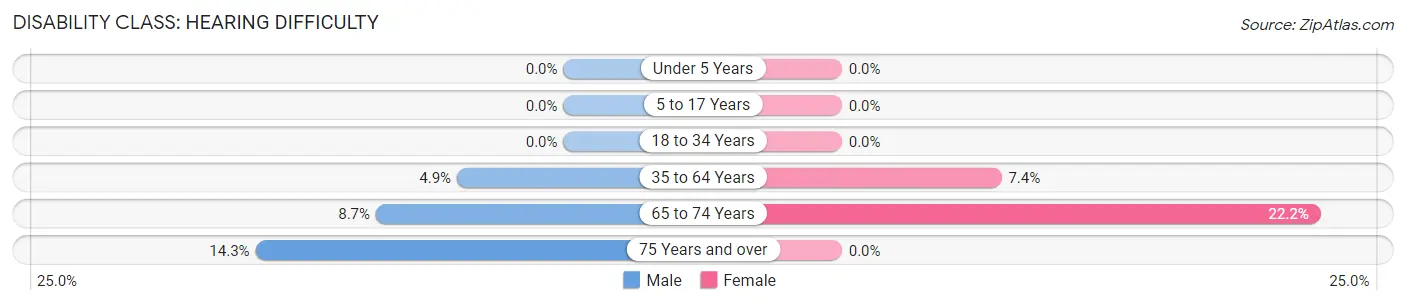
| Age Bracket | Male | Female |
| Under 5 Years | 0 (0.0%) | 0 (0.0%) |
| 5 to 17 Years | 0 (0.0%) | 0 (0.0%) |
| 18 to 34 Years | 0 (0.0%) | 0 (0.0%) |
| 35 to 64 Years | 4 (4.9%) | 4 (7.4%) |
| 65 to 74 Years | 2 (8.7%) | 2 (22.2%) |
| 75 Years and over | 1 (14.3%) | 0 (0.0%) |
Disability Class: Vision Difficulty
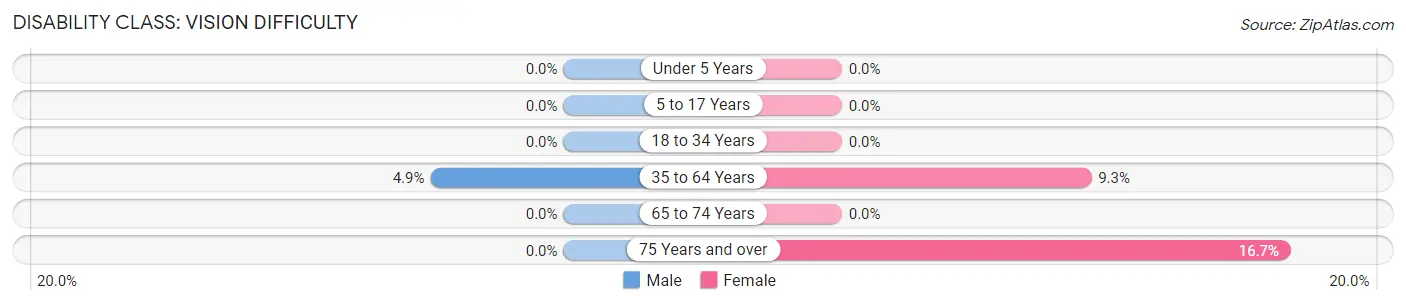
| Age Bracket | Male | Female |
| Under 5 Years | 0 (0.0%) | 0 (0.0%) |
| 5 to 17 Years | 0 (0.0%) | 0 (0.0%) |
| 18 to 34 Years | 0 (0.0%) | 0 (0.0%) |
| 35 to 64 Years | 4 (4.9%) | 5 (9.3%) |
| 65 to 74 Years | 0 (0.0%) | 0 (0.0%) |
| 75 Years and over | 0 (0.0%) | 2 (16.7%) |
Disability Class: Cognitive Difficulty
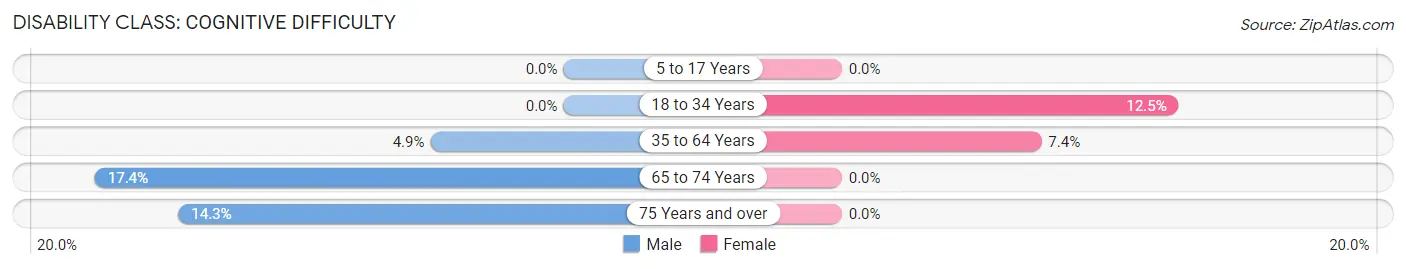
| Age Bracket | Male | Female |
| 5 to 17 Years | 0 (0.0%) | 0 (0.0%) |
| 18 to 34 Years | 0 (0.0%) | 2 (12.5%) |
| 35 to 64 Years | 4 (4.9%) | 4 (7.4%) |
| 65 to 74 Years | 4 (17.4%) | 0 (0.0%) |
| 75 Years and over | 1 (14.3%) | 0 (0.0%) |
Disability Class: Ambulatory Difficulty
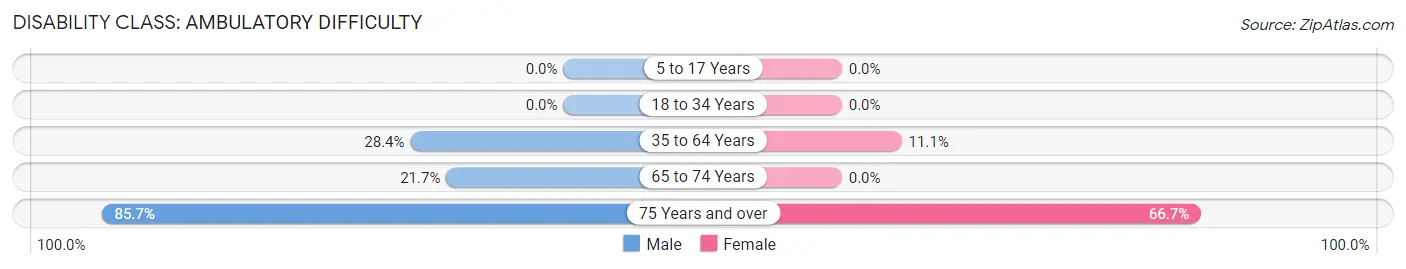
| Age Bracket | Male | Female |
| 5 to 17 Years | 0 (0.0%) | 0 (0.0%) |
| 18 to 34 Years | 0 (0.0%) | 0 (0.0%) |
| 35 to 64 Years | 23 (28.4%) | 6 (11.1%) |
| 65 to 74 Years | 5 (21.7%) | 0 (0.0%) |
| 75 Years and over | 6 (85.7%) | 8 (66.7%) |
Disability Class: Self-Care Difficulty
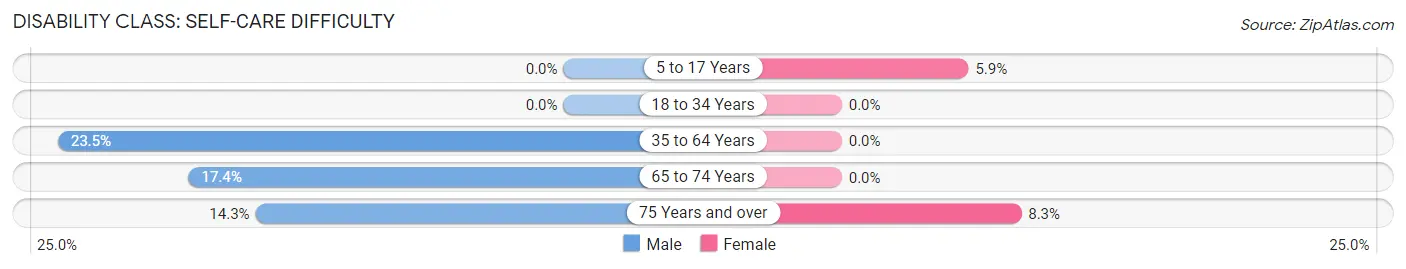
| Age Bracket | Male | Female |
| 5 to 17 Years | 0 (0.0%) | 1 (5.9%) |
| 18 to 34 Years | 0 (0.0%) | 0 (0.0%) |
| 35 to 64 Years | 19 (23.5%) | 0 (0.0%) |
| 65 to 74 Years | 4 (17.4%) | 0 (0.0%) |
| 75 Years and over | 1 (14.3%) | 1 (8.3%) |
Technology Access in Luther
Computing Device Access in Luther
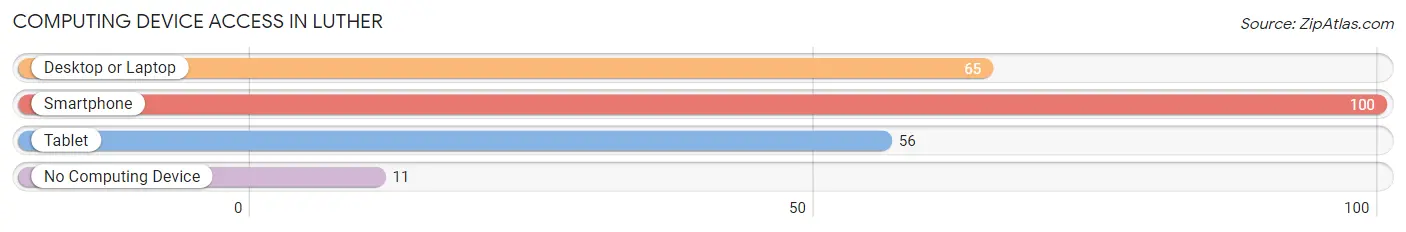
| Device Type | # Households | % Households |
| Desktop or Laptop | 65 | 56.0% |
| Smartphone | 100 | 86.2% |
| Tablet | 56 | 48.3% |
| No Computing Device | 11 | 9.5% |
| Total | 116 | 100.0% |
Internet Access in Luther
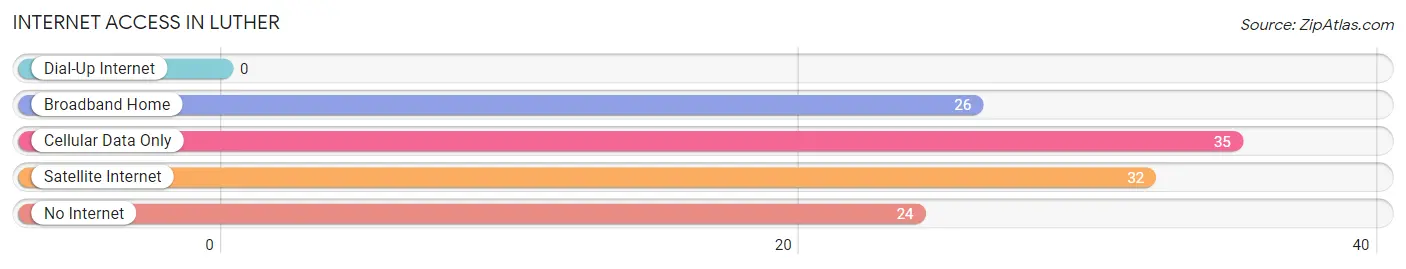
| Internet Type | # Households | % Households |
| Dial-Up Internet | 0 | 0.0% |
| Broadband Home | 26 | 22.4% |
| Cellular Data Only | 35 | 30.2% |
| Satellite Internet | 32 | 27.6% |
| No Internet | 24 | 20.7% |
| Total | 116 | 100.0% |
Luther Summary
Luther is a small unincorporated community located in the northern part of Michigan’s Lower Peninsula. It is situated in the northwest corner of Lake County, approximately 20 miles east of Traverse City. The community is surrounded by rolling hills, forests, and lakes, making it a popular destination for outdoor recreation.
History
The area that is now Luther was first settled in the late 1800s by a group of German immigrants. The settlers named the community after Martin Luther, the German theologian and leader of the Protestant Reformation. The first post office was established in 1891, and the village was officially incorporated in 1895.
In the early 1900s, Luther was a thriving agricultural community, with many of the residents working in the local lumber industry. The village also had a number of small businesses, including a general store, a blacksmith shop, and a sawmill.
In the 1950s, the lumber industry began to decline, and many of the residents moved away. The village was eventually disincorporated in the 1970s, and the population has remained relatively stable since then.
Geography
Luther is located in the northwest corner of Lake County, approximately 20 miles east of Traverse City. The community is situated on the banks of the Manistee River, which flows through the area. The terrain is mostly rolling hills, with some flat areas near the river. The area is heavily forested, with a mix of hardwood and coniferous trees.
The climate in Luther is typical of the northern Lower Peninsula, with cold winters and warm summers. The average annual temperature is around 45 degrees Fahrenheit, and the average annual precipitation is around 30 inches.
Economy
The economy of Luther is largely based on tourism and outdoor recreation. The area is popular for fishing, hunting, camping, and other outdoor activities. There are also several small businesses in the village, including a general store, a gas station, and a restaurant.
Demographics
As of the 2010 census, the population of Luther was 545. The racial makeup of the village was 97.3% White, 0.2% African American, 0.4% Native American, 0.2% Asian, 0.2% from other races, and 1.7% from two or more races. The median household income was $37,500, and the median family income was $41,250. The per capita income was $17,500.
Conclusion
Luther is a small unincorporated community located in the northern part of Michigan’s Lower Peninsula. It is situated in the northwest corner of Lake County, approximately 20 miles east of Traverse City. The community is surrounded by rolling hills, forests, and lakes, making it a popular destination for outdoor recreation. The economy of Luther is largely based on tourism and outdoor recreation, and the population of the village was 545 as of the 2010 census.
Common Questions
What is Per Capita Income in Luther?
Per Capita income in Luther is $26,270.
What is the Median Family Income in Luther?
Median Family Income in Luther is $55,313.
What is the Median Household income in Luther?
Median Household Income in Luther is $50,278.
What is Income or Wage Gap in Luther?
Income or Wage Gap in Luther is 6.4%.
Women in Luther earn 93.6 cents for every dollar earned by a man.
What is Inequality or Gini Index in Luther?
Inequality or Gini Index in Luther is 0.39.
What is the Total Population of Luther?
Total Population of Luther is 269.
What is the Total Male Population of Luther?
Total Male Population of Luther is 152.
What is the Total Female Population of Luther?
Total Female Population of Luther is 117.
What is the Ratio of Males per 100 Females in Luther?
There are 129.91 Males per 100 Females in Luther.
What is the Ratio of Females per 100 Males in Luther?
There are 76.97 Females per 100 Males in Luther.
What is the Median Population Age in Luther?
Median Population Age in Luther is 48.5 Years.
What is the Average Family Size in Luther
Average Family Size in Luther is 2.9 People.
What is the Average Household Size in Luther
Average Household Size in Luther is 2.3 People.
How Large is the Labor Force in Luther?
There are 118 People in the Labor Forcein in Luther.
What is the Percentage of People in the Labor Force in Luther?
50.9% of People are in the Labor Force in Luther.
What is the Unemployment Rate in Luther?
Unemployment Rate in Luther is 8.5%.