Lake Leelanau, MI Map & Demographics
Lake Leelanau Map
Lake Leelanau Overview
$25,060
PER CAPITA INCOME
$48,125
AVG HOUSEHOLD INCOME
0.43
INEQUALITY / GINI INDEX
165
TOTAL POPULATION
87
MALE POPULATION
78
FEMALE POPULATION
111.54
MALES / 100 FEMALES
89.66
FEMALES / 100 MALES
27.9
MEDIAN AGE
5.2
AVG FAMILY SIZE
3.2
AVG HOUSEHOLD SIZE
60
LABOR FORCE [ PEOPLE ]
61.9%
PERCENT IN LABOR FORCE
Lake Leelanau Zip Codes
Lake Leelanau Area Codes
Income in Lake Leelanau
Income Overview in Lake Leelanau
| Characteristic | Number | Measure |
| Per Capita Income | 165 | $25,060 |
| Median Family Income | 27 | $0 |
| Mean Family Income | 27 | $120,685 |
| Median Household Income | 52 | $48,125 |
| Mean Household Income | 52 | $75,523 |
| Income Deficit | 27 | $0 |
| Wage / Income Gap (%) | 165 | 0.00% |
| Wage / Income Gap ($) | 165 | 100.00¢ per $1 |
| Gini / Inequality Index | 165 | 0.43 |
Earnings by Sex in Lake Leelanau
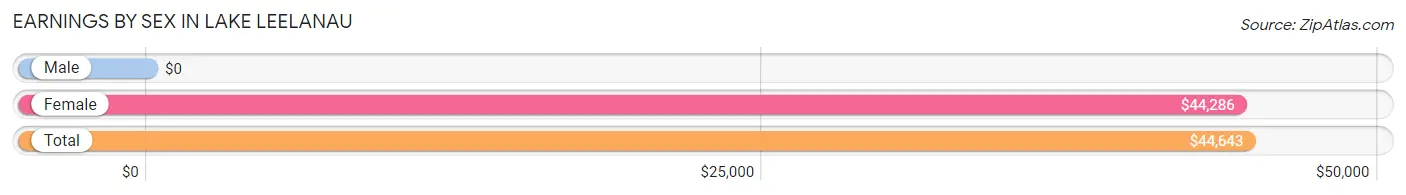
| Sex | Number | Average Earnings |
| Male | 32 (53.3%) | $0 |
| Female | 28 (46.7%) | $44,286 |
| Total | 60 (100.0%) | $44,643 |
Earnings by Sex by Income Bracket in Lake Leelanau
The most common earnings brackets in Lake Leelanau are $100,000+ for men (14 | 43.8%) and $55,000 to $64,999 for women (12 | 42.9%).
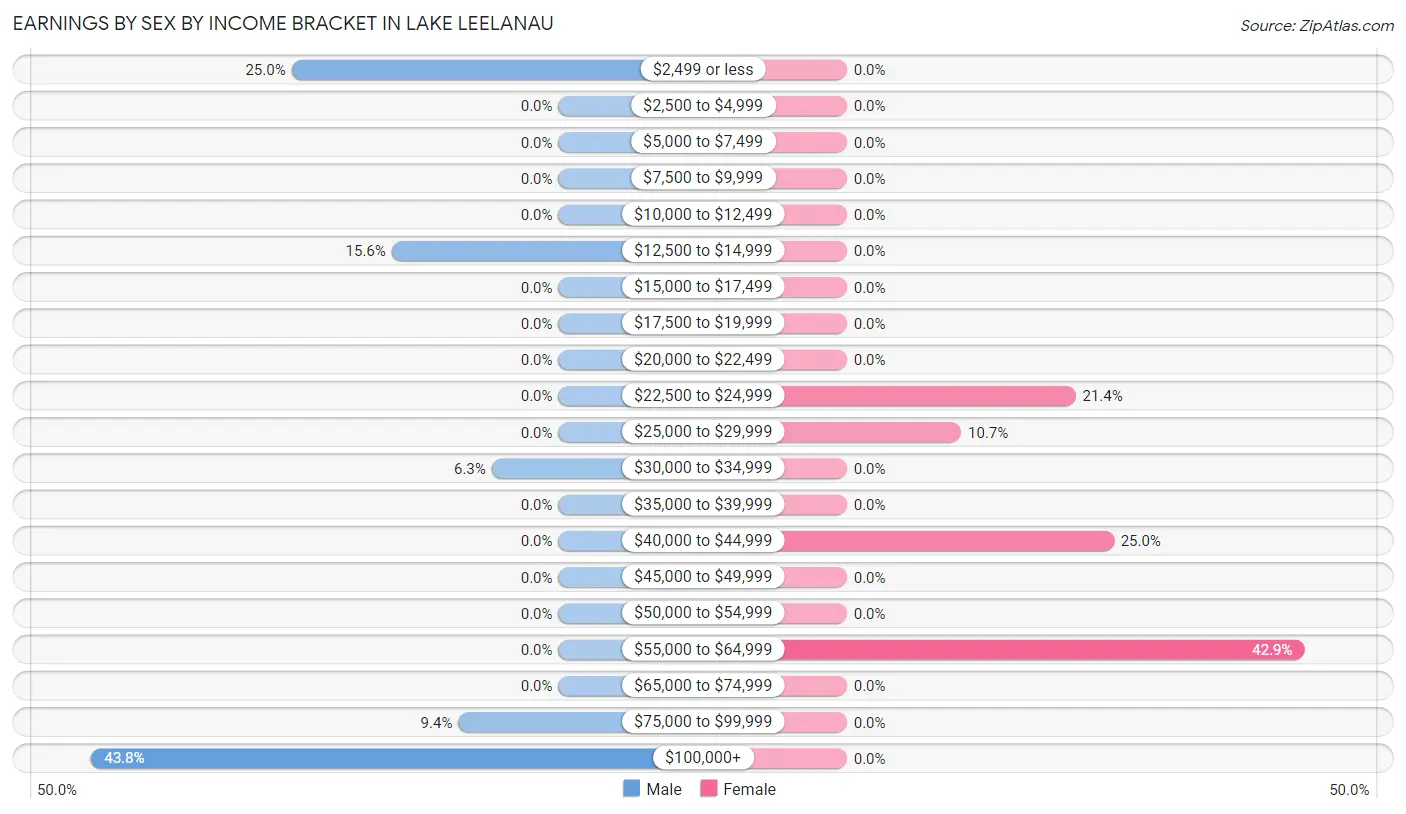
| Income | Male | Female |
| $2,499 or less | 8 (25.0%) | 0 (0.0%) |
| $2,500 to $4,999 | 0 (0.0%) | 0 (0.0%) |
| $5,000 to $7,499 | 0 (0.0%) | 0 (0.0%) |
| $7,500 to $9,999 | 0 (0.0%) | 0 (0.0%) |
| $10,000 to $12,499 | 0 (0.0%) | 0 (0.0%) |
| $12,500 to $14,999 | 5 (15.6%) | 0 (0.0%) |
| $15,000 to $17,499 | 0 (0.0%) | 0 (0.0%) |
| $17,500 to $19,999 | 0 (0.0%) | 0 (0.0%) |
| $20,000 to $22,499 | 0 (0.0%) | 0 (0.0%) |
| $22,500 to $24,999 | 0 (0.0%) | 6 (21.4%) |
| $25,000 to $29,999 | 0 (0.0%) | 3 (10.7%) |
| $30,000 to $34,999 | 2 (6.2%) | 0 (0.0%) |
| $35,000 to $39,999 | 0 (0.0%) | 0 (0.0%) |
| $40,000 to $44,999 | 0 (0.0%) | 7 (25.0%) |
| $45,000 to $49,999 | 0 (0.0%) | 0 (0.0%) |
| $50,000 to $54,999 | 0 (0.0%) | 0 (0.0%) |
| $55,000 to $64,999 | 0 (0.0%) | 12 (42.9%) |
| $65,000 to $74,999 | 0 (0.0%) | 0 (0.0%) |
| $75,000 to $99,999 | 3 (9.4%) | 0 (0.0%) |
| $100,000+ | 14 (43.8%) | 0 (0.0%) |
| Total | 32 (100.0%) | 28 (100.0%) |
Earnings by Sex by Educational Attainment in Lake Leelanau
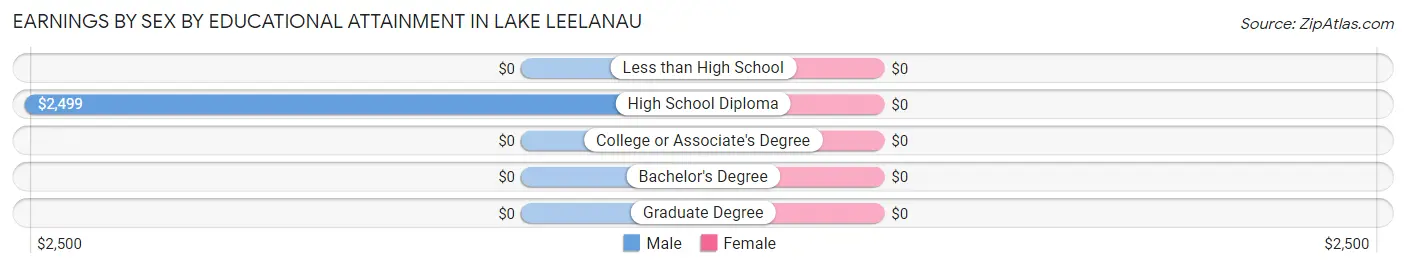
| Educational Attainment | Male Income | Female Income |
| Less than High School | - | - |
| High School Diploma | $2,499 | $0 |
| College or Associate's Degree | - | - |
| Bachelor's Degree | - | - |
| Graduate Degree | - | - |
| Total | - | - |
Family Income in Lake Leelanau
Family Income Brackets in Lake Leelanau
According to the Lake Leelanau family income data, there are 15 families falling into the $150,000 to $199,999 income range, which is the most common income bracket and makes up 55.6% of all families.
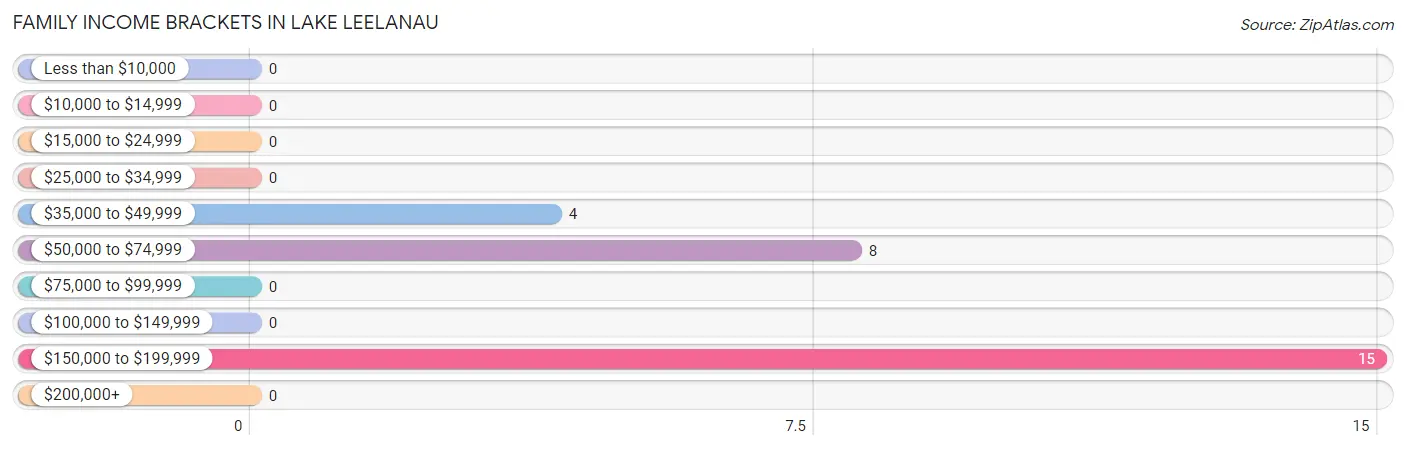
| Income Bracket | # Families | % Families |
| Less than $10,000 | 0 | 0.0% |
| $10,000 to $14,999 | 0 | 0.0% |
| $15,000 to $24,999 | 0 | 0.0% |
| $25,000 to $34,999 | 0 | 0.0% |
| $35,000 to $49,999 | 4 | 14.8% |
| $50,000 to $74,999 | 8 | 29.6% |
| $75,000 to $99,999 | 0 | 0.0% |
| $100,000 to $149,999 | 0 | 0.0% |
| $150,000 to $199,999 | 15 | 55.6% |
| $200,000+ | 0 | 0.0% |
Family Income by Famaliy Size in Lake Leelanau
| Income Bracket | # Families | Median Income |
| 2-Person Families | 7 (25.9%) | $0 |
| 3-Person Families | 8 (29.6%) | $0 |
| 4-Person Families | 0 (0.0%) | $0 |
| 5-Person Families | 0 (0.0%) | $0 |
| 6-Person Families | 0 (0.0%) | $0 |
| 7+ Person Families | 12 (44.4%) | $0 |
| Total | 27 (100.0%) | $0 |
Family Income by Number of Earners in Lake Leelanau
| Number of Earners | # Families | Median Income |
| No Earners | 0 (0.0%) | $0 |
| 1 Earner | 4 (14.8%) | $0 |
| 2 Earners | 15 (55.6%) | $0 |
| 3+ Earners | 8 (29.6%) | $0 |
| Total | 27 (100.0%) | $0 |
Household Income in Lake Leelanau
Household Income Brackets in Lake Leelanau
With 21 households falling in the category, the $25,000 to $34,999 income range is the most frequent in Lake Leelanau, accounting for 40.4% of all households.
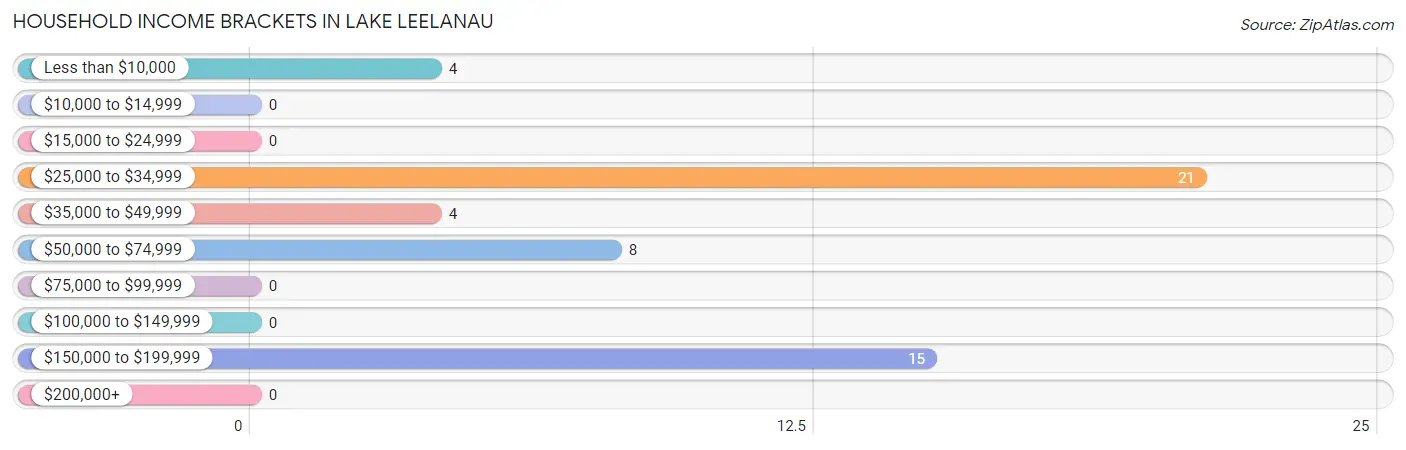
| Income Bracket | # Households | % Households |
| Less than $10,000 | 4 | 7.7% |
| $10,000 to $14,999 | 0 | 0.0% |
| $15,000 to $24,999 | 0 | 0.0% |
| $25,000 to $34,999 | 21 | 40.4% |
| $35,000 to $49,999 | 4 | 7.7% |
| $50,000 to $74,999 | 8 | 15.4% |
| $75,000 to $99,999 | 0 | 0.0% |
| $100,000 to $149,999 | 0 | 0.0% |
| $150,000 to $199,999 | 15 | 28.8% |
| $200,000+ | 0 | 0.0% |
Household Income by Householder Age in Lake Leelanau
The median household income in Lake Leelanau is $48,125, with the highest median household income of $58,906 found in the 45 to 64 years age bracket for the primary householder. A total of 13 households (25.0%) fall into this category.
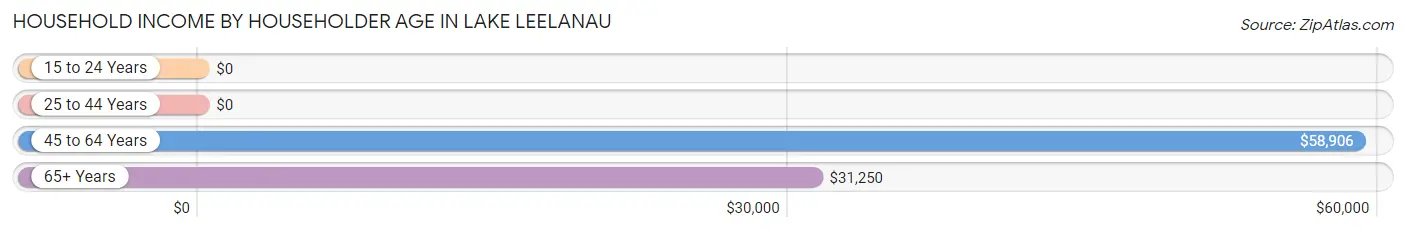
| Income Bracket | # Households | Median Income |
| 15 to 24 Years | 0 (0.0%) | $0 |
| 25 to 44 Years | 12 (23.1%) | $0 |
| 45 to 64 Years | 13 (25.0%) | $58,906 |
| 65+ Years | 27 (51.9%) | $31,250 |
| Total | 52 (100.0%) | $48,125 |
Poverty in Lake Leelanau
Income Below Poverty by Sex and Age in Lake Leelanau
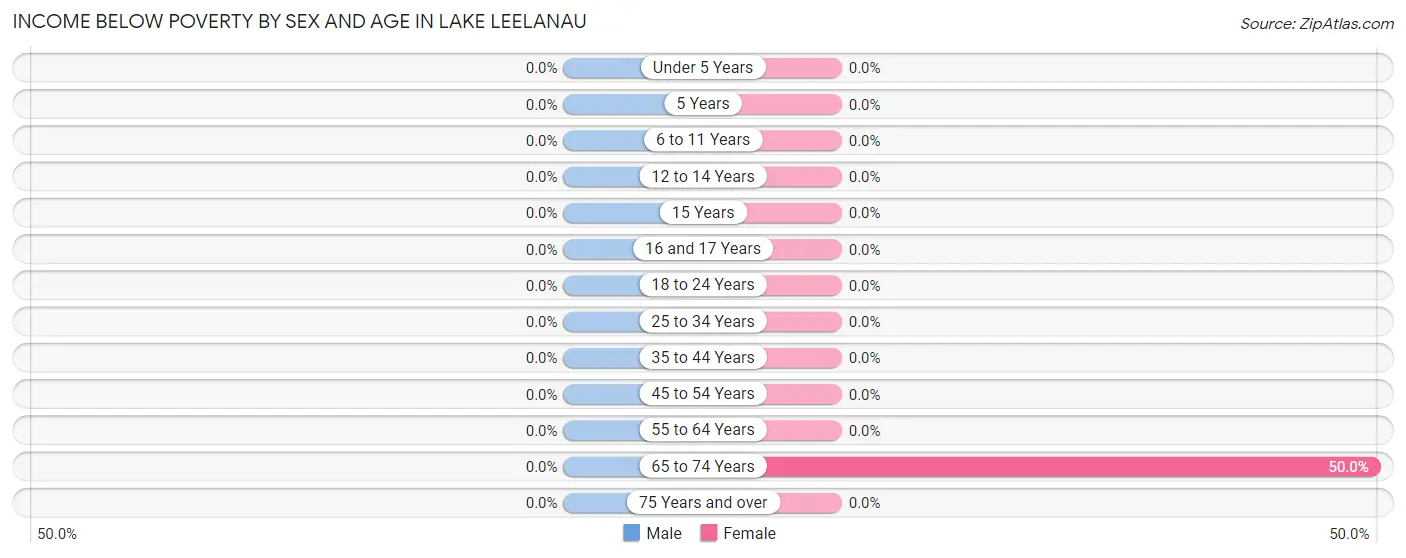
| Age Bracket | Male | Female |
| Under 5 Years | 0 (0.0%) | 0 (0.0%) |
| 5 Years | 0 (0.0%) | 0 (0.0%) |
| 6 to 11 Years | 0 (0.0%) | 0 (0.0%) |
| 12 to 14 Years | 0 (0.0%) | 0 (0.0%) |
| 15 Years | 0 (0.0%) | 0 (0.0%) |
| 16 and 17 Years | 0 (0.0%) | 0 (0.0%) |
| 18 to 24 Years | 0 (0.0%) | 0 (0.0%) |
| 25 to 34 Years | 0 (0.0%) | 0 (0.0%) |
| 35 to 44 Years | 0 (0.0%) | 0 (0.0%) |
| 45 to 54 Years | 0 (0.0%) | 0 (0.0%) |
| 55 to 64 Years | 0 (0.0%) | 0 (0.0%) |
| 65 to 74 Years | 0 (0.0%) | 4 (50.0%) |
| 75 Years and over | 0 (0.0%) | 0 (0.0%) |
| Total | 0 (0.0%) | 4 (5.1%) |
Income Above Poverty by Sex and Age in Lake Leelanau
According to the poverty statistics in Lake Leelanau, males aged under 5 years and females aged 5 years are the age groups that are most secure financially, with 100.0% of males and 100.0% of females in these age groups living above the poverty line.
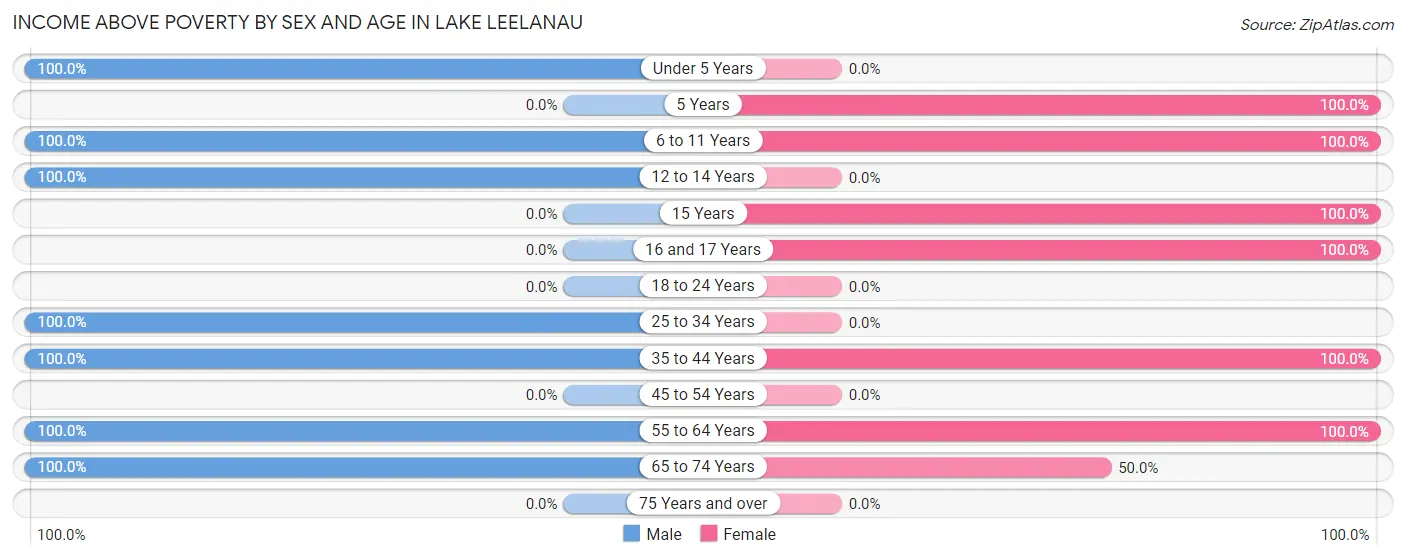
| Age Bracket | Male | Female |
| Under 5 Years | 12 (100.0%) | 0 (0.0%) |
| 5 Years | 0 (0.0%) | 12 (100.0%) |
| 6 to 11 Years | 12 (100.0%) | 11 (100.0%) |
| 12 to 14 Years | 12 (100.0%) | 0 (0.0%) |
| 15 Years | 0 (0.0%) | 9 (100.0%) |
| 16 and 17 Years | 0 (0.0%) | 10 (100.0%) |
| 18 to 24 Years | 0 (0.0%) | 0 (0.0%) |
| 25 to 34 Years | 5 (100.0%) | 0 (0.0%) |
| 35 to 44 Years | 14 (100.0%) | 12 (100.0%) |
| 45 to 54 Years | 0 (0.0%) | 0 (0.0%) |
| 55 to 64 Years | 13 (100.0%) | 16 (100.0%) |
| 65 to 74 Years | 19 (100.0%) | 4 (50.0%) |
| 75 Years and over | 0 (0.0%) | 0 (0.0%) |
| Total | 87 (100.0%) | 74 (94.9%) |
Income Below Poverty Among Married-Couple Families in Lake Leelanau
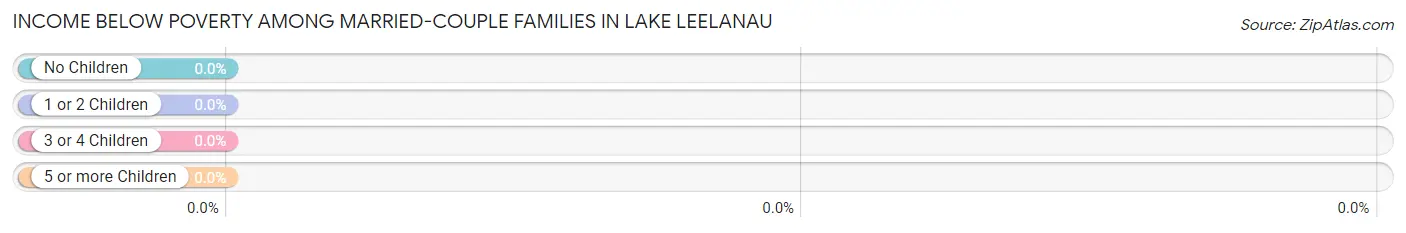
| Children | Above Poverty | Below Poverty |
| No Children | 11 (100.0%) | 0 (0.0%) |
| 1 or 2 Children | 0 (0.0%) | 0 (0.0%) |
| 3 or 4 Children | 0 (0.0%) | 0 (0.0%) |
| 5 or more Children | 12 (100.0%) | 0 (0.0%) |
| Total | 23 (100.0%) | 0 (0.0%) |
Income Below Poverty Among Single-Parent Households in Lake Leelanau
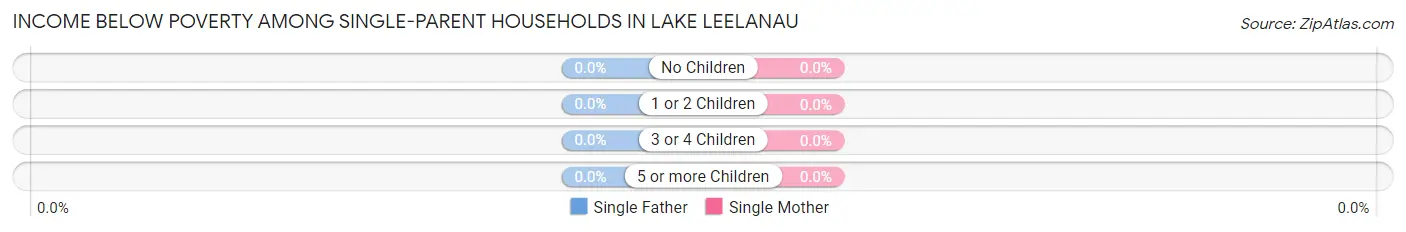
| Children | Single Father | Single Mother |
| No Children | 0 (0.0%) | 0 (0.0%) |
| 1 or 2 Children | 0 (0.0%) | 0 (0.0%) |
| 3 or 4 Children | 0 (0.0%) | 0 (0.0%) |
| 5 or more Children | 0 (0.0%) | 0 (0.0%) |
| Total | 0 (0.0%) | 0 (0.0%) |
Income Below Poverty Among Married-Couple vs Single-Parent Households in Lake Leelanau
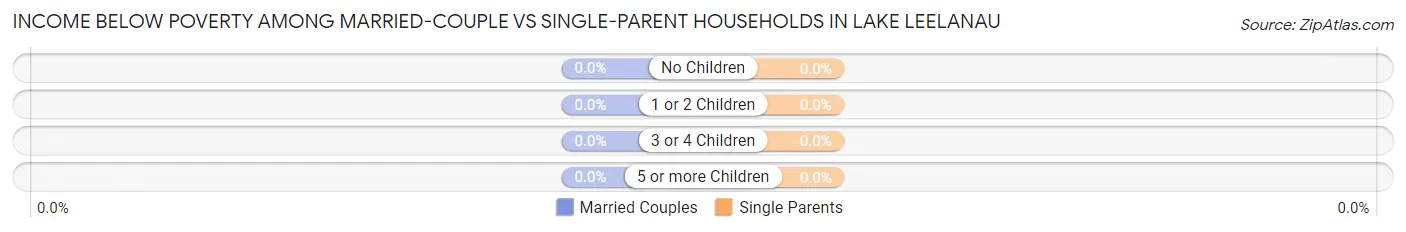
| Children | Married-Couple Families | Single-Parent Households |
| No Children | 0 (0.0%) | 0 (0.0%) |
| 1 or 2 Children | 0 (0.0%) | 0 (0.0%) |
| 3 or 4 Children | 0 (0.0%) | 0 (0.0%) |
| 5 or more Children | 0 (0.0%) | 0 (0.0%) |
| Total | 0 (0.0%) | 0 (0.0%) |
Race in Lake Leelanau
The most populous races in Lake Leelanau are White / Caucasian (145 | 87.9%), and Some other Race (20 | 12.1%).
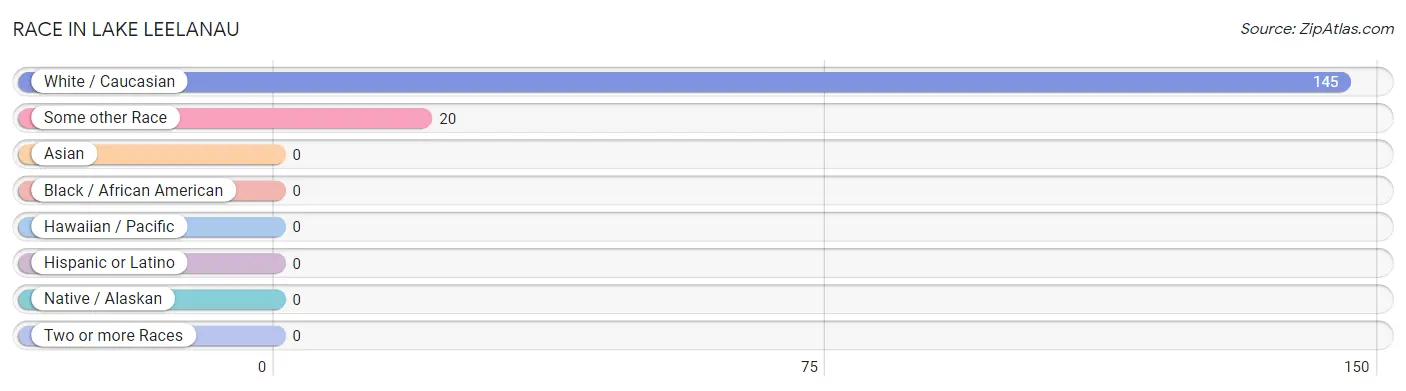
| Race | # Population | % Population |
| Asian | 0 | 0.0% |
| Black / African American | 0 | 0.0% |
| Hawaiian / Pacific | 0 | 0.0% |
| Hispanic or Latino | 0 | 0.0% |
| Native / Alaskan | 0 | 0.0% |
| White / Caucasian | 145 | 87.9% |
| Two or more Races | 0 | 0.0% |
| Some other Race | 20 | 12.1% |
| Total | 165 | 100.0% |
Ancestry in Lake Leelanau
The most populous ancestries reported in Lake Leelanau are Irish (19 | 11.5%), Polish (19 | 11.5%), European (15 | 9.1%), American (5 | 3.0%), and German (5 | 3.0%), together accounting for 38.2% of all Lake Leelanau residents.
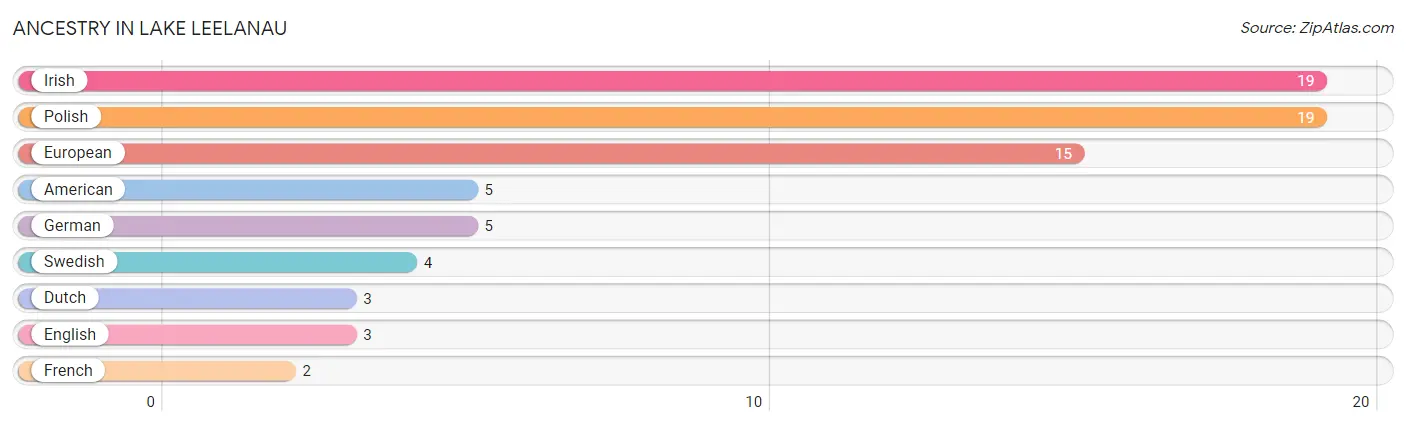
| Ancestry | # Population | % Population |
| American | 5 | 3.0% |
| Dutch | 3 | 1.8% |
| English | 3 | 1.8% |
| European | 15 | 9.1% |
| French | 2 | 1.2% |
| German | 5 | 3.0% |
| Irish | 19 | 11.5% |
| Polish | 19 | 11.5% |
| Swedish | 4 | 2.4% | View All 9 Rows |
Immigrants in Lake Leelanau

| Immigration Origin | # Population | % Population | View All 0 Rows |
Sex and Age in Lake Leelanau
Sex and Age in Lake Leelanau
The most populous age groups in Lake Leelanau are 65 to 69 Years (19 | 21.8%) for men and 15 to 19 Years (19 | 24.4%) for women.
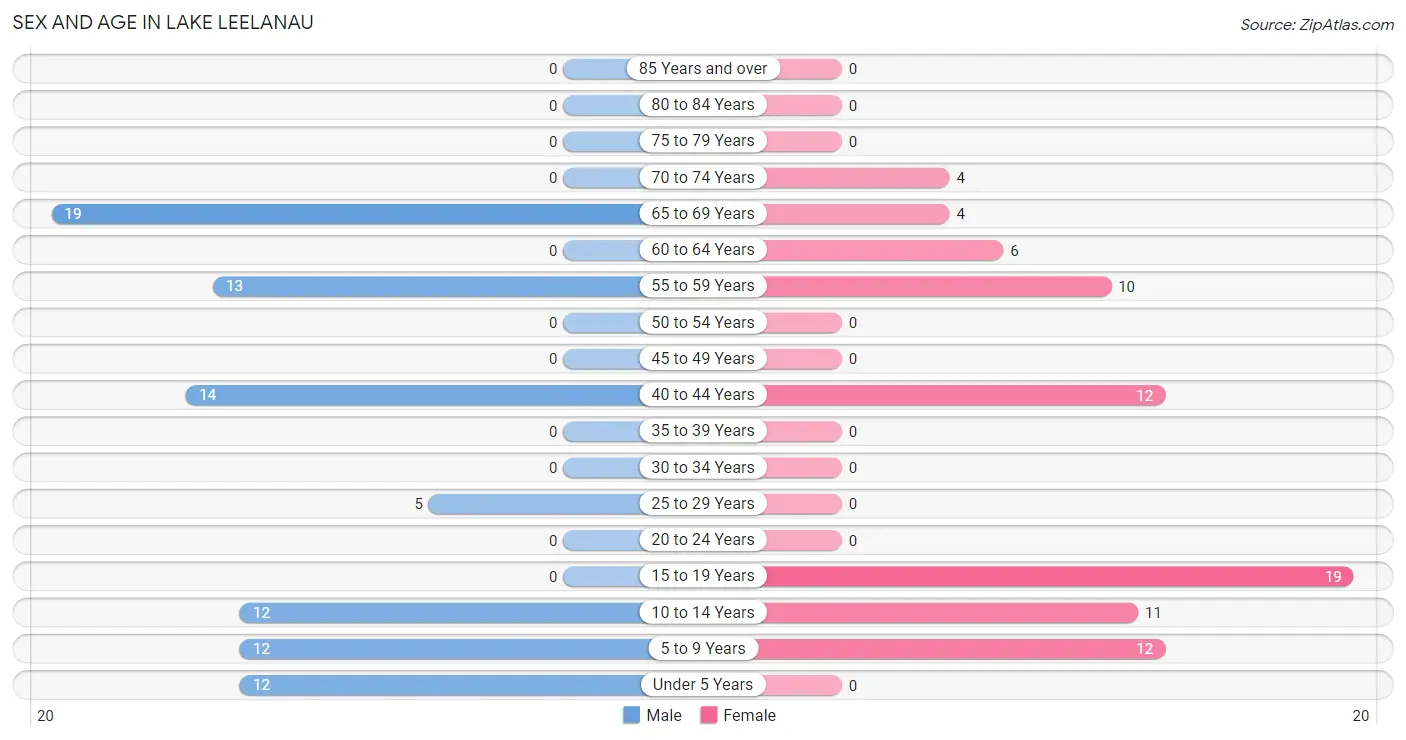
| Age Bracket | Male | Female |
| Under 5 Years | 12 (13.8%) | 0 (0.0%) |
| 5 to 9 Years | 12 (13.8%) | 12 (15.4%) |
| 10 to 14 Years | 12 (13.8%) | 11 (14.1%) |
| 15 to 19 Years | 0 (0.0%) | 19 (24.4%) |
| 20 to 24 Years | 0 (0.0%) | 0 (0.0%) |
| 25 to 29 Years | 5 (5.8%) | 0 (0.0%) |
| 30 to 34 Years | 0 (0.0%) | 0 (0.0%) |
| 35 to 39 Years | 0 (0.0%) | 0 (0.0%) |
| 40 to 44 Years | 14 (16.1%) | 12 (15.4%) |
| 45 to 49 Years | 0 (0.0%) | 0 (0.0%) |
| 50 to 54 Years | 0 (0.0%) | 0 (0.0%) |
| 55 to 59 Years | 13 (14.9%) | 10 (12.8%) |
| 60 to 64 Years | 0 (0.0%) | 6 (7.7%) |
| 65 to 69 Years | 19 (21.8%) | 4 (5.1%) |
| 70 to 74 Years | 0 (0.0%) | 4 (5.1%) |
| 75 to 79 Years | 0 (0.0%) | 0 (0.0%) |
| 80 to 84 Years | 0 (0.0%) | 0 (0.0%) |
| 85 Years and over | 0 (0.0%) | 0 (0.0%) |
| Total | 87 (100.0%) | 78 (100.0%) |
Families and Households in Lake Leelanau
Median Family Size in Lake Leelanau
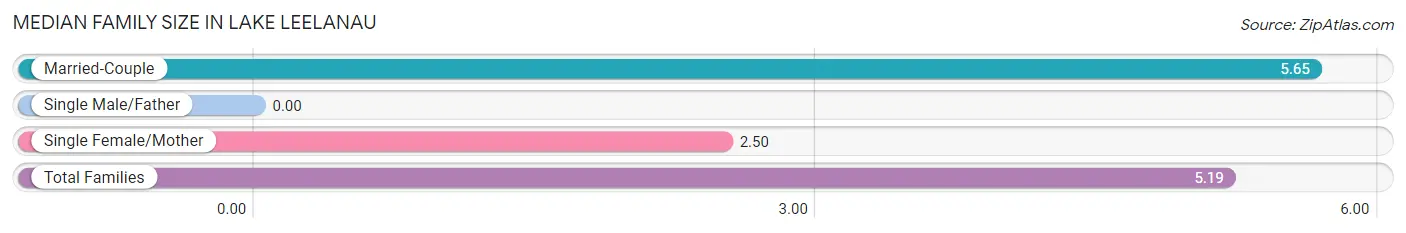
| Family Type | # Families | Family Size |
| Married-Couple | 23 (85.2%) | 5.65 |
| Single Male/Father | 0 (0.0%) | - |
| Single Female/Mother | 4 (14.8%) | 2.50 |
| Total Families | 27 (100.0%) | 5.19 |
Median Household Size in Lake Leelanau
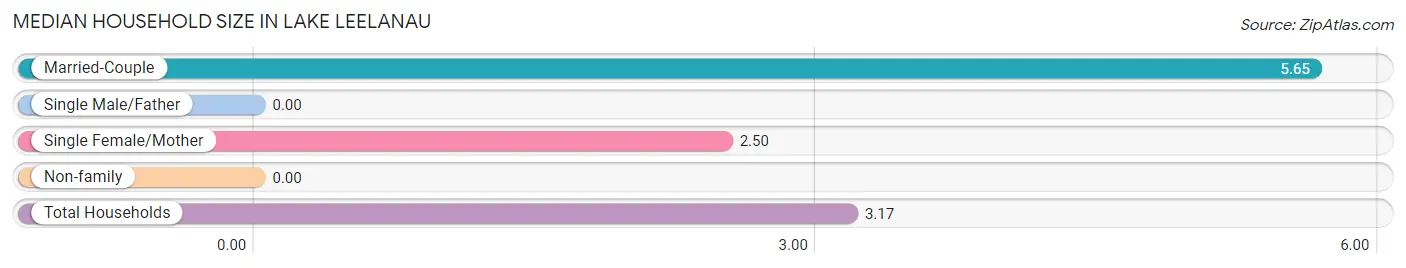
| Household Type | # Households | Household Size |
| Married-Couple | 23 (44.2%) | 5.65 |
| Single Male/Father | 0 (0.0%) | - |
| Single Female/Mother | 4 (7.7%) | 2.50 |
| Non-family | 25 (48.1%) | - |
| Total Households | 52 (100.0%) | 3.17 |
Household Size by Marriage Status in Lake Leelanau
Out of a total of 52 households in Lake Leelanau, 27 (51.9%) are family households, while 25 (48.1%) are nonfamily households. The most numerous type of family households are 7+ person households, comprising 12, and the most common type of nonfamily households are 1-person households, comprising 25.
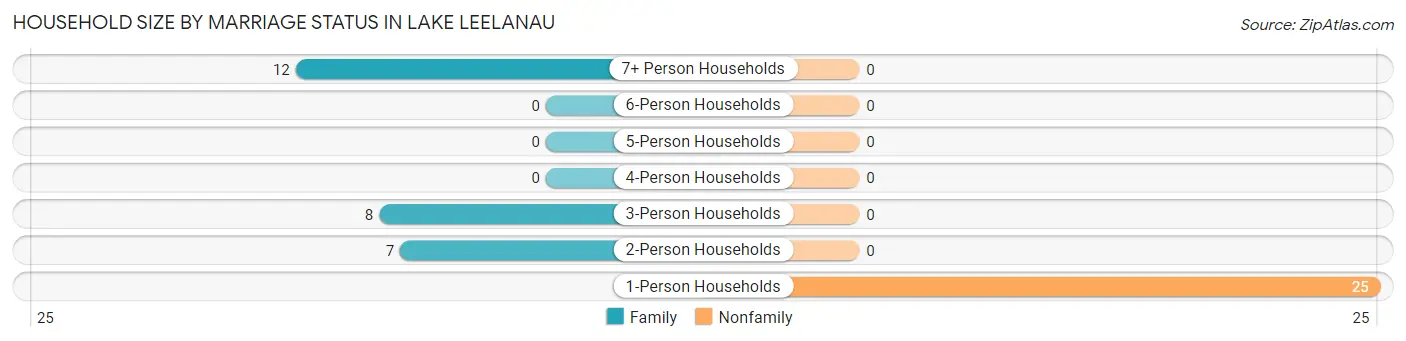
| Household Size | Family Households | Nonfamily Households |
| 1-Person Households | - | 25 (48.1%) |
| 2-Person Households | 7 (13.5%) | 0 (0.0%) |
| 3-Person Households | 8 (15.4%) | 0 (0.0%) |
| 4-Person Households | 0 (0.0%) | 0 (0.0%) |
| 5-Person Households | 0 (0.0%) | 0 (0.0%) |
| 6-Person Households | 0 (0.0%) | 0 (0.0%) |
| 7+ Person Households | 12 (23.1%) | 0 (0.0%) |
| Total | 27 (51.9%) | 25 (48.1%) |
Female Fertility in Lake Leelanau
Fertility by Age in Lake Leelanau
| Age Bracket | Women with Births | Births / 1,000 Women |
| 15 to 19 years | 0 (0.0%) | 0.0 |
| 20 to 34 years | 0 (0.0%) | 0.0 |
| 35 to 50 years | 0 (0.0%) | 0.0 |
| Total | 0 (0.0%) | 0.0 |
Fertility by Age by Marriage Status in Lake Leelanau
| Age Bracket | Married | Unmarried |
| 15 to 19 years | 0 (0.0%) | 0 (0.0%) |
| 20 to 34 years | 0 (0.0%) | 0 (0.0%) |
| 35 to 50 years | 0 (0.0%) | 0 (0.0%) |
| Total | 0 (0.0%) | 0 (0.0%) |
Fertility by Education in Lake Leelanau
| Educational Attainment | Women with Births | Births / 1,000 Women |
| Less than High School | 0 (0.0%) | 0.0 |
| High School Diploma | 0 (0.0%) | 0.0 |
| College or Associate's Degree | 0 (0.0%) | 0.0 |
| Bachelor's Degree | 0 (0.0%) | 0.0 |
| Graduate Degree | 0 (0.0%) | 0.0 |
| Total | 0 (0.0%) | 0.0 |
Fertility by Education by Marriage Status in Lake Leelanau
| Educational Attainment | Married | Unmarried |
| Less than High School | 0 (0.0%) | 0 (0.0%) |
| High School Diploma | 0 (0.0%) | 0 (0.0%) |
| College or Associate's Degree | 0 (0.0%) | 0 (0.0%) |
| Bachelor's Degree | 0 (0.0%) | 0 (0.0%) |
| Graduate Degree | 0 (0.0%) | 0 (0.0%) |
| Total | 0 (0.0%) | 0 (0.0%) |
Employment Characteristics in Lake Leelanau
Employment by Class of Employer in Lake Leelanau
Among the 60 employed individuals in Lake Leelanau, private company employees (40 | 66.7%), not-for-profit organizations (12 | 20.0%), and self-employed (not incorporated) (8 | 13.3%) make up the most common classes of employment.
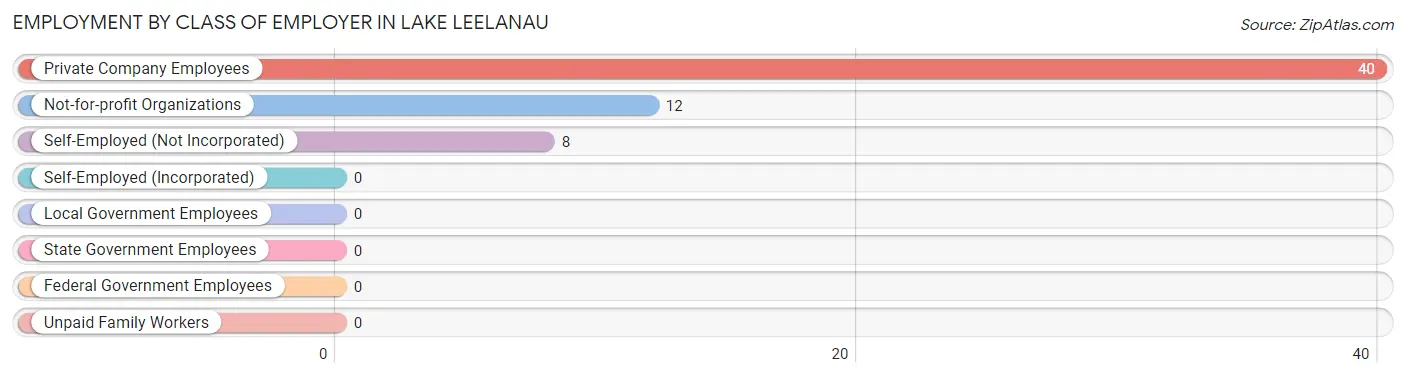
| Employer Class | # Employees | % Employees |
| Private Company Employees | 40 | 66.7% |
| Self-Employed (Incorporated) | 0 | 0.0% |
| Self-Employed (Not Incorporated) | 8 | 13.3% |
| Not-for-profit Organizations | 12 | 20.0% |
| Local Government Employees | 0 | 0.0% |
| State Government Employees | 0 | 0.0% |
| Federal Government Employees | 0 | 0.0% |
| Unpaid Family Workers | 0 | 0.0% |
| Total | 60 | 100.0% |
Employment Status by Age in Lake Leelanau
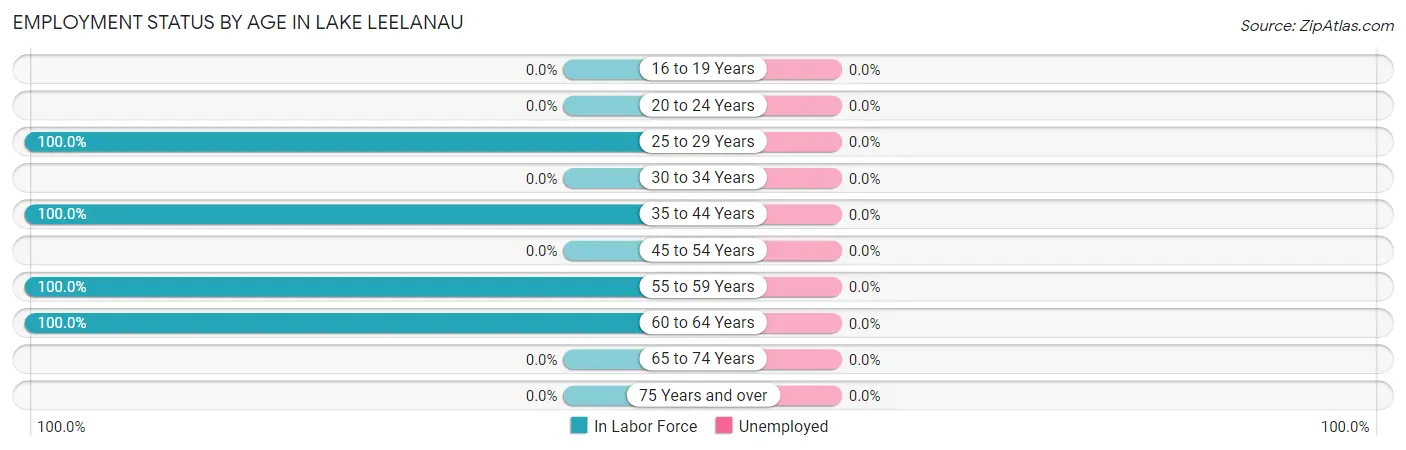
| Age Bracket | In Labor Force | Unemployed |
| 16 to 19 Years | 0 (0.0%) | 0 (0.0%) |
| 20 to 24 Years | 0 (0.0%) | 0 (0.0%) |
| 25 to 29 Years | 5 (100.0%) | 0 (0.0%) |
| 30 to 34 Years | 0 (0.0%) | 0 (0.0%) |
| 35 to 44 Years | 26 (100.0%) | 0 (0.0%) |
| 45 to 54 Years | 0 (0.0%) | 0 (0.0%) |
| 55 to 59 Years | 23 (100.0%) | 0 (0.0%) |
| 60 to 64 Years | 6 (100.0%) | 0 (0.0%) |
| 65 to 74 Years | 0 (0.0%) | 0 (0.0%) |
| 75 Years and over | 0 (0.0%) | 0 (0.0%) |
| Total | 60 (61.9%) | 0 (0.0%) |
Employment Status by Educational Attainment in Lake Leelanau
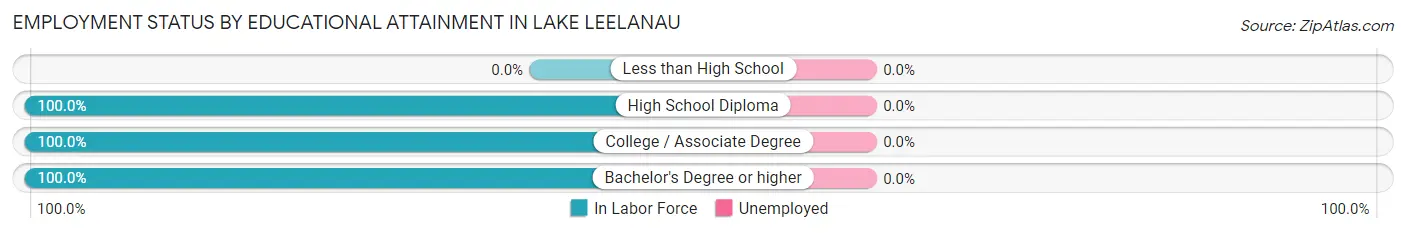
| Educational Attainment | In Labor Force | Unemployed |
| Less than High School | 0 (0.0%) | 0 (0.0%) |
| High School Diploma | 22 (100.0%) | 0 (0.0%) |
| College / Associate Degree | 19 (100.0%) | 0 (0.0%) |
| Bachelor's Degree or higher | 19 (100.0%) | 0 (0.0%) |
| Total | 60 (100.0%) | 0 (0.0%) |
Employment Occupations by Sex in Lake Leelanau
Management, Business, Science and Arts Occupations
The most common Management, Business, Science and Arts occupations in Lake Leelanau are Management (14 | 23.3%), Health Diagnosing & Treating (12 | 20.0%), and Health Technologists (12 | 20.0%).
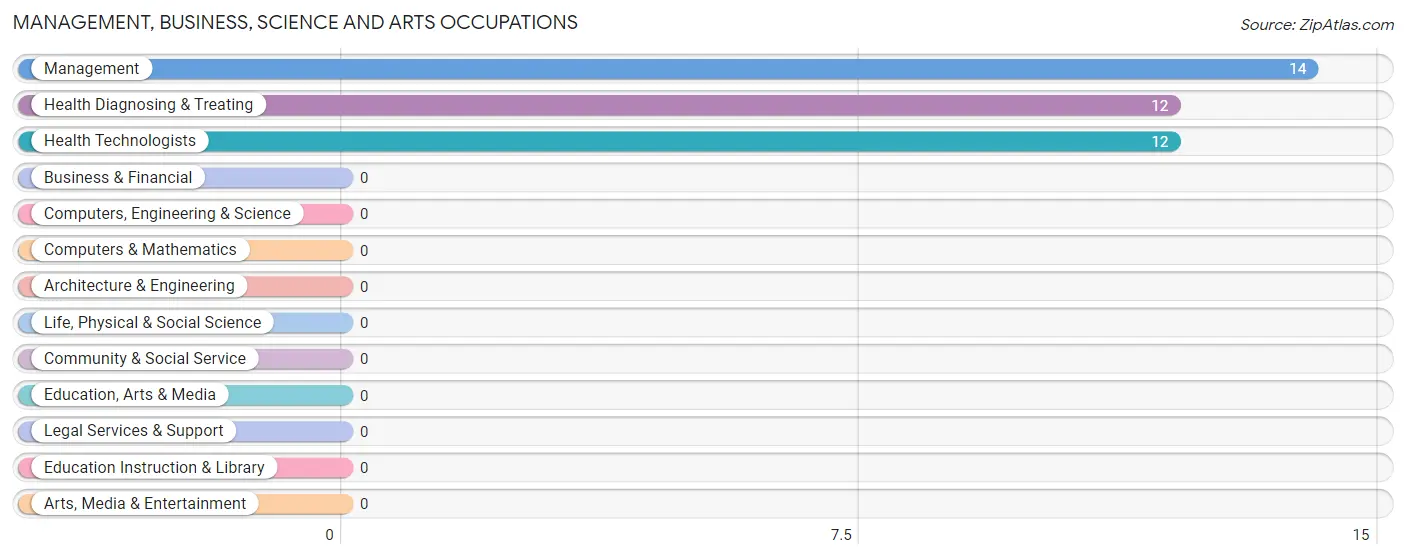
Management, Business, Science and Arts Occupations by Sex
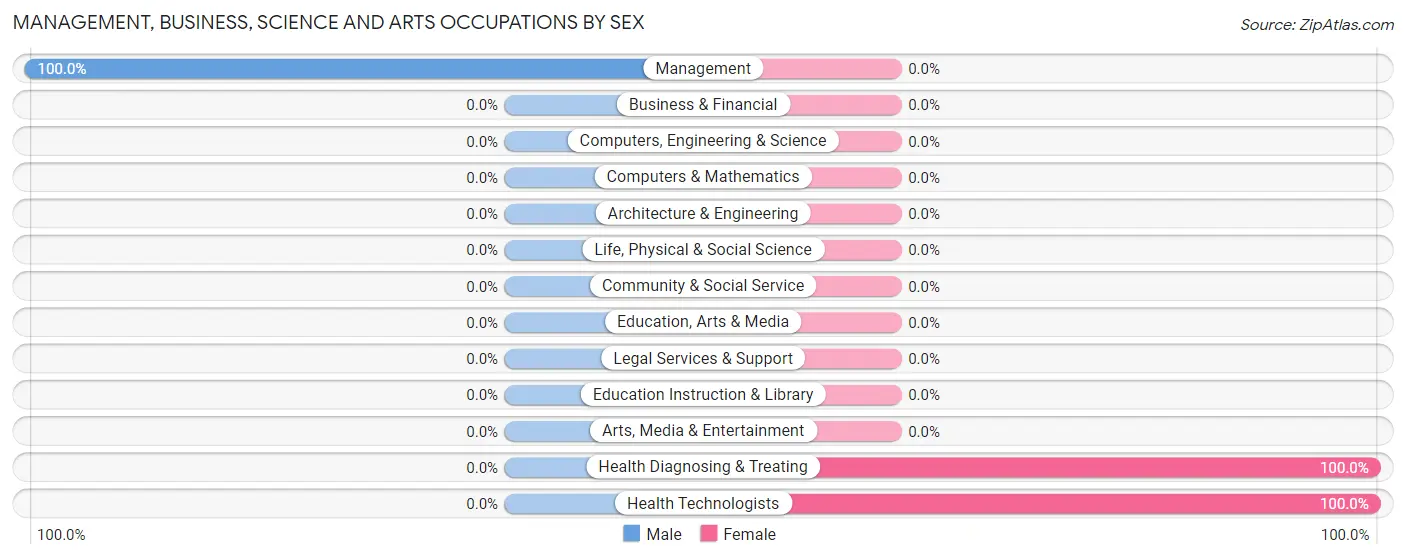
| Occupation | Male | Female |
| Management | 14 (100.0%) | 0 (0.0%) |
| Business & Financial | 0 (0.0%) | 0 (0.0%) |
| Computers, Engineering & Science | 0 (0.0%) | 0 (0.0%) |
| Computers & Mathematics | 0 (0.0%) | 0 (0.0%) |
| Architecture & Engineering | 0 (0.0%) | 0 (0.0%) |
| Life, Physical & Social Science | 0 (0.0%) | 0 (0.0%) |
| Community & Social Service | 0 (0.0%) | 0 (0.0%) |
| Education, Arts & Media | 0 (0.0%) | 0 (0.0%) |
| Legal Services & Support | 0 (0.0%) | 0 (0.0%) |
| Education Instruction & Library | 0 (0.0%) | 0 (0.0%) |
| Arts, Media & Entertainment | 0 (0.0%) | 0 (0.0%) |
| Health Diagnosing & Treating | 0 (0.0%) | 12 (100.0%) |
| Health Technologists | 0 (0.0%) | 12 (100.0%) |
| Total (Category) | 14 (53.8%) | 12 (46.2%) |
| Total (Overall) | 32 (53.3%) | 28 (46.7%) |
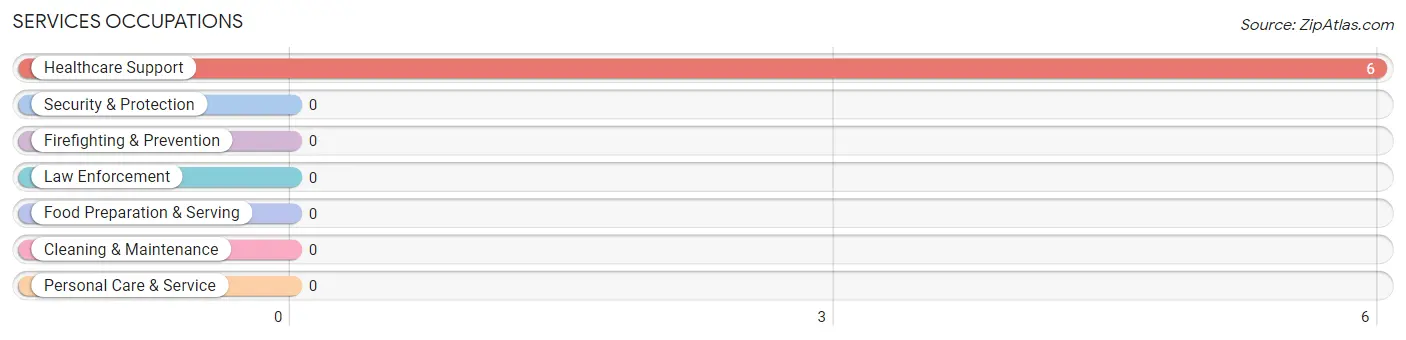
Services Occupations
The most common Services occupations in Lake Leelanau are , and Healthcare Support (6 | 10.0%).
Services Occupations by Sex
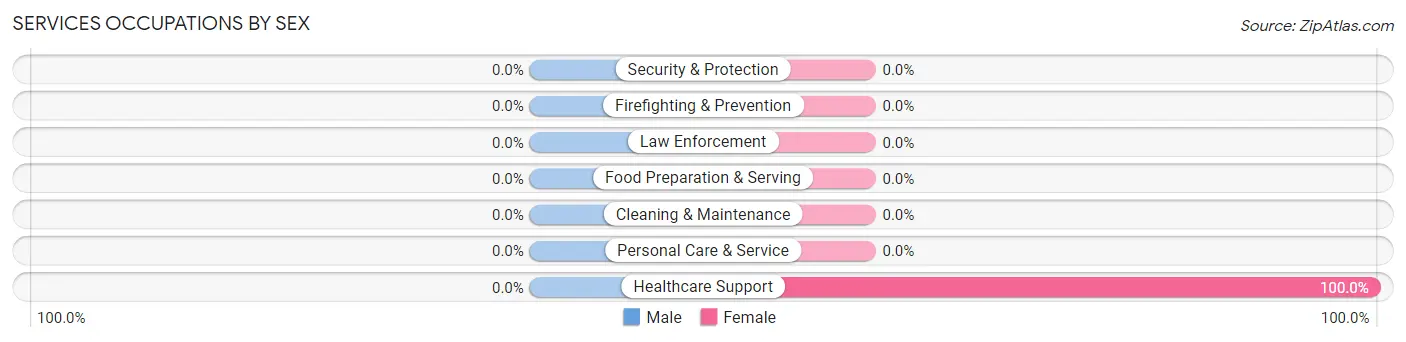
| Occupation | Male | Female |
| Healthcare Support | 0 (0.0%) | 6 (100.0%) |
| Security & Protection | 0 (0.0%) | 0 (0.0%) |
| Firefighting & Prevention | 0 (0.0%) | 0 (0.0%) |
| Law Enforcement | 0 (0.0%) | 0 (0.0%) |
| Food Preparation & Serving | 0 (0.0%) | 0 (0.0%) |
| Cleaning & Maintenance | 0 (0.0%) | 0 (0.0%) |
| Personal Care & Service | 0 (0.0%) | 0 (0.0%) |
| Total (Category) | 0 (0.0%) | 6 (100.0%) |
| Total (Overall) | 32 (53.3%) | 28 (46.7%) |
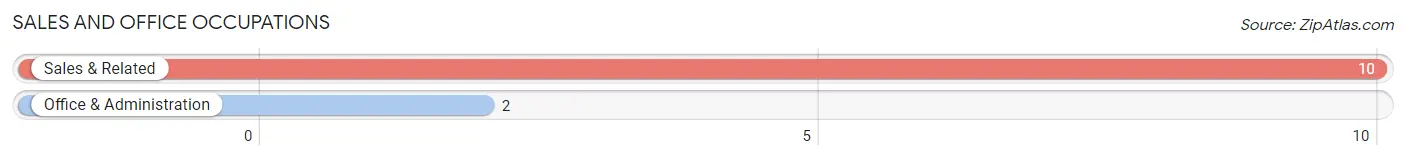
Sales and Office Occupations
The most common Sales and Office occupations in Lake Leelanau are Sales & Related (10 | 16.7%), and Office & Administration (2 | 3.3%).
Sales and Office Occupations by Sex
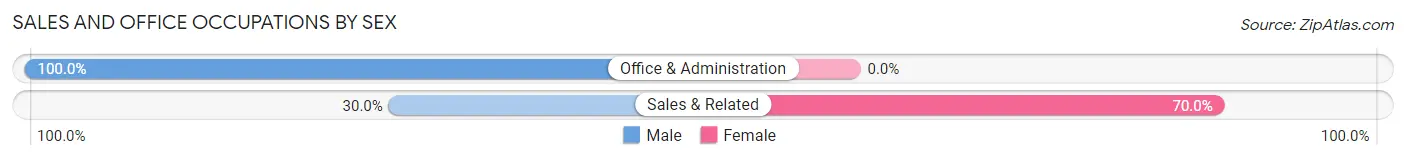
| Occupation | Male | Female |
| Sales & Related | 3 (30.0%) | 7 (70.0%) |
| Office & Administration | 2 (100.0%) | 0 (0.0%) |
| Total (Category) | 5 (41.7%) | 7 (58.3%) |
| Total (Overall) | 32 (53.3%) | 28 (46.7%) |
Natural Resources, Construction and Maintenance Occupations
The most common Natural Resources, Construction and Maintenance occupations in Lake Leelanau are , and Construction & Extraction (13 | 21.7%).
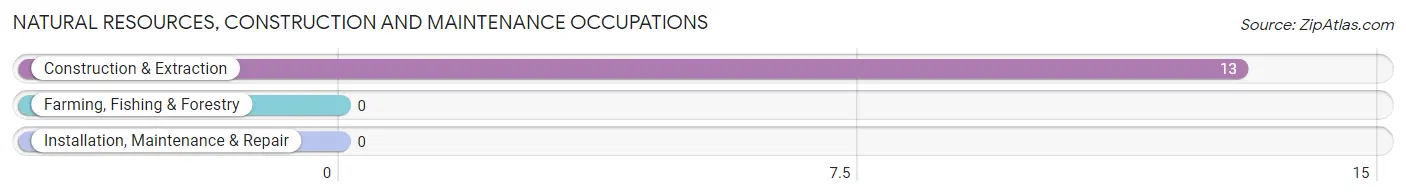
Natural Resources, Construction and Maintenance Occupations by Sex
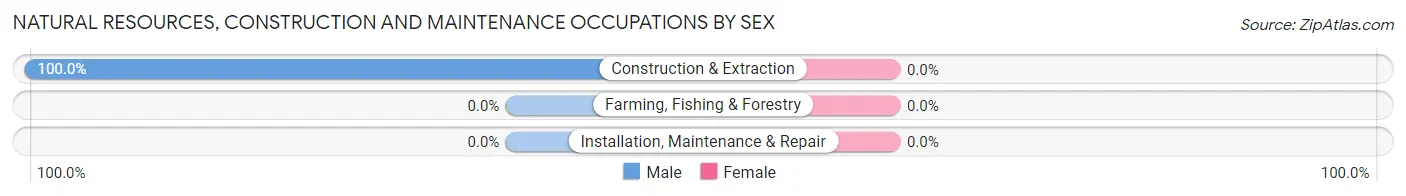
| Occupation | Male | Female |
| Farming, Fishing & Forestry | 0 (0.0%) | 0 (0.0%) |
| Construction & Extraction | 13 (100.0%) | 0 (0.0%) |
| Installation, Maintenance & Repair | 0 (0.0%) | 0 (0.0%) |
| Total (Category) | 13 (100.0%) | 0 (0.0%) |
| Total (Overall) | 32 (53.3%) | 28 (46.7%) |
Production, Transportation and Moving Occupations
The most common Production, Transportation and Moving occupations in Lake Leelanau are , and Production (3 | 5.0%).
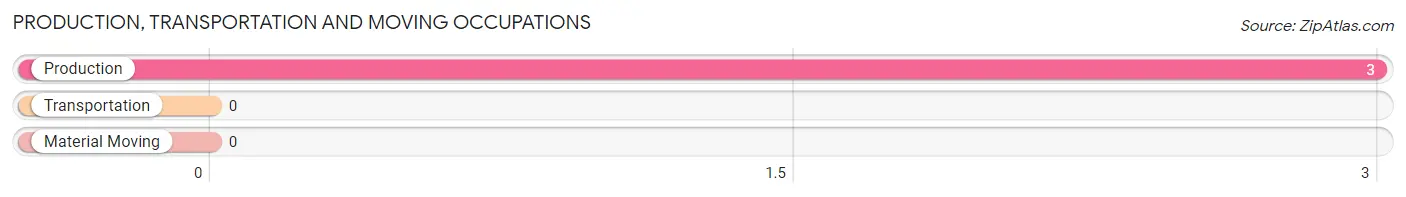
Production, Transportation and Moving Occupations by Sex
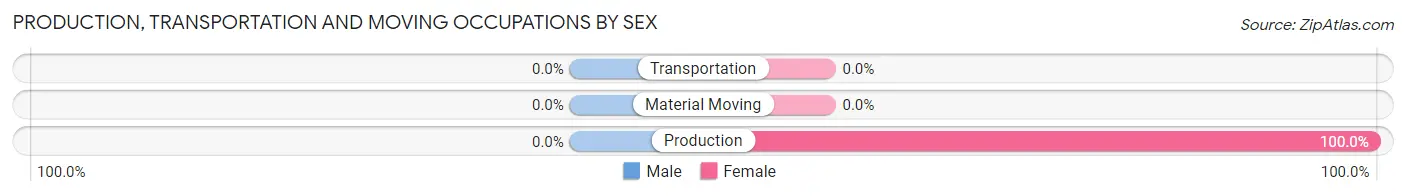
| Occupation | Male | Female |
| Production | 0 (0.0%) | 3 (100.0%) |
| Transportation | 0 (0.0%) | 0 (0.0%) |
| Material Moving | 0 (0.0%) | 0 (0.0%) |
| Total (Category) | 0 (0.0%) | 3 (100.0%) |
| Total (Overall) | 32 (53.3%) | 28 (46.7%) |
Employment Industries by Sex in Lake Leelanau
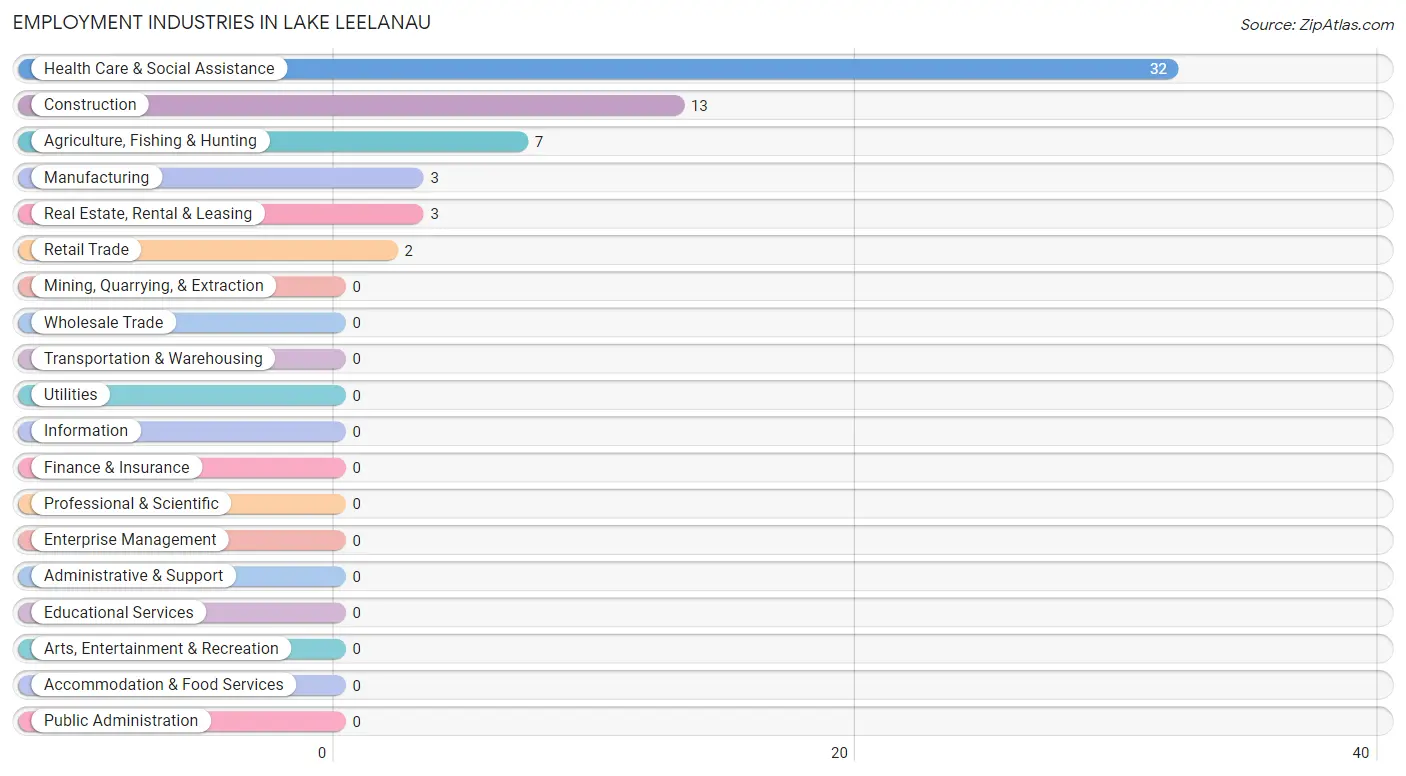
Employment Industries in Lake Leelanau
The major employment industries in Lake Leelanau include Health Care & Social Assistance (32 | 53.3%), Construction (13 | 21.7%), Agriculture, Fishing & Hunting (7 | 11.7%), Manufacturing (3 | 5.0%), and Real Estate, Rental & Leasing (3 | 5.0%).
Employment Industries by Sex in Lake Leelanau
The Lake Leelanau industries that see more men than women are Construction (100.0%), Retail Trade (100.0%), and Real Estate, Rental & Leasing (100.0%), whereas the industries that tend to have a higher number of women are Agriculture, Fishing & Hunting (100.0%), Manufacturing (100.0%), and Health Care & Social Assistance (56.2%).
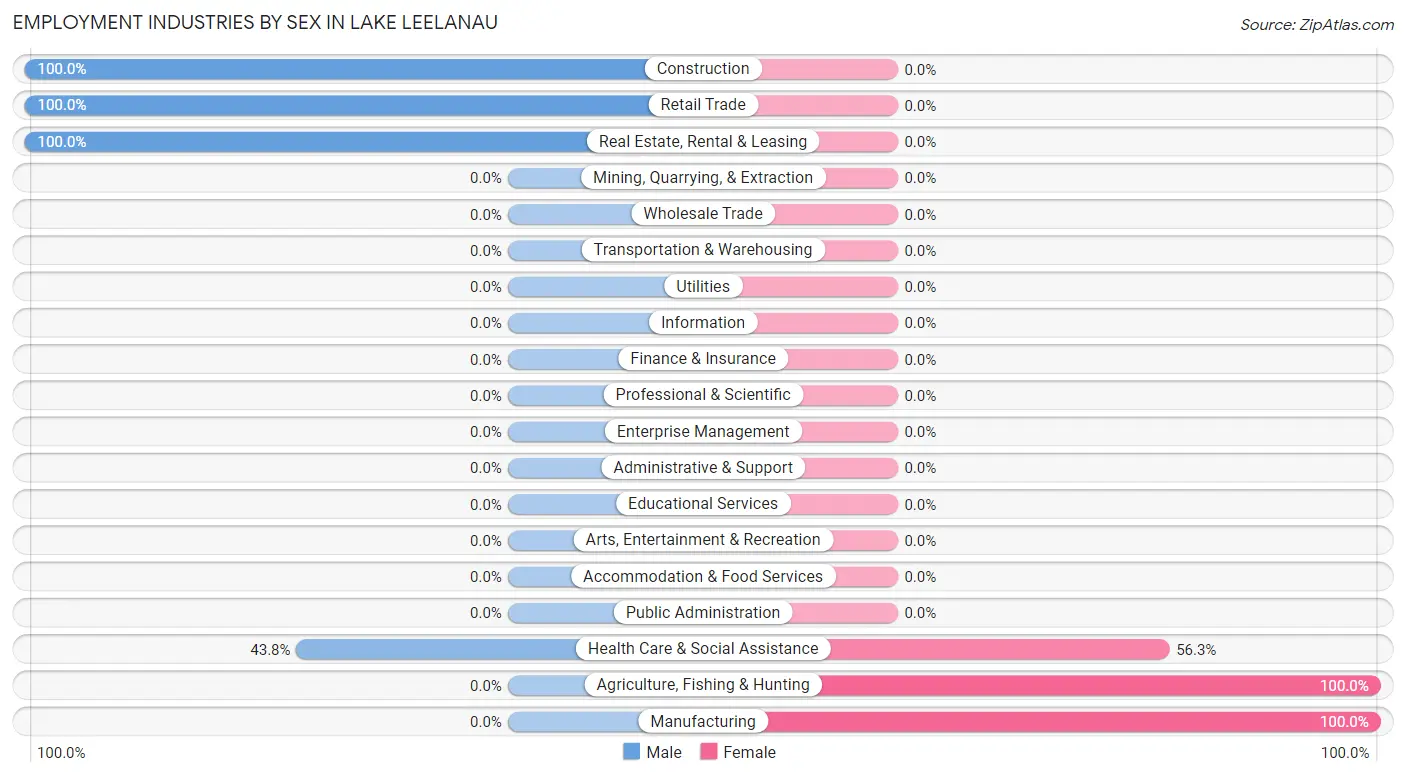
| Industry | Male | Female |
| Agriculture, Fishing & Hunting | 0 (0.0%) | 7 (100.0%) |
| Mining, Quarrying, & Extraction | 0 (0.0%) | 0 (0.0%) |
| Construction | 13 (100.0%) | 0 (0.0%) |
| Manufacturing | 0 (0.0%) | 3 (100.0%) |
| Wholesale Trade | 0 (0.0%) | 0 (0.0%) |
| Retail Trade | 2 (100.0%) | 0 (0.0%) |
| Transportation & Warehousing | 0 (0.0%) | 0 (0.0%) |
| Utilities | 0 (0.0%) | 0 (0.0%) |
| Information | 0 (0.0%) | 0 (0.0%) |
| Finance & Insurance | 0 (0.0%) | 0 (0.0%) |
| Real Estate, Rental & Leasing | 3 (100.0%) | 0 (0.0%) |
| Professional & Scientific | 0 (0.0%) | 0 (0.0%) |
| Enterprise Management | 0 (0.0%) | 0 (0.0%) |
| Administrative & Support | 0 (0.0%) | 0 (0.0%) |
| Educational Services | 0 (0.0%) | 0 (0.0%) |
| Health Care & Social Assistance | 14 (43.8%) | 18 (56.2%) |
| Arts, Entertainment & Recreation | 0 (0.0%) | 0 (0.0%) |
| Accommodation & Food Services | 0 (0.0%) | 0 (0.0%) |
| Public Administration | 0 (0.0%) | 0 (0.0%) |
| Total | 32 (53.3%) | 28 (46.7%) |
Education in Lake Leelanau
School Enrollment in Lake Leelanau
The most common levels of schooling among the 71 students in Lake Leelanau are elementary school (23 | 32.4%), high school (19 | 26.8%), and kindergarten (12 | 16.9%).
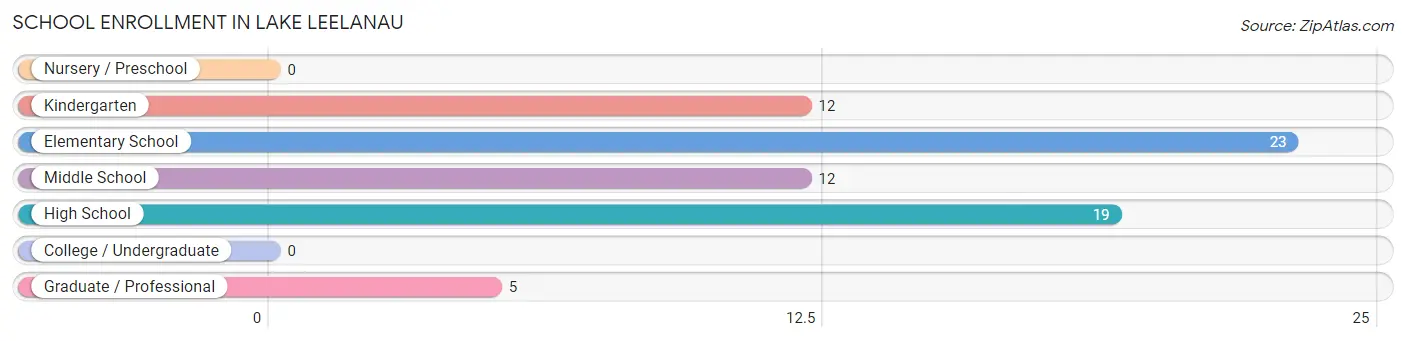
| School Level | # Students | % Students |
| Nursery / Preschool | 0 | 0.0% |
| Kindergarten | 12 | 16.9% |
| Elementary School | 23 | 32.4% |
| Middle School | 12 | 16.9% |
| High School | 19 | 26.8% |
| College / Undergraduate | 0 | 0.0% |
| Graduate / Professional | 5 | 7.0% |
| Total | 71 | 100.0% |
School Enrollment by Age by Funding Source in Lake Leelanau
Out of a total of 71 students who are enrolled in schools in Lake Leelanau, 5 (7.0%) attend a private institution, while the remaining 66 (93.0%) are enrolled in public schools. The age group of 25 to 34 year olds has the highest likelihood of being enrolled in private schools, with 5 (100.0% in the age bracket) enrolled. Conversely, the age group of 5 to 9 year old has the lowest likelihood of being enrolled in a private school, with 24 (100.0% in the age bracket) attending a public institution.
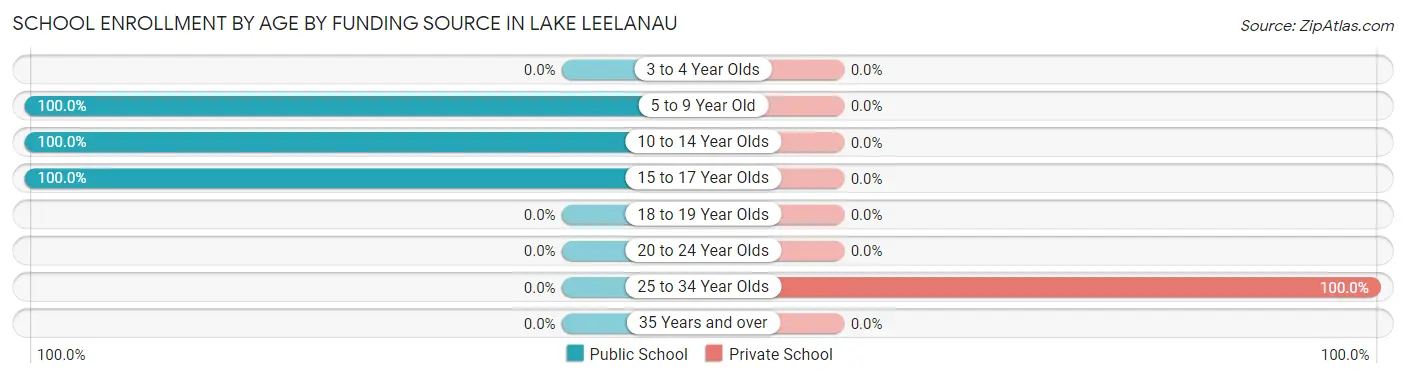
| Age Bracket | Public School | Private School |
| 3 to 4 Year Olds | 0 (0.0%) | 0 (0.0%) |
| 5 to 9 Year Old | 24 (100.0%) | 0 (0.0%) |
| 10 to 14 Year Olds | 23 (100.0%) | 0 (0.0%) |
| 15 to 17 Year Olds | 19 (100.0%) | 0 (0.0%) |
| 18 to 19 Year Olds | 0 (0.0%) | 0 (0.0%) |
| 20 to 24 Year Olds | 0 (0.0%) | 0 (0.0%) |
| 25 to 34 Year Olds | 0 (0.0%) | 5 (100.0%) |
| 35 Years and over | 0 (0.0%) | 0 (0.0%) |
| Total | 66 (93.0%) | 5 (7.0%) |
Educational Attainment by Field of Study in Lake Leelanau
Engineering (14 | 60.9%), bio, nature & agricultural (5 | 21.7%), and arts & humanities (4 | 17.4%) are the most common fields of study among 23 individuals in Lake Leelanau who have obtained a bachelor's degree or higher.
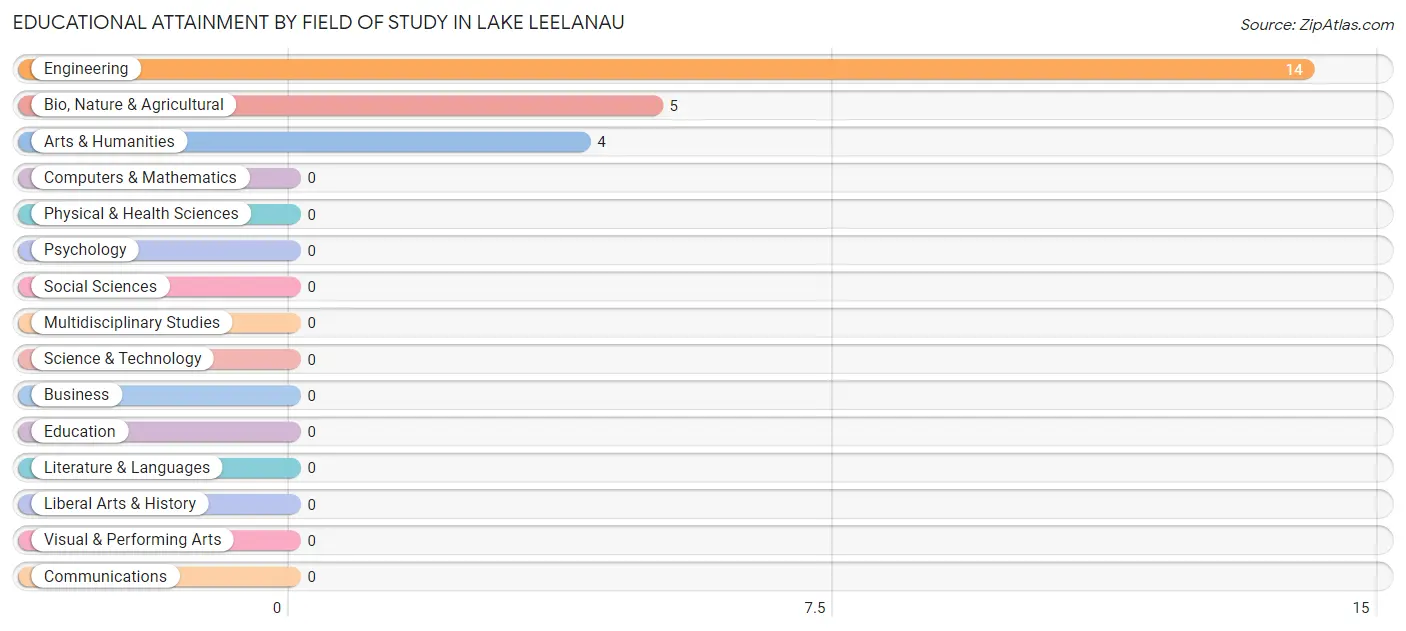
| Field of Study | # Graduates | % Graduates |
| Computers & Mathematics | 0 | 0.0% |
| Bio, Nature & Agricultural | 5 | 21.7% |
| Physical & Health Sciences | 0 | 0.0% |
| Psychology | 0 | 0.0% |
| Social Sciences | 0 | 0.0% |
| Engineering | 14 | 60.9% |
| Multidisciplinary Studies | 0 | 0.0% |
| Science & Technology | 0 | 0.0% |
| Business | 0 | 0.0% |
| Education | 0 | 0.0% |
| Literature & Languages | 0 | 0.0% |
| Liberal Arts & History | 0 | 0.0% |
| Visual & Performing Arts | 0 | 0.0% |
| Communications | 0 | 0.0% |
| Arts & Humanities | 4 | 17.4% |
| Total | 23 | 100.0% |
Transportation & Commute in Lake Leelanau
Vehicle Availability by Sex in Lake Leelanau
The most prevalent vehicle ownership categories in Lake Leelanau are males with 3 vehicles (30, accounting for 93.8%) and females with 3 vehicles (22, making up 107.1%).
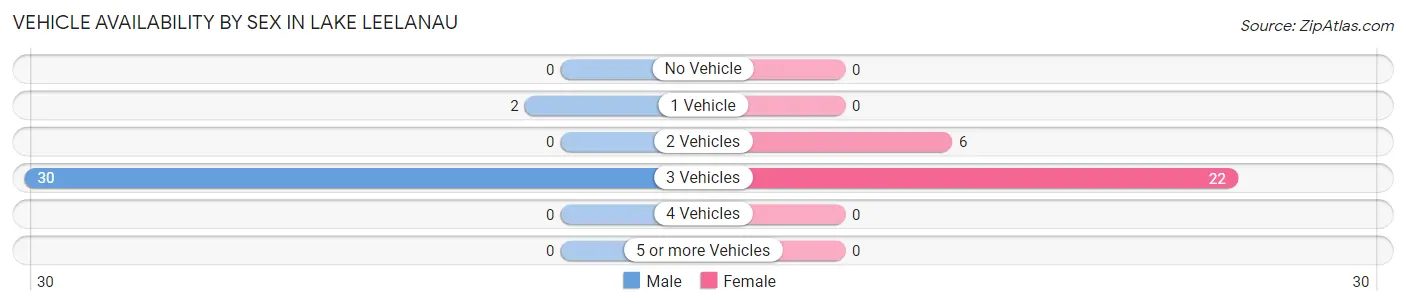
| Vehicles Available | Male | Female |
| No Vehicle | 0 (0.0%) | 0 (0.0%) |
| 1 Vehicle | 2 (6.2%) | 0 (0.0%) |
| 2 Vehicles | 0 (0.0%) | 6 (21.4%) |
| 3 Vehicles | 30 (93.8%) | 22 (78.6%) |
| 4 Vehicles | 0 (0.0%) | 0 (0.0%) |
| 5 or more Vehicles | 0 (0.0%) | 0 (0.0%) |
| Total | 32 (100.0%) | 28 (100.0%) |
Commute Time in Lake Leelanau
The most frequently occuring commute durations in Lake Leelanau are less than 5 minutes (15 commuters, 32.6%), 10 to 14 minutes (12 commuters, 26.1%), and 25 to 29 minutes (7 commuters, 15.2%).
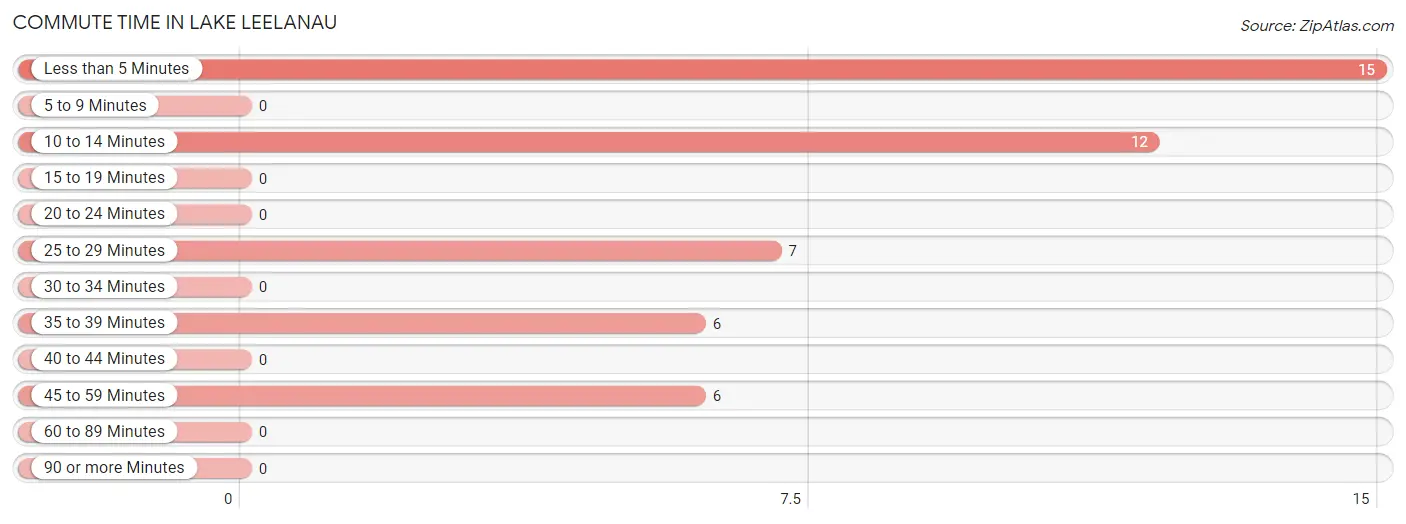
| Commute Time | # Commuters | % Commuters |
| Less than 5 Minutes | 15 | 32.6% |
| 5 to 9 Minutes | 0 | 0.0% |
| 10 to 14 Minutes | 12 | 26.1% |
| 15 to 19 Minutes | 0 | 0.0% |
| 20 to 24 Minutes | 0 | 0.0% |
| 25 to 29 Minutes | 7 | 15.2% |
| 30 to 34 Minutes | 0 | 0.0% |
| 35 to 39 Minutes | 6 | 13.0% |
| 40 to 44 Minutes | 0 | 0.0% |
| 45 to 59 Minutes | 6 | 13.0% |
| 60 to 89 Minutes | 0 | 0.0% |
| 90 or more Minutes | 0 | 0.0% |
Commute Time by Sex in Lake Leelanau
The most common commute times in Lake Leelanau are less than 5 minutes (8 commuters, 44.4%) for males and 10 to 14 minutes (12 commuters, 42.9%) for females.
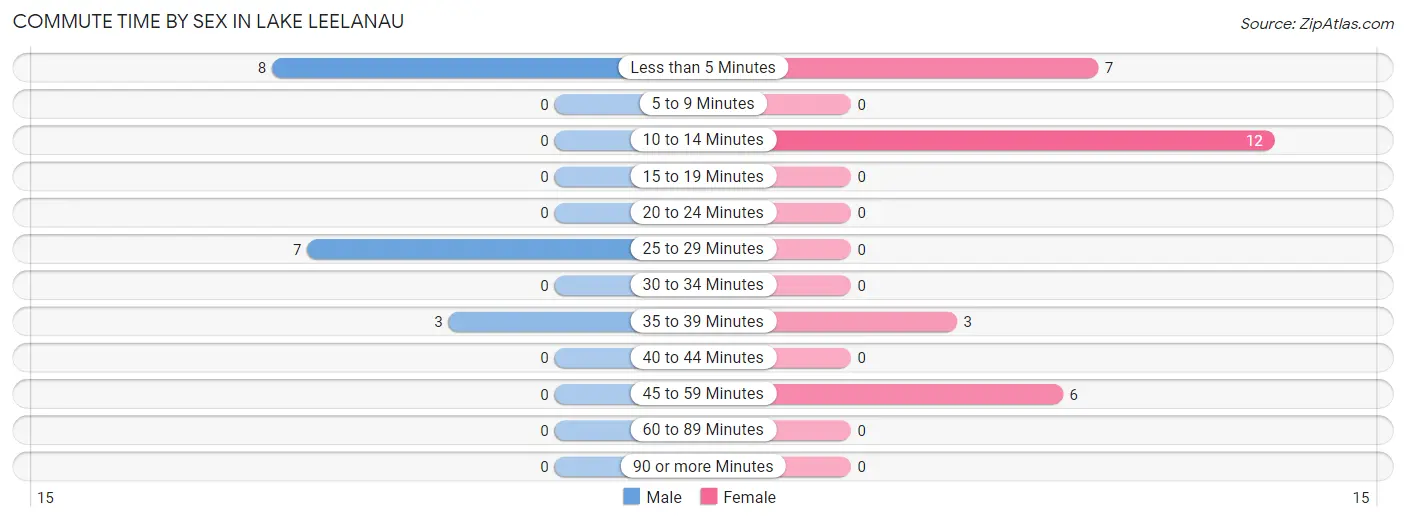
| Commute Time | Male | Female |
| Less than 5 Minutes | 8 (44.4%) | 7 (25.0%) |
| 5 to 9 Minutes | 0 (0.0%) | 0 (0.0%) |
| 10 to 14 Minutes | 0 (0.0%) | 12 (42.9%) |
| 15 to 19 Minutes | 0 (0.0%) | 0 (0.0%) |
| 20 to 24 Minutes | 0 (0.0%) | 0 (0.0%) |
| 25 to 29 Minutes | 7 (38.9%) | 0 (0.0%) |
| 30 to 34 Minutes | 0 (0.0%) | 0 (0.0%) |
| 35 to 39 Minutes | 3 (16.7%) | 3 (10.7%) |
| 40 to 44 Minutes | 0 (0.0%) | 0 (0.0%) |
| 45 to 59 Minutes | 0 (0.0%) | 6 (21.4%) |
| 60 to 89 Minutes | 0 (0.0%) | 0 (0.0%) |
| 90 or more Minutes | 0 (0.0%) | 0 (0.0%) |
Time of Departure to Work by Sex in Lake Leelanau
The most frequent times of departure to work in Lake Leelanau are 6:30 AM to 6:59 AM (8, 44.4%) for males and 10:00 AM to 10:59 AM (12, 42.9%) for females.
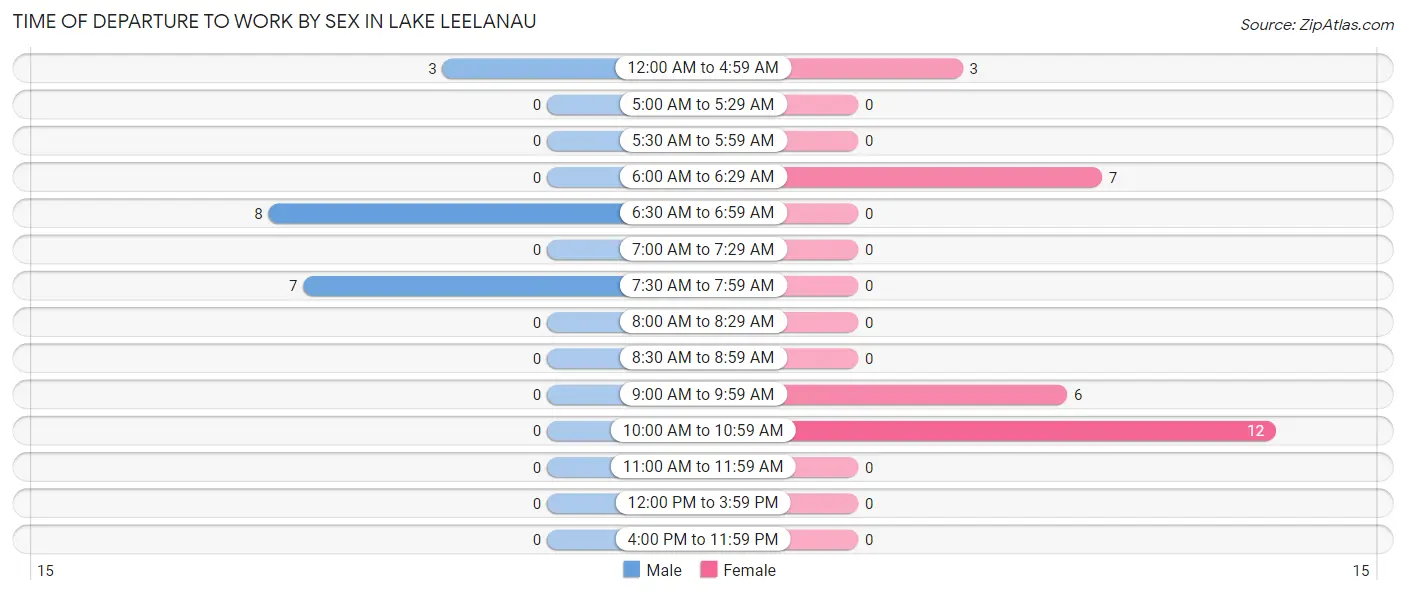
| Time of Departure | Male | Female |
| 12:00 AM to 4:59 AM | 3 (16.7%) | 3 (10.7%) |
| 5:00 AM to 5:29 AM | 0 (0.0%) | 0 (0.0%) |
| 5:30 AM to 5:59 AM | 0 (0.0%) | 0 (0.0%) |
| 6:00 AM to 6:29 AM | 0 (0.0%) | 7 (25.0%) |
| 6:30 AM to 6:59 AM | 8 (44.4%) | 0 (0.0%) |
| 7:00 AM to 7:29 AM | 0 (0.0%) | 0 (0.0%) |
| 7:30 AM to 7:59 AM | 7 (38.9%) | 0 (0.0%) |
| 8:00 AM to 8:29 AM | 0 (0.0%) | 0 (0.0%) |
| 8:30 AM to 8:59 AM | 0 (0.0%) | 0 (0.0%) |
| 9:00 AM to 9:59 AM | 0 (0.0%) | 6 (21.4%) |
| 10:00 AM to 10:59 AM | 0 (0.0%) | 12 (42.9%) |
| 11:00 AM to 11:59 AM | 0 (0.0%) | 0 (0.0%) |
| 12:00 PM to 3:59 PM | 0 (0.0%) | 0 (0.0%) |
| 4:00 PM to 11:59 PM | 0 (0.0%) | 0 (0.0%) |
| Total | 18 (100.0%) | 28 (100.0%) |
Housing Occupancy in Lake Leelanau
Occupancy by Ownership in Lake Leelanau
Of the total 52 dwellings in Lake Leelanau, owner-occupied units account for 48 (92.3%), while renter-occupied units make up 4 (7.7%).
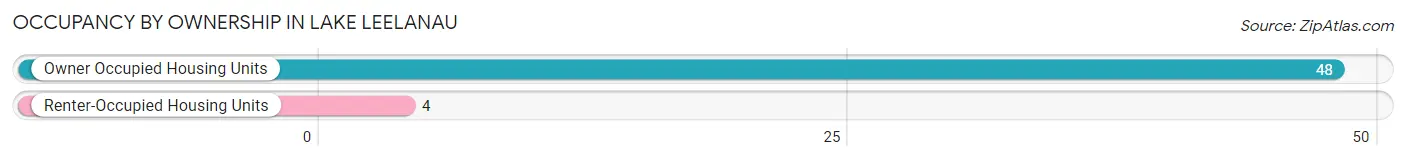
| Occupancy | # Housing Units | % Housing Units |
| Owner Occupied Housing Units | 48 | 92.3% |
| Renter-Occupied Housing Units | 4 | 7.7% |
| Total Occupied Housing Units | 52 | 100.0% |
Occupancy by Household Size in Lake Leelanau
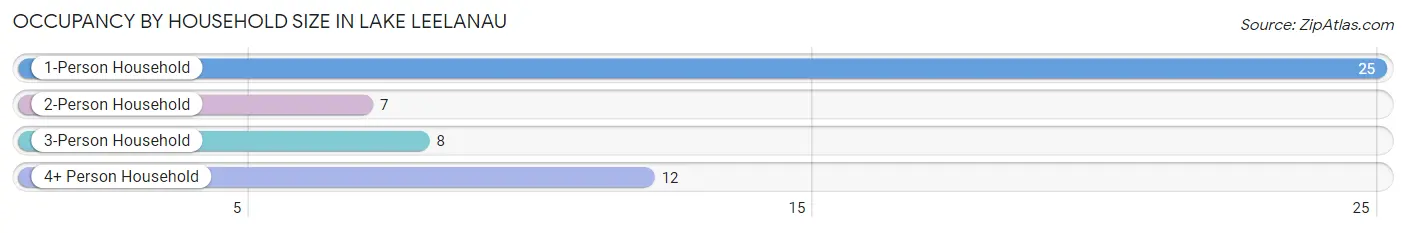
| Household Size | # Housing Units | % Housing Units |
| 1-Person Household | 25 | 48.1% |
| 2-Person Household | 7 | 13.5% |
| 3-Person Household | 8 | 15.4% |
| 4+ Person Household | 12 | 23.1% |
| Total Housing Units | 52 | 100.0% |
Occupancy by Ownership by Household Size in Lake Leelanau
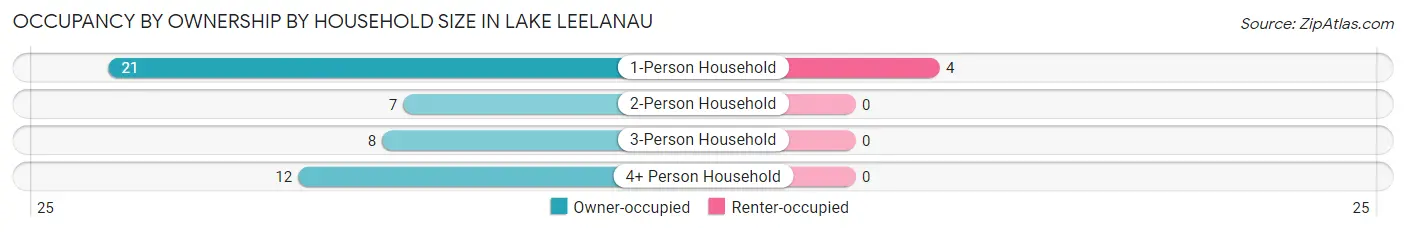
| Household Size | Owner-occupied | Renter-occupied |
| 1-Person Household | 21 (84.0%) | 4 (16.0%) |
| 2-Person Household | 7 (100.0%) | 0 (0.0%) |
| 3-Person Household | 8 (100.0%) | 0 (0.0%) |
| 4+ Person Household | 12 (100.0%) | 0 (0.0%) |
| Total Housing Units | 48 (92.3%) | 4 (7.7%) |
Occupancy by Educational Attainment in Lake Leelanau
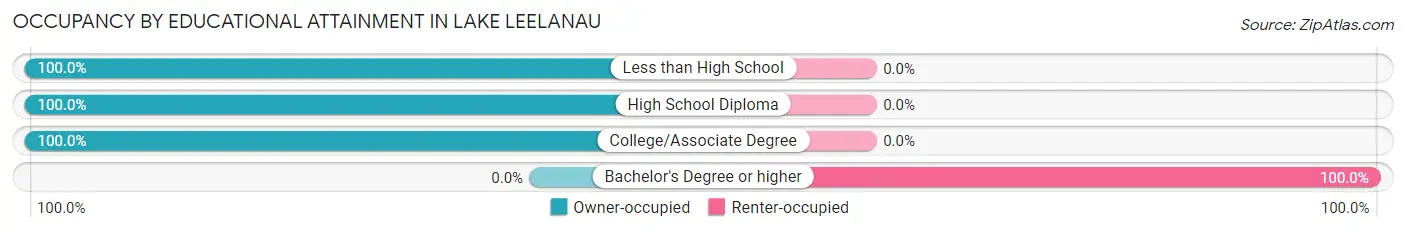
| Household Size | Owner-occupied | Renter-occupied |
| Less than High School | 4 (100.0%) | 0 (0.0%) |
| High School Diploma | 13 (100.0%) | 0 (0.0%) |
| College/Associate Degree | 31 (100.0%) | 0 (0.0%) |
| Bachelor's Degree or higher | 0 (0.0%) | 4 (100.0%) |
Occupancy by Age of Householder in Lake Leelanau
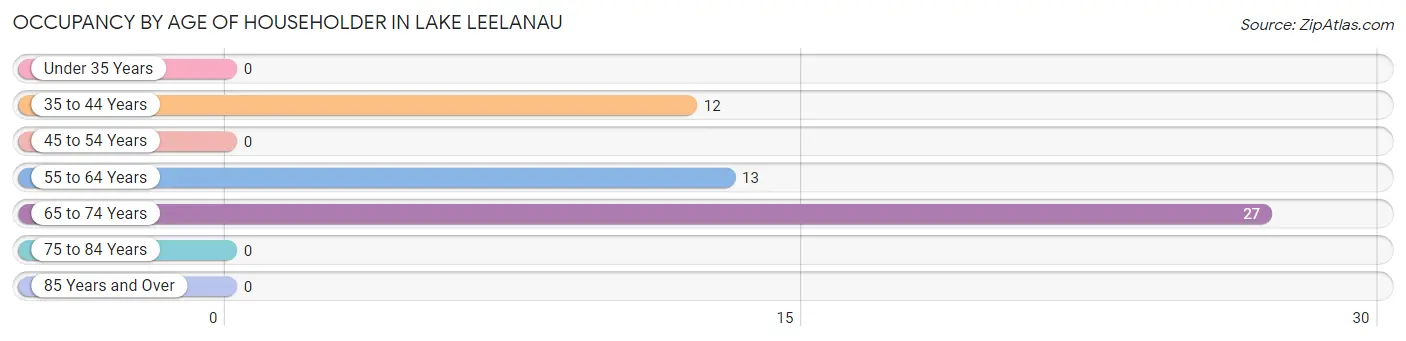
| Age Bracket | # Households | % Households |
| Under 35 Years | 0 | 0.0% |
| 35 to 44 Years | 12 | 23.1% |
| 45 to 54 Years | 0 | 0.0% |
| 55 to 64 Years | 13 | 25.0% |
| 65 to 74 Years | 27 | 51.9% |
| 75 to 84 Years | 0 | 0.0% |
| 85 Years and Over | 0 | 0.0% |
| Total | 52 | 100.0% |
Housing Finances in Lake Leelanau
Median Income by Occupancy in Lake Leelanau
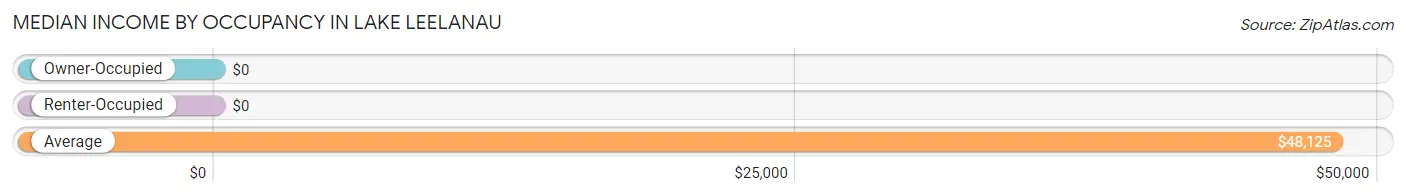
| Occupancy Type | # Households | Median Income |
| Owner-Occupied | 48 (92.3%) | $0 |
| Renter-Occupied | 4 (7.7%) | $0 |
| Average | 52 (100.0%) | $48,125 |
Occupancy by Householder Income Bracket in Lake Leelanau
| Income Bracket | Owner-occupied | Renter-occupied |
| Less than $5,000 | 0 (0.0%) | 4 (100.0%) |
| $5,000 to $9,999 | 0 (0.0%) | 0 (0.0%) |
| $10,000 to $14,999 | 0 (0.0%) | 0 (0.0%) |
| $15,000 to $19,999 | 0 (0.0%) | 0 (0.0%) |
| $20,000 to $24,999 | 0 (0.0%) | 0 (0.0%) |
| $25,000 to $34,999 | 21 (43.8%) | 0 (0.0%) |
| $35,000 to $49,999 | 4 (8.3%) | 0 (0.0%) |
| $50,000 to $74,999 | 8 (16.7%) | 0 (0.0%) |
| $75,000 to $99,999 | 0 (0.0%) | 0 (0.0%) |
| $100,000 to $149,999 | 0 (0.0%) | 0 (0.0%) |
| $150,000 or more | 15 (31.2%) | 0 (0.0%) |
| Total | 48 (100.0%) | 4 (100.0%) |
Monthly Housing Cost Tiers in Lake Leelanau
| Monthly Cost | Owner-occupied | Renter-occupied |
| Less than $300 | 0 (0.0%) | 0 (0.0%) |
| $300 to $499 | 3 (6.2%) | 0 (0.0%) |
| $500 to $799 | 0 (0.0%) | 0 (0.0%) |
| $800 to $999 | 27 (56.2%) | 0 (0.0%) |
| $1,000 to $1,499 | 6 (12.5%) | 4 (100.0%) |
| $1,500 to $1,999 | 0 (0.0%) | 0 (0.0%) |
| $2,000 to $2,499 | 12 (25.0%) | 0 (0.0%) |
| $2,500 to $2,999 | 0 (0.0%) | 0 (0.0%) |
| $3,000 or more | 0 (0.0%) | 0 (0.0%) |
| Total | 48 (100.0%) | 4 (100.0%) |
Physical Housing Characteristics in Lake Leelanau
Housing Structures in Lake Leelanau
| Structure Type | # Housing Units | % Housing Units |
| Single Unit, Detached | 48 | 92.3% |
| Single Unit, Attached | 0 | 0.0% |
| 2 Unit Apartments | 0 | 0.0% |
| 3 or 4 Unit Apartments | 0 | 0.0% |
| 5 to 9 Unit Apartments | 0 | 0.0% |
| 10 or more Apartments | 0 | 0.0% |
| Mobile Home / Other | 4 | 7.7% |
| Total | 52 | 100.0% |
Housing Structures by Occupancy in Lake Leelanau
| Structure Type | Owner-occupied | Renter-occupied |
| Single Unit, Detached | 44 (91.7%) | 4 (8.3%) |
| Single Unit, Attached | 0 (0.0%) | 0 (0.0%) |
| 2 Unit Apartments | 0 (0.0%) | 0 (0.0%) |
| 3 or 4 Unit Apartments | 0 (0.0%) | 0 (0.0%) |
| 5 to 9 Unit Apartments | 0 (0.0%) | 0 (0.0%) |
| 10 or more Apartments | 0 (0.0%) | 0 (0.0%) |
| Mobile Home / Other | 4 (100.0%) | 0 (0.0%) |
| Total | 48 (92.3%) | 4 (7.7%) |
Housing Structures by Number of Rooms in Lake Leelanau
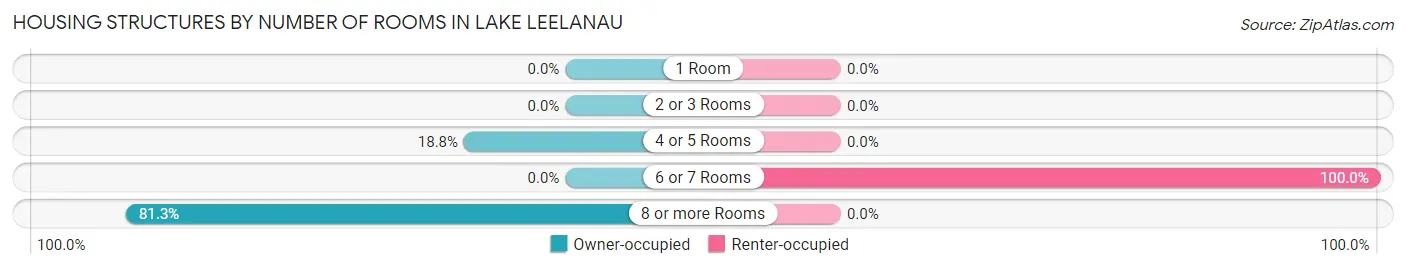
| Number of Rooms | Owner-occupied | Renter-occupied |
| 1 Room | 0 (0.0%) | 0 (0.0%) |
| 2 or 3 Rooms | 0 (0.0%) | 0 (0.0%) |
| 4 or 5 Rooms | 9 (18.8%) | 0 (0.0%) |
| 6 or 7 Rooms | 0 (0.0%) | 4 (100.0%) |
| 8 or more Rooms | 39 (81.2%) | 0 (0.0%) |
| Total | 48 (100.0%) | 4 (100.0%) |
Housing Structure by Heating Type in Lake Leelanau
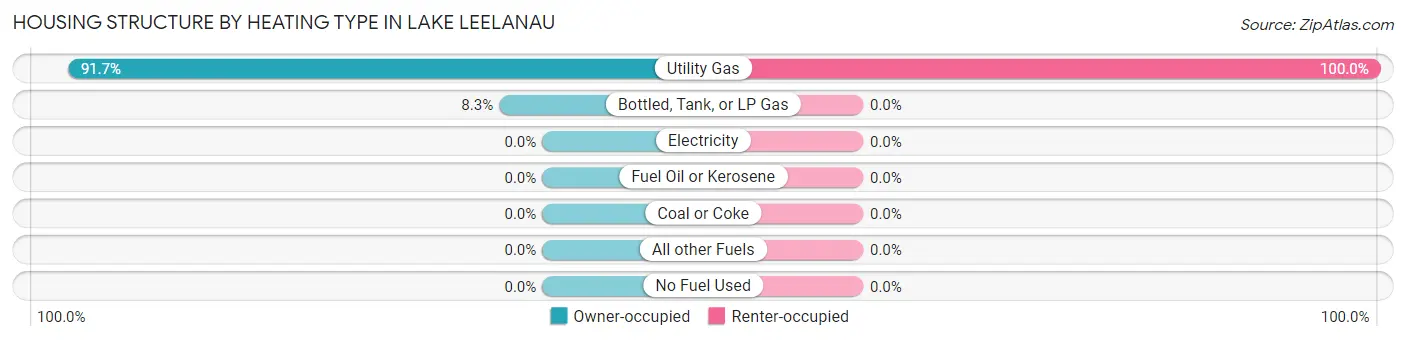
| Heating Type | Owner-occupied | Renter-occupied |
| Utility Gas | 44 (91.7%) | 4 (100.0%) |
| Bottled, Tank, or LP Gas | 4 (8.3%) | 0 (0.0%) |
| Electricity | 0 (0.0%) | 0 (0.0%) |
| Fuel Oil or Kerosene | 0 (0.0%) | 0 (0.0%) |
| Coal or Coke | 0 (0.0%) | 0 (0.0%) |
| All other Fuels | 0 (0.0%) | 0 (0.0%) |
| No Fuel Used | 0 (0.0%) | 0 (0.0%) |
| Total | 48 (100.0%) | 4 (100.0%) |
Household Vehicle Usage in Lake Leelanau
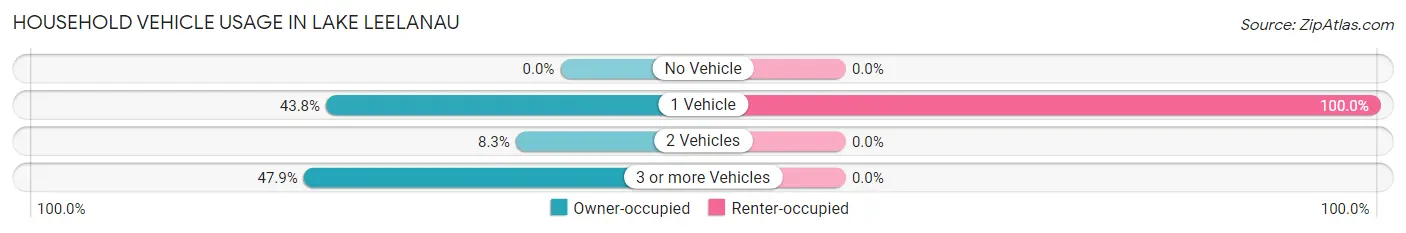
| Vehicles per Household | Owner-occupied | Renter-occupied |
| No Vehicle | 0 (0.0%) | 0 (0.0%) |
| 1 Vehicle | 21 (43.8%) | 4 (100.0%) |
| 2 Vehicles | 4 (8.3%) | 0 (0.0%) |
| 3 or more Vehicles | 23 (47.9%) | 0 (0.0%) |
| Total | 48 (100.0%) | 4 (100.0%) |
Real Estate & Mortgages in Lake Leelanau
Real Estate and Mortgage Overview in Lake Leelanau
| Characteristic | Without Mortgage | With Mortgage |
| Housing Units | 22 | 26 |
| Median Property Value | - | - |
| Median Household Income | - | - |
| Monthly Housing Costs | - | - |
| Real Estate Taxes | - | - |
Property Value by Mortgage Status in Lake Leelanau
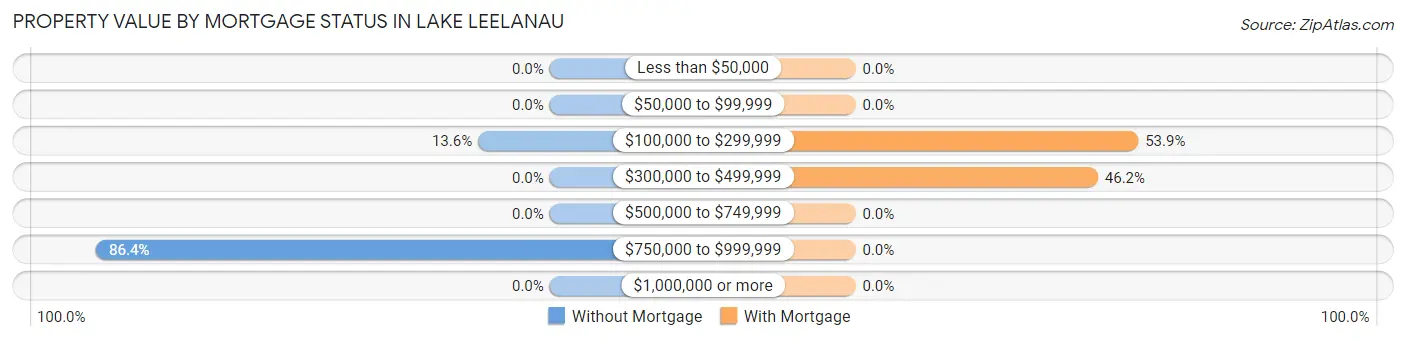
| Property Value | Without Mortgage | With Mortgage |
| Less than $50,000 | 0 (0.0%) | 0 (0.0%) |
| $50,000 to $99,999 | 0 (0.0%) | 0 (0.0%) |
| $100,000 to $299,999 | 3 (13.6%) | 14 (53.8%) |
| $300,000 to $499,999 | 0 (0.0%) | 12 (46.2%) |
| $500,000 to $749,999 | 0 (0.0%) | 0 (0.0%) |
| $750,000 to $999,999 | 19 (86.4%) | 0 (0.0%) |
| $1,000,000 or more | 0 (0.0%) | 0 (0.0%) |
| Total | 22 (100.0%) | 26 (100.0%) |
Household Income by Mortgage Status in Lake Leelanau
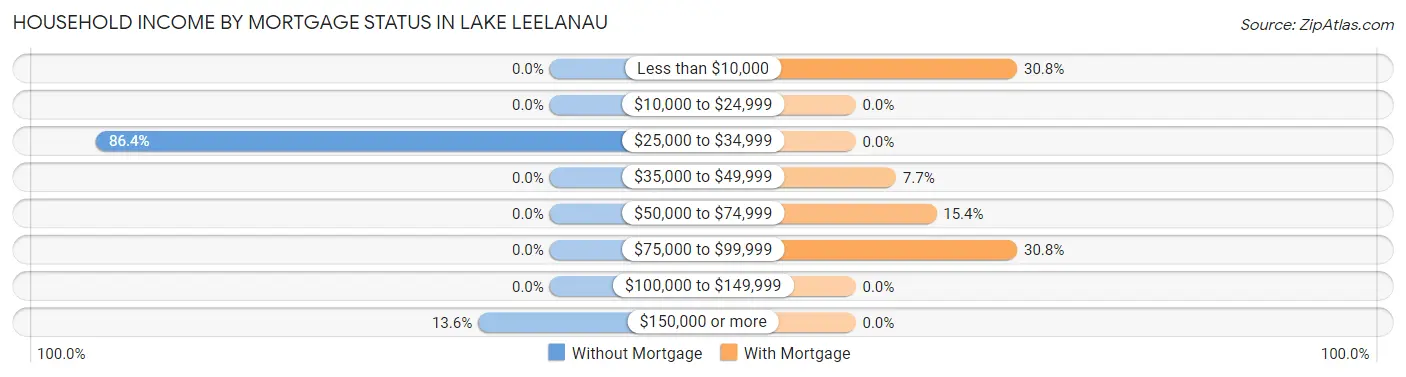
| Household Income | Without Mortgage | With Mortgage |
| Less than $10,000 | 0 (0.0%) | 8 (30.8%) |
| $10,000 to $24,999 | 0 (0.0%) | 0 (0.0%) |
| $25,000 to $34,999 | 19 (86.4%) | 0 (0.0%) |
| $35,000 to $49,999 | 0 (0.0%) | 2 (7.7%) |
| $50,000 to $74,999 | 0 (0.0%) | 4 (15.4%) |
| $75,000 to $99,999 | 0 (0.0%) | 8 (30.8%) |
| $100,000 to $149,999 | 0 (0.0%) | 0 (0.0%) |
| $150,000 or more | 3 (13.6%) | 0 (0.0%) |
| Total | 22 (100.0%) | 26 (100.0%) |
Property Value to Household Income Ratio in Lake Leelanau
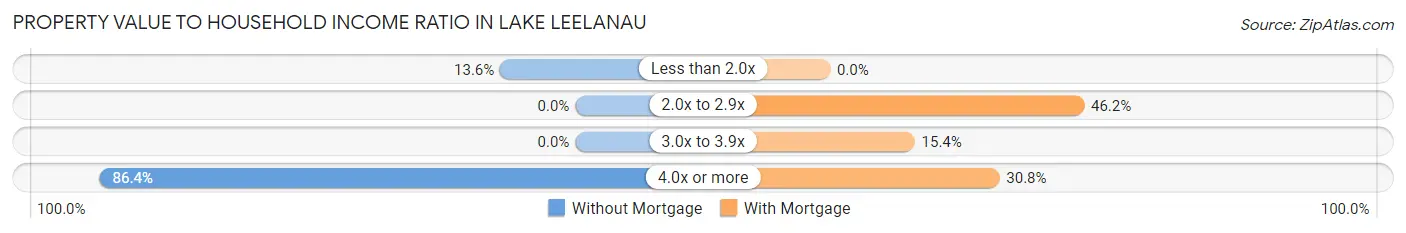
| Value-to-Income Ratio | Without Mortgage | With Mortgage |
| Less than 2.0x | 3 (13.6%) | 0 (0.0%) |
| 2.0x to 2.9x | 0 (0.0%) | 12 (46.2%) |
| 3.0x to 3.9x | 0 (0.0%) | 4 (15.4%) |
| 4.0x or more | 19 (86.4%) | 8 (30.8%) |
| Total | 22 (100.0%) | 26 (100.0%) |
Real Estate Taxes by Mortgage Status in Lake Leelanau
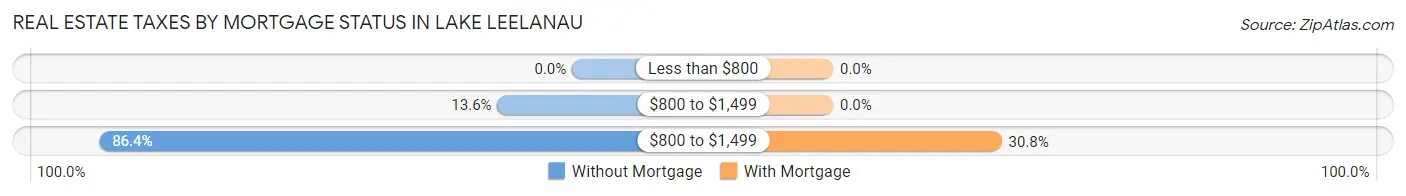
| Property Taxes | Without Mortgage | With Mortgage |
| Less than $800 | 0 (0.0%) | 0 (0.0%) |
| $800 to $1,499 | 3 (13.6%) | 0 (0.0%) |
| $800 to $1,499 | 19 (86.4%) | 8 (30.8%) |
| Total | 22 (100.0%) | 26 (100.0%) |
Health & Disability in Lake Leelanau
Health Insurance Coverage by Age in Lake Leelanau
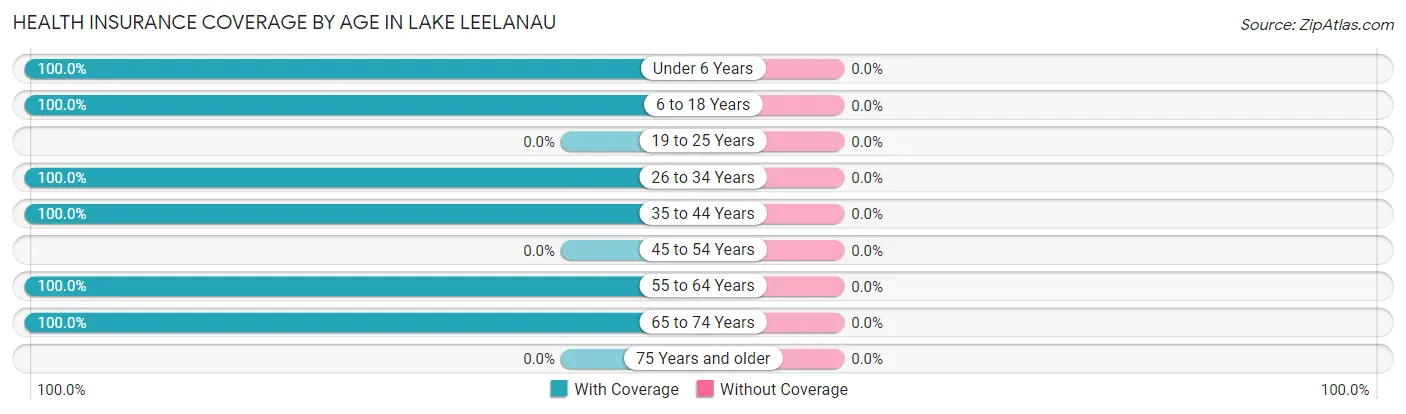
| Age Bracket | With Coverage | Without Coverage |
| Under 6 Years | 24 (100.0%) | 0 (0.0%) |
| 6 to 18 Years | 54 (100.0%) | 0 (0.0%) |
| 19 to 25 Years | 0 (0.0%) | 0 (0.0%) |
| 26 to 34 Years | 5 (100.0%) | 0 (0.0%) |
| 35 to 44 Years | 26 (100.0%) | 0 (0.0%) |
| 45 to 54 Years | 0 (0.0%) | 0 (0.0%) |
| 55 to 64 Years | 29 (100.0%) | 0 (0.0%) |
| 65 to 74 Years | 27 (100.0%) | 0 (0.0%) |
| 75 Years and older | 0 (0.0%) | 0 (0.0%) |
| Total | 165 (100.0%) | 0 (0.0%) |
Health Insurance Coverage by Citizenship Status in Lake Leelanau
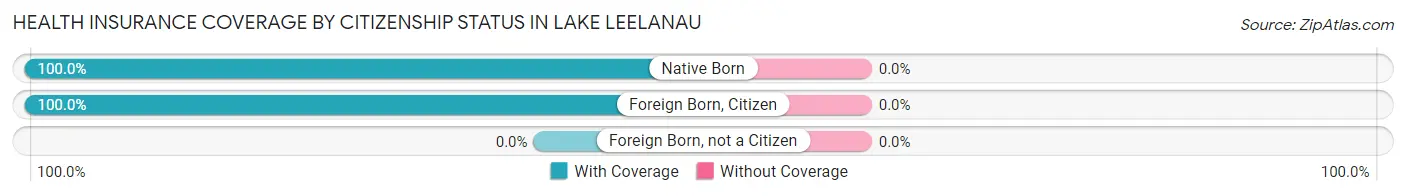
| Citizenship Status | With Coverage | Without Coverage |
| Native Born | 24 (100.0%) | 0 (0.0%) |
| Foreign Born, Citizen | 54 (100.0%) | 0 (0.0%) |
| Foreign Born, not a Citizen | 0 (0.0%) | 0 (0.0%) |
Health Insurance Coverage by Household Income in Lake Leelanau
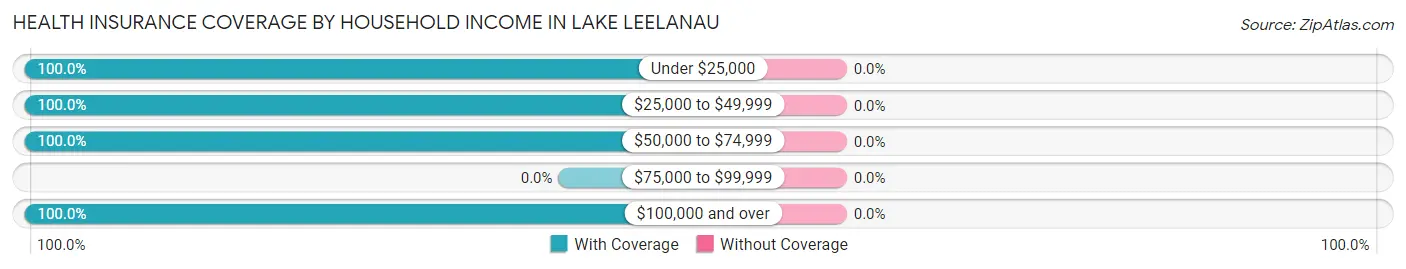
| Household Income | With Coverage | Without Coverage |
| Under $25,000 | 4 (100.0%) | 0 (0.0%) |
| $25,000 to $49,999 | 31 (100.0%) | 0 (0.0%) |
| $50,000 to $74,999 | 20 (100.0%) | 0 (0.0%) |
| $75,000 to $99,999 | 0 (0.0%) | 0 (0.0%) |
| $100,000 and over | 110 (100.0%) | 0 (0.0%) |
Public vs Private Health Insurance Coverage by Age in Lake Leelanau
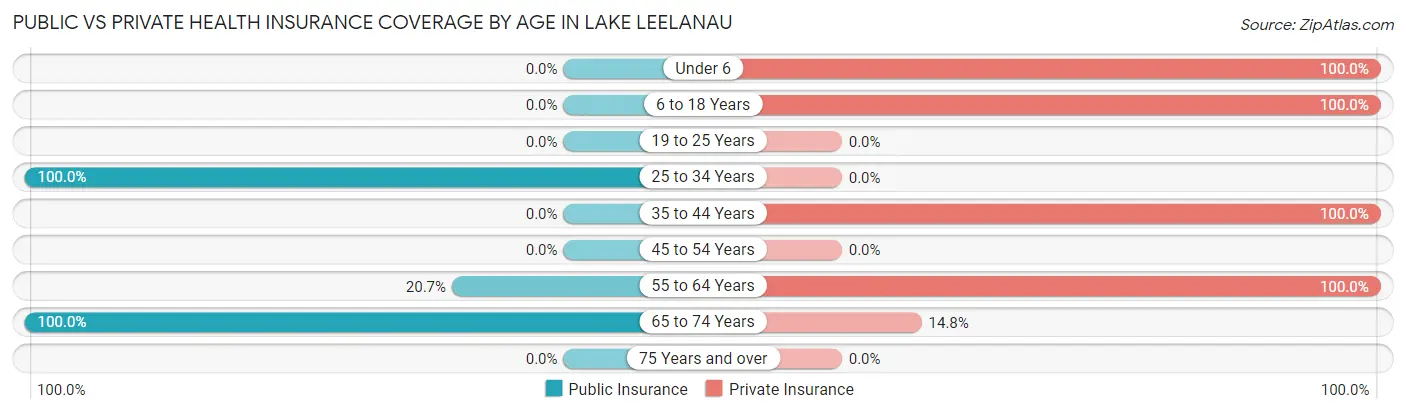
| Age Bracket | Public Insurance | Private Insurance |
| Under 6 | 0 (0.0%) | 24 (100.0%) |
| 6 to 18 Years | 0 (0.0%) | 54 (100.0%) |
| 19 to 25 Years | 0 (0.0%) | 0 (0.0%) |
| 25 to 34 Years | 5 (100.0%) | 0 (0.0%) |
| 35 to 44 Years | 0 (0.0%) | 26 (100.0%) |
| 45 to 54 Years | 0 (0.0%) | 0 (0.0%) |
| 55 to 64 Years | 6 (20.7%) | 29 (100.0%) |
| 65 to 74 Years | 27 (100.0%) | 4 (14.8%) |
| 75 Years and over | 0 (0.0%) | 0 (0.0%) |
| Total | 38 (23.0%) | 137 (83.0%) |
Disability Status by Sex by Age in Lake Leelanau
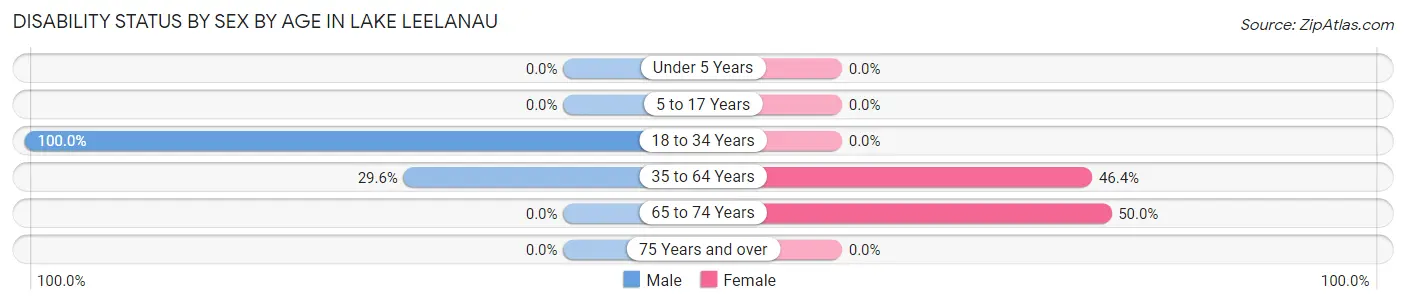
| Age Bracket | Male | Female |
| Under 5 Years | 0 (0.0%) | 0 (0.0%) |
| 5 to 17 Years | 0 (0.0%) | 0 (0.0%) |
| 18 to 34 Years | 5 (100.0%) | 0 (0.0%) |
| 35 to 64 Years | 8 (29.6%) | 13 (46.4%) |
| 65 to 74 Years | 0 (0.0%) | 4 (50.0%) |
| 75 Years and over | 0 (0.0%) | 0 (0.0%) |
Disability Class by Sex by Age in Lake Leelanau
Disability Class: Hearing Difficulty

| Age Bracket | Male | Female |
| Under 5 Years | 0 (0.0%) | 0 (0.0%) |
| 5 to 17 Years | 0 (0.0%) | 0 (0.0%) |
| 18 to 34 Years | 5 (100.0%) | 0 (0.0%) |
| 35 to 64 Years | 8 (29.6%) | 13 (46.4%) |
| 65 to 74 Years | 0 (0.0%) | 4 (50.0%) |
| 75 Years and over | 0 (0.0%) | 0 (0.0%) |
Disability Class: Vision Difficulty
| Age Bracket | Male | Female |
| Under 5 Years | 0 (0.0%) | 0 (0.0%) |
| 5 to 17 Years | 0 (0.0%) | 0 (0.0%) |
| 18 to 34 Years | 0 (0.0%) | 0 (0.0%) |
| 35 to 64 Years | 0 (0.0%) | 0 (0.0%) |
| 65 to 74 Years | 0 (0.0%) | 0 (0.0%) |
| 75 Years and over | 0 (0.0%) | 0 (0.0%) |
Disability Class: Cognitive Difficulty
| Age Bracket | Male | Female |
| 5 to 17 Years | 0 (0.0%) | 0 (0.0%) |
| 18 to 34 Years | 0 (0.0%) | 0 (0.0%) |
| 35 to 64 Years | 0 (0.0%) | 0 (0.0%) |
| 65 to 74 Years | 0 (0.0%) | 0 (0.0%) |
| 75 Years and over | 0 (0.0%) | 0 (0.0%) |
Disability Class: Ambulatory Difficulty
| Age Bracket | Male | Female |
| 5 to 17 Years | 0 (0.0%) | 0 (0.0%) |
| 18 to 34 Years | 0 (0.0%) | 0 (0.0%) |
| 35 to 64 Years | 0 (0.0%) | 0 (0.0%) |
| 65 to 74 Years | 0 (0.0%) | 0 (0.0%) |
| 75 Years and over | 0 (0.0%) | 0 (0.0%) |
Disability Class: Self-Care Difficulty
| Age Bracket | Male | Female |
| 5 to 17 Years | 0 (0.0%) | 0 (0.0%) |
| 18 to 34 Years | 0 (0.0%) | 0 (0.0%) |
| 35 to 64 Years | 0 (0.0%) | 0 (0.0%) |
| 65 to 74 Years | 0 (0.0%) | 0 (0.0%) |
| 75 Years and over | 0 (0.0%) | 0 (0.0%) |
Technology Access in Lake Leelanau
Computing Device Access in Lake Leelanau
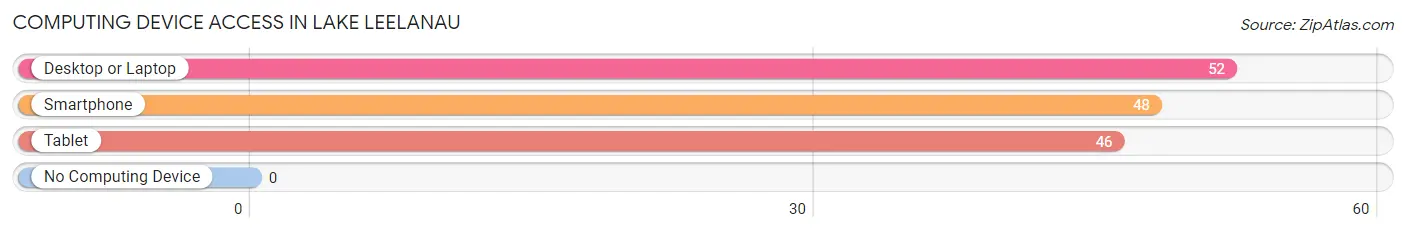
| Device Type | # Households | % Households |
| Desktop or Laptop | 52 | 100.0% |
| Smartphone | 48 | 92.3% |
| Tablet | 46 | 88.5% |
| No Computing Device | 0 | 0.0% |
| Total | 52 | 100.0% |
Internet Access in Lake Leelanau
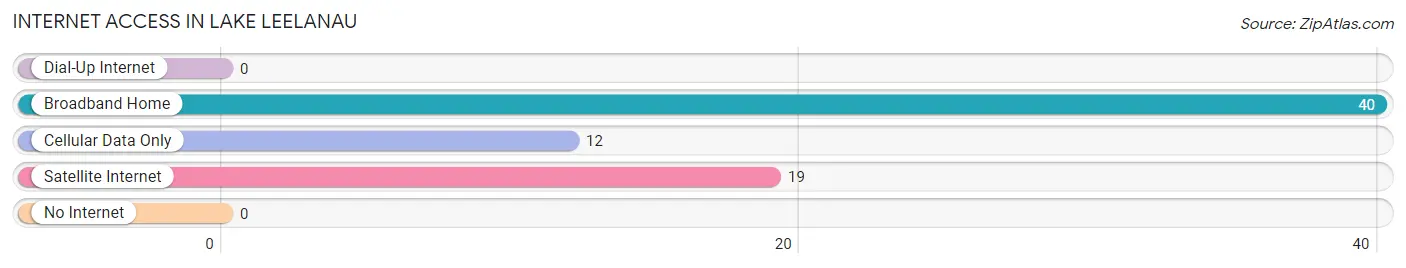
| Internet Type | # Households | % Households |
| Dial-Up Internet | 0 | 0.0% |
| Broadband Home | 40 | 76.9% |
| Cellular Data Only | 12 | 23.1% |
| Satellite Internet | 19 | 36.5% |
| No Internet | 0 | 0.0% |
| Total | 52 | 100.0% |
Lake Leelanau Summary
Lake Leelanau is a small unincorporated community located in Leelanau County, Michigan. It is situated on the eastern shore of Lake Leelanau, a long, narrow lake that is part of the Grand Traverse Bay of Lake Michigan. The community is located approximately 15 miles north of Traverse City and is home to a population of approximately 1,000 people.
History
The area around Lake Leelanau has been inhabited for thousands of years by the Anishinaabe people, who were the original inhabitants of the area. The first European settlers arrived in the area in the early 1800s, and the community of Lake Leelanau was officially established in 1855. The community was named after the lake, which was named after the Anishinaabe word for “delight of life”.
The area around Lake Leelanau was largely agricultural in the late 19th and early 20th centuries, with the main crops being apples, cherries, and grapes. The area also had a thriving lumber industry, with several sawmills located in the area.
In the late 19th century, the area around Lake Leelanau began to attract tourists, and the community became a popular summer destination. The area was also home to several resorts, including the Grand Traverse Resort, which opened in 1891.
Geography
Lake Leelanau is located in the northwest corner of Michigan’s Lower Peninsula, approximately 15 miles north of Traverse City. The community is situated on the eastern shore of Lake Leelanau, a long, narrow lake that is part of the Grand Traverse Bay of Lake Michigan. The lake is approximately 8 miles long and 1 mile wide, and is surrounded by rolling hills and forests.
The area around Lake Leelanau is known for its natural beauty, and is home to several parks and nature preserves, including the Leelanau State Park and the Sleeping Bear Dunes National Lakeshore. The area is also home to several wineries, and is a popular destination for wine tasting.
Economy
The economy of Lake Leelanau is largely based on tourism and agriculture. The area is home to several wineries, and is a popular destination for wine tasting. The area is also home to several resorts, including the Grand Traverse Resort, which opened in 1891.
The area is also home to several fruit farms, and is known for its production of apples, cherries, and grapes. The area also has a thriving lumber industry, with several sawmills located in the area.
Demographics
As of the 2010 census, the population of Lake Leelanau was 1,039. The racial makeup of the community was 97.2% White, 0.7% African American, 0.3% Native American, 0.3% Asian, 0.1% Pacific Islander, 0.2% from other races, and 1.3% from two or more races. Hispanic or Latino of any race were 1.3% of the population.
The median household income in Lake Leelanau was $45,938, and the median family income was $51,250. The per capita income for the community was $25,945. About 8.2% of families and 10.2% of the population were below the poverty line, including 14.2% of those under age 18 and 5.2% of those age 65 or over.
Common Questions
What is Per Capita Income in Lake Leelanau?
Per Capita income in Lake Leelanau is $25,060.
What is the Median Household income in Lake Leelanau?
Median Household Income in Lake Leelanau is $48,125.
What is Inequality or Gini Index in Lake Leelanau?
Inequality or Gini Index in Lake Leelanau is 0.43.
What is the Total Population of Lake Leelanau?
Total Population of Lake Leelanau is 165.
What is the Total Male Population of Lake Leelanau?
Total Male Population of Lake Leelanau is 87.
What is the Total Female Population of Lake Leelanau?
Total Female Population of Lake Leelanau is 78.
What is the Ratio of Males per 100 Females in Lake Leelanau?
There are 111.54 Males per 100 Females in Lake Leelanau.
What is the Ratio of Females per 100 Males in Lake Leelanau?
There are 89.66 Females per 100 Males in Lake Leelanau.
What is the Median Population Age in Lake Leelanau?
Median Population Age in Lake Leelanau is 27.9 Years.
What is the Average Family Size in Lake Leelanau
Average Family Size in Lake Leelanau is 5.2 People.
What is the Average Household Size in Lake Leelanau
Average Household Size in Lake Leelanau is 3.2 People.
How Large is the Labor Force in Lake Leelanau?
There are 60 People in the Labor Forcein in Lake Leelanau.
What is the Percentage of People in the Labor Force in Lake Leelanau?
61.9% of People are in the Labor Force in Lake Leelanau.