Kingsley, MI Map & Demographics
Kingsley Map
Kingsley Overview
$22,280
PER CAPITA INCOME
$66,926
AVG FAMILY INCOME
$65,060
AVG HOUSEHOLD INCOME
50.3%
WAGE / INCOME GAP [ % ]
49.7¢/ $1
WAGE / INCOME GAP [ $ ]
0.42
INEQUALITY / GINI INDEX
1,792
TOTAL POPULATION
983
MALE POPULATION
809
FEMALE POPULATION
121.51
MALES / 100 FEMALES
82.30
FEMALES / 100 MALES
28.7
MEDIAN AGE
4.3
AVG FAMILY SIZE
3.5
AVG HOUSEHOLD SIZE
646
LABOR FORCE [ PEOPLE ]
62.3%
PERCENT IN LABOR FORCE
2.6%
UNEMPLOYMENT RATE
Kingsley Zip Codes
Kingsley Area Codes
Income in Kingsley
Income Overview in Kingsley
Per Capita Income in Kingsley is $22,280, while median incomes of families and households are $66,926 and $65,060 respectively.
| Characteristic | Number | Measure |
| Per Capita Income | 1,792 | $22,280 |
| Median Family Income | 353 | $66,926 |
| Mean Family Income | 353 | $76,414 |
| Median Household Income | 514 | $65,060 |
| Mean Household Income | 514 | $73,085 |
| Income Deficit | 353 | $0 |
| Wage / Income Gap (%) | 1,792 | 50.28% |
| Wage / Income Gap ($) | 1,792 | 49.72¢ per $1 |
| Gini / Inequality Index | 1,792 | 0.42 |
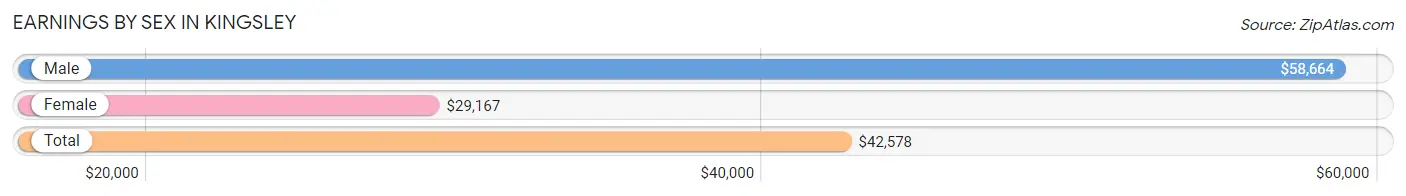
Earnings by Sex in Kingsley
Average Earnings in Kingsley are $42,578, $58,664 for men and $29,167 for women, a difference of 50.3%.
| Sex | Number | Average Earnings |
| Male | 367 (52.8%) | $58,664 |
| Female | 328 (47.2%) | $29,167 |
| Total | 695 (100.0%) | $42,578 |
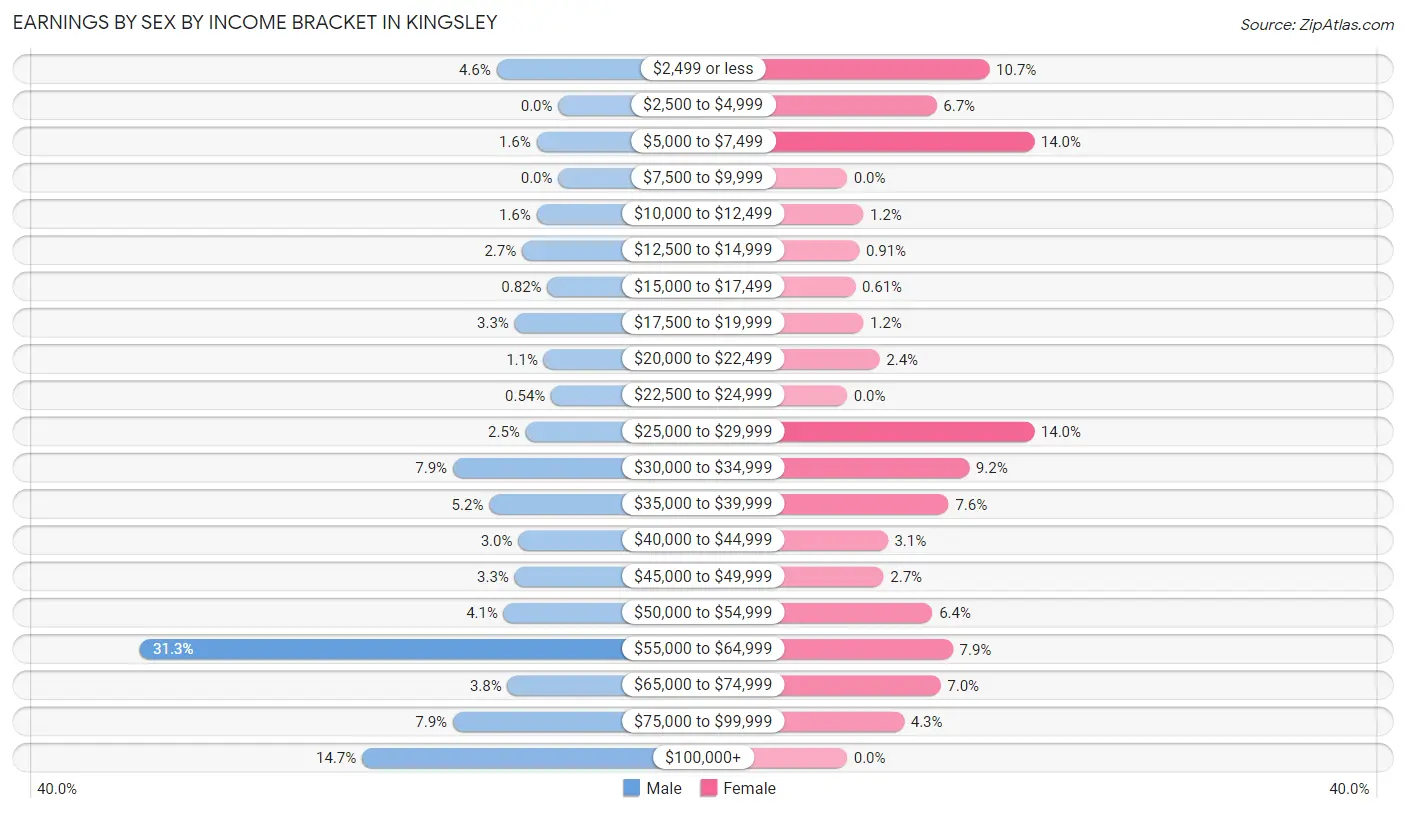
Earnings by Sex by Income Bracket in Kingsley
The most common earnings brackets in Kingsley are $55,000 to $64,999 for men (115 | 31.3%) and $5,000 to $7,499 for women (46 | 14.0%).
| Income | Male | Female |
| $2,499 or less | 17 (4.6%) | 35 (10.7%) |
| $2,500 to $4,999 | 0 (0.0%) | 22 (6.7%) |
| $5,000 to $7,499 | 6 (1.6%) | 46 (14.0%) |
| $7,500 to $9,999 | 0 (0.0%) | 0 (0.0%) |
| $10,000 to $12,499 | 6 (1.6%) | 4 (1.2%) |
| $12,500 to $14,999 | 10 (2.7%) | 3 (0.9%) |
| $15,000 to $17,499 | 3 (0.8%) | 2 (0.6%) |
| $17,500 to $19,999 | 12 (3.3%) | 4 (1.2%) |
| $20,000 to $22,499 | 4 (1.1%) | 8 (2.4%) |
| $22,500 to $24,999 | 2 (0.5%) | 0 (0.0%) |
| $25,000 to $29,999 | 9 (2.5%) | 46 (14.0%) |
| $30,000 to $34,999 | 29 (7.9%) | 30 (9.1%) |
| $35,000 to $39,999 | 19 (5.2%) | 25 (7.6%) |
| $40,000 to $44,999 | 11 (3.0%) | 10 (3.0%) |
| $45,000 to $49,999 | 12 (3.3%) | 9 (2.7%) |
| $50,000 to $54,999 | 15 (4.1%) | 21 (6.4%) |
| $55,000 to $64,999 | 115 (31.3%) | 26 (7.9%) |
| $65,000 to $74,999 | 14 (3.8%) | 23 (7.0%) |
| $75,000 to $99,999 | 29 (7.9%) | 14 (4.3%) |
| $100,000+ | 54 (14.7%) | 0 (0.0%) |
| Total | 367 (100.0%) | 328 (100.0%) |
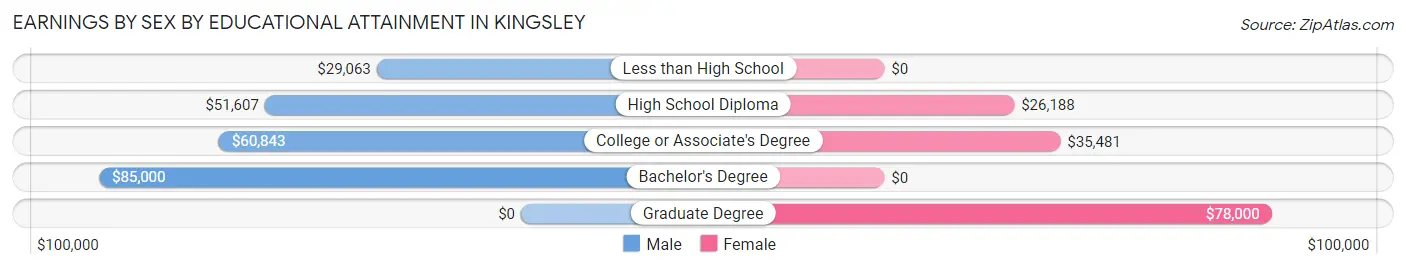
Earnings by Sex by Educational Attainment in Kingsley
Average earnings in Kingsley are $60,047 for men and $30,114 for women, a difference of 49.8%. Men with an educational attainment of bachelor's degree enjoy the highest average annual earnings of $85,000, while those with less than high school education earn the least with $29,063. Women with an educational attainment of graduate degree earn the most with the average annual earnings of $78,000, while those with high school diploma education have the smallest earnings of $26,188.
| Educational Attainment | Male Income | Female Income |
| Less than High School | $29,063 | $0 |
| High School Diploma | $51,607 | $26,188 |
| College or Associate's Degree | $60,843 | $35,481 |
| Bachelor's Degree | $85,000 | $0 |
| Graduate Degree | - | - |
| Total | $60,047 | $30,114 |
Family Income in Kingsley
Family Income Brackets in Kingsley
According to the Kingsley family income data, there are 93 families falling into the $50,000 to $74,999 income range, which is the most common income bracket and makes up 26.4% of all families. Conversely, the $10,000 to $14,999 income bracket is the least frequent group with only 4 families (1.1%) belonging to this category.
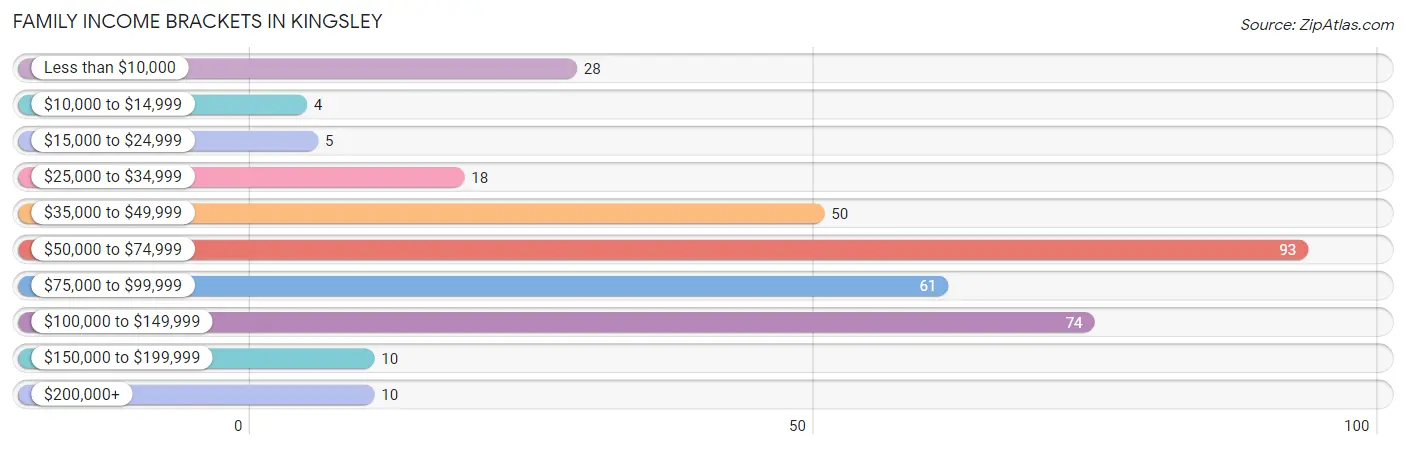
| Income Bracket | # Families | % Families |
| Less than $10,000 | 28 | 7.9% |
| $10,000 to $14,999 | 4 | 1.1% |
| $15,000 to $24,999 | 5 | 1.4% |
| $25,000 to $34,999 | 18 | 5.1% |
| $35,000 to $49,999 | 50 | 14.2% |
| $50,000 to $74,999 | 93 | 26.3% |
| $75,000 to $99,999 | 61 | 17.3% |
| $100,000 to $149,999 | 74 | 21.0% |
| $150,000 to $199,999 | 10 | 2.8% |
| $200,000+ | 10 | 2.8% |
Family Income by Famaliy Size in Kingsley
4-person families (53 | 15.0%) account for the highest median family income in Kingsley with $105,417 per family, while 2-person families (139 | 39.4%) have the highest median income of $36,875 per family member.
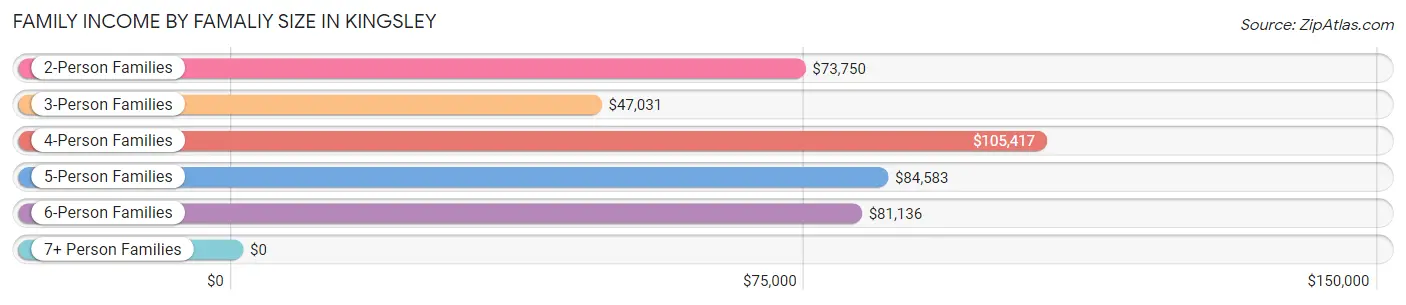
| Income Bracket | # Families | Median Income |
| 2-Person Families | 139 (39.4%) | $73,750 |
| 3-Person Families | 79 (22.4%) | $47,031 |
| 4-Person Families | 53 (15.0%) | $105,417 |
| 5-Person Families | 29 (8.2%) | $84,583 |
| 6-Person Families | 16 (4.5%) | $81,136 |
| 7+ Person Families | 37 (10.5%) | $0 |
| Total | 353 (100.0%) | $66,926 |
Family Income by Number of Earners in Kingsley
The median family income in Kingsley is $66,926, with families comprising 3+ earners (27) having the highest median family income of $98,750, while families with no earners (70) have the lowest median family income of $37,083, accounting for 7.6% and 19.8% of families, respectively.
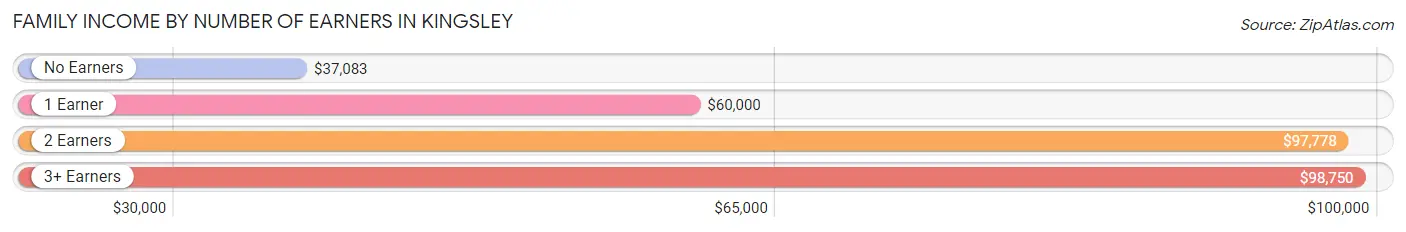
| Number of Earners | # Families | Median Income |
| No Earners | 70 (19.8%) | $37,083 |
| 1 Earner | 116 (32.9%) | $60,000 |
| 2 Earners | 140 (39.7%) | $97,778 |
| 3+ Earners | 27 (7.6%) | $98,750 |
| Total | 353 (100.0%) | $66,926 |
Household Income in Kingsley
Household Income Brackets in Kingsley
With 106 households falling in the category, the $50,000 to $74,999 income range is the most frequent in Kingsley, accounting for 20.6% of all households. In contrast, only 13 households (2.5%) fall into the $150,000 to $199,999 income bracket, making it the least populous group.
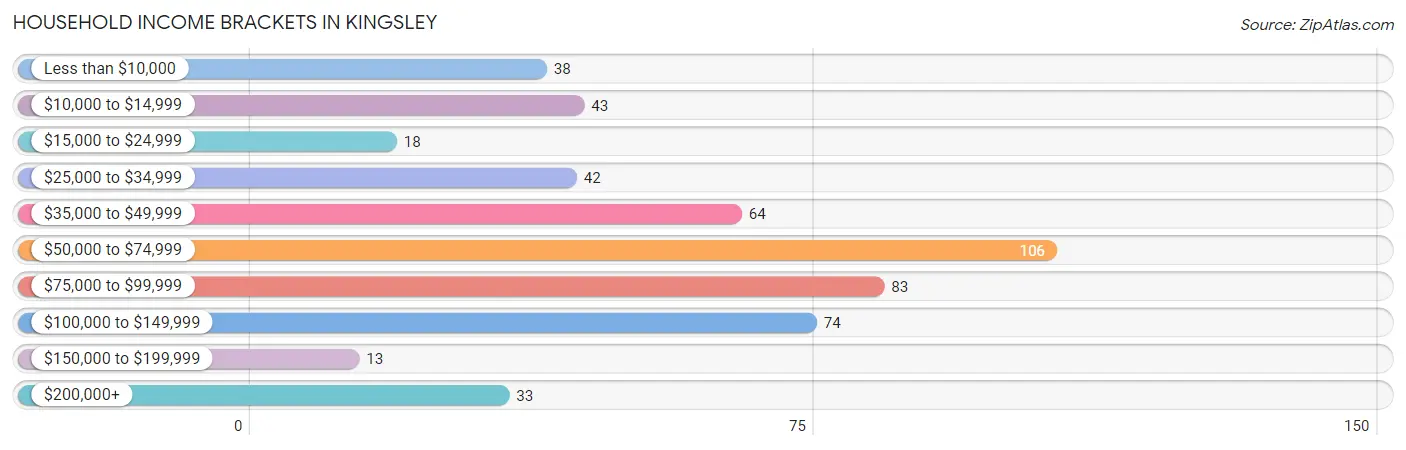
| Income Bracket | # Households | % Households |
| Less than $10,000 | 38 | 7.4% |
| $10,000 to $14,999 | 43 | 8.4% |
| $15,000 to $24,999 | 18 | 3.5% |
| $25,000 to $34,999 | 42 | 8.2% |
| $35,000 to $49,999 | 64 | 12.5% |
| $50,000 to $74,999 | 106 | 20.6% |
| $75,000 to $99,999 | 83 | 16.1% |
| $100,000 to $149,999 | 74 | 14.4% |
| $150,000 to $199,999 | 13 | 2.5% |
| $200,000+ | 33 | 6.4% |
Household Income by Householder Age in Kingsley
The median household income in Kingsley is $65,060, with the highest median household income of $80,000 found in the 25 to 44 years age bracket for the primary householder. A total of 236 households (45.9%) fall into this category. Meanwhile, the 65+ years age bracket for the primary householder has the lowest median household income of $37,813, with 111 households (21.6%) in this group.
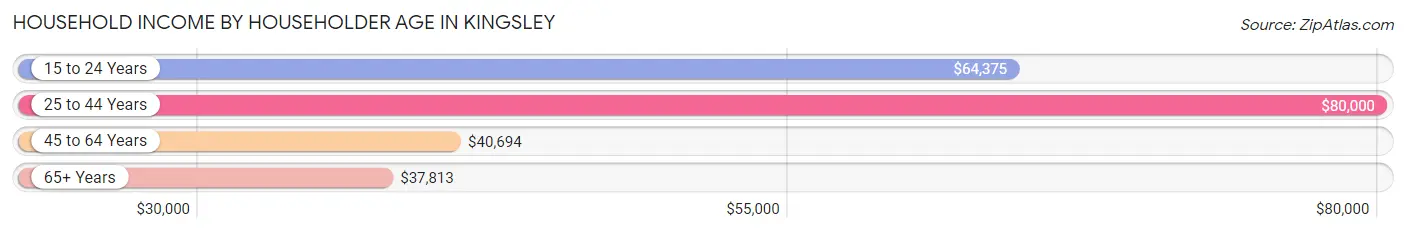
| Income Bracket | # Households | Median Income |
| 15 to 24 Years | 16 (3.1%) | $64,375 |
| 25 to 44 Years | 236 (45.9%) | $80,000 |
| 45 to 64 Years | 151 (29.4%) | $40,694 |
| 65+ Years | 111 (21.6%) | $37,813 |
| Total | 514 (100.0%) | $65,060 |
Poverty in Kingsley
Income Below Poverty by Sex and Age in Kingsley
With 9.5% poverty level for males and 15.7% for females among the residents of Kingsley, 18 to 24 year old males and under 5 year old females are the most vulnerable to poverty, with 9 males (29.0%) and 15 females (34.9%) in their respective age groups living below the poverty level.
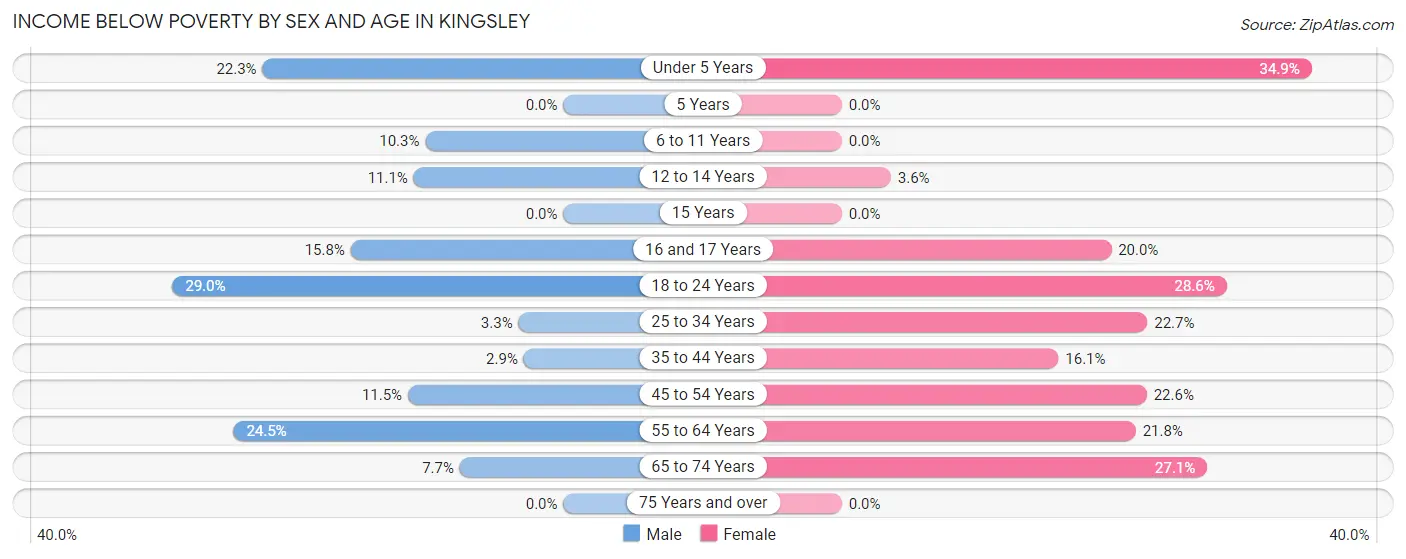
| Age Bracket | Male | Female |
| Under 5 Years | 21 (22.3%) | 15 (34.9%) |
| 5 Years | 0 (0.0%) | 0 (0.0%) |
| 6 to 11 Years | 25 (10.2%) | 0 (0.0%) |
| 12 to 14 Years | 5 (11.1%) | 4 (3.6%) |
| 15 Years | 0 (0.0%) | 0 (0.0%) |
| 16 and 17 Years | 3 (15.8%) | 2 (20.0%) |
| 18 to 24 Years | 9 (29.0%) | 8 (28.6%) |
| 25 to 34 Years | 4 (3.3%) | 22 (22.7%) |
| 35 to 44 Years | 4 (2.9%) | 23 (16.1%) |
| 45 to 54 Years | 6 (11.5%) | 12 (22.6%) |
| 55 to 64 Years | 12 (24.5%) | 24 (21.8%) |
| 65 to 74 Years | 4 (7.7%) | 16 (27.1%) |
| 75 Years and over | 0 (0.0%) | 0 (0.0%) |
| Total | 93 (9.5%) | 126 (15.7%) |
Income Above Poverty by Sex and Age in Kingsley
According to the poverty statistics in Kingsley, males aged 5 years and females aged 5 years are the age groups that are most secure financially, with 100.0% of males and 100.0% of females in these age groups living above the poverty line.
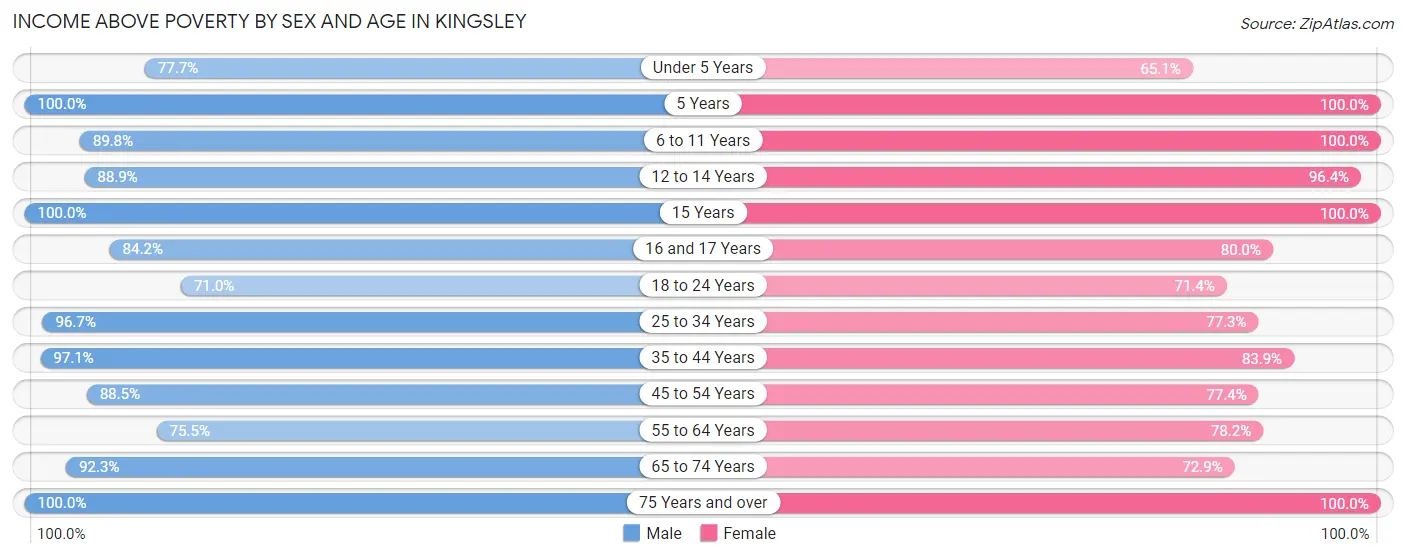
| Age Bracket | Male | Female |
| Under 5 Years | 73 (77.7%) | 28 (65.1%) |
| 5 Years | 8 (100.0%) | 51 (100.0%) |
| 6 to 11 Years | 219 (89.7%) | 52 (100.0%) |
| 12 to 14 Years | 40 (88.9%) | 106 (96.4%) |
| 15 Years | 90 (100.0%) | 5 (100.0%) |
| 16 and 17 Years | 16 (84.2%) | 8 (80.0%) |
| 18 to 24 Years | 22 (71.0%) | 20 (71.4%) |
| 25 to 34 Years | 116 (96.7%) | 75 (77.3%) |
| 35 to 44 Years | 132 (97.1%) | 120 (83.9%) |
| 45 to 54 Years | 46 (88.5%) | 41 (77.4%) |
| 55 to 64 Years | 37 (75.5%) | 86 (78.2%) |
| 65 to 74 Years | 48 (92.3%) | 43 (72.9%) |
| 75 Years and over | 38 (100.0%) | 40 (100.0%) |
| Total | 885 (90.5%) | 675 (84.3%) |
Income Below Poverty Among Married-Couple Families in Kingsley
The poverty statistics for married-couple families in Kingsley show that 4.9% or 14 of the total 286 families live below the poverty line. Families with 1 or 2 children have the highest poverty rate of 16.9%, comprising of 14 families. On the other hand, families with no children have the lowest poverty rate of 0.0%, which includes 0 families.
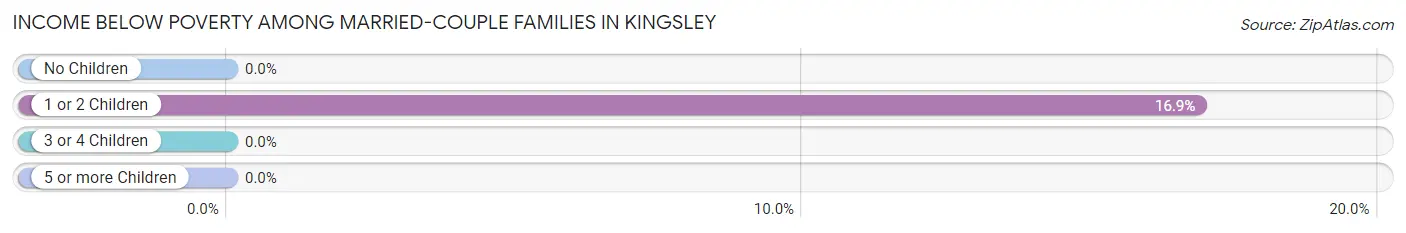
| Children | Above Poverty | Below Poverty |
| No Children | 131 (100.0%) | 0 (0.0%) |
| 1 or 2 Children | 69 (83.1%) | 14 (16.9%) |
| 3 or 4 Children | 35 (100.0%) | 0 (0.0%) |
| 5 or more Children | 37 (100.0%) | 0 (0.0%) |
| Total | 272 (95.1%) | 14 (4.9%) |
Income Below Poverty Among Single-Parent Households in Kingsley
According to the poverty data in Kingsley, 17.6% or 3 single-father households and 40.0% or 20 single-mother households are living below the poverty line. Among single-father households, those with 1 or 2 children have the highest poverty rate, with 3 households (17.6%) experiencing poverty. Likewise, among single-mother households, those with 3 or 4 children have the highest poverty rate, with 11 households (100.0%) falling below the poverty line.
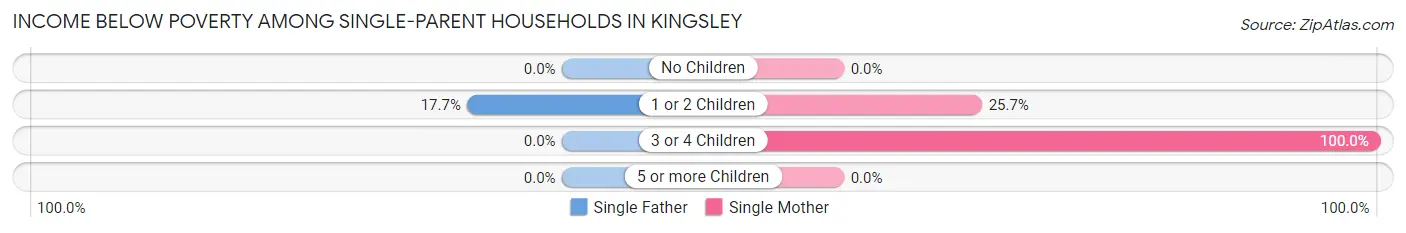
| Children | Single Father | Single Mother |
| No Children | 0 (0.0%) | 0 (0.0%) |
| 1 or 2 Children | 3 (17.6%) | 9 (25.7%) |
| 3 or 4 Children | 0 (0.0%) | 11 (100.0%) |
| 5 or more Children | 0 (0.0%) | 0 (0.0%) |
| Total | 3 (17.6%) | 20 (40.0%) |
Income Below Poverty Among Married-Couple vs Single-Parent Households in Kingsley
The poverty data for Kingsley shows that 14 of the married-couple family households (4.9%) and 23 of the single-parent households (34.3%) are living below the poverty level. Within the married-couple family households, those with 1 or 2 children have the highest poverty rate, with 14 households (16.9%) falling below the poverty line. Among the single-parent households, those with 3 or 4 children have the highest poverty rate, with 11 household (100.0%) living below poverty.
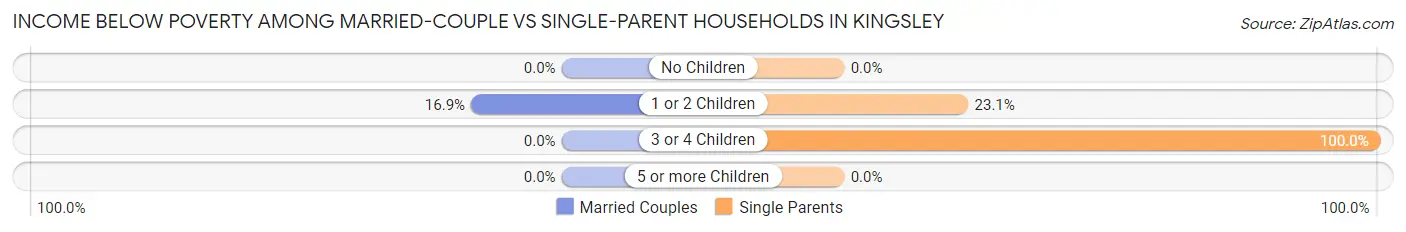
| Children | Married-Couple Families | Single-Parent Households |
| No Children | 0 (0.0%) | 0 (0.0%) |
| 1 or 2 Children | 14 (16.9%) | 12 (23.1%) |
| 3 or 4 Children | 0 (0.0%) | 11 (100.0%) |
| 5 or more Children | 0 (0.0%) | 0 (0.0%) |
| Total | 14 (4.9%) | 23 (34.3%) |
Race in Kingsley
The most populous races in Kingsley are White / Caucasian (1,722 | 96.1%), Hispanic or Latino (164 | 9.1%), and Two or more Races (39 | 2.2%).
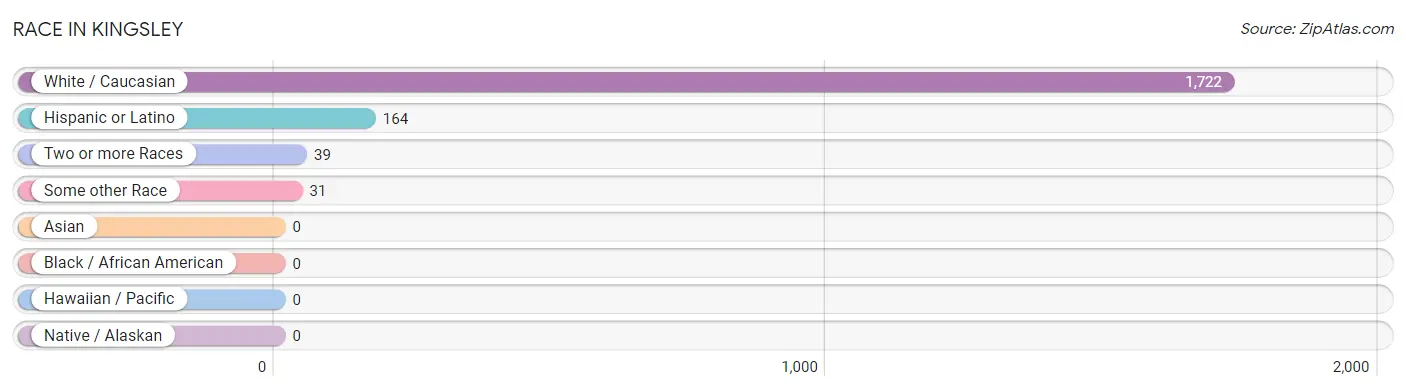
| Race | # Population | % Population |
| Asian | 0 | 0.0% |
| Black / African American | 0 | 0.0% |
| Hawaiian / Pacific | 0 | 0.0% |
| Hispanic or Latino | 164 | 9.1% |
| Native / Alaskan | 0 | 0.0% |
| White / Caucasian | 1,722 | 96.1% |
| Two or more Races | 39 | 2.2% |
| Some other Race | 31 | 1.7% |
| Total | 1,792 | 100.0% |
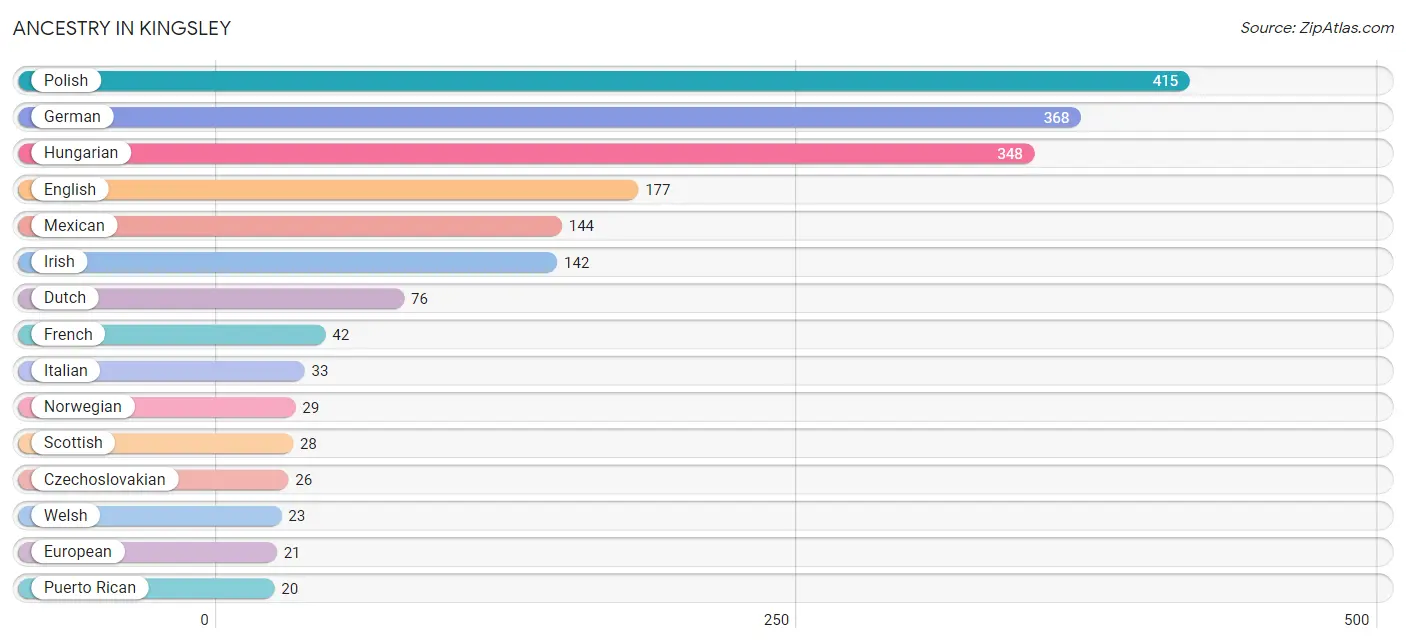
Ancestry in Kingsley
The most populous ancestries reported in Kingsley are Polish (415 | 23.2%), German (368 | 20.5%), Hungarian (348 | 19.4%), English (177 | 9.9%), and Mexican (144 | 8.0%), together accounting for 81.0% of all Kingsley residents.
| Ancestry | # Population | % Population |
| American | 18 | 1.0% |
| Arab | 1 | 0.1% |
| Armenian | 10 | 0.6% |
| Belgian | 3 | 0.2% |
| Burmese | 9 | 0.5% |
| Canadian | 9 | 0.5% |
| Czech | 3 | 0.2% |
| Czechoslovakian | 26 | 1.5% |
| Danish | 10 | 0.6% |
| Dutch | 76 | 4.2% |
| English | 177 | 9.9% |
| European | 21 | 1.2% |
| French | 42 | 2.3% |
| French Canadian | 14 | 0.8% |
| German | 368 | 20.5% |
| Hungarian | 348 | 19.4% |
| Irish | 142 | 7.9% |
| Italian | 33 | 1.8% |
| Lebanese | 1 | 0.1% |
| Mexican | 144 | 8.0% |
| Northern European | 2 | 0.1% |
| Norwegian | 29 | 1.6% |
| Pennsylvania German | 8 | 0.4% |
| Polish | 415 | 23.2% |
| Portuguese | 3 | 0.2% |
| Puerto Rican | 20 | 1.1% |
| Russian | 6 | 0.3% |
| Scandinavian | 3 | 0.2% |
| Scotch-Irish | 5 | 0.3% |
| Scottish | 28 | 1.6% |
| Swedish | 19 | 1.1% |
| Ukrainian | 8 | 0.4% |
| Welsh | 23 | 1.3% |
| Yugoslavian | 3 | 0.2% | View All 34 Rows |
Immigrants in Kingsley
The most numerous immigrant groups reported in Kingsley came from , and Canada (5 | 0.3%), together accounting for 0.3% of all Kingsley residents.

| Immigration Origin | # Population | % Population |
| Canada | 5 | 0.3% | View All 1 Rows |
Sex and Age in Kingsley
Sex and Age in Kingsley
The most populous age groups in Kingsley are 10 to 14 Years (223 | 22.7%) for men and 10 to 14 Years (138 | 17.1%) for women.
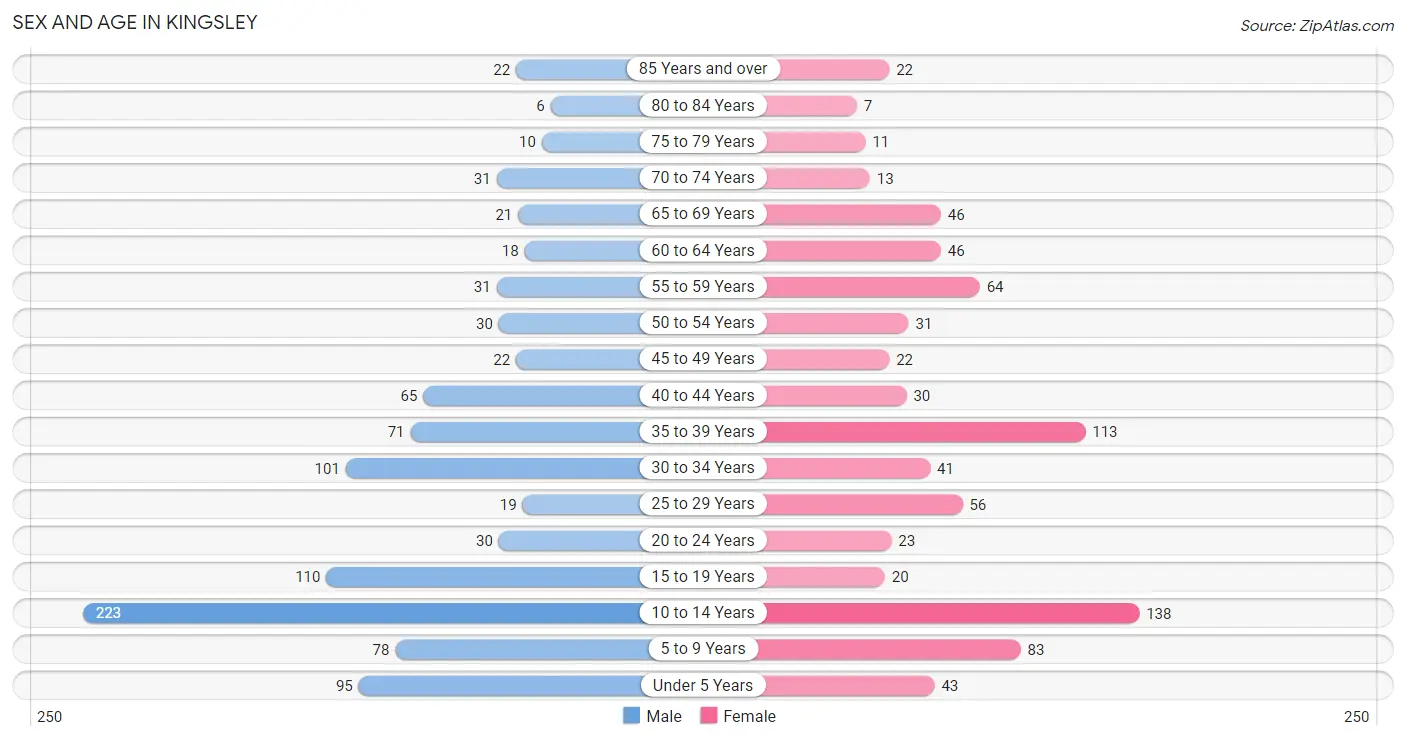
| Age Bracket | Male | Female |
| Under 5 Years | 95 (9.7%) | 43 (5.3%) |
| 5 to 9 Years | 78 (7.9%) | 83 (10.3%) |
| 10 to 14 Years | 223 (22.7%) | 138 (17.1%) |
| 15 to 19 Years | 110 (11.2%) | 20 (2.5%) |
| 20 to 24 Years | 30 (3.0%) | 23 (2.8%) |
| 25 to 29 Years | 19 (1.9%) | 56 (6.9%) |
| 30 to 34 Years | 101 (10.3%) | 41 (5.1%) |
| 35 to 39 Years | 71 (7.2%) | 113 (14.0%) |
| 40 to 44 Years | 65 (6.6%) | 30 (3.7%) |
| 45 to 49 Years | 22 (2.2%) | 22 (2.7%) |
| 50 to 54 Years | 30 (3.0%) | 31 (3.8%) |
| 55 to 59 Years | 31 (3.2%) | 64 (7.9%) |
| 60 to 64 Years | 18 (1.8%) | 46 (5.7%) |
| 65 to 69 Years | 21 (2.1%) | 46 (5.7%) |
| 70 to 74 Years | 31 (3.2%) | 13 (1.6%) |
| 75 to 79 Years | 10 (1.0%) | 11 (1.4%) |
| 80 to 84 Years | 6 (0.6%) | 7 (0.9%) |
| 85 Years and over | 22 (2.2%) | 22 (2.7%) |
| Total | 983 (100.0%) | 809 (100.0%) |
Families and Households in Kingsley
Median Family Size in Kingsley
The median family size in Kingsley is 4.35 persons per family, with married-couple families (286 | 81.0%) accounting for the largest median family size of 4.64 persons per family. On the other hand, single male/father families (17 | 4.8%) represent the smallest median family size with 2.29 persons per family.
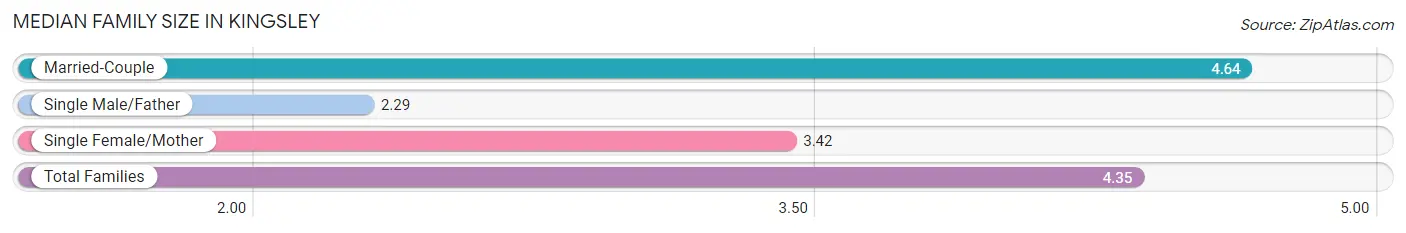
| Family Type | # Families | Family Size |
| Married-Couple | 286 (81.0%) | 4.64 |
| Single Male/Father | 17 (4.8%) | 2.29 |
| Single Female/Mother | 50 (14.2%) | 3.42 |
| Total Families | 353 (100.0%) | 4.35 |
Median Household Size in Kingsley
The median household size in Kingsley is 3.49 persons per household, with married-couple households (286 | 55.6%) accounting for the largest median household size of 4.65 persons per household. non-family households (161 | 31.3%) represent the smallest median household size with 1.48 persons per household.
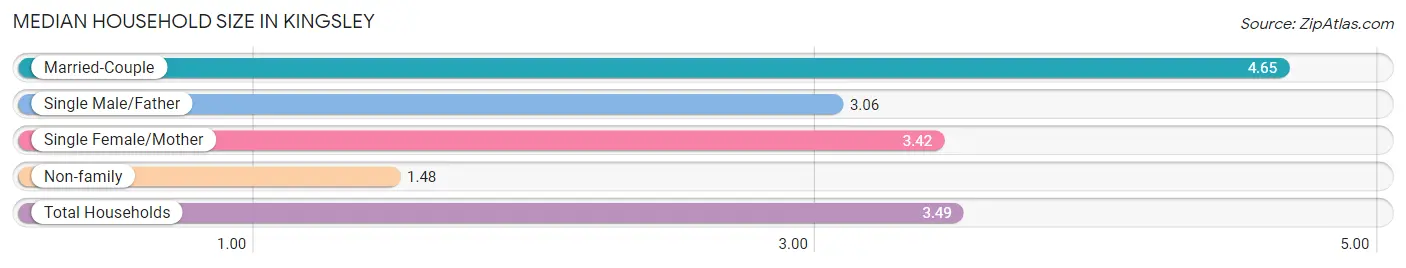
| Household Type | # Households | Household Size |
| Married-Couple | 286 (55.6%) | 4.65 |
| Single Male/Father | 17 (3.3%) | 3.06 |
| Single Female/Mother | 50 (9.7%) | 3.42 |
| Non-family | 161 (31.3%) | 1.48 |
| Total Households | 514 (100.0%) | 3.49 |
Household Size by Marriage Status in Kingsley
Out of a total of 514 households in Kingsley, 353 (68.7%) are family households, while 161 (31.3%) are nonfamily households. The most numerous type of family households are 2-person households, comprising 132, and the most common type of nonfamily households are 1-person households, comprising 93.
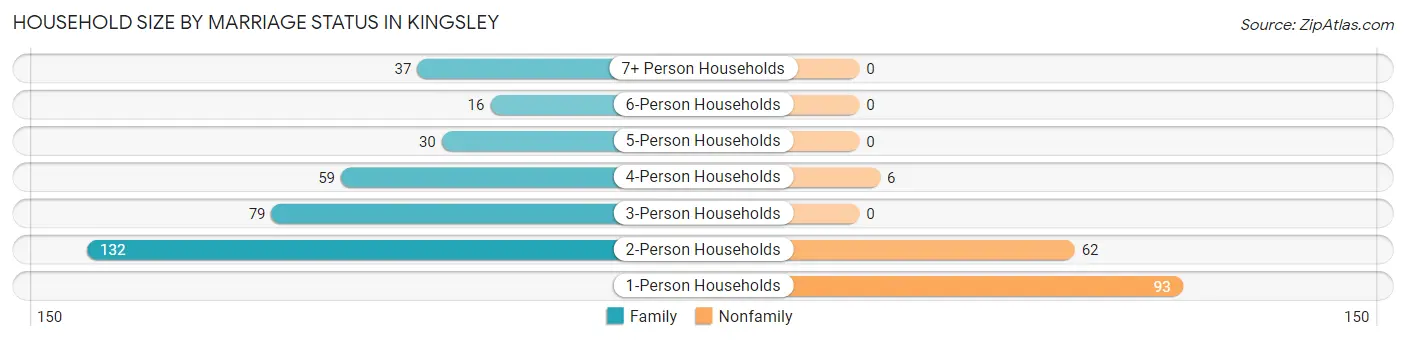
| Household Size | Family Households | Nonfamily Households |
| 1-Person Households | - | 93 (18.1%) |
| 2-Person Households | 132 (25.7%) | 62 (12.1%) |
| 3-Person Households | 79 (15.4%) | 0 (0.0%) |
| 4-Person Households | 59 (11.5%) | 6 (1.2%) |
| 5-Person Households | 30 (5.8%) | 0 (0.0%) |
| 6-Person Households | 16 (3.1%) | 0 (0.0%) |
| 7+ Person Households | 37 (7.2%) | 0 (0.0%) |
| Total | 353 (68.7%) | 161 (31.3%) |
Female Fertility in Kingsley
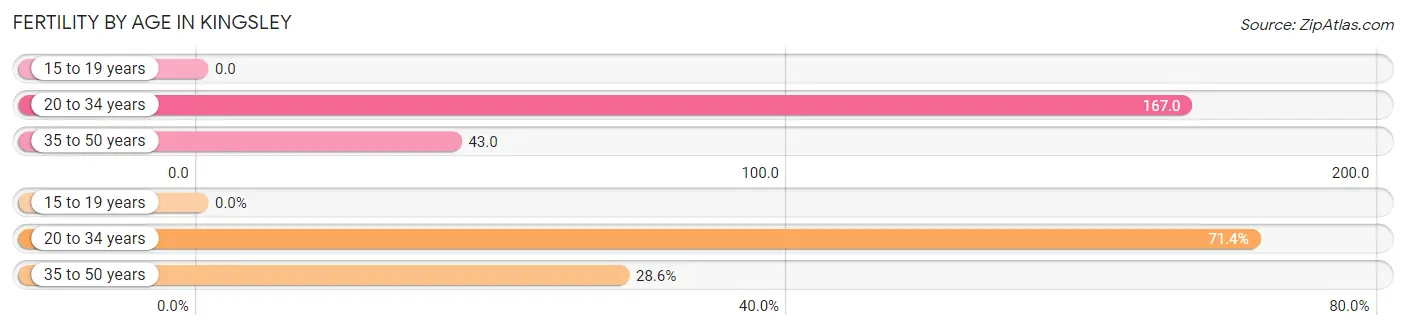
Fertility by Age in Kingsley
Average fertility rate in Kingsley is 86.0 births per 1,000 women. Women in the age bracket of 20 to 34 years have the highest fertility rate with 167.0 births per 1,000 women. Women in the age bracket of 20 to 34 years acount for 71.4% of all women with births.
| Age Bracket | Women with Births | Births / 1,000 Women |
| 15 to 19 years | 0 (0.0%) | 0.0 |
| 20 to 34 years | 20 (71.4%) | 167.0 |
| 35 to 50 years | 8 (28.6%) | 43.0 |
| Total | 28 (100.0%) | 86.0 |
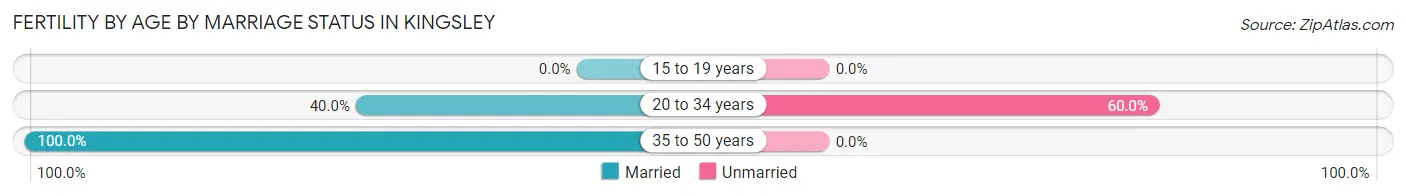
Fertility by Age by Marriage Status in Kingsley
57.1% of women with births (28) in Kingsley are married. The highest percentage of unmarried women with births falls into 20 to 34 years age bracket with 60.0% of them unmarried at the time of birth, while the lowest percentage of unmarried women with births belong to 35 to 50 years age bracket with 0.0% of them unmarried.
| Age Bracket | Married | Unmarried |
| 15 to 19 years | 0 (0.0%) | 0 (0.0%) |
| 20 to 34 years | 8 (40.0%) | 12 (60.0%) |
| 35 to 50 years | 8 (100.0%) | 0 (0.0%) |
| Total | 16 (57.1%) | 12 (42.9%) |
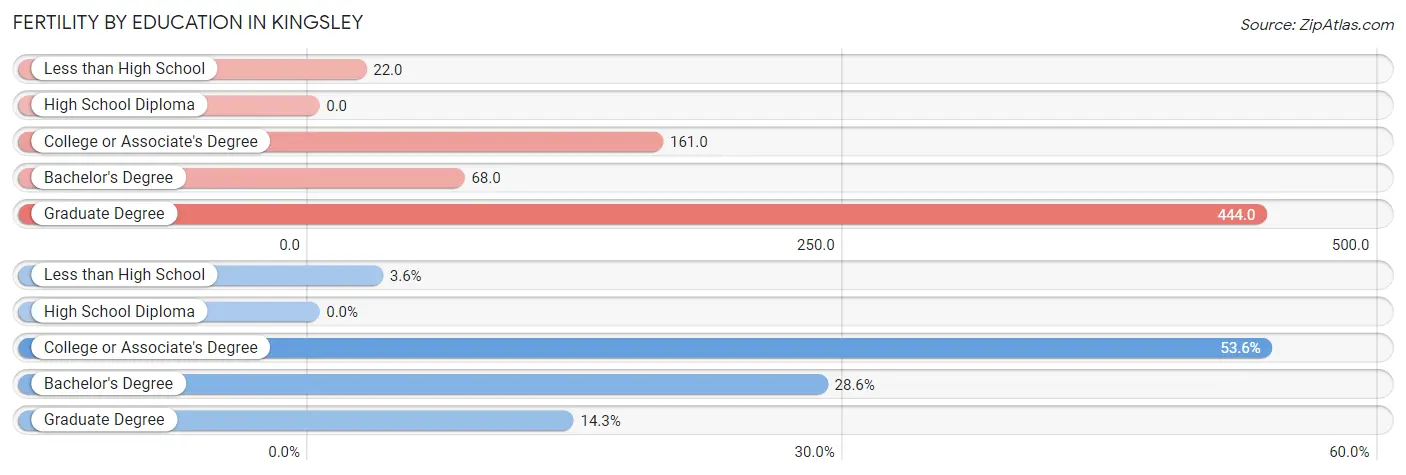
Fertility by Education in Kingsley
| Educational Attainment | Women with Births | Births / 1,000 Women |
| Less than High School | 1 (3.6%) | 22.0 |
| High School Diploma | 0 (0.0%) | 0.0 |
| College or Associate's Degree | 15 (53.6%) | 161.0 |
| Bachelor's Degree | 8 (28.6%) | 68.0 |
| Graduate Degree | 4 (14.3%) | 444.0 |
| Total | 28 (100.0%) | 86.0 |
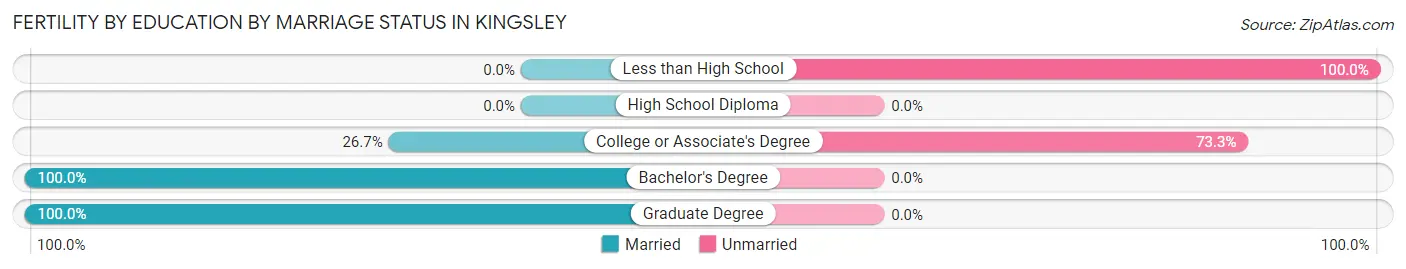
Fertility by Education by Marriage Status in Kingsley
42.9% of women with births in Kingsley are unmarried. Women with the educational attainment of bachelor's degree are most likely to be married with 100.0% of them married at childbirth, while women with the educational attainment of less than high school are least likely to be married with 100.0% of them unmarried at childbirth.
| Educational Attainment | Married | Unmarried |
| Less than High School | 0 (0.0%) | 1 (100.0%) |
| High School Diploma | 0 (0.0%) | 0 (0.0%) |
| College or Associate's Degree | 4 (26.7%) | 11 (73.3%) |
| Bachelor's Degree | 8 (100.0%) | 0 (0.0%) |
| Graduate Degree | 4 (100.0%) | 0 (0.0%) |
| Total | 16 (57.1%) | 12 (42.9%) |
Employment Characteristics in Kingsley
Employment by Class of Employer in Kingsley
Among the 626 employed individuals in Kingsley, private company employees (441 | 70.5%), not-for-profit organizations (67 | 10.7%), and self-employed (not incorporated) (52 | 8.3%) make up the most common classes of employment.
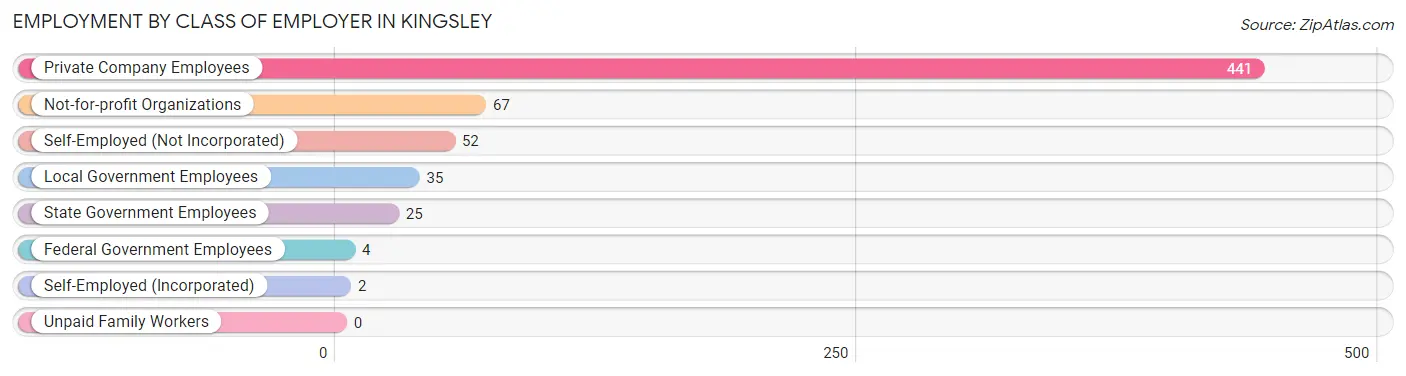
| Employer Class | # Employees | % Employees |
| Private Company Employees | 441 | 70.5% |
| Self-Employed (Incorporated) | 2 | 0.3% |
| Self-Employed (Not Incorporated) | 52 | 8.3% |
| Not-for-profit Organizations | 67 | 10.7% |
| Local Government Employees | 35 | 5.6% |
| State Government Employees | 25 | 4.0% |
| Federal Government Employees | 4 | 0.6% |
| Unpaid Family Workers | 0 | 0.0% |
| Total | 626 | 100.0% |
Employment Status by Age in Kingsley
According to the labor force statistics for Kingsley, out of the total population over 16 years of age (1,037), 62.3% or 646 individuals are in the labor force, with 2.6% or 17 of them unemployed. The age group with the highest labor force participation rate is 30 to 34 years, with 94.4% or 134 individuals in the labor force. Within the labor force, the 35 to 44 years age range has the highest percentage of unemployed individuals, with 8.1% or 17 of them being unemployed.
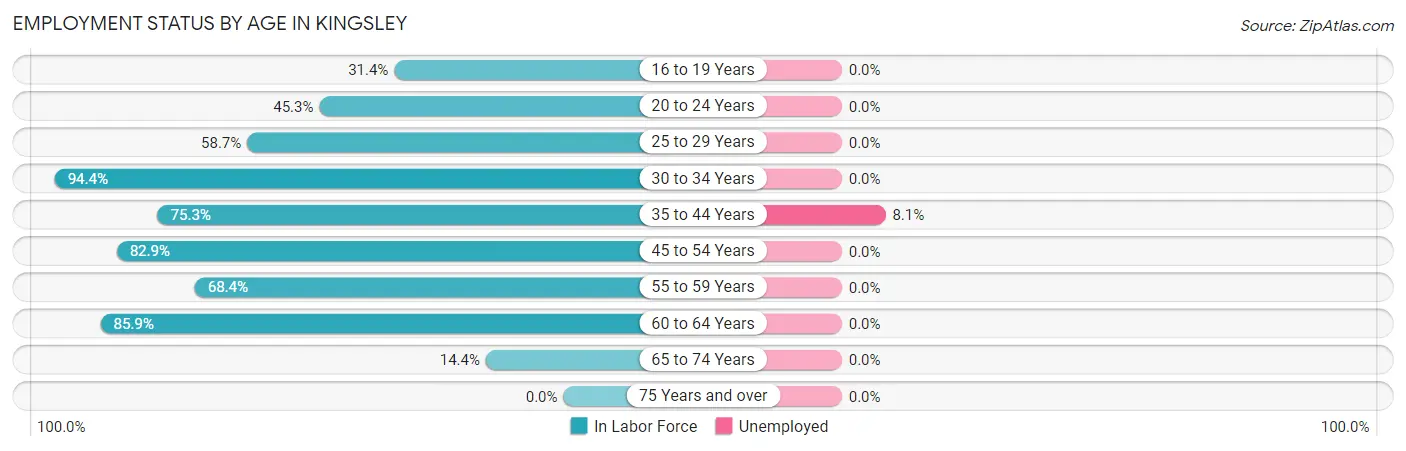
| Age Bracket | In Labor Force | Unemployed |
| 16 to 19 Years | 11 (31.4%) | 0 (0.0%) |
| 20 to 24 Years | 24 (45.3%) | 0 (0.0%) |
| 25 to 29 Years | 44 (58.7%) | 0 (0.0%) |
| 30 to 34 Years | 134 (94.4%) | 0 (0.0%) |
| 35 to 44 Years | 210 (75.3%) | 17 (8.1%) |
| 45 to 54 Years | 87 (82.9%) | 0 (0.0%) |
| 55 to 59 Years | 65 (68.4%) | 0 (0.0%) |
| 60 to 64 Years | 55 (85.9%) | 0 (0.0%) |
| 65 to 74 Years | 16 (14.4%) | 0 (0.0%) |
| 75 Years and over | 0 (0.0%) | 0 (0.0%) |
| Total | 646 (62.3%) | 17 (2.6%) |
Employment Status by Educational Attainment in Kingsley
According to labor force statistics for Kingsley, 78.3% of individuals (595) out of the total population between 25 and 64 years of age (760) are in the labor force, with 2.9% or 17 of them being unemployed. The group with the highest labor force participation rate are those with the educational attainment of college / associate degree, with 84.3% or 241 individuals in the labor force. Within the labor force, individuals with less than high school education have the highest percentage of unemployment, with 43.6% or 17 of them being unemployed.
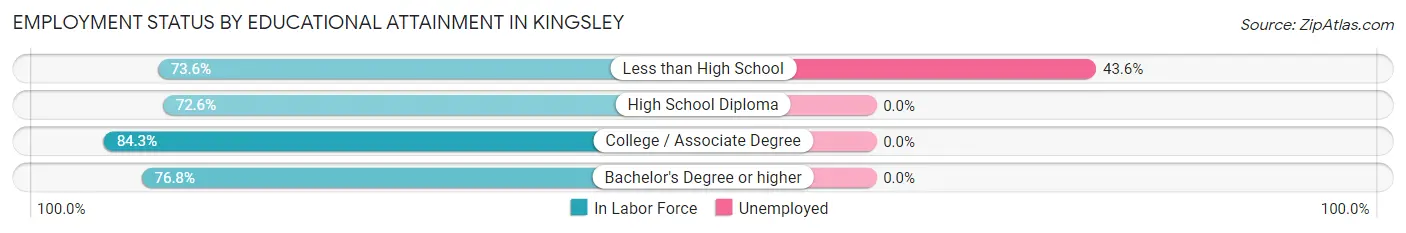
| Educational Attainment | In Labor Force | Unemployed |
| Less than High School | 39 (73.6%) | 23 (43.6%) |
| High School Diploma | 146 (72.6%) | 0 (0.0%) |
| College / Associate Degree | 241 (84.3%) | 0 (0.0%) |
| Bachelor's Degree or higher | 169 (76.8%) | 0 (0.0%) |
| Total | 595 (78.3%) | 22 (2.9%) |
Employment Occupations by Sex in Kingsley
Management, Business, Science and Arts Occupations
The most common Management, Business, Science and Arts occupations in Kingsley are Management (80 | 12.7%), Community & Social Service (44 | 7.0%), Computers, Engineering & Science (42 | 6.7%), Education Instruction & Library (33 | 5.2%), and Computers & Mathematics (23 | 3.7%).
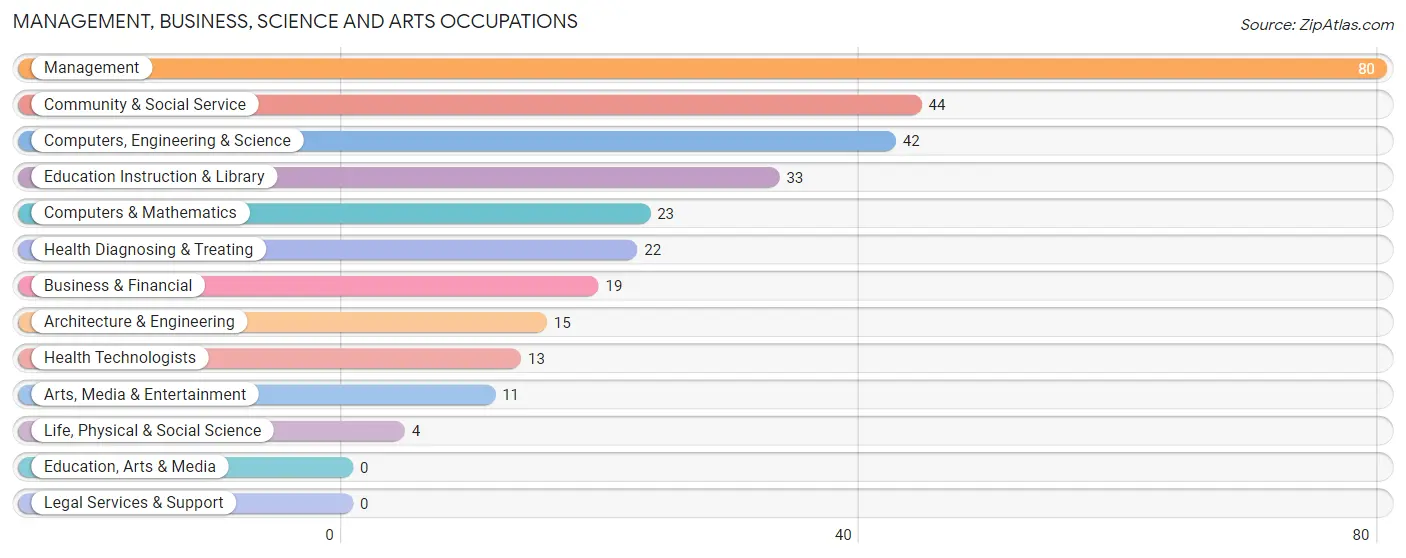
Management, Business, Science and Arts Occupations by Sex
Within the Management, Business, Science and Arts occupations in Kingsley, the most male-oriented occupations are Computers & Mathematics (100.0%), Life, Physical & Social Science (100.0%), and Computers, Engineering & Science (88.1%), while the most female-oriented occupations are Health Diagnosing & Treating (100.0%), Health Technologists (100.0%), and Business & Financial (89.5%).
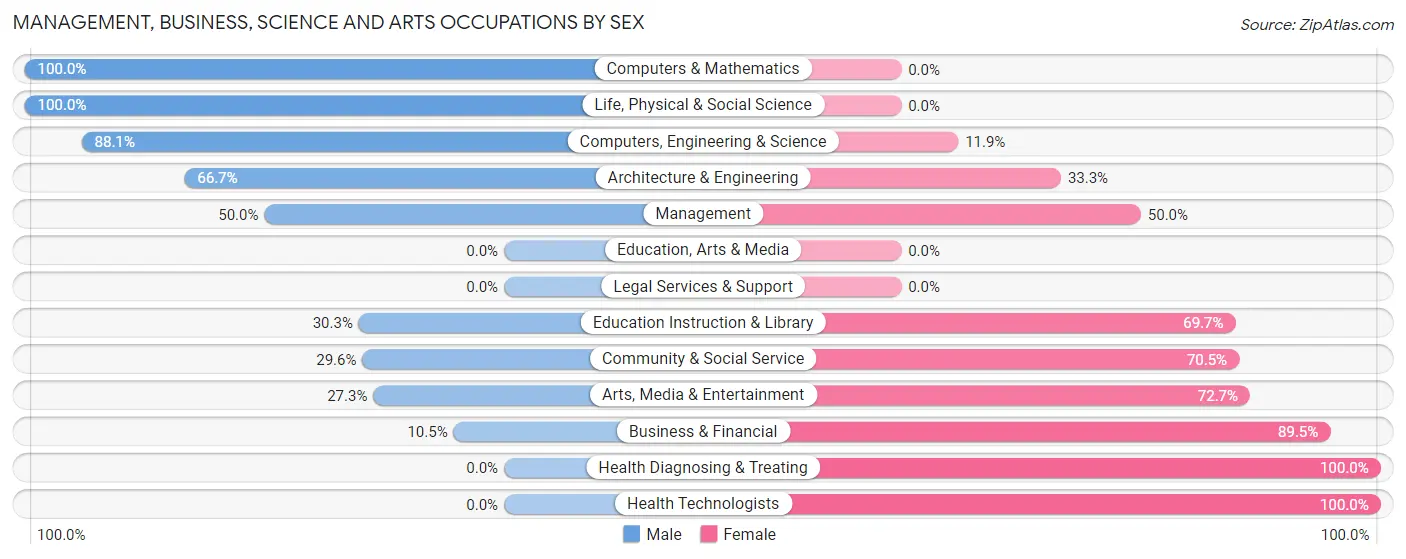
| Occupation | Male | Female |
| Management | 40 (50.0%) | 40 (50.0%) |
| Business & Financial | 2 (10.5%) | 17 (89.5%) |
| Computers, Engineering & Science | 37 (88.1%) | 5 (11.9%) |
| Computers & Mathematics | 23 (100.0%) | 0 (0.0%) |
| Architecture & Engineering | 10 (66.7%) | 5 (33.3%) |
| Life, Physical & Social Science | 4 (100.0%) | 0 (0.0%) |
| Community & Social Service | 13 (29.5%) | 31 (70.5%) |
| Education, Arts & Media | 0 (0.0%) | 0 (0.0%) |
| Legal Services & Support | 0 (0.0%) | 0 (0.0%) |
| Education Instruction & Library | 10 (30.3%) | 23 (69.7%) |
| Arts, Media & Entertainment | 3 (27.3%) | 8 (72.7%) |
| Health Diagnosing & Treating | 0 (0.0%) | 22 (100.0%) |
| Health Technologists | 0 (0.0%) | 13 (100.0%) |
| Total (Category) | 92 (44.4%) | 115 (55.6%) |
| Total (Overall) | 355 (56.4%) | 274 (43.6%) |
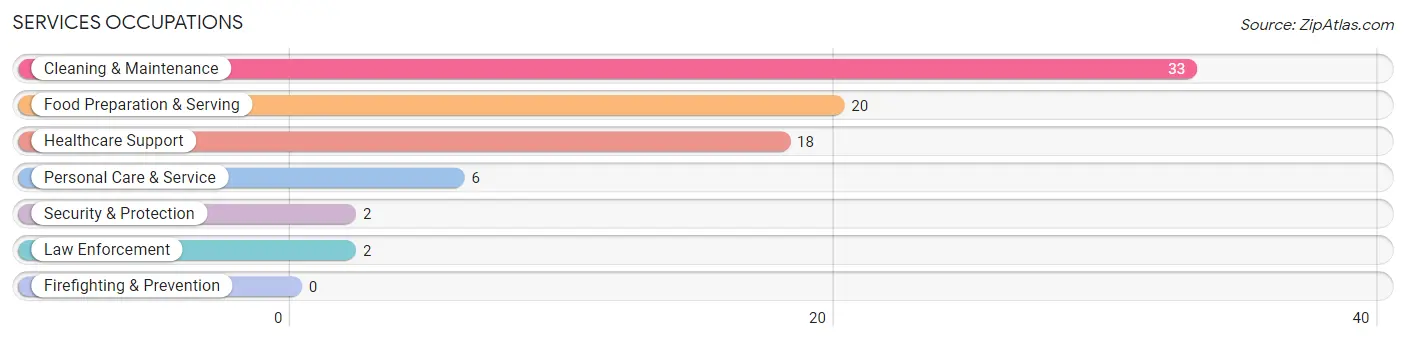
Services Occupations
The most common Services occupations in Kingsley are Cleaning & Maintenance (33 | 5.2%), Food Preparation & Serving (20 | 3.2%), Healthcare Support (18 | 2.9%), Personal Care & Service (6 | 0.9%), and Security & Protection (2 | 0.3%).
Services Occupations by Sex
Within the Services occupations in Kingsley, the most male-oriented occupations are Security & Protection (100.0%), Law Enforcement (100.0%), and Cleaning & Maintenance (51.5%), while the most female-oriented occupations are Healthcare Support (100.0%), Food Preparation & Serving (100.0%), and Personal Care & Service (50.0%).
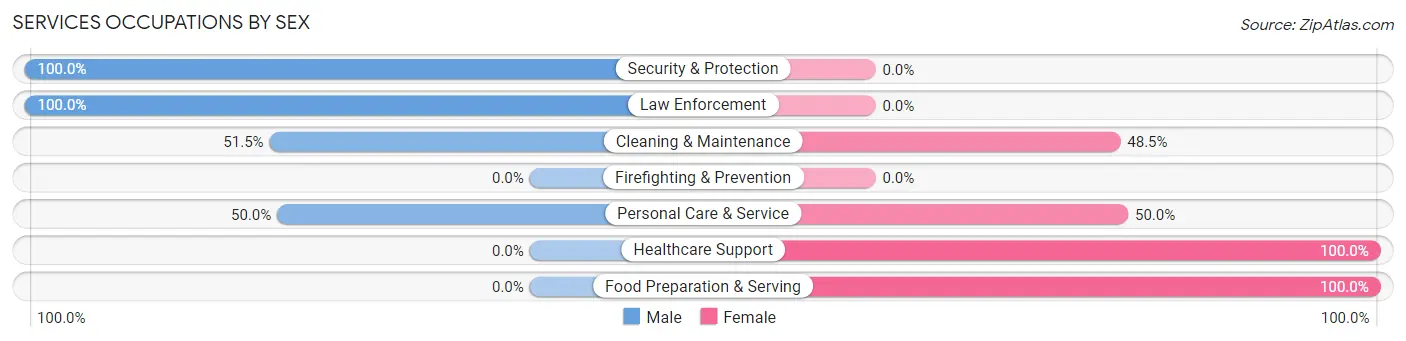
| Occupation | Male | Female |
| Healthcare Support | 0 (0.0%) | 18 (100.0%) |
| Security & Protection | 2 (100.0%) | 0 (0.0%) |
| Firefighting & Prevention | 0 (0.0%) | 0 (0.0%) |
| Law Enforcement | 2 (100.0%) | 0 (0.0%) |
| Food Preparation & Serving | 0 (0.0%) | 20 (100.0%) |
| Cleaning & Maintenance | 17 (51.5%) | 16 (48.5%) |
| Personal Care & Service | 3 (50.0%) | 3 (50.0%) |
| Total (Category) | 22 (27.9%) | 57 (72.2%) |
| Total (Overall) | 355 (56.4%) | 274 (43.6%) |
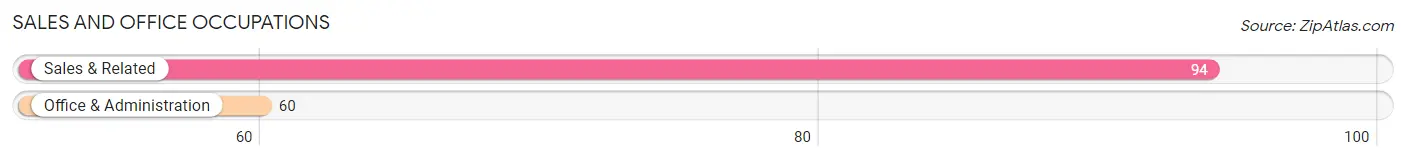
Sales and Office Occupations
The most common Sales and Office occupations in Kingsley are Sales & Related (94 | 14.9%), and Office & Administration (60 | 9.5%).
Sales and Office Occupations by Sex
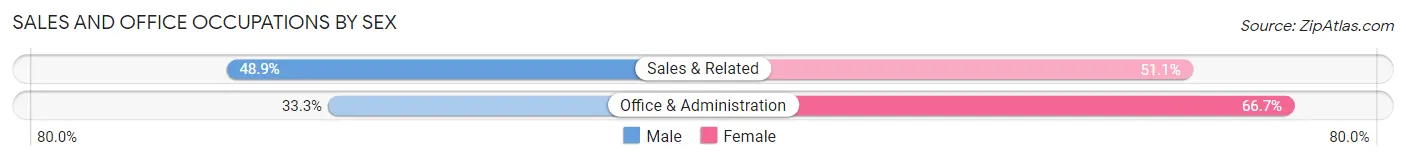
| Occupation | Male | Female |
| Sales & Related | 46 (48.9%) | 48 (51.1%) |
| Office & Administration | 20 (33.3%) | 40 (66.7%) |
| Total (Category) | 66 (42.9%) | 88 (57.1%) |
| Total (Overall) | 355 (56.4%) | 274 (43.6%) |
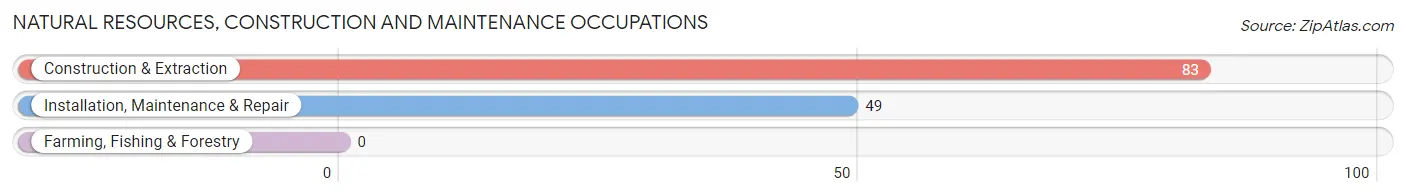
Natural Resources, Construction and Maintenance Occupations
The most common Natural Resources, Construction and Maintenance occupations in Kingsley are Construction & Extraction (83 | 13.2%), and Installation, Maintenance & Repair (49 | 7.8%).
Natural Resources, Construction and Maintenance Occupations by Sex
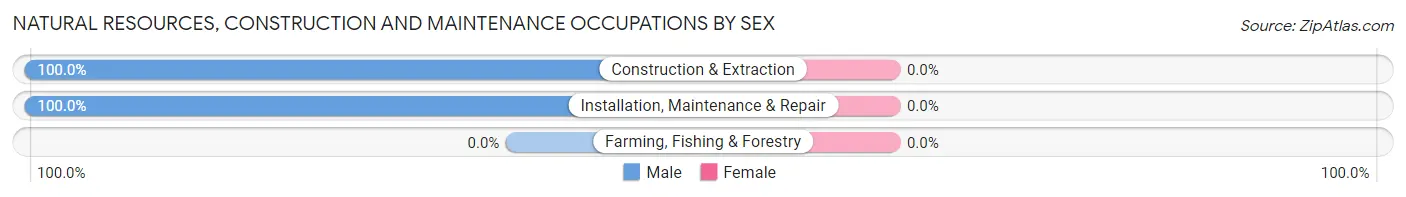
| Occupation | Male | Female |
| Farming, Fishing & Forestry | 0 (0.0%) | 0 (0.0%) |
| Construction & Extraction | 83 (100.0%) | 0 (0.0%) |
| Installation, Maintenance & Repair | 49 (100.0%) | 0 (0.0%) |
| Total (Category) | 132 (100.0%) | 0 (0.0%) |
| Total (Overall) | 355 (56.4%) | 274 (43.6%) |
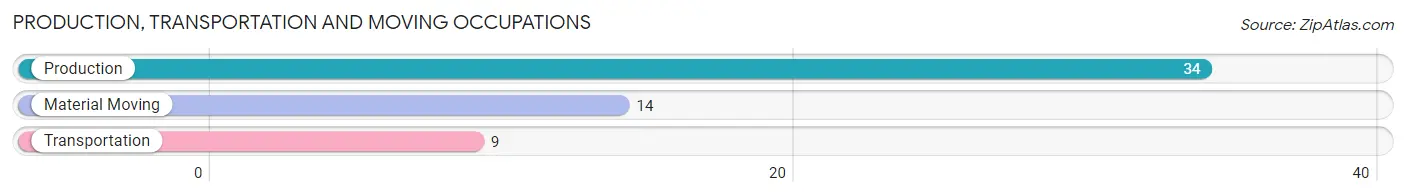
Production, Transportation and Moving Occupations
The most common Production, Transportation and Moving occupations in Kingsley are Production (34 | 5.4%), Material Moving (14 | 2.2%), and Transportation (9 | 1.4%).
Production, Transportation and Moving Occupations by Sex
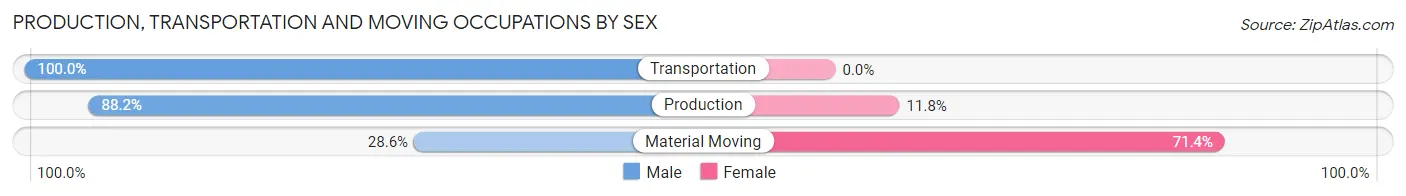
| Occupation | Male | Female |
| Production | 30 (88.2%) | 4 (11.8%) |
| Transportation | 9 (100.0%) | 0 (0.0%) |
| Material Moving | 4 (28.6%) | 10 (71.4%) |
| Total (Category) | 43 (75.4%) | 14 (24.6%) |
| Total (Overall) | 355 (56.4%) | 274 (43.6%) |
Employment Industries by Sex in Kingsley
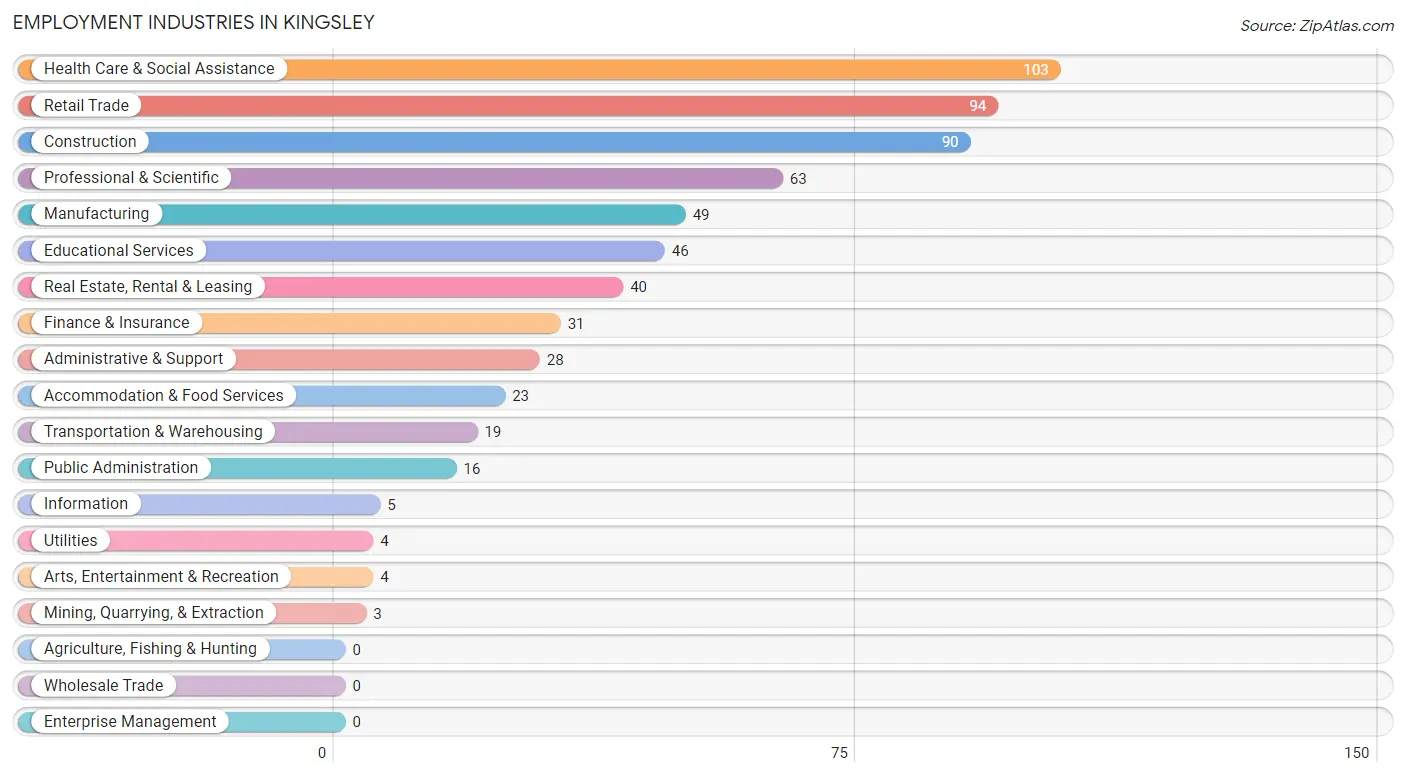
Employment Industries in Kingsley
The major employment industries in Kingsley include Health Care & Social Assistance (103 | 16.4%), Retail Trade (94 | 14.9%), Construction (90 | 14.3%), Professional & Scientific (63 | 10.0%), and Manufacturing (49 | 7.8%).
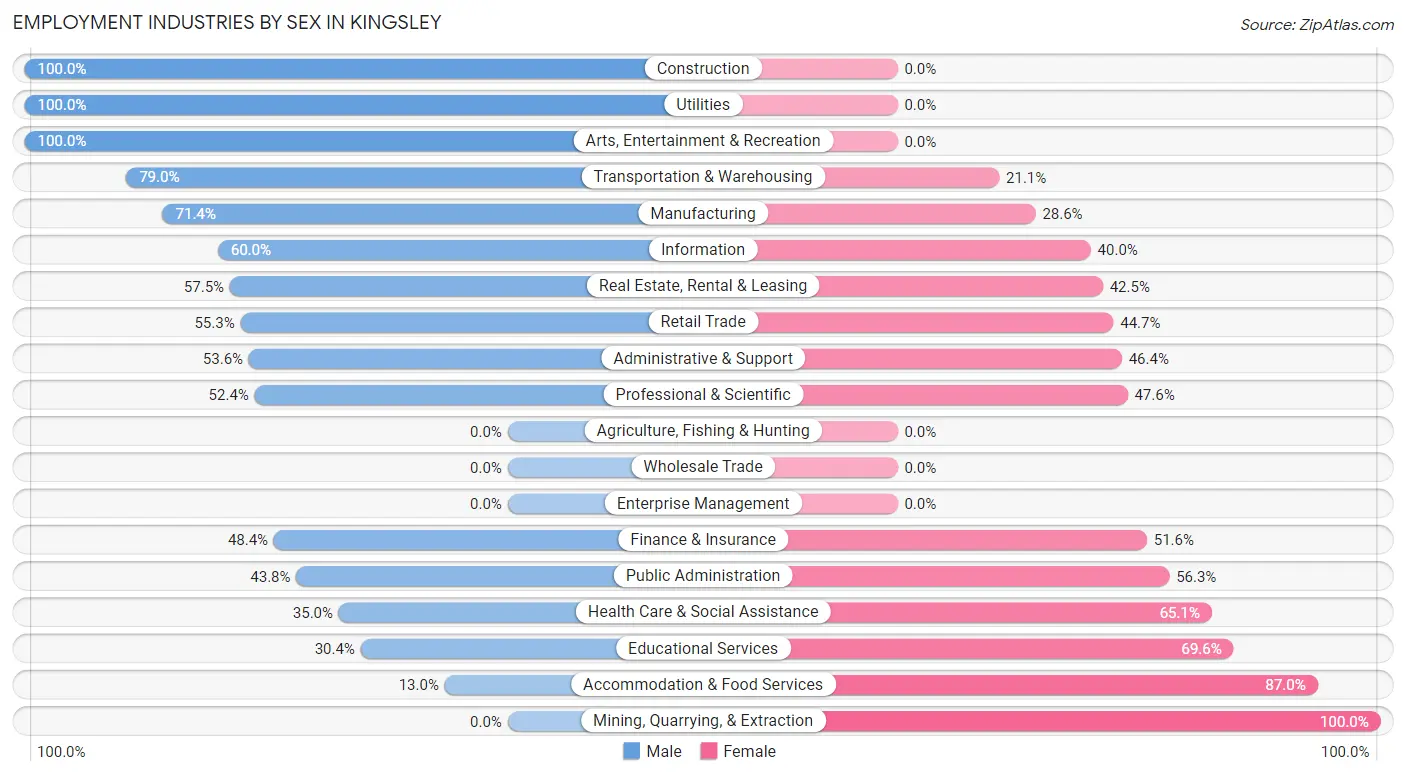
Employment Industries by Sex in Kingsley
The Kingsley industries that see more men than women are Construction (100.0%), Utilities (100.0%), and Arts, Entertainment & Recreation (100.0%), whereas the industries that tend to have a higher number of women are Mining, Quarrying, & Extraction (100.0%), Accommodation & Food Services (87.0%), and Educational Services (69.6%).
| Industry | Male | Female |
| Agriculture, Fishing & Hunting | 0 (0.0%) | 0 (0.0%) |
| Mining, Quarrying, & Extraction | 0 (0.0%) | 3 (100.0%) |
| Construction | 90 (100.0%) | 0 (0.0%) |
| Manufacturing | 35 (71.4%) | 14 (28.6%) |
| Wholesale Trade | 0 (0.0%) | 0 (0.0%) |
| Retail Trade | 52 (55.3%) | 42 (44.7%) |
| Transportation & Warehousing | 15 (78.9%) | 4 (21.0%) |
| Utilities | 4 (100.0%) | 0 (0.0%) |
| Information | 3 (60.0%) | 2 (40.0%) |
| Finance & Insurance | 15 (48.4%) | 16 (51.6%) |
| Real Estate, Rental & Leasing | 23 (57.5%) | 17 (42.5%) |
| Professional & Scientific | 33 (52.4%) | 30 (47.6%) |
| Enterprise Management | 0 (0.0%) | 0 (0.0%) |
| Administrative & Support | 15 (53.6%) | 13 (46.4%) |
| Educational Services | 14 (30.4%) | 32 (69.6%) |
| Health Care & Social Assistance | 36 (34.9%) | 67 (65.0%) |
| Arts, Entertainment & Recreation | 4 (100.0%) | 0 (0.0%) |
| Accommodation & Food Services | 3 (13.0%) | 20 (87.0%) |
| Public Administration | 7 (43.8%) | 9 (56.2%) |
| Total | 355 (56.4%) | 274 (43.6%) |
Education in Kingsley
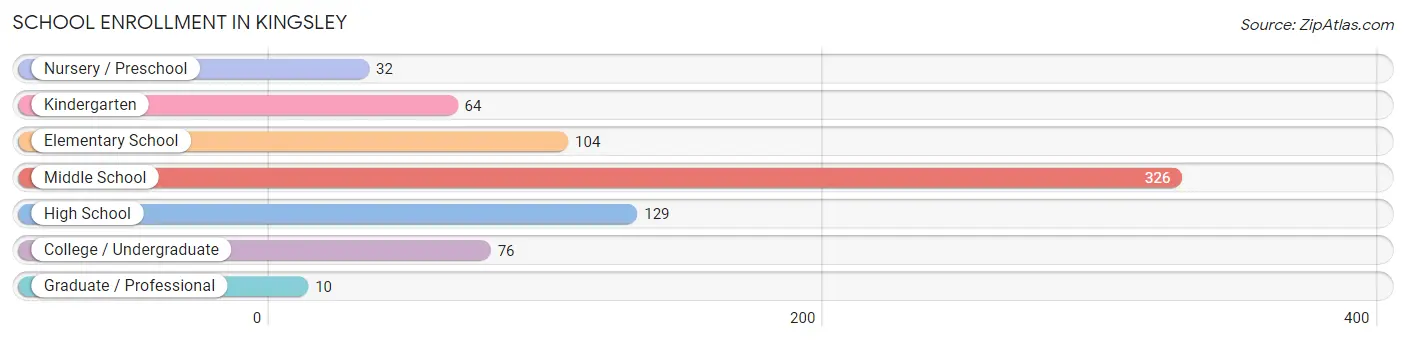
School Enrollment in Kingsley
The most common levels of schooling among the 741 students in Kingsley are middle school (326 | 44.0%), high school (129 | 17.4%), and elementary school (104 | 14.0%).
| School Level | # Students | % Students |
| Nursery / Preschool | 32 | 4.3% |
| Kindergarten | 64 | 8.6% |
| Elementary School | 104 | 14.0% |
| Middle School | 326 | 44.0% |
| High School | 129 | 17.4% |
| College / Undergraduate | 76 | 10.3% |
| Graduate / Professional | 10 | 1.3% |
| Total | 741 | 100.0% |
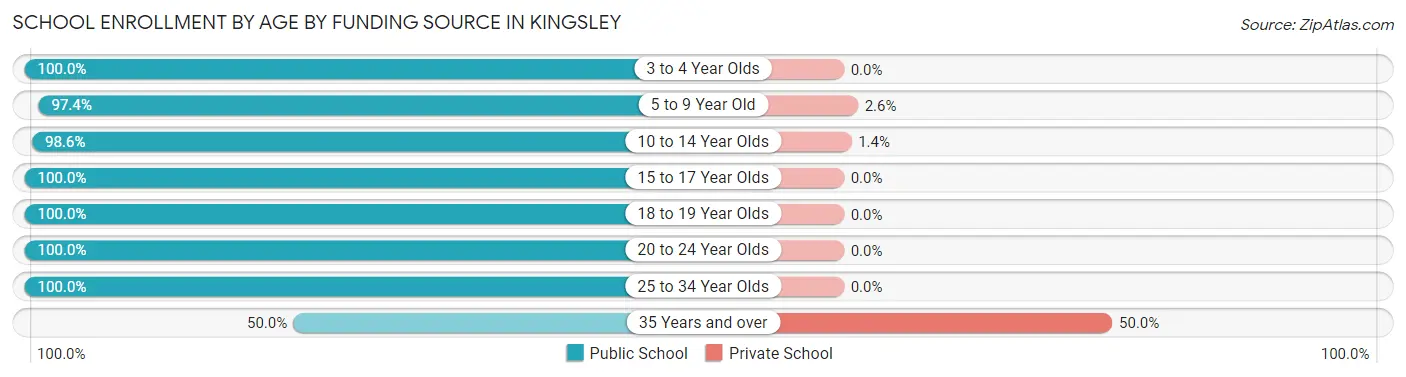
School Enrollment by Age by Funding Source in Kingsley
Out of a total of 741 students who are enrolled in schools in Kingsley, 18 (2.4%) attend a private institution, while the remaining 723 (97.6%) are enrolled in public schools. The age group of 35 years and over has the highest likelihood of being enrolled in private schools, with 9 (50.0% in the age bracket) enrolled. Conversely, the age group of 3 to 4 year olds has the lowest likelihood of being enrolled in a private school, with 27 (100.0% in the age bracket) attending a public institution.
| Age Bracket | Public School | Private School |
| 3 to 4 Year Olds | 27 (100.0%) | 0 (0.0%) |
| 5 to 9 Year Old | 149 (97.4%) | 4 (2.6%) |
| 10 to 14 Year Olds | 351 (98.6%) | 5 (1.4%) |
| 15 to 17 Year Olds | 119 (100.0%) | 0 (0.0%) |
| 18 to 19 Year Olds | 5 (100.0%) | 0 (0.0%) |
| 20 to 24 Year Olds | 14 (100.0%) | 0 (0.0%) |
| 25 to 34 Year Olds | 49 (100.0%) | 0 (0.0%) |
| 35 Years and over | 9 (50.0%) | 9 (50.0%) |
| Total | 723 (97.6%) | 18 (2.4%) |
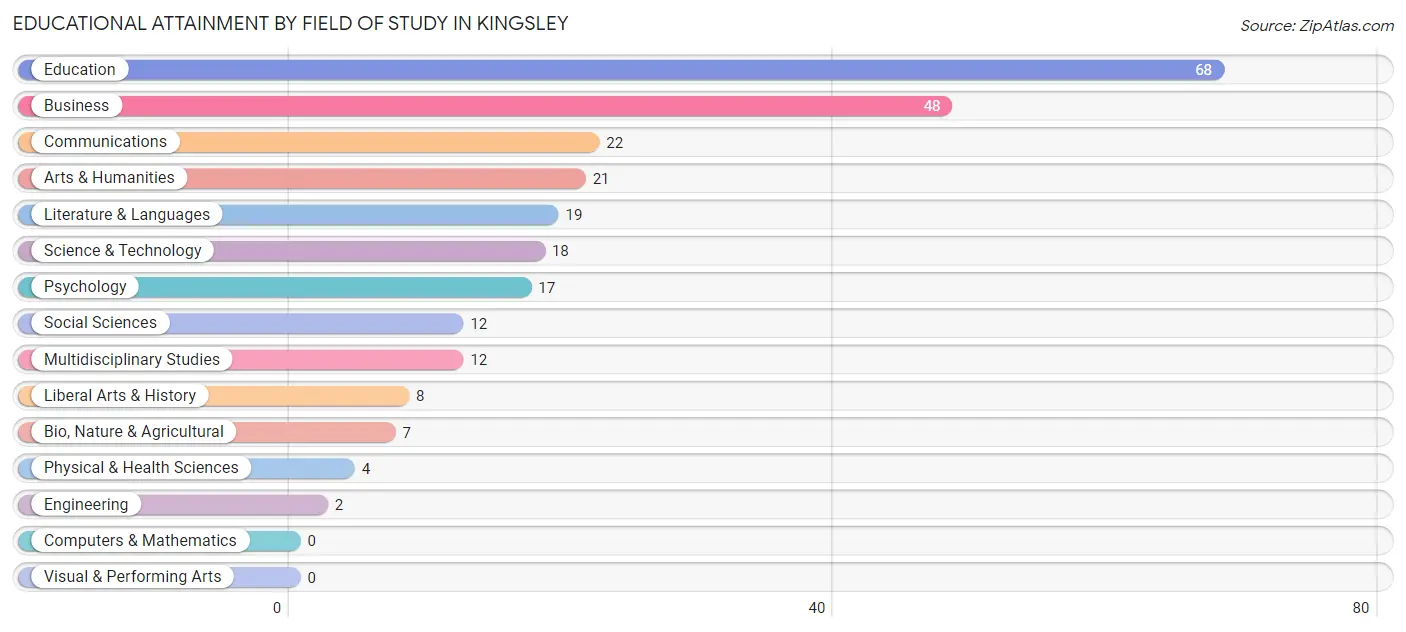
Educational Attainment by Field of Study in Kingsley
Education (68 | 26.4%), business (48 | 18.6%), communications (22 | 8.5%), arts & humanities (21 | 8.1%), and literature & languages (19 | 7.4%) are the most common fields of study among 258 individuals in Kingsley who have obtained a bachelor's degree or higher.
| Field of Study | # Graduates | % Graduates |
| Computers & Mathematics | 0 | 0.0% |
| Bio, Nature & Agricultural | 7 | 2.7% |
| Physical & Health Sciences | 4 | 1.5% |
| Psychology | 17 | 6.6% |
| Social Sciences | 12 | 4.6% |
| Engineering | 2 | 0.8% |
| Multidisciplinary Studies | 12 | 4.6% |
| Science & Technology | 18 | 7.0% |
| Business | 48 | 18.6% |
| Education | 68 | 26.4% |
| Literature & Languages | 19 | 7.4% |
| Liberal Arts & History | 8 | 3.1% |
| Visual & Performing Arts | 0 | 0.0% |
| Communications | 22 | 8.5% |
| Arts & Humanities | 21 | 8.1% |
| Total | 258 | 100.0% |
Transportation & Commute in Kingsley
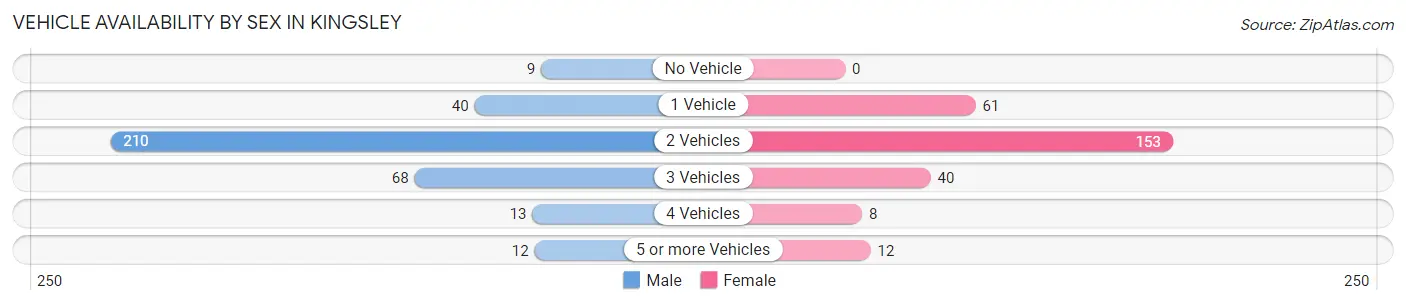
Vehicle Availability by Sex in Kingsley
The most prevalent vehicle ownership categories in Kingsley are males with 2 vehicles (210, accounting for 59.7%) and females with 2 vehicles (153, making up 76.6%).
| Vehicles Available | Male | Female |
| No Vehicle | 9 (2.6%) | 0 (0.0%) |
| 1 Vehicle | 40 (11.4%) | 61 (22.3%) |
| 2 Vehicles | 210 (59.7%) | 153 (55.8%) |
| 3 Vehicles | 68 (19.3%) | 40 (14.6%) |
| 4 Vehicles | 13 (3.7%) | 8 (2.9%) |
| 5 or more Vehicles | 12 (3.4%) | 12 (4.4%) |
| Total | 352 (100.0%) | 274 (100.0%) |
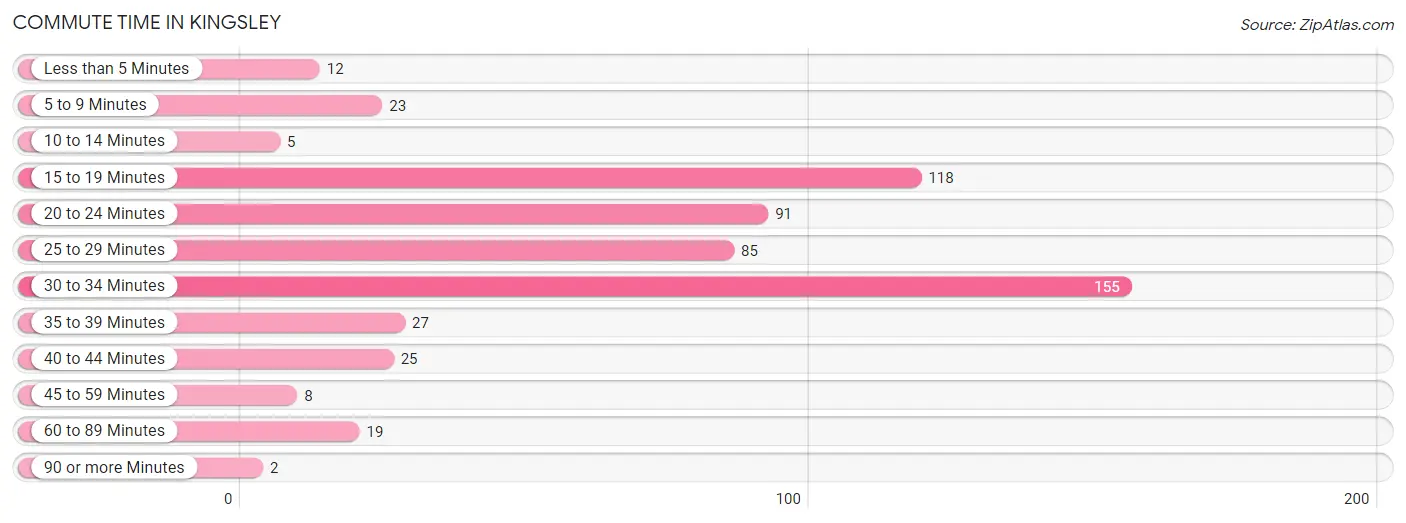
Commute Time in Kingsley
The most frequently occuring commute durations in Kingsley are 30 to 34 minutes (155 commuters, 27.2%), 15 to 19 minutes (118 commuters, 20.7%), and 20 to 24 minutes (91 commuters, 16.0%).
| Commute Time | # Commuters | % Commuters |
| Less than 5 Minutes | 12 | 2.1% |
| 5 to 9 Minutes | 23 | 4.0% |
| 10 to 14 Minutes | 5 | 0.9% |
| 15 to 19 Minutes | 118 | 20.7% |
| 20 to 24 Minutes | 91 | 16.0% |
| 25 to 29 Minutes | 85 | 14.9% |
| 30 to 34 Minutes | 155 | 27.2% |
| 35 to 39 Minutes | 27 | 4.7% |
| 40 to 44 Minutes | 25 | 4.4% |
| 45 to 59 Minutes | 8 | 1.4% |
| 60 to 89 Minutes | 19 | 3.3% |
| 90 or more Minutes | 2 | 0.4% |
Commute Time by Sex in Kingsley
The most common commute times in Kingsley are 15 to 19 minutes (87 commuters, 25.4%) for males and 30 to 34 minutes (70 commuters, 30.7%) for females.
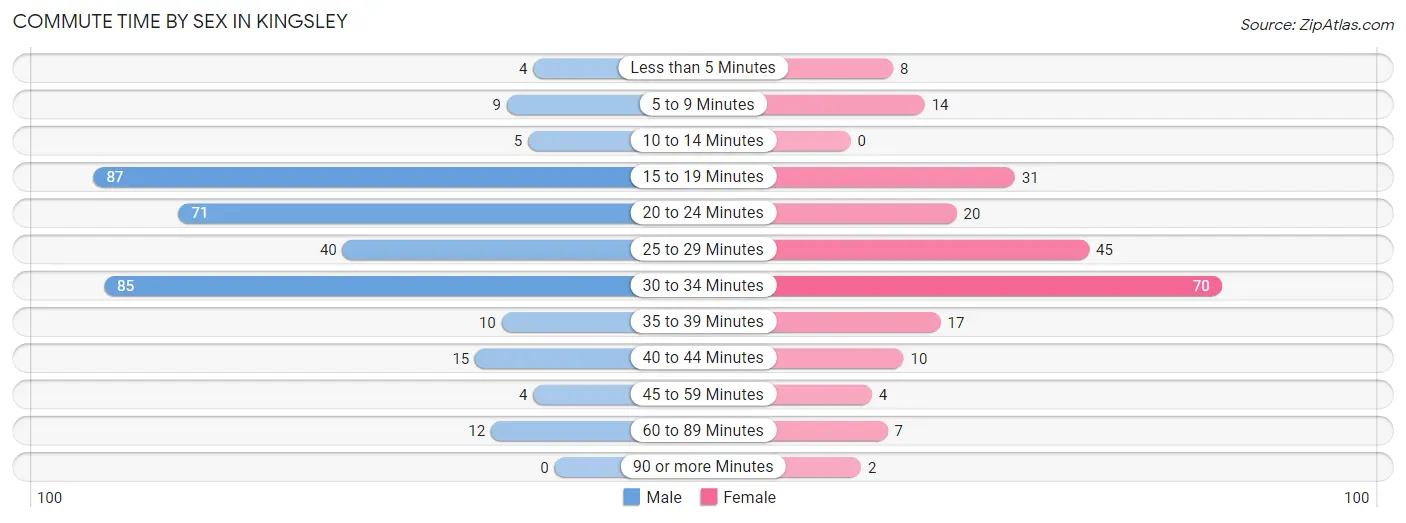
| Commute Time | Male | Female |
| Less than 5 Minutes | 4 (1.2%) | 8 (3.5%) |
| 5 to 9 Minutes | 9 (2.6%) | 14 (6.1%) |
| 10 to 14 Minutes | 5 (1.5%) | 0 (0.0%) |
| 15 to 19 Minutes | 87 (25.4%) | 31 (13.6%) |
| 20 to 24 Minutes | 71 (20.8%) | 20 (8.8%) |
| 25 to 29 Minutes | 40 (11.7%) | 45 (19.7%) |
| 30 to 34 Minutes | 85 (24.8%) | 70 (30.7%) |
| 35 to 39 Minutes | 10 (2.9%) | 17 (7.5%) |
| 40 to 44 Minutes | 15 (4.4%) | 10 (4.4%) |
| 45 to 59 Minutes | 4 (1.2%) | 4 (1.8%) |
| 60 to 89 Minutes | 12 (3.5%) | 7 (3.1%) |
| 90 or more Minutes | 0 (0.0%) | 2 (0.9%) |
Time of Departure to Work by Sex in Kingsley
The most frequent times of departure to work in Kingsley are 7:30 AM to 7:59 AM (71, 20.8%) for males and 7:00 AM to 7:29 AM (77, 33.8%) for females.
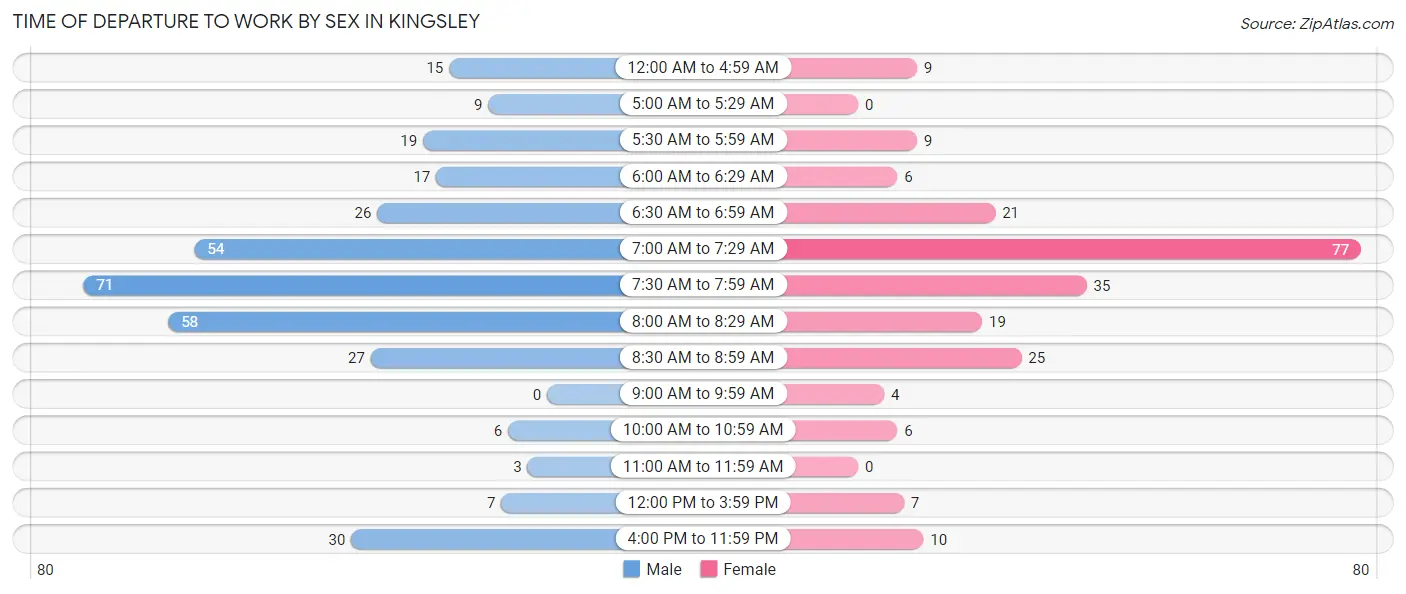
| Time of Departure | Male | Female |
| 12:00 AM to 4:59 AM | 15 (4.4%) | 9 (4.0%) |
| 5:00 AM to 5:29 AM | 9 (2.6%) | 0 (0.0%) |
| 5:30 AM to 5:59 AM | 19 (5.6%) | 9 (4.0%) |
| 6:00 AM to 6:29 AM | 17 (5.0%) | 6 (2.6%) |
| 6:30 AM to 6:59 AM | 26 (7.6%) | 21 (9.2%) |
| 7:00 AM to 7:29 AM | 54 (15.8%) | 77 (33.8%) |
| 7:30 AM to 7:59 AM | 71 (20.8%) | 35 (15.3%) |
| 8:00 AM to 8:29 AM | 58 (17.0%) | 19 (8.3%) |
| 8:30 AM to 8:59 AM | 27 (7.9%) | 25 (11.0%) |
| 9:00 AM to 9:59 AM | 0 (0.0%) | 4 (1.8%) |
| 10:00 AM to 10:59 AM | 6 (1.8%) | 6 (2.6%) |
| 11:00 AM to 11:59 AM | 3 (0.9%) | 0 (0.0%) |
| 12:00 PM to 3:59 PM | 7 (2.1%) | 7 (3.1%) |
| 4:00 PM to 11:59 PM | 30 (8.8%) | 10 (4.4%) |
| Total | 342 (100.0%) | 228 (100.0%) |
Housing Occupancy in Kingsley
Occupancy by Ownership in Kingsley
Of the total 514 dwellings in Kingsley, owner-occupied units account for 364 (70.8%), while renter-occupied units make up 150 (29.2%).
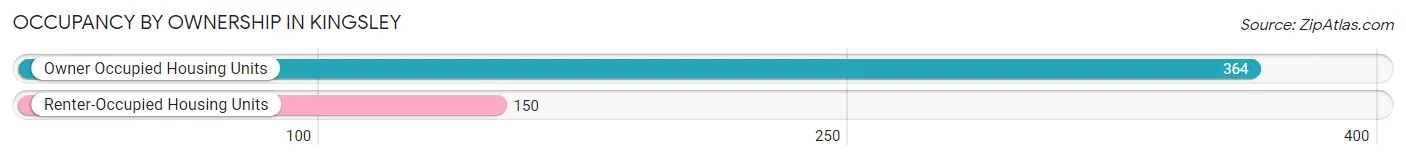
| Occupancy | # Housing Units | % Housing Units |
| Owner Occupied Housing Units | 364 | 70.8% |
| Renter-Occupied Housing Units | 150 | 29.2% |
| Total Occupied Housing Units | 514 | 100.0% |
Occupancy by Household Size in Kingsley
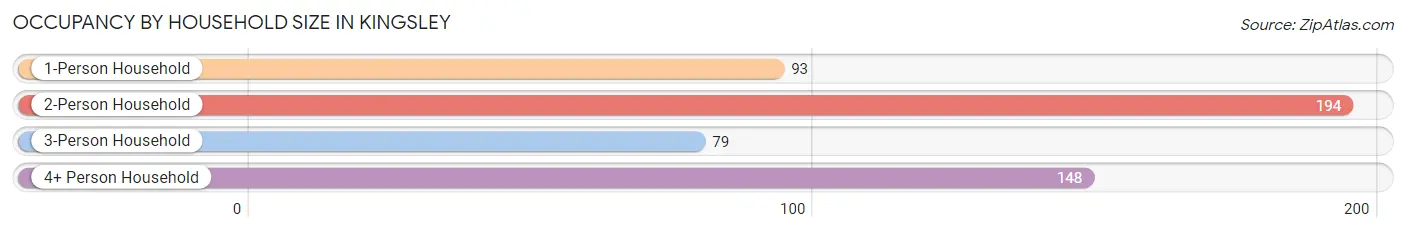
| Household Size | # Housing Units | % Housing Units |
| 1-Person Household | 93 | 18.1% |
| 2-Person Household | 194 | 37.7% |
| 3-Person Household | 79 | 15.4% |
| 4+ Person Household | 148 | 28.8% |
| Total Housing Units | 514 | 100.0% |
Occupancy by Ownership by Household Size in Kingsley
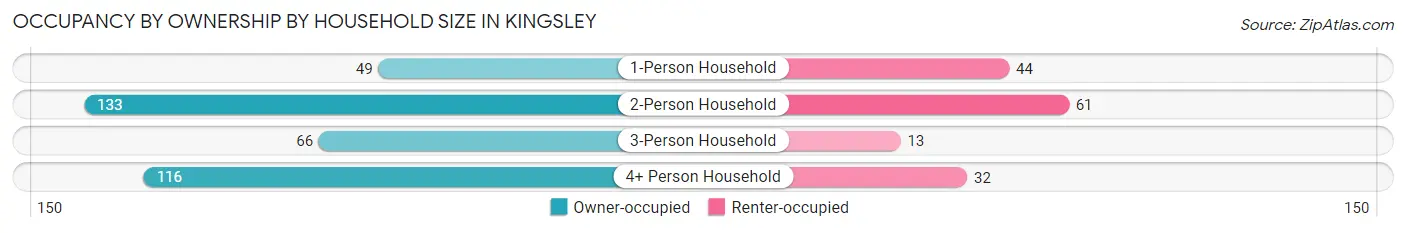
| Household Size | Owner-occupied | Renter-occupied |
| 1-Person Household | 49 (52.7%) | 44 (47.3%) |
| 2-Person Household | 133 (68.6%) | 61 (31.4%) |
| 3-Person Household | 66 (83.5%) | 13 (16.5%) |
| 4+ Person Household | 116 (78.4%) | 32 (21.6%) |
| Total Housing Units | 364 (70.8%) | 150 (29.2%) |
Occupancy by Educational Attainment in Kingsley
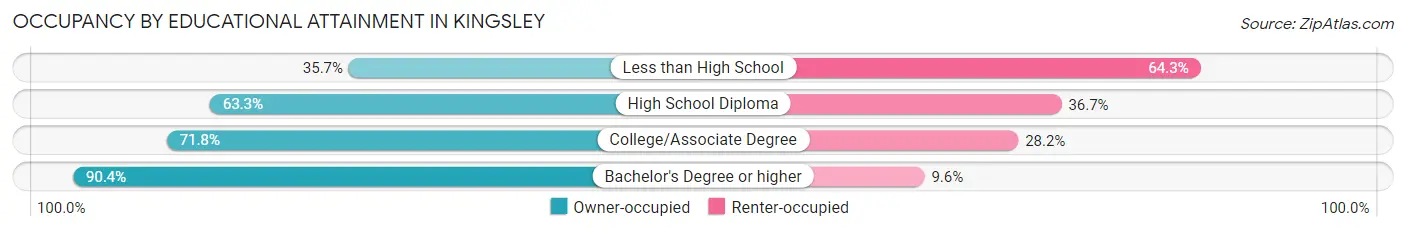
| Household Size | Owner-occupied | Renter-occupied |
| Less than High School | 10 (35.7%) | 18 (64.3%) |
| High School Diploma | 93 (63.3%) | 54 (36.7%) |
| College/Associate Degree | 176 (71.8%) | 69 (28.2%) |
| Bachelor's Degree or higher | 85 (90.4%) | 9 (9.6%) |
Occupancy by Age of Householder in Kingsley
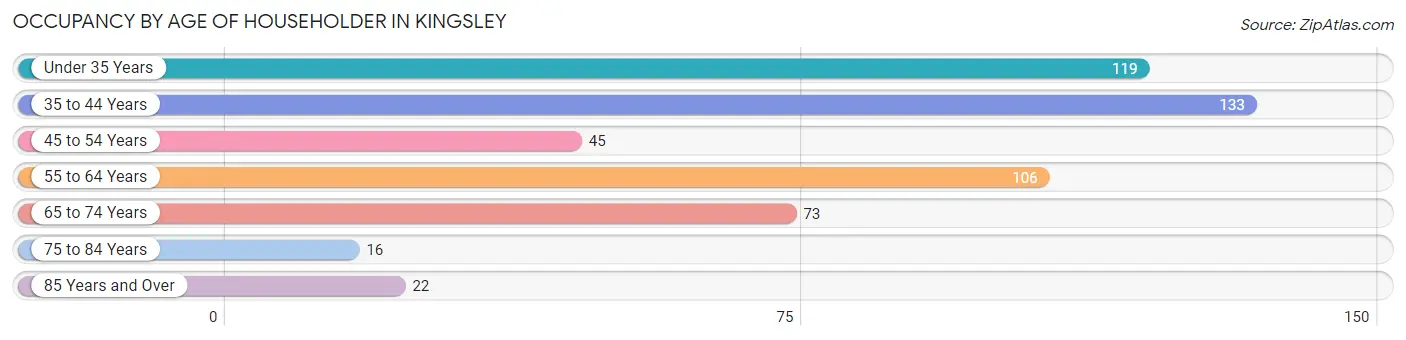
| Age Bracket | # Households | % Households |
| Under 35 Years | 119 | 23.2% |
| 35 to 44 Years | 133 | 25.9% |
| 45 to 54 Years | 45 | 8.7% |
| 55 to 64 Years | 106 | 20.6% |
| 65 to 74 Years | 73 | 14.2% |
| 75 to 84 Years | 16 | 3.1% |
| 85 Years and Over | 22 | 4.3% |
| Total | 514 | 100.0% |
Housing Finances in Kingsley
Median Income by Occupancy in Kingsley
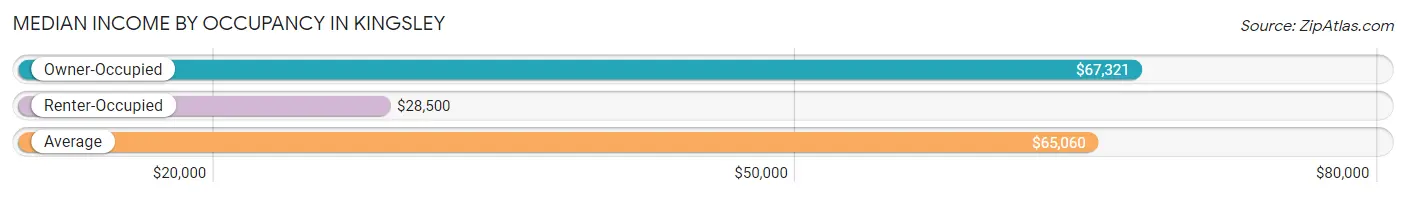
| Occupancy Type | # Households | Median Income |
| Owner-Occupied | 364 (70.8%) | $67,321 |
| Renter-Occupied | 150 (29.2%) | $28,500 |
| Average | 514 (100.0%) | $65,060 |
Occupancy by Householder Income Bracket in Kingsley
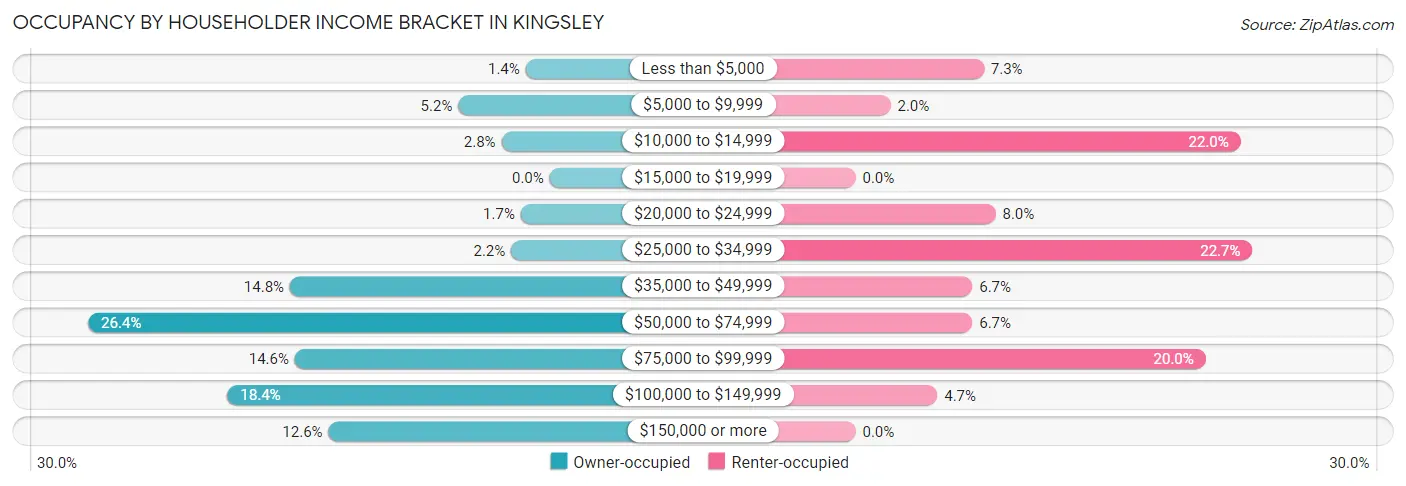
| Income Bracket | Owner-occupied | Renter-occupied |
| Less than $5,000 | 5 (1.4%) | 11 (7.3%) |
| $5,000 to $9,999 | 19 (5.2%) | 3 (2.0%) |
| $10,000 to $14,999 | 10 (2.8%) | 33 (22.0%) |
| $15,000 to $19,999 | 0 (0.0%) | 0 (0.0%) |
| $20,000 to $24,999 | 6 (1.7%) | 12 (8.0%) |
| $25,000 to $34,999 | 8 (2.2%) | 34 (22.7%) |
| $35,000 to $49,999 | 54 (14.8%) | 10 (6.7%) |
| $50,000 to $74,999 | 96 (26.4%) | 10 (6.7%) |
| $75,000 to $99,999 | 53 (14.6%) | 30 (20.0%) |
| $100,000 to $149,999 | 67 (18.4%) | 7 (4.7%) |
| $150,000 or more | 46 (12.6%) | 0 (0.0%) |
| Total | 364 (100.0%) | 150 (100.0%) |
Monthly Housing Cost Tiers in Kingsley
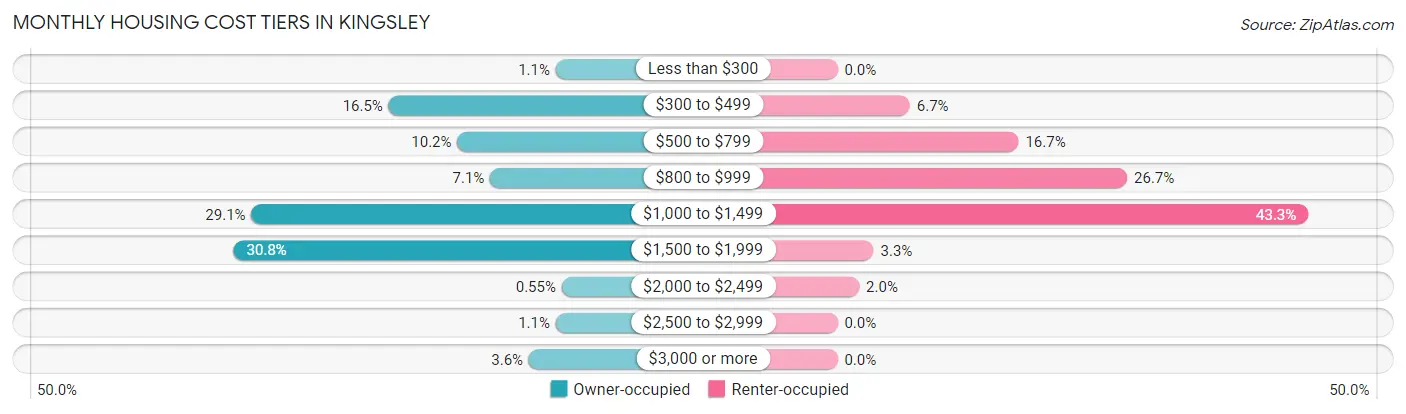
| Monthly Cost | Owner-occupied | Renter-occupied |
| Less than $300 | 4 (1.1%) | 0 (0.0%) |
| $300 to $499 | 60 (16.5%) | 10 (6.7%) |
| $500 to $799 | 37 (10.2%) | 25 (16.7%) |
| $800 to $999 | 26 (7.1%) | 40 (26.7%) |
| $1,000 to $1,499 | 106 (29.1%) | 65 (43.3%) |
| $1,500 to $1,999 | 112 (30.8%) | 5 (3.3%) |
| $2,000 to $2,499 | 2 (0.5%) | 3 (2.0%) |
| $2,500 to $2,999 | 4 (1.1%) | 0 (0.0%) |
| $3,000 or more | 13 (3.6%) | 0 (0.0%) |
| Total | 364 (100.0%) | 150 (100.0%) |
Physical Housing Characteristics in Kingsley
Housing Structures in Kingsley
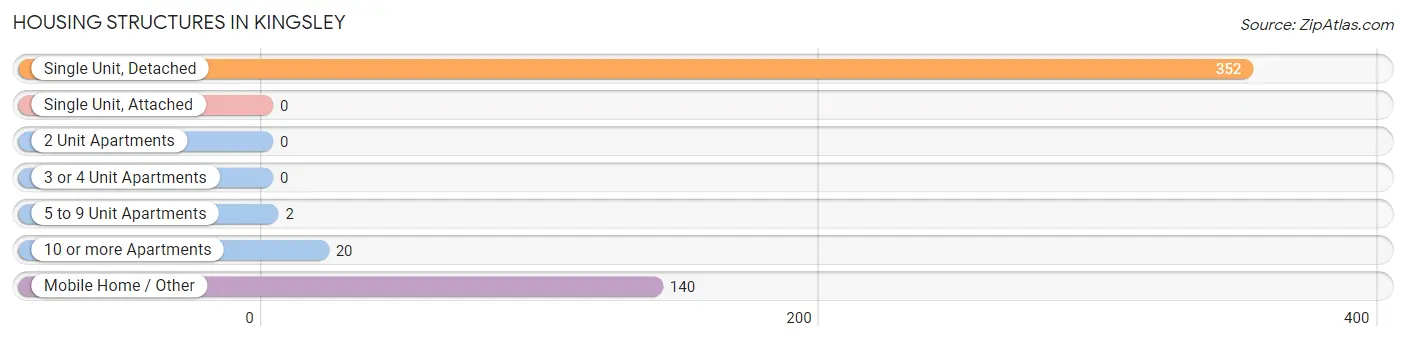
| Structure Type | # Housing Units | % Housing Units |
| Single Unit, Detached | 352 | 68.5% |
| Single Unit, Attached | 0 | 0.0% |
| 2 Unit Apartments | 0 | 0.0% |
| 3 or 4 Unit Apartments | 0 | 0.0% |
| 5 to 9 Unit Apartments | 2 | 0.4% |
| 10 or more Apartments | 20 | 3.9% |
| Mobile Home / Other | 140 | 27.2% |
| Total | 514 | 100.0% |
Housing Structures by Occupancy in Kingsley
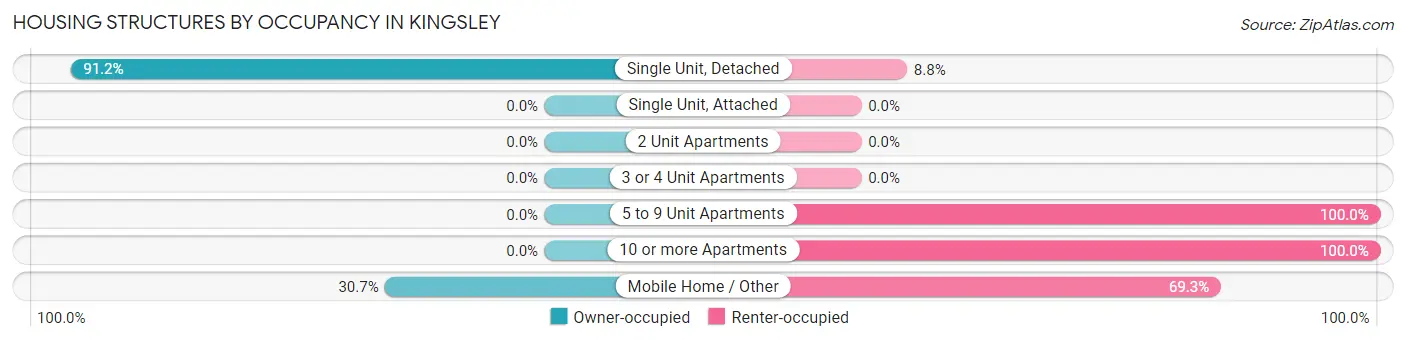
| Structure Type | Owner-occupied | Renter-occupied |
| Single Unit, Detached | 321 (91.2%) | 31 (8.8%) |
| Single Unit, Attached | 0 (0.0%) | 0 (0.0%) |
| 2 Unit Apartments | 0 (0.0%) | 0 (0.0%) |
| 3 or 4 Unit Apartments | 0 (0.0%) | 0 (0.0%) |
| 5 to 9 Unit Apartments | 0 (0.0%) | 2 (100.0%) |
| 10 or more Apartments | 0 (0.0%) | 20 (100.0%) |
| Mobile Home / Other | 43 (30.7%) | 97 (69.3%) |
| Total | 364 (70.8%) | 150 (29.2%) |
Housing Structures by Number of Rooms in Kingsley
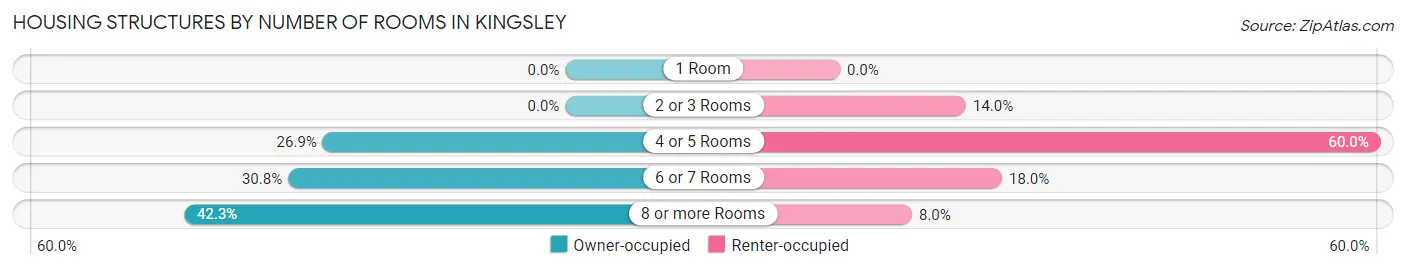
| Number of Rooms | Owner-occupied | Renter-occupied |
| 1 Room | 0 (0.0%) | 0 (0.0%) |
| 2 or 3 Rooms | 0 (0.0%) | 21 (14.0%) |
| 4 or 5 Rooms | 98 (26.9%) | 90 (60.0%) |
| 6 or 7 Rooms | 112 (30.8%) | 27 (18.0%) |
| 8 or more Rooms | 154 (42.3%) | 12 (8.0%) |
| Total | 364 (100.0%) | 150 (100.0%) |
Housing Structure by Heating Type in Kingsley
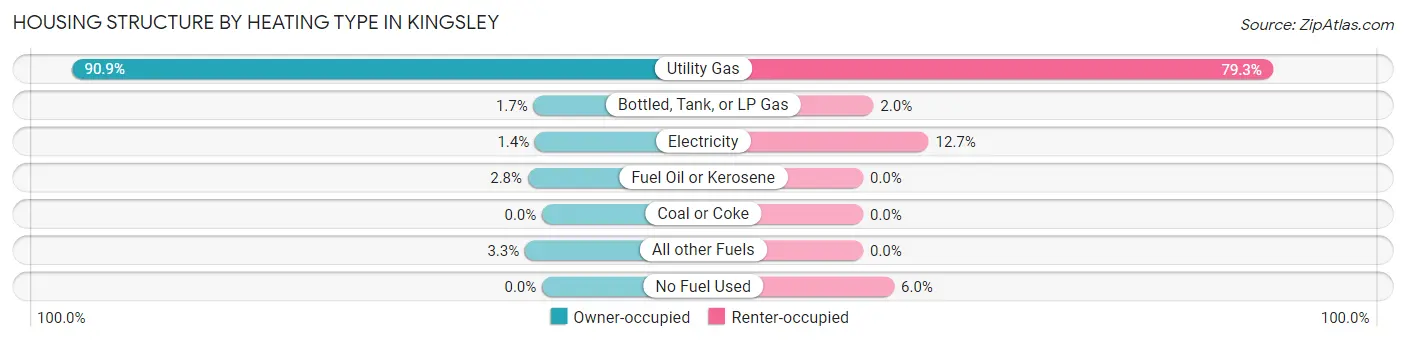
| Heating Type | Owner-occupied | Renter-occupied |
| Utility Gas | 331 (90.9%) | 119 (79.3%) |
| Bottled, Tank, or LP Gas | 6 (1.7%) | 3 (2.0%) |
| Electricity | 5 (1.4%) | 19 (12.7%) |
| Fuel Oil or Kerosene | 10 (2.8%) | 0 (0.0%) |
| Coal or Coke | 0 (0.0%) | 0 (0.0%) |
| All other Fuels | 12 (3.3%) | 0 (0.0%) |
| No Fuel Used | 0 (0.0%) | 9 (6.0%) |
| Total | 364 (100.0%) | 150 (100.0%) |
Household Vehicle Usage in Kingsley
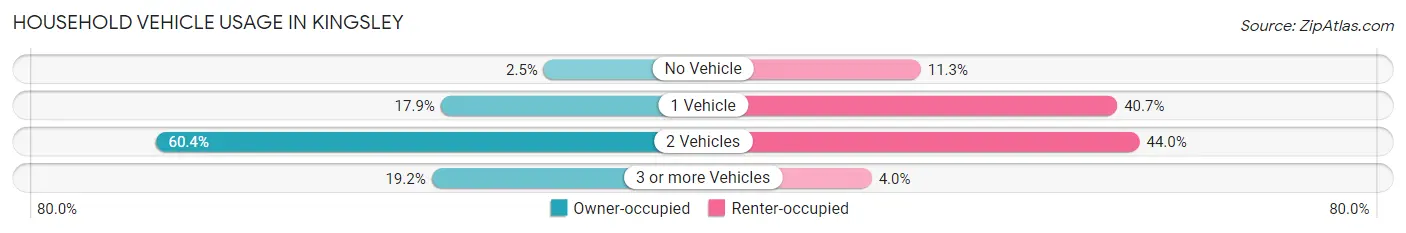
| Vehicles per Household | Owner-occupied | Renter-occupied |
| No Vehicle | 9 (2.5%) | 17 (11.3%) |
| 1 Vehicle | 65 (17.9%) | 61 (40.7%) |
| 2 Vehicles | 220 (60.4%) | 66 (44.0%) |
| 3 or more Vehicles | 70 (19.2%) | 6 (4.0%) |
| Total | 364 (100.0%) | 150 (100.0%) |
Real Estate & Mortgages in Kingsley
Real Estate and Mortgage Overview in Kingsley
| Characteristic | Without Mortgage | With Mortgage |
| Housing Units | 103 | 261 |
| Median Property Value | $176,100 | $250,500 |
| Median Household Income | $55,179 | $36 |
| Monthly Housing Costs | $450 | $13 |
| Real Estate Taxes | $2,605 | $11 |
Property Value by Mortgage Status in Kingsley
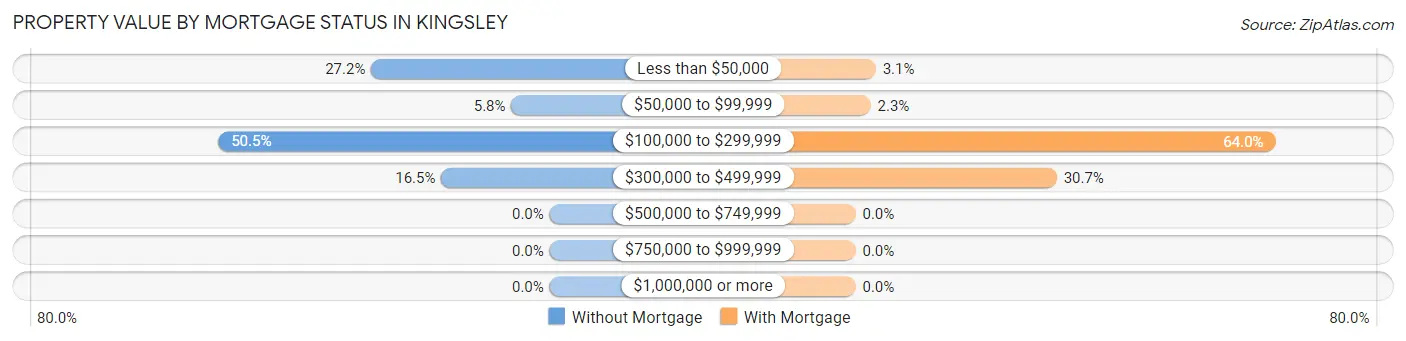
| Property Value | Without Mortgage | With Mortgage |
| Less than $50,000 | 28 (27.2%) | 8 (3.1%) |
| $50,000 to $99,999 | 6 (5.8%) | 6 (2.3%) |
| $100,000 to $299,999 | 52 (50.5%) | 167 (64.0%) |
| $300,000 to $499,999 | 17 (16.5%) | 80 (30.6%) |
| $500,000 to $749,999 | 0 (0.0%) | 0 (0.0%) |
| $750,000 to $999,999 | 0 (0.0%) | 0 (0.0%) |
| $1,000,000 or more | 0 (0.0%) | 0 (0.0%) |
| Total | 103 (100.0%) | 261 (100.0%) |
Household Income by Mortgage Status in Kingsley
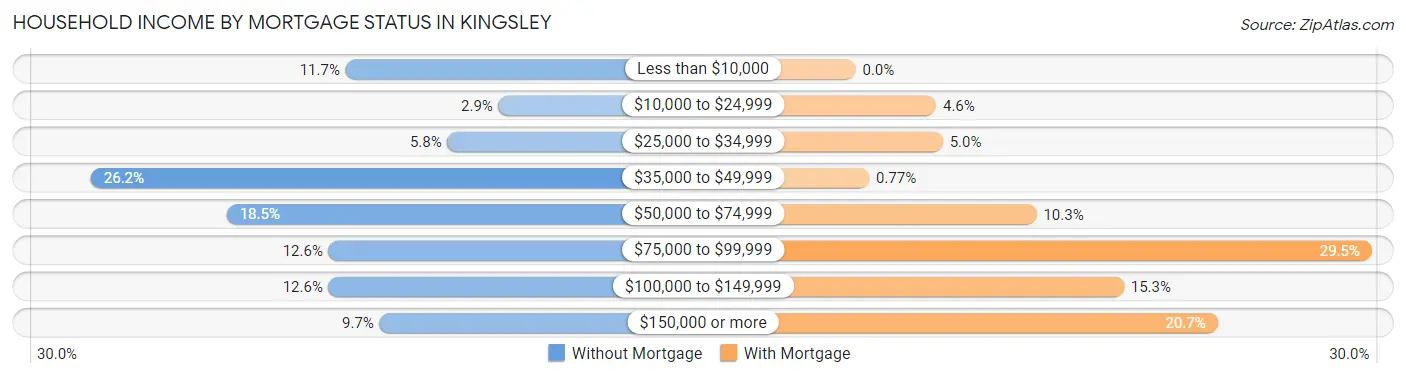
| Household Income | Without Mortgage | With Mortgage |
| Less than $10,000 | 12 (11.7%) | 0 (0.0%) |
| $10,000 to $24,999 | 3 (2.9%) | 12 (4.6%) |
| $25,000 to $34,999 | 6 (5.8%) | 13 (5.0%) |
| $35,000 to $49,999 | 27 (26.2%) | 2 (0.8%) |
| $50,000 to $74,999 | 19 (18.4%) | 27 (10.3%) |
| $75,000 to $99,999 | 13 (12.6%) | 77 (29.5%) |
| $100,000 to $149,999 | 13 (12.6%) | 40 (15.3%) |
| $150,000 or more | 10 (9.7%) | 54 (20.7%) |
| Total | 103 (100.0%) | 261 (100.0%) |
Property Value to Household Income Ratio in Kingsley
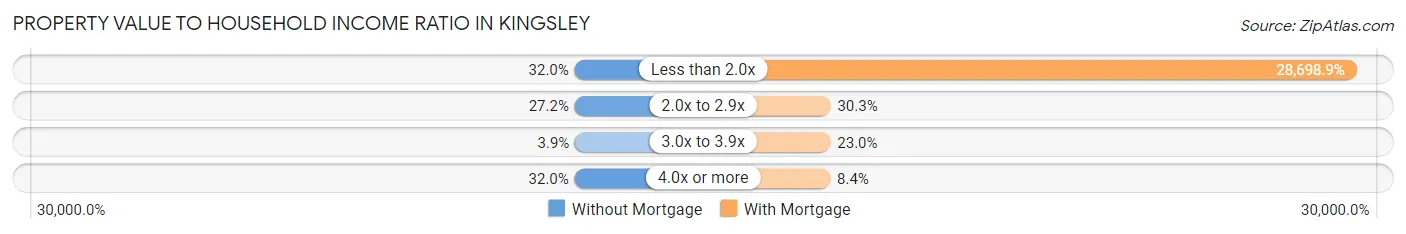
| Value-to-Income Ratio | Without Mortgage | With Mortgage |
| Less than 2.0x | 33 (32.0%) | 74,904 (28,698.8%) |
| 2.0x to 2.9x | 28 (27.2%) | 79 (30.3%) |
| 3.0x to 3.9x | 4 (3.9%) | 60 (23.0%) |
| 4.0x or more | 33 (32.0%) | 22 (8.4%) |
| Total | 103 (100.0%) | 261 (100.0%) |
Real Estate Taxes by Mortgage Status in Kingsley
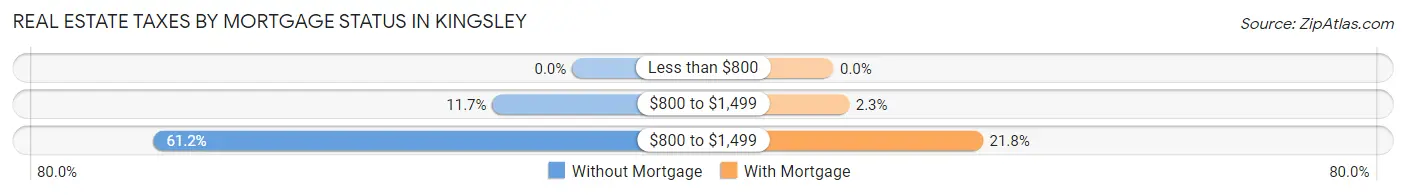
| Property Taxes | Without Mortgage | With Mortgage |
| Less than $800 | 0 (0.0%) | 0 (0.0%) |
| $800 to $1,499 | 12 (11.7%) | 6 (2.3%) |
| $800 to $1,499 | 63 (61.2%) | 57 (21.8%) |
| Total | 103 (100.0%) | 261 (100.0%) |
Health & Disability in Kingsley
Health Insurance Coverage by Age in Kingsley
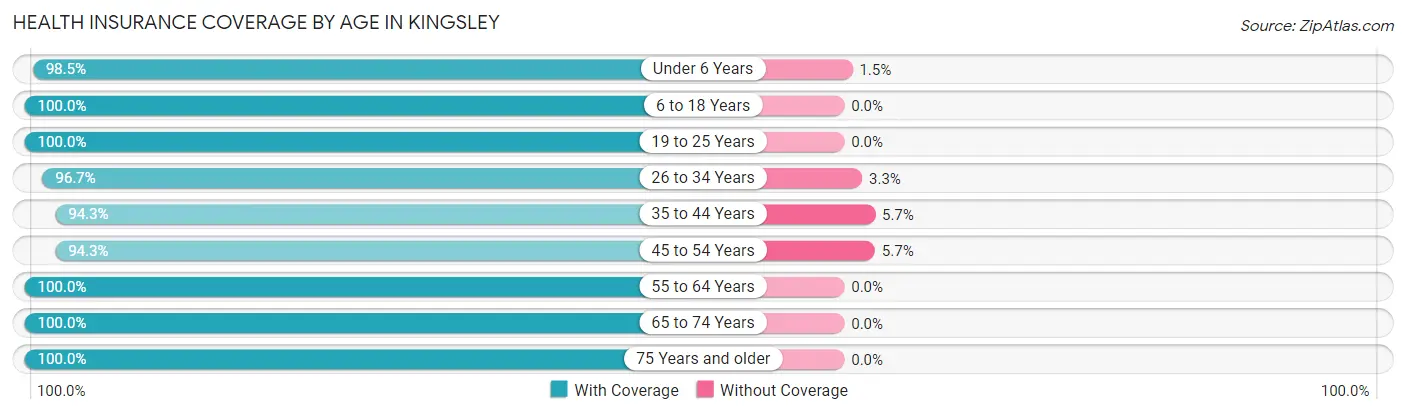
| Age Bracket | With Coverage | Without Coverage |
| Under 6 Years | 194 (98.5%) | 3 (1.5%) |
| 6 to 18 Years | 591 (100.0%) | 0 (0.0%) |
| 19 to 25 Years | 61 (100.0%) | 0 (0.0%) |
| 26 to 34 Years | 204 (96.7%) | 7 (3.3%) |
| 35 to 44 Years | 263 (94.3%) | 16 (5.7%) |
| 45 to 54 Years | 99 (94.3%) | 6 (5.7%) |
| 55 to 64 Years | 159 (100.0%) | 0 (0.0%) |
| 65 to 74 Years | 111 (100.0%) | 0 (0.0%) |
| 75 Years and older | 78 (100.0%) | 0 (0.0%) |
| Total | 1,760 (98.2%) | 32 (1.8%) |
Health Insurance Coverage by Citizenship Status in Kingsley
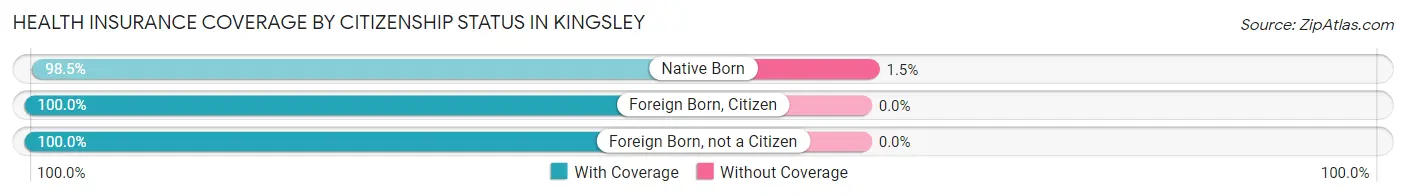
| Citizenship Status | With Coverage | Without Coverage |
| Native Born | 194 (98.5%) | 3 (1.5%) |
| Foreign Born, Citizen | 591 (100.0%) | 0 (0.0%) |
| Foreign Born, not a Citizen | 61 (100.0%) | 0 (0.0%) |
Health Insurance Coverage by Household Income in Kingsley
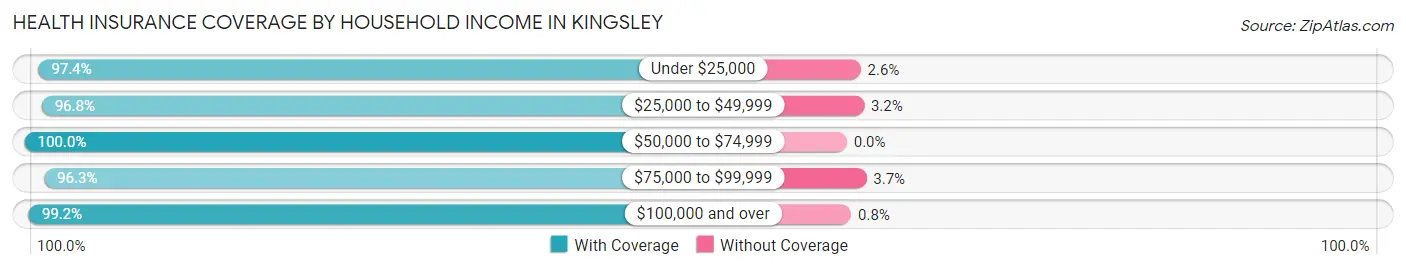
| Household Income | With Coverage | Without Coverage |
| Under $25,000 | 189 (97.4%) | 5 (2.6%) |
| $25,000 to $49,999 | 241 (96.8%) | 8 (3.2%) |
| $50,000 to $74,999 | 539 (100.0%) | 0 (0.0%) |
| $75,000 to $99,999 | 421 (96.3%) | 16 (3.7%) |
| $100,000 and over | 370 (99.2%) | 3 (0.8%) |
Public vs Private Health Insurance Coverage by Age in Kingsley
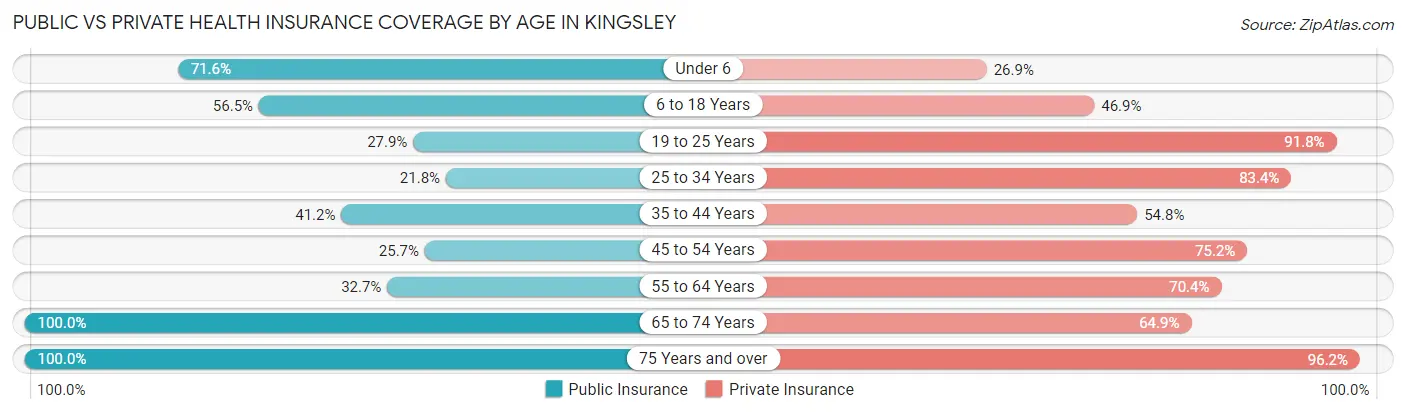
| Age Bracket | Public Insurance | Private Insurance |
| Under 6 | 141 (71.6%) | 53 (26.9%) |
| 6 to 18 Years | 334 (56.5%) | 277 (46.9%) |
| 19 to 25 Years | 17 (27.9%) | 56 (91.8%) |
| 25 to 34 Years | 46 (21.8%) | 176 (83.4%) |
| 35 to 44 Years | 115 (41.2%) | 153 (54.8%) |
| 45 to 54 Years | 27 (25.7%) | 79 (75.2%) |
| 55 to 64 Years | 52 (32.7%) | 112 (70.4%) |
| 65 to 74 Years | 111 (100.0%) | 72 (64.9%) |
| 75 Years and over | 78 (100.0%) | 75 (96.2%) |
| Total | 921 (51.4%) | 1,053 (58.8%) |
Disability Status by Sex by Age in Kingsley
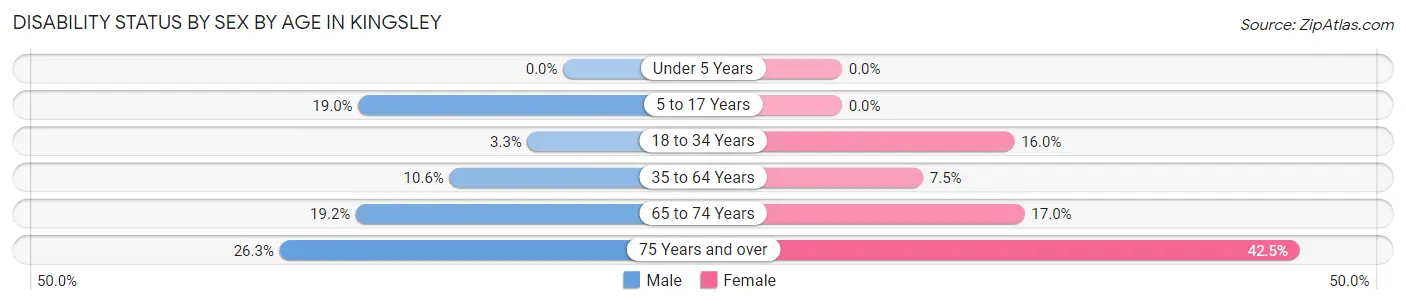
| Age Bracket | Male | Female |
| Under 5 Years | 0 (0.0%) | 0 (0.0%) |
| 5 to 17 Years | 78 (19.0%) | 0 (0.0%) |
| 18 to 34 Years | 5 (3.3%) | 20 (16.0%) |
| 35 to 64 Years | 25 (10.5%) | 23 (7.5%) |
| 65 to 74 Years | 10 (19.2%) | 10 (17.0%) |
| 75 Years and over | 10 (26.3%) | 17 (42.5%) |
Disability Class by Sex by Age in Kingsley
Disability Class: Hearing Difficulty
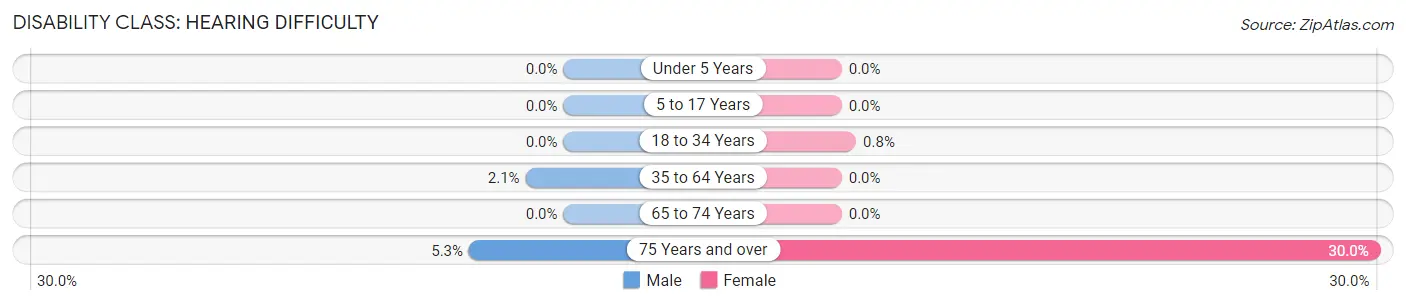
| Age Bracket | Male | Female |
| Under 5 Years | 0 (0.0%) | 0 (0.0%) |
| 5 to 17 Years | 0 (0.0%) | 0 (0.0%) |
| 18 to 34 Years | 0 (0.0%) | 1 (0.8%) |
| 35 to 64 Years | 5 (2.1%) | 0 (0.0%) |
| 65 to 74 Years | 0 (0.0%) | 0 (0.0%) |
| 75 Years and over | 2 (5.3%) | 12 (30.0%) |
Disability Class: Vision Difficulty
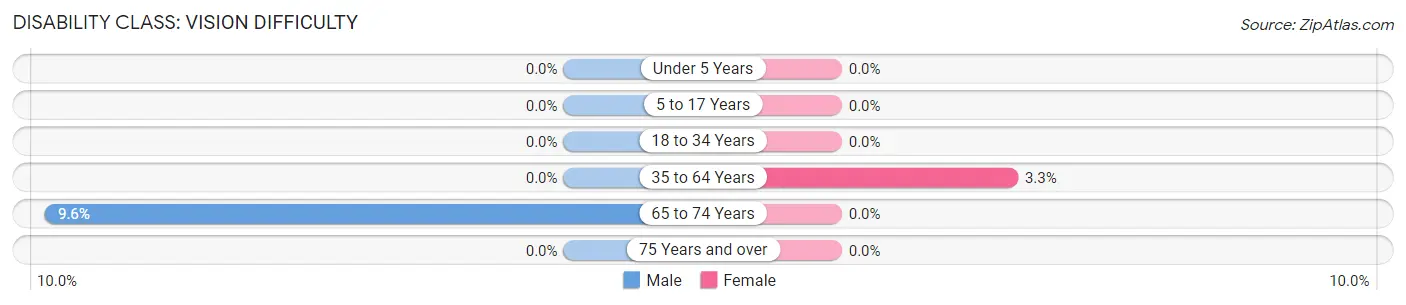
| Age Bracket | Male | Female |
| Under 5 Years | 0 (0.0%) | 0 (0.0%) |
| 5 to 17 Years | 0 (0.0%) | 0 (0.0%) |
| 18 to 34 Years | 0 (0.0%) | 0 (0.0%) |
| 35 to 64 Years | 0 (0.0%) | 10 (3.3%) |
| 65 to 74 Years | 5 (9.6%) | 0 (0.0%) |
| 75 Years and over | 0 (0.0%) | 0 (0.0%) |
Disability Class: Cognitive Difficulty
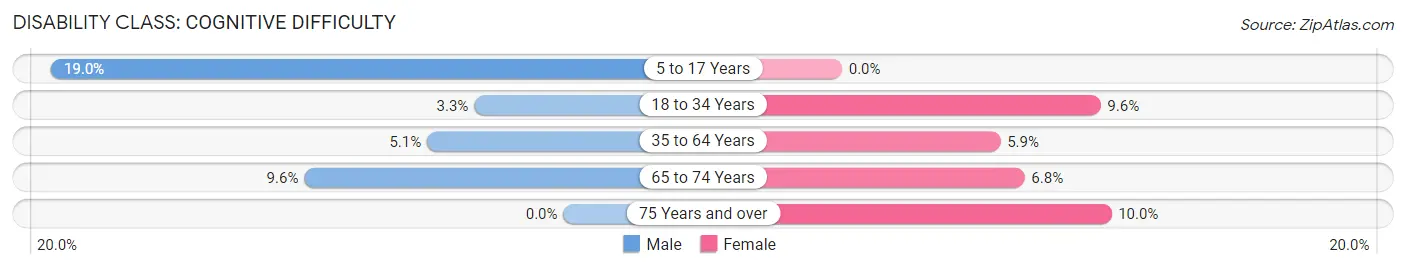
| Age Bracket | Male | Female |
| 5 to 17 Years | 78 (19.0%) | 0 (0.0%) |
| 18 to 34 Years | 5 (3.3%) | 12 (9.6%) |
| 35 to 64 Years | 12 (5.1%) | 18 (5.9%) |
| 65 to 74 Years | 5 (9.6%) | 4 (6.8%) |
| 75 Years and over | 0 (0.0%) | 4 (10.0%) |
Disability Class: Ambulatory Difficulty
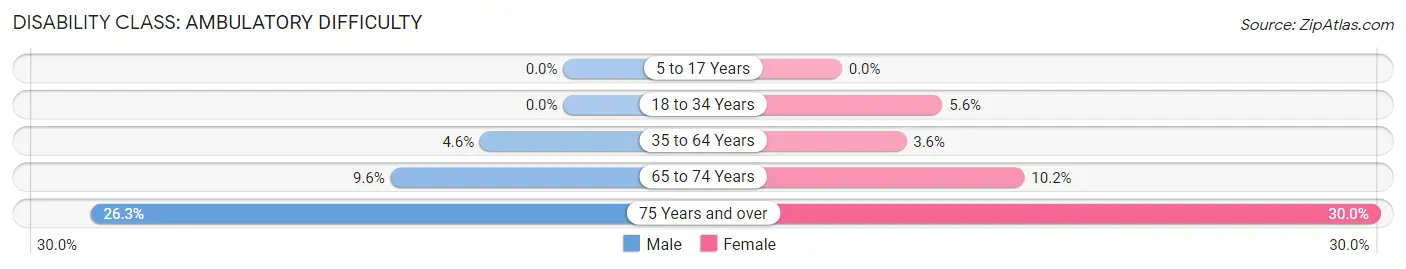
| Age Bracket | Male | Female |
| 5 to 17 Years | 0 (0.0%) | 0 (0.0%) |
| 18 to 34 Years | 0 (0.0%) | 7 (5.6%) |
| 35 to 64 Years | 11 (4.6%) | 11 (3.6%) |
| 65 to 74 Years | 5 (9.6%) | 6 (10.2%) |
| 75 Years and over | 10 (26.3%) | 12 (30.0%) |
Disability Class: Self-Care Difficulty
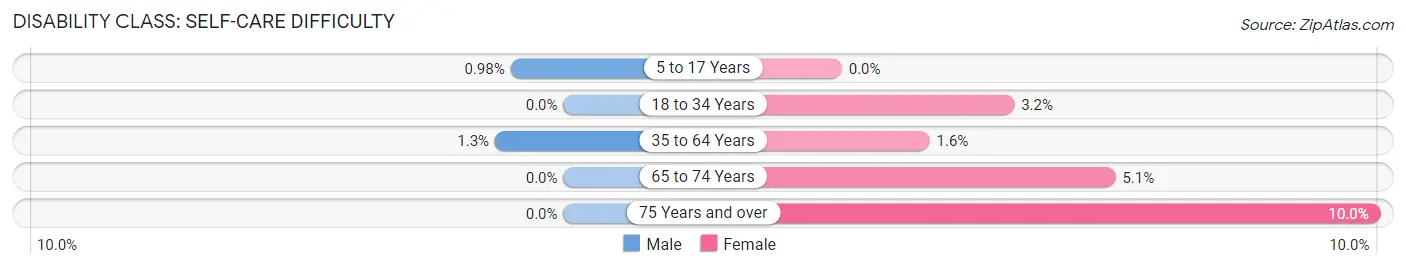
| Age Bracket | Male | Female |
| 5 to 17 Years | 4 (1.0%) | 0 (0.0%) |
| 18 to 34 Years | 0 (0.0%) | 4 (3.2%) |
| 35 to 64 Years | 3 (1.3%) | 5 (1.6%) |
| 65 to 74 Years | 0 (0.0%) | 3 (5.1%) |
| 75 Years and over | 0 (0.0%) | 4 (10.0%) |
Technology Access in Kingsley
Computing Device Access in Kingsley
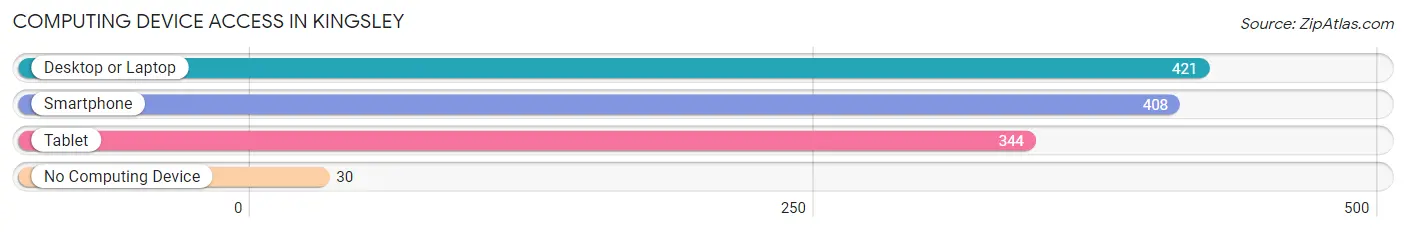
| Device Type | # Households | % Households |
| Desktop or Laptop | 421 | 81.9% |
| Smartphone | 408 | 79.4% |
| Tablet | 344 | 66.9% |
| No Computing Device | 30 | 5.8% |
| Total | 514 | 100.0% |
Internet Access in Kingsley
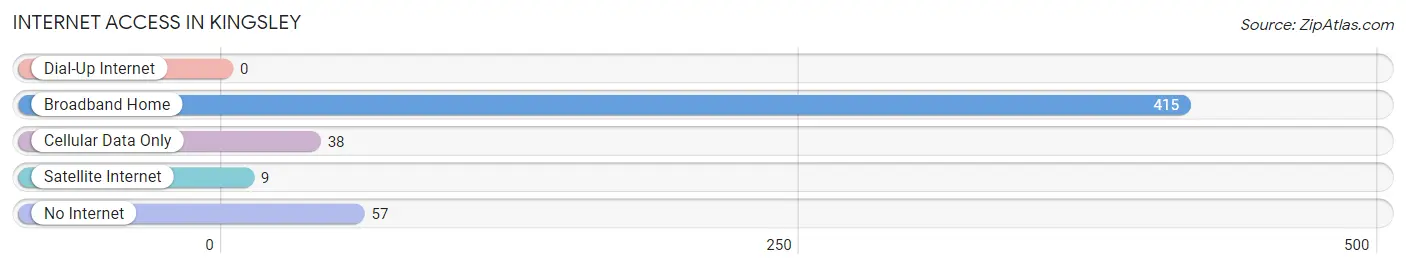
| Internet Type | # Households | % Households |
| Dial-Up Internet | 0 | 0.0% |
| Broadband Home | 415 | 80.7% |
| Cellular Data Only | 38 | 7.4% |
| Satellite Internet | 9 | 1.8% |
| No Internet | 57 | 11.1% |
| Total | 514 | 100.0% |
Kingsley Summary
Kingsley, Michigan is a small village located in Grand Traverse County in the northwestern part of the state. It is situated on the banks of the Boardman River, and is surrounded by rolling hills and forests. The village has a population of 1,845 people, according to the 2010 census.
History
The area that is now Kingsley was first settled in 1855 by a group of settlers from New York. The village was originally known as “Kingsley’s Corners”, named after the first settler, William Kingsley. The village was incorporated in 1891, and the name was changed to Kingsley.
Geography
Kingsley is located in Grand Traverse County, in the northwestern part of Michigan. It is situated on the banks of the Boardman River, and is surrounded by rolling hills and forests. The village has a total area of 1.2 square miles, all of which is land. The terrain is mostly flat, with some hills and valleys.
Economy
The economy of Kingsley is largely based on agriculture and tourism. The village is home to several farms, which produce a variety of crops, including apples, cherries, and other fruits and vegetables. The village also has several wineries, which produce a variety of wines. Tourism is also an important part of the local economy, with many visitors coming to the area to enjoy the natural beauty of the area.
Demographics
According to the 2010 census, the population of Kingsley was 1,845 people. The racial makeup of the village was 97.2% White, 0.7% African American, 0.3% Native American, 0.3% Asian, 0.2% from other races, and 1.5% from two or more races. The median household income was $41,250, and the median family income was $50,000.
Conclusion
Kingsley, Michigan is a small village located in Grand Traverse County in the northwestern part of the state. It has a population of 1,845 people, and is surrounded by rolling hills and forests. The economy of the village is largely based on agriculture and tourism, and the racial makeup of the village is mostly White. Kingsley is a great place to visit, and offers a variety of activities for visitors to enjoy.
Common Questions
What is Per Capita Income in Kingsley?
Per Capita income in Kingsley is $22,280.
What is the Median Family Income in Kingsley?
Median Family Income in Kingsley is $66,926.
What is the Median Household income in Kingsley?
Median Household Income in Kingsley is $65,060.
What is Income or Wage Gap in Kingsley?
Income or Wage Gap in Kingsley is 50.3%.
Women in Kingsley earn 49.7 cents for every dollar earned by a man.
What is Inequality or Gini Index in Kingsley?
Inequality or Gini Index in Kingsley is 0.42.
What is the Total Population of Kingsley?
Total Population of Kingsley is 1,792.
What is the Total Male Population of Kingsley?
Total Male Population of Kingsley is 983.
What is the Total Female Population of Kingsley?
Total Female Population of Kingsley is 809.
What is the Ratio of Males per 100 Females in Kingsley?
There are 121.51 Males per 100 Females in Kingsley.
What is the Ratio of Females per 100 Males in Kingsley?
There are 82.30 Females per 100 Males in Kingsley.
What is the Median Population Age in Kingsley?
Median Population Age in Kingsley is 28.7 Years.
What is the Average Family Size in Kingsley
Average Family Size in Kingsley is 4.3 People.
What is the Average Household Size in Kingsley
Average Household Size in Kingsley is 3.5 People.
How Large is the Labor Force in Kingsley?
There are 646 People in the Labor Forcein in Kingsley.
What is the Percentage of People in the Labor Force in Kingsley?
62.3% of People are in the Labor Force in Kingsley.
What is the Unemployment Rate in Kingsley?
Unemployment Rate in Kingsley is 2.6%.