Kalkaska, MI Map & Demographics
Kalkaska Map
Kalkaska Overview
$23,674
PER CAPITA INCOME
$57,188
AVG FAMILY INCOME
$43,514
AVG HOUSEHOLD INCOME
38.8%
WAGE / INCOME GAP [ % ]
61.2¢/ $1
WAGE / INCOME GAP [ $ ]
0.45
INEQUALITY / GINI INDEX
2,563
TOTAL POPULATION
1,160
MALE POPULATION
1,403
FEMALE POPULATION
82.68
MALES / 100 FEMALES
120.95
FEMALES / 100 MALES
35.5
MEDIAN AGE
3.2
AVG FAMILY SIZE
2.3
AVG HOUSEHOLD SIZE
1,085
LABOR FORCE [ PEOPLE ]
54.0%
PERCENT IN LABOR FORCE
4.5%
UNEMPLOYMENT RATE
Kalkaska Zip Codes
Income in Kalkaska
Income Overview in Kalkaska
Per Capita Income in Kalkaska is $23,674, while median incomes of families and households are $57,188 and $43,514 respectively.
| Characteristic | Number | Measure |
| Per Capita Income | 2,563 | $23,674 |
| Median Family Income | 564 | $57,188 |
| Mean Family Income | 564 | $67,282 |
| Median Household Income | 1,082 | $43,514 |
| Mean Household Income | 1,082 | $54,943 |
| Income Deficit | 564 | $0 |
| Wage / Income Gap (%) | 2,563 | 38.78% |
| Wage / Income Gap ($) | 2,563 | 61.22¢ per $1 |
| Gini / Inequality Index | 2,563 | 0.45 |
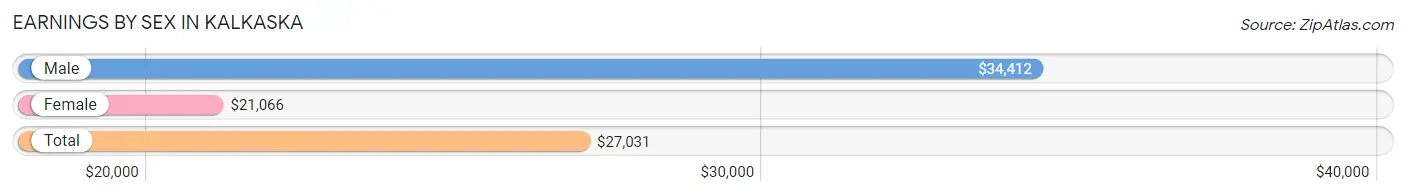
Earnings by Sex in Kalkaska
Average Earnings in Kalkaska are $27,031, $34,412 for men and $21,066 for women, a difference of 38.8%.
| Sex | Number | Average Earnings |
| Male | 574 (49.1%) | $34,412 |
| Female | 596 (50.9%) | $21,066 |
| Total | 1,170 (100.0%) | $27,031 |
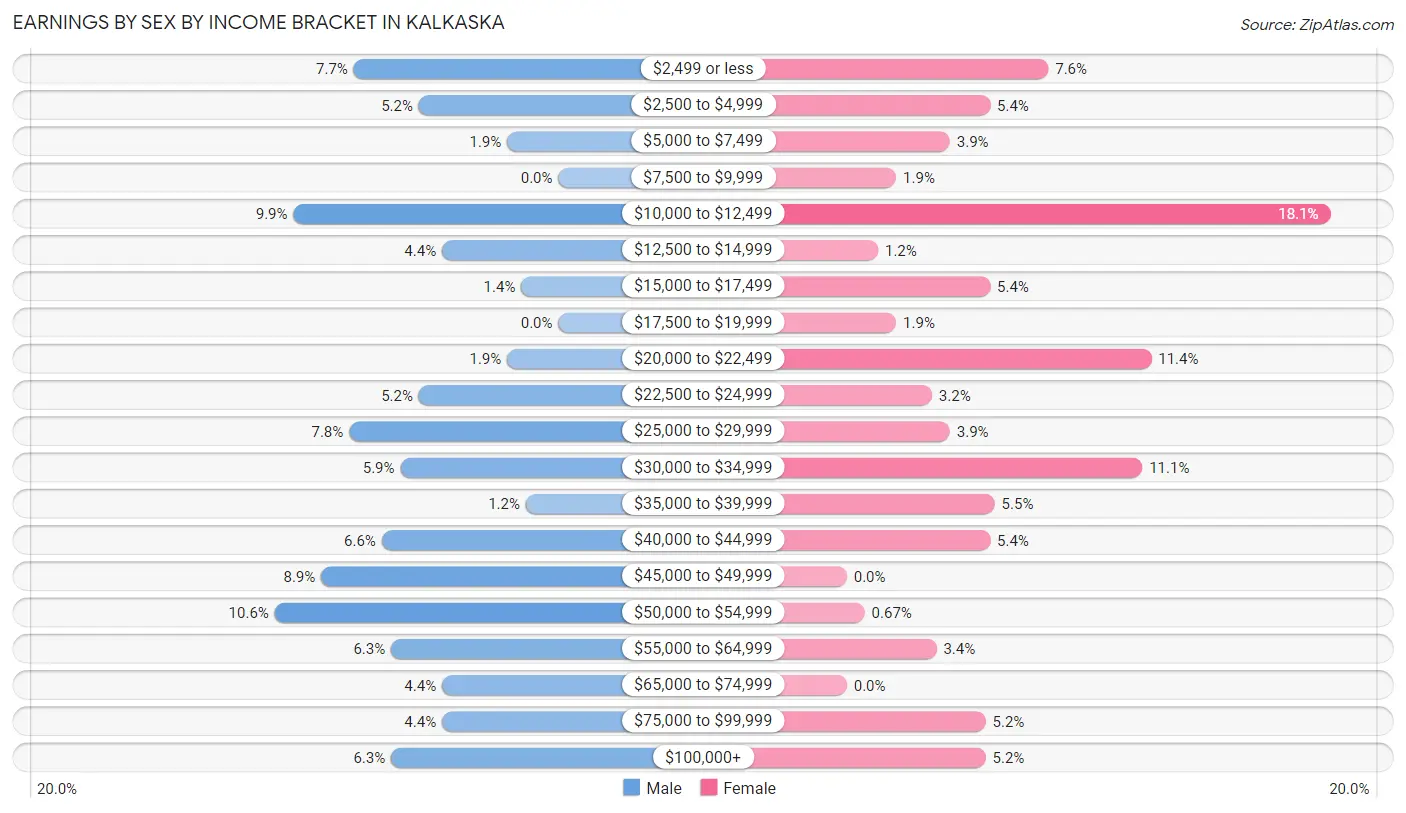
Earnings by Sex by Income Bracket in Kalkaska
The most common earnings brackets in Kalkaska are $50,000 to $54,999 for men (61 | 10.6%) and $10,000 to $12,499 for women (108 | 18.1%).
| Income | Male | Female |
| $2,499 or less | 44 (7.7%) | 45 (7.5%) |
| $2,500 to $4,999 | 30 (5.2%) | 32 (5.4%) |
| $5,000 to $7,499 | 11 (1.9%) | 23 (3.9%) |
| $7,500 to $9,999 | 0 (0.0%) | 11 (1.8%) |
| $10,000 to $12,499 | 57 (9.9%) | 108 (18.1%) |
| $12,500 to $14,999 | 25 (4.4%) | 7 (1.2%) |
| $15,000 to $17,499 | 8 (1.4%) | 32 (5.4%) |
| $17,500 to $19,999 | 0 (0.0%) | 11 (1.8%) |
| $20,000 to $22,499 | 11 (1.9%) | 68 (11.4%) |
| $22,500 to $24,999 | 30 (5.2%) | 19 (3.2%) |
| $25,000 to $29,999 | 45 (7.8%) | 23 (3.9%) |
| $30,000 to $34,999 | 34 (5.9%) | 66 (11.1%) |
| $35,000 to $39,999 | 7 (1.2%) | 33 (5.5%) |
| $40,000 to $44,999 | 38 (6.6%) | 32 (5.4%) |
| $45,000 to $49,999 | 51 (8.9%) | 0 (0.0%) |
| $50,000 to $54,999 | 61 (10.6%) | 4 (0.7%) |
| $55,000 to $64,999 | 36 (6.3%) | 20 (3.4%) |
| $65,000 to $74,999 | 25 (4.4%) | 0 (0.0%) |
| $75,000 to $99,999 | 25 (4.4%) | 31 (5.2%) |
| $100,000+ | 36 (6.3%) | 31 (5.2%) |
| Total | 574 (100.0%) | 596 (100.0%) |
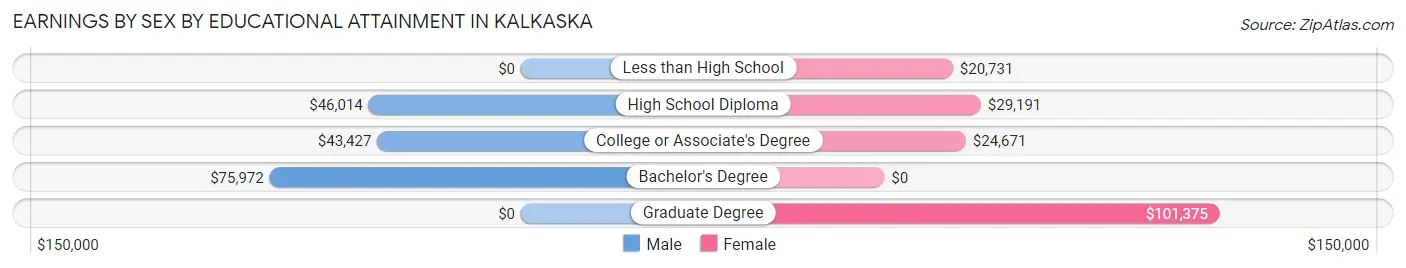
Earnings by Sex by Educational Attainment in Kalkaska
Average earnings in Kalkaska are $45,574 for men and $24,671 for women, a difference of 45.9%. Men with an educational attainment of bachelor's degree enjoy the highest average annual earnings of $75,972, while those with college or associate's degree education earn the least with $43,427. Women with an educational attainment of graduate degree earn the most with the average annual earnings of $101,375, while those with less than high school education have the smallest earnings of $20,731.
| Educational Attainment | Male Income | Female Income |
| Less than High School | - | - |
| High School Diploma | $46,014 | $29,191 |
| College or Associate's Degree | $43,427 | $24,671 |
| Bachelor's Degree | $75,972 | $0 |
| Graduate Degree | - | - |
| Total | $45,574 | $24,671 |
Family Income in Kalkaska
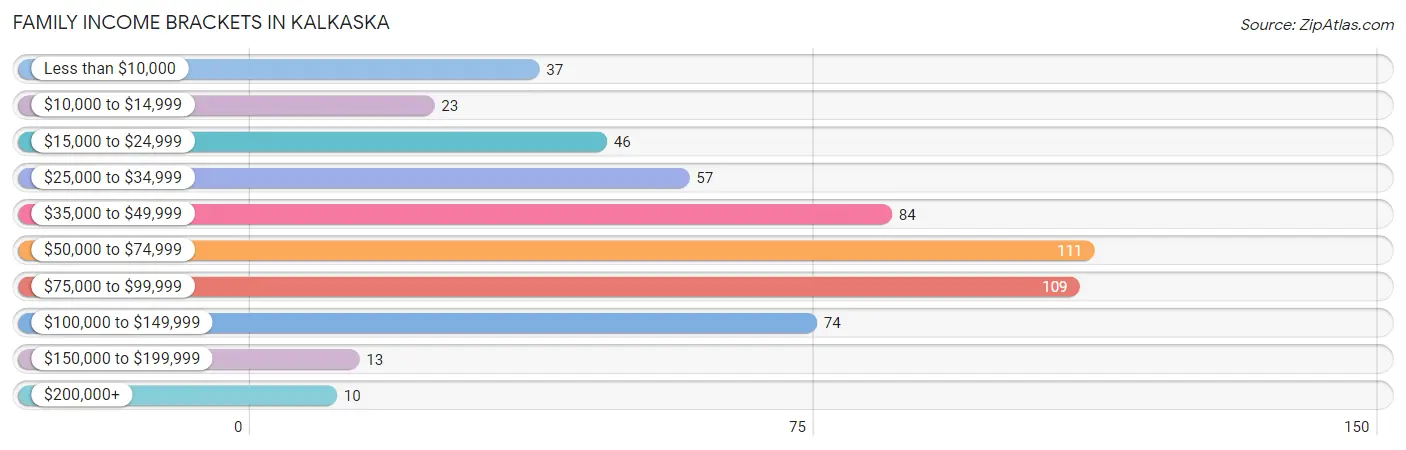
Family Income Brackets in Kalkaska
According to the Kalkaska family income data, there are 111 families falling into the $50,000 to $74,999 income range, which is the most common income bracket and makes up 19.7% of all families. Conversely, the $200,000+ income bracket is the least frequent group with only 10 families (1.8%) belonging to this category.
| Income Bracket | # Families | % Families |
| Less than $10,000 | 37 | 6.6% |
| $10,000 to $14,999 | 23 | 4.1% |
| $15,000 to $24,999 | 46 | 8.2% |
| $25,000 to $34,999 | 57 | 10.1% |
| $35,000 to $49,999 | 84 | 14.9% |
| $50,000 to $74,999 | 111 | 19.7% |
| $75,000 to $99,999 | 109 | 19.3% |
| $100,000 to $149,999 | 74 | 13.1% |
| $150,000 to $199,999 | 13 | 2.3% |
| $200,000+ | 10 | 1.8% |
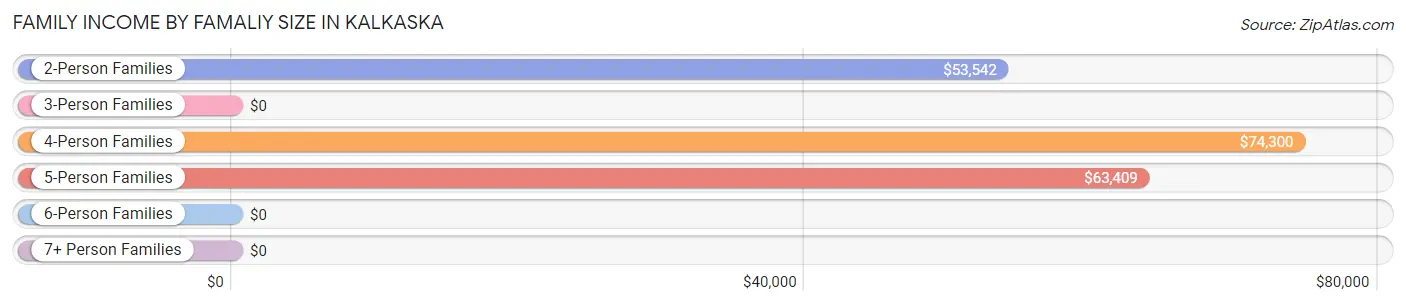
Family Income by Famaliy Size in Kalkaska
4-person families (164 | 29.1%) account for the highest median family income in Kalkaska with $74,300 per family, while 2-person families (221 | 39.2%) have the highest median income of $26,771 per family member.
| Income Bracket | # Families | Median Income |
| 2-Person Families | 221 (39.2%) | $53,542 |
| 3-Person Families | 95 (16.8%) | $0 |
| 4-Person Families | 164 (29.1%) | $74,300 |
| 5-Person Families | 70 (12.4%) | $63,409 |
| 6-Person Families | 9 (1.6%) | $0 |
| 7+ Person Families | 5 (0.9%) | $0 |
| Total | 564 (100.0%) | $57,188 |
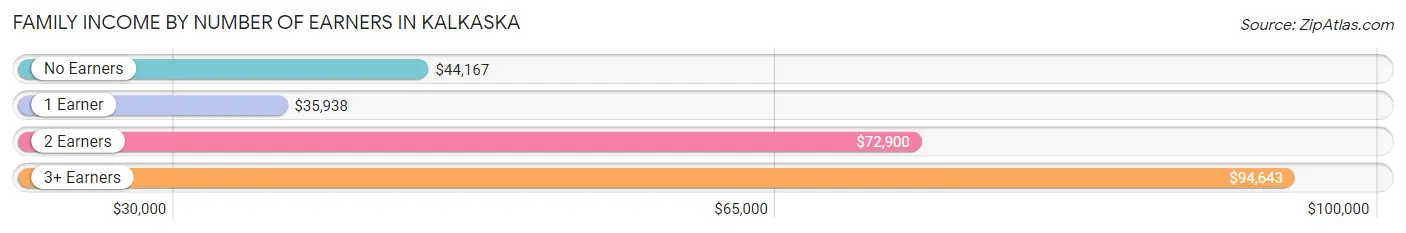
Family Income by Number of Earners in Kalkaska
The median family income in Kalkaska is $57,188, with families comprising 3+ earners (68) having the highest median family income of $94,643, while families with 1 earner (162) have the lowest median family income of $35,938, accounting for 12.1% and 28.7% of families, respectively.
| Number of Earners | # Families | Median Income |
| No Earners | 116 (20.6%) | $44,167 |
| 1 Earner | 162 (28.7%) | $35,938 |
| 2 Earners | 218 (38.7%) | $72,900 |
| 3+ Earners | 68 (12.1%) | $94,643 |
| Total | 564 (100.0%) | $57,188 |
Household Income in Kalkaska
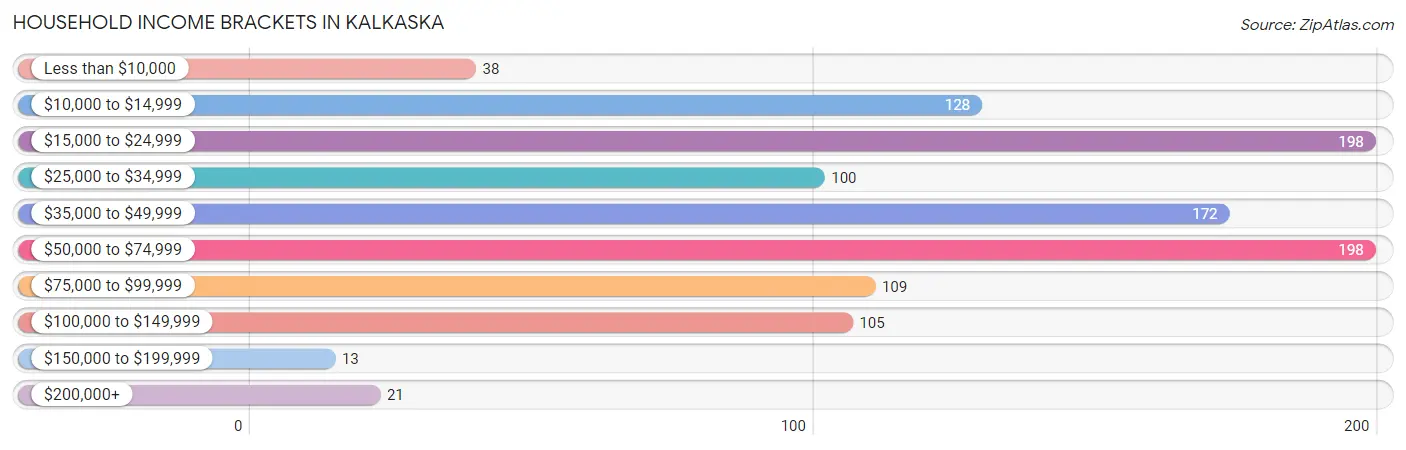
Household Income Brackets in Kalkaska
With 198 households falling in the category, the $15,000 to $24,999 income range is the most frequent in Kalkaska, accounting for 18.3% of all households. In contrast, only 13 households (1.2%) fall into the $150,000 to $199,999 income bracket, making it the least populous group.
| Income Bracket | # Households | % Households |
| Less than $10,000 | 38 | 3.5% |
| $10,000 to $14,999 | 128 | 11.8% |
| $15,000 to $24,999 | 198 | 18.3% |
| $25,000 to $34,999 | 100 | 9.2% |
| $35,000 to $49,999 | 172 | 15.9% |
| $50,000 to $74,999 | 198 | 18.3% |
| $75,000 to $99,999 | 109 | 10.1% |
| $100,000 to $149,999 | 105 | 9.7% |
| $150,000 to $199,999 | 13 | 1.2% |
| $200,000+ | 21 | 1.9% |
Household Income by Householder Age in Kalkaska
The median household income in Kalkaska is $43,514, with the highest median household income of $53,438 found in the 25 to 44 years age bracket for the primary householder. A total of 401 households (37.1%) fall into this category. Meanwhile, the 15 to 24 years age bracket for the primary householder has the lowest median household income of $23,375, with 64 households (5.9%) in this group.
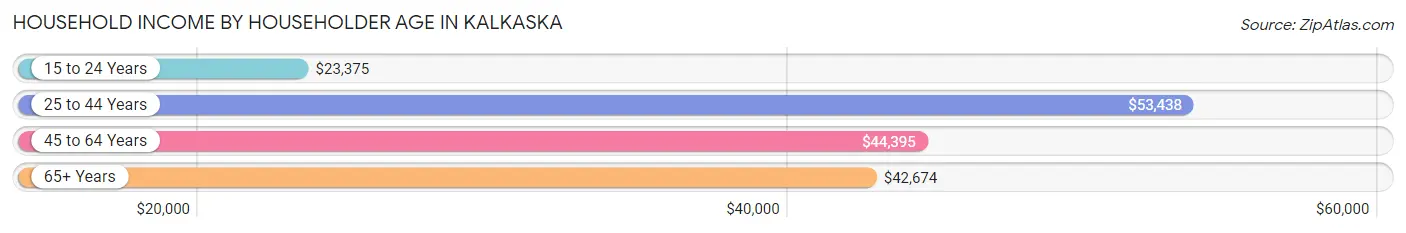
| Income Bracket | # Households | Median Income |
| 15 to 24 Years | 64 (5.9%) | $23,375 |
| 25 to 44 Years | 401 (37.1%) | $53,438 |
| 45 to 64 Years | 277 (25.6%) | $44,395 |
| 65+ Years | 340 (31.4%) | $42,674 |
| Total | 1,082 (100.0%) | $43,514 |
Poverty in Kalkaska
Income Below Poverty by Sex and Age in Kalkaska
With 24.9% poverty level for males and 28.5% for females among the residents of Kalkaska, under 5 year old males and 15 year old females are the most vulnerable to poverty, with 44 males (75.9%) and 11 females (100.0%) in their respective age groups living below the poverty level.
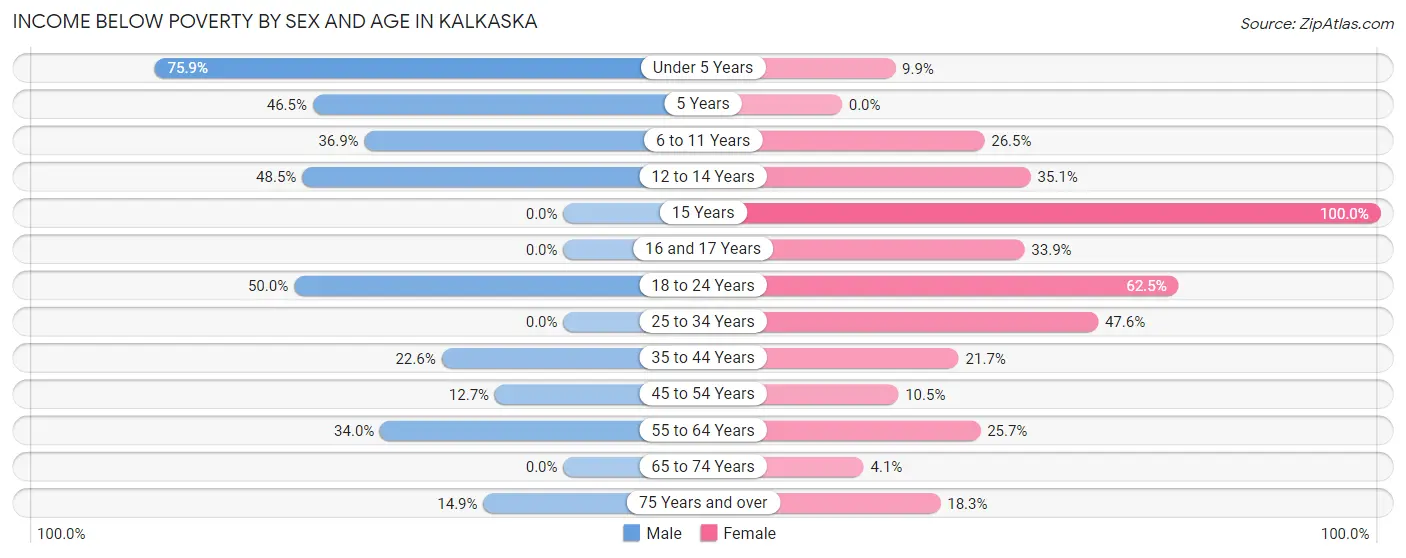
| Age Bracket | Male | Female |
| Under 5 Years | 44 (75.9%) | 9 (9.9%) |
| 5 Years | 20 (46.5%) | 0 (0.0%) |
| 6 to 11 Years | 24 (36.9%) | 32 (26.5%) |
| 12 to 14 Years | 32 (48.5%) | 27 (35.1%) |
| 15 Years | 0 (0.0%) | 11 (100.0%) |
| 16 and 17 Years | 0 (0.0%) | 20 (33.9%) |
| 18 to 24 Years | 43 (50.0%) | 65 (62.5%) |
| 25 to 34 Years | 0 (0.0%) | 126 (47.5%) |
| 35 to 44 Years | 50 (22.6%) | 41 (21.7%) |
| 45 to 54 Years | 16 (12.7%) | 11 (10.5%) |
| 55 to 64 Years | 34 (34.0%) | 28 (25.7%) |
| 65 to 74 Years | 0 (0.0%) | 6 (4.1%) |
| 75 Years and over | 15 (14.8%) | 17 (18.3%) |
| Total | 278 (24.9%) | 393 (28.5%) |
Income Above Poverty by Sex and Age in Kalkaska
According to the poverty statistics in Kalkaska, males aged 15 years and females aged 5 years are the age groups that are most secure financially, with 100.0% of males and 100.0% of females in these age groups living above the poverty line.
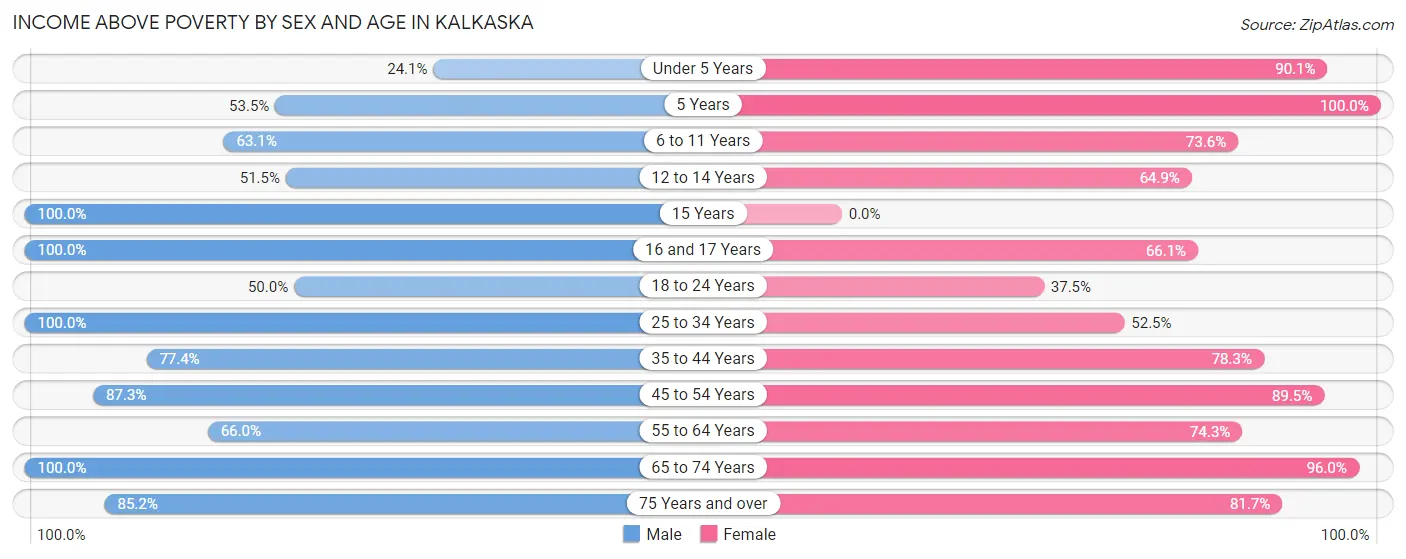
| Age Bracket | Male | Female |
| Under 5 Years | 14 (24.1%) | 82 (90.1%) |
| 5 Years | 23 (53.5%) | 8 (100.0%) |
| 6 to 11 Years | 41 (63.1%) | 89 (73.6%) |
| 12 to 14 Years | 34 (51.5%) | 50 (64.9%) |
| 15 Years | 7 (100.0%) | 0 (0.0%) |
| 16 and 17 Years | 37 (100.0%) | 39 (66.1%) |
| 18 to 24 Years | 43 (50.0%) | 39 (37.5%) |
| 25 to 34 Years | 98 (100.0%) | 139 (52.4%) |
| 35 to 44 Years | 171 (77.4%) | 148 (78.3%) |
| 45 to 54 Years | 110 (87.3%) | 94 (89.5%) |
| 55 to 64 Years | 66 (66.0%) | 81 (74.3%) |
| 65 to 74 Years | 109 (100.0%) | 142 (96.0%) |
| 75 Years and over | 86 (85.2%) | 76 (81.7%) |
| Total | 839 (75.1%) | 987 (71.5%) |
Income Below Poverty Among Married-Couple Families in Kalkaska
The poverty statistics for married-couple families in Kalkaska show that 3.6% or 13 of the total 359 families live below the poverty line. Families with 3 or 4 children have the highest poverty rate of 39.1%, comprising of 9 families. On the other hand, families with no children have the lowest poverty rate of 0.0%, which includes 0 families.
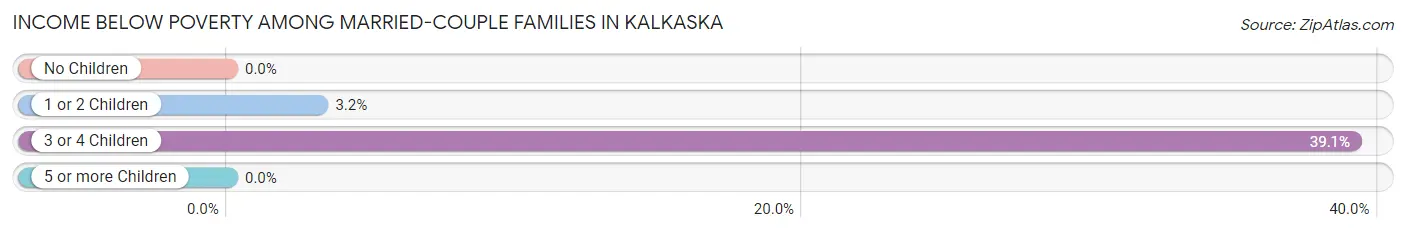
| Children | Above Poverty | Below Poverty |
| No Children | 204 (100.0%) | 0 (0.0%) |
| 1 or 2 Children | 123 (96.9%) | 4 (3.2%) |
| 3 or 4 Children | 14 (60.9%) | 9 (39.1%) |
| 5 or more Children | 5 (100.0%) | 0 (0.0%) |
| Total | 346 (96.4%) | 13 (3.6%) |
Income Below Poverty Among Single-Parent Households in Kalkaska
According to the poverty data in Kalkaska, 14.7% or 9 single-father households and 72.2% or 104 single-mother households are living below the poverty line. Among single-father households, those with 3 or 4 children have the highest poverty rate, with 9 households (21.4%) experiencing poverty. Likewise, among single-mother households, those with 1 or 2 children have the highest poverty rate, with 98 households (76.6%) falling below the poverty line.
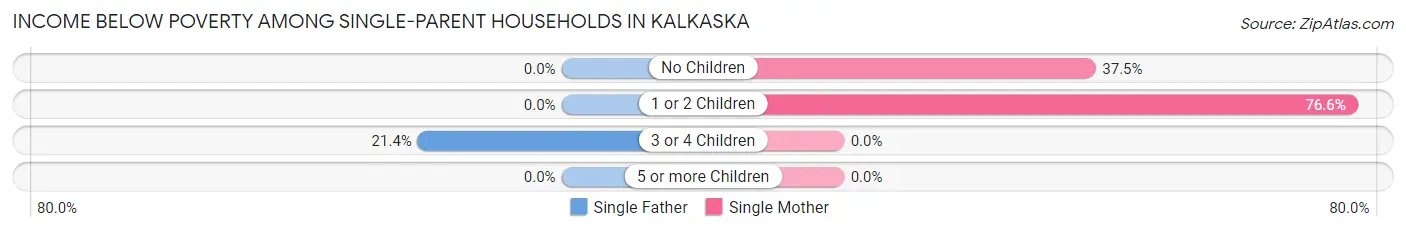
| Children | Single Father | Single Mother |
| No Children | 0 (0.0%) | 6 (37.5%) |
| 1 or 2 Children | 0 (0.0%) | 98 (76.6%) |
| 3 or 4 Children | 9 (21.4%) | 0 (0.0%) |
| 5 or more Children | 0 (0.0%) | 0 (0.0%) |
| Total | 9 (14.7%) | 104 (72.2%) |
Income Below Poverty Among Married-Couple vs Single-Parent Households in Kalkaska
The poverty data for Kalkaska shows that 13 of the married-couple family households (3.6%) and 113 of the single-parent households (55.1%) are living below the poverty level. Within the married-couple family households, those with 3 or 4 children have the highest poverty rate, with 9 households (39.1%) falling below the poverty line. Among the single-parent households, those with 1 or 2 children have the highest poverty rate, with 98 household (70.5%) living below poverty.
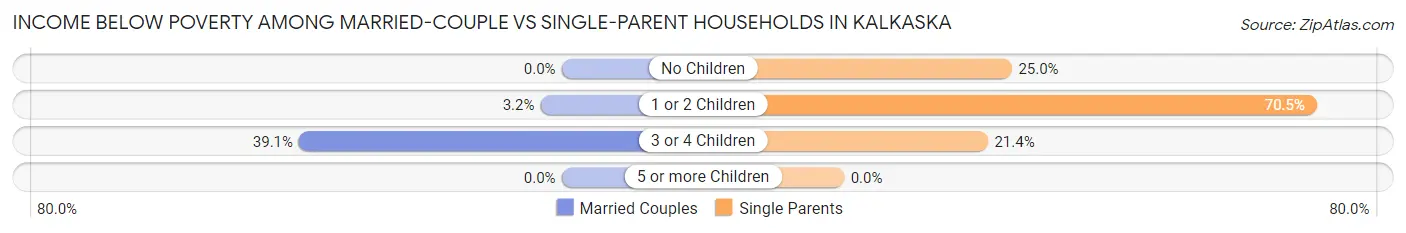
| Children | Married-Couple Families | Single-Parent Households |
| No Children | 0 (0.0%) | 6 (25.0%) |
| 1 or 2 Children | 4 (3.2%) | 98 (70.5%) |
| 3 or 4 Children | 9 (39.1%) | 9 (21.4%) |
| 5 or more Children | 0 (0.0%) | 0 (0.0%) |
| Total | 13 (3.6%) | 113 (55.1%) |
Race in Kalkaska
The most populous races in Kalkaska are White / Caucasian (2,289 | 89.3%), Black / African American (114 | 4.4%), and Two or more Races (114 | 4.4%).
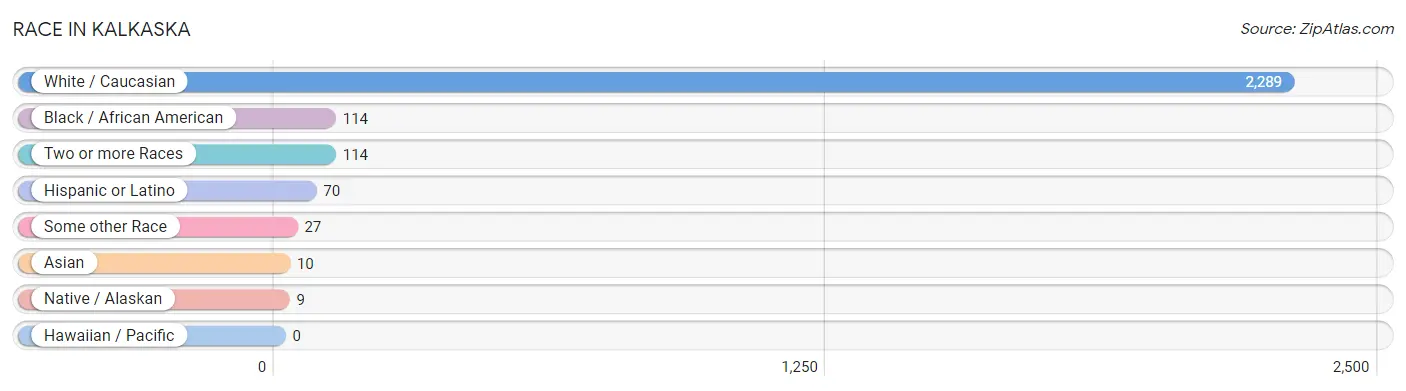
| Race | # Population | % Population |
| Asian | 10 | 0.4% |
| Black / African American | 114 | 4.4% |
| Hawaiian / Pacific | 0 | 0.0% |
| Hispanic or Latino | 70 | 2.7% |
| Native / Alaskan | 9 | 0.4% |
| White / Caucasian | 2,289 | 89.3% |
| Two or more Races | 114 | 4.4% |
| Some other Race | 27 | 1.1% |
| Total | 2,563 | 100.0% |
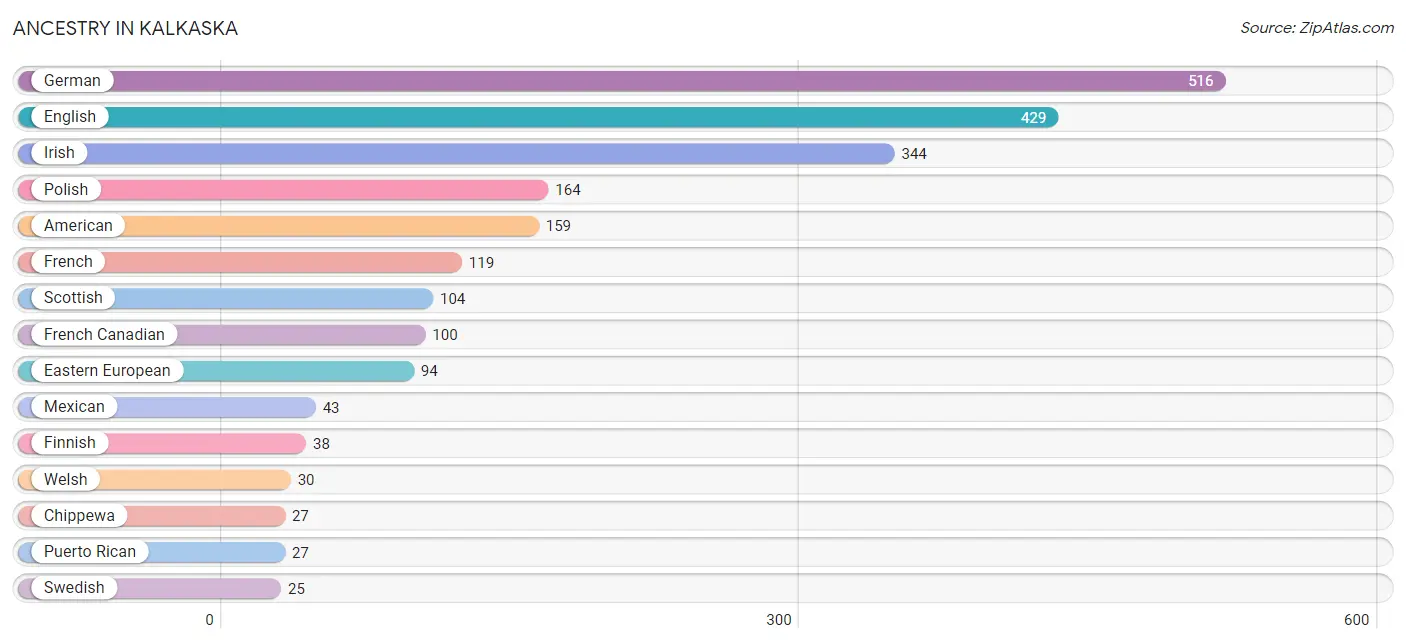
Ancestry in Kalkaska
The most populous ancestries reported in Kalkaska are German (516 | 20.1%), English (429 | 16.7%), Irish (344 | 13.4%), Polish (164 | 6.4%), and American (159 | 6.2%), together accounting for 62.9% of all Kalkaska residents.
| Ancestry | # Population | % Population |
| American | 159 | 6.2% |
| Austrian | 10 | 0.4% |
| Belgian | 4 | 0.2% |
| Brazilian | 10 | 0.4% |
| British | 6 | 0.2% |
| Canadian | 13 | 0.5% |
| Chippewa | 27 | 1.1% |
| Dutch | 23 | 0.9% |
| Eastern European | 94 | 3.7% |
| English | 429 | 16.7% |
| European | 22 | 0.9% |
| Finnish | 38 | 1.5% |
| French | 119 | 4.6% |
| French Canadian | 100 | 3.9% |
| German | 516 | 20.1% |
| Greek | 10 | 0.4% |
| Hungarian | 8 | 0.3% |
| Irish | 344 | 13.4% |
| Italian | 19 | 0.7% |
| Mexican | 43 | 1.7% |
| Northern European | 8 | 0.3% |
| Norwegian | 6 | 0.2% |
| Pennsylvania German | 17 | 0.7% |
| Polish | 164 | 6.4% |
| Portuguese | 10 | 0.4% |
| Potawatomi | 9 | 0.4% |
| Puerto Rican | 27 | 1.1% |
| Scandinavian | 4 | 0.2% |
| Scotch-Irish | 6 | 0.2% |
| Scottish | 104 | 4.1% |
| Swedish | 25 | 1.0% |
| Welsh | 30 | 1.2% |
| Yugoslavian | 7 | 0.3% | View All 33 Rows |
Immigrants in Kalkaska
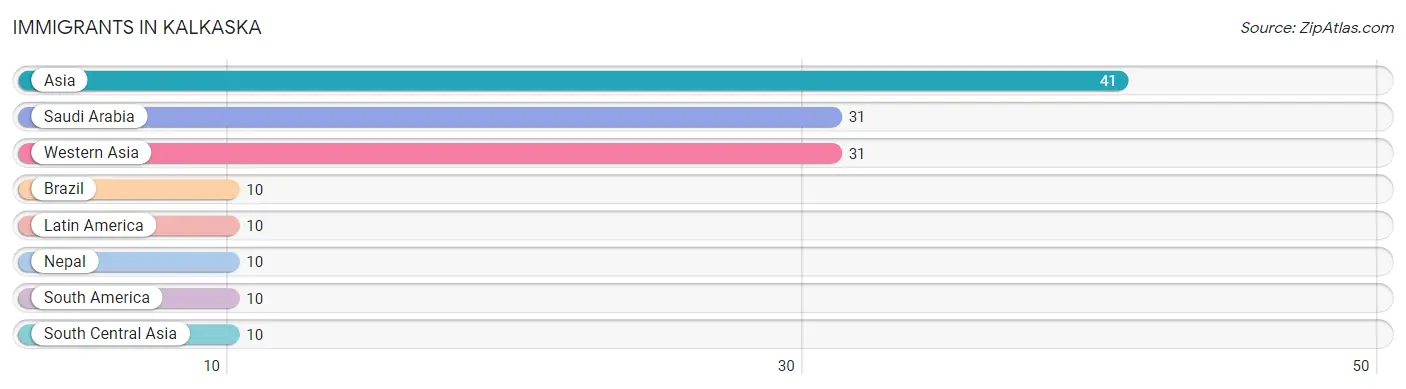
The most numerous immigrant groups reported in Kalkaska came from Asia (41 | 1.6%), Saudi Arabia (31 | 1.2%), Western Asia (31 | 1.2%), Brazil (10 | 0.4%), and Latin America (10 | 0.4%), together accounting for 4.8% of all Kalkaska residents.
| Immigration Origin | # Population | % Population |
| Asia | 41 | 1.6% |
| Brazil | 10 | 0.4% |
| Latin America | 10 | 0.4% |
| Nepal | 10 | 0.4% |
| Saudi Arabia | 31 | 1.2% |
| South America | 10 | 0.4% |
| South Central Asia | 10 | 0.4% |
| Western Asia | 31 | 1.2% | View All 8 Rows |
Sex and Age in Kalkaska
Sex and Age in Kalkaska
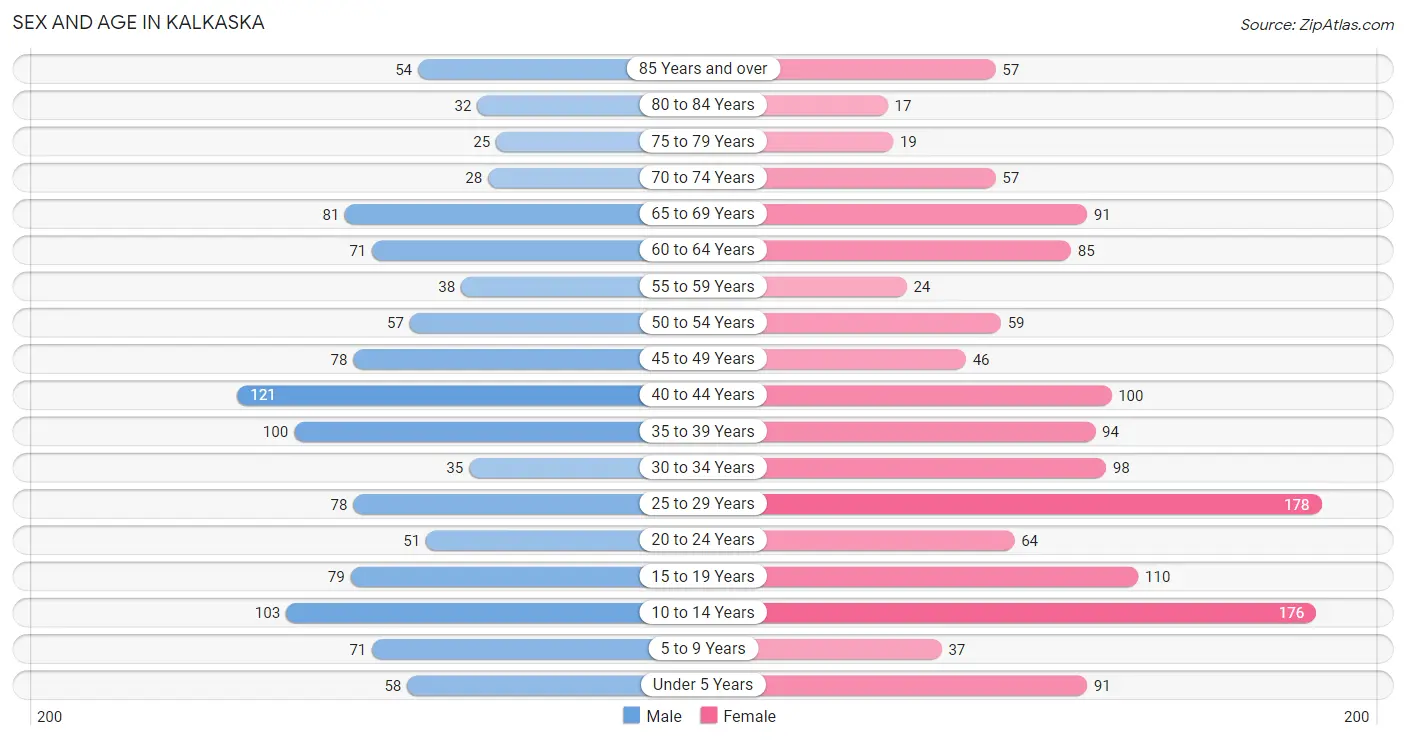
The most populous age groups in Kalkaska are 40 to 44 Years (121 | 10.4%) for men and 25 to 29 Years (178 | 12.7%) for women.
| Age Bracket | Male | Female |
| Under 5 Years | 58 (5.0%) | 91 (6.5%) |
| 5 to 9 Years | 71 (6.1%) | 37 (2.6%) |
| 10 to 14 Years | 103 (8.9%) | 176 (12.5%) |
| 15 to 19 Years | 79 (6.8%) | 110 (7.8%) |
| 20 to 24 Years | 51 (4.4%) | 64 (4.6%) |
| 25 to 29 Years | 78 (6.7%) | 178 (12.7%) |
| 30 to 34 Years | 35 (3.0%) | 98 (7.0%) |
| 35 to 39 Years | 100 (8.6%) | 94 (6.7%) |
| 40 to 44 Years | 121 (10.4%) | 100 (7.1%) |
| 45 to 49 Years | 78 (6.7%) | 46 (3.3%) |
| 50 to 54 Years | 57 (4.9%) | 59 (4.2%) |
| 55 to 59 Years | 38 (3.3%) | 24 (1.7%) |
| 60 to 64 Years | 71 (6.1%) | 85 (6.1%) |
| 65 to 69 Years | 81 (7.0%) | 91 (6.5%) |
| 70 to 74 Years | 28 (2.4%) | 57 (4.1%) |
| 75 to 79 Years | 25 (2.2%) | 19 (1.3%) |
| 80 to 84 Years | 32 (2.8%) | 17 (1.2%) |
| 85 Years and over | 54 (4.7%) | 57 (4.1%) |
| Total | 1,160 (100.0%) | 1,403 (100.0%) |
Families and Households in Kalkaska
Median Family Size in Kalkaska
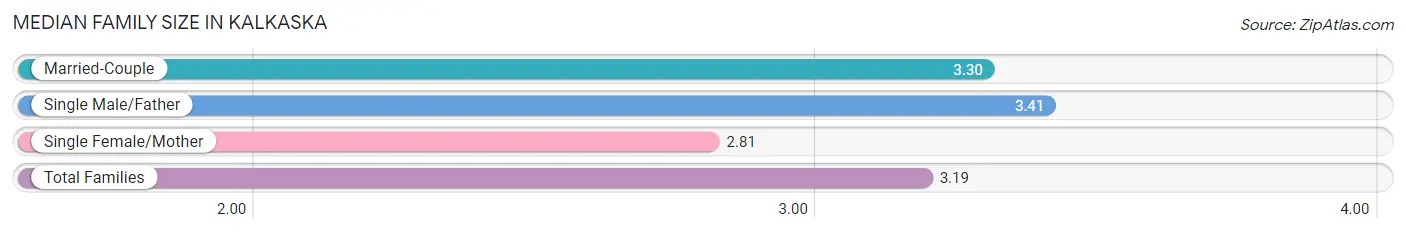
The median family size in Kalkaska is 3.19 persons per family, with single male/father families (61 | 10.8%) accounting for the largest median family size of 3.41 persons per family. On the other hand, single female/mother families (144 | 25.5%) represent the smallest median family size with 2.81 persons per family.
| Family Type | # Families | Family Size |
| Married-Couple | 359 (63.6%) | 3.30 |
| Single Male/Father | 61 (10.8%) | 3.41 |
| Single Female/Mother | 144 (25.5%) | 2.81 |
| Total Families | 564 (100.0%) | 3.19 |
Median Household Size in Kalkaska
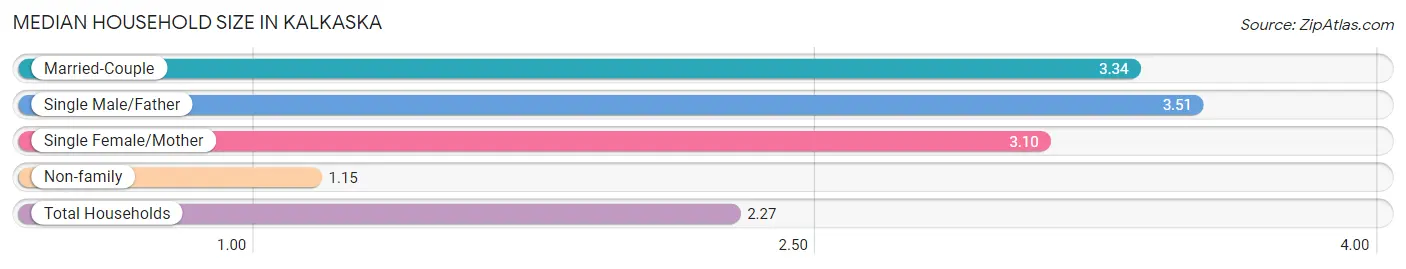
The median household size in Kalkaska is 2.27 persons per household, with single male/father households (61 | 5.6%) accounting for the largest median household size of 3.51 persons per household. non-family households (518 | 47.9%) represent the smallest median household size with 1.15 persons per household.
| Household Type | # Households | Household Size |
| Married-Couple | 359 (33.2%) | 3.34 |
| Single Male/Father | 61 (5.6%) | 3.51 |
| Single Female/Mother | 144 (13.3%) | 3.10 |
| Non-family | 518 (47.9%) | 1.15 |
| Total Households | 1,082 (100.0%) | 2.27 |
Household Size by Marriage Status in Kalkaska
Out of a total of 1,082 households in Kalkaska, 564 (52.1%) are family households, while 518 (47.9%) are nonfamily households. The most numerous type of family households are 2-person households, comprising 219, and the most common type of nonfamily households are 1-person households, comprising 445.
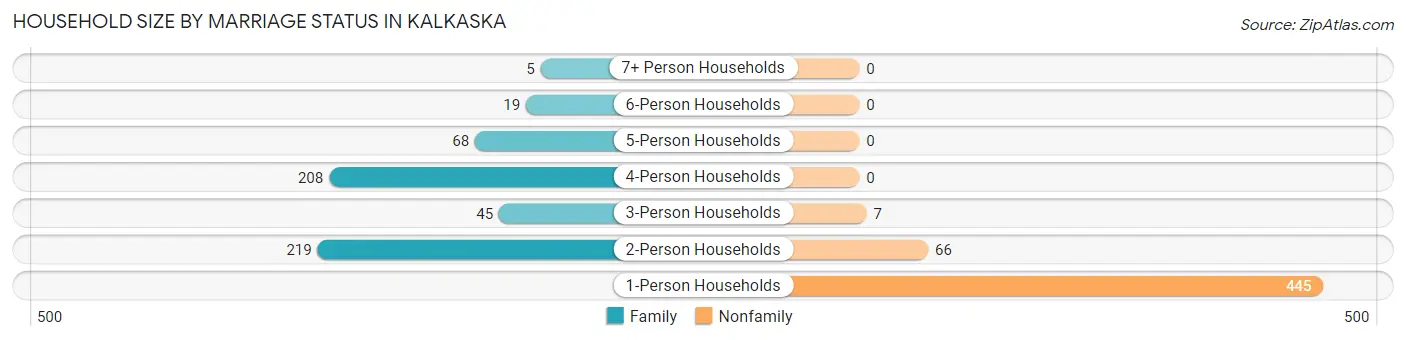
| Household Size | Family Households | Nonfamily Households |
| 1-Person Households | - | 445 (41.1%) |
| 2-Person Households | 219 (20.2%) | 66 (6.1%) |
| 3-Person Households | 45 (4.2%) | 7 (0.6%) |
| 4-Person Households | 208 (19.2%) | 0 (0.0%) |
| 5-Person Households | 68 (6.3%) | 0 (0.0%) |
| 6-Person Households | 19 (1.8%) | 0 (0.0%) |
| 7+ Person Households | 5 (0.5%) | 0 (0.0%) |
| Total | 564 (52.1%) | 518 (47.9%) |
Female Fertility in Kalkaska
Fertility by Age in Kalkaska
| Age Bracket | Women with Births | Births / 1,000 Women |
| 15 to 19 years | 0 (0.0%) | 0.0 |
| 20 to 34 years | 0 (0.0%) | 0.0 |
| 35 to 50 years | 0 (0.0%) | 0.0 |
| Total | 0 (0.0%) | 0.0 |
Fertility by Age by Marriage Status in Kalkaska
| Age Bracket | Married | Unmarried |
| 15 to 19 years | 0 (0.0%) | 0 (0.0%) |
| 20 to 34 years | 0 (0.0%) | 0 (0.0%) |
| 35 to 50 years | 0 (0.0%) | 0 (0.0%) |
| Total | 0 (0.0%) | 0 (0.0%) |
Fertility by Education in Kalkaska
| Educational Attainment | Women with Births | Births / 1,000 Women |
| Less than High School | 0 (0.0%) | 0.0 |
| High School Diploma | 0 (0.0%) | 0.0 |
| College or Associate's Degree | 0 (0.0%) | 0.0 |
| Bachelor's Degree | 0 (0.0%) | 0.0 |
| Graduate Degree | 0 (0.0%) | 0.0 |
| Total | 0 (0.0%) | 0.0 |
Fertility by Education by Marriage Status in Kalkaska
| Educational Attainment | Married | Unmarried |
| Less than High School | 0 (0.0%) | 0 (0.0%) |
| High School Diploma | 0 (0.0%) | 0 (0.0%) |
| College or Associate's Degree | 0 (0.0%) | 0 (0.0%) |
| Bachelor's Degree | 0 (0.0%) | 0 (0.0%) |
| Graduate Degree | 0 (0.0%) | 0 (0.0%) |
| Total | 0 (0.0%) | 0 (0.0%) |
Employment Characteristics in Kalkaska
Employment by Class of Employer in Kalkaska
Among the 1,003 employed individuals in Kalkaska, private company employees (830 | 82.8%), not-for-profit organizations (49 | 4.9%), and local government employees (36 | 3.6%) make up the most common classes of employment.
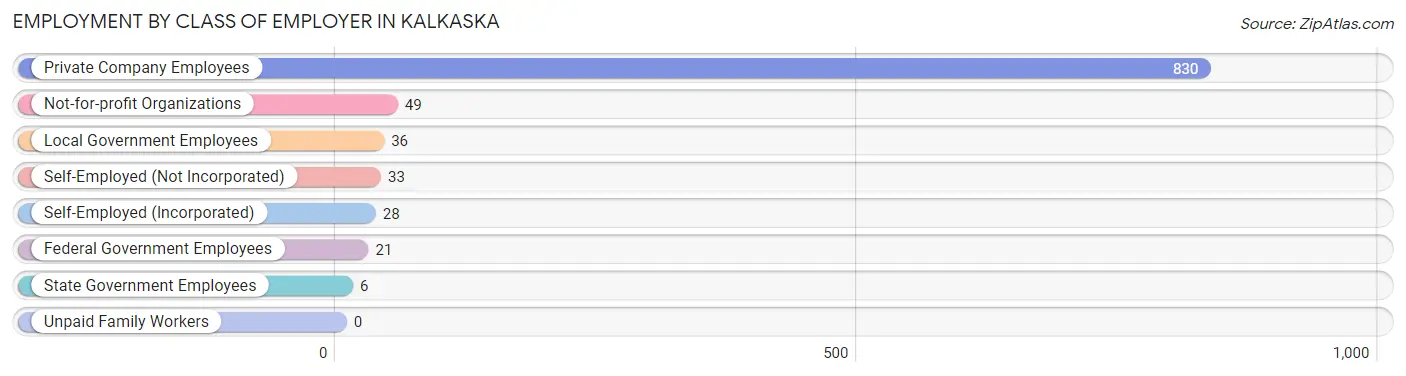
| Employer Class | # Employees | % Employees |
| Private Company Employees | 830 | 82.8% |
| Self-Employed (Incorporated) | 28 | 2.8% |
| Self-Employed (Not Incorporated) | 33 | 3.3% |
| Not-for-profit Organizations | 49 | 4.9% |
| Local Government Employees | 36 | 3.6% |
| State Government Employees | 6 | 0.6% |
| Federal Government Employees | 21 | 2.1% |
| Unpaid Family Workers | 0 | 0.0% |
| Total | 1,003 | 100.0% |
Employment Status by Age in Kalkaska
According to the labor force statistics for Kalkaska, out of the total population over 16 years of age (2,009), 54.0% or 1,085 individuals are in the labor force, with 4.5% or 49 of them unemployed. The age group with the highest labor force participation rate is 35 to 44 years, with 92.8% or 385 individuals in the labor force. Within the labor force, the 60 to 64 years age range has the highest percentage of unemployed individuals, with 12.8% or 5 of them being unemployed.
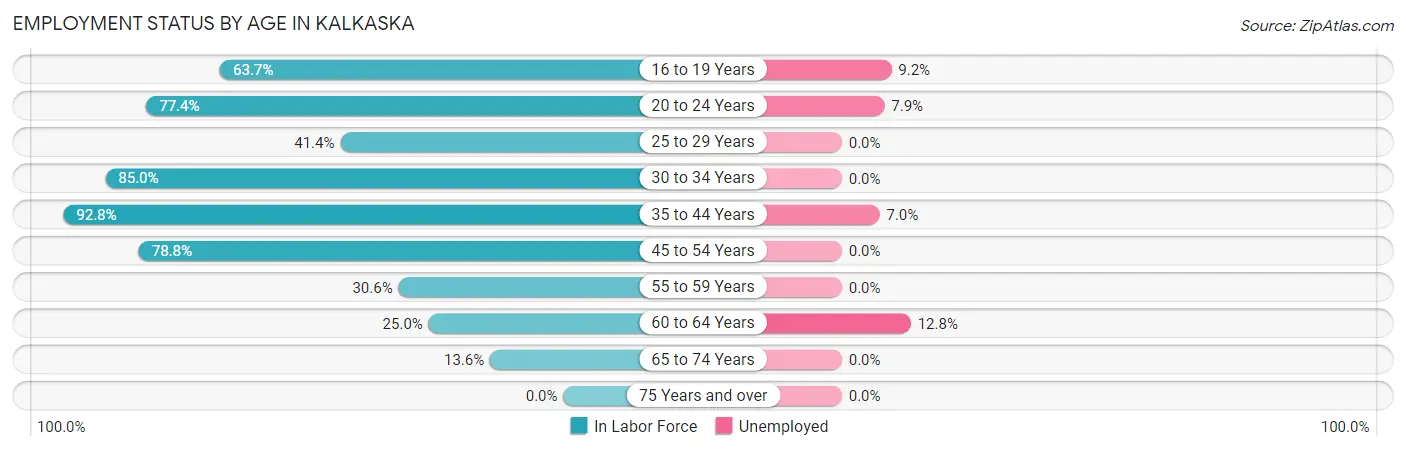
| Age Bracket | In Labor Force | Unemployed |
| 16 to 19 Years | 109 (63.7%) | 10 (9.2%) |
| 20 to 24 Years | 89 (77.4%) | 7 (7.9%) |
| 25 to 29 Years | 106 (41.4%) | 0 (0.0%) |
| 30 to 34 Years | 113 (85.0%) | 0 (0.0%) |
| 35 to 44 Years | 385 (92.8%) | 27 (7.0%) |
| 45 to 54 Years | 189 (78.8%) | 0 (0.0%) |
| 55 to 59 Years | 19 (30.6%) | 0 (0.0%) |
| 60 to 64 Years | 39 (25.0%) | 5 (12.8%) |
| 65 to 74 Years | 35 (13.6%) | 0 (0.0%) |
| 75 Years and over | 0 (0.0%) | 0 (0.0%) |
| Total | 1,085 (54.0%) | 49 (4.5%) |
Employment Status by Educational Attainment in Kalkaska
According to labor force statistics for Kalkaska, 67.4% of individuals (851) out of the total population between 25 and 64 years of age (1,262) are in the labor force, with 3.8% or 32 of them being unemployed. The group with the highest labor force participation rate are those with the educational attainment of bachelor's degree or higher, with 73.7% or 146 individuals in the labor force. Within the labor force, individuals with high school diploma education have the highest percentage of unemployment, with 9.0% or 27 of them being unemployed.
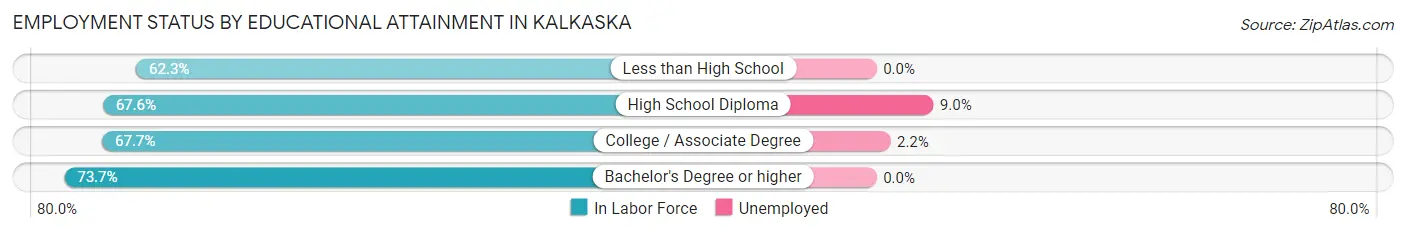
| Educational Attainment | In Labor Force | Unemployed |
| Less than High School | 175 (62.3%) | 0 (0.0%) |
| High School Diploma | 299 (67.6%) | 40 (9.0%) |
| College / Associate Degree | 231 (67.7%) | 8 (2.2%) |
| Bachelor's Degree or higher | 146 (73.7%) | 0 (0.0%) |
| Total | 851 (67.4%) | 48 (3.8%) |
Employment Occupations by Sex in Kalkaska
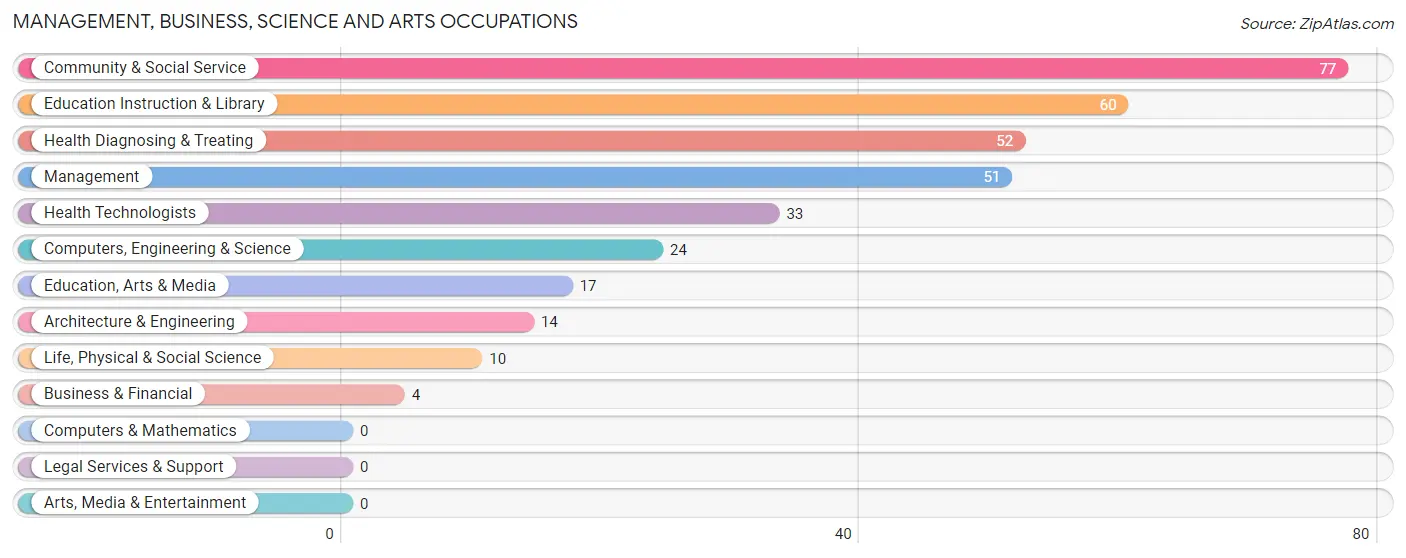
Management, Business, Science and Arts Occupations
The most common Management, Business, Science and Arts occupations in Kalkaska are Community & Social Service (77 | 7.4%), Education Instruction & Library (60 | 5.8%), Health Diagnosing & Treating (52 | 5.0%), Management (51 | 4.9%), and Health Technologists (33 | 3.2%).
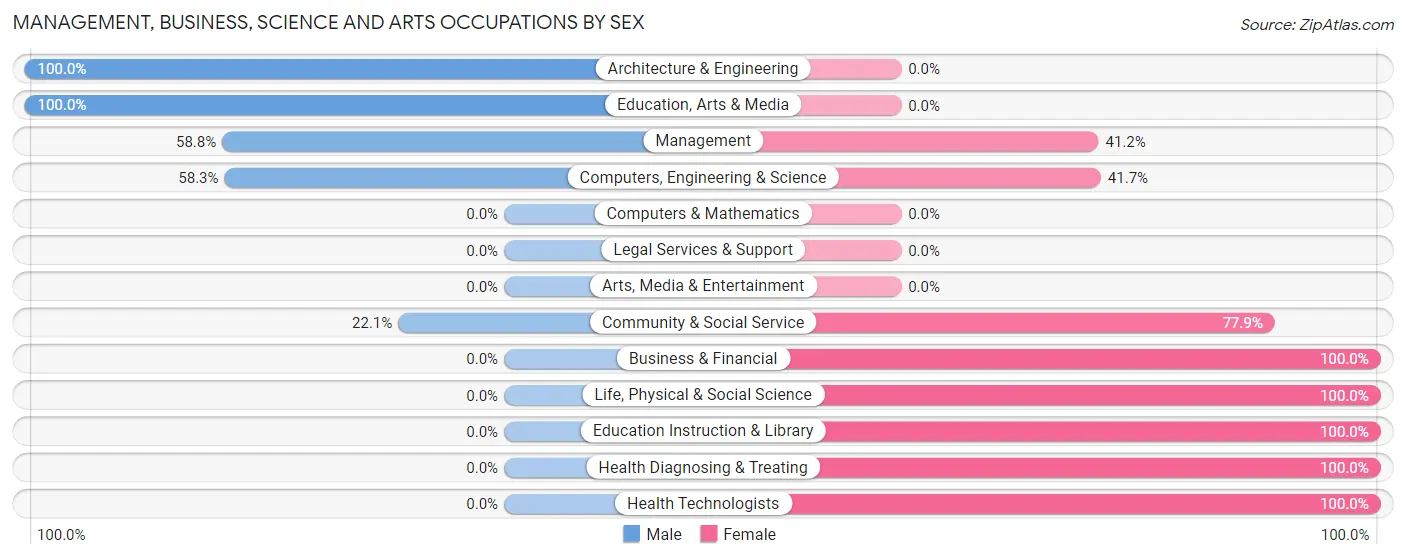
Management, Business, Science and Arts Occupations by Sex
Within the Management, Business, Science and Arts occupations in Kalkaska, the most male-oriented occupations are Architecture & Engineering (100.0%), Education, Arts & Media (100.0%), and Management (58.8%), while the most female-oriented occupations are Business & Financial (100.0%), Life, Physical & Social Science (100.0%), and Education Instruction & Library (100.0%).
| Occupation | Male | Female |
| Management | 30 (58.8%) | 21 (41.2%) |
| Business & Financial | 0 (0.0%) | 4 (100.0%) |
| Computers, Engineering & Science | 14 (58.3%) | 10 (41.7%) |
| Computers & Mathematics | 0 (0.0%) | 0 (0.0%) |
| Architecture & Engineering | 14 (100.0%) | 0 (0.0%) |
| Life, Physical & Social Science | 0 (0.0%) | 10 (100.0%) |
| Community & Social Service | 17 (22.1%) | 60 (77.9%) |
| Education, Arts & Media | 17 (100.0%) | 0 (0.0%) |
| Legal Services & Support | 0 (0.0%) | 0 (0.0%) |
| Education Instruction & Library | 0 (0.0%) | 60 (100.0%) |
| Arts, Media & Entertainment | 0 (0.0%) | 0 (0.0%) |
| Health Diagnosing & Treating | 0 (0.0%) | 52 (100.0%) |
| Health Technologists | 0 (0.0%) | 33 (100.0%) |
| Total (Category) | 61 (29.3%) | 147 (70.7%) |
| Total (Overall) | 518 (50.0%) | 517 (49.9%) |
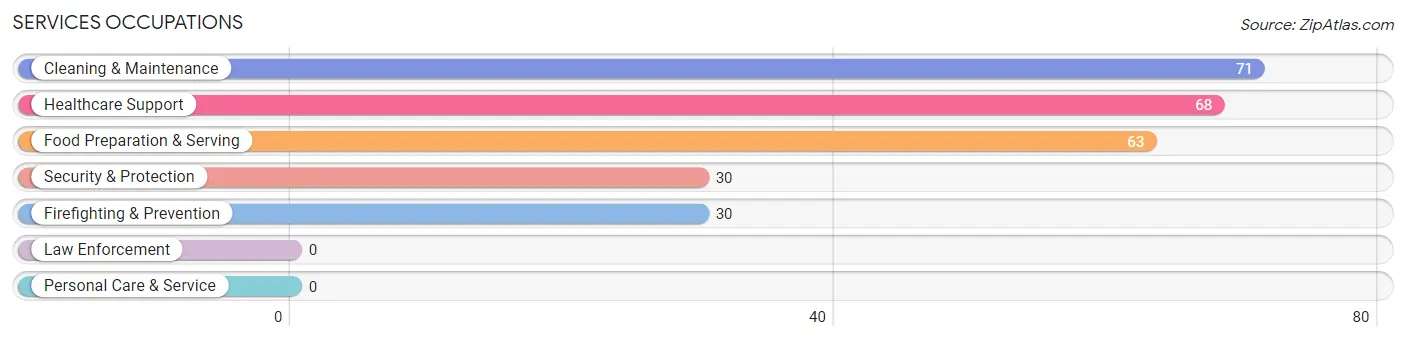
Services Occupations
The most common Services occupations in Kalkaska are Cleaning & Maintenance (71 | 6.9%), Healthcare Support (68 | 6.6%), Food Preparation & Serving (63 | 6.1%), Security & Protection (30 | 2.9%), and Firefighting & Prevention (30 | 2.9%).
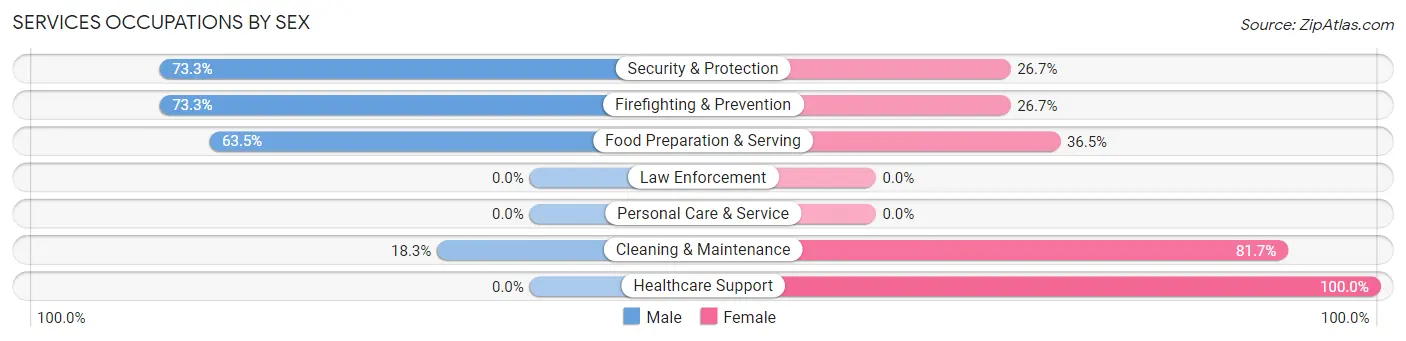
Services Occupations by Sex
Within the Services occupations in Kalkaska, the most male-oriented occupations are Security & Protection (73.3%), Firefighting & Prevention (73.3%), and Food Preparation & Serving (63.5%), while the most female-oriented occupations are Healthcare Support (100.0%), Cleaning & Maintenance (81.7%), and Food Preparation & Serving (36.5%).
| Occupation | Male | Female |
| Healthcare Support | 0 (0.0%) | 68 (100.0%) |
| Security & Protection | 22 (73.3%) | 8 (26.7%) |
| Firefighting & Prevention | 22 (73.3%) | 8 (26.7%) |
| Law Enforcement | 0 (0.0%) | 0 (0.0%) |
| Food Preparation & Serving | 40 (63.5%) | 23 (36.5%) |
| Cleaning & Maintenance | 13 (18.3%) | 58 (81.7%) |
| Personal Care & Service | 0 (0.0%) | 0 (0.0%) |
| Total (Category) | 75 (32.3%) | 157 (67.7%) |
| Total (Overall) | 518 (50.0%) | 517 (49.9%) |
Sales and Office Occupations
The most common Sales and Office occupations in Kalkaska are Sales & Related (141 | 13.6%), and Office & Administration (80 | 7.7%).
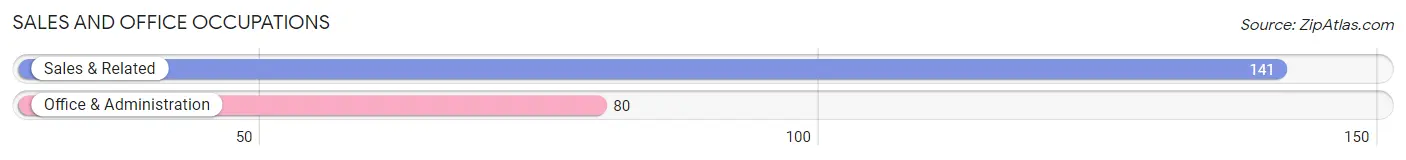
Sales and Office Occupations by Sex

| Occupation | Male | Female |
| Sales & Related | 15 (10.6%) | 126 (89.4%) |
| Office & Administration | 23 (28.7%) | 57 (71.3%) |
| Total (Category) | 38 (17.2%) | 183 (82.8%) |
| Total (Overall) | 518 (50.0%) | 517 (49.9%) |
Natural Resources, Construction and Maintenance Occupations
The most common Natural Resources, Construction and Maintenance occupations in Kalkaska are Construction & Extraction (59 | 5.7%), Installation, Maintenance & Repair (48 | 4.6%), and Farming, Fishing & Forestry (10 | 1.0%).
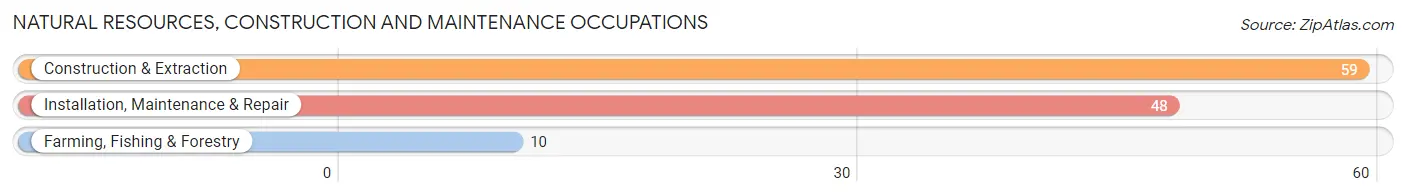
Natural Resources, Construction and Maintenance Occupations by Sex
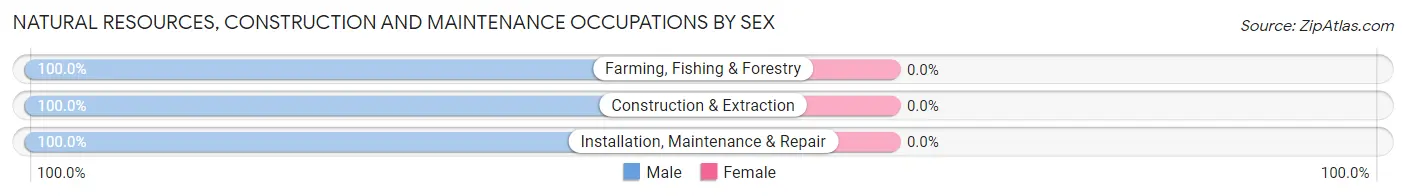
| Occupation | Male | Female |
| Farming, Fishing & Forestry | 10 (100.0%) | 0 (0.0%) |
| Construction & Extraction | 59 (100.0%) | 0 (0.0%) |
| Installation, Maintenance & Repair | 48 (100.0%) | 0 (0.0%) |
| Total (Category) | 117 (100.0%) | 0 (0.0%) |
| Total (Overall) | 518 (50.0%) | 517 (49.9%) |
Production, Transportation and Moving Occupations
The most common Production, Transportation and Moving occupations in Kalkaska are Production (147 | 14.2%), Material Moving (65 | 6.3%), and Transportation (45 | 4.3%).
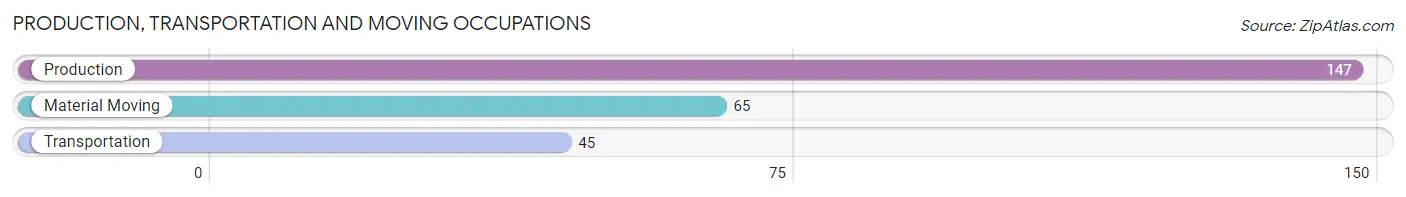
Production, Transportation and Moving Occupations by Sex
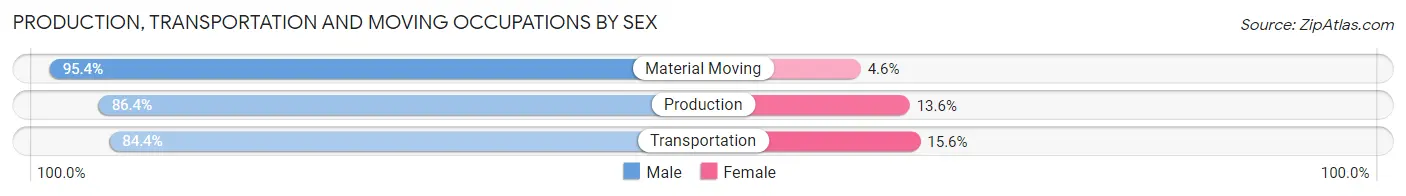
| Occupation | Male | Female |
| Production | 127 (86.4%) | 20 (13.6%) |
| Transportation | 38 (84.4%) | 7 (15.6%) |
| Material Moving | 62 (95.4%) | 3 (4.6%) |
| Total (Category) | 227 (88.3%) | 30 (11.7%) |
| Total (Overall) | 518 (50.0%) | 517 (49.9%) |
Employment Industries by Sex in Kalkaska
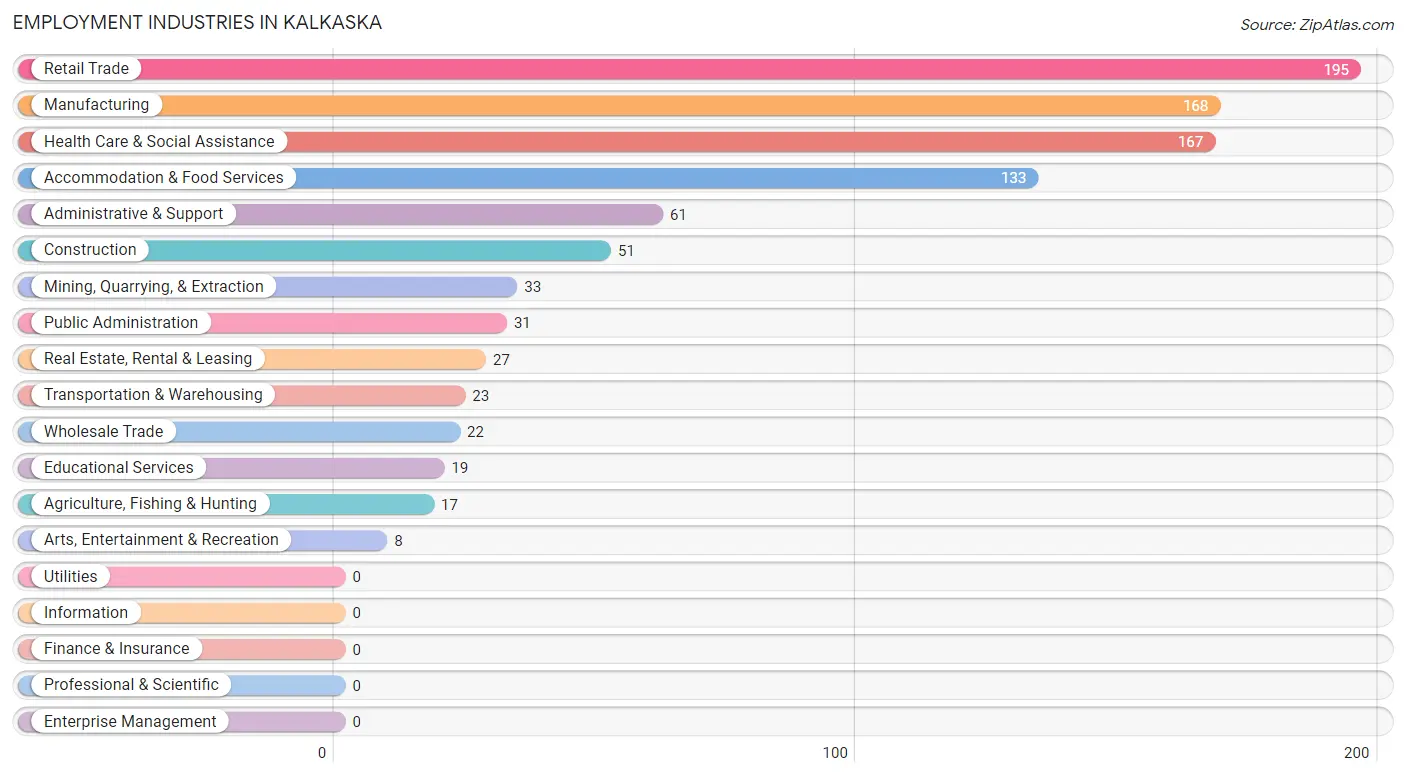
Employment Industries in Kalkaska
The major employment industries in Kalkaska include Retail Trade (195 | 18.8%), Manufacturing (168 | 16.2%), Health Care & Social Assistance (167 | 16.1%), Accommodation & Food Services (133 | 12.9%), and Administrative & Support (61 | 5.9%).
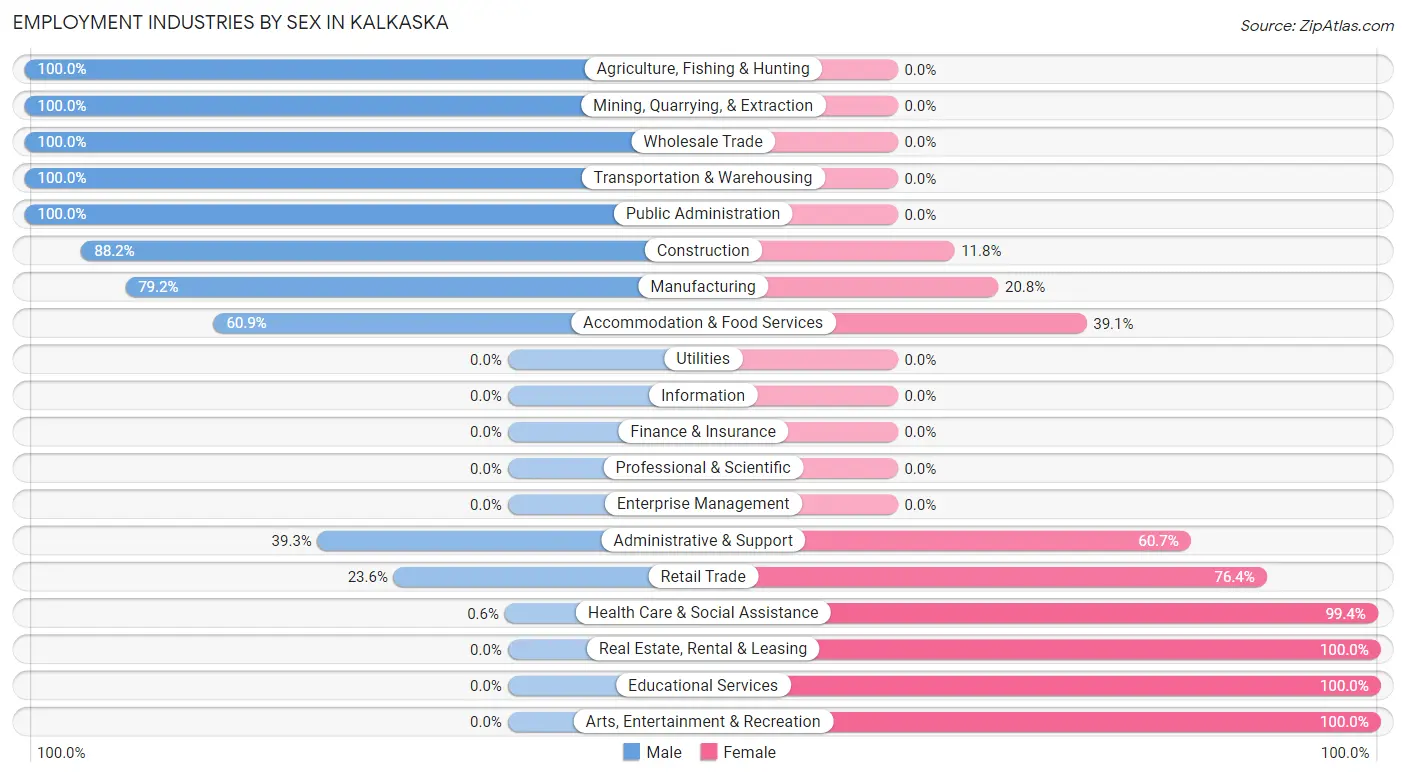
Employment Industries by Sex in Kalkaska
The Kalkaska industries that see more men than women are Agriculture, Fishing & Hunting (100.0%), Mining, Quarrying, & Extraction (100.0%), and Wholesale Trade (100.0%), whereas the industries that tend to have a higher number of women are Real Estate, Rental & Leasing (100.0%), Educational Services (100.0%), and Arts, Entertainment & Recreation (100.0%).
| Industry | Male | Female |
| Agriculture, Fishing & Hunting | 17 (100.0%) | 0 (0.0%) |
| Mining, Quarrying, & Extraction | 33 (100.0%) | 0 (0.0%) |
| Construction | 45 (88.2%) | 6 (11.8%) |
| Manufacturing | 133 (79.2%) | 35 (20.8%) |
| Wholesale Trade | 22 (100.0%) | 0 (0.0%) |
| Retail Trade | 46 (23.6%) | 149 (76.4%) |
| Transportation & Warehousing | 23 (100.0%) | 0 (0.0%) |
| Utilities | 0 (0.0%) | 0 (0.0%) |
| Information | 0 (0.0%) | 0 (0.0%) |
| Finance & Insurance | 0 (0.0%) | 0 (0.0%) |
| Real Estate, Rental & Leasing | 0 (0.0%) | 27 (100.0%) |
| Professional & Scientific | 0 (0.0%) | 0 (0.0%) |
| Enterprise Management | 0 (0.0%) | 0 (0.0%) |
| Administrative & Support | 24 (39.3%) | 37 (60.7%) |
| Educational Services | 0 (0.0%) | 19 (100.0%) |
| Health Care & Social Assistance | 1 (0.6%) | 166 (99.4%) |
| Arts, Entertainment & Recreation | 0 (0.0%) | 8 (100.0%) |
| Accommodation & Food Services | 81 (60.9%) | 52 (39.1%) |
| Public Administration | 31 (100.0%) | 0 (0.0%) |
| Total | 518 (50.0%) | 517 (49.9%) |
Education in Kalkaska
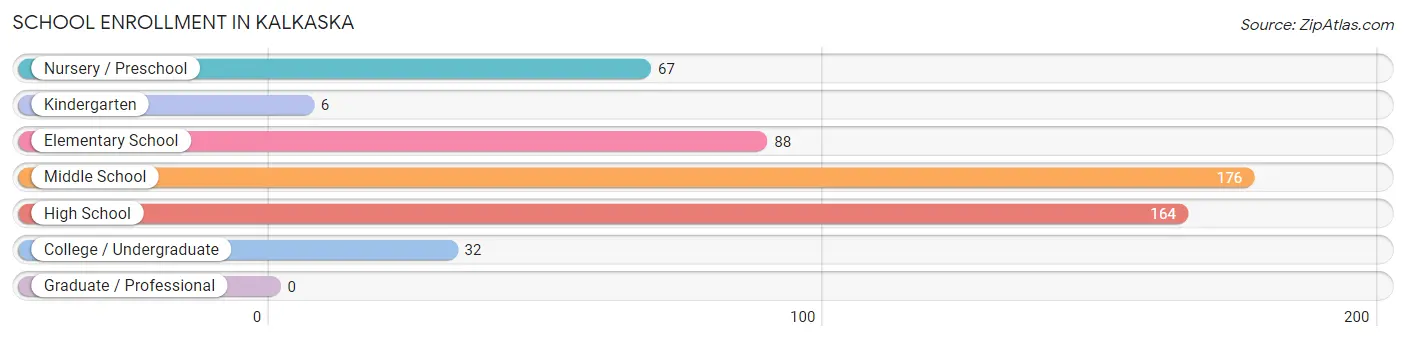
School Enrollment in Kalkaska
The most common levels of schooling among the 533 students in Kalkaska are middle school (176 | 33.0%), high school (164 | 30.8%), and elementary school (88 | 16.5%).
| School Level | # Students | % Students |
| Nursery / Preschool | 67 | 12.6% |
| Kindergarten | 6 | 1.1% |
| Elementary School | 88 | 16.5% |
| Middle School | 176 | 33.0% |
| High School | 164 | 30.8% |
| College / Undergraduate | 32 | 6.0% |
| Graduate / Professional | 0 | 0.0% |
| Total | 533 | 100.0% |
School Enrollment by Age by Funding Source in Kalkaska
Out of a total of 533 students who are enrolled in schools in Kalkaska, 30 (5.6%) attend a private institution, while the remaining 503 (94.4%) are enrolled in public schools. The age group of 5 to 9 year old has the highest likelihood of being enrolled in private schools, with 18 (21.2% in the age bracket) enrolled. Conversely, the age group of 3 to 4 year olds has the lowest likelihood of being enrolled in a private school, with 39 (100.0% in the age bracket) attending a public institution.
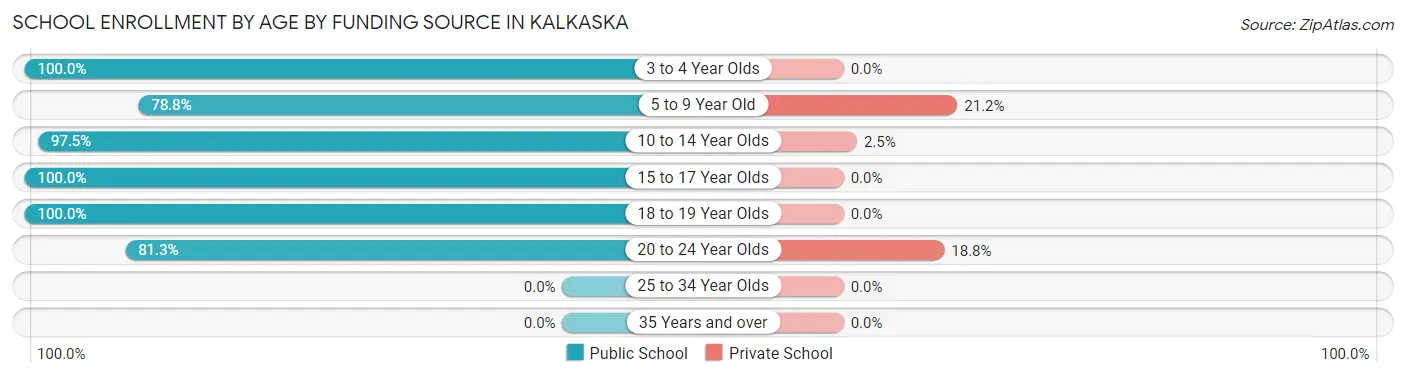
| Age Bracket | Public School | Private School |
| 3 to 4 Year Olds | 39 (100.0%) | 0 (0.0%) |
| 5 to 9 Year Old | 67 (78.8%) | 18 (21.2%) |
| 10 to 14 Year Olds | 236 (97.5%) | 6 (2.5%) |
| 15 to 17 Year Olds | 114 (100.0%) | 0 (0.0%) |
| 18 to 19 Year Olds | 21 (100.0%) | 0 (0.0%) |
| 20 to 24 Year Olds | 26 (81.2%) | 6 (18.8%) |
| 25 to 34 Year Olds | 0 (0.0%) | 0 (0.0%) |
| 35 Years and over | 0 (0.0%) | 0 (0.0%) |
| Total | 503 (94.4%) | 30 (5.6%) |
Educational Attainment by Field of Study in Kalkaska
Science & technology (55 | 19.8%), business (44 | 15.8%), education (35 | 12.6%), bio, nature & agricultural (34 | 12.2%), and computers & mathematics (28 | 10.1%) are the most common fields of study among 278 individuals in Kalkaska who have obtained a bachelor's degree or higher.
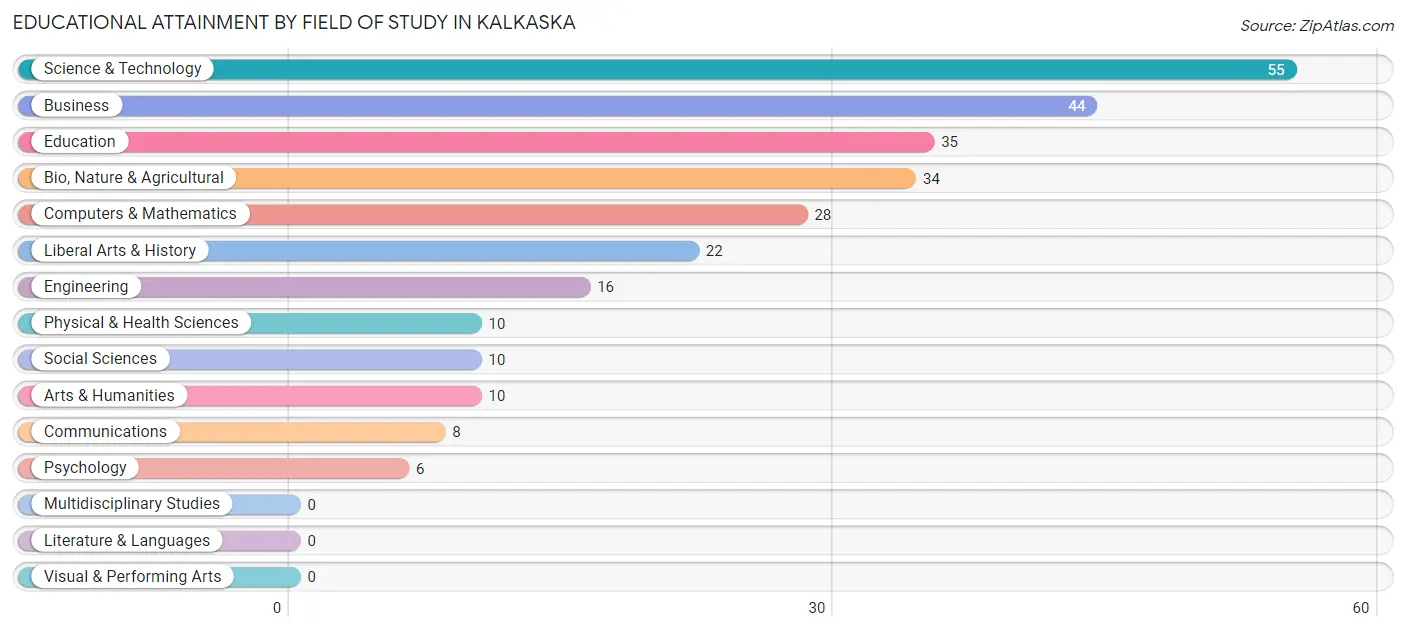
| Field of Study | # Graduates | % Graduates |
| Computers & Mathematics | 28 | 10.1% |
| Bio, Nature & Agricultural | 34 | 12.2% |
| Physical & Health Sciences | 10 | 3.6% |
| Psychology | 6 | 2.2% |
| Social Sciences | 10 | 3.6% |
| Engineering | 16 | 5.8% |
| Multidisciplinary Studies | 0 | 0.0% |
| Science & Technology | 55 | 19.8% |
| Business | 44 | 15.8% |
| Education | 35 | 12.6% |
| Literature & Languages | 0 | 0.0% |
| Liberal Arts & History | 22 | 7.9% |
| Visual & Performing Arts | 0 | 0.0% |
| Communications | 8 | 2.9% |
| Arts & Humanities | 10 | 3.6% |
| Total | 278 | 100.0% |
Transportation & Commute in Kalkaska
Vehicle Availability by Sex in Kalkaska
The most prevalent vehicle ownership categories in Kalkaska are males with 2 vehicles (249, accounting for 48.9%) and females with 2 vehicles (159, making up 50.4%).
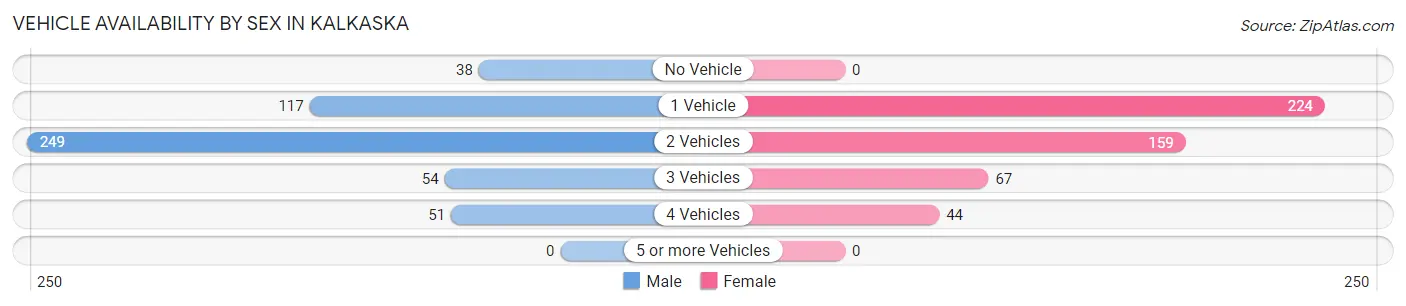
| Vehicles Available | Male | Female |
| No Vehicle | 38 (7.5%) | 0 (0.0%) |
| 1 Vehicle | 117 (23.0%) | 224 (45.3%) |
| 2 Vehicles | 249 (48.9%) | 159 (32.2%) |
| 3 Vehicles | 54 (10.6%) | 67 (13.6%) |
| 4 Vehicles | 51 (10.0%) | 44 (8.9%) |
| 5 or more Vehicles | 0 (0.0%) | 0 (0.0%) |
| Total | 509 (100.0%) | 494 (100.0%) |
Commute Time in Kalkaska
The most frequently occuring commute durations in Kalkaska are 5 to 9 minutes (330 commuters, 33.3%), less than 5 minutes (118 commuters, 11.9%), and 15 to 19 minutes (112 commuters, 11.3%).
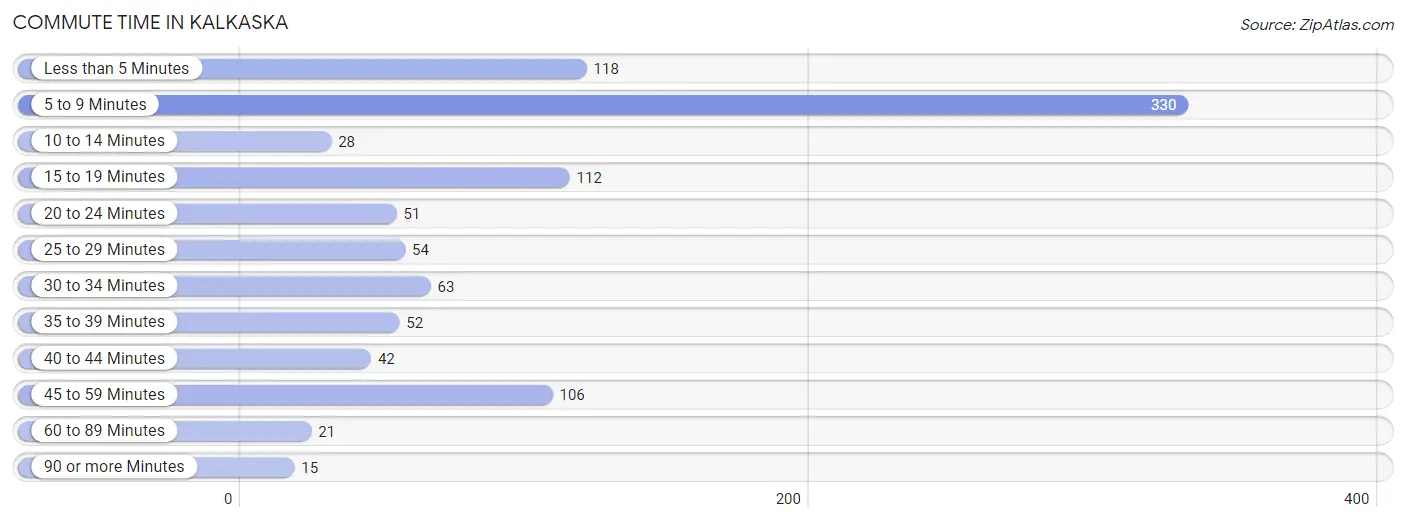
| Commute Time | # Commuters | % Commuters |
| Less than 5 Minutes | 118 | 11.9% |
| 5 to 9 Minutes | 330 | 33.3% |
| 10 to 14 Minutes | 28 | 2.8% |
| 15 to 19 Minutes | 112 | 11.3% |
| 20 to 24 Minutes | 51 | 5.1% |
| 25 to 29 Minutes | 54 | 5.4% |
| 30 to 34 Minutes | 63 | 6.4% |
| 35 to 39 Minutes | 52 | 5.2% |
| 40 to 44 Minutes | 42 | 4.2% |
| 45 to 59 Minutes | 106 | 10.7% |
| 60 to 89 Minutes | 21 | 2.1% |
| 90 or more Minutes | 15 | 1.5% |
Commute Time by Sex in Kalkaska
The most common commute times in Kalkaska are 5 to 9 minutes (169 commuters, 33.2%) for males and 5 to 9 minutes (161 commuters, 33.3%) for females.
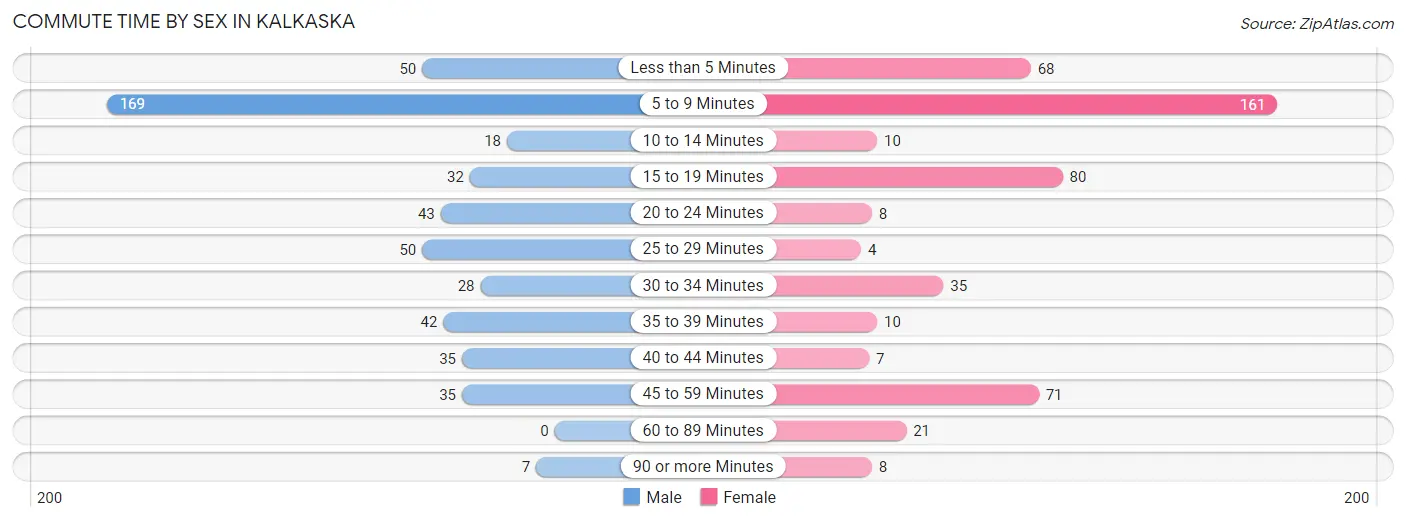
| Commute Time | Male | Female |
| Less than 5 Minutes | 50 (9.8%) | 68 (14.1%) |
| 5 to 9 Minutes | 169 (33.2%) | 161 (33.3%) |
| 10 to 14 Minutes | 18 (3.5%) | 10 (2.1%) |
| 15 to 19 Minutes | 32 (6.3%) | 80 (16.6%) |
| 20 to 24 Minutes | 43 (8.5%) | 8 (1.7%) |
| 25 to 29 Minutes | 50 (9.8%) | 4 (0.8%) |
| 30 to 34 Minutes | 28 (5.5%) | 35 (7.2%) |
| 35 to 39 Minutes | 42 (8.3%) | 10 (2.1%) |
| 40 to 44 Minutes | 35 (6.9%) | 7 (1.5%) |
| 45 to 59 Minutes | 35 (6.9%) | 71 (14.7%) |
| 60 to 89 Minutes | 0 (0.0%) | 21 (4.3%) |
| 90 or more Minutes | 7 (1.4%) | 8 (1.7%) |
Time of Departure to Work by Sex in Kalkaska
The most frequent times of departure to work in Kalkaska are 7:00 AM to 7:29 AM (95, 18.7%) for males and 7:00 AM to 7:29 AM (132, 27.3%) for females.
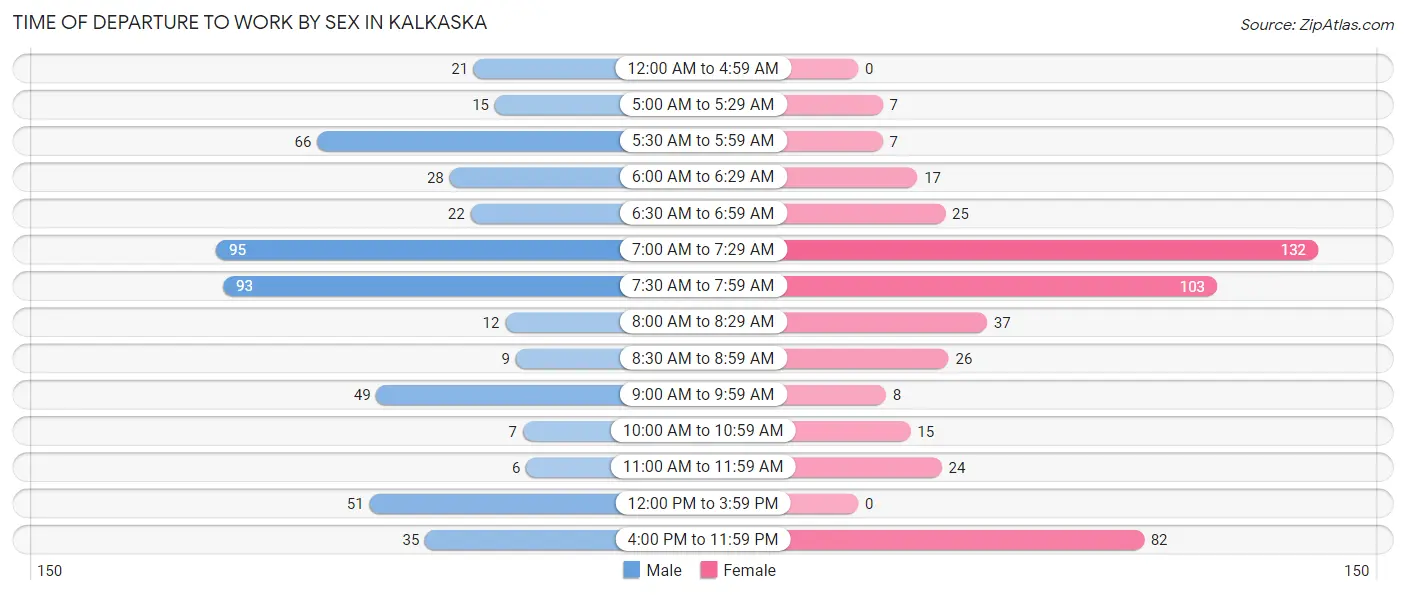
| Time of Departure | Male | Female |
| 12:00 AM to 4:59 AM | 21 (4.1%) | 0 (0.0%) |
| 5:00 AM to 5:29 AM | 15 (2.9%) | 7 (1.5%) |
| 5:30 AM to 5:59 AM | 66 (13.0%) | 7 (1.5%) |
| 6:00 AM to 6:29 AM | 28 (5.5%) | 17 (3.5%) |
| 6:30 AM to 6:59 AM | 22 (4.3%) | 25 (5.2%) |
| 7:00 AM to 7:29 AM | 95 (18.7%) | 132 (27.3%) |
| 7:30 AM to 7:59 AM | 93 (18.3%) | 103 (21.3%) |
| 8:00 AM to 8:29 AM | 12 (2.4%) | 37 (7.7%) |
| 8:30 AM to 8:59 AM | 9 (1.8%) | 26 (5.4%) |
| 9:00 AM to 9:59 AM | 49 (9.6%) | 8 (1.7%) |
| 10:00 AM to 10:59 AM | 7 (1.4%) | 15 (3.1%) |
| 11:00 AM to 11:59 AM | 6 (1.2%) | 24 (5.0%) |
| 12:00 PM to 3:59 PM | 51 (10.0%) | 0 (0.0%) |
| 4:00 PM to 11:59 PM | 35 (6.9%) | 82 (17.0%) |
| Total | 509 (100.0%) | 483 (100.0%) |
Housing Occupancy in Kalkaska
Occupancy by Ownership in Kalkaska
Of the total 1,082 dwellings in Kalkaska, owner-occupied units account for 588 (54.3%), while renter-occupied units make up 494 (45.7%).
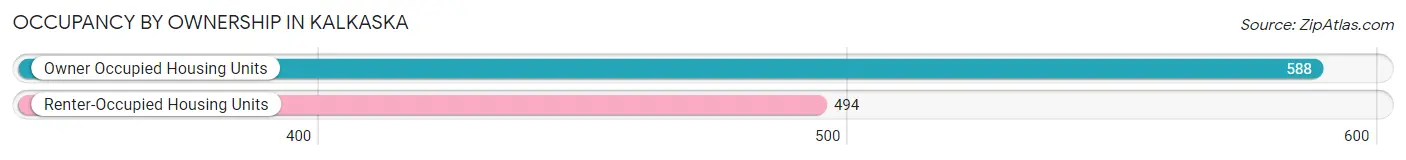
| Occupancy | # Housing Units | % Housing Units |
| Owner Occupied Housing Units | 588 | 54.3% |
| Renter-Occupied Housing Units | 494 | 45.7% |
| Total Occupied Housing Units | 1,082 | 100.0% |
Occupancy by Household Size in Kalkaska
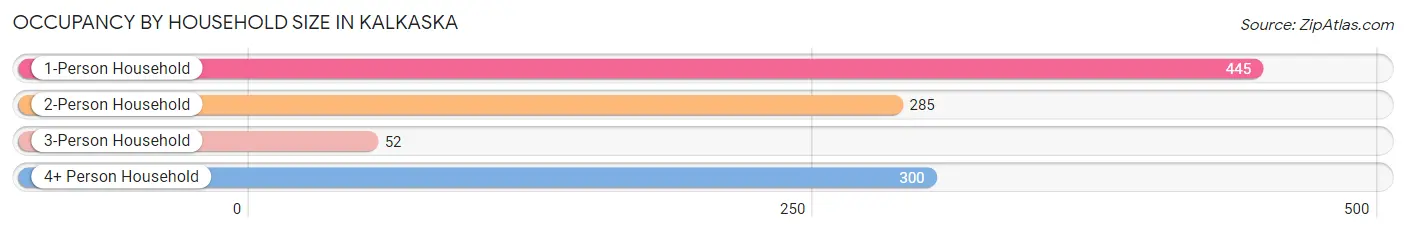
| Household Size | # Housing Units | % Housing Units |
| 1-Person Household | 445 | 41.1% |
| 2-Person Household | 285 | 26.3% |
| 3-Person Household | 52 | 4.8% |
| 4+ Person Household | 300 | 27.7% |
| Total Housing Units | 1,082 | 100.0% |
Occupancy by Ownership by Household Size in Kalkaska
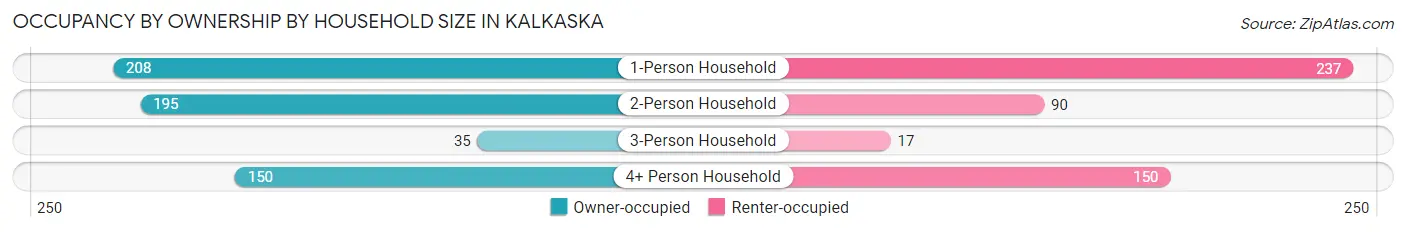
| Household Size | Owner-occupied | Renter-occupied |
| 1-Person Household | 208 (46.7%) | 237 (53.3%) |
| 2-Person Household | 195 (68.4%) | 90 (31.6%) |
| 3-Person Household | 35 (67.3%) | 17 (32.7%) |
| 4+ Person Household | 150 (50.0%) | 150 (50.0%) |
| Total Housing Units | 588 (54.3%) | 494 (45.7%) |
Occupancy by Educational Attainment in Kalkaska
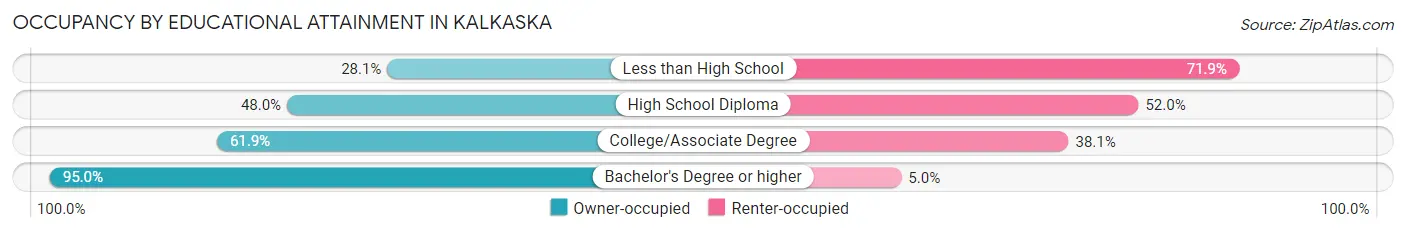
| Household Size | Owner-occupied | Renter-occupied |
| Less than High School | 52 (28.1%) | 133 (71.9%) |
| High School Diploma | 203 (48.0%) | 220 (52.0%) |
| College/Associate Degree | 219 (61.9%) | 135 (38.1%) |
| Bachelor's Degree or higher | 114 (95.0%) | 6 (5.0%) |
Occupancy by Age of Householder in Kalkaska
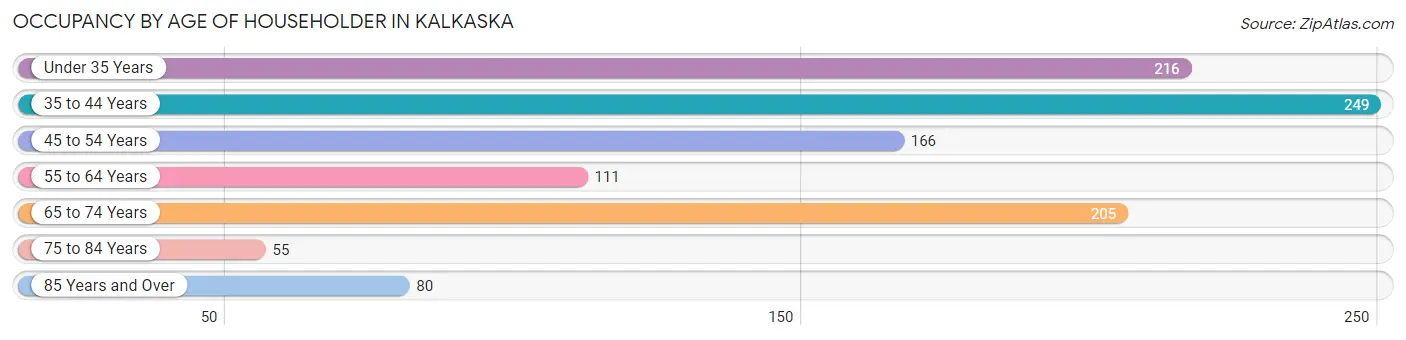
| Age Bracket | # Households | % Households |
| Under 35 Years | 216 | 20.0% |
| 35 to 44 Years | 249 | 23.0% |
| 45 to 54 Years | 166 | 15.3% |
| 55 to 64 Years | 111 | 10.3% |
| 65 to 74 Years | 205 | 19.0% |
| 75 to 84 Years | 55 | 5.1% |
| 85 Years and Over | 80 | 7.4% |
| Total | 1,082 | 100.0% |
Housing Finances in Kalkaska
Median Income by Occupancy in Kalkaska
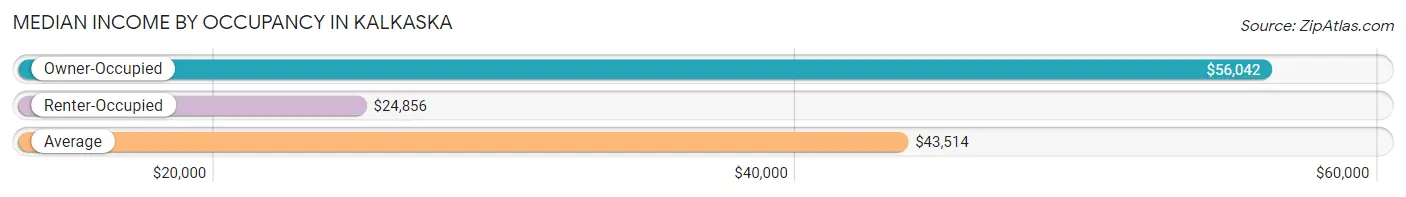
| Occupancy Type | # Households | Median Income |
| Owner-Occupied | 588 (54.3%) | $56,042 |
| Renter-Occupied | 494 (45.7%) | $24,856 |
| Average | 1,082 (100.0%) | $43,514 |
Occupancy by Householder Income Bracket in Kalkaska
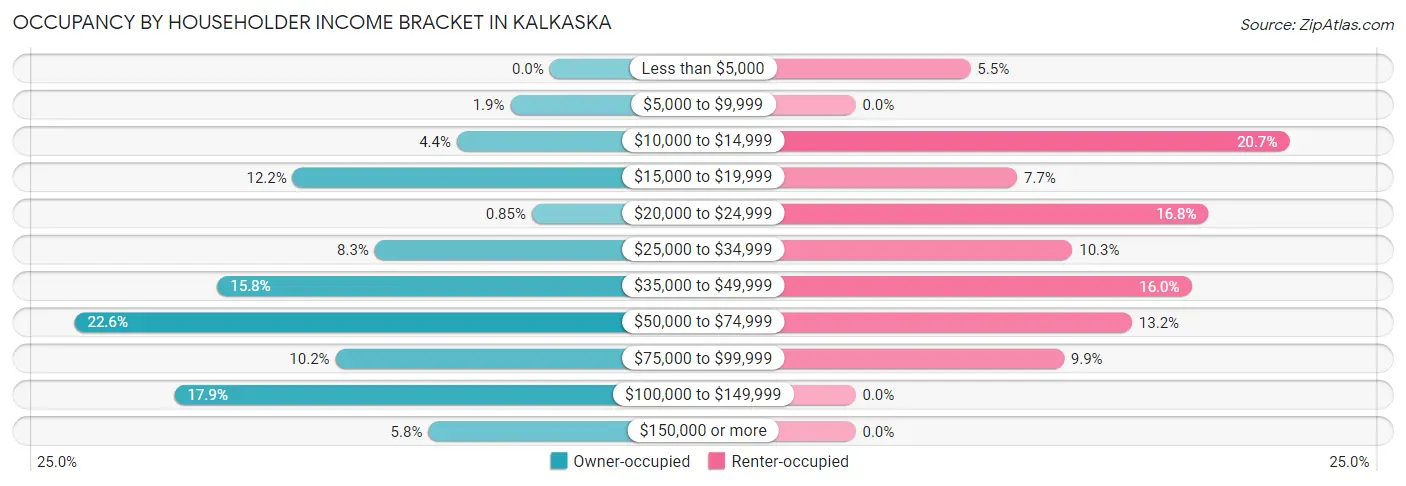
| Income Bracket | Owner-occupied | Renter-occupied |
| Less than $5,000 | 0 (0.0%) | 27 (5.5%) |
| $5,000 to $9,999 | 11 (1.9%) | 0 (0.0%) |
| $10,000 to $14,999 | 26 (4.4%) | 102 (20.6%) |
| $15,000 to $19,999 | 72 (12.2%) | 38 (7.7%) |
| $20,000 to $24,999 | 5 (0.9%) | 83 (16.8%) |
| $25,000 to $34,999 | 49 (8.3%) | 51 (10.3%) |
| $35,000 to $49,999 | 93 (15.8%) | 79 (16.0%) |
| $50,000 to $74,999 | 133 (22.6%) | 65 (13.2%) |
| $75,000 to $99,999 | 60 (10.2%) | 49 (9.9%) |
| $100,000 to $149,999 | 105 (17.9%) | 0 (0.0%) |
| $150,000 or more | 34 (5.8%) | 0 (0.0%) |
| Total | 588 (100.0%) | 494 (100.0%) |
Monthly Housing Cost Tiers in Kalkaska
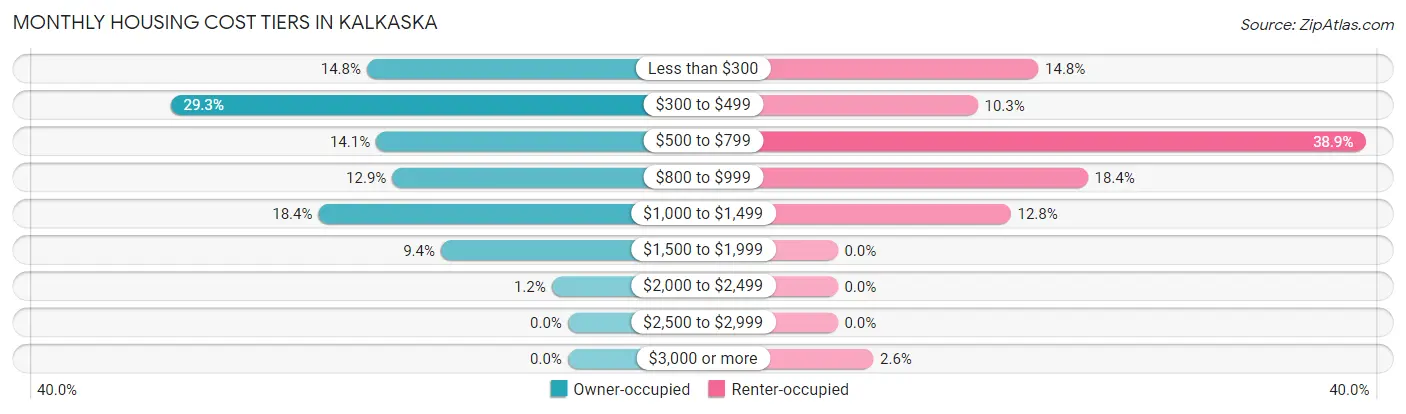
| Monthly Cost | Owner-occupied | Renter-occupied |
| Less than $300 | 87 (14.8%) | 73 (14.8%) |
| $300 to $499 | 172 (29.2%) | 51 (10.3%) |
| $500 to $799 | 83 (14.1%) | 192 (38.9%) |
| $800 to $999 | 76 (12.9%) | 91 (18.4%) |
| $1,000 to $1,499 | 108 (18.4%) | 63 (12.8%) |
| $1,500 to $1,999 | 55 (9.3%) | 0 (0.0%) |
| $2,000 to $2,499 | 7 (1.2%) | 0 (0.0%) |
| $2,500 to $2,999 | 0 (0.0%) | 0 (0.0%) |
| $3,000 or more | 0 (0.0%) | 13 (2.6%) |
| Total | 588 (100.0%) | 494 (100.0%) |
Physical Housing Characteristics in Kalkaska
Housing Structures in Kalkaska
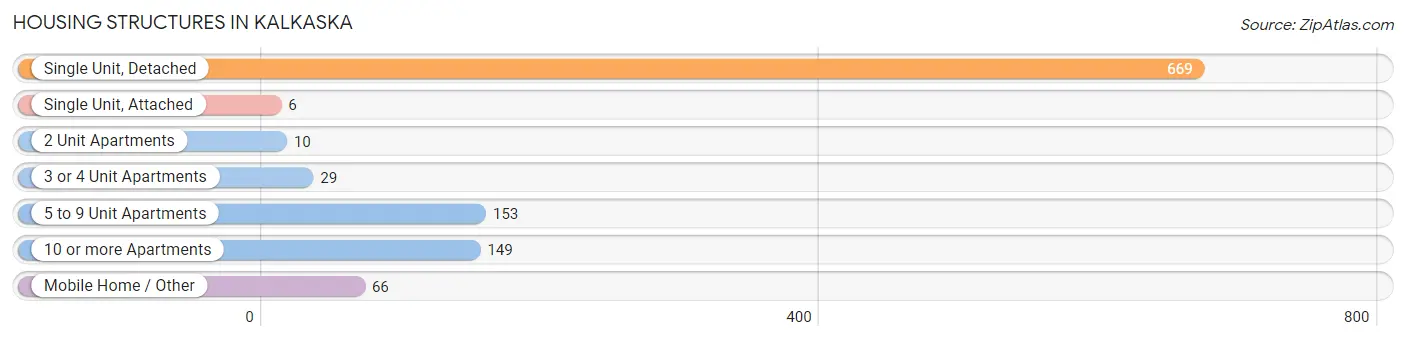
| Structure Type | # Housing Units | % Housing Units |
| Single Unit, Detached | 669 | 61.8% |
| Single Unit, Attached | 6 | 0.5% |
| 2 Unit Apartments | 10 | 0.9% |
| 3 or 4 Unit Apartments | 29 | 2.7% |
| 5 to 9 Unit Apartments | 153 | 14.1% |
| 10 or more Apartments | 149 | 13.8% |
| Mobile Home / Other | 66 | 6.1% |
| Total | 1,082 | 100.0% |
Housing Structures by Occupancy in Kalkaska
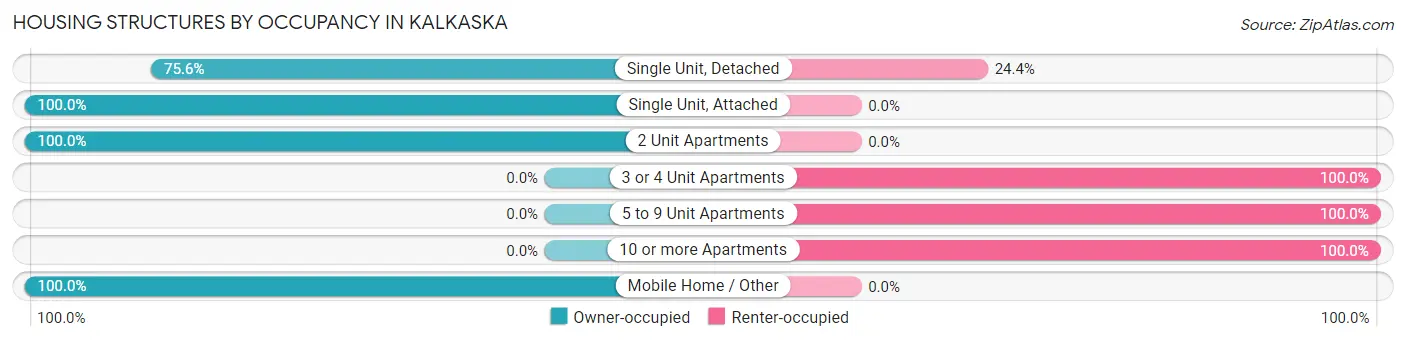
| Structure Type | Owner-occupied | Renter-occupied |
| Single Unit, Detached | 506 (75.6%) | 163 (24.4%) |
| Single Unit, Attached | 6 (100.0%) | 0 (0.0%) |
| 2 Unit Apartments | 10 (100.0%) | 0 (0.0%) |
| 3 or 4 Unit Apartments | 0 (0.0%) | 29 (100.0%) |
| 5 to 9 Unit Apartments | 0 (0.0%) | 153 (100.0%) |
| 10 or more Apartments | 0 (0.0%) | 149 (100.0%) |
| Mobile Home / Other | 66 (100.0%) | 0 (0.0%) |
| Total | 588 (54.3%) | 494 (45.7%) |
Housing Structures by Number of Rooms in Kalkaska
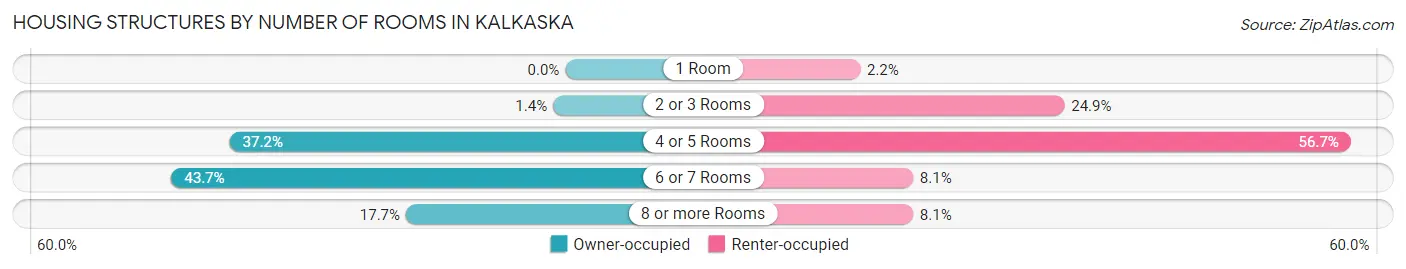
| Number of Rooms | Owner-occupied | Renter-occupied |
| 1 Room | 0 (0.0%) | 11 (2.2%) |
| 2 or 3 Rooms | 8 (1.4%) | 123 (24.9%) |
| 4 or 5 Rooms | 219 (37.2%) | 280 (56.7%) |
| 6 or 7 Rooms | 257 (43.7%) | 40 (8.1%) |
| 8 or more Rooms | 104 (17.7%) | 40 (8.1%) |
| Total | 588 (100.0%) | 494 (100.0%) |
Housing Structure by Heating Type in Kalkaska
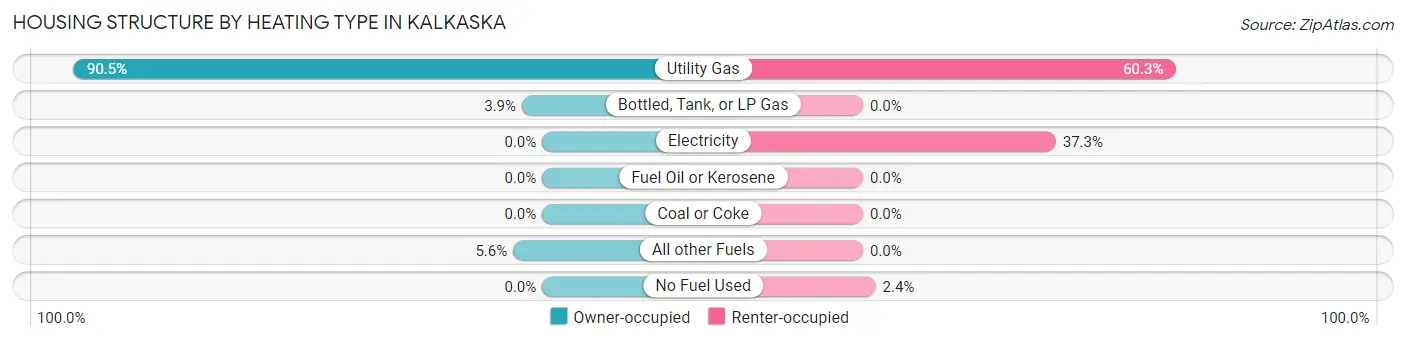
| Heating Type | Owner-occupied | Renter-occupied |
| Utility Gas | 532 (90.5%) | 298 (60.3%) |
| Bottled, Tank, or LP Gas | 23 (3.9%) | 0 (0.0%) |
| Electricity | 0 (0.0%) | 184 (37.2%) |
| Fuel Oil or Kerosene | 0 (0.0%) | 0 (0.0%) |
| Coal or Coke | 0 (0.0%) | 0 (0.0%) |
| All other Fuels | 33 (5.6%) | 0 (0.0%) |
| No Fuel Used | 0 (0.0%) | 12 (2.4%) |
| Total | 588 (100.0%) | 494 (100.0%) |
Household Vehicle Usage in Kalkaska
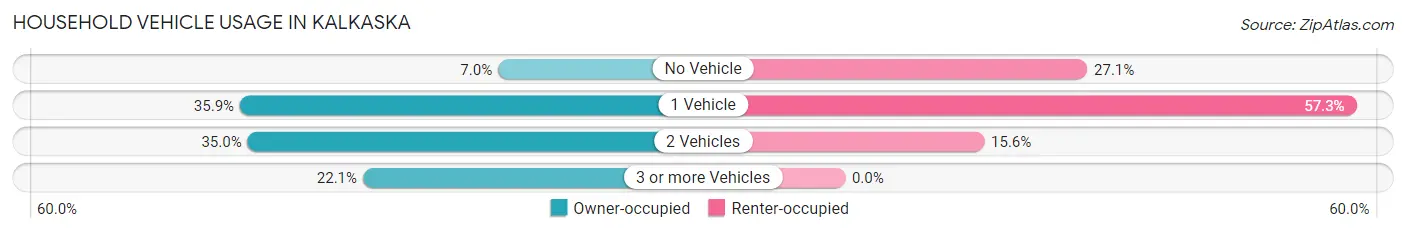
| Vehicles per Household | Owner-occupied | Renter-occupied |
| No Vehicle | 41 (7.0%) | 134 (27.1%) |
| 1 Vehicle | 211 (35.9%) | 283 (57.3%) |
| 2 Vehicles | 206 (35.0%) | 77 (15.6%) |
| 3 or more Vehicles | 130 (22.1%) | 0 (0.0%) |
| Total | 588 (100.0%) | 494 (100.0%) |
Real Estate & Mortgages in Kalkaska
Real Estate and Mortgage Overview in Kalkaska
| Characteristic | Without Mortgage | With Mortgage |
| Housing Units | 239 | 349 |
| Median Property Value | $109,400 | $113,200 |
| Median Household Income | $70,375 | $8 |
| Monthly Housing Costs | $389 | $0 |
| Real Estate Taxes | $1,064 | $24 |
Property Value by Mortgage Status in Kalkaska
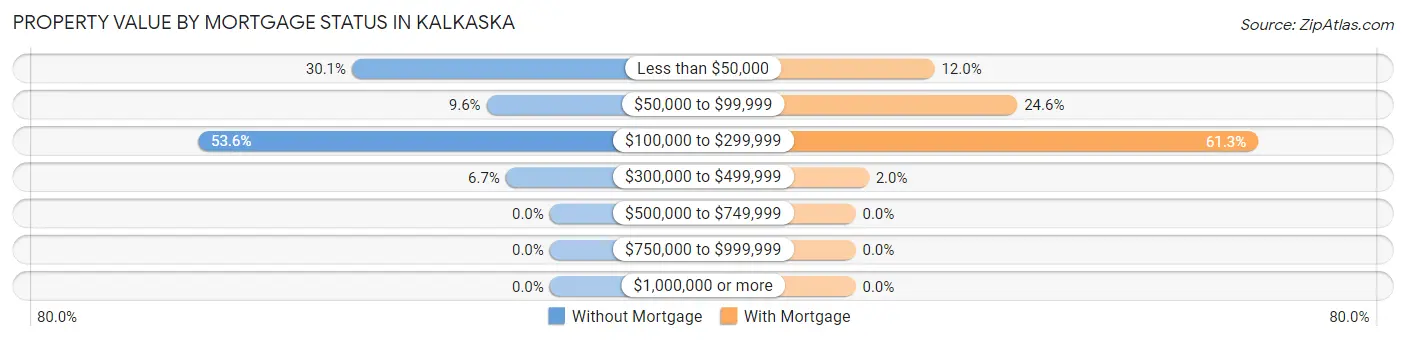
| Property Value | Without Mortgage | With Mortgage |
| Less than $50,000 | 72 (30.1%) | 42 (12.0%) |
| $50,000 to $99,999 | 23 (9.6%) | 86 (24.6%) |
| $100,000 to $299,999 | 128 (53.6%) | 214 (61.3%) |
| $300,000 to $499,999 | 16 (6.7%) | 7 (2.0%) |
| $500,000 to $749,999 | 0 (0.0%) | 0 (0.0%) |
| $750,000 to $999,999 | 0 (0.0%) | 0 (0.0%) |
| $1,000,000 or more | 0 (0.0%) | 0 (0.0%) |
| Total | 239 (100.0%) | 349 (100.0%) |
Household Income by Mortgage Status in Kalkaska
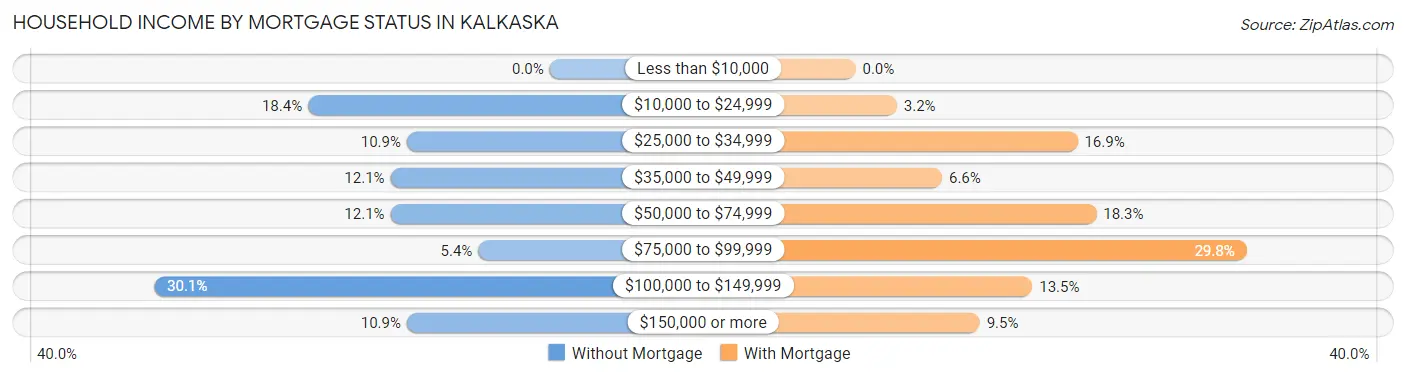
| Household Income | Without Mortgage | With Mortgage |
| Less than $10,000 | 0 (0.0%) | 0 (0.0%) |
| $10,000 to $24,999 | 44 (18.4%) | 11 (3.2%) |
| $25,000 to $34,999 | 26 (10.9%) | 59 (16.9%) |
| $35,000 to $49,999 | 29 (12.1%) | 23 (6.6%) |
| $50,000 to $74,999 | 29 (12.1%) | 64 (18.3%) |
| $75,000 to $99,999 | 13 (5.4%) | 104 (29.8%) |
| $100,000 to $149,999 | 72 (30.1%) | 47 (13.5%) |
| $150,000 or more | 26 (10.9%) | 33 (9.5%) |
| Total | 239 (100.0%) | 349 (100.0%) |
Property Value to Household Income Ratio in Kalkaska
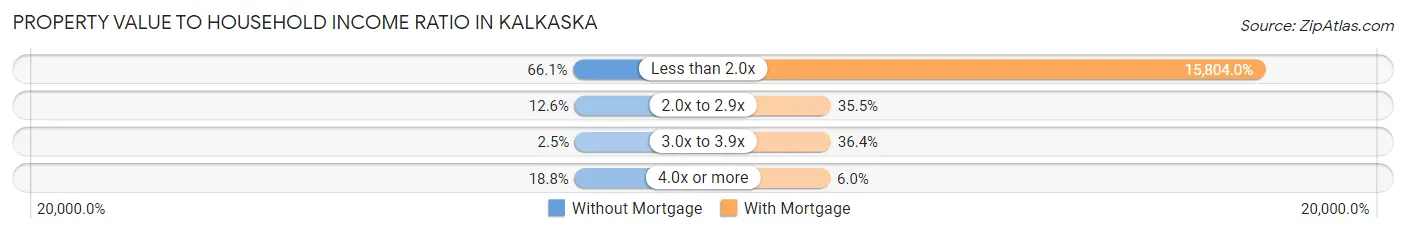
| Value-to-Income Ratio | Without Mortgage | With Mortgage |
| Less than 2.0x | 158 (66.1%) | 55,156 (15,804.0%) |
| 2.0x to 2.9x | 30 (12.6%) | 124 (35.5%) |
| 3.0x to 3.9x | 6 (2.5%) | 127 (36.4%) |
| 4.0x or more | 45 (18.8%) | 21 (6.0%) |
| Total | 239 (100.0%) | 349 (100.0%) |
Real Estate Taxes by Mortgage Status in Kalkaska
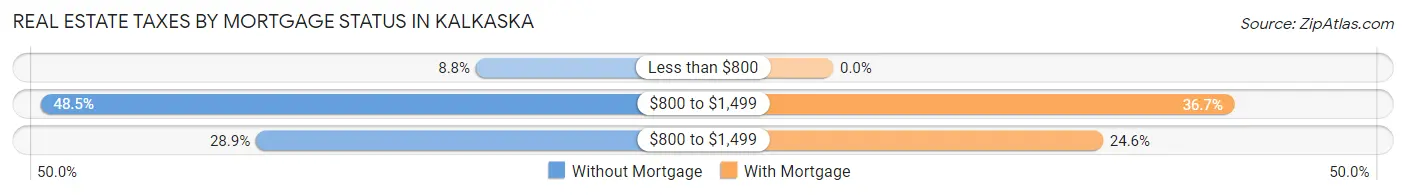
| Property Taxes | Without Mortgage | With Mortgage |
| Less than $800 | 21 (8.8%) | 0 (0.0%) |
| $800 to $1,499 | 116 (48.5%) | 128 (36.7%) |
| $800 to $1,499 | 69 (28.9%) | 86 (24.6%) |
| Total | 239 (100.0%) | 349 (100.0%) |
Health & Disability in Kalkaska
Health Insurance Coverage by Age in Kalkaska
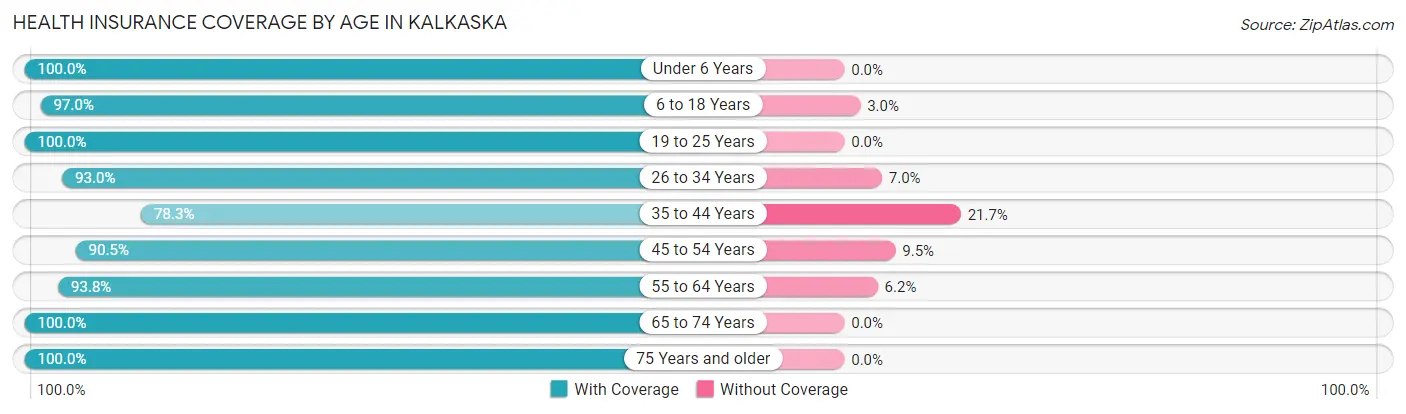
| Age Bracket | With Coverage | Without Coverage |
| Under 6 Years | 200 (100.0%) | 0 (0.0%) |
| 6 to 18 Years | 457 (97.0%) | 14 (3.0%) |
| 19 to 25 Years | 175 (100.0%) | 0 (0.0%) |
| 26 to 34 Years | 332 (93.0%) | 25 (7.0%) |
| 35 to 44 Years | 321 (78.3%) | 89 (21.7%) |
| 45 to 54 Years | 209 (90.5%) | 22 (9.5%) |
| 55 to 64 Years | 196 (93.8%) | 13 (6.2%) |
| 65 to 74 Years | 257 (100.0%) | 0 (0.0%) |
| 75 Years and older | 194 (100.0%) | 0 (0.0%) |
| Total | 2,341 (93.5%) | 163 (6.5%) |
Health Insurance Coverage by Citizenship Status in Kalkaska
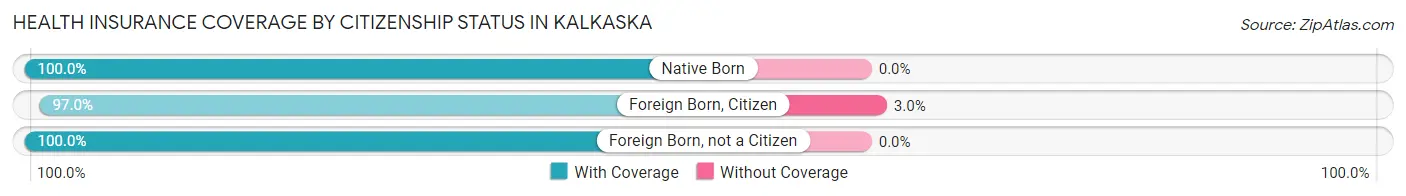
| Citizenship Status | With Coverage | Without Coverage |
| Native Born | 200 (100.0%) | 0 (0.0%) |
| Foreign Born, Citizen | 457 (97.0%) | 14 (3.0%) |
| Foreign Born, not a Citizen | 175 (100.0%) | 0 (0.0%) |
Health Insurance Coverage by Household Income in Kalkaska
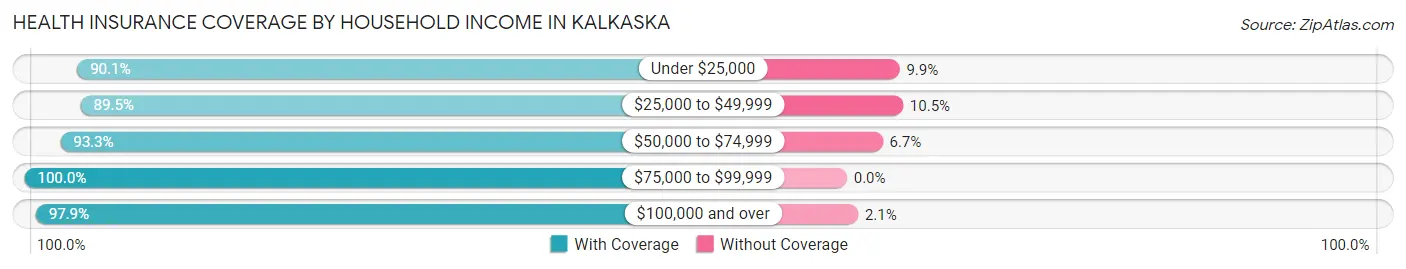
| Household Income | With Coverage | Without Coverage |
| Under $25,000 | 484 (90.1%) | 53 (9.9%) |
| $25,000 to $49,999 | 528 (89.5%) | 62 (10.5%) |
| $50,000 to $74,999 | 557 (93.3%) | 40 (6.7%) |
| $75,000 to $99,999 | 352 (100.0%) | 0 (0.0%) |
| $100,000 and over | 373 (97.9%) | 8 (2.1%) |
Public vs Private Health Insurance Coverage by Age in Kalkaska
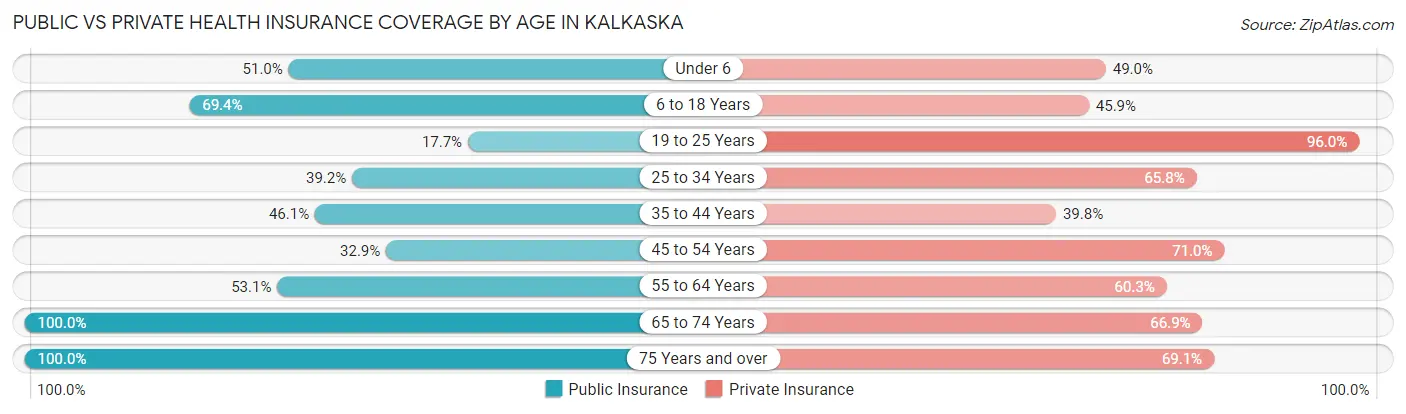
| Age Bracket | Public Insurance | Private Insurance |
| Under 6 | 102 (51.0%) | 98 (49.0%) |
| 6 to 18 Years | 327 (69.4%) | 216 (45.9%) |
| 19 to 25 Years | 31 (17.7%) | 168 (96.0%) |
| 25 to 34 Years | 140 (39.2%) | 235 (65.8%) |
| 35 to 44 Years | 189 (46.1%) | 163 (39.8%) |
| 45 to 54 Years | 76 (32.9%) | 164 (71.0%) |
| 55 to 64 Years | 111 (53.1%) | 126 (60.3%) |
| 65 to 74 Years | 257 (100.0%) | 172 (66.9%) |
| 75 Years and over | 194 (100.0%) | 134 (69.1%) |
| Total | 1,427 (57.0%) | 1,476 (59.0%) |
Disability Status by Sex by Age in Kalkaska
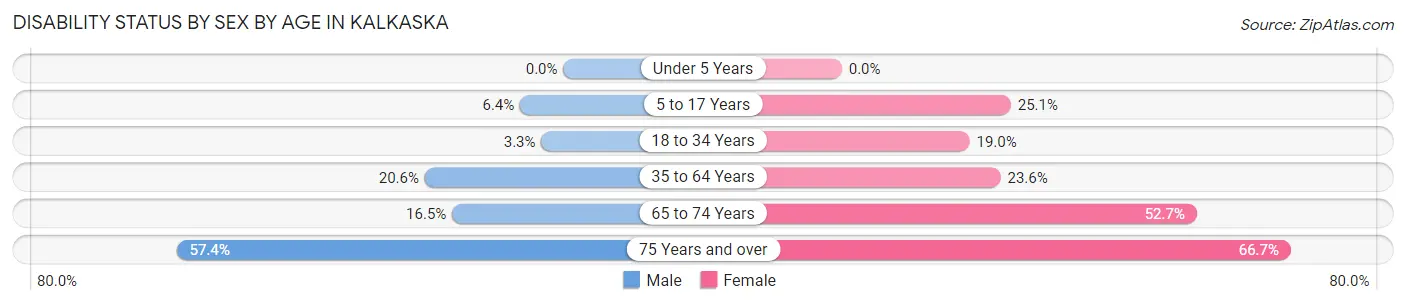
| Age Bracket | Male | Female |
| Under 5 Years | 0 (0.0%) | 0 (0.0%) |
| 5 to 17 Years | 14 (6.4%) | 71 (25.1%) |
| 18 to 34 Years | 6 (3.3%) | 70 (19.0%) |
| 35 to 64 Years | 92 (20.6%) | 95 (23.6%) |
| 65 to 74 Years | 18 (16.5%) | 78 (52.7%) |
| 75 Years and over | 58 (57.4%) | 62 (66.7%) |
Disability Class by Sex by Age in Kalkaska
Disability Class: Hearing Difficulty
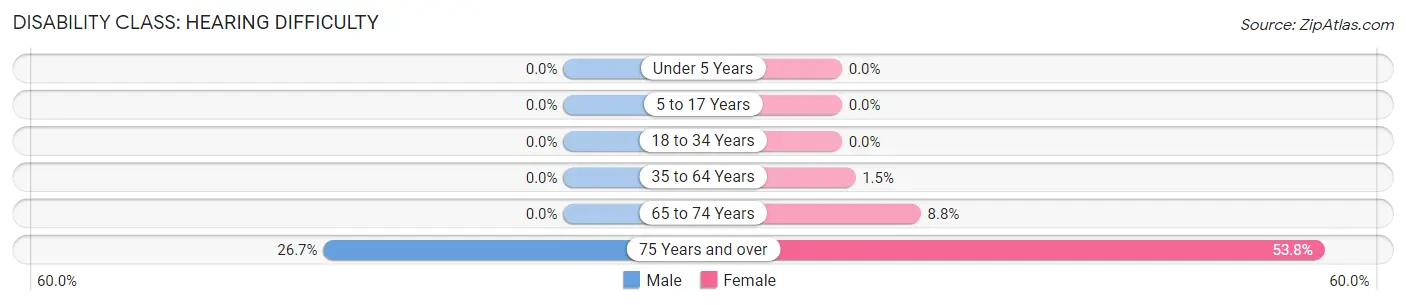
| Age Bracket | Male | Female |
| Under 5 Years | 0 (0.0%) | 0 (0.0%) |
| 5 to 17 Years | 0 (0.0%) | 0 (0.0%) |
| 18 to 34 Years | 0 (0.0%) | 0 (0.0%) |
| 35 to 64 Years | 0 (0.0%) | 6 (1.5%) |
| 65 to 74 Years | 0 (0.0%) | 13 (8.8%) |
| 75 Years and over | 27 (26.7%) | 50 (53.8%) |
Disability Class: Vision Difficulty
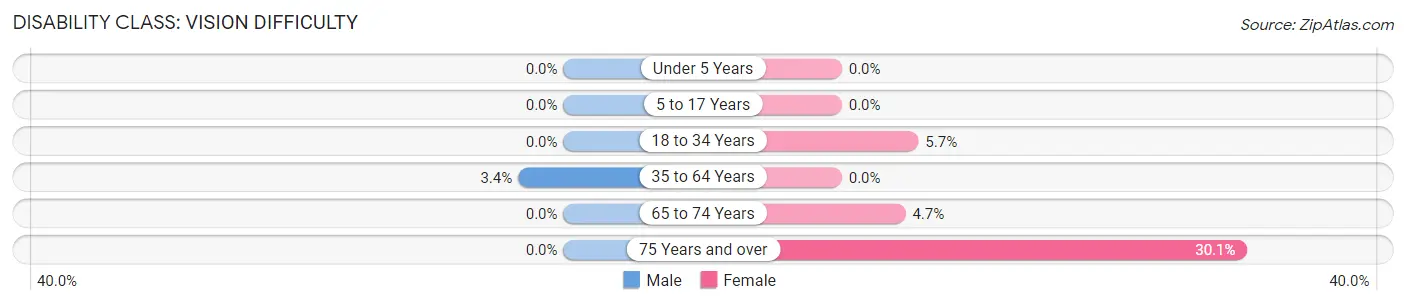
| Age Bracket | Male | Female |
| Under 5 Years | 0 (0.0%) | 0 (0.0%) |
| 5 to 17 Years | 0 (0.0%) | 0 (0.0%) |
| 18 to 34 Years | 0 (0.0%) | 21 (5.7%) |
| 35 to 64 Years | 15 (3.4%) | 0 (0.0%) |
| 65 to 74 Years | 0 (0.0%) | 7 (4.7%) |
| 75 Years and over | 0 (0.0%) | 28 (30.1%) |
Disability Class: Cognitive Difficulty
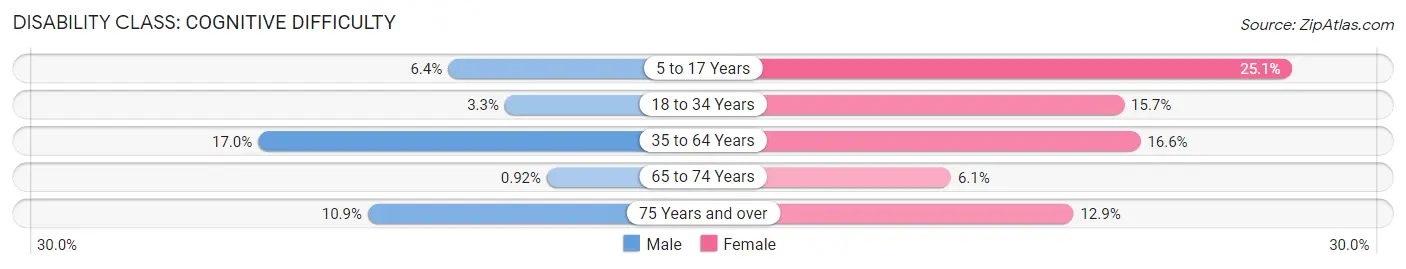
| Age Bracket | Male | Female |
| 5 to 17 Years | 14 (6.4%) | 71 (25.1%) |
| 18 to 34 Years | 6 (3.3%) | 58 (15.7%) |
| 35 to 64 Years | 76 (17.0%) | 67 (16.6%) |
| 65 to 74 Years | 1 (0.9%) | 9 (6.1%) |
| 75 Years and over | 11 (10.9%) | 12 (12.9%) |
Disability Class: Ambulatory Difficulty
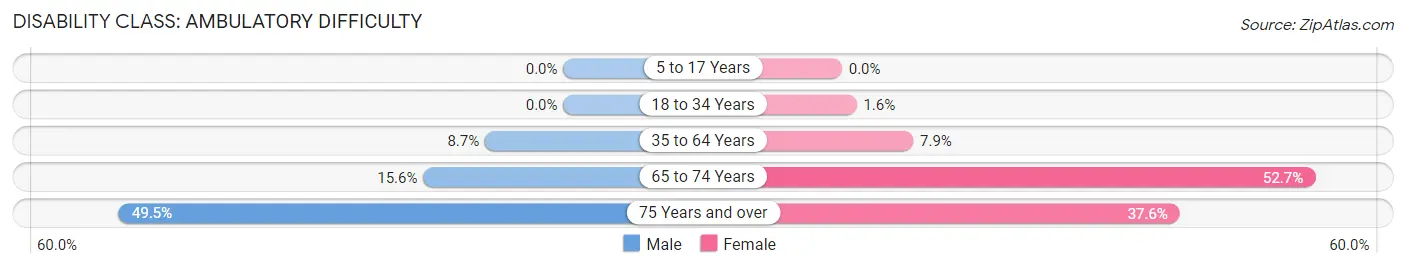
| Age Bracket | Male | Female |
| 5 to 17 Years | 0 (0.0%) | 0 (0.0%) |
| 18 to 34 Years | 0 (0.0%) | 6 (1.6%) |
| 35 to 64 Years | 39 (8.7%) | 32 (7.9%) |
| 65 to 74 Years | 17 (15.6%) | 78 (52.7%) |
| 75 Years and over | 50 (49.5%) | 35 (37.6%) |
Disability Class: Self-Care Difficulty
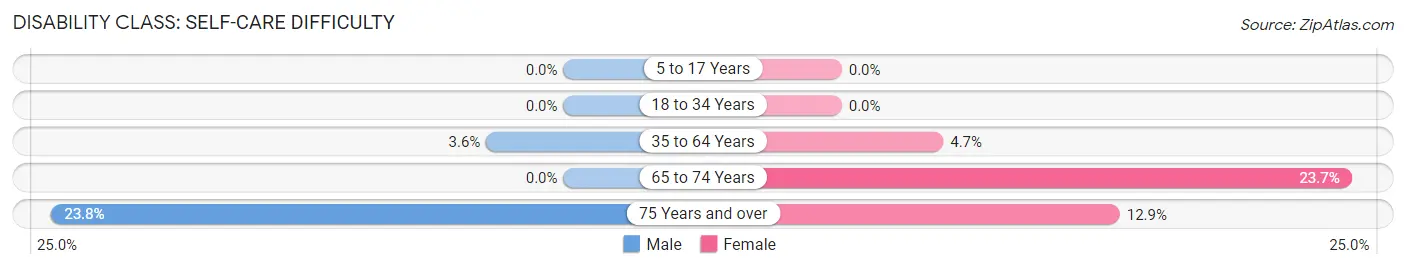
| Age Bracket | Male | Female |
| 5 to 17 Years | 0 (0.0%) | 0 (0.0%) |
| 18 to 34 Years | 0 (0.0%) | 0 (0.0%) |
| 35 to 64 Years | 16 (3.6%) | 19 (4.7%) |
| 65 to 74 Years | 0 (0.0%) | 35 (23.6%) |
| 75 Years and over | 24 (23.8%) | 12 (12.9%) |
Technology Access in Kalkaska
Computing Device Access in Kalkaska
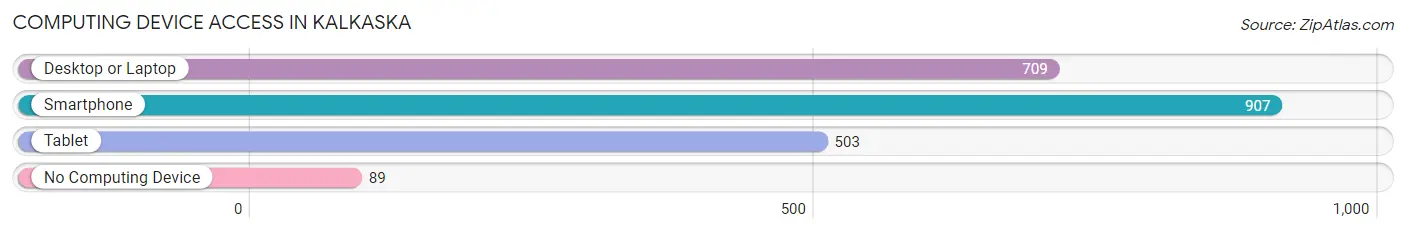
| Device Type | # Households | % Households |
| Desktop or Laptop | 709 | 65.5% |
| Smartphone | 907 | 83.8% |
| Tablet | 503 | 46.5% |
| No Computing Device | 89 | 8.2% |
| Total | 1,082 | 100.0% |
Internet Access in Kalkaska
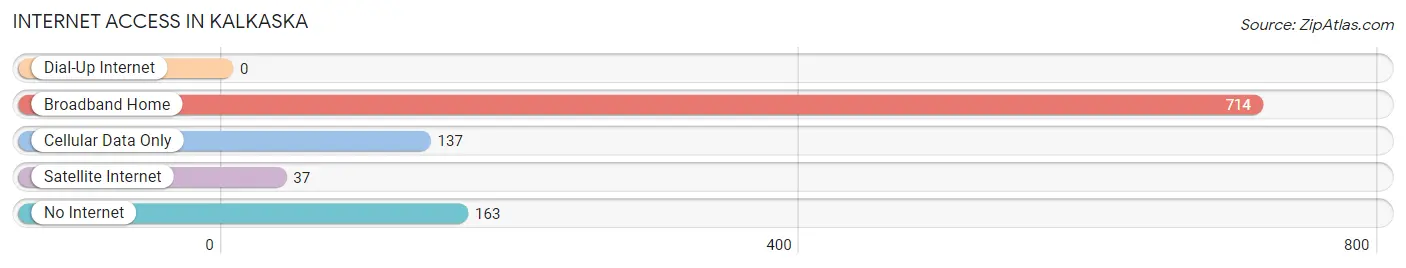
| Internet Type | # Households | % Households |
| Dial-Up Internet | 0 | 0.0% |
| Broadband Home | 714 | 66.0% |
| Cellular Data Only | 137 | 12.7% |
| Satellite Internet | 37 | 3.4% |
| No Internet | 163 | 15.1% |
| Total | 1,082 | 100.0% |
Kalkaska Summary
Kalkaska is a small town located in the northwestern part of Michigan’s Lower Peninsula. It is situated in the heart of the Grand Traverse Bay region, and is surrounded by the Manistee National Forest. The town is home to a population of just over 2,000 people, and is the county seat of Kalkaska County.
History
Kalkaska was first settled in 1855 by a group of lumberjacks from Canada. The town was originally known as “Kalkaska Station”, and was a stop on the Grand Rapids and Indiana Railroad. The town was officially incorporated in 1871, and was named after the Kalkaska River, which runs through the area.
In the late 19th century, Kalkaska was a major lumbering center, and the town’s economy was largely based on the lumber industry. The town also had a thriving agricultural sector, and was home to several large farms.
In the early 20th century, Kalkaska began to transition away from its reliance on the lumber industry, and began to focus more on tourism and recreation. The town was home to several resorts, and was a popular destination for hunters and fishermen.
Geography
Kalkaska is located in the northwestern part of Michigan’s Lower Peninsula, and is situated in the heart of the Grand Traverse Bay region. The town is surrounded by the Manistee National Forest, and is located near several lakes, including Lake Skegemog, Lake Bellaire, and Lake Dubonnet.
The town is located at the intersection of US-131 and M-72, and is about 30 miles north of Traverse City. The nearest major cities are Grand Rapids, which is about 90 miles to the south, and Detroit, which is about 200 miles to the east.
Economy
Kalkaska’s economy is largely based on tourism and recreation. The town is home to several resorts, and is a popular destination for hunters and fishermen. The town is also home to several manufacturing companies, including a furniture factory and a plastics factory.
The town is also home to several small businesses, including restaurants, shops, and other services. The town is also home to several farms, and is a major producer of apples, cherries, and other fruits and vegetables.
Demographics
As of the 2010 census, Kalkaska had a population of 2,020 people. The town has a median age of 43.7 years, and the median household income is $37,917. The town is predominantly white (94.3%), with small percentages of African American (2.2%), Native American (1.2%), and Asian (0.7%) residents.
Conclusion
Kalkaska is a small town located in the northwestern part of Michigan’s Lower Peninsula. The town is surrounded by the Manistee National Forest, and is home to a population of just over 2,000 people. The town’s economy is largely based on tourism and recreation, and the town is home to several resorts, manufacturing companies, and small businesses. The town is predominantly white, with small percentages of African American, Native American, and Asian residents.
Common Questions
What is Per Capita Income in Kalkaska?
Per Capita income in Kalkaska is $23,674.
What is the Median Family Income in Kalkaska?
Median Family Income in Kalkaska is $57,188.
What is the Median Household income in Kalkaska?
Median Household Income in Kalkaska is $43,514.
What is Income or Wage Gap in Kalkaska?
Income or Wage Gap in Kalkaska is 38.8%.
Women in Kalkaska earn 61.2 cents for every dollar earned by a man.
What is Inequality or Gini Index in Kalkaska?
Inequality or Gini Index in Kalkaska is 0.45.
What is the Total Population of Kalkaska?
Total Population of Kalkaska is 2,563.
What is the Total Male Population of Kalkaska?
Total Male Population of Kalkaska is 1,160.
What is the Total Female Population of Kalkaska?
Total Female Population of Kalkaska is 1,403.
What is the Ratio of Males per 100 Females in Kalkaska?
There are 82.68 Males per 100 Females in Kalkaska.
What is the Ratio of Females per 100 Males in Kalkaska?
There are 120.95 Females per 100 Males in Kalkaska.
What is the Median Population Age in Kalkaska?
Median Population Age in Kalkaska is 35.5 Years.
What is the Average Family Size in Kalkaska
Average Family Size in Kalkaska is 3.2 People.
What is the Average Household Size in Kalkaska
Average Household Size in Kalkaska is 2.3 People.
How Large is the Labor Force in Kalkaska?
There are 1,085 People in the Labor Forcein in Kalkaska.
What is the Percentage of People in the Labor Force in Kalkaska?
54.0% of People are in the Labor Force in Kalkaska.
What is the Unemployment Rate in Kalkaska?
Unemployment Rate in Kalkaska is 4.5%.