Hart, MI Map & Demographics
Hart Map
Hart Overview
$27,774
PER CAPITA INCOME
$67,660
AVG FAMILY INCOME
$56,979
AVG HOUSEHOLD INCOME
15.3%
WAGE / INCOME GAP [ % ]
84.7¢/ $1
WAGE / INCOME GAP [ $ ]
0.46
INEQUALITY / GINI INDEX
2,173
TOTAL POPULATION
1,211
MALE POPULATION
962
FEMALE POPULATION
125.88
MALES / 100 FEMALES
79.44
FEMALES / 100 MALES
39.5
MEDIAN AGE
3.1
AVG FAMILY SIZE
2.5
AVG HOUSEHOLD SIZE
998
LABOR FORCE [ PEOPLE ]
57.7%
PERCENT IN LABOR FORCE
3.0%
UNEMPLOYMENT RATE
Hart Zip Codes
Hart Area Codes
Income in Hart
Income Overview in Hart
Per Capita Income in Hart is $27,774, while median incomes of families and households are $67,660 and $56,979 respectively.
| Characteristic | Number | Measure |
| Per Capita Income | 2,173 | $27,774 |
| Median Family Income | 461 | $67,660 |
| Mean Family Income | 461 | $81,503 |
| Median Household Income | 776 | $56,979 |
| Mean Household Income | 776 | $73,350 |
| Income Deficit | 461 | $0 |
| Wage / Income Gap (%) | 2,173 | 15.34% |
| Wage / Income Gap ($) | 2,173 | 84.66¢ per $1 |
| Gini / Inequality Index | 2,173 | 0.46 |
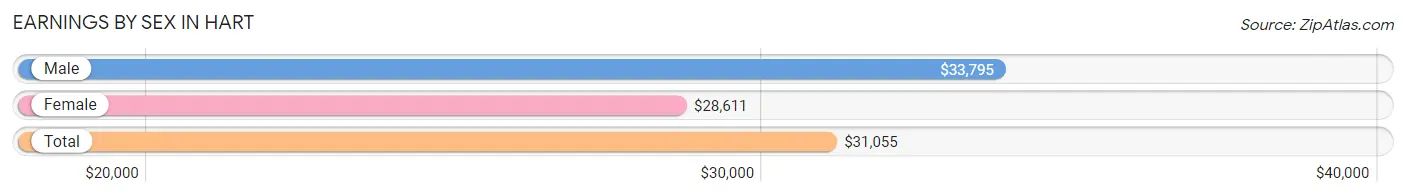
Earnings by Sex in Hart
Average Earnings in Hart are $31,055, $33,795 for men and $28,611 for women, a difference of 15.3%.
| Sex | Number | Average Earnings |
| Male | 617 (55.6%) | $33,795 |
| Female | 492 (44.4%) | $28,611 |
| Total | 1,109 (100.0%) | $31,055 |
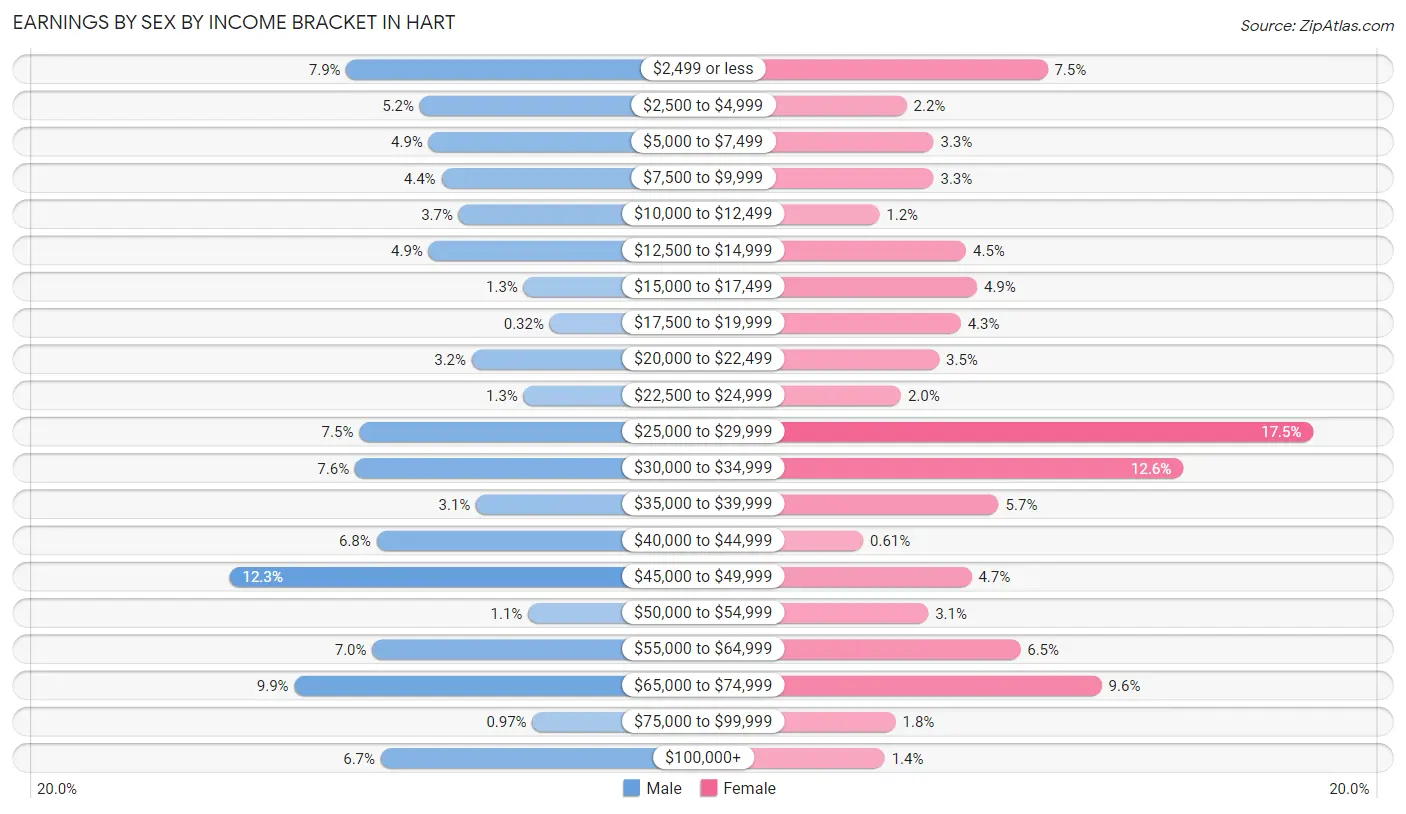
Earnings by Sex by Income Bracket in Hart
The most common earnings brackets in Hart are $45,000 to $49,999 for men (76 | 12.3%) and $25,000 to $29,999 for women (86 | 17.5%).
| Income | Male | Female |
| $2,499 or less | 49 (7.9%) | 37 (7.5%) |
| $2,500 to $4,999 | 32 (5.2%) | 11 (2.2%) |
| $5,000 to $7,499 | 30 (4.9%) | 16 (3.3%) |
| $7,500 to $9,999 | 27 (4.4%) | 16 (3.3%) |
| $10,000 to $12,499 | 23 (3.7%) | 6 (1.2%) |
| $12,500 to $14,999 | 30 (4.9%) | 22 (4.5%) |
| $15,000 to $17,499 | 8 (1.3%) | 24 (4.9%) |
| $17,500 to $19,999 | 2 (0.3%) | 21 (4.3%) |
| $20,000 to $22,499 | 20 (3.2%) | 17 (3.5%) |
| $22,500 to $24,999 | 8 (1.3%) | 10 (2.0%) |
| $25,000 to $29,999 | 46 (7.5%) | 86 (17.5%) |
| $30,000 to $34,999 | 47 (7.6%) | 62 (12.6%) |
| $35,000 to $39,999 | 19 (3.1%) | 28 (5.7%) |
| $40,000 to $44,999 | 42 (6.8%) | 3 (0.6%) |
| $45,000 to $49,999 | 76 (12.3%) | 23 (4.7%) |
| $50,000 to $54,999 | 7 (1.1%) | 15 (3.0%) |
| $55,000 to $64,999 | 43 (7.0%) | 32 (6.5%) |
| $65,000 to $74,999 | 61 (9.9%) | 47 (9.6%) |
| $75,000 to $99,999 | 6 (1.0%) | 9 (1.8%) |
| $100,000+ | 41 (6.7%) | 7 (1.4%) |
| Total | 617 (100.0%) | 492 (100.0%) |
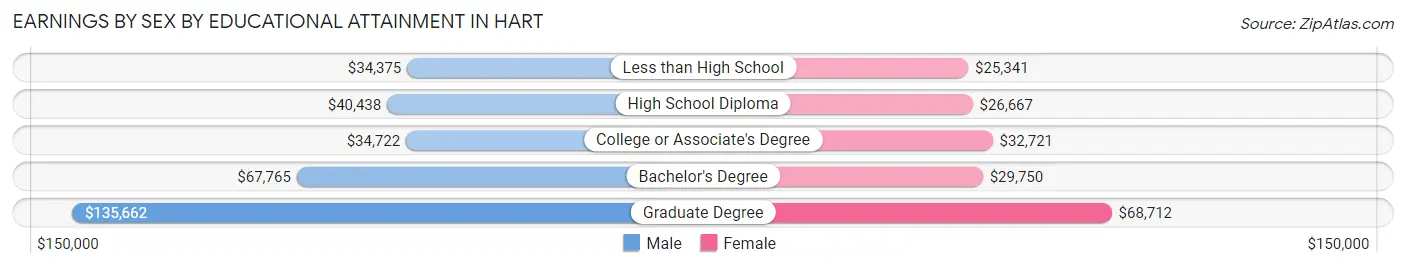
Earnings by Sex by Educational Attainment in Hart
Average earnings in Hart are $42,450 for men and $30,577 for women, a difference of 28.0%. Men with an educational attainment of graduate degree enjoy the highest average annual earnings of $135,662, while those with less than high school education earn the least with $34,375. Women with an educational attainment of graduate degree earn the most with the average annual earnings of $68,712, while those with less than high school education have the smallest earnings of $25,341.
| Educational Attainment | Male Income | Female Income |
| Less than High School | $34,375 | $25,341 |
| High School Diploma | $40,438 | $26,667 |
| College or Associate's Degree | $34,722 | $32,721 |
| Bachelor's Degree | $67,765 | $29,750 |
| Graduate Degree | $135,662 | $68,712 |
| Total | $42,450 | $30,577 |
Family Income in Hart
Family Income Brackets in Hart
According to the Hart family income data, there are 117 families falling into the $50,000 to $74,999 income range, which is the most common income bracket and makes up 25.4% of all families. Conversely, the $150,000 to $199,999 income bracket is the least frequent group with only 3 families (0.6%) belonging to this category.
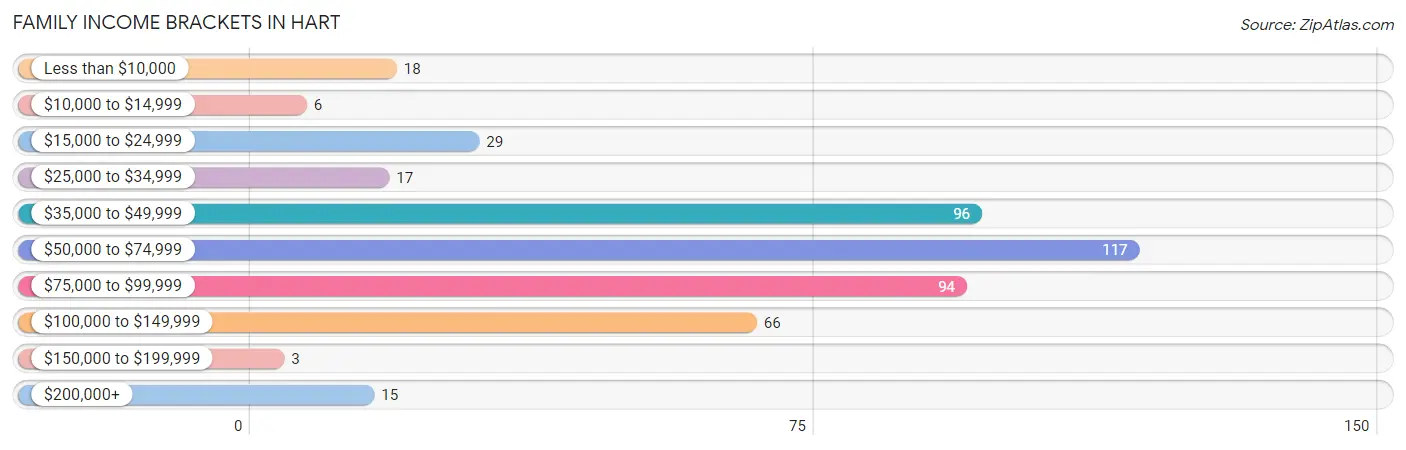
| Income Bracket | # Families | % Families |
| Less than $10,000 | 18 | 3.9% |
| $10,000 to $14,999 | 6 | 1.3% |
| $15,000 to $24,999 | 29 | 6.3% |
| $25,000 to $34,999 | 17 | 3.7% |
| $35,000 to $49,999 | 96 | 20.8% |
| $50,000 to $74,999 | 117 | 25.4% |
| $75,000 to $99,999 | 94 | 20.4% |
| $100,000 to $149,999 | 66 | 14.3% |
| $150,000 to $199,999 | 3 | 0.7% |
| $200,000+ | 15 | 3.3% |
Family Income by Famaliy Size in Hart
5-person families (70 | 15.2%) account for the highest median family income in Hart with $90,893 per family, while 2-person families (160 | 34.7%) have the highest median income of $25,938 per family member.
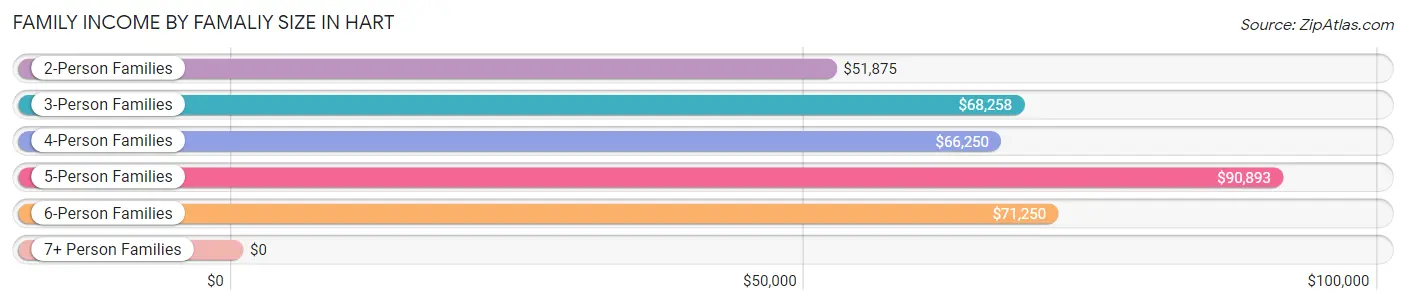
| Income Bracket | # Families | Median Income |
| 2-Person Families | 160 (34.7%) | $51,875 |
| 3-Person Families | 132 (28.6%) | $68,258 |
| 4-Person Families | 88 (19.1%) | $66,250 |
| 5-Person Families | 70 (15.2%) | $90,893 |
| 6-Person Families | 11 (2.4%) | $71,250 |
| 7+ Person Families | 0 (0.0%) | $0 |
| Total | 461 (100.0%) | $67,660 |
Family Income by Number of Earners in Hart
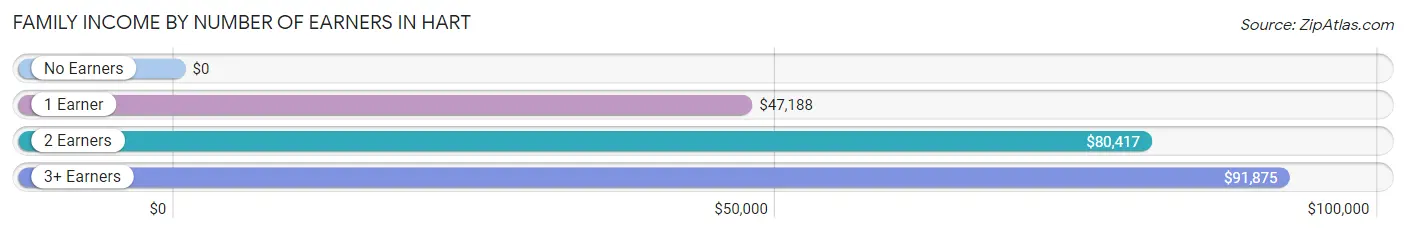
| Number of Earners | # Families | Median Income |
| No Earners | 45 (9.8%) | $0 |
| 1 Earner | 175 (38.0%) | $47,188 |
| 2 Earners | 143 (31.0%) | $80,417 |
| 3+ Earners | 98 (21.3%) | $91,875 |
| Total | 461 (100.0%) | $67,660 |
Household Income in Hart
Household Income Brackets in Hart
With 199 households falling in the category, the $50,000 to $74,999 income range is the most frequent in Hart, accounting for 25.6% of all households. In contrast, only 6 households (0.8%) fall into the $150,000 to $199,999 income bracket, making it the least populous group.
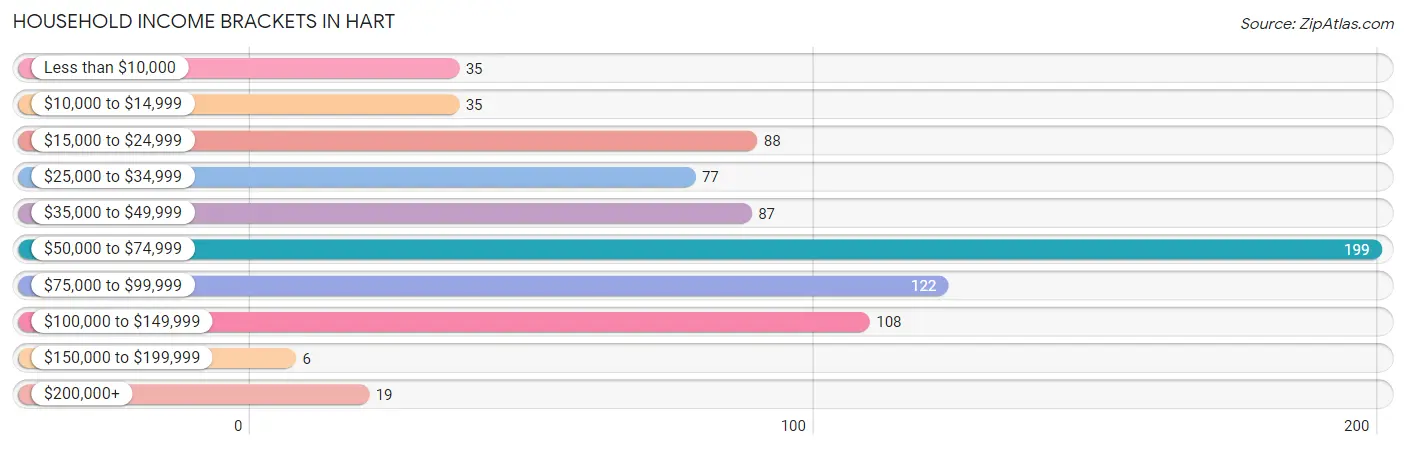
| Income Bracket | # Households | % Households |
| Less than $10,000 | 35 | 4.5% |
| $10,000 to $14,999 | 35 | 4.5% |
| $15,000 to $24,999 | 88 | 11.3% |
| $25,000 to $34,999 | 77 | 9.9% |
| $35,000 to $49,999 | 87 | 11.2% |
| $50,000 to $74,999 | 199 | 25.6% |
| $75,000 to $99,999 | 122 | 15.7% |
| $100,000 to $149,999 | 108 | 13.9% |
| $150,000 to $199,999 | 6 | 0.8% |
| $200,000+ | 19 | 2.4% |
Household Income by Householder Age in Hart
The median household income in Hart is $56,979, with the highest median household income of $62,500 found in the 25 to 44 years age bracket for the primary householder. A total of 244 households (31.4%) fall into this category. Meanwhile, the 65+ years age bracket for the primary householder has the lowest median household income of $33,750, with 195 households (25.1%) in this group.
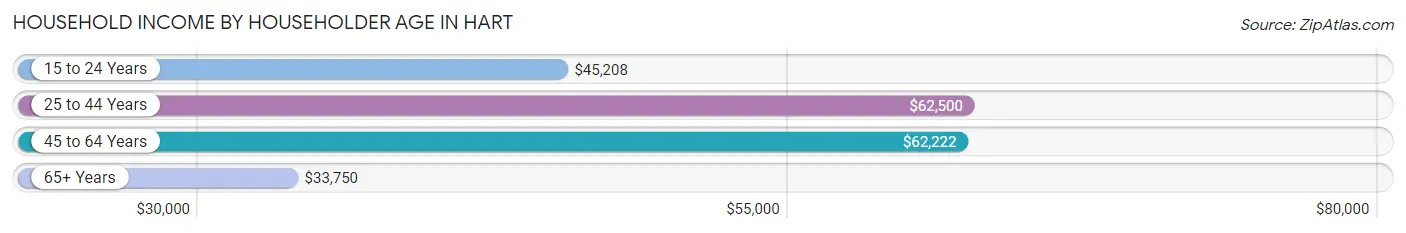
| Income Bracket | # Households | Median Income |
| 15 to 24 Years | 21 (2.7%) | $45,208 |
| 25 to 44 Years | 244 (31.4%) | $62,500 |
| 45 to 64 Years | 316 (40.7%) | $62,222 |
| 65+ Years | 195 (25.1%) | $33,750 |
| Total | 776 (100.0%) | $56,979 |
Poverty in Hart
Income Below Poverty by Sex and Age in Hart
With 15.3% poverty level for males and 24.8% for females among the residents of Hart, under 5 year old males and 5 year old females are the most vulnerable to poverty, with 25 males (32.5%) and 6 females (100.0%) in their respective age groups living below the poverty level.
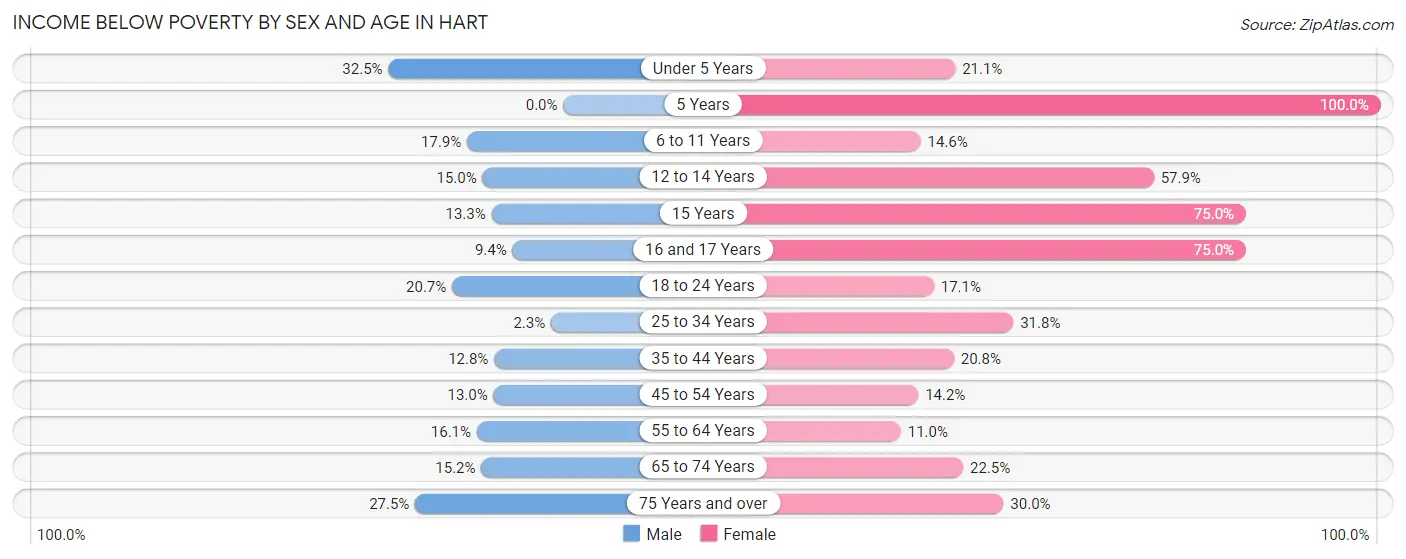
| Age Bracket | Male | Female |
| Under 5 Years | 25 (32.5%) | 12 (21.0%) |
| 5 Years | 0 (0.0%) | 6 (100.0%) |
| 6 to 11 Years | 25 (17.9%) | 6 (14.6%) |
| 12 to 14 Years | 6 (15.0%) | 11 (57.9%) |
| 15 Years | 4 (13.3%) | 21 (75.0%) |
| 16 and 17 Years | 5 (9.4%) | 15 (75.0%) |
| 18 to 24 Years | 19 (20.6%) | 7 (17.1%) |
| 25 to 34 Years | 3 (2.3%) | 42 (31.8%) |
| 35 to 44 Years | 19 (12.8%) | 21 (20.8%) |
| 45 to 54 Years | 14 (13.0%) | 19 (14.2%) |
| 55 to 64 Years | 26 (16.1%) | 15 (11.0%) |
| 65 to 74 Years | 14 (15.2%) | 18 (22.5%) |
| 75 Years and over | 11 (27.5%) | 24 (30.0%) |
| Total | 171 (15.3%) | 217 (24.8%) |
Income Above Poverty by Sex and Age in Hart
According to the poverty statistics in Hart, males aged 5 years and females aged 55 to 64 years are the age groups that are most secure financially, with 100.0% of males and 89.0% of females in these age groups living above the poverty line.
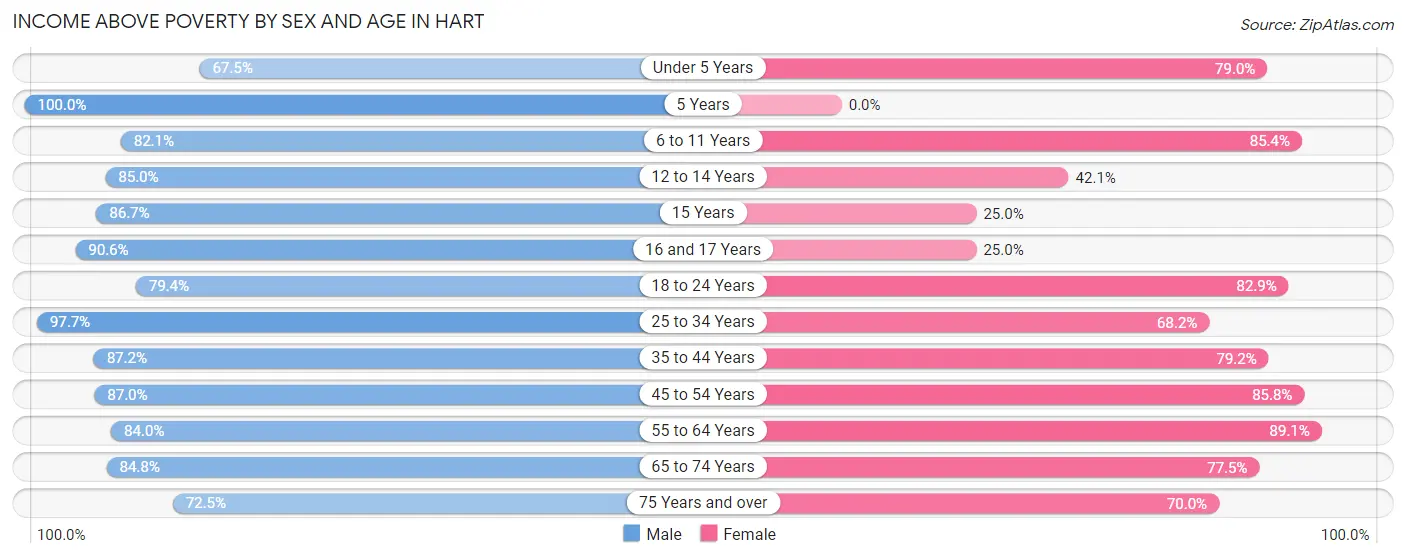
| Age Bracket | Male | Female |
| Under 5 Years | 52 (67.5%) | 45 (78.9%) |
| 5 Years | 2 (100.0%) | 0 (0.0%) |
| 6 to 11 Years | 115 (82.1%) | 35 (85.4%) |
| 12 to 14 Years | 34 (85.0%) | 8 (42.1%) |
| 15 Years | 26 (86.7%) | 7 (25.0%) |
| 16 and 17 Years | 48 (90.6%) | 5 (25.0%) |
| 18 to 24 Years | 73 (79.3%) | 34 (82.9%) |
| 25 to 34 Years | 128 (97.7%) | 90 (68.2%) |
| 35 to 44 Years | 129 (87.2%) | 80 (79.2%) |
| 45 to 54 Years | 94 (87.0%) | 115 (85.8%) |
| 55 to 64 Years | 136 (84.0%) | 122 (89.0%) |
| 65 to 74 Years | 78 (84.8%) | 62 (77.5%) |
| 75 Years and over | 29 (72.5%) | 56 (70.0%) |
| Total | 944 (84.7%) | 659 (75.2%) |
Income Below Poverty Among Married-Couple Families in Hart
The poverty statistics for married-couple families in Hart show that 8.1% or 25 of the total 308 families live below the poverty line. Families with 3 or 4 children have the highest poverty rate of 14.3%, comprising of 2 families. On the other hand, families with 1 or 2 children have the lowest poverty rate of 1.5%, which includes 2 families.
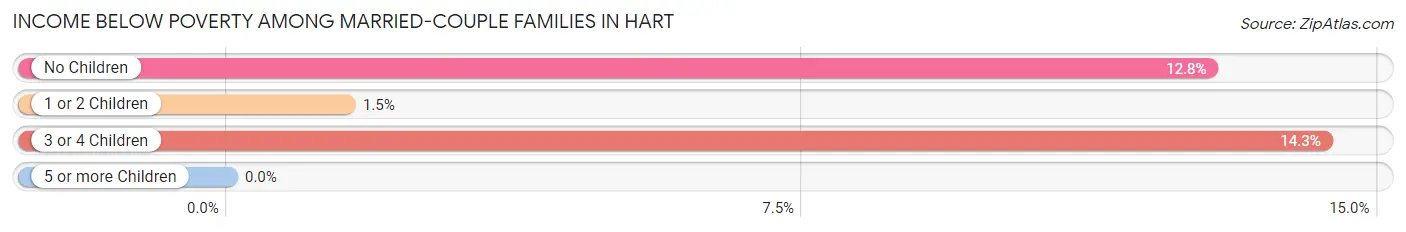
| Children | Above Poverty | Below Poverty |
| No Children | 143 (87.2%) | 21 (12.8%) |
| 1 or 2 Children | 128 (98.5%) | 2 (1.5%) |
| 3 or 4 Children | 12 (85.7%) | 2 (14.3%) |
| 5 or more Children | 0 (0.0%) | 0 (0.0%) |
| Total | 283 (91.9%) | 25 (8.1%) |
Income Below Poverty Among Single-Parent Households in Hart
According to the poverty data in Hart, 3.7% or 3 single-father households and 42.2% or 30 single-mother households are living below the poverty line. Among single-father households, those with 1 or 2 children have the highest poverty rate, with 3 households (5.4%) experiencing poverty. Likewise, among single-mother households, those with 3 or 4 children have the highest poverty rate, with 16 households (100.0%) falling below the poverty line.
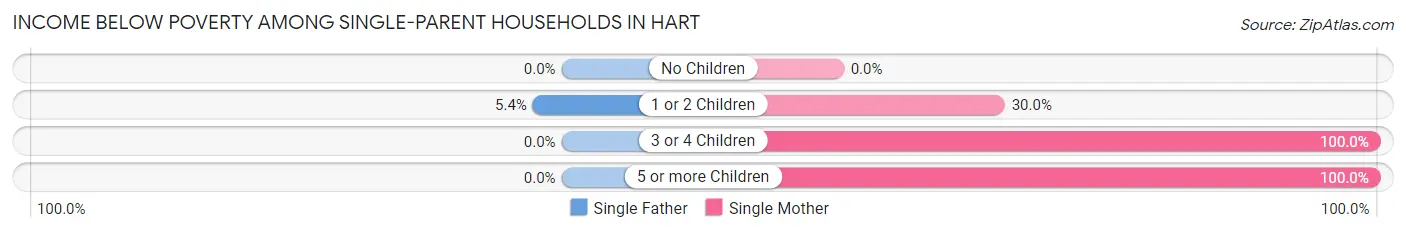
| Children | Single Father | Single Mother |
| No Children | 0 (0.0%) | 0 (0.0%) |
| 1 or 2 Children | 3 (5.4%) | 12 (30.0%) |
| 3 or 4 Children | 0 (0.0%) | 16 (100.0%) |
| 5 or more Children | 0 (0.0%) | 2 (100.0%) |
| Total | 3 (3.7%) | 30 (42.2%) |
Income Below Poverty Among Married-Couple vs Single-Parent Households in Hart
The poverty data for Hart shows that 25 of the married-couple family households (8.1%) and 33 of the single-parent households (21.6%) are living below the poverty level. Within the married-couple family households, those with 3 or 4 children have the highest poverty rate, with 2 households (14.3%) falling below the poverty line. Among the single-parent households, those with 5 or more children have the highest poverty rate, with 2 household (100.0%) living below poverty.
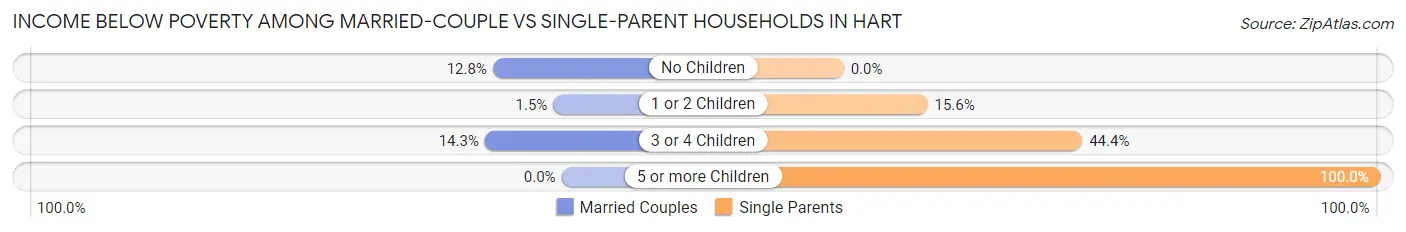
| Children | Married-Couple Families | Single-Parent Households |
| No Children | 21 (12.8%) | 0 (0.0%) |
| 1 or 2 Children | 2 (1.5%) | 15 (15.6%) |
| 3 or 4 Children | 2 (14.3%) | 16 (44.4%) |
| 5 or more Children | 0 (0.0%) | 2 (100.0%) |
| Total | 25 (8.1%) | 33 (21.6%) |
Race in Hart
The most populous races in Hart are White / Caucasian (1,815 | 83.5%), Hispanic or Latino (485 | 22.3%), and Some other Race (119 | 5.5%).
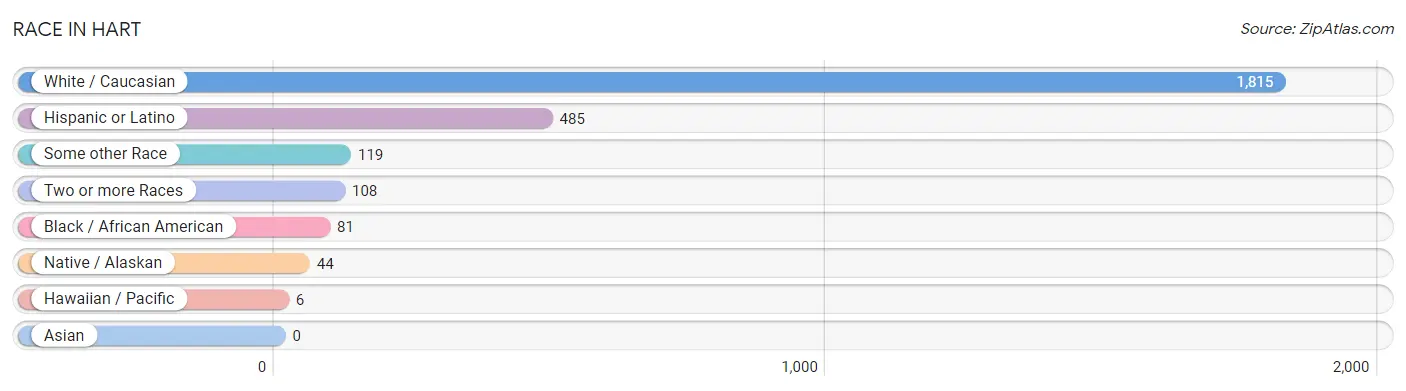
| Race | # Population | % Population |
| Asian | 0 | 0.0% |
| Black / African American | 81 | 3.7% |
| Hawaiian / Pacific | 6 | 0.3% |
| Hispanic or Latino | 485 | 22.3% |
| Native / Alaskan | 44 | 2.0% |
| White / Caucasian | 1,815 | 83.5% |
| Two or more Races | 108 | 5.0% |
| Some other Race | 119 | 5.5% |
| Total | 2,173 | 100.0% |
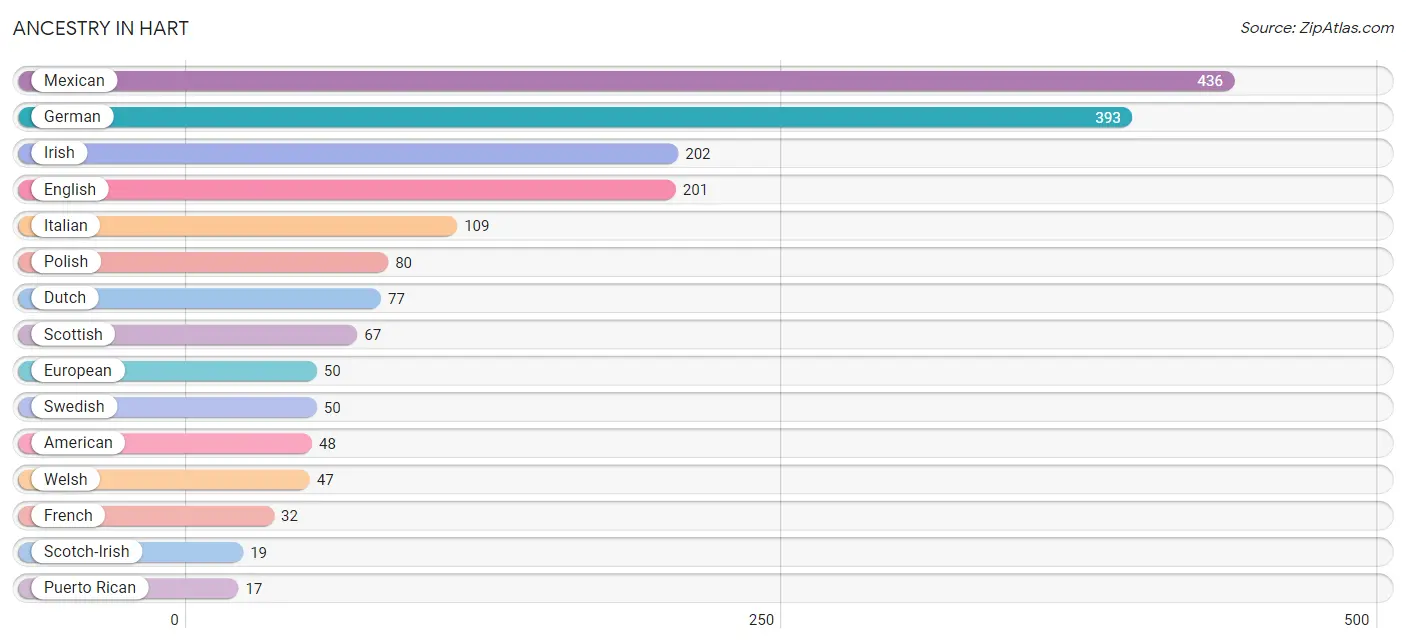
Ancestry in Hart
The most populous ancestries reported in Hart are Mexican (436 | 20.1%), German (393 | 18.1%), Irish (202 | 9.3%), English (201 | 9.2%), and Italian (109 | 5.0%), together accounting for 61.7% of all Hart residents.
| Ancestry | # Population | % Population |
| African | 4 | 0.2% |
| American | 48 | 2.2% |
| Belgian | 11 | 0.5% |
| Brazilian | 4 | 0.2% |
| Canadian | 4 | 0.2% |
| Chippewa | 13 | 0.6% |
| Colombian | 8 | 0.4% |
| Czech | 8 | 0.4% |
| Czechoslovakian | 4 | 0.2% |
| Danish | 5 | 0.2% |
| Dutch | 77 | 3.5% |
| Eastern European | 6 | 0.3% |
| English | 201 | 9.2% |
| European | 50 | 2.3% |
| French | 32 | 1.5% |
| French Canadian | 15 | 0.7% |
| German | 393 | 18.1% |
| Irish | 202 | 9.3% |
| Italian | 109 | 5.0% |
| Lithuanian | 8 | 0.4% |
| Mexican | 436 | 20.1% |
| Mexican American Indian | 14 | 0.6% |
| Native Hawaiian | 6 | 0.3% |
| Norwegian | 2 | 0.1% |
| Ottawa | 3 | 0.1% |
| Pennsylvania German | 3 | 0.1% |
| Polish | 80 | 3.7% |
| Portuguese | 3 | 0.1% |
| Puerto Rican | 17 | 0.8% |
| Scotch-Irish | 19 | 0.9% |
| Scottish | 67 | 3.1% |
| Slovak | 4 | 0.2% |
| South American | 8 | 0.4% |
| Spanish | 17 | 0.8% |
| Subsaharan African | 4 | 0.2% |
| Swedish | 50 | 2.3% |
| Swiss | 2 | 0.1% |
| Tlingit-Haida | 11 | 0.5% |
| Welsh | 47 | 2.2% | View All 39 Rows |
Immigrants in Hart
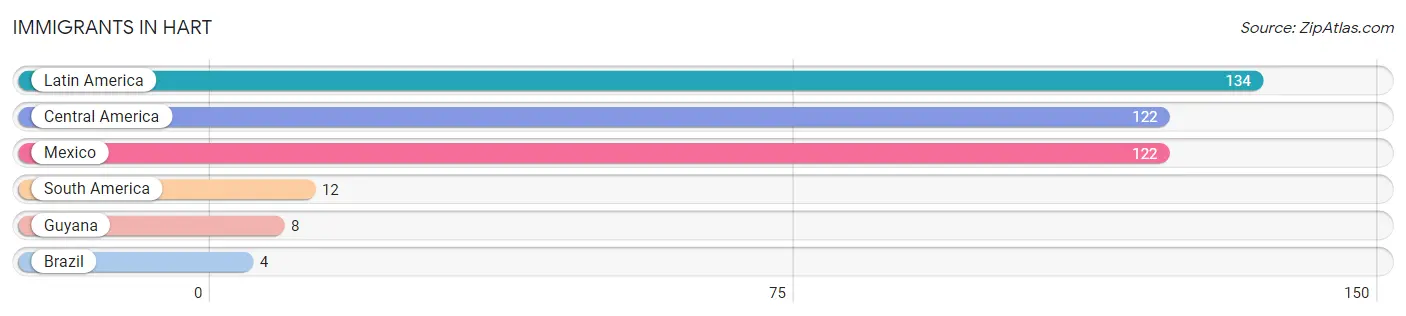
The most numerous immigrant groups reported in Hart came from Latin America (134 | 6.2%), Central America (122 | 5.6%), Mexico (122 | 5.6%), South America (12 | 0.5%), and Guyana (8 | 0.4%), together accounting for 18.3% of all Hart residents.
| Immigration Origin | # Population | % Population |
| Brazil | 4 | 0.2% |
| Central America | 122 | 5.6% |
| Guyana | 8 | 0.4% |
| Latin America | 134 | 6.2% |
| Mexico | 122 | 5.6% |
| South America | 12 | 0.5% | View All 6 Rows |
Sex and Age in Hart
Sex and Age in Hart
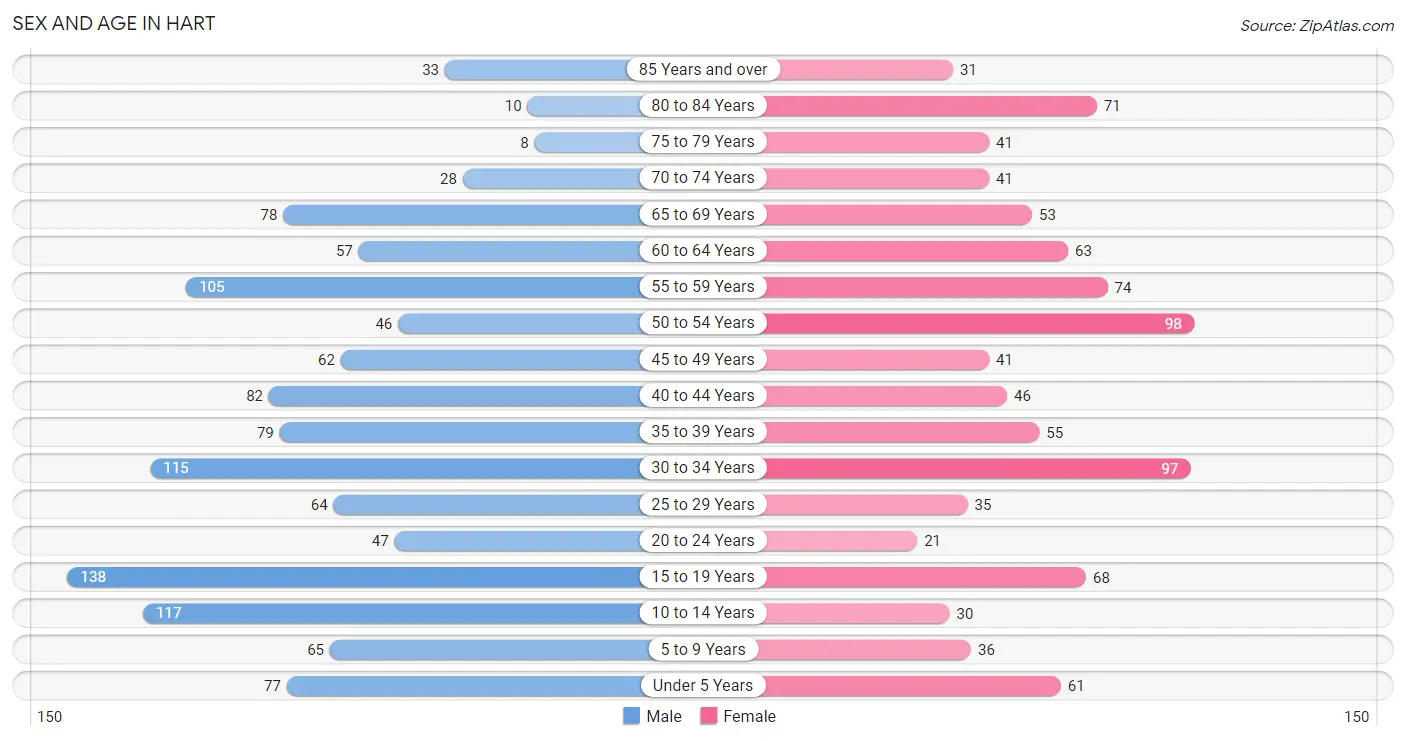
The most populous age groups in Hart are 15 to 19 Years (138 | 11.4%) for men and 50 to 54 Years (98 | 10.2%) for women.
| Age Bracket | Male | Female |
| Under 5 Years | 77 (6.4%) | 61 (6.3%) |
| 5 to 9 Years | 65 (5.4%) | 36 (3.7%) |
| 10 to 14 Years | 117 (9.7%) | 30 (3.1%) |
| 15 to 19 Years | 138 (11.4%) | 68 (7.1%) |
| 20 to 24 Years | 47 (3.9%) | 21 (2.2%) |
| 25 to 29 Years | 64 (5.3%) | 35 (3.6%) |
| 30 to 34 Years | 115 (9.5%) | 97 (10.1%) |
| 35 to 39 Years | 79 (6.5%) | 55 (5.7%) |
| 40 to 44 Years | 82 (6.8%) | 46 (4.8%) |
| 45 to 49 Years | 62 (5.1%) | 41 (4.3%) |
| 50 to 54 Years | 46 (3.8%) | 98 (10.2%) |
| 55 to 59 Years | 105 (8.7%) | 74 (7.7%) |
| 60 to 64 Years | 57 (4.7%) | 63 (6.6%) |
| 65 to 69 Years | 78 (6.4%) | 53 (5.5%) |
| 70 to 74 Years | 28 (2.3%) | 41 (4.3%) |
| 75 to 79 Years | 8 (0.7%) | 41 (4.3%) |
| 80 to 84 Years | 10 (0.8%) | 71 (7.4%) |
| 85 Years and over | 33 (2.7%) | 31 (3.2%) |
| Total | 1,211 (100.0%) | 962 (100.0%) |
Families and Households in Hart
Median Family Size in Hart
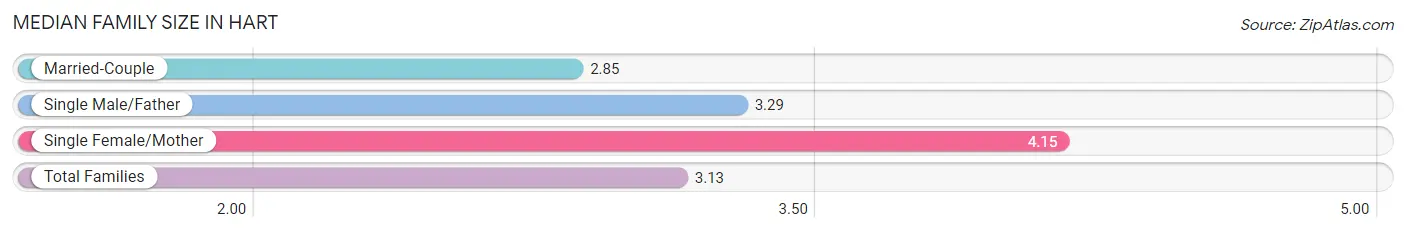
The median family size in Hart is 3.13 persons per family, with single female/mother families (71 | 15.4%) accounting for the largest median family size of 4.15 persons per family. On the other hand, married-couple families (308 | 66.8%) represent the smallest median family size with 2.85 persons per family.
| Family Type | # Families | Family Size |
| Married-Couple | 308 (66.8%) | 2.85 |
| Single Male/Father | 82 (17.8%) | 3.29 |
| Single Female/Mother | 71 (15.4%) | 4.15 |
| Total Families | 461 (100.0%) | 3.13 |
Median Household Size in Hart
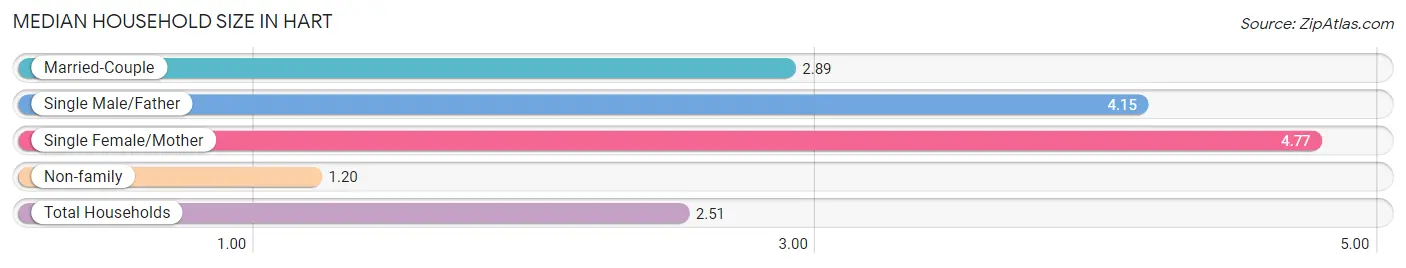
The median household size in Hart is 2.51 persons per household, with single female/mother households (71 | 9.1%) accounting for the largest median household size of 4.77 persons per household. non-family households (315 | 40.6%) represent the smallest median household size with 1.20 persons per household.
| Household Type | # Households | Household Size |
| Married-Couple | 308 (39.7%) | 2.89 |
| Single Male/Father | 82 (10.6%) | 4.15 |
| Single Female/Mother | 71 (9.1%) | 4.77 |
| Non-family | 315 (40.6%) | 1.20 |
| Total Households | 776 (100.0%) | 2.51 |
Household Size by Marriage Status in Hart
Out of a total of 776 households in Hart, 461 (59.4%) are family households, while 315 (40.6%) are nonfamily households. The most numerous type of family households are 2-person households, comprising 149, and the most common type of nonfamily households are 1-person households, comprising 268.
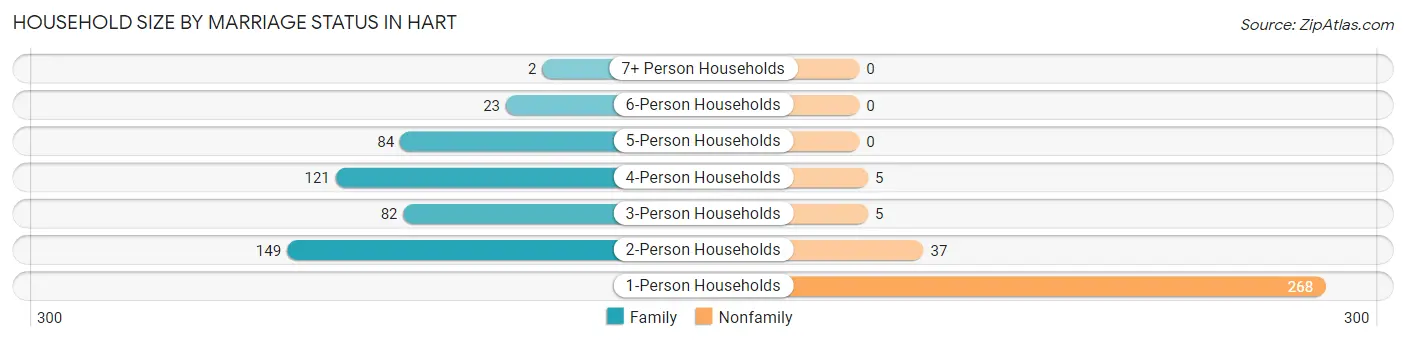
| Household Size | Family Households | Nonfamily Households |
| 1-Person Households | - | 268 (34.5%) |
| 2-Person Households | 149 (19.2%) | 37 (4.8%) |
| 3-Person Households | 82 (10.6%) | 5 (0.6%) |
| 4-Person Households | 121 (15.6%) | 5 (0.6%) |
| 5-Person Households | 84 (10.8%) | 0 (0.0%) |
| 6-Person Households | 23 (3.0%) | 0 (0.0%) |
| 7+ Person Households | 2 (0.3%) | 0 (0.0%) |
| Total | 461 (59.4%) | 315 (40.6%) |
Female Fertility in Hart
Fertility by Age in Hart
Average fertility rate in Hart is 165.0 births per 1,000 women. Women in the age bracket of 20 to 34 years have the highest fertility rate with 359.0 births per 1,000 women. Women in the age bracket of 20 to 34 years acount for 90.2% of all women with births.
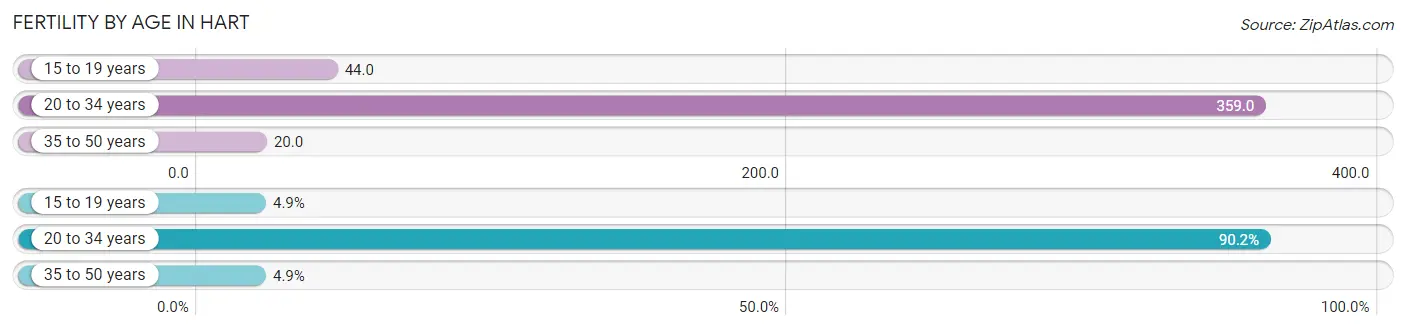
| Age Bracket | Women with Births | Births / 1,000 Women |
| 15 to 19 years | 3 (4.9%) | 44.0 |
| 20 to 34 years | 55 (90.2%) | 359.0 |
| 35 to 50 years | 3 (4.9%) | 20.0 |
| Total | 61 (100.0%) | 165.0 |
Fertility by Age by Marriage Status in Hart
19.7% of women with births (61) in Hart are married. The highest percentage of unmarried women with births falls into 15 to 19 years age bracket with 100.0% of them unmarried at the time of birth, while the lowest percentage of unmarried women with births belong to 35 to 50 years age bracket with 0.0% of them unmarried.
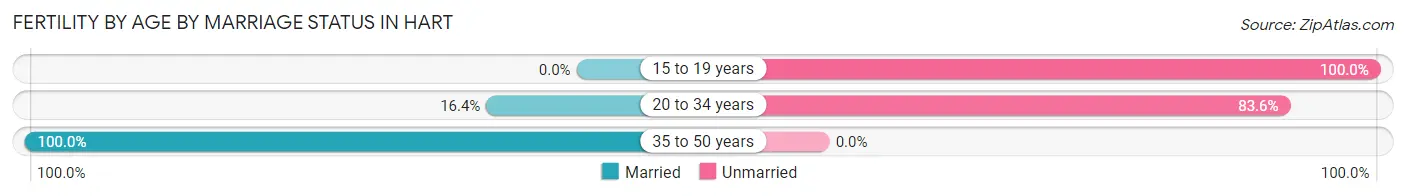
| Age Bracket | Married | Unmarried |
| 15 to 19 years | 0 (0.0%) | 3 (100.0%) |
| 20 to 34 years | 9 (16.4%) | 46 (83.6%) |
| 35 to 50 years | 3 (100.0%) | 0 (0.0%) |
| Total | 12 (19.7%) | 49 (80.3%) |
Fertility by Education in Hart
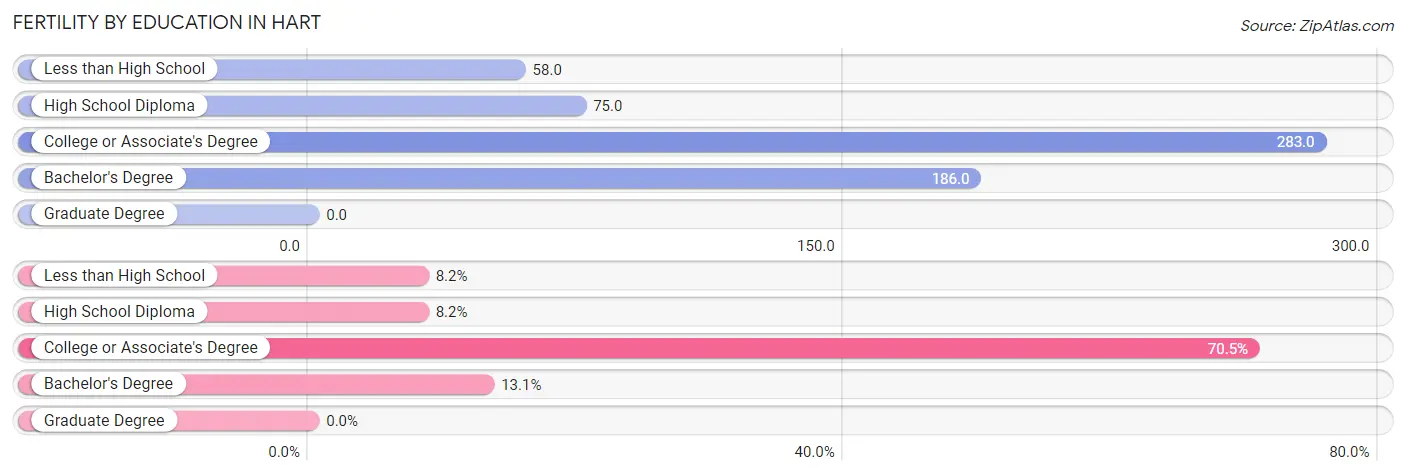
| Educational Attainment | Women with Births | Births / 1,000 Women |
| Less than High School | 5 (8.2%) | 58.0 |
| High School Diploma | 5 (8.2%) | 75.0 |
| College or Associate's Degree | 43 (70.5%) | 283.0 |
| Bachelor's Degree | 8 (13.1%) | 186.0 |
| Graduate Degree | 0 (0.0%) | 0.0 |
| Total | 61 (100.0%) | 165.0 |
Fertility by Education by Marriage Status in Hart
80.3% of women with births in Hart are unmarried. Women with the educational attainment of bachelor's degree are most likely to be married with 37.5% of them married at childbirth, while women with the educational attainment of less than high school are least likely to be married with 100.0% of them unmarried at childbirth.
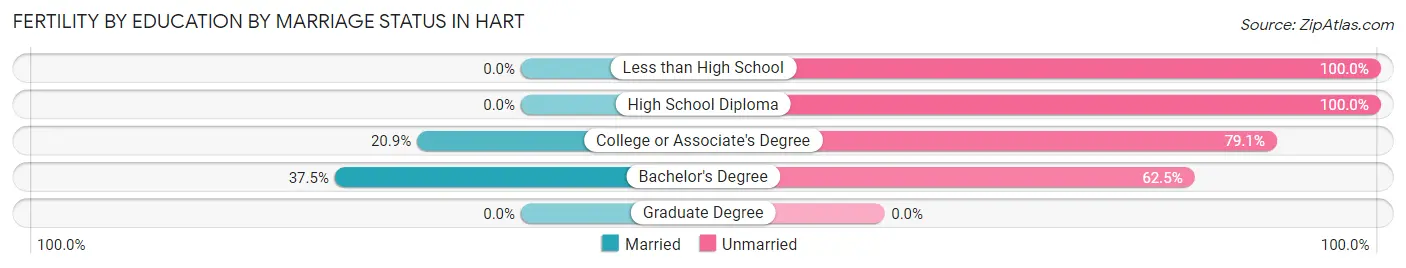
| Educational Attainment | Married | Unmarried |
| Less than High School | 0 (0.0%) | 5 (100.0%) |
| High School Diploma | 0 (0.0%) | 5 (100.0%) |
| College or Associate's Degree | 9 (20.9%) | 34 (79.1%) |
| Bachelor's Degree | 3 (37.5%) | 5 (62.5%) |
| Graduate Degree | 0 (0.0%) | 0 (0.0%) |
| Total | 12 (19.7%) | 49 (80.3%) |
Employment Characteristics in Hart
Employment by Class of Employer in Hart
Among the 954 employed individuals in Hart, private company employees (607 | 63.6%), local government employees (85 | 8.9%), and self-employed (incorporated) (79 | 8.3%) make up the most common classes of employment.
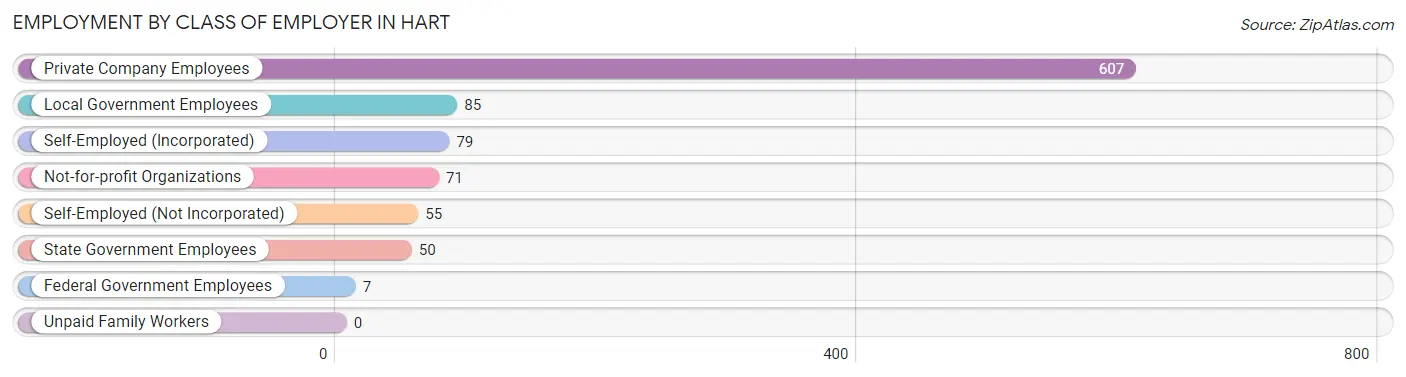
| Employer Class | # Employees | % Employees |
| Private Company Employees | 607 | 63.6% |
| Self-Employed (Incorporated) | 79 | 8.3% |
| Self-Employed (Not Incorporated) | 55 | 5.8% |
| Not-for-profit Organizations | 71 | 7.4% |
| Local Government Employees | 85 | 8.9% |
| State Government Employees | 50 | 5.2% |
| Federal Government Employees | 7 | 0.7% |
| Unpaid Family Workers | 0 | 0.0% |
| Total | 954 | 100.0% |
Employment Status by Age in Hart
According to the labor force statistics for Hart, out of the total population over 16 years of age (1,729), 57.7% or 998 individuals are in the labor force, with 3.0% or 30 of them unemployed. The age group with the highest labor force participation rate is 35 to 44 years, with 88.9% or 233 individuals in the labor force. Within the labor force, the 20 to 24 years age range has the highest percentage of unemployed individuals, with 15.3% or 9 of them being unemployed.
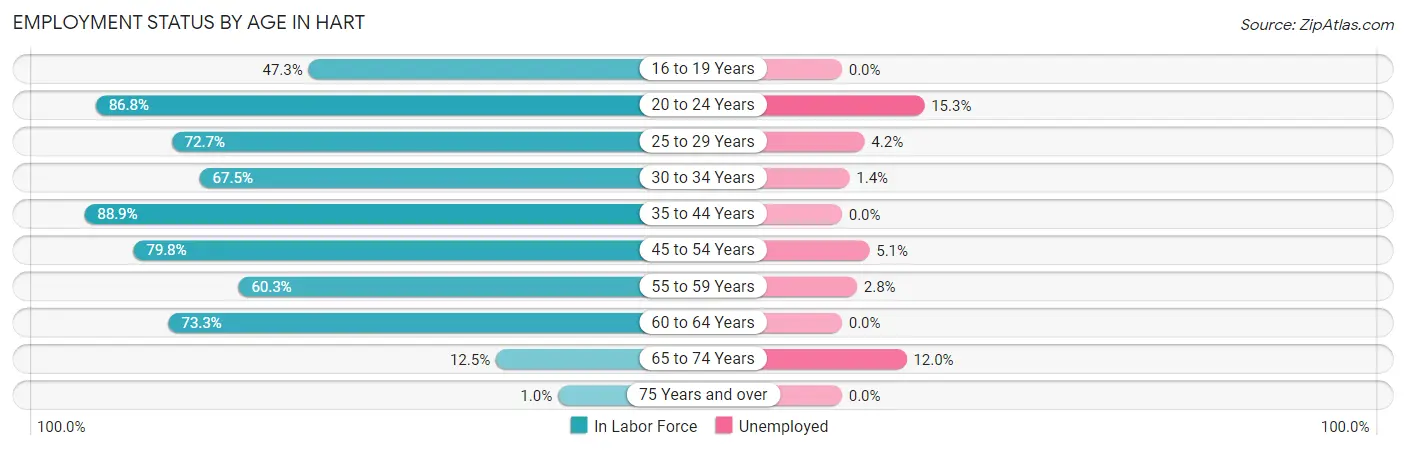
| Age Bracket | In Labor Force | Unemployed |
| 16 to 19 Years | 70 (47.3%) | 0 (0.0%) |
| 20 to 24 Years | 59 (86.8%) | 9 (15.3%) |
| 25 to 29 Years | 72 (72.7%) | 3 (4.2%) |
| 30 to 34 Years | 143 (67.5%) | 2 (1.4%) |
| 35 to 44 Years | 233 (88.9%) | 0 (0.0%) |
| 45 to 54 Years | 197 (79.8%) | 10 (5.1%) |
| 55 to 59 Years | 108 (60.3%) | 3 (2.8%) |
| 60 to 64 Years | 88 (73.3%) | 0 (0.0%) |
| 65 to 74 Years | 25 (12.5%) | 3 (12.0%) |
| 75 Years and over | 2 (1.0%) | 0 (0.0%) |
| Total | 998 (57.7%) | 30 (3.0%) |
Employment Status by Educational Attainment in Hart
According to labor force statistics for Hart, 75.2% of individuals (841) out of the total population between 25 and 64 years of age (1,119) are in the labor force, with 2.1% or 18 of them being unemployed. The group with the highest labor force participation rate are those with the educational attainment of bachelor's degree or higher, with 96.0% or 216 individuals in the labor force. Within the labor force, individuals with high school diploma education have the highest percentage of unemployment, with 5.4% or 13 of them being unemployed.
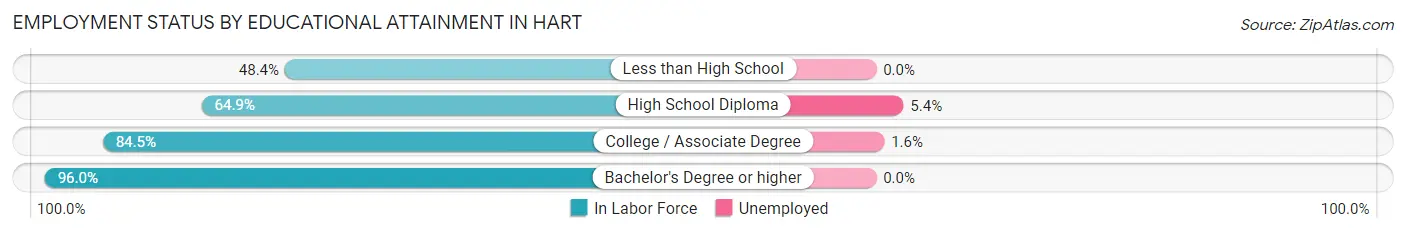
| Educational Attainment | In Labor Force | Unemployed |
| Less than High School | 77 (48.4%) | 0 (0.0%) |
| High School Diploma | 242 (64.9%) | 20 (5.4%) |
| College / Associate Degree | 306 (84.5%) | 6 (1.6%) |
| Bachelor's Degree or higher | 216 (96.0%) | 0 (0.0%) |
| Total | 841 (75.2%) | 23 (2.1%) |
Employment Occupations by Sex in Hart
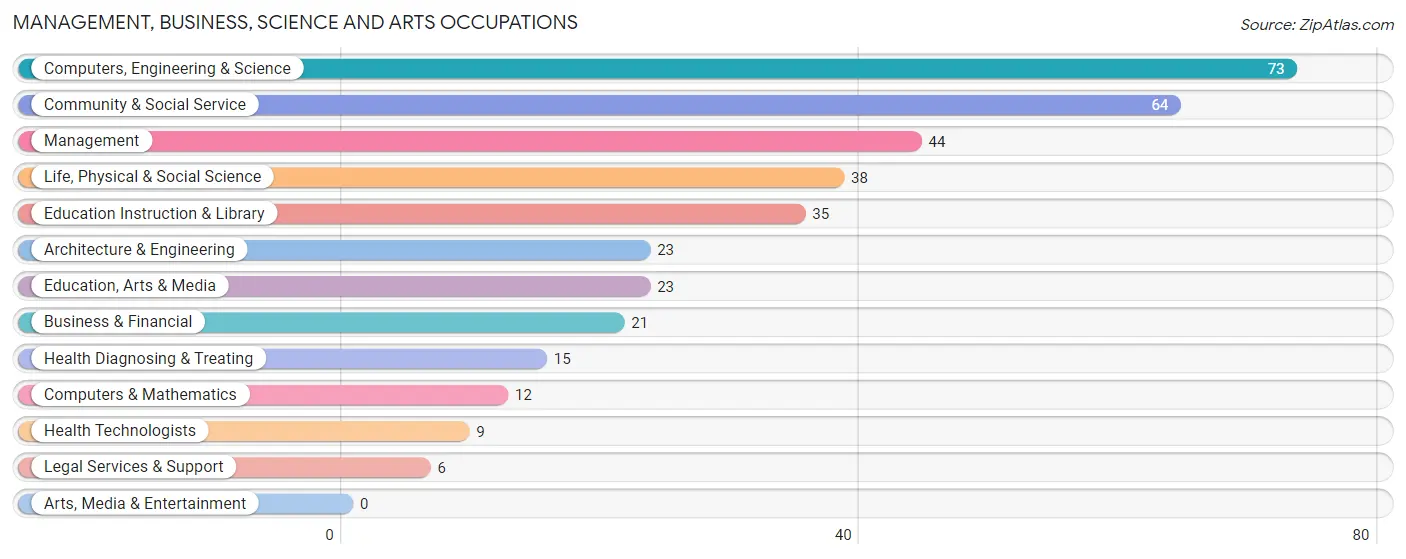
Management, Business, Science and Arts Occupations
The most common Management, Business, Science and Arts occupations in Hart are Computers, Engineering & Science (73 | 7.5%), Community & Social Service (64 | 6.6%), Management (44 | 4.5%), Life, Physical & Social Science (38 | 3.9%), and Education Instruction & Library (35 | 3.6%).
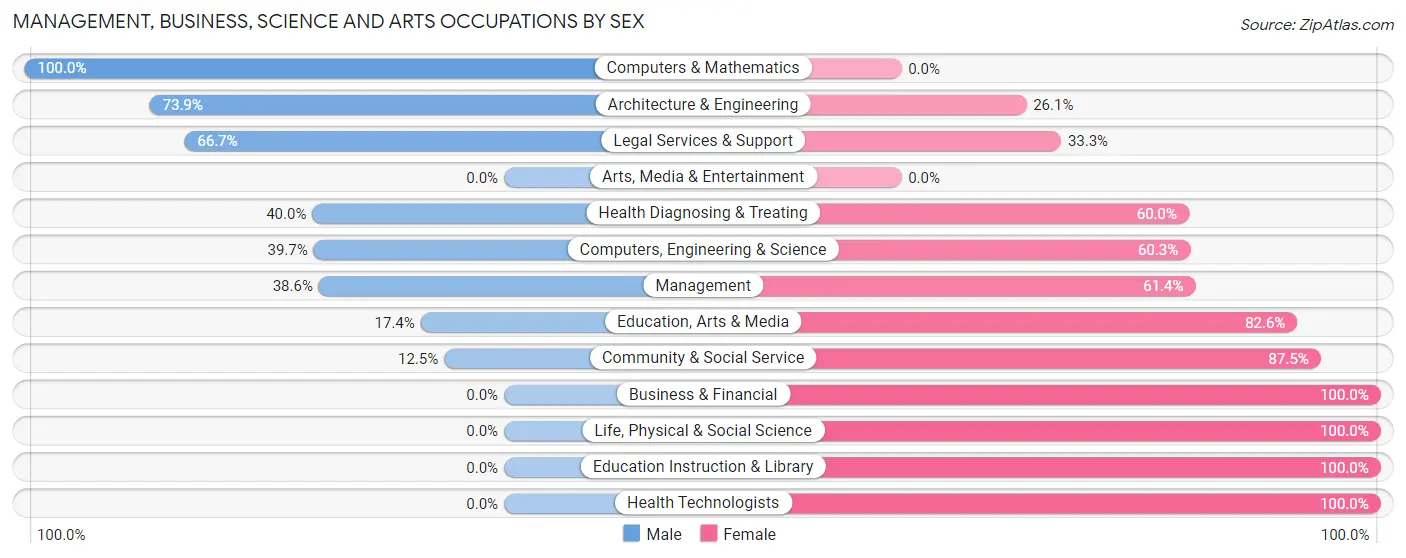
Management, Business, Science and Arts Occupations by Sex
Within the Management, Business, Science and Arts occupations in Hart, the most male-oriented occupations are Computers & Mathematics (100.0%), Architecture & Engineering (73.9%), and Legal Services & Support (66.7%), while the most female-oriented occupations are Business & Financial (100.0%), Life, Physical & Social Science (100.0%), and Education Instruction & Library (100.0%).
| Occupation | Male | Female |
| Management | 17 (38.6%) | 27 (61.4%) |
| Business & Financial | 0 (0.0%) | 21 (100.0%) |
| Computers, Engineering & Science | 29 (39.7%) | 44 (60.3%) |
| Computers & Mathematics | 12 (100.0%) | 0 (0.0%) |
| Architecture & Engineering | 17 (73.9%) | 6 (26.1%) |
| Life, Physical & Social Science | 0 (0.0%) | 38 (100.0%) |
| Community & Social Service | 8 (12.5%) | 56 (87.5%) |
| Education, Arts & Media | 4 (17.4%) | 19 (82.6%) |
| Legal Services & Support | 4 (66.7%) | 2 (33.3%) |
| Education Instruction & Library | 0 (0.0%) | 35 (100.0%) |
| Arts, Media & Entertainment | 0 (0.0%) | 0 (0.0%) |
| Health Diagnosing & Treating | 6 (40.0%) | 9 (60.0%) |
| Health Technologists | 0 (0.0%) | 9 (100.0%) |
| Total (Category) | 60 (27.7%) | 157 (72.4%) |
| Total (Overall) | 514 (53.1%) | 453 (46.9%) |
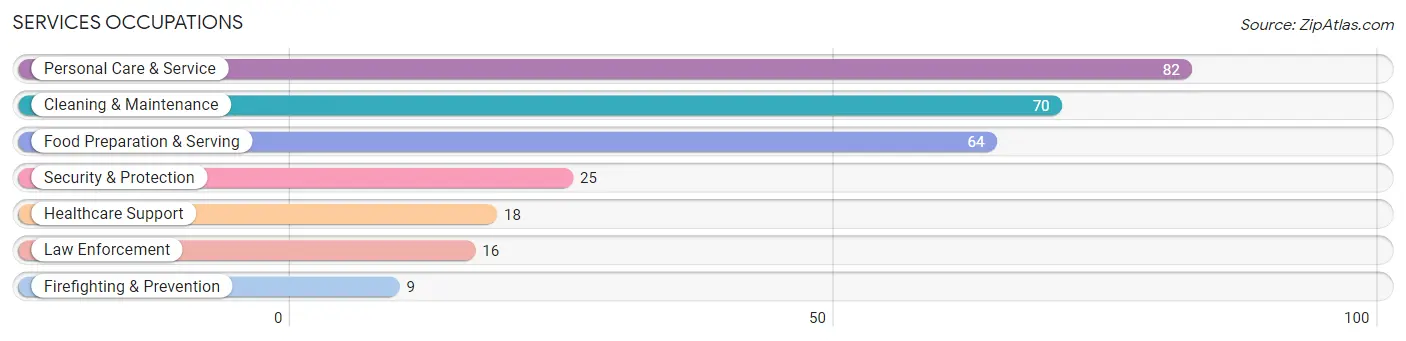
Services Occupations
The most common Services occupations in Hart are Personal Care & Service (82 | 8.5%), Cleaning & Maintenance (70 | 7.2%), Food Preparation & Serving (64 | 6.6%), Security & Protection (25 | 2.6%), and Healthcare Support (18 | 1.9%).
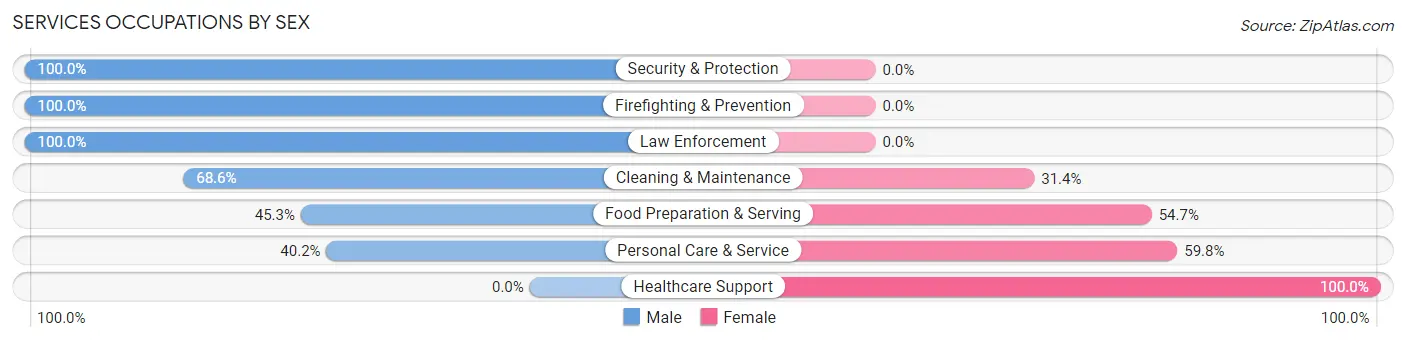
Services Occupations by Sex
Within the Services occupations in Hart, the most male-oriented occupations are Security & Protection (100.0%), Firefighting & Prevention (100.0%), and Law Enforcement (100.0%), while the most female-oriented occupations are Healthcare Support (100.0%), Personal Care & Service (59.8%), and Food Preparation & Serving (54.7%).
| Occupation | Male | Female |
| Healthcare Support | 0 (0.0%) | 18 (100.0%) |
| Security & Protection | 25 (100.0%) | 0 (0.0%) |
| Firefighting & Prevention | 9 (100.0%) | 0 (0.0%) |
| Law Enforcement | 16 (100.0%) | 0 (0.0%) |
| Food Preparation & Serving | 29 (45.3%) | 35 (54.7%) |
| Cleaning & Maintenance | 48 (68.6%) | 22 (31.4%) |
| Personal Care & Service | 33 (40.2%) | 49 (59.8%) |
| Total (Category) | 135 (52.1%) | 124 (47.9%) |
| Total (Overall) | 514 (53.1%) | 453 (46.9%) |
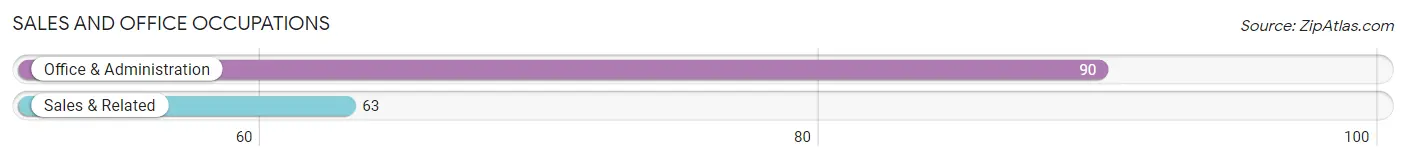
Sales and Office Occupations
The most common Sales and Office occupations in Hart are Office & Administration (90 | 9.3%), and Sales & Related (63 | 6.5%).
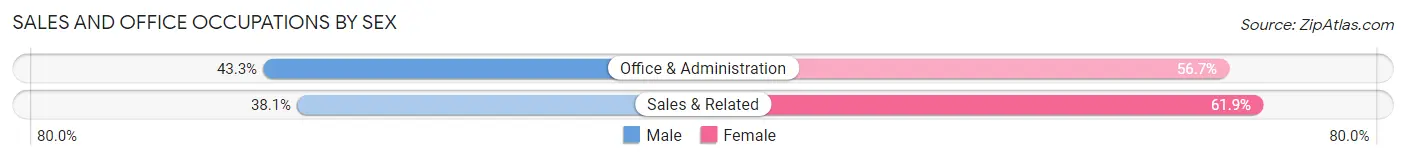
Sales and Office Occupations by Sex
| Occupation | Male | Female |
| Sales & Related | 24 (38.1%) | 39 (61.9%) |
| Office & Administration | 39 (43.3%) | 51 (56.7%) |
| Total (Category) | 63 (41.2%) | 90 (58.8%) |
| Total (Overall) | 514 (53.1%) | 453 (46.9%) |
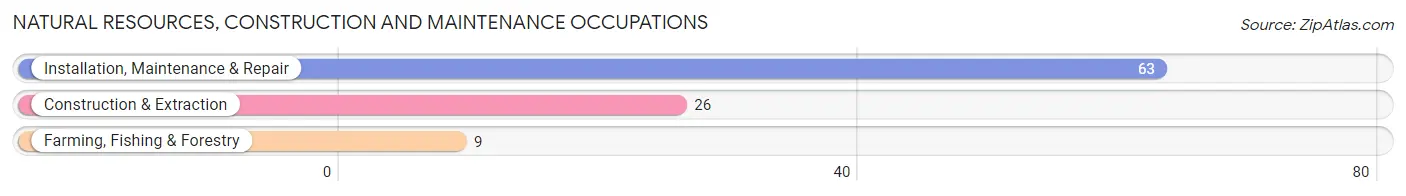
Natural Resources, Construction and Maintenance Occupations
The most common Natural Resources, Construction and Maintenance occupations in Hart are Installation, Maintenance & Repair (63 | 6.5%), Construction & Extraction (26 | 2.7%), and Farming, Fishing & Forestry (9 | 0.9%).
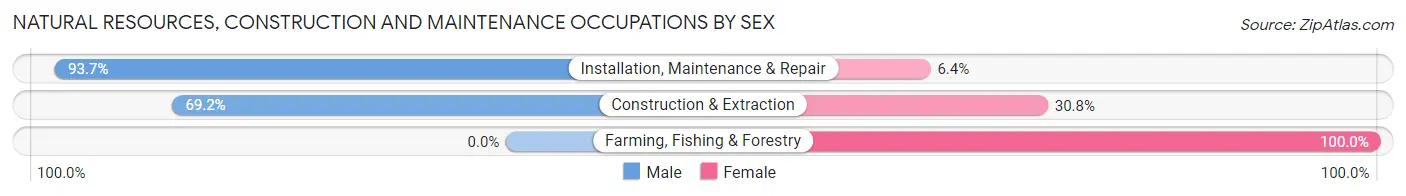
Natural Resources, Construction and Maintenance Occupations by Sex
| Occupation | Male | Female |
| Farming, Fishing & Forestry | 0 (0.0%) | 9 (100.0%) |
| Construction & Extraction | 18 (69.2%) | 8 (30.8%) |
| Installation, Maintenance & Repair | 59 (93.6%) | 4 (6.4%) |
| Total (Category) | 77 (78.6%) | 21 (21.4%) |
| Total (Overall) | 514 (53.1%) | 453 (46.9%) |
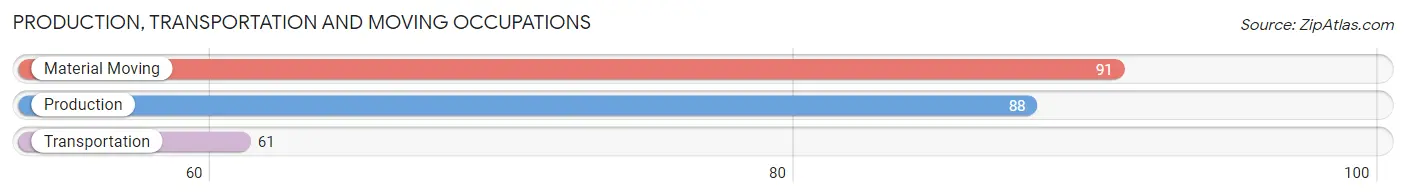
Production, Transportation and Moving Occupations
The most common Production, Transportation and Moving occupations in Hart are Material Moving (91 | 9.4%), Production (88 | 9.1%), and Transportation (61 | 6.3%).
Production, Transportation and Moving Occupations by Sex
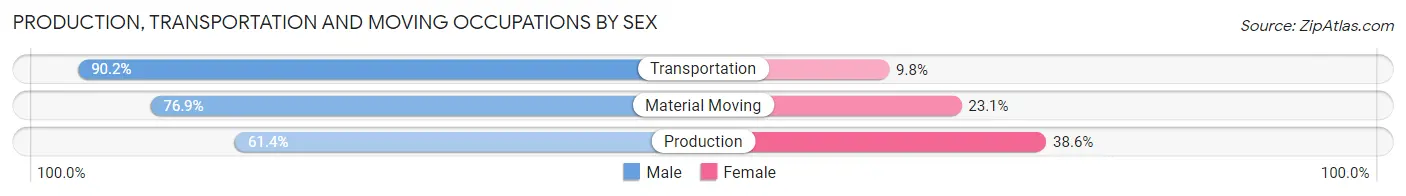
| Occupation | Male | Female |
| Production | 54 (61.4%) | 34 (38.6%) |
| Transportation | 55 (90.2%) | 6 (9.8%) |
| Material Moving | 70 (76.9%) | 21 (23.1%) |
| Total (Category) | 179 (74.6%) | 61 (25.4%) |
| Total (Overall) | 514 (53.1%) | 453 (46.9%) |
Employment Industries by Sex in Hart
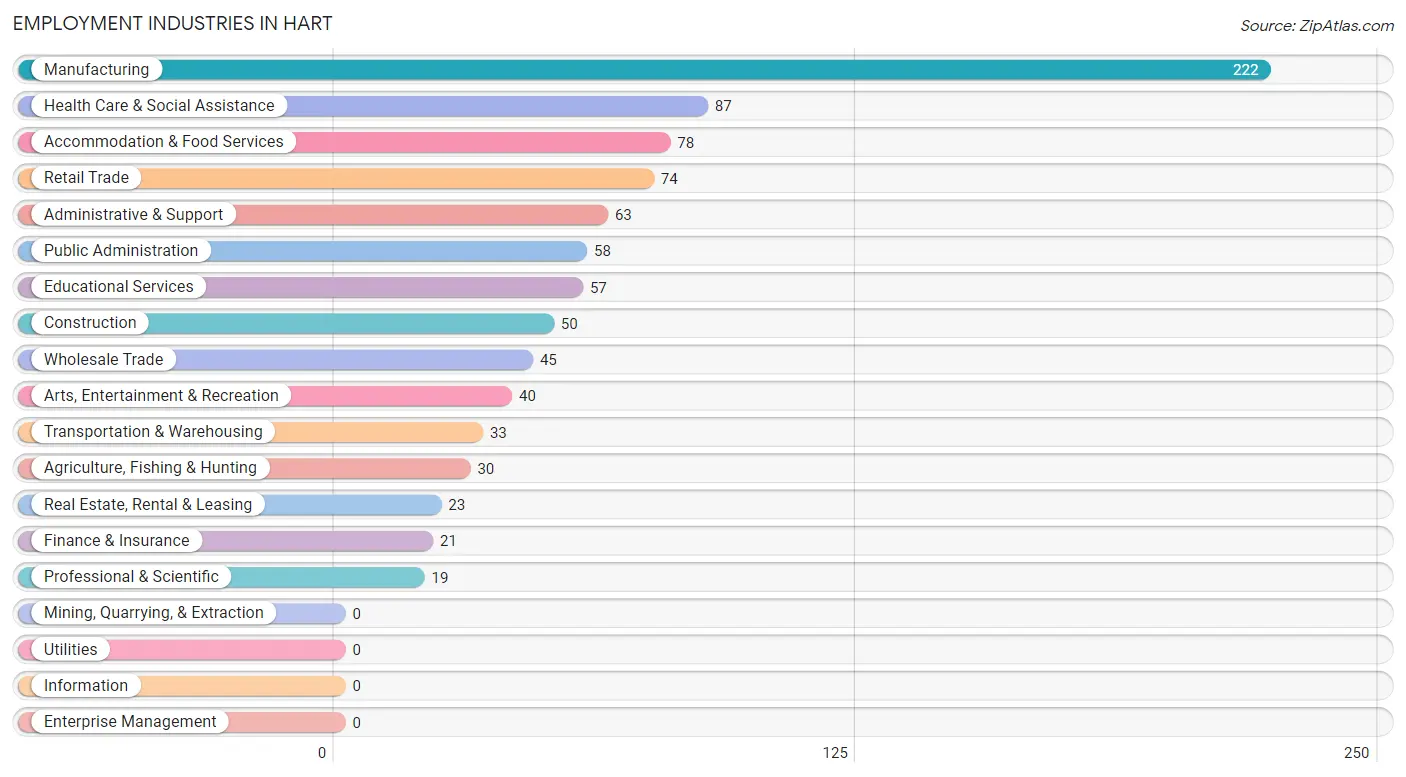
Employment Industries in Hart
The major employment industries in Hart include Manufacturing (222 | 23.0%), Health Care & Social Assistance (87 | 9.0%), Accommodation & Food Services (78 | 8.1%), Retail Trade (74 | 7.6%), and Administrative & Support (63 | 6.5%).
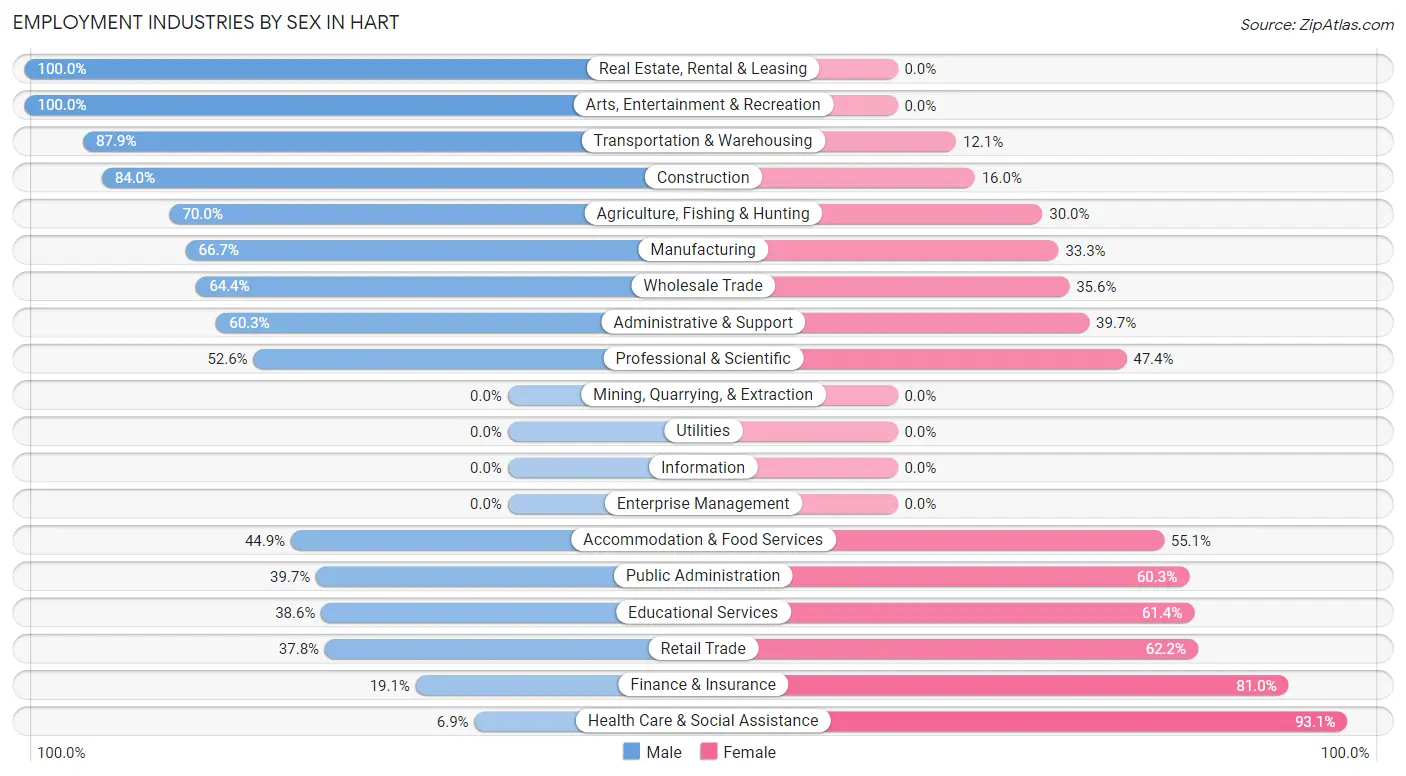
Employment Industries by Sex in Hart
The Hart industries that see more men than women are Real Estate, Rental & Leasing (100.0%), Arts, Entertainment & Recreation (100.0%), and Transportation & Warehousing (87.9%), whereas the industries that tend to have a higher number of women are Health Care & Social Assistance (93.1%), Finance & Insurance (80.9%), and Retail Trade (62.2%).
| Industry | Male | Female |
| Agriculture, Fishing & Hunting | 21 (70.0%) | 9 (30.0%) |
| Mining, Quarrying, & Extraction | 0 (0.0%) | 0 (0.0%) |
| Construction | 42 (84.0%) | 8 (16.0%) |
| Manufacturing | 148 (66.7%) | 74 (33.3%) |
| Wholesale Trade | 29 (64.4%) | 16 (35.6%) |
| Retail Trade | 28 (37.8%) | 46 (62.2%) |
| Transportation & Warehousing | 29 (87.9%) | 4 (12.1%) |
| Utilities | 0 (0.0%) | 0 (0.0%) |
| Information | 0 (0.0%) | 0 (0.0%) |
| Finance & Insurance | 4 (19.1%) | 17 (80.9%) |
| Real Estate, Rental & Leasing | 23 (100.0%) | 0 (0.0%) |
| Professional & Scientific | 10 (52.6%) | 9 (47.4%) |
| Enterprise Management | 0 (0.0%) | 0 (0.0%) |
| Administrative & Support | 38 (60.3%) | 25 (39.7%) |
| Educational Services | 22 (38.6%) | 35 (61.4%) |
| Health Care & Social Assistance | 6 (6.9%) | 81 (93.1%) |
| Arts, Entertainment & Recreation | 40 (100.0%) | 0 (0.0%) |
| Accommodation & Food Services | 35 (44.9%) | 43 (55.1%) |
| Public Administration | 23 (39.7%) | 35 (60.3%) |
| Total | 514 (53.1%) | 453 (46.9%) |
Education in Hart
School Enrollment in Hart
The most common levels of schooling among the 444 students in Hart are high school (172 | 38.7%), elementary school (99 | 22.3%), and middle school (85 | 19.1%).
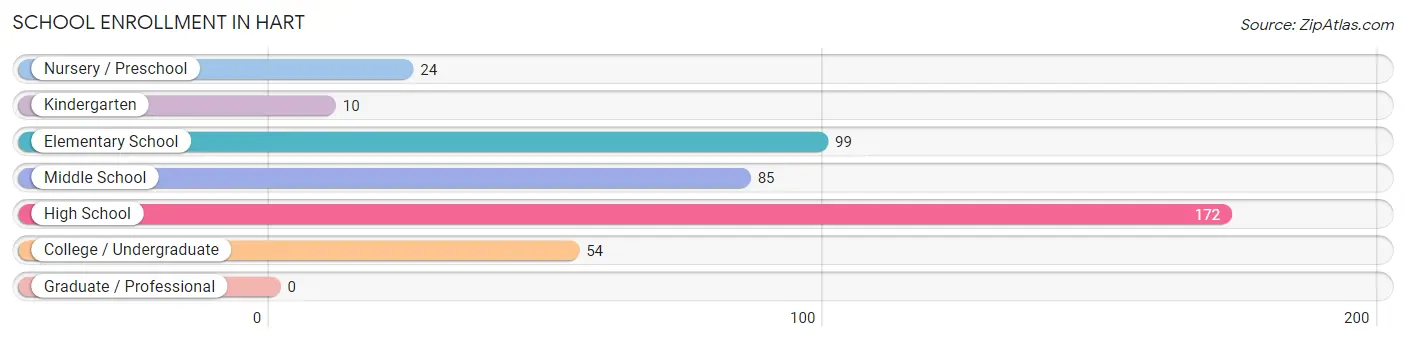
| School Level | # Students | % Students |
| Nursery / Preschool | 24 | 5.4% |
| Kindergarten | 10 | 2.2% |
| Elementary School | 99 | 22.3% |
| Middle School | 85 | 19.1% |
| High School | 172 | 38.7% |
| College / Undergraduate | 54 | 12.2% |
| Graduate / Professional | 0 | 0.0% |
| Total | 444 | 100.0% |
School Enrollment by Age by Funding Source in Hart
Out of a total of 444 students who are enrolled in schools in Hart, 104 (23.4%) attend a private institution, while the remaining 340 (76.6%) are enrolled in public schools. The age group of 20 to 24 year olds has the highest likelihood of being enrolled in private schools, with 7 (31.8% in the age bracket) enrolled. Conversely, the age group of 25 to 34 year olds has the lowest likelihood of being enrolled in a private school, with 9 (100.0% in the age bracket) attending a public institution.
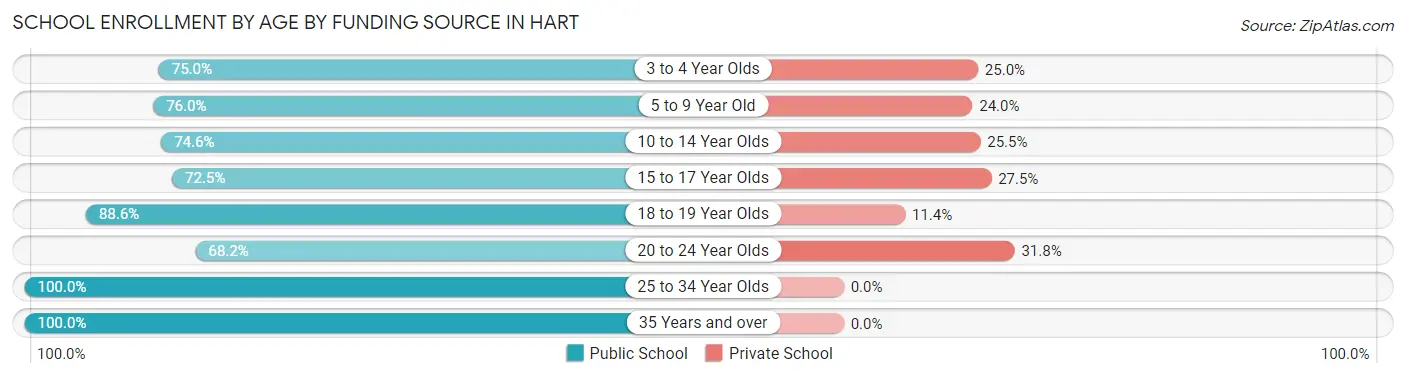
| Age Bracket | Public School | Private School |
| 3 to 4 Year Olds | 18 (75.0%) | 6 (25.0%) |
| 5 to 9 Year Old | 73 (76.0%) | 23 (24.0%) |
| 10 to 14 Year Olds | 82 (74.6%) | 28 (25.5%) |
| 15 to 17 Year Olds | 95 (72.5%) | 36 (27.5%) |
| 18 to 19 Year Olds | 31 (88.6%) | 4 (11.4%) |
| 20 to 24 Year Olds | 15 (68.2%) | 7 (31.8%) |
| 25 to 34 Year Olds | 9 (100.0%) | 0 (0.0%) |
| 35 Years and over | 17 (100.0%) | 0 (0.0%) |
| Total | 340 (76.6%) | 104 (23.4%) |
Educational Attainment by Field of Study in Hart
Arts & humanities (89 | 29.2%), science & technology (37 | 12.1%), computers & mathematics (32 | 10.5%), education (29 | 9.5%), and communications (23 | 7.5%) are the most common fields of study among 305 individuals in Hart who have obtained a bachelor's degree or higher.
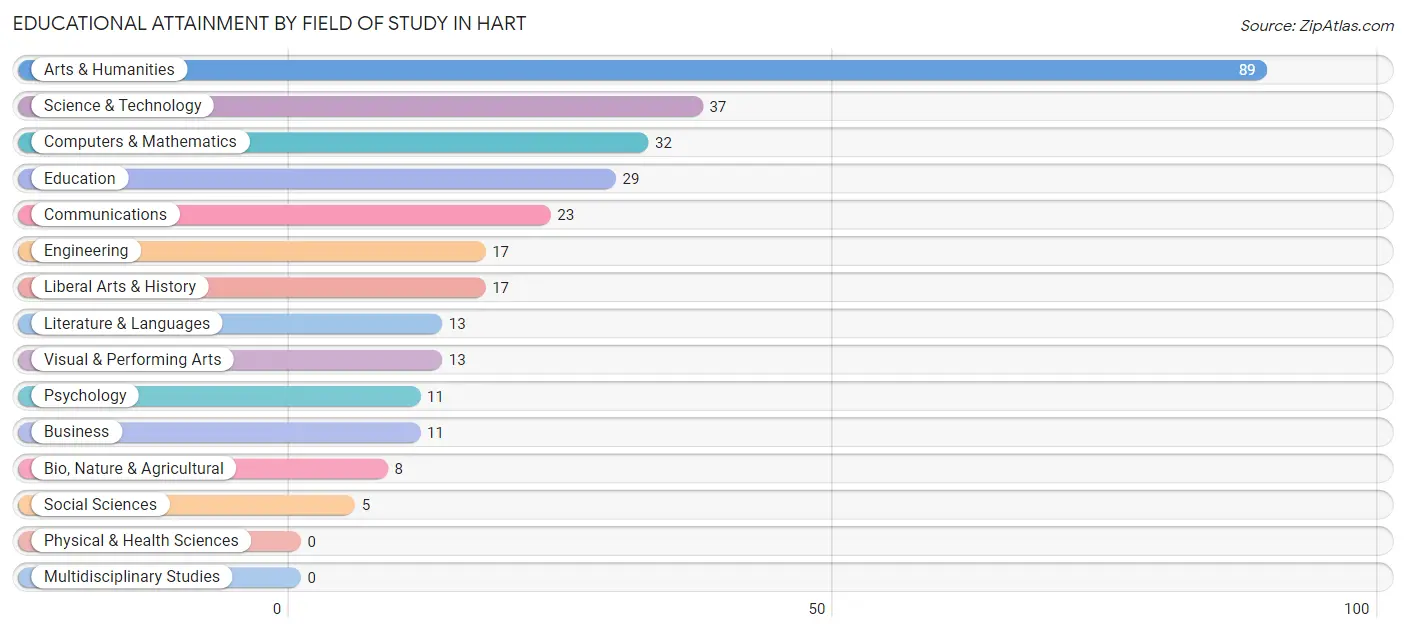
| Field of Study | # Graduates | % Graduates |
| Computers & Mathematics | 32 | 10.5% |
| Bio, Nature & Agricultural | 8 | 2.6% |
| Physical & Health Sciences | 0 | 0.0% |
| Psychology | 11 | 3.6% |
| Social Sciences | 5 | 1.6% |
| Engineering | 17 | 5.6% |
| Multidisciplinary Studies | 0 | 0.0% |
| Science & Technology | 37 | 12.1% |
| Business | 11 | 3.6% |
| Education | 29 | 9.5% |
| Literature & Languages | 13 | 4.3% |
| Liberal Arts & History | 17 | 5.6% |
| Visual & Performing Arts | 13 | 4.3% |
| Communications | 23 | 7.5% |
| Arts & Humanities | 89 | 29.2% |
| Total | 305 | 100.0% |
Transportation & Commute in Hart
Vehicle Availability by Sex in Hart
The most prevalent vehicle ownership categories in Hart are males with 2 vehicles (225, accounting for 44.0%) and females with 2 vehicles (133, making up 50.8%).
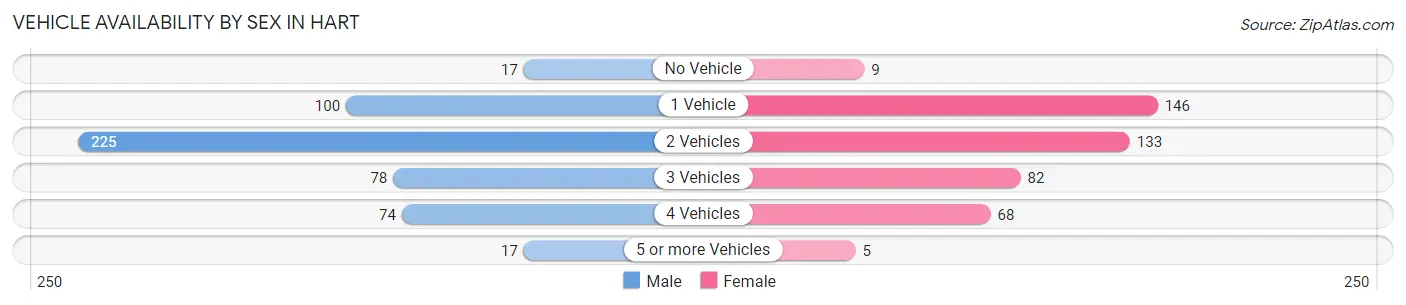
| Vehicles Available | Male | Female |
| No Vehicle | 17 (3.3%) | 9 (2.0%) |
| 1 Vehicle | 100 (19.6%) | 146 (33.0%) |
| 2 Vehicles | 225 (44.0%) | 133 (30.0%) |
| 3 Vehicles | 78 (15.3%) | 82 (18.5%) |
| 4 Vehicles | 74 (14.5%) | 68 (15.3%) |
| 5 or more Vehicles | 17 (3.3%) | 5 (1.1%) |
| Total | 511 (100.0%) | 443 (100.0%) |
Commute Time in Hart
The most frequently occuring commute durations in Hart are 5 to 9 minutes (289 commuters, 30.8%), 10 to 14 minutes (153 commuters, 16.3%), and less than 5 minutes (124 commuters, 13.2%).
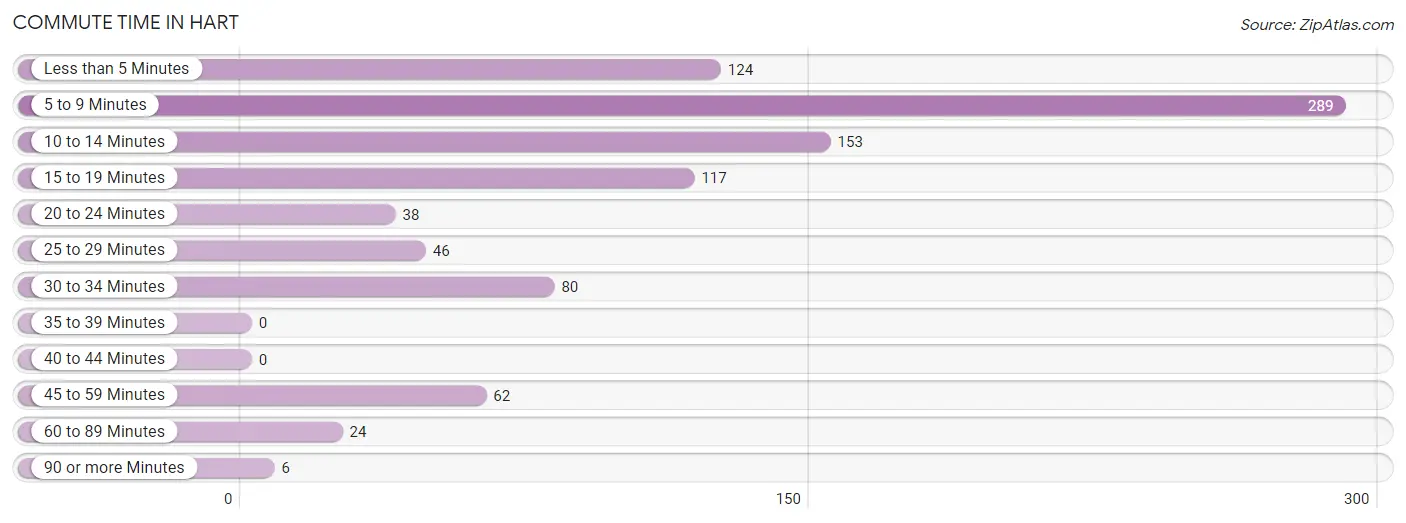
| Commute Time | # Commuters | % Commuters |
| Less than 5 Minutes | 124 | 13.2% |
| 5 to 9 Minutes | 289 | 30.8% |
| 10 to 14 Minutes | 153 | 16.3% |
| 15 to 19 Minutes | 117 | 12.5% |
| 20 to 24 Minutes | 38 | 4.1% |
| 25 to 29 Minutes | 46 | 4.9% |
| 30 to 34 Minutes | 80 | 8.5% |
| 35 to 39 Minutes | 0 | 0.0% |
| 40 to 44 Minutes | 0 | 0.0% |
| 45 to 59 Minutes | 62 | 6.6% |
| 60 to 89 Minutes | 24 | 2.6% |
| 90 or more Minutes | 6 | 0.6% |
Commute Time by Sex in Hart
The most common commute times in Hart are 5 to 9 minutes (143 commuters, 28.2%) for males and 5 to 9 minutes (146 commuters, 33.8%) for females.
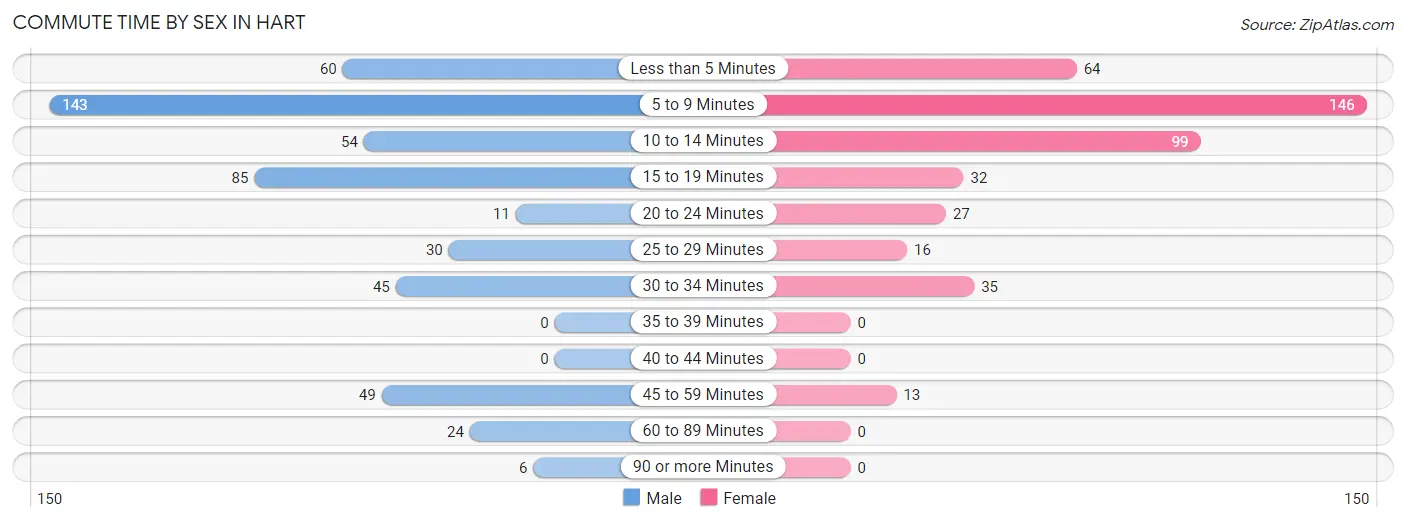
| Commute Time | Male | Female |
| Less than 5 Minutes | 60 (11.8%) | 64 (14.8%) |
| 5 to 9 Minutes | 143 (28.2%) | 146 (33.8%) |
| 10 to 14 Minutes | 54 (10.6%) | 99 (22.9%) |
| 15 to 19 Minutes | 85 (16.8%) | 32 (7.4%) |
| 20 to 24 Minutes | 11 (2.2%) | 27 (6.2%) |
| 25 to 29 Minutes | 30 (5.9%) | 16 (3.7%) |
| 30 to 34 Minutes | 45 (8.9%) | 35 (8.1%) |
| 35 to 39 Minutes | 0 (0.0%) | 0 (0.0%) |
| 40 to 44 Minutes | 0 (0.0%) | 0 (0.0%) |
| 45 to 59 Minutes | 49 (9.7%) | 13 (3.0%) |
| 60 to 89 Minutes | 24 (4.7%) | 0 (0.0%) |
| 90 or more Minutes | 6 (1.2%) | 0 (0.0%) |
Time of Departure to Work by Sex in Hart
The most frequent times of departure to work in Hart are 7:00 AM to 7:29 AM (80, 15.8%) for males and 5:30 AM to 5:59 AM (70, 16.2%) for females.
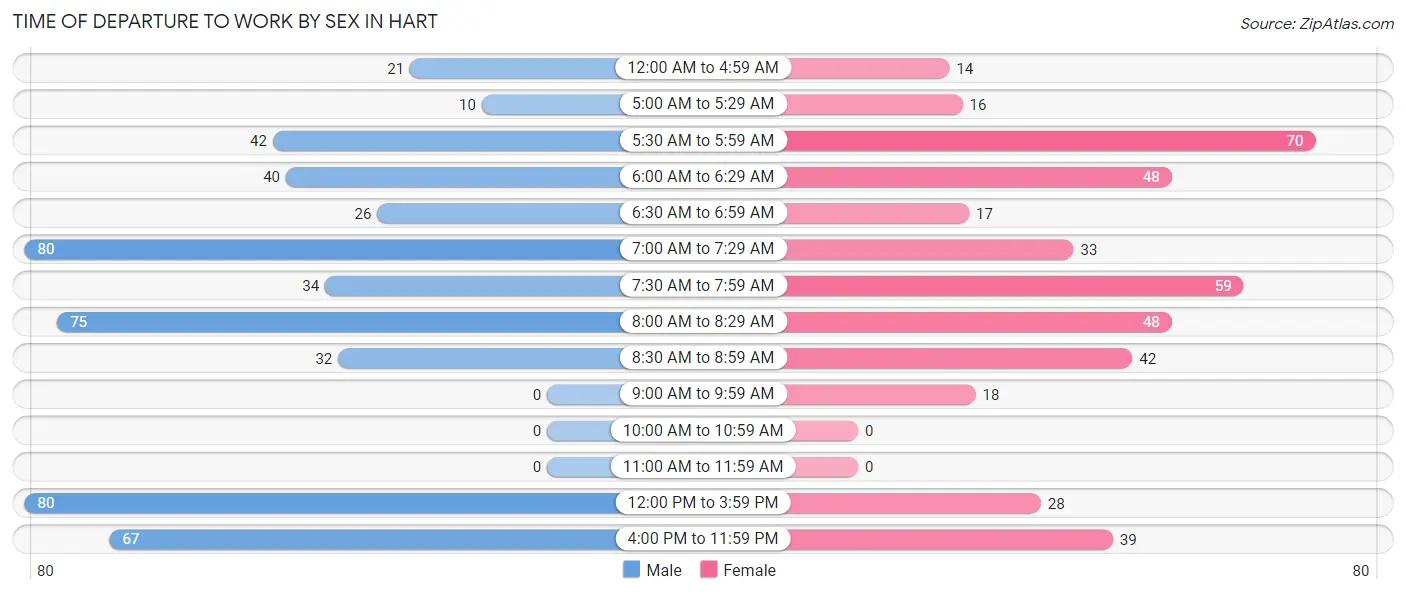
| Time of Departure | Male | Female |
| 12:00 AM to 4:59 AM | 21 (4.1%) | 14 (3.2%) |
| 5:00 AM to 5:29 AM | 10 (2.0%) | 16 (3.7%) |
| 5:30 AM to 5:59 AM | 42 (8.3%) | 70 (16.2%) |
| 6:00 AM to 6:29 AM | 40 (7.9%) | 48 (11.1%) |
| 6:30 AM to 6:59 AM | 26 (5.1%) | 17 (3.9%) |
| 7:00 AM to 7:29 AM | 80 (15.8%) | 33 (7.6%) |
| 7:30 AM to 7:59 AM | 34 (6.7%) | 59 (13.7%) |
| 8:00 AM to 8:29 AM | 75 (14.8%) | 48 (11.1%) |
| 8:30 AM to 8:59 AM | 32 (6.3%) | 42 (9.7%) |
| 9:00 AM to 9:59 AM | 0 (0.0%) | 18 (4.2%) |
| 10:00 AM to 10:59 AM | 0 (0.0%) | 0 (0.0%) |
| 11:00 AM to 11:59 AM | 0 (0.0%) | 0 (0.0%) |
| 12:00 PM to 3:59 PM | 80 (15.8%) | 28 (6.5%) |
| 4:00 PM to 11:59 PM | 67 (13.2%) | 39 (9.0%) |
| Total | 507 (100.0%) | 432 (100.0%) |
Housing Occupancy in Hart
Occupancy by Ownership in Hart
Of the total 776 dwellings in Hart, owner-occupied units account for 472 (60.8%), while renter-occupied units make up 304 (39.2%).
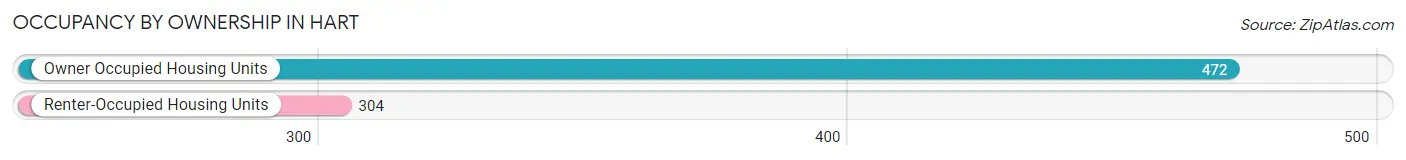
| Occupancy | # Housing Units | % Housing Units |
| Owner Occupied Housing Units | 472 | 60.8% |
| Renter-Occupied Housing Units | 304 | 39.2% |
| Total Occupied Housing Units | 776 | 100.0% |
Occupancy by Household Size in Hart
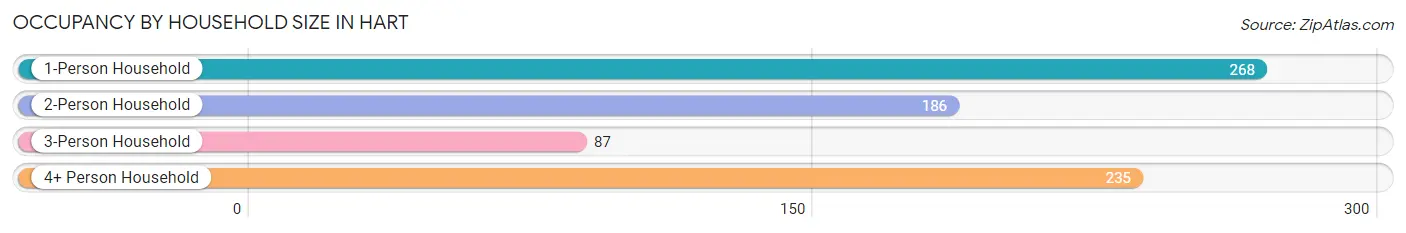
| Household Size | # Housing Units | % Housing Units |
| 1-Person Household | 268 | 34.5% |
| 2-Person Household | 186 | 24.0% |
| 3-Person Household | 87 | 11.2% |
| 4+ Person Household | 235 | 30.3% |
| Total Housing Units | 776 | 100.0% |
Occupancy by Ownership by Household Size in Hart
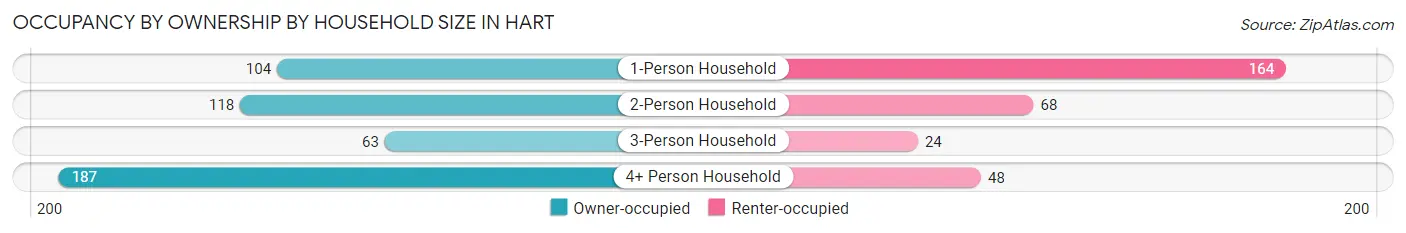
| Household Size | Owner-occupied | Renter-occupied |
| 1-Person Household | 104 (38.8%) | 164 (61.2%) |
| 2-Person Household | 118 (63.4%) | 68 (36.6%) |
| 3-Person Household | 63 (72.4%) | 24 (27.6%) |
| 4+ Person Household | 187 (79.6%) | 48 (20.4%) |
| Total Housing Units | 472 (60.8%) | 304 (39.2%) |
Occupancy by Educational Attainment in Hart
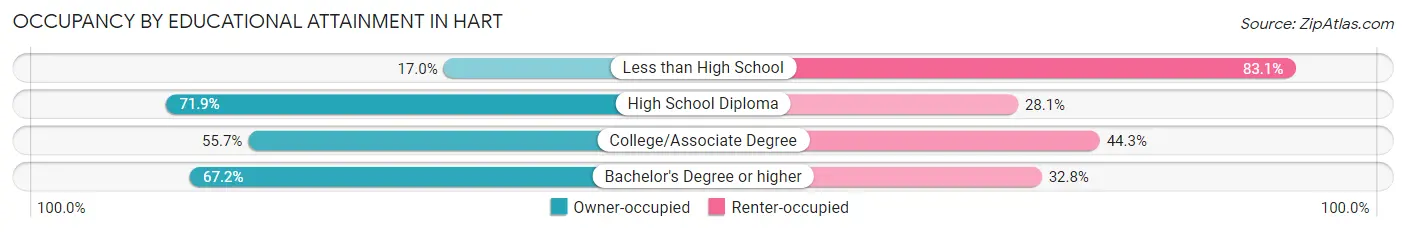
| Household Size | Owner-occupied | Renter-occupied |
| Less than High School | 10 (17.0%) | 49 (83.1%) |
| High School Diploma | 179 (71.9%) | 70 (28.1%) |
| College/Associate Degree | 152 (55.7%) | 121 (44.3%) |
| Bachelor's Degree or higher | 131 (67.2%) | 64 (32.8%) |
Occupancy by Age of Householder in Hart
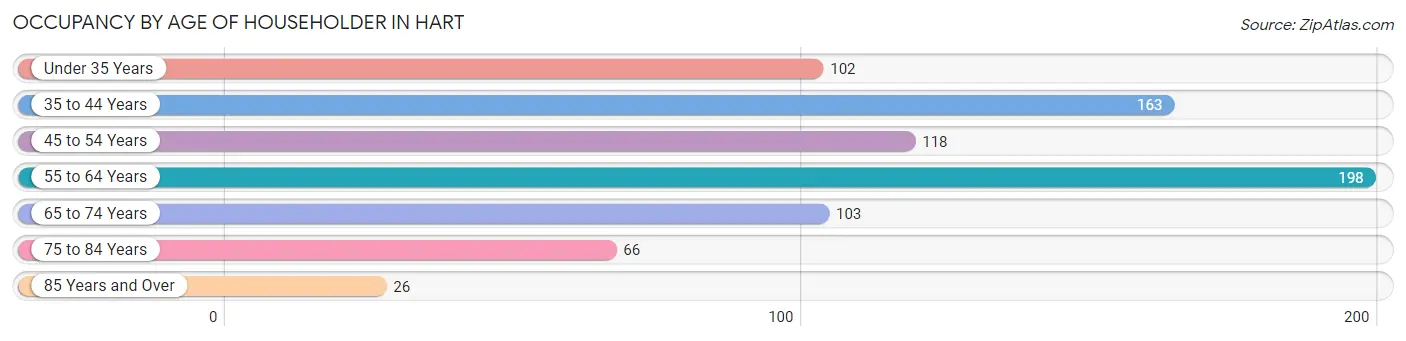
| Age Bracket | # Households | % Households |
| Under 35 Years | 102 | 13.1% |
| 35 to 44 Years | 163 | 21.0% |
| 45 to 54 Years | 118 | 15.2% |
| 55 to 64 Years | 198 | 25.5% |
| 65 to 74 Years | 103 | 13.3% |
| 75 to 84 Years | 66 | 8.5% |
| 85 Years and Over | 26 | 3.4% |
| Total | 776 | 100.0% |
Housing Finances in Hart
Median Income by Occupancy in Hart
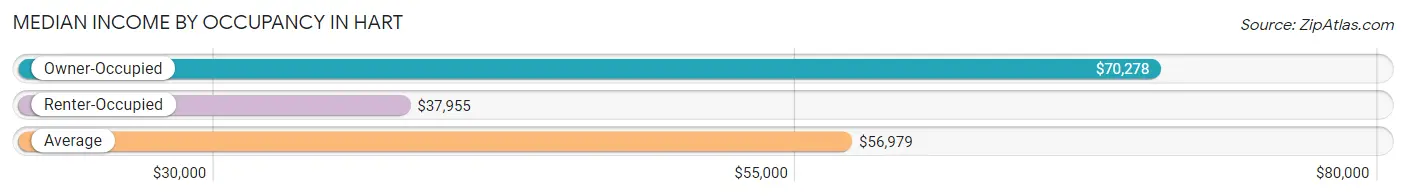
| Occupancy Type | # Households | Median Income |
| Owner-Occupied | 472 (60.8%) | $70,278 |
| Renter-Occupied | 304 (39.2%) | $37,955 |
| Average | 776 (100.0%) | $56,979 |
Occupancy by Householder Income Bracket in Hart
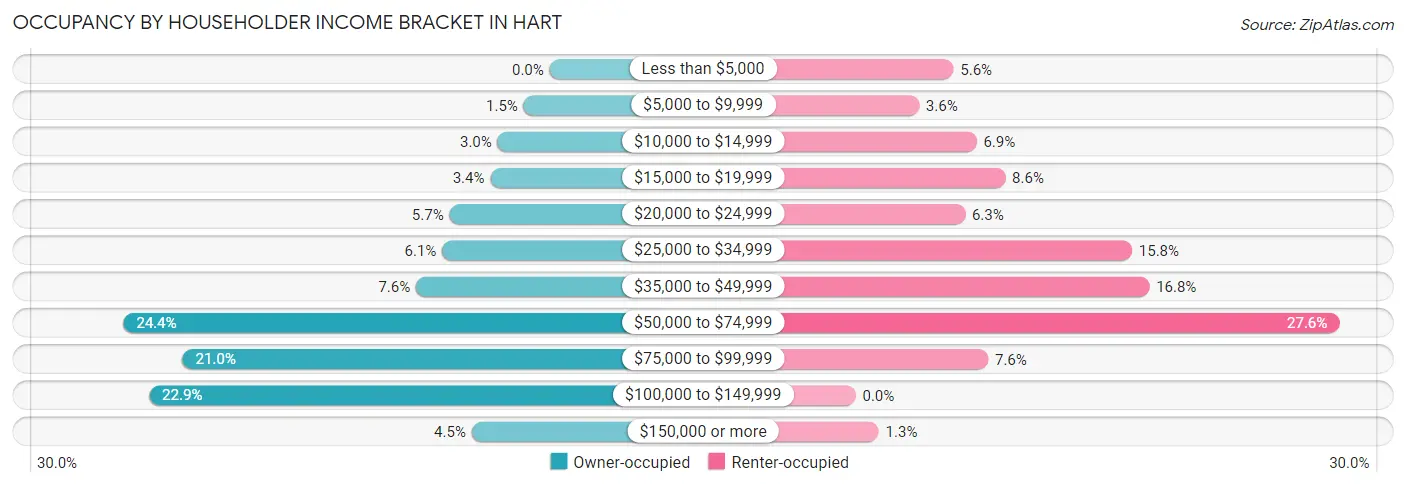
| Income Bracket | Owner-occupied | Renter-occupied |
| Less than $5,000 | 0 (0.0%) | 17 (5.6%) |
| $5,000 to $9,999 | 7 (1.5%) | 11 (3.6%) |
| $10,000 to $14,999 | 14 (3.0%) | 21 (6.9%) |
| $15,000 to $19,999 | 16 (3.4%) | 26 (8.6%) |
| $20,000 to $24,999 | 27 (5.7%) | 19 (6.2%) |
| $25,000 to $34,999 | 29 (6.1%) | 48 (15.8%) |
| $35,000 to $49,999 | 36 (7.6%) | 51 (16.8%) |
| $50,000 to $74,999 | 115 (24.4%) | 84 (27.6%) |
| $75,000 to $99,999 | 99 (21.0%) | 23 (7.6%) |
| $100,000 to $149,999 | 108 (22.9%) | 0 (0.0%) |
| $150,000 or more | 21 (4.4%) | 4 (1.3%) |
| Total | 472 (100.0%) | 304 (100.0%) |
Monthly Housing Cost Tiers in Hart
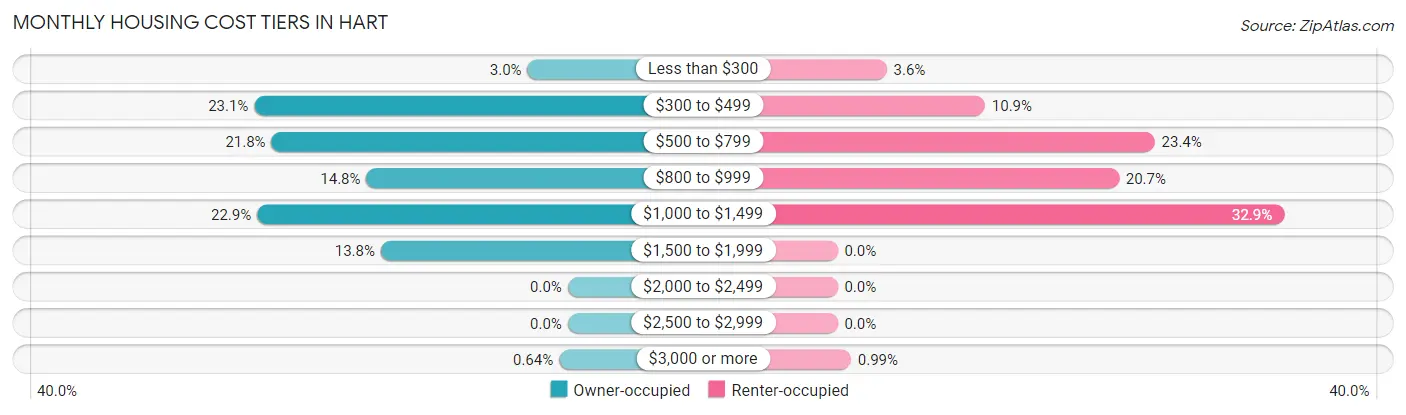
| Monthly Cost | Owner-occupied | Renter-occupied |
| Less than $300 | 14 (3.0%) | 11 (3.6%) |
| $300 to $499 | 109 (23.1%) | 33 (10.9%) |
| $500 to $799 | 103 (21.8%) | 71 (23.4%) |
| $800 to $999 | 70 (14.8%) | 63 (20.7%) |
| $1,000 to $1,499 | 108 (22.9%) | 100 (32.9%) |
| $1,500 to $1,999 | 65 (13.8%) | 0 (0.0%) |
| $2,000 to $2,499 | 0 (0.0%) | 0 (0.0%) |
| $2,500 to $2,999 | 0 (0.0%) | 0 (0.0%) |
| $3,000 or more | 3 (0.6%) | 3 (1.0%) |
| Total | 472 (100.0%) | 304 (100.0%) |
Physical Housing Characteristics in Hart
Housing Structures in Hart
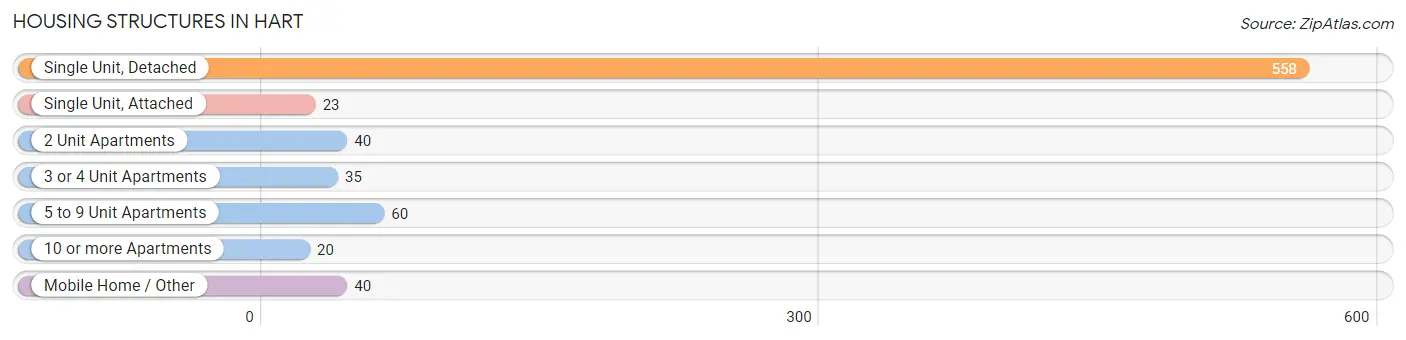
| Structure Type | # Housing Units | % Housing Units |
| Single Unit, Detached | 558 | 71.9% |
| Single Unit, Attached | 23 | 3.0% |
| 2 Unit Apartments | 40 | 5.1% |
| 3 or 4 Unit Apartments | 35 | 4.5% |
| 5 to 9 Unit Apartments | 60 | 7.7% |
| 10 or more Apartments | 20 | 2.6% |
| Mobile Home / Other | 40 | 5.1% |
| Total | 776 | 100.0% |
Housing Structures by Occupancy in Hart
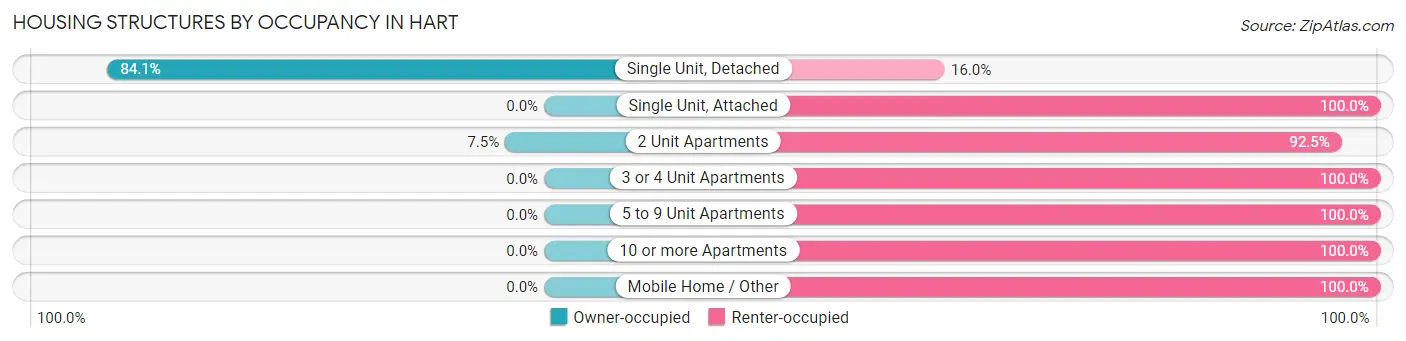
| Structure Type | Owner-occupied | Renter-occupied |
| Single Unit, Detached | 469 (84.1%) | 89 (16.0%) |
| Single Unit, Attached | 0 (0.0%) | 23 (100.0%) |
| 2 Unit Apartments | 3 (7.5%) | 37 (92.5%) |
| 3 or 4 Unit Apartments | 0 (0.0%) | 35 (100.0%) |
| 5 to 9 Unit Apartments | 0 (0.0%) | 60 (100.0%) |
| 10 or more Apartments | 0 (0.0%) | 20 (100.0%) |
| Mobile Home / Other | 0 (0.0%) | 40 (100.0%) |
| Total | 472 (60.8%) | 304 (39.2%) |
Housing Structures by Number of Rooms in Hart
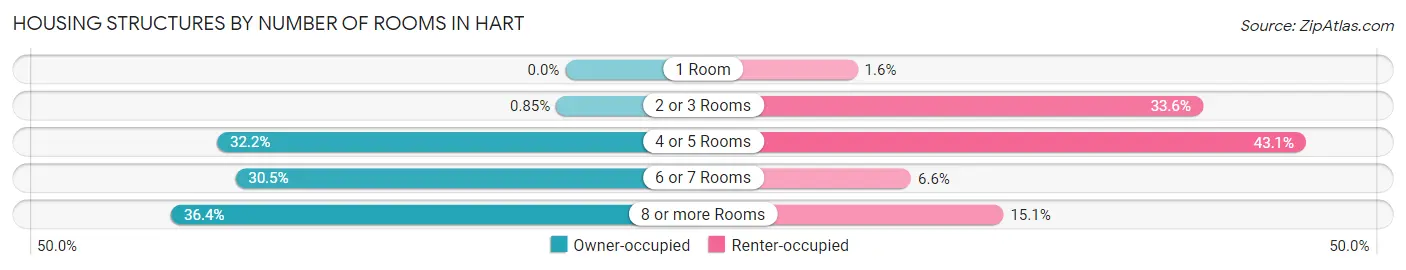
| Number of Rooms | Owner-occupied | Renter-occupied |
| 1 Room | 0 (0.0%) | 5 (1.6%) |
| 2 or 3 Rooms | 4 (0.9%) | 102 (33.6%) |
| 4 or 5 Rooms | 152 (32.2%) | 131 (43.1%) |
| 6 or 7 Rooms | 144 (30.5%) | 20 (6.6%) |
| 8 or more Rooms | 172 (36.4%) | 46 (15.1%) |
| Total | 472 (100.0%) | 304 (100.0%) |
Housing Structure by Heating Type in Hart
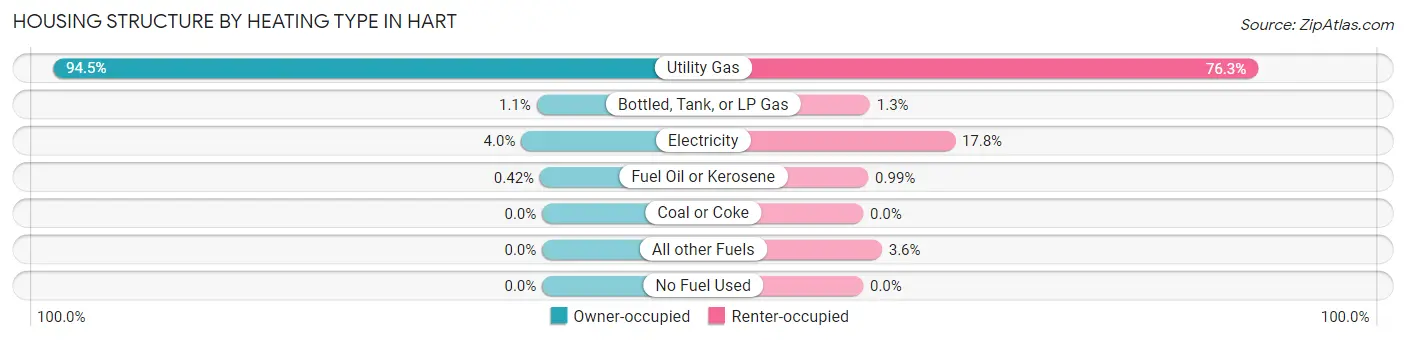
| Heating Type | Owner-occupied | Renter-occupied |
| Utility Gas | 446 (94.5%) | 232 (76.3%) |
| Bottled, Tank, or LP Gas | 5 (1.1%) | 4 (1.3%) |
| Electricity | 19 (4.0%) | 54 (17.8%) |
| Fuel Oil or Kerosene | 2 (0.4%) | 3 (1.0%) |
| Coal or Coke | 0 (0.0%) | 0 (0.0%) |
| All other Fuels | 0 (0.0%) | 11 (3.6%) |
| No Fuel Used | 0 (0.0%) | 0 (0.0%) |
| Total | 472 (100.0%) | 304 (100.0%) |
Household Vehicle Usage in Hart
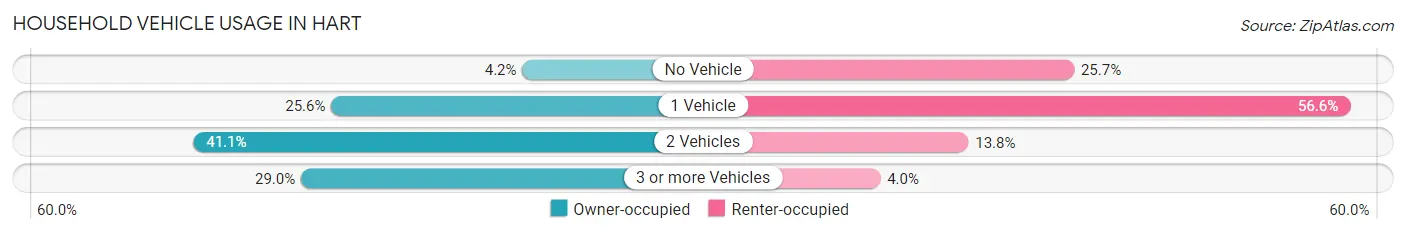
| Vehicles per Household | Owner-occupied | Renter-occupied |
| No Vehicle | 20 (4.2%) | 78 (25.7%) |
| 1 Vehicle | 121 (25.6%) | 172 (56.6%) |
| 2 Vehicles | 194 (41.1%) | 42 (13.8%) |
| 3 or more Vehicles | 137 (29.0%) | 12 (4.0%) |
| Total | 472 (100.0%) | 304 (100.0%) |
Real Estate & Mortgages in Hart
Real Estate and Mortgage Overview in Hart
| Characteristic | Without Mortgage | With Mortgage |
| Housing Units | 163 | 309 |
| Median Property Value | $105,400 | $115,800 |
| Median Household Income | $58,375 | $16 |
| Monthly Housing Costs | $423 | $3 |
| Real Estate Taxes | $1,419 | $18 |
Property Value by Mortgage Status in Hart
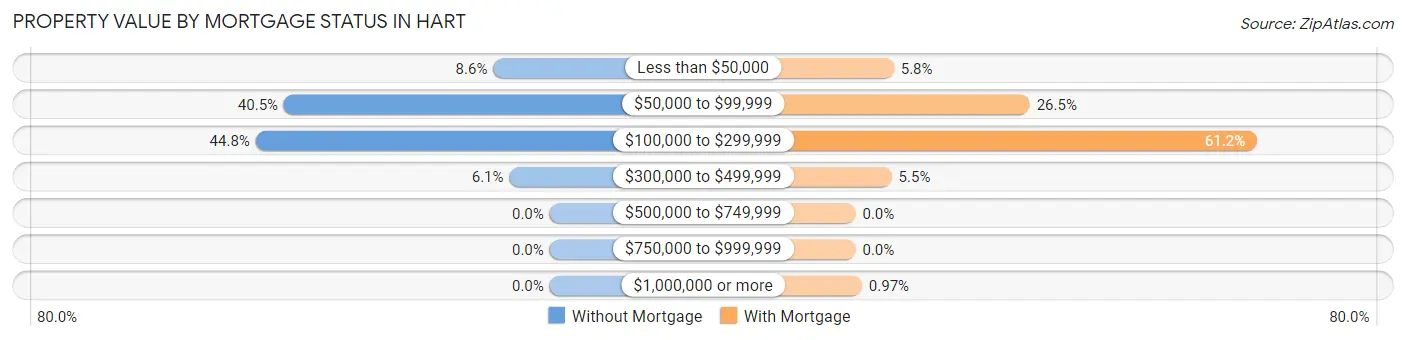
| Property Value | Without Mortgage | With Mortgage |
| Less than $50,000 | 14 (8.6%) | 18 (5.8%) |
| $50,000 to $99,999 | 66 (40.5%) | 82 (26.5%) |
| $100,000 to $299,999 | 73 (44.8%) | 189 (61.2%) |
| $300,000 to $499,999 | 10 (6.1%) | 17 (5.5%) |
| $500,000 to $749,999 | 0 (0.0%) | 0 (0.0%) |
| $750,000 to $999,999 | 0 (0.0%) | 0 (0.0%) |
| $1,000,000 or more | 0 (0.0%) | 3 (1.0%) |
| Total | 163 (100.0%) | 309 (100.0%) |
Household Income by Mortgage Status in Hart
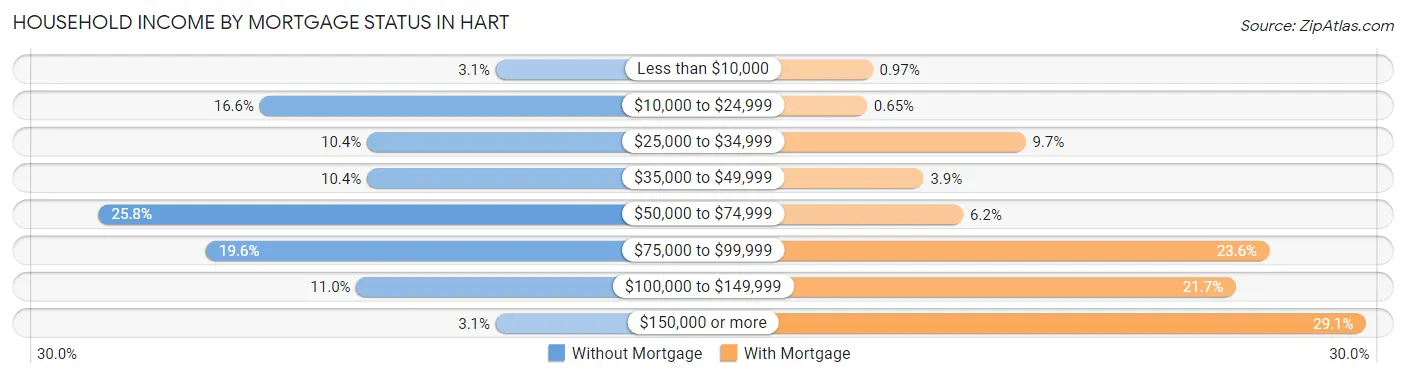
| Household Income | Without Mortgage | With Mortgage |
| Less than $10,000 | 5 (3.1%) | 3 (1.0%) |
| $10,000 to $24,999 | 27 (16.6%) | 2 (0.6%) |
| $25,000 to $34,999 | 17 (10.4%) | 30 (9.7%) |
| $35,000 to $49,999 | 17 (10.4%) | 12 (3.9%) |
| $50,000 to $74,999 | 42 (25.8%) | 19 (6.1%) |
| $75,000 to $99,999 | 32 (19.6%) | 73 (23.6%) |
| $100,000 to $149,999 | 18 (11.0%) | 67 (21.7%) |
| $150,000 or more | 5 (3.1%) | 90 (29.1%) |
| Total | 163 (100.0%) | 309 (100.0%) |
Property Value to Household Income Ratio in Hart
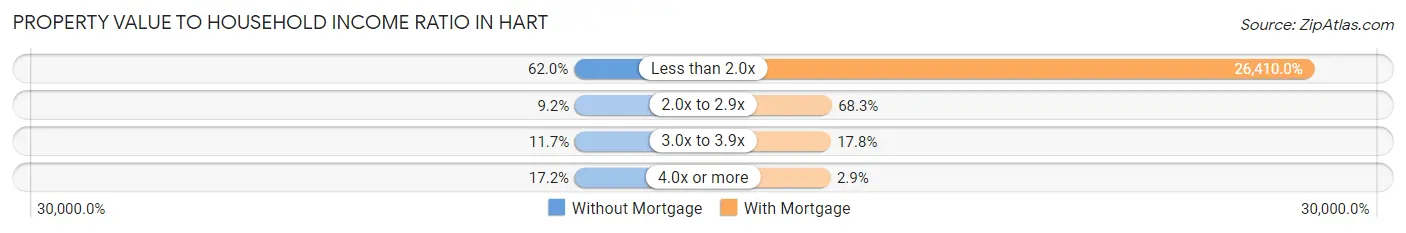
| Value-to-Income Ratio | Without Mortgage | With Mortgage |
| Less than 2.0x | 101 (62.0%) | 81,607 (26,410.0%) |
| 2.0x to 2.9x | 15 (9.2%) | 211 (68.3%) |
| 3.0x to 3.9x | 19 (11.7%) | 55 (17.8%) |
| 4.0x or more | 28 (17.2%) | 9 (2.9%) |
| Total | 163 (100.0%) | 309 (100.0%) |
Real Estate Taxes by Mortgage Status in Hart
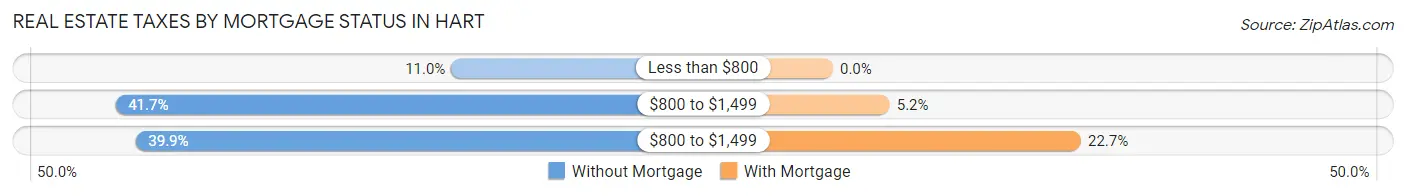
| Property Taxes | Without Mortgage | With Mortgage |
| Less than $800 | 18 (11.0%) | 0 (0.0%) |
| $800 to $1,499 | 68 (41.7%) | 16 (5.2%) |
| $800 to $1,499 | 65 (39.9%) | 70 (22.7%) |
| Total | 163 (100.0%) | 309 (100.0%) |
Health & Disability in Hart
Health Insurance Coverage by Age in Hart
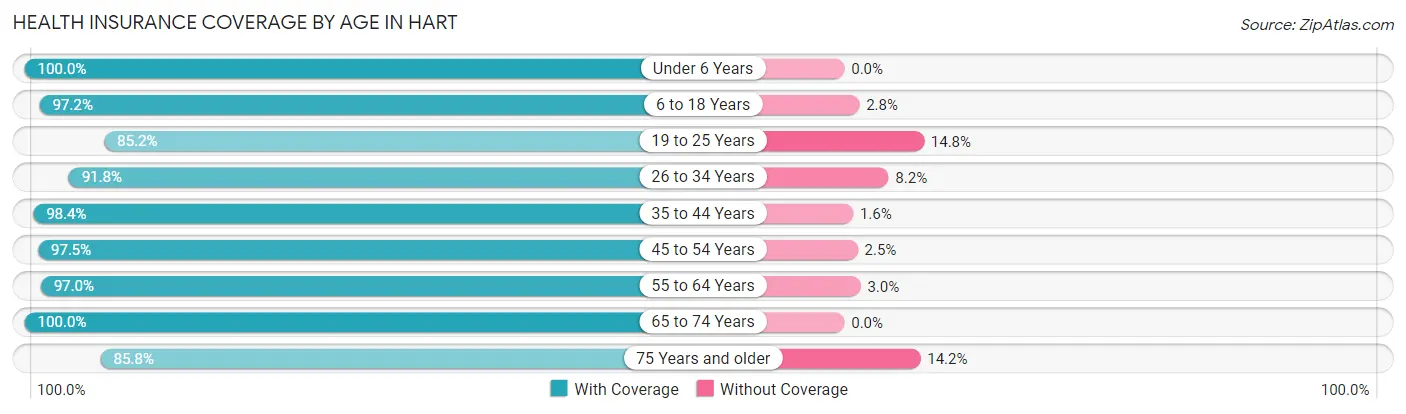
| Age Bracket | With Coverage | Without Coverage |
| Under 6 Years | 146 (100.0%) | 0 (0.0%) |
| 6 to 18 Years | 385 (97.2%) | 11 (2.8%) |
| 19 to 25 Years | 109 (85.2%) | 19 (14.8%) |
| 26 to 34 Years | 223 (91.8%) | 20 (8.2%) |
| 35 to 44 Years | 245 (98.4%) | 4 (1.6%) |
| 45 to 54 Years | 236 (97.5%) | 6 (2.5%) |
| 55 to 64 Years | 290 (97.0%) | 9 (3.0%) |
| 65 to 74 Years | 172 (100.0%) | 0 (0.0%) |
| 75 Years and older | 103 (85.8%) | 17 (14.2%) |
| Total | 1,909 (95.7%) | 86 (4.3%) |
Health Insurance Coverage by Citizenship Status in Hart
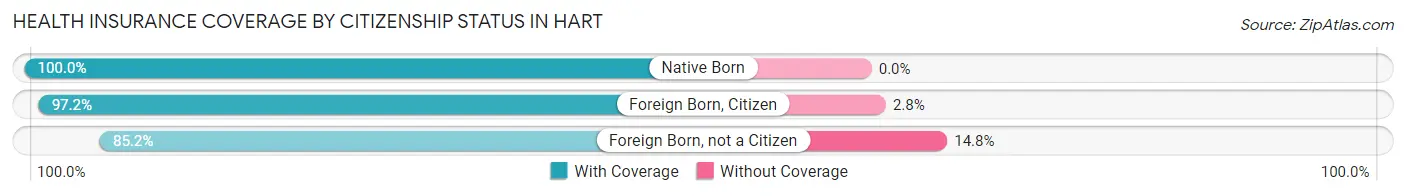
| Citizenship Status | With Coverage | Without Coverage |
| Native Born | 146 (100.0%) | 0 (0.0%) |
| Foreign Born, Citizen | 385 (97.2%) | 11 (2.8%) |
| Foreign Born, not a Citizen | 109 (85.2%) | 19 (14.8%) |
Health Insurance Coverage by Household Income in Hart
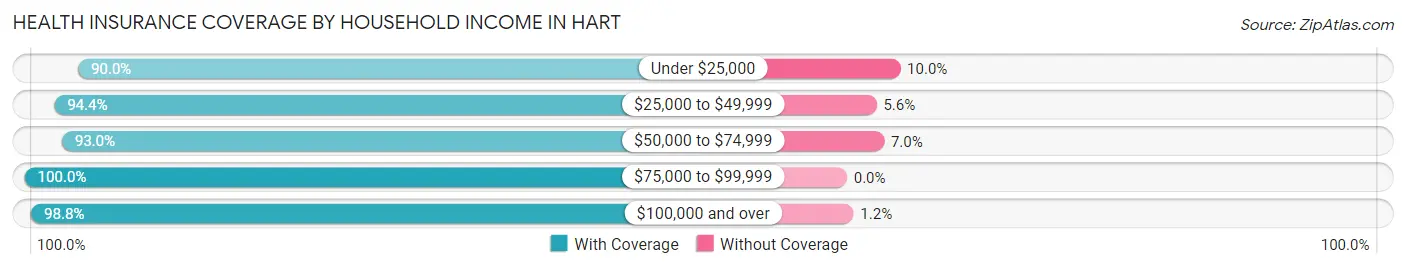
| Household Income | With Coverage | Without Coverage |
| Under $25,000 | 234 (90.0%) | 26 (10.0%) |
| $25,000 to $49,999 | 306 (94.4%) | 18 (5.6%) |
| $50,000 to $74,999 | 494 (93.0%) | 37 (7.0%) |
| $75,000 to $99,999 | 430 (100.0%) | 0 (0.0%) |
| $100,000 and over | 399 (98.8%) | 5 (1.2%) |
Public vs Private Health Insurance Coverage by Age in Hart
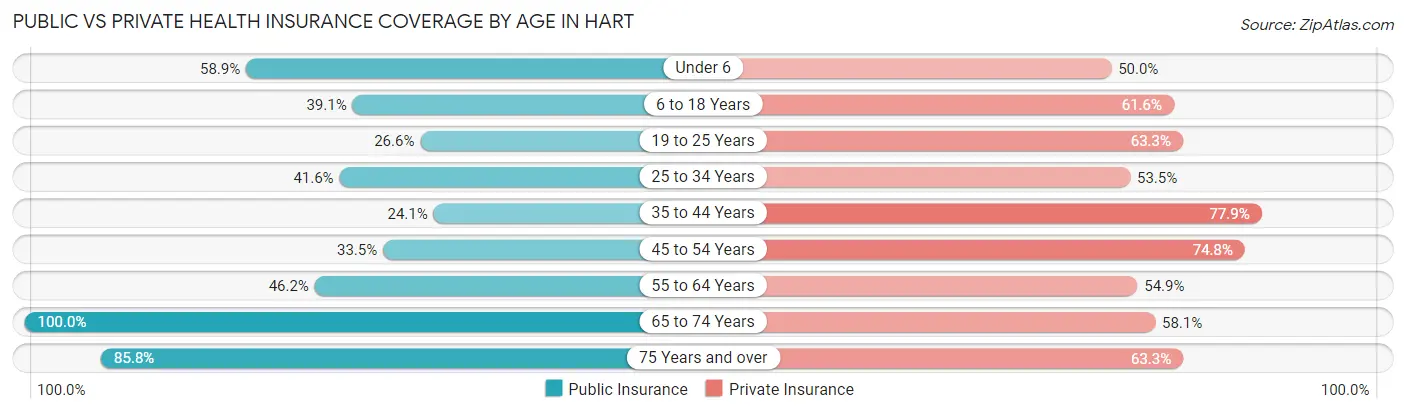
| Age Bracket | Public Insurance | Private Insurance |
| Under 6 | 86 (58.9%) | 73 (50.0%) |
| 6 to 18 Years | 155 (39.1%) | 244 (61.6%) |
| 19 to 25 Years | 34 (26.6%) | 81 (63.3%) |
| 25 to 34 Years | 101 (41.6%) | 130 (53.5%) |
| 35 to 44 Years | 60 (24.1%) | 194 (77.9%) |
| 45 to 54 Years | 81 (33.5%) | 181 (74.8%) |
| 55 to 64 Years | 138 (46.2%) | 164 (54.8%) |
| 65 to 74 Years | 172 (100.0%) | 100 (58.1%) |
| 75 Years and over | 103 (85.8%) | 76 (63.3%) |
| Total | 930 (46.6%) | 1,243 (62.3%) |
Disability Status by Sex by Age in Hart
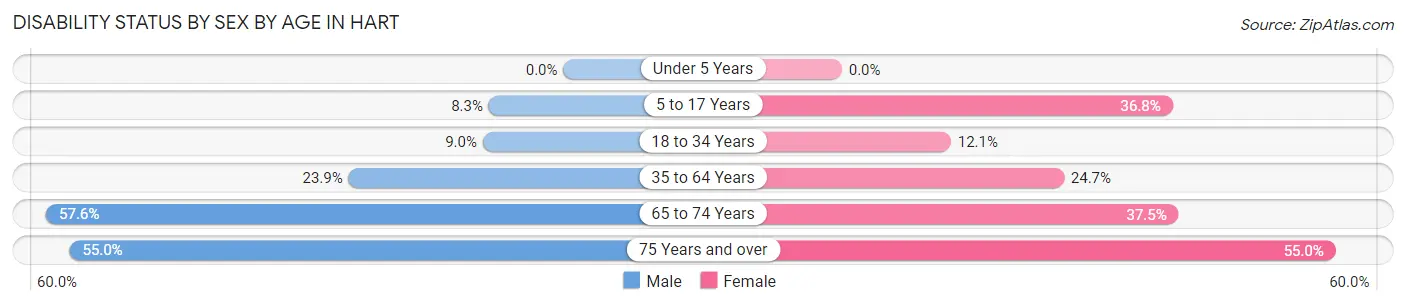
| Age Bracket | Male | Female |
| Under 5 Years | 0 (0.0%) | 0 (0.0%) |
| 5 to 17 Years | 22 (8.3%) | 42 (36.8%) |
| 18 to 34 Years | 20 (9.0%) | 21 (12.1%) |
| 35 to 64 Years | 100 (23.9%) | 92 (24.7%) |
| 65 to 74 Years | 53 (57.6%) | 30 (37.5%) |
| 75 Years and over | 22 (55.0%) | 44 (55.0%) |
Disability Class by Sex by Age in Hart
Disability Class: Hearing Difficulty
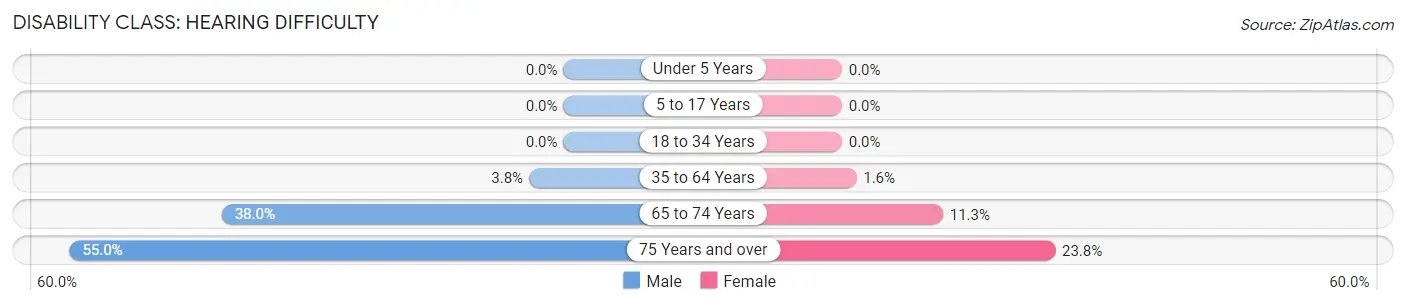
| Age Bracket | Male | Female |
| Under 5 Years | 0 (0.0%) | 0 (0.0%) |
| 5 to 17 Years | 0 (0.0%) | 0 (0.0%) |
| 18 to 34 Years | 0 (0.0%) | 0 (0.0%) |
| 35 to 64 Years | 16 (3.8%) | 6 (1.6%) |
| 65 to 74 Years | 35 (38.0%) | 9 (11.3%) |
| 75 Years and over | 22 (55.0%) | 19 (23.7%) |
Disability Class: Vision Difficulty
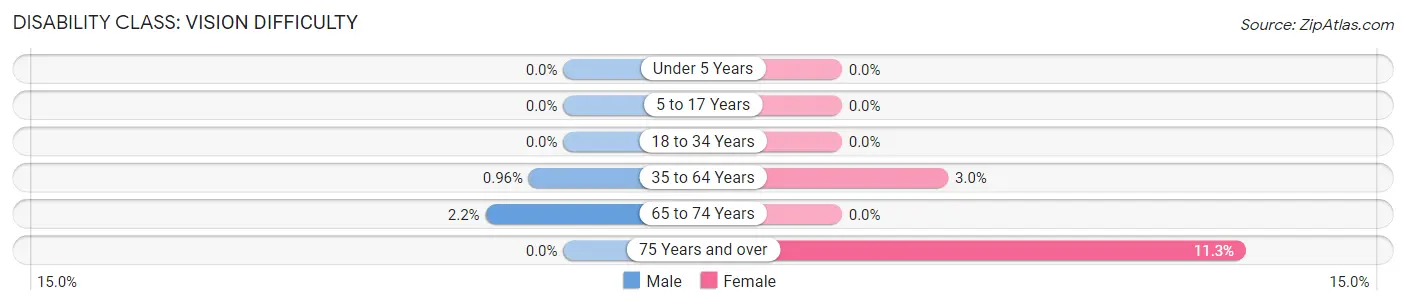
| Age Bracket | Male | Female |
| Under 5 Years | 0 (0.0%) | 0 (0.0%) |
| 5 to 17 Years | 0 (0.0%) | 0 (0.0%) |
| 18 to 34 Years | 0 (0.0%) | 0 (0.0%) |
| 35 to 64 Years | 4 (1.0%) | 11 (3.0%) |
| 65 to 74 Years | 2 (2.2%) | 0 (0.0%) |
| 75 Years and over | 0 (0.0%) | 9 (11.3%) |
Disability Class: Cognitive Difficulty
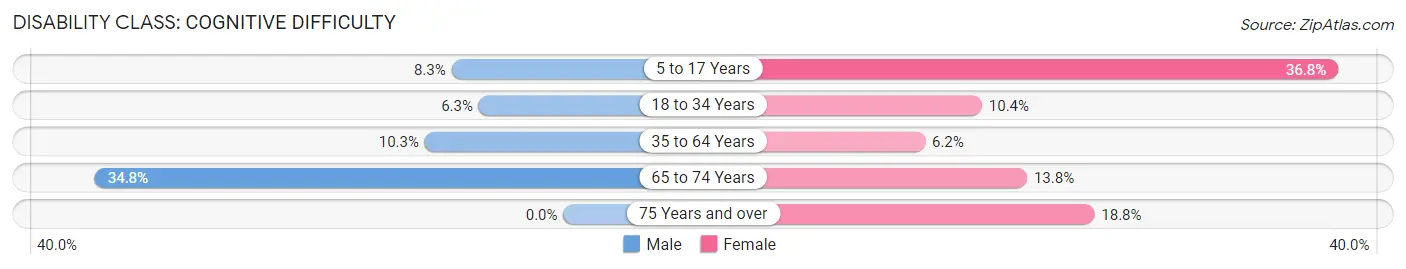
| Age Bracket | Male | Female |
| 5 to 17 Years | 22 (8.3%) | 42 (36.8%) |
| 18 to 34 Years | 14 (6.3%) | 18 (10.4%) |
| 35 to 64 Years | 43 (10.3%) | 23 (6.2%) |
| 65 to 74 Years | 32 (34.8%) | 11 (13.8%) |
| 75 Years and over | 0 (0.0%) | 15 (18.8%) |
Disability Class: Ambulatory Difficulty
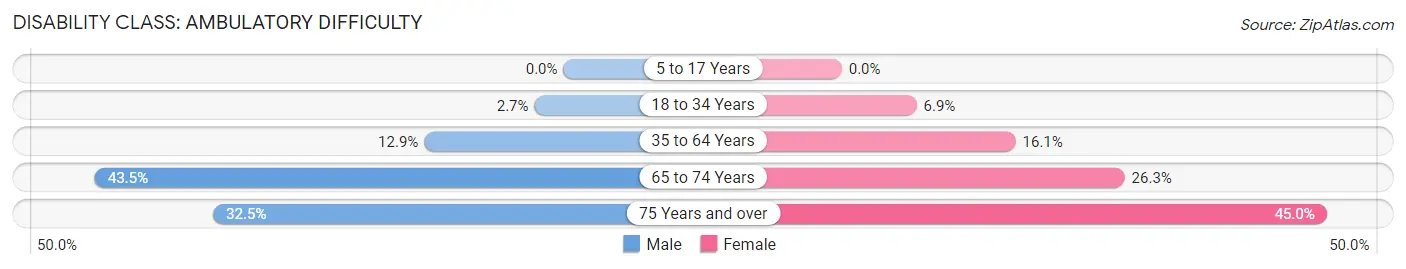
| Age Bracket | Male | Female |
| 5 to 17 Years | 0 (0.0%) | 0 (0.0%) |
| 18 to 34 Years | 6 (2.7%) | 12 (6.9%) |
| 35 to 64 Years | 54 (12.9%) | 60 (16.1%) |
| 65 to 74 Years | 40 (43.5%) | 21 (26.3%) |
| 75 Years and over | 13 (32.5%) | 36 (45.0%) |
Disability Class: Self-Care Difficulty
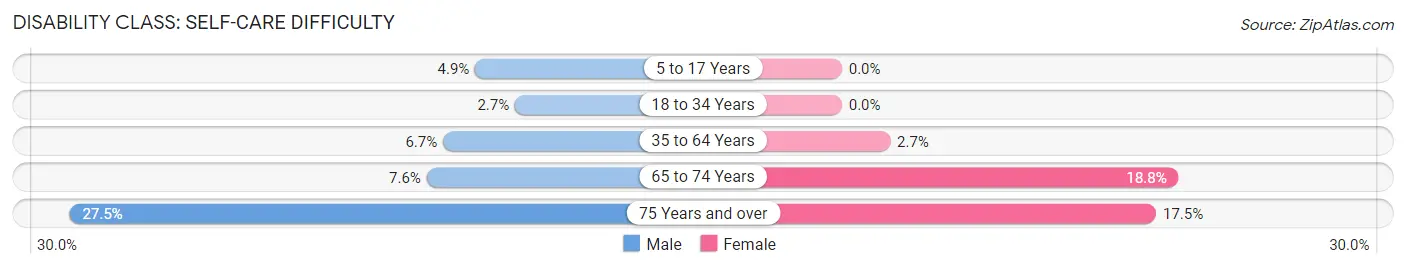
| Age Bracket | Male | Female |
| 5 to 17 Years | 13 (4.9%) | 0 (0.0%) |
| 18 to 34 Years | 6 (2.7%) | 0 (0.0%) |
| 35 to 64 Years | 28 (6.7%) | 10 (2.7%) |
| 65 to 74 Years | 7 (7.6%) | 15 (18.8%) |
| 75 Years and over | 11 (27.5%) | 14 (17.5%) |
Technology Access in Hart
Computing Device Access in Hart
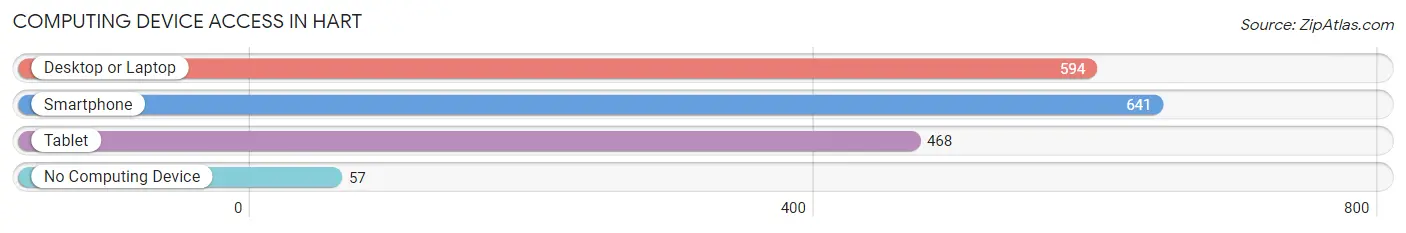
| Device Type | # Households | % Households |
| Desktop or Laptop | 594 | 76.5% |
| Smartphone | 641 | 82.6% |
| Tablet | 468 | 60.3% |
| No Computing Device | 57 | 7.3% |
| Total | 776 | 100.0% |
Internet Access in Hart
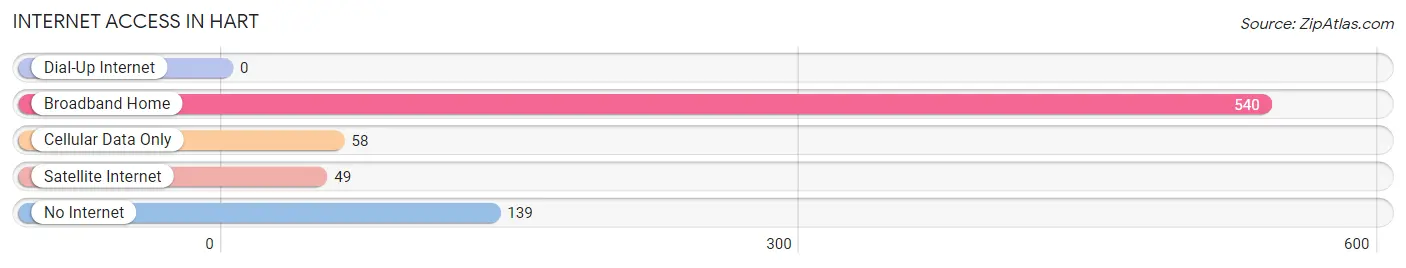
| Internet Type | # Households | % Households |
| Dial-Up Internet | 0 | 0.0% |
| Broadband Home | 540 | 69.6% |
| Cellular Data Only | 58 | 7.5% |
| Satellite Internet | 49 | 6.3% |
| No Internet | 139 | 17.9% |
| Total | 776 | 100.0% |
Hart Summary
Hart is a city located in Oceana County, Michigan, United States. The population was 2,126 at the 2010 census. It is the county seat of Oceana County.
History
Hart was first settled in 1855 by a group of settlers from New York. The town was named after Hart Massey, a prominent Canadian businessman. The first post office was established in 1858. In 1871, the village was incorporated as a city.
Geography
Hart is located at the intersection of US-31 and M-20 in Oceana County. It is situated on the banks of the Pentwater River, which flows through the city. The city is surrounded by farmland and woodlands.
Economy
Hart's economy is largely based on agriculture and tourism. The city is home to several farms, including dairy, beef, and vegetable farms. The city also has a number of small businesses, including restaurants, retail stores, and service providers.
Tourism is an important part of the local economy. Hart is home to several popular attractions, including the Hart-Montague Bicycle Trail, the Hart Historical Museum, and the Hart-Montague Airport. The city also hosts several annual events, such as the Hart County Fair and the Hart Summer Festival.
Demographics
As of the 2010 census, there were 2,126 people, 845 households, and 545 families residing in the city. The population density was 1,092.3 people per square mile (422.2/km2). The racial makeup of the city was 95.2% White, 0.7% African American, 0.4% Native American, 0.4% Asian, 0.1% Pacific Islander, 1.3% from other races, and 2.0% from two or more races. Hispanic or Latino of any race were 3.2% of the population.
The median income for a household in the city was $35,938, and the median income for a family was $45,000. Males had a median income of $31,250 versus $22,500 for females. The per capita income for the city was $17,845. About 8.3% of families and 11.2% of the population were below the poverty line, including 14.2% of those under age 18 and 8.2% of those age 65 or over.
Common Questions
What is Per Capita Income in Hart?
Per Capita income in Hart is $27,774.
What is the Median Family Income in Hart?
Median Family Income in Hart is $67,660.
What is the Median Household income in Hart?
Median Household Income in Hart is $56,979.
What is Income or Wage Gap in Hart?
Income or Wage Gap in Hart is 15.3%.
Women in Hart earn 84.7 cents for every dollar earned by a man.
What is Inequality or Gini Index in Hart?
Inequality or Gini Index in Hart is 0.46.
What is the Total Population of Hart?
Total Population of Hart is 2,173.
What is the Total Male Population of Hart?
Total Male Population of Hart is 1,211.
What is the Total Female Population of Hart?
Total Female Population of Hart is 962.
What is the Ratio of Males per 100 Females in Hart?
There are 125.88 Males per 100 Females in Hart.
What is the Ratio of Females per 100 Males in Hart?
There are 79.44 Females per 100 Males in Hart.
What is the Median Population Age in Hart?
Median Population Age in Hart is 39.5 Years.
What is the Average Family Size in Hart
Average Family Size in Hart is 3.1 People.
What is the Average Household Size in Hart
Average Household Size in Hart is 2.5 People.
How Large is the Labor Force in Hart?
There are 998 People in the Labor Forcein in Hart.
What is the Percentage of People in the Labor Force in Hart?
57.7% of People are in the Labor Force in Hart.
What is the Unemployment Rate in Hart?
Unemployment Rate in Hart is 3.0%.