Harrietta, MI Map & Demographics
Harrietta Map
Harrietta Overview
$18,696
PER CAPITA INCOME
$64,688
AVG FAMILY INCOME
$48,333
AVG HOUSEHOLD INCOME
7.4%
WAGE / INCOME GAP [ % ]
92.6¢/ $1
WAGE / INCOME GAP [ $ ]
0.35
INEQUALITY / GINI INDEX
210
TOTAL POPULATION
106
MALE POPULATION
104
FEMALE POPULATION
101.92
MALES / 100 FEMALES
98.11
FEMALES / 100 MALES
45.8
MEDIAN AGE
3.3
AVG FAMILY SIZE
2.6
AVG HOUSEHOLD SIZE
93
LABOR FORCE [ PEOPLE ]
50.8%
PERCENT IN LABOR FORCE
Harrietta Zip Codes
Harrietta Area Codes
Income in Harrietta
Income Overview in Harrietta
Per Capita Income in Harrietta is $18,696, while median incomes of families and households are $64,688 and $48,333 respectively.
| Characteristic | Number | Measure |
| Per Capita Income | 210 | $18,696 |
| Median Family Income | 53 | $64,688 |
| Mean Family Income | 53 | $64,594 |
| Median Household Income | 82 | $48,333 |
| Mean Household Income | 82 | $49,065 |
| Income Deficit | 53 | $0 |
| Wage / Income Gap (%) | 210 | 7.42% |
| Wage / Income Gap ($) | 210 | 92.58¢ per $1 |
| Gini / Inequality Index | 210 | 0.35 |
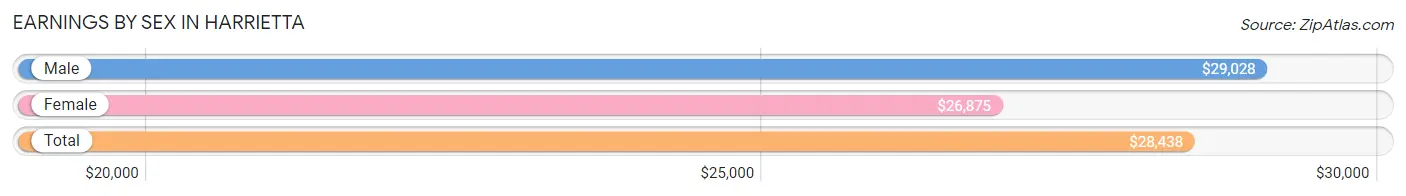
Earnings by Sex in Harrietta
Average Earnings in Harrietta are $28,438, $29,028 for men and $26,875 for women, a difference of 7.4%.
| Sex | Number | Average Earnings |
| Male | 41 (40.6%) | $29,028 |
| Female | 60 (59.4%) | $26,875 |
| Total | 101 (100.0%) | $28,438 |
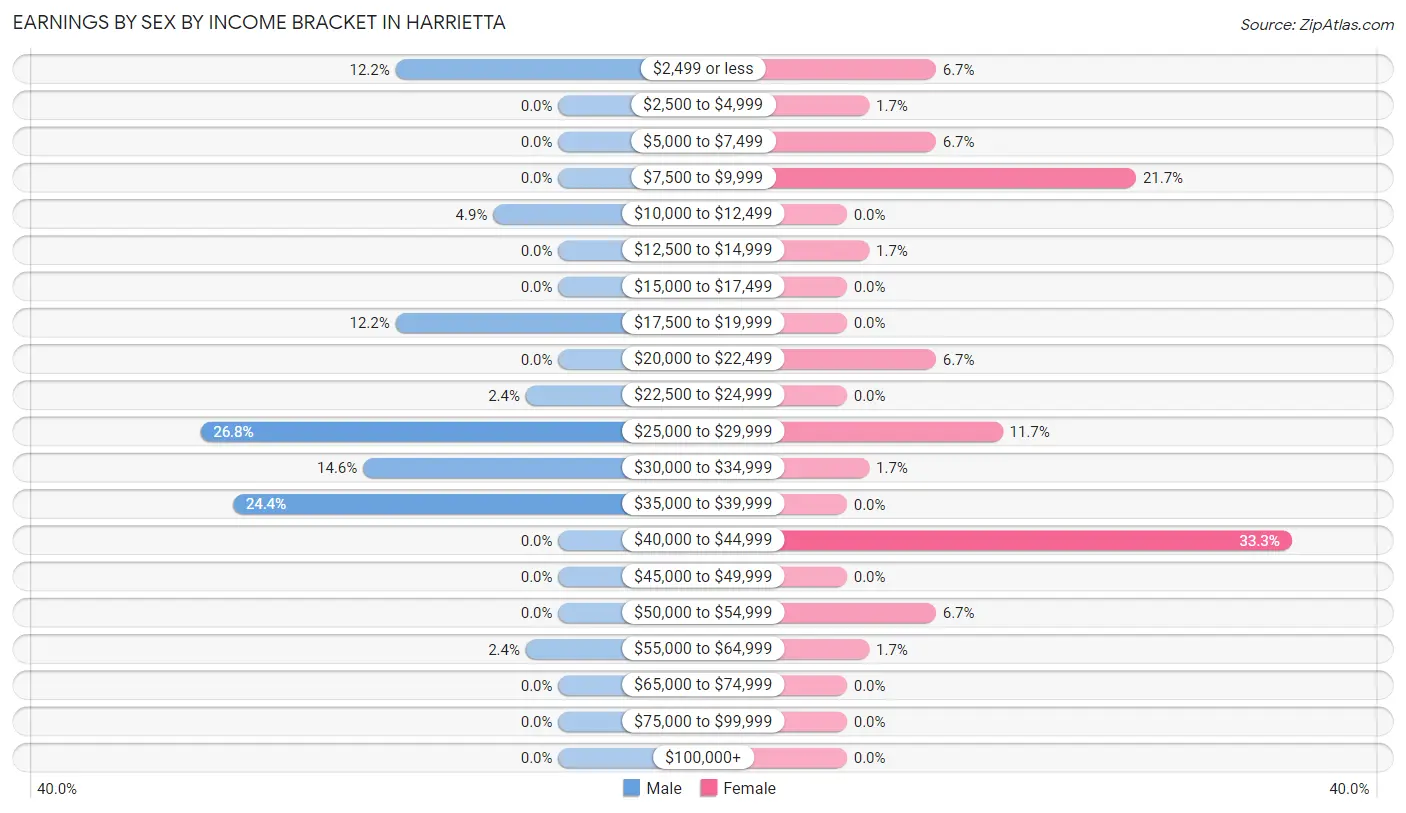
Earnings by Sex by Income Bracket in Harrietta
The most common earnings brackets in Harrietta are $25,000 to $29,999 for men (11 | 26.8%) and $40,000 to $44,999 for women (20 | 33.3%).
| Income | Male | Female |
| $2,499 or less | 5 (12.2%) | 4 (6.7%) |
| $2,500 to $4,999 | 0 (0.0%) | 1 (1.7%) |
| $5,000 to $7,499 | 0 (0.0%) | 4 (6.7%) |
| $7,500 to $9,999 | 0 (0.0%) | 13 (21.7%) |
| $10,000 to $12,499 | 2 (4.9%) | 0 (0.0%) |
| $12,500 to $14,999 | 0 (0.0%) | 1 (1.7%) |
| $15,000 to $17,499 | 0 (0.0%) | 0 (0.0%) |
| $17,500 to $19,999 | 5 (12.2%) | 0 (0.0%) |
| $20,000 to $22,499 | 0 (0.0%) | 4 (6.7%) |
| $22,500 to $24,999 | 1 (2.4%) | 0 (0.0%) |
| $25,000 to $29,999 | 11 (26.8%) | 7 (11.7%) |
| $30,000 to $34,999 | 6 (14.6%) | 1 (1.7%) |
| $35,000 to $39,999 | 10 (24.4%) | 0 (0.0%) |
| $40,000 to $44,999 | 0 (0.0%) | 20 (33.3%) |
| $45,000 to $49,999 | 0 (0.0%) | 0 (0.0%) |
| $50,000 to $54,999 | 0 (0.0%) | 4 (6.7%) |
| $55,000 to $64,999 | 1 (2.4%) | 1 (1.7%) |
| $65,000 to $74,999 | 0 (0.0%) | 0 (0.0%) |
| $75,000 to $99,999 | 0 (0.0%) | 0 (0.0%) |
| $100,000+ | 0 (0.0%) | 0 (0.0%) |
| Total | 41 (100.0%) | 60 (100.0%) |
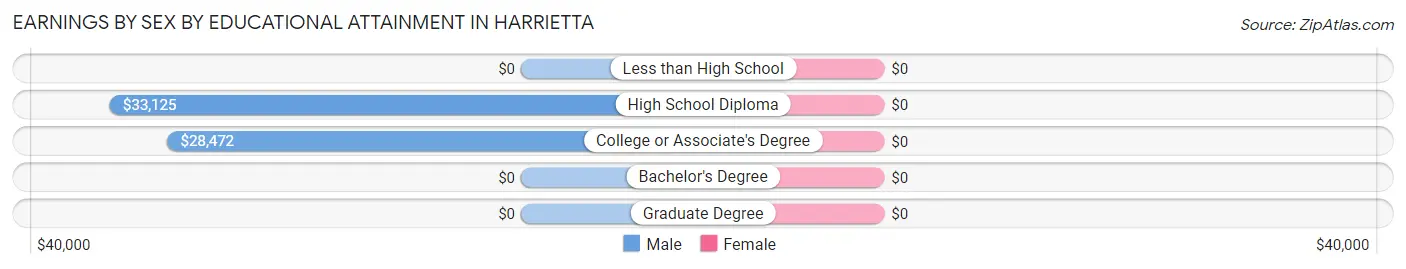
Earnings by Sex by Educational Attainment in Harrietta
| Educational Attainment | Male Income | Female Income |
| Less than High School | - | - |
| High School Diploma | $33,125 | $0 |
| College or Associate's Degree | $28,472 | $0 |
| Bachelor's Degree | - | - |
| Graduate Degree | - | - |
| Total | $29,167 | $43,224 |
Family Income in Harrietta
Family Income Brackets in Harrietta
According to the Harrietta family income data, there are 23 families falling into the $75,000 to $99,999 income range, which is the most common income bracket and makes up 43.4% of all families.
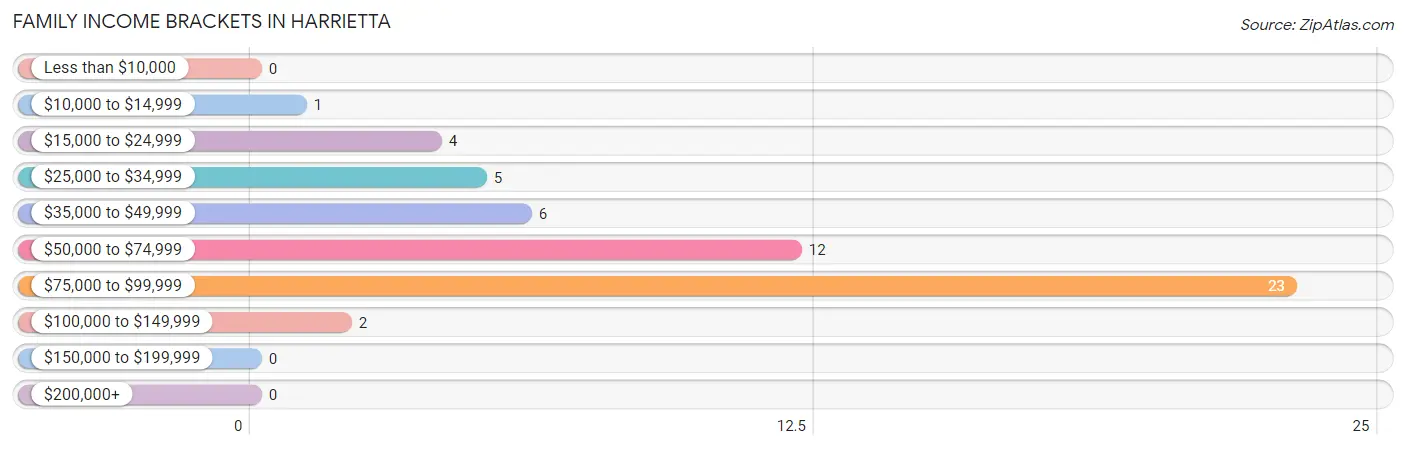
| Income Bracket | # Families | % Families |
| Less than $10,000 | 0 | 0.0% |
| $10,000 to $14,999 | 1 | 1.9% |
| $15,000 to $24,999 | 4 | 7.5% |
| $25,000 to $34,999 | 5 | 9.4% |
| $35,000 to $49,999 | 6 | 11.3% |
| $50,000 to $74,999 | 12 | 22.6% |
| $75,000 to $99,999 | 23 | 43.4% |
| $100,000 to $149,999 | 2 | 3.8% |
| $150,000 to $199,999 | 0 | 0.0% |
| $200,000+ | 0 | 0.0% |
Family Income by Famaliy Size in Harrietta
2-person families (23 | 43.4%) account for the highest median family income in Harrietta with $49,583 per family, while 2-person families (23 | 43.4%) have the highest median income of $24,792 per family member.
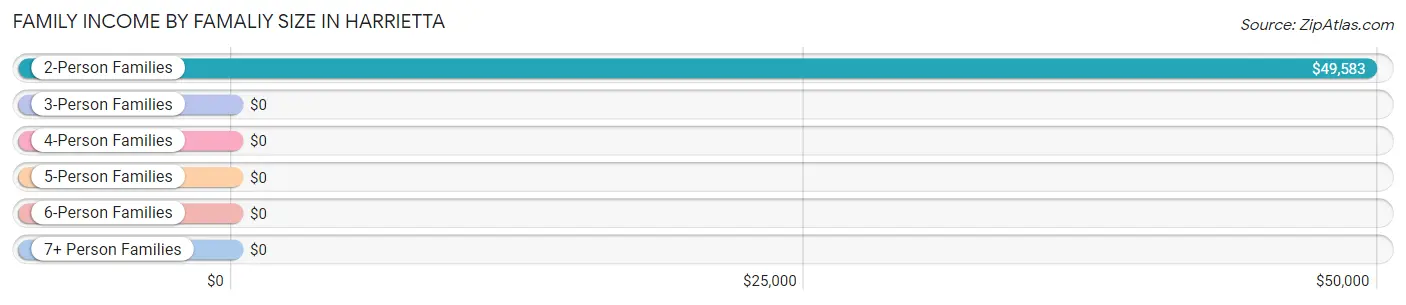
| Income Bracket | # Families | Median Income |
| 2-Person Families | 23 (43.4%) | $49,583 |
| 3-Person Families | 3 (5.7%) | $0 |
| 4-Person Families | 7 (13.2%) | $0 |
| 5-Person Families | 17 (32.1%) | $0 |
| 6-Person Families | 0 (0.0%) | $0 |
| 7+ Person Families | 3 (5.7%) | $0 |
| Total | 53 (100.0%) | $64,688 |
Family Income by Number of Earners in Harrietta
The median family income in Harrietta is $64,688, with families comprising 3+ earners (22) having the highest median family income of $83,906, while families with no earners (12) have the lowest median family income of $37,500, accounting for 41.5% and 22.6% of families, respectively.
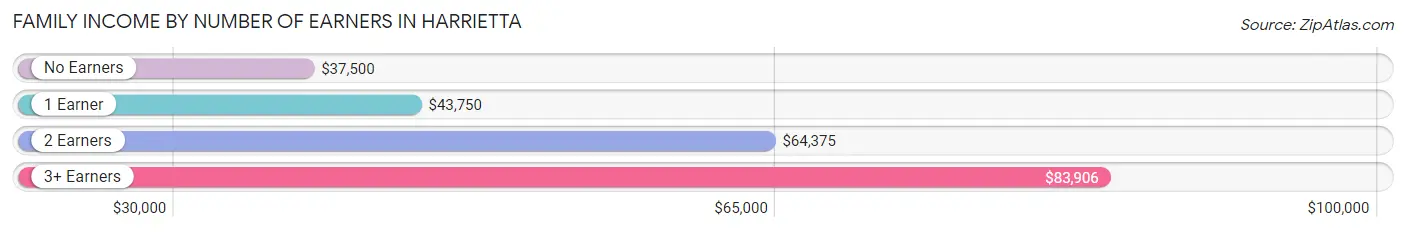
| Number of Earners | # Families | Median Income |
| No Earners | 12 (22.6%) | $37,500 |
| 1 Earner | 11 (20.7%) | $43,750 |
| 2 Earners | 8 (15.1%) | $64,375 |
| 3+ Earners | 22 (41.5%) | $83,906 |
| Total | 53 (100.0%) | $64,688 |
Household Income in Harrietta
Household Income Brackets in Harrietta
With 23 households falling in the category, the $75,000 to $99,999 income range is the most frequent in Harrietta, accounting for 28.1% of all households.
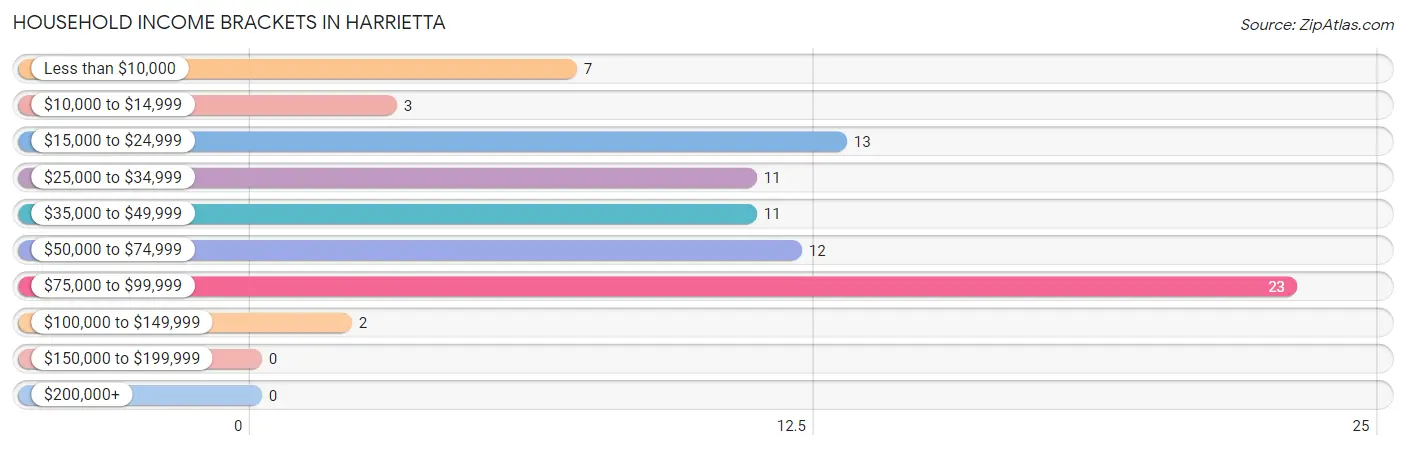
| Income Bracket | # Households | % Households |
| Less than $10,000 | 7 | 8.5% |
| $10,000 to $14,999 | 3 | 3.7% |
| $15,000 to $24,999 | 13 | 15.9% |
| $25,000 to $34,999 | 11 | 13.4% |
| $35,000 to $49,999 | 11 | 13.4% |
| $50,000 to $74,999 | 12 | 14.6% |
| $75,000 to $99,999 | 23 | 28.0% |
| $100,000 to $149,999 | 2 | 2.4% |
| $150,000 to $199,999 | 0 | 0.0% |
| $200,000+ | 0 | 0.0% |
Household Income by Householder Age in Harrietta
The median household income in Harrietta is $48,333, with the highest median household income of $56,250 found in the 45 to 64 years age bracket for the primary householder. A total of 52 households (63.4%) fall into this category. Meanwhile, the 15 to 24 years age bracket for the primary householder has the lowest median household income of $0, with 1 households (1.2%) in this group.
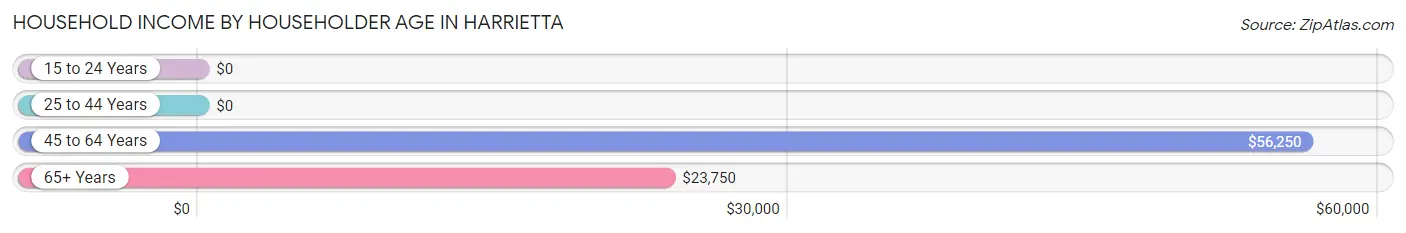
| Income Bracket | # Households | Median Income |
| 15 to 24 Years | 1 (1.2%) | $0 |
| 25 to 44 Years | 8 (9.8%) | $0 |
| 45 to 64 Years | 52 (63.4%) | $56,250 |
| 65+ Years | 21 (25.6%) | $23,750 |
| Total | 82 (100.0%) | $48,333 |
Poverty in Harrietta
Income Below Poverty by Sex and Age in Harrietta
With 11.3% poverty level for males and 21.1% for females among the residents of Harrietta, 35 to 44 year old males and under 5 year old females are the most vulnerable to poverty, with 5 males (45.5%) and 1 females (100.0%) in their respective age groups living below the poverty level.
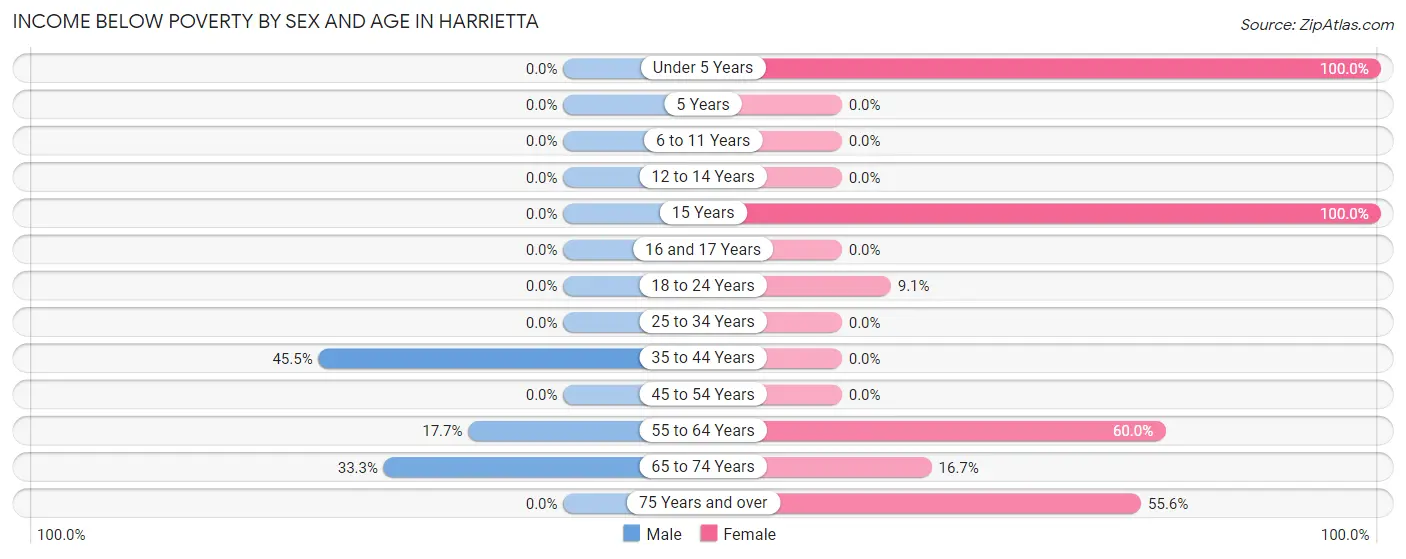
| Age Bracket | Male | Female |
| Under 5 Years | 0 (0.0%) | 1 (100.0%) |
| 5 Years | 0 (0.0%) | 0 (0.0%) |
| 6 to 11 Years | 0 (0.0%) | 0 (0.0%) |
| 12 to 14 Years | 0 (0.0%) | 0 (0.0%) |
| 15 Years | 0 (0.0%) | 4 (100.0%) |
| 16 and 17 Years | 0 (0.0%) | 0 (0.0%) |
| 18 to 24 Years | 0 (0.0%) | 1 (9.1%) |
| 25 to 34 Years | 0 (0.0%) | 0 (0.0%) |
| 35 to 44 Years | 5 (45.5%) | 0 (0.0%) |
| 45 to 54 Years | 0 (0.0%) | 0 (0.0%) |
| 55 to 64 Years | 3 (17.6%) | 9 (60.0%) |
| 65 to 74 Years | 4 (33.3%) | 2 (16.7%) |
| 75 Years and over | 0 (0.0%) | 5 (55.6%) |
| Total | 12 (11.3%) | 22 (21.1%) |
Income Above Poverty by Sex and Age in Harrietta
According to the poverty statistics in Harrietta, males aged under 5 years and females aged 6 to 11 years are the age groups that are most secure financially, with 100.0% of males and 100.0% of females in these age groups living above the poverty line.
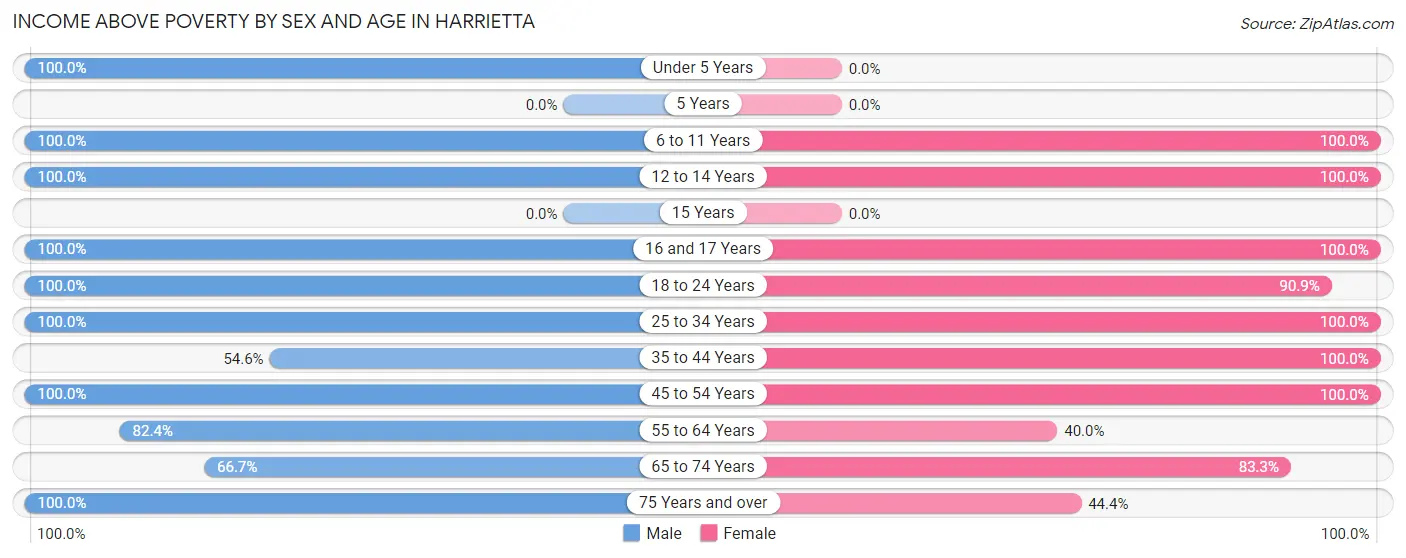
| Age Bracket | Male | Female |
| Under 5 Years | 4 (100.0%) | 0 (0.0%) |
| 5 Years | 0 (0.0%) | 0 (0.0%) |
| 6 to 11 Years | 2 (100.0%) | 3 (100.0%) |
| 12 to 14 Years | 12 (100.0%) | 1 (100.0%) |
| 15 Years | 0 (0.0%) | 0 (0.0%) |
| 16 and 17 Years | 16 (100.0%) | 12 (100.0%) |
| 18 to 24 Years | 8 (100.0%) | 10 (90.9%) |
| 25 to 34 Years | 1 (100.0%) | 3 (100.0%) |
| 35 to 44 Years | 6 (54.5%) | 1 (100.0%) |
| 45 to 54 Years | 20 (100.0%) | 32 (100.0%) |
| 55 to 64 Years | 14 (82.4%) | 6 (40.0%) |
| 65 to 74 Years | 8 (66.7%) | 10 (83.3%) |
| 75 Years and over | 3 (100.0%) | 4 (44.4%) |
| Total | 94 (88.7%) | 82 (78.8%) |
Income Below Poverty Among Married-Couple Families in Harrietta
The poverty statistics for married-couple families in Harrietta show that 8.7% or 4 of the total 46 families live below the poverty line. Families with 1 or 2 children have the highest poverty rate of 66.7%, comprising of 4 families. On the other hand, families with no children have the lowest poverty rate of 0.0%, which includes 0 families.
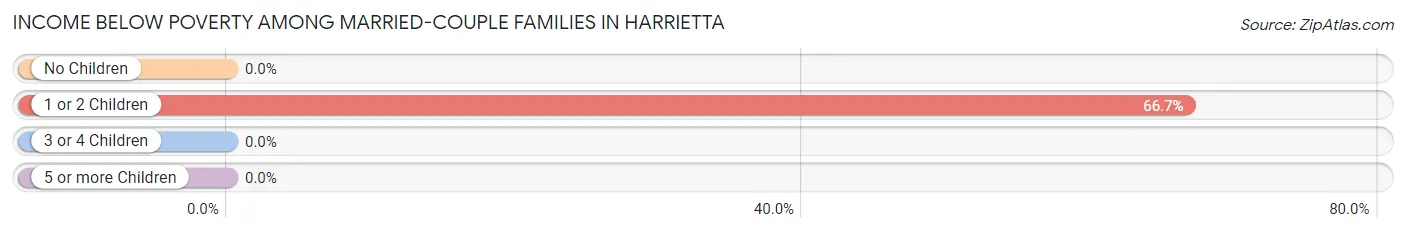
| Children | Above Poverty | Below Poverty |
| No Children | 20 (100.0%) | 0 (0.0%) |
| 1 or 2 Children | 2 (33.3%) | 4 (66.7%) |
| 3 or 4 Children | 20 (100.0%) | 0 (0.0%) |
| 5 or more Children | 0 (0.0%) | 0 (0.0%) |
| Total | 42 (91.3%) | 4 (8.7%) |
Income Below Poverty Among Single-Parent Households in Harrietta
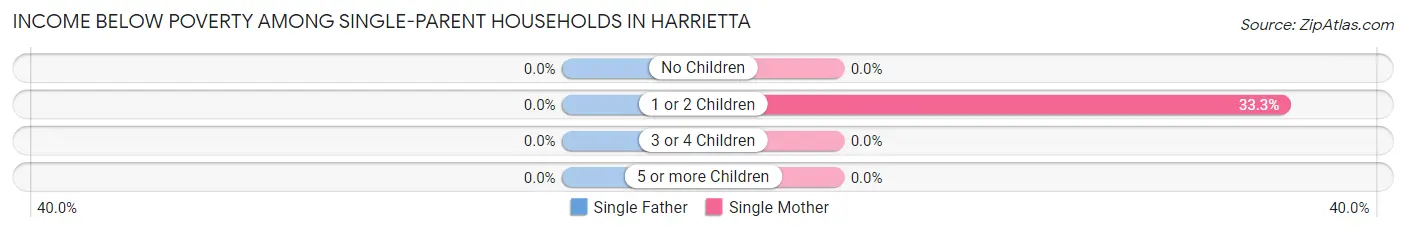
| Children | Single Father | Single Mother |
| No Children | 0 (0.0%) | 0 (0.0%) |
| 1 or 2 Children | 0 (0.0%) | 1 (33.3%) |
| 3 or 4 Children | 0 (0.0%) | 0 (0.0%) |
| 5 or more Children | 0 (0.0%) | 0 (0.0%) |
| Total | 0 (0.0%) | 1 (14.3%) |
Income Below Poverty Among Married-Couple vs Single-Parent Households in Harrietta
The poverty data for Harrietta shows that 4 of the married-couple family households (8.7%) and 1 of the single-parent households (14.3%) are living below the poverty level. Within the married-couple family households, those with 1 or 2 children have the highest poverty rate, with 4 households (66.7%) falling below the poverty line. Among the single-parent households, those with 1 or 2 children have the highest poverty rate, with 1 household (33.3%) living below poverty.
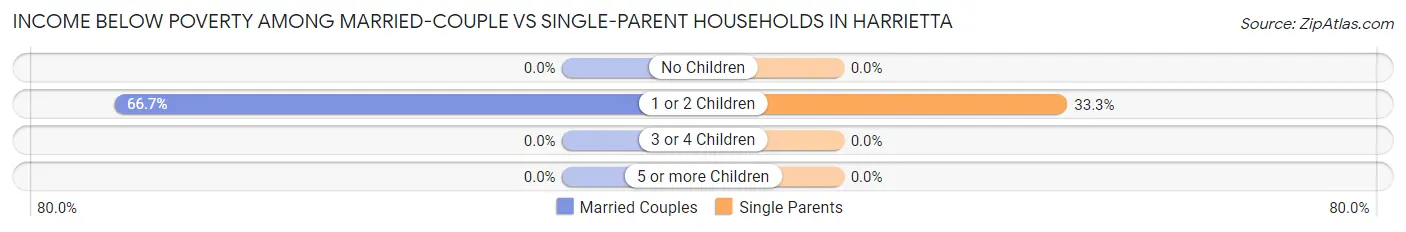
| Children | Married-Couple Families | Single-Parent Households |
| No Children | 0 (0.0%) | 0 (0.0%) |
| 1 or 2 Children | 4 (66.7%) | 1 (33.3%) |
| 3 or 4 Children | 0 (0.0%) | 0 (0.0%) |
| 5 or more Children | 0 (0.0%) | 0 (0.0%) |
| Total | 4 (8.7%) | 1 (14.3%) |
Race in Harrietta
The most populous races in Harrietta are White / Caucasian (210 | 100.0%), and Hispanic or Latino (4 | 1.9%).
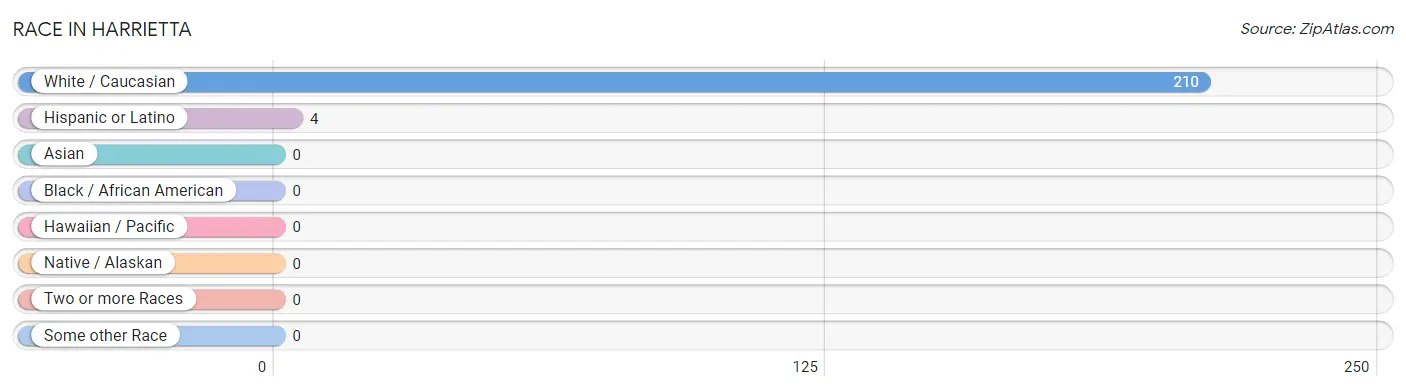
| Race | # Population | % Population |
| Asian | 0 | 0.0% |
| Black / African American | 0 | 0.0% |
| Hawaiian / Pacific | 0 | 0.0% |
| Hispanic or Latino | 4 | 1.9% |
| Native / Alaskan | 0 | 0.0% |
| White / Caucasian | 210 | 100.0% |
| Two or more Races | 0 | 0.0% |
| Some other Race | 0 | 0.0% |
| Total | 210 | 100.0% |
Ancestry in Harrietta
The most populous ancestries reported in Harrietta are German (56 | 26.7%), Irish (25 | 11.9%), Dutch (20 | 9.5%), English (19 | 9.0%), and American (11 | 5.2%), together accounting for 62.4% of all Harrietta residents.
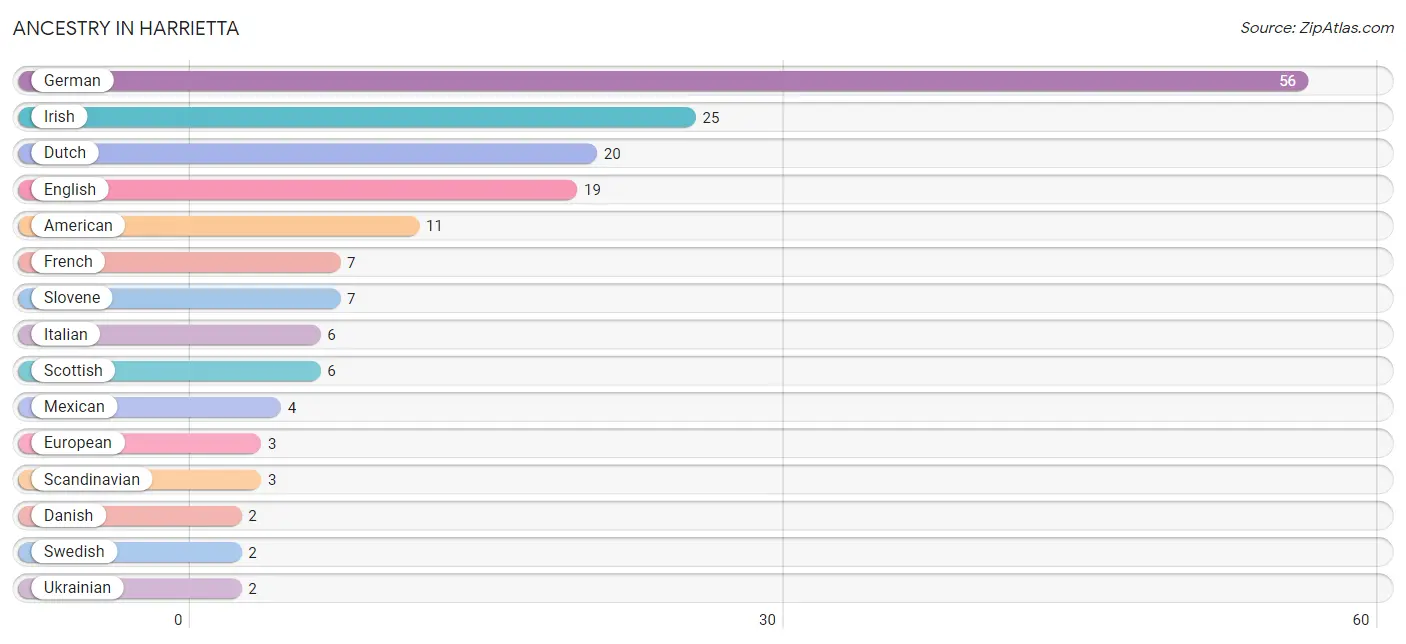
| Ancestry | # Population | % Population |
| American | 11 | 5.2% |
| Canadian | 1 | 0.5% |
| Danish | 2 | 0.9% |
| Dutch | 20 | 9.5% |
| English | 19 | 9.0% |
| European | 3 | 1.4% |
| Finnish | 1 | 0.5% |
| French | 7 | 3.3% |
| French Canadian | 1 | 0.5% |
| German | 56 | 26.7% |
| Greek | 1 | 0.5% |
| Irish | 25 | 11.9% |
| Italian | 6 | 2.9% |
| Mexican | 4 | 1.9% |
| Scandinavian | 3 | 1.4% |
| Scotch-Irish | 1 | 0.5% |
| Scottish | 6 | 2.9% |
| Slovene | 7 | 3.3% |
| Swedish | 2 | 0.9% |
| Ukrainian | 2 | 0.9% | View All 20 Rows |
Immigrants in Harrietta

| Immigration Origin | # Population | % Population | View All 0 Rows |
Sex and Age in Harrietta
Sex and Age in Harrietta
The most populous age groups in Harrietta are 15 to 19 Years (18 | 17.0%) for men and 45 to 49 Years (25 | 24.0%) for women.
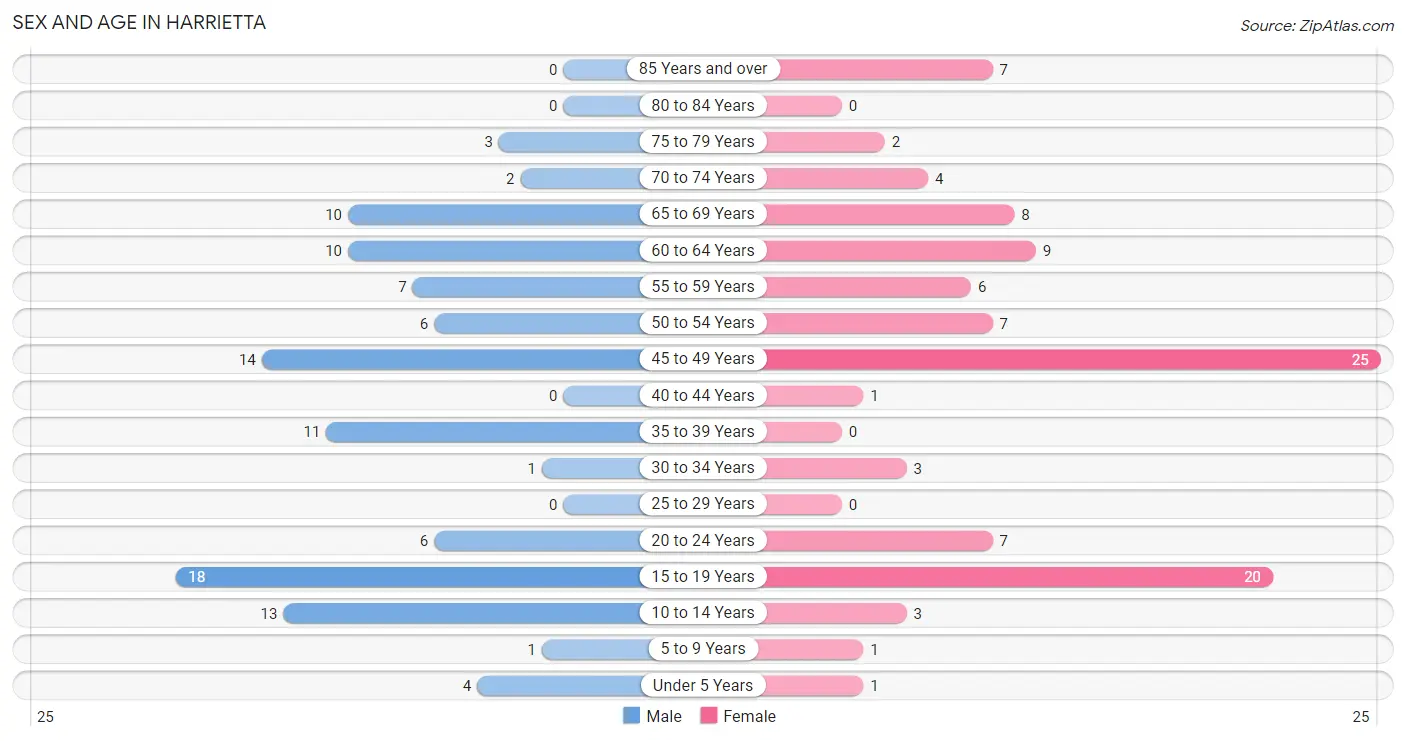
| Age Bracket | Male | Female |
| Under 5 Years | 4 (3.8%) | 1 (1.0%) |
| 5 to 9 Years | 1 (0.9%) | 1 (1.0%) |
| 10 to 14 Years | 13 (12.3%) | 3 (2.9%) |
| 15 to 19 Years | 18 (17.0%) | 20 (19.2%) |
| 20 to 24 Years | 6 (5.7%) | 7 (6.7%) |
| 25 to 29 Years | 0 (0.0%) | 0 (0.0%) |
| 30 to 34 Years | 1 (0.9%) | 3 (2.9%) |
| 35 to 39 Years | 11 (10.4%) | 0 (0.0%) |
| 40 to 44 Years | 0 (0.0%) | 1 (1.0%) |
| 45 to 49 Years | 14 (13.2%) | 25 (24.0%) |
| 50 to 54 Years | 6 (5.7%) | 7 (6.7%) |
| 55 to 59 Years | 7 (6.6%) | 6 (5.8%) |
| 60 to 64 Years | 10 (9.4%) | 9 (8.6%) |
| 65 to 69 Years | 10 (9.4%) | 8 (7.7%) |
| 70 to 74 Years | 2 (1.9%) | 4 (3.8%) |
| 75 to 79 Years | 3 (2.8%) | 2 (1.9%) |
| 80 to 84 Years | 0 (0.0%) | 0 (0.0%) |
| 85 Years and over | 0 (0.0%) | 7 (6.7%) |
| Total | 106 (100.0%) | 104 (100.0%) |
Families and Households in Harrietta
Median Family Size in Harrietta
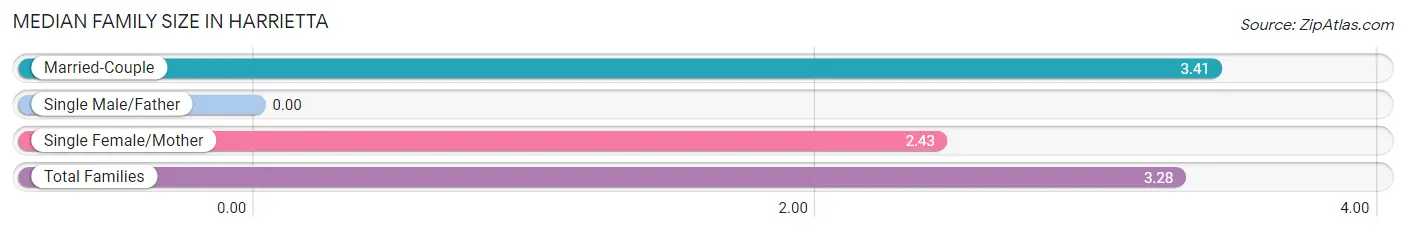
| Family Type | # Families | Family Size |
| Married-Couple | 46 (86.8%) | 3.41 |
| Single Male/Father | 0 (0.0%) | - |
| Single Female/Mother | 7 (13.2%) | 2.43 |
| Total Families | 53 (100.0%) | 3.28 |
Median Household Size in Harrietta
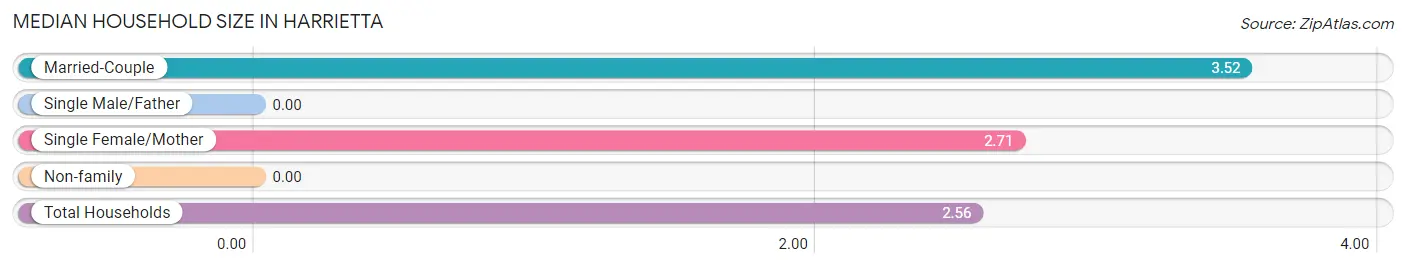
| Household Type | # Households | Household Size |
| Married-Couple | 46 (56.1%) | 3.52 |
| Single Male/Father | 0 (0.0%) | - |
| Single Female/Mother | 7 (8.5%) | 2.71 |
| Non-family | 29 (35.4%) | - |
| Total Households | 82 (100.0%) | 2.56 |
Household Size by Marriage Status in Harrietta
Out of a total of 82 households in Harrietta, 53 (64.6%) are family households, while 29 (35.4%) are nonfamily households. The most numerous type of family households are 2-person households, comprising 22, and the most common type of nonfamily households are 1-person households, comprising 29.
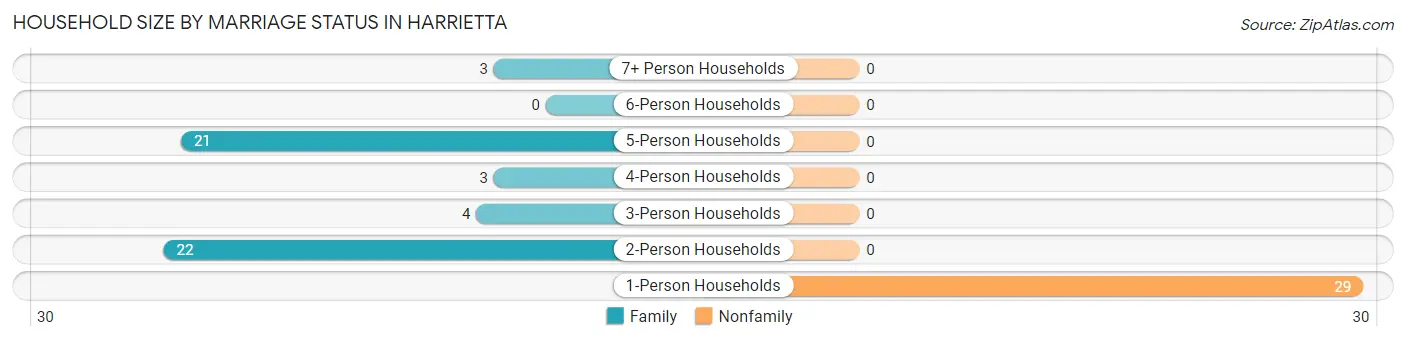
| Household Size | Family Households | Nonfamily Households |
| 1-Person Households | - | 29 (35.4%) |
| 2-Person Households | 22 (26.8%) | 0 (0.0%) |
| 3-Person Households | 4 (4.9%) | 0 (0.0%) |
| 4-Person Households | 3 (3.7%) | 0 (0.0%) |
| 5-Person Households | 21 (25.6%) | 0 (0.0%) |
| 6-Person Households | 0 (0.0%) | 0 (0.0%) |
| 7+ Person Households | 3 (3.7%) | 0 (0.0%) |
| Total | 53 (64.6%) | 29 (35.4%) |
Female Fertility in Harrietta
Fertility by Age in Harrietta
Average fertility rate in Harrietta is 17.0 births per 1,000 women. Women in the age bracket of 20 to 34 years have the highest fertility rate with 100.0 births per 1,000 women. Women in the age bracket of 20 to 34 years acount for 100.0% of all women with births.
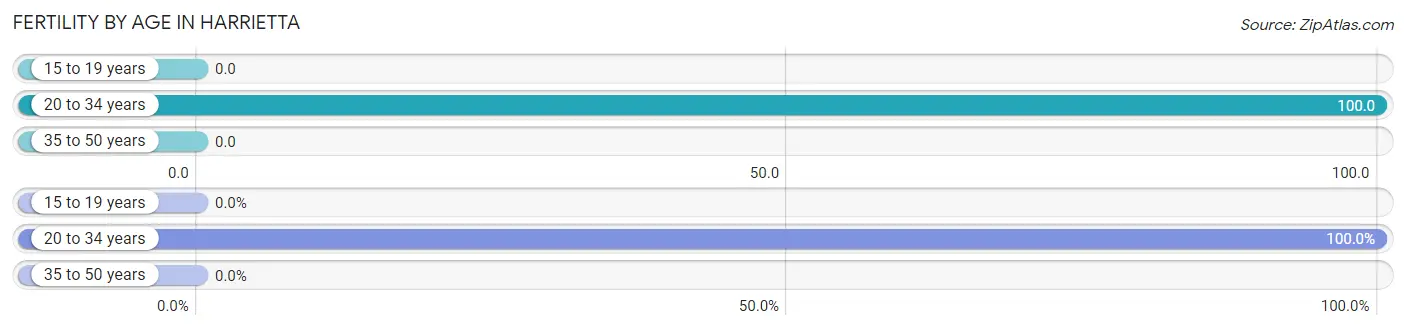
| Age Bracket | Women with Births | Births / 1,000 Women |
| 15 to 19 years | 0 (0.0%) | 0.0 |
| 20 to 34 years | 1 (100.0%) | 100.0 |
| 35 to 50 years | 0 (0.0%) | 0.0 |
| Total | 1 (100.0%) | 17.0 |
Fertility by Age by Marriage Status in Harrietta
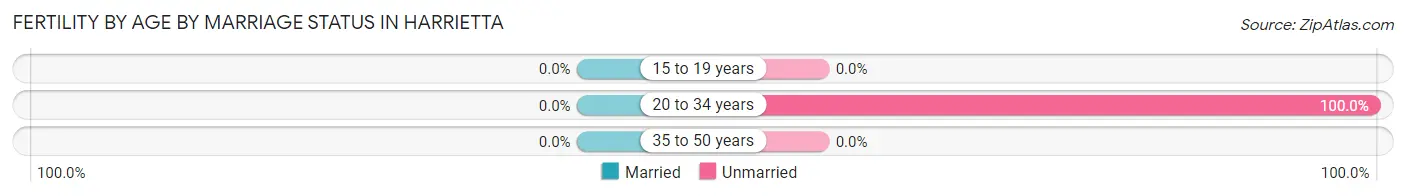
| Age Bracket | Married | Unmarried |
| 15 to 19 years | 0 (0.0%) | 0 (0.0%) |
| 20 to 34 years | 0 (0.0%) | 1 (100.0%) |
| 35 to 50 years | 0 (0.0%) | 0 (0.0%) |
| Total | 0 (0.0%) | 1 (100.0%) |
Fertility by Education in Harrietta
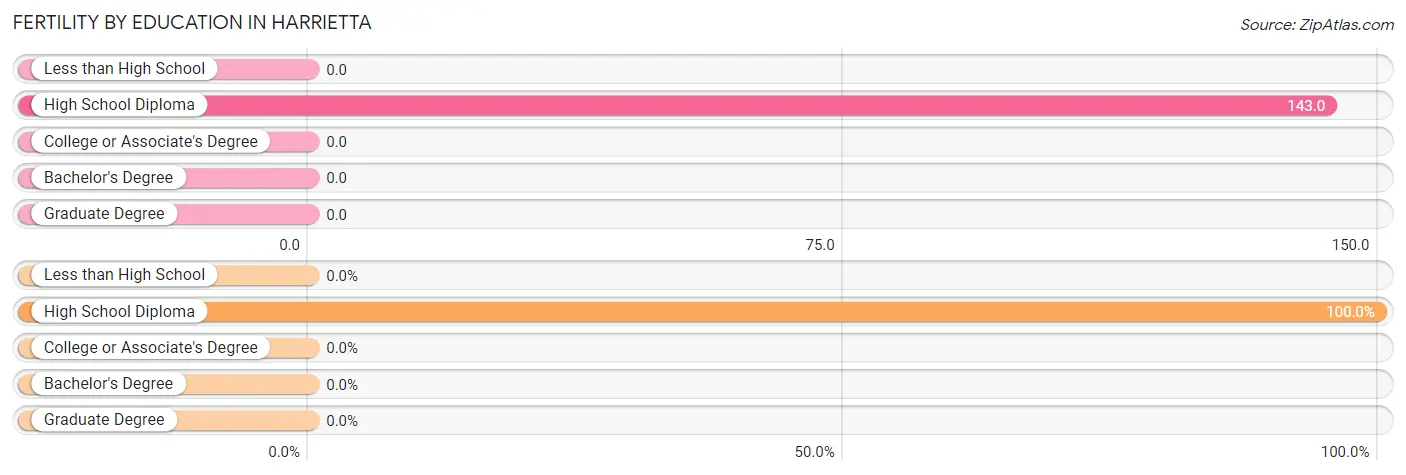
| Educational Attainment | Women with Births | Births / 1,000 Women |
| Less than High School | 0 (0.0%) | 0.0 |
| High School Diploma | 1 (100.0%) | 143.0 |
| College or Associate's Degree | 0 (0.0%) | 0.0 |
| Bachelor's Degree | 0 (0.0%) | 0.0 |
| Graduate Degree | 0 (0.0%) | 0.0 |
| Total | 1 (100.0%) | 17.0 |
Fertility by Education by Marriage Status in Harrietta
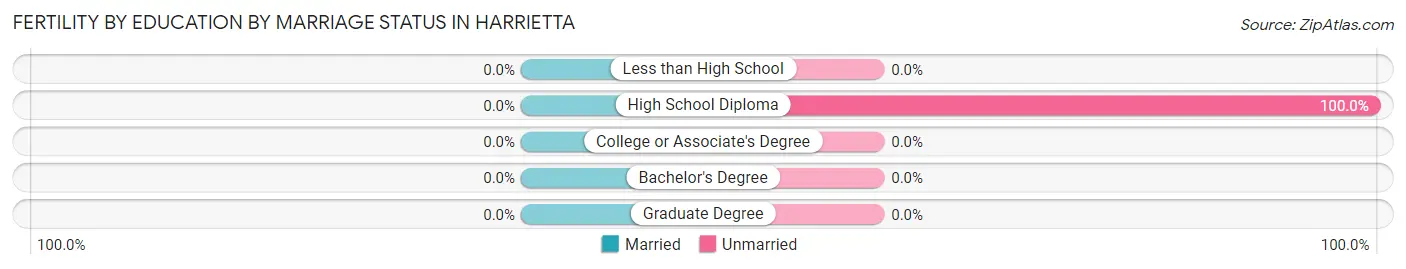
| Educational Attainment | Married | Unmarried |
| Less than High School | 0 (0.0%) | 0 (0.0%) |
| High School Diploma | 0 (0.0%) | 1 (100.0%) |
| College or Associate's Degree | 0 (0.0%) | 0 (0.0%) |
| Bachelor's Degree | 0 (0.0%) | 0 (0.0%) |
| Graduate Degree | 0 (0.0%) | 0 (0.0%) |
| Total | 0 (0.0%) | 1 (100.0%) |
Employment Characteristics in Harrietta
Employment by Class of Employer in Harrietta
Among the 86 employed individuals in Harrietta, private company employees (51 | 59.3%), self-employed (not incorporated) (21 | 24.4%), and not-for-profit organizations (8 | 9.3%) make up the most common classes of employment.
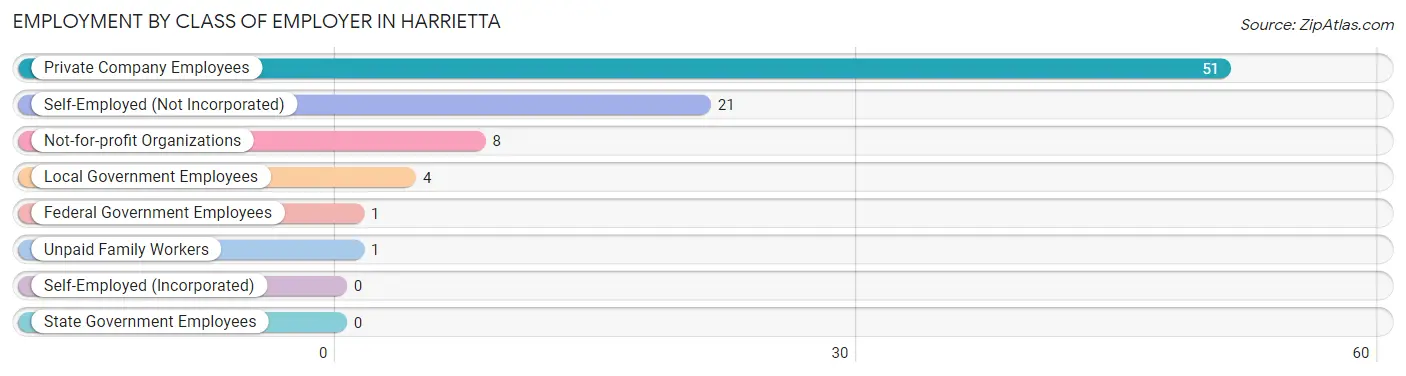
| Employer Class | # Employees | % Employees |
| Private Company Employees | 51 | 59.3% |
| Self-Employed (Incorporated) | 0 | 0.0% |
| Self-Employed (Not Incorporated) | 21 | 24.4% |
| Not-for-profit Organizations | 8 | 9.3% |
| Local Government Employees | 4 | 4.6% |
| State Government Employees | 0 | 0.0% |
| Federal Government Employees | 1 | 1.2% |
| Unpaid Family Workers | 1 | 1.2% |
| Total | 86 | 100.0% |
Employment Status by Age in Harrietta
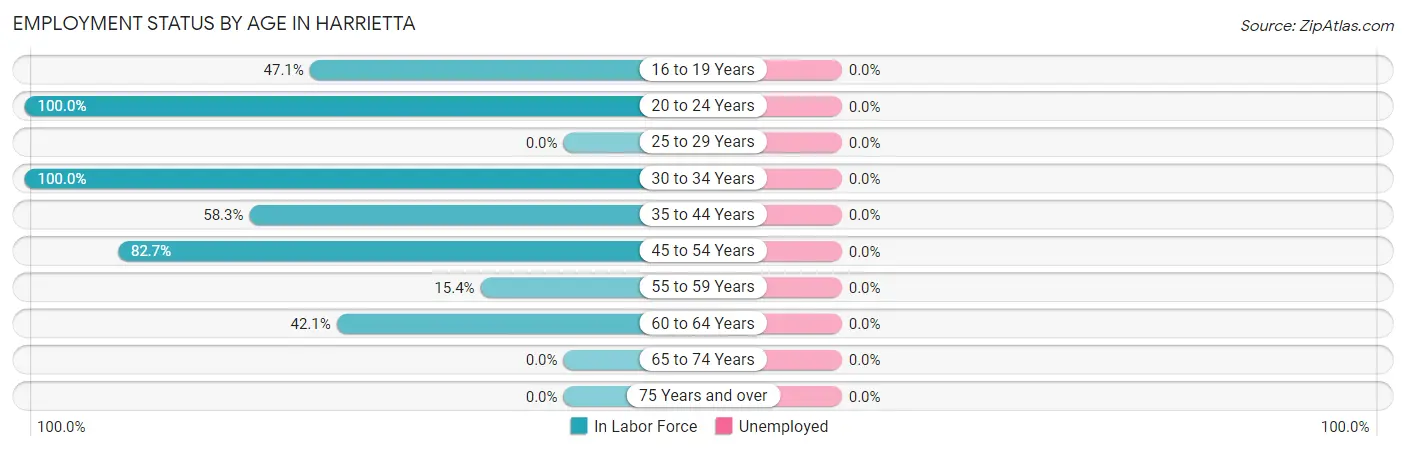
| Age Bracket | In Labor Force | Unemployed |
| 16 to 19 Years | 16 (47.1%) | 0 (0.0%) |
| 20 to 24 Years | 13 (100.0%) | 0 (0.0%) |
| 25 to 29 Years | 0 (0.0%) | 0 (0.0%) |
| 30 to 34 Years | 4 (100.0%) | 0 (0.0%) |
| 35 to 44 Years | 7 (58.3%) | 0 (0.0%) |
| 45 to 54 Years | 43 (82.7%) | 0 (0.0%) |
| 55 to 59 Years | 2 (15.4%) | 0 (0.0%) |
| 60 to 64 Years | 8 (42.1%) | 0 (0.0%) |
| 65 to 74 Years | 0 (0.0%) | 0 (0.0%) |
| 75 Years and over | 0 (0.0%) | 0 (0.0%) |
| Total | 93 (50.8%) | 0 (0.0%) |
Employment Status by Educational Attainment in Harrietta
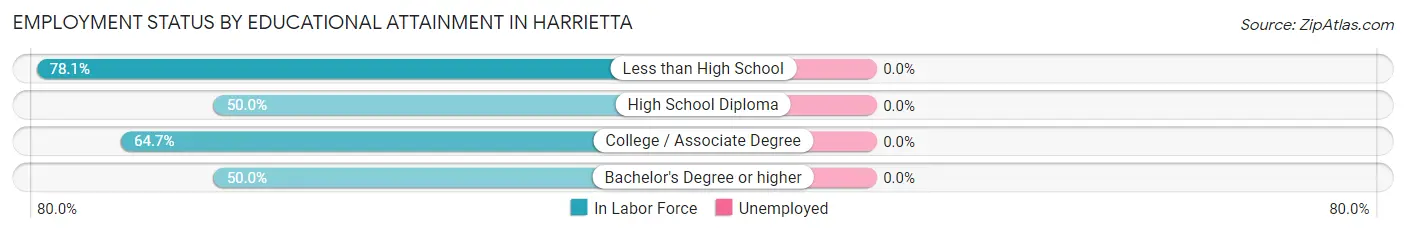
| Educational Attainment | In Labor Force | Unemployed |
| Less than High School | 25 (78.1%) | 0 (0.0%) |
| High School Diploma | 13 (50.0%) | 0 (0.0%) |
| College / Associate Degree | 22 (64.7%) | 0 (0.0%) |
| Bachelor's Degree or higher | 4 (50.0%) | 0 (0.0%) |
| Total | 64 (64.0%) | 0 (0.0%) |
Employment Occupations by Sex in Harrietta
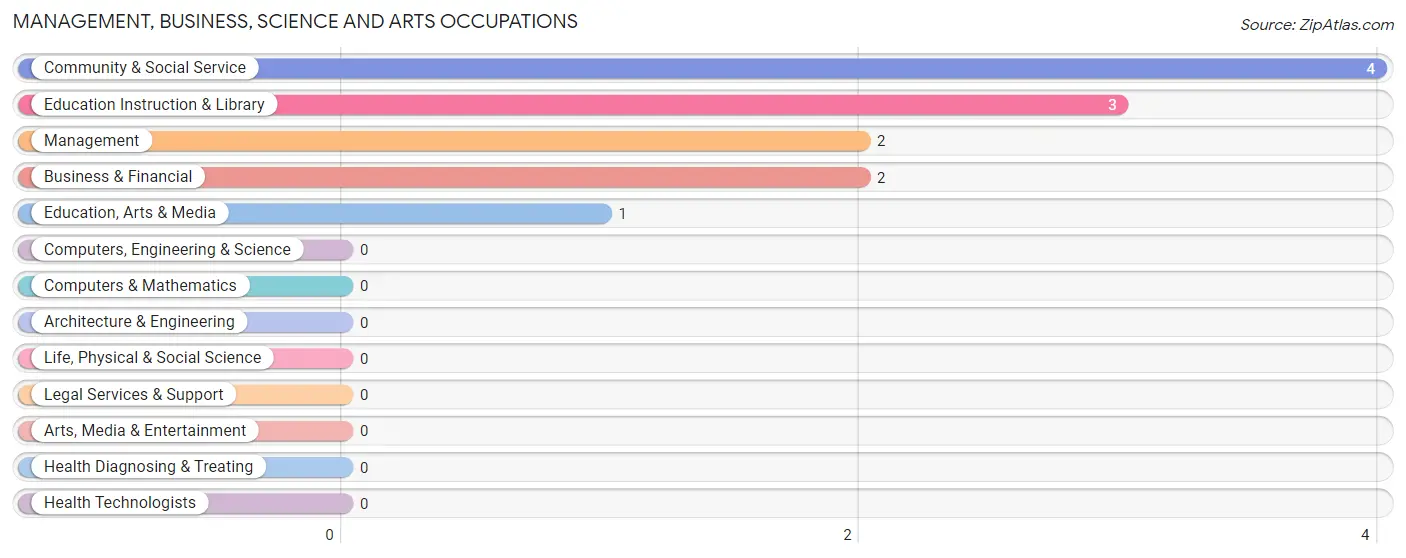
Management, Business, Science and Arts Occupations
The most common Management, Business, Science and Arts occupations in Harrietta are Community & Social Service (4 | 4.3%), Education Instruction & Library (3 | 3.2%), Management (2 | 2.1%), Business & Financial (2 | 2.1%), and Education, Arts & Media (1 | 1.1%).
Management, Business, Science and Arts Occupations by Sex
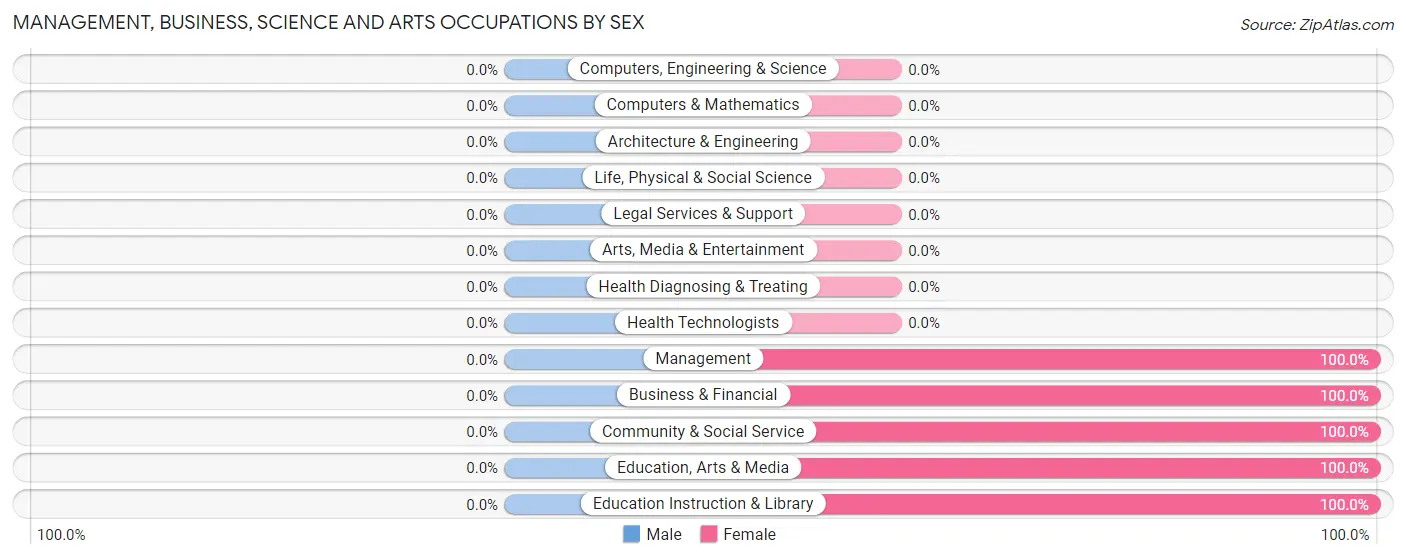
| Occupation | Male | Female |
| Management | 0 (0.0%) | 2 (100.0%) |
| Business & Financial | 0 (0.0%) | 2 (100.0%) |
| Computers, Engineering & Science | 0 (0.0%) | 0 (0.0%) |
| Computers & Mathematics | 0 (0.0%) | 0 (0.0%) |
| Architecture & Engineering | 0 (0.0%) | 0 (0.0%) |
| Life, Physical & Social Science | 0 (0.0%) | 0 (0.0%) |
| Community & Social Service | 0 (0.0%) | 4 (100.0%) |
| Education, Arts & Media | 0 (0.0%) | 1 (100.0%) |
| Legal Services & Support | 0 (0.0%) | 0 (0.0%) |
| Education Instruction & Library | 0 (0.0%) | 3 (100.0%) |
| Arts, Media & Entertainment | 0 (0.0%) | 0 (0.0%) |
| Health Diagnosing & Treating | 0 (0.0%) | 0 (0.0%) |
| Health Technologists | 0 (0.0%) | 0 (0.0%) |
| Total (Category) | 0 (0.0%) | 8 (100.0%) |
| Total (Overall) | 34 (36.6%) | 59 (63.4%) |
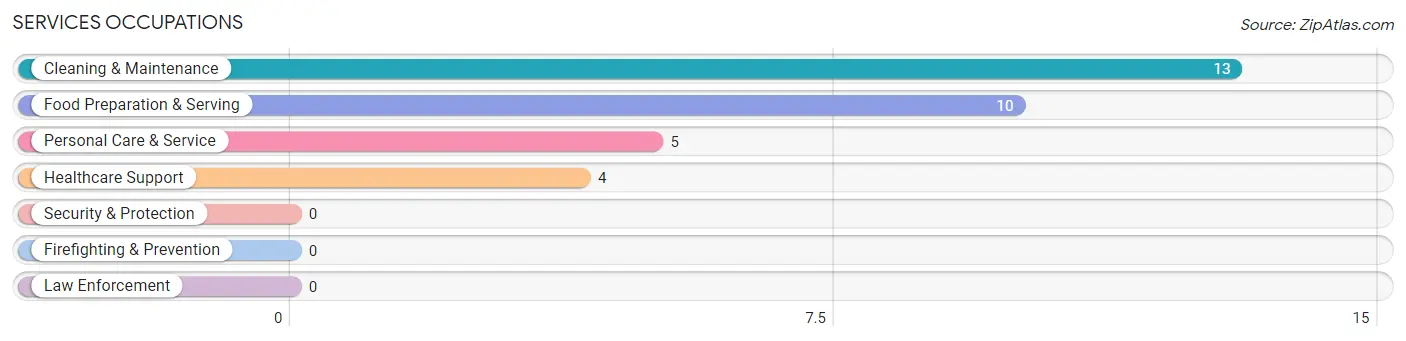
Services Occupations
The most common Services occupations in Harrietta are Cleaning & Maintenance (13 | 14.0%), Food Preparation & Serving (10 | 10.7%), Personal Care & Service (5 | 5.4%), and Healthcare Support (4 | 4.3%).
Services Occupations by Sex
Within the Services occupations in Harrietta, the most male-oriented occupations are Personal Care & Service (100.0%), and Food Preparation & Serving (10.0%), while the most female-oriented occupations are Healthcare Support (100.0%), Cleaning & Maintenance (100.0%), and Food Preparation & Serving (90.0%).
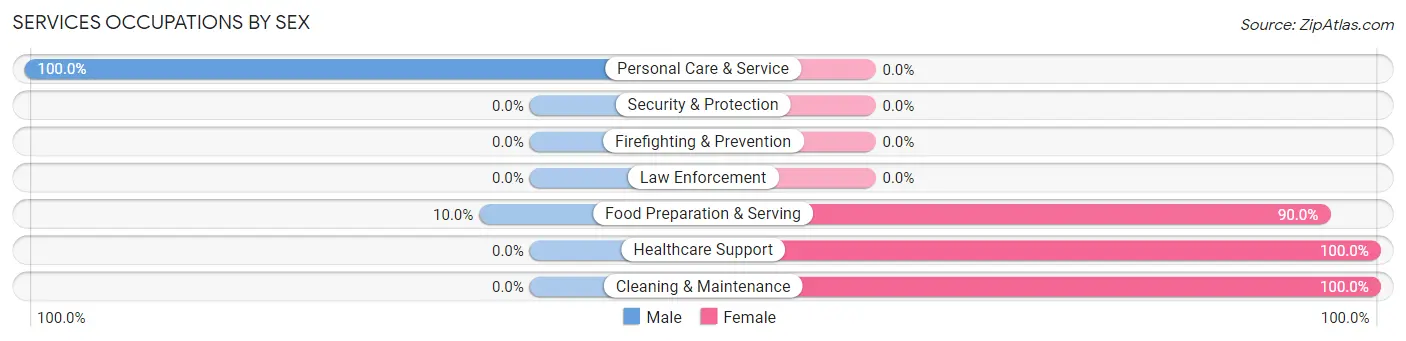
| Occupation | Male | Female |
| Healthcare Support | 0 (0.0%) | 4 (100.0%) |
| Security & Protection | 0 (0.0%) | 0 (0.0%) |
| Firefighting & Prevention | 0 (0.0%) | 0 (0.0%) |
| Law Enforcement | 0 (0.0%) | 0 (0.0%) |
| Food Preparation & Serving | 1 (10.0%) | 9 (90.0%) |
| Cleaning & Maintenance | 0 (0.0%) | 13 (100.0%) |
| Personal Care & Service | 5 (100.0%) | 0 (0.0%) |
| Total (Category) | 6 (18.8%) | 26 (81.2%) |
| Total (Overall) | 34 (36.6%) | 59 (63.4%) |
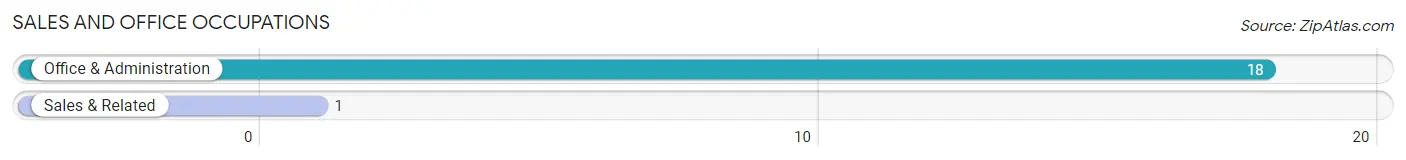
Sales and Office Occupations
The most common Sales and Office occupations in Harrietta are Office & Administration (18 | 19.4%), and Sales & Related (1 | 1.1%).
Sales and Office Occupations by Sex
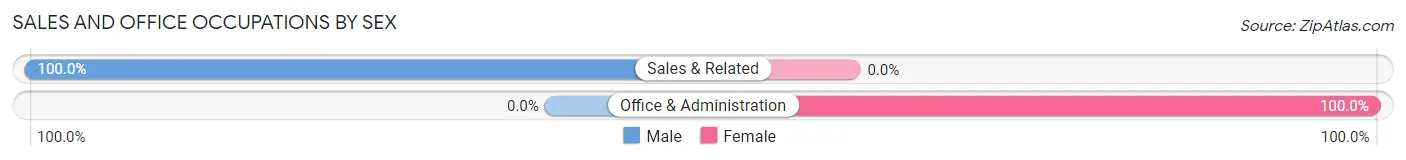
| Occupation | Male | Female |
| Sales & Related | 1 (100.0%) | 0 (0.0%) |
| Office & Administration | 0 (0.0%) | 18 (100.0%) |
| Total (Category) | 1 (5.3%) | 18 (94.7%) |
| Total (Overall) | 34 (36.6%) | 59 (63.4%) |
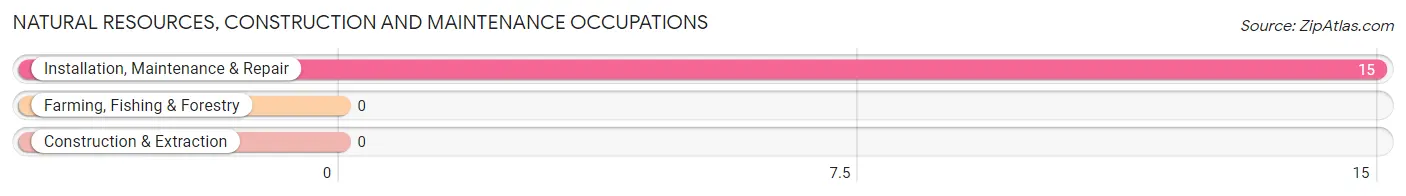
Natural Resources, Construction and Maintenance Occupations
The most common Natural Resources, Construction and Maintenance occupations in Harrietta are , and Installation, Maintenance & Repair (15 | 16.1%).
Natural Resources, Construction and Maintenance Occupations by Sex
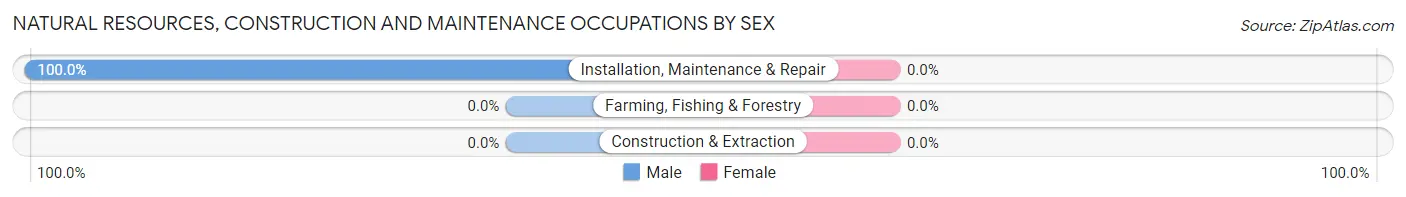
| Occupation | Male | Female |
| Farming, Fishing & Forestry | 0 (0.0%) | 0 (0.0%) |
| Construction & Extraction | 0 (0.0%) | 0 (0.0%) |
| Installation, Maintenance & Repair | 15 (100.0%) | 0 (0.0%) |
| Total (Category) | 15 (100.0%) | 0 (0.0%) |
| Total (Overall) | 34 (36.6%) | 59 (63.4%) |
Production, Transportation and Moving Occupations
The most common Production, Transportation and Moving occupations in Harrietta are Production (16 | 17.2%), and Material Moving (3 | 3.2%).
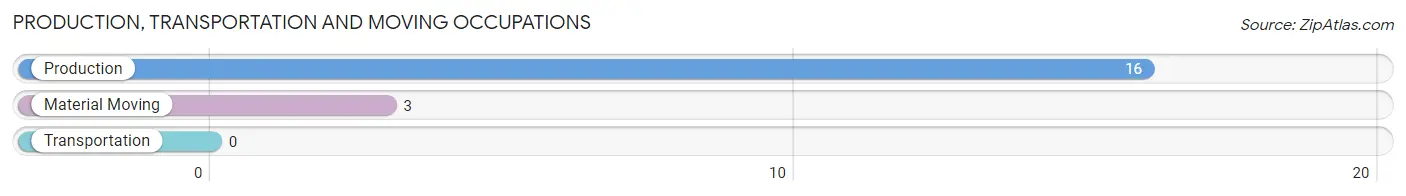
Production, Transportation and Moving Occupations by Sex
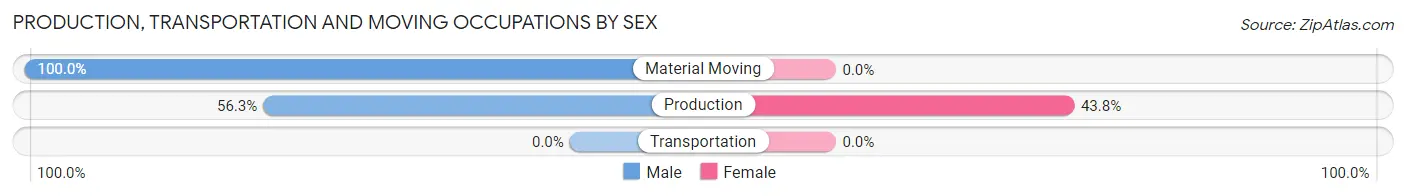
| Occupation | Male | Female |
| Production | 9 (56.2%) | 7 (43.8%) |
| Transportation | 0 (0.0%) | 0 (0.0%) |
| Material Moving | 3 (100.0%) | 0 (0.0%) |
| Total (Category) | 12 (63.2%) | 7 (36.8%) |
| Total (Overall) | 34 (36.6%) | 59 (63.4%) |
Employment Industries by Sex in Harrietta
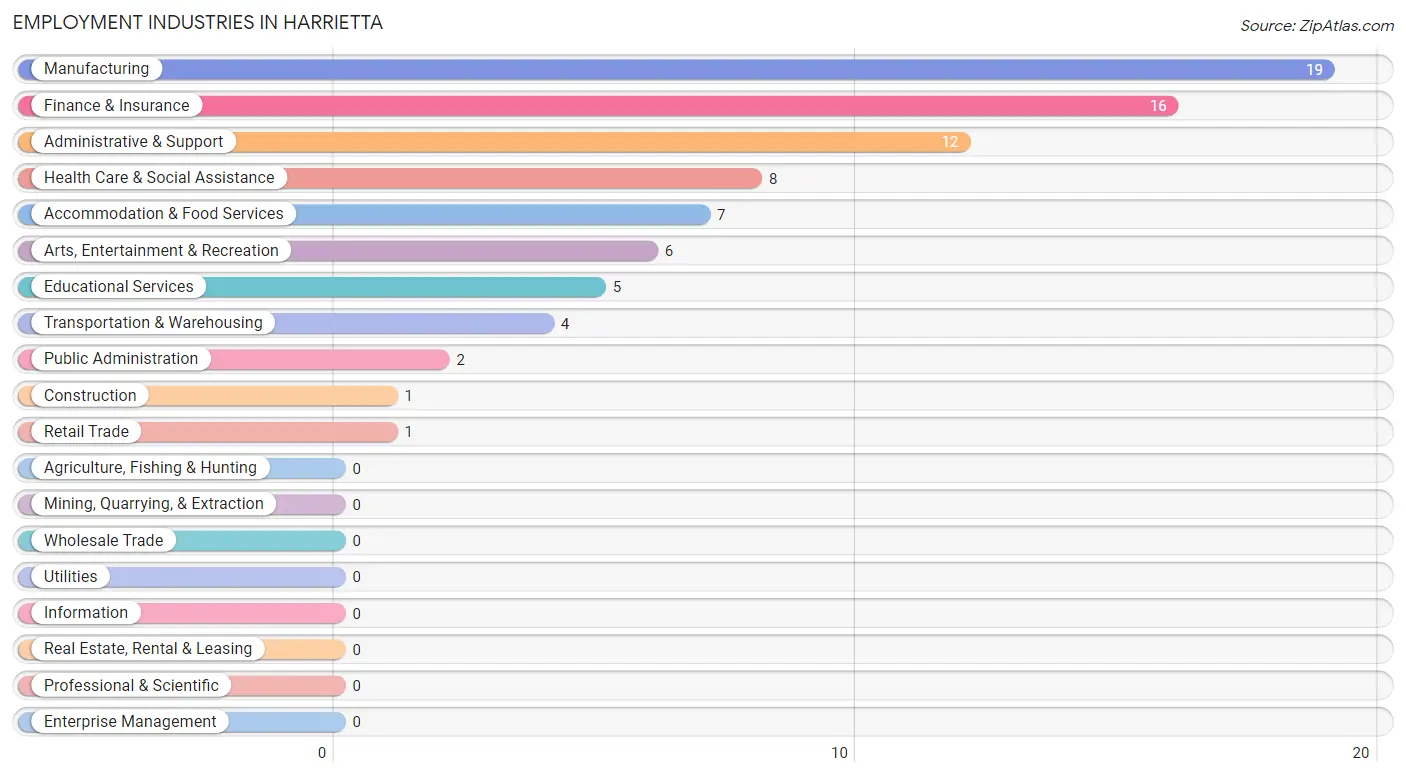
Employment Industries in Harrietta
The major employment industries in Harrietta include Manufacturing (19 | 20.4%), Finance & Insurance (16 | 17.2%), Administrative & Support (12 | 12.9%), Health Care & Social Assistance (8 | 8.6%), and Accommodation & Food Services (7 | 7.5%).
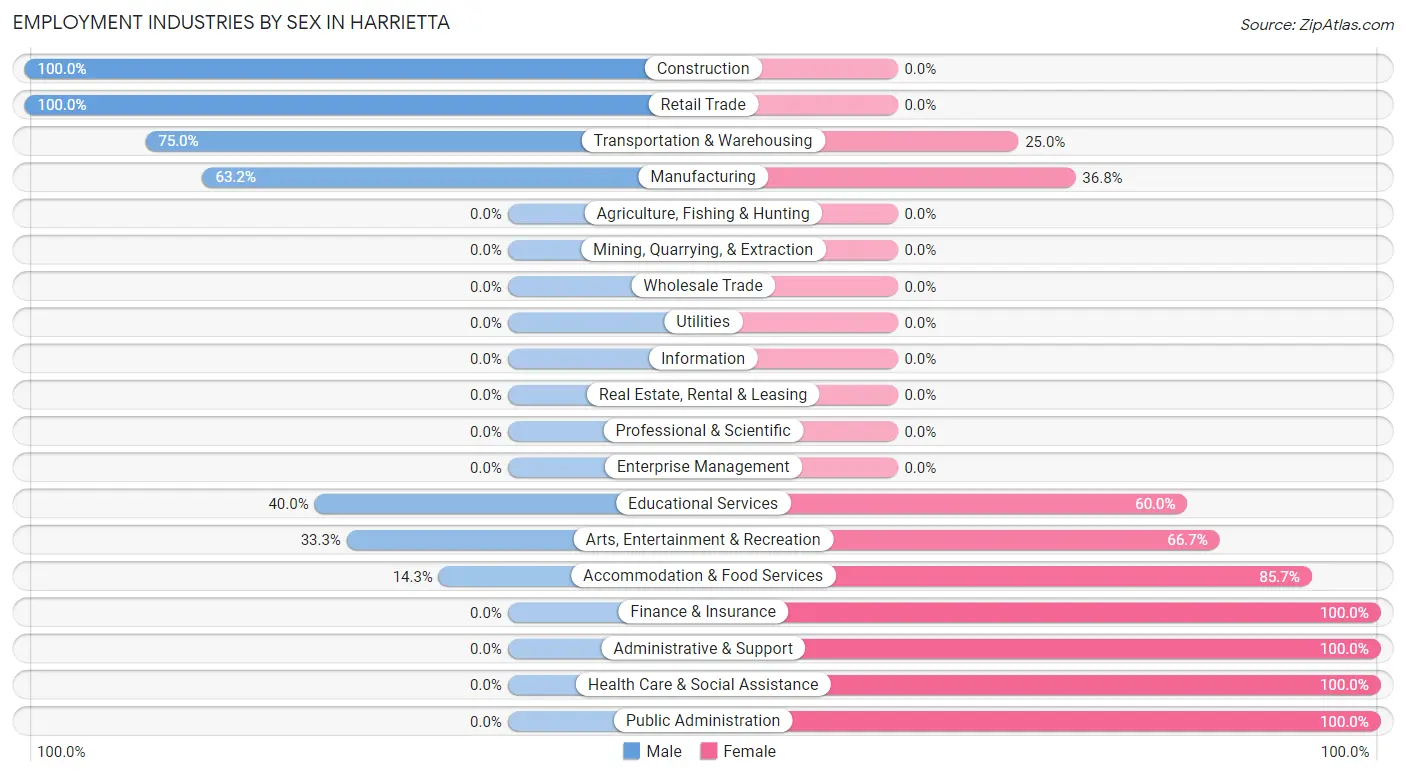
Employment Industries by Sex in Harrietta
The Harrietta industries that see more men than women are Construction (100.0%), Retail Trade (100.0%), and Transportation & Warehousing (75.0%), whereas the industries that tend to have a higher number of women are Finance & Insurance (100.0%), Administrative & Support (100.0%), and Health Care & Social Assistance (100.0%).
| Industry | Male | Female |
| Agriculture, Fishing & Hunting | 0 (0.0%) | 0 (0.0%) |
| Mining, Quarrying, & Extraction | 0 (0.0%) | 0 (0.0%) |
| Construction | 1 (100.0%) | 0 (0.0%) |
| Manufacturing | 12 (63.2%) | 7 (36.8%) |
| Wholesale Trade | 0 (0.0%) | 0 (0.0%) |
| Retail Trade | 1 (100.0%) | 0 (0.0%) |
| Transportation & Warehousing | 3 (75.0%) | 1 (25.0%) |
| Utilities | 0 (0.0%) | 0 (0.0%) |
| Information | 0 (0.0%) | 0 (0.0%) |
| Finance & Insurance | 0 (0.0%) | 16 (100.0%) |
| Real Estate, Rental & Leasing | 0 (0.0%) | 0 (0.0%) |
| Professional & Scientific | 0 (0.0%) | 0 (0.0%) |
| Enterprise Management | 0 (0.0%) | 0 (0.0%) |
| Administrative & Support | 0 (0.0%) | 12 (100.0%) |
| Educational Services | 2 (40.0%) | 3 (60.0%) |
| Health Care & Social Assistance | 0 (0.0%) | 8 (100.0%) |
| Arts, Entertainment & Recreation | 2 (33.3%) | 4 (66.7%) |
| Accommodation & Food Services | 1 (14.3%) | 6 (85.7%) |
| Public Administration | 0 (0.0%) | 2 (100.0%) |
| Total | 34 (36.6%) | 59 (63.4%) |
Education in Harrietta
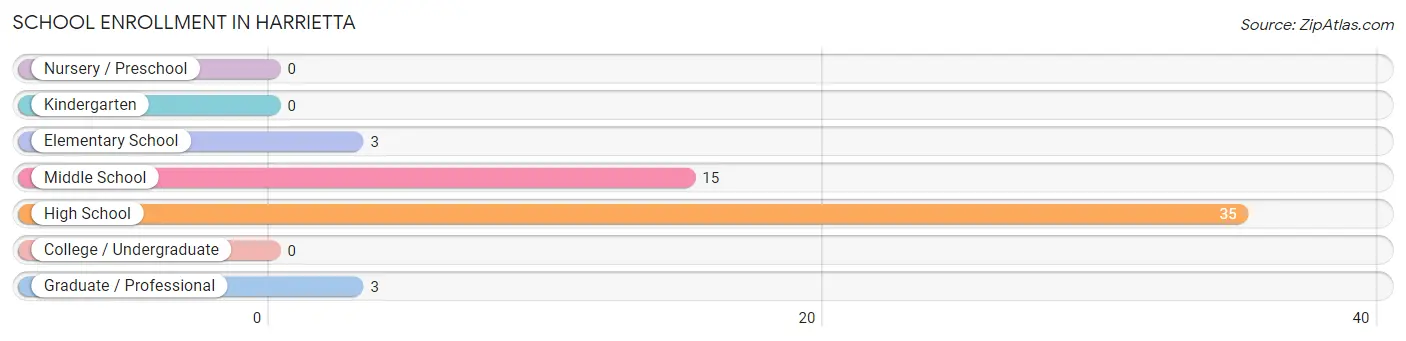
School Enrollment in Harrietta
The most common levels of schooling among the 56 students in Harrietta are high school (35 | 62.5%), middle school (15 | 26.8%), and elementary school (3 | 5.4%).
| School Level | # Students | % Students |
| Nursery / Preschool | 0 | 0.0% |
| Kindergarten | 0 | 0.0% |
| Elementary School | 3 | 5.4% |
| Middle School | 15 | 26.8% |
| High School | 35 | 62.5% |
| College / Undergraduate | 0 | 0.0% |
| Graduate / Professional | 3 | 5.4% |
| Total | 56 | 100.0% |
School Enrollment by Age by Funding Source in Harrietta
Out of a total of 56 students who are enrolled in schools in Harrietta, 16 (28.6%) attend a private institution, while the remaining 40 (71.4%) are enrolled in public schools. The age group of 15 to 17 year olds has the highest likelihood of being enrolled in private schools, with 16 (50.0% in the age bracket) enrolled. Conversely, the age group of 5 to 9 year old has the lowest likelihood of being enrolled in a private school, with 2 (100.0% in the age bracket) attending a public institution.
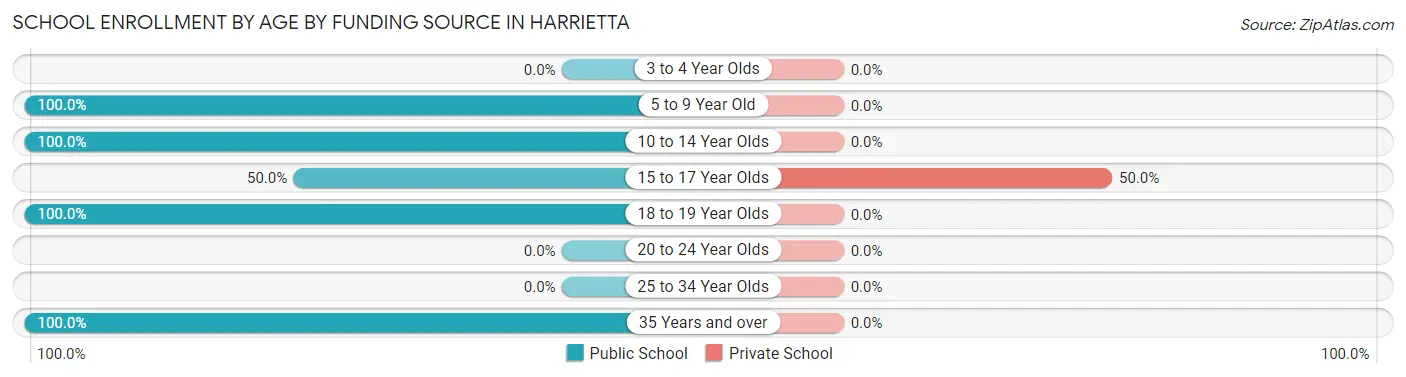
| Age Bracket | Public School | Private School |
| 3 to 4 Year Olds | 0 (0.0%) | 0 (0.0%) |
| 5 to 9 Year Old | 2 (100.0%) | 0 (0.0%) |
| 10 to 14 Year Olds | 16 (100.0%) | 0 (0.0%) |
| 15 to 17 Year Olds | 16 (50.0%) | 16 (50.0%) |
| 18 to 19 Year Olds | 2 (100.0%) | 0 (0.0%) |
| 20 to 24 Year Olds | 0 (0.0%) | 0 (0.0%) |
| 25 to 34 Year Olds | 0 (0.0%) | 0 (0.0%) |
| 35 Years and over | 4 (100.0%) | 0 (0.0%) |
| Total | 40 (71.4%) | 16 (28.6%) |
Educational Attainment by Field of Study in Harrietta
Science & technology (4 | 28.6%), education (3 | 21.4%), bio, nature & agricultural (2 | 14.3%), engineering (2 | 14.3%), and computers & mathematics (1 | 7.1%) are the most common fields of study among 14 individuals in Harrietta who have obtained a bachelor's degree or higher.
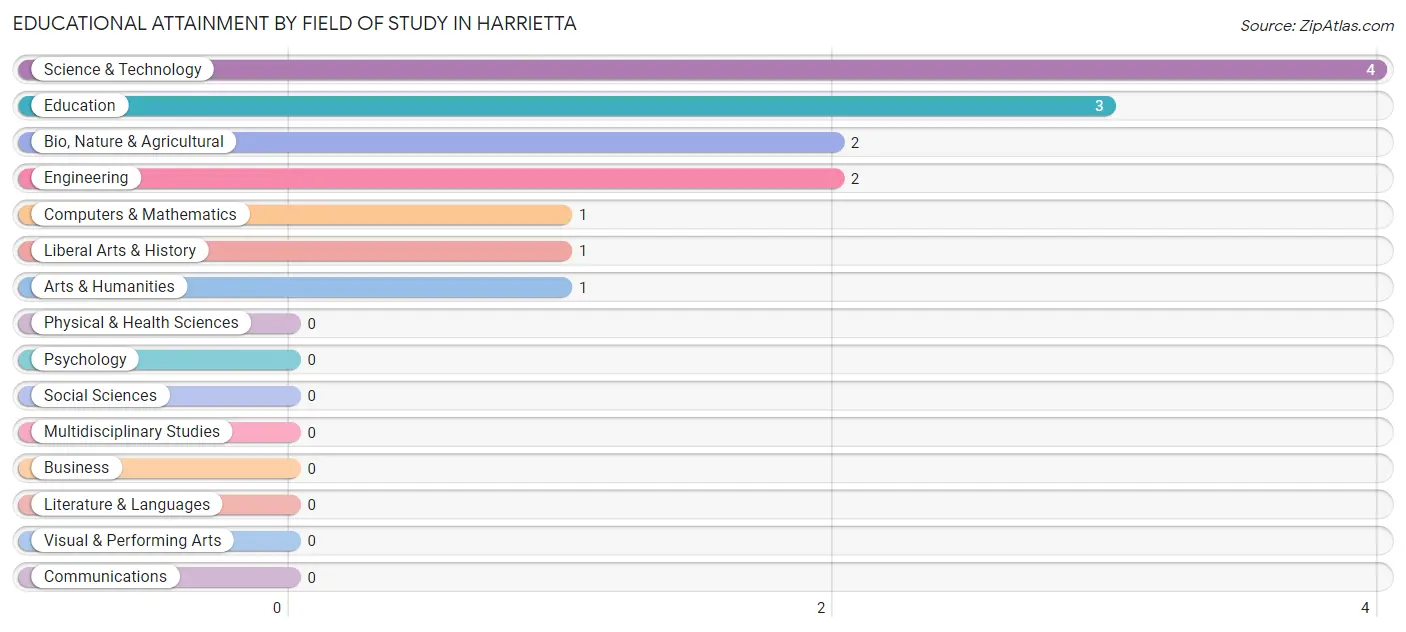
| Field of Study | # Graduates | % Graduates |
| Computers & Mathematics | 1 | 7.1% |
| Bio, Nature & Agricultural | 2 | 14.3% |
| Physical & Health Sciences | 0 | 0.0% |
| Psychology | 0 | 0.0% |
| Social Sciences | 0 | 0.0% |
| Engineering | 2 | 14.3% |
| Multidisciplinary Studies | 0 | 0.0% |
| Science & Technology | 4 | 28.6% |
| Business | 0 | 0.0% |
| Education | 3 | 21.4% |
| Literature & Languages | 0 | 0.0% |
| Liberal Arts & History | 1 | 7.1% |
| Visual & Performing Arts | 0 | 0.0% |
| Communications | 0 | 0.0% |
| Arts & Humanities | 1 | 7.1% |
| Total | 14 | 100.0% |
Transportation & Commute in Harrietta
Vehicle Availability by Sex in Harrietta
The most prevalent vehicle ownership categories in Harrietta are males with 3 vehicles (17, accounting for 54.8%) and females with 3 vehicles (31, making up 30.9%).
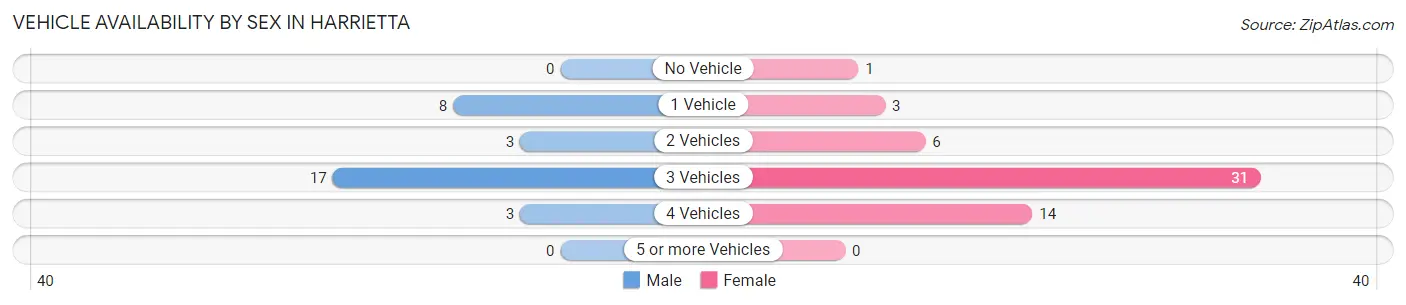
| Vehicles Available | Male | Female |
| No Vehicle | 0 (0.0%) | 1 (1.8%) |
| 1 Vehicle | 8 (25.8%) | 3 (5.4%) |
| 2 Vehicles | 3 (9.7%) | 6 (10.9%) |
| 3 Vehicles | 17 (54.8%) | 31 (56.4%) |
| 4 Vehicles | 3 (9.7%) | 14 (25.5%) |
| 5 or more Vehicles | 0 (0.0%) | 0 (0.0%) |
| Total | 31 (100.0%) | 55 (100.0%) |
Commute Time in Harrietta
The most frequently occuring commute durations in Harrietta are 45 to 59 minutes (17 commuters, 19.8%), 90 or more minutes (16 commuters, 18.6%), and 25 to 29 minutes (13 commuters, 15.1%).
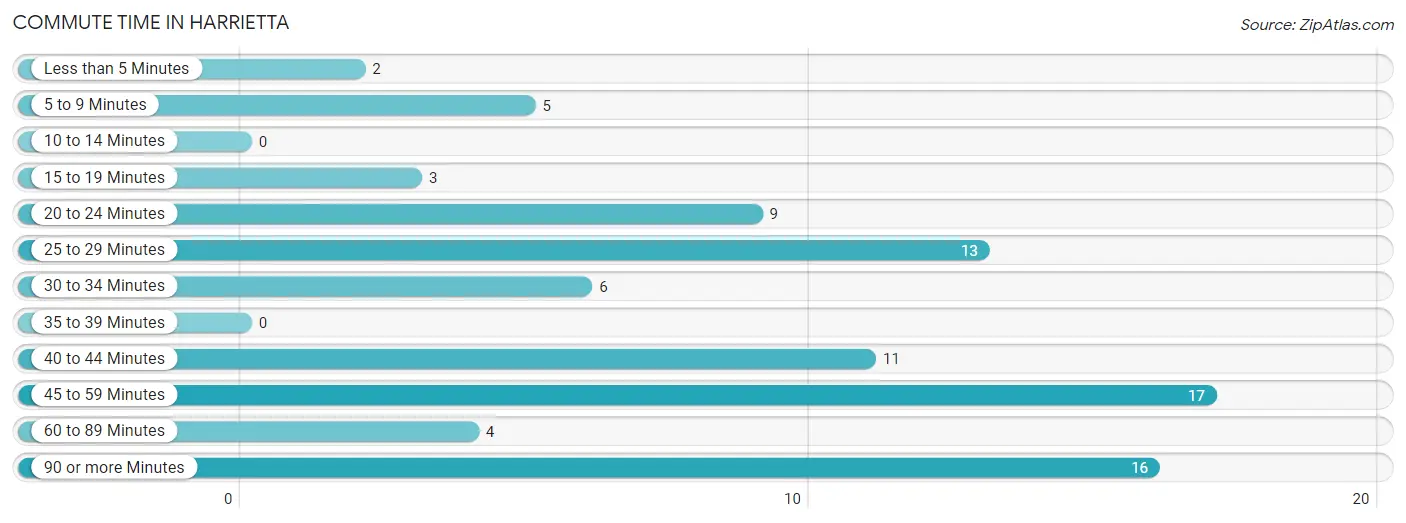
| Commute Time | # Commuters | % Commuters |
| Less than 5 Minutes | 2 | 2.3% |
| 5 to 9 Minutes | 5 | 5.8% |
| 10 to 14 Minutes | 0 | 0.0% |
| 15 to 19 Minutes | 3 | 3.5% |
| 20 to 24 Minutes | 9 | 10.5% |
| 25 to 29 Minutes | 13 | 15.1% |
| 30 to 34 Minutes | 6 | 7.0% |
| 35 to 39 Minutes | 0 | 0.0% |
| 40 to 44 Minutes | 11 | 12.8% |
| 45 to 59 Minutes | 17 | 19.8% |
| 60 to 89 Minutes | 4 | 4.6% |
| 90 or more Minutes | 16 | 18.6% |
Commute Time by Sex in Harrietta
The most common commute times in Harrietta are 25 to 29 minutes (9 commuters, 29.0%) for males and 45 to 59 minutes (16 commuters, 29.1%) for females.
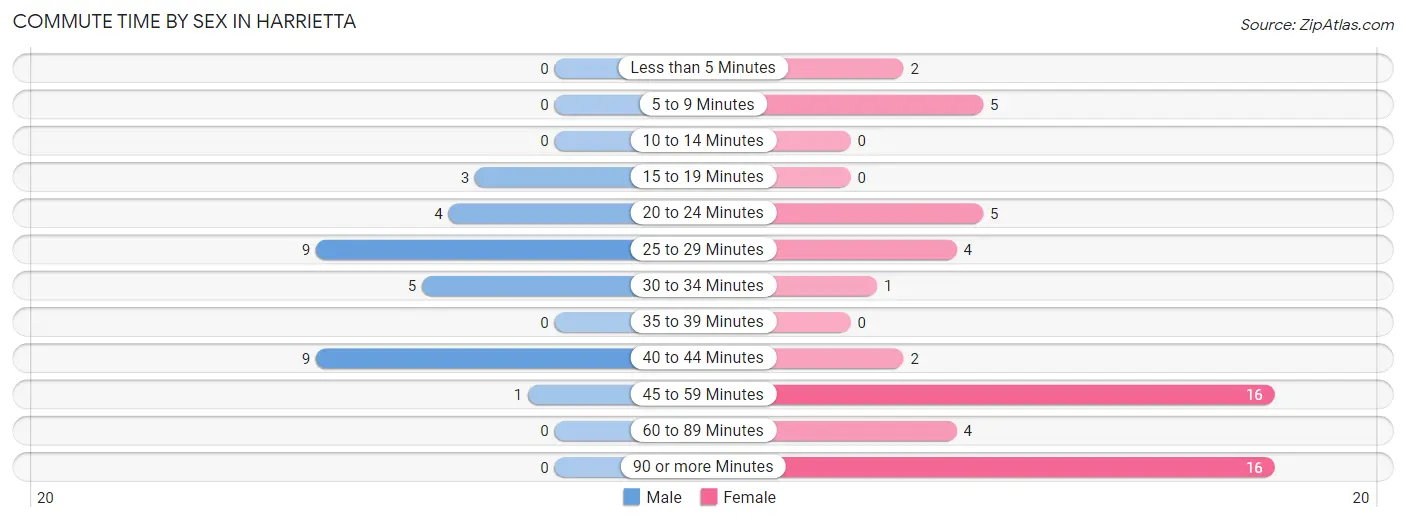
| Commute Time | Male | Female |
| Less than 5 Minutes | 0 (0.0%) | 2 (3.6%) |
| 5 to 9 Minutes | 0 (0.0%) | 5 (9.1%) |
| 10 to 14 Minutes | 0 (0.0%) | 0 (0.0%) |
| 15 to 19 Minutes | 3 (9.7%) | 0 (0.0%) |
| 20 to 24 Minutes | 4 (12.9%) | 5 (9.1%) |
| 25 to 29 Minutes | 9 (29.0%) | 4 (7.3%) |
| 30 to 34 Minutes | 5 (16.1%) | 1 (1.8%) |
| 35 to 39 Minutes | 0 (0.0%) | 0 (0.0%) |
| 40 to 44 Minutes | 9 (29.0%) | 2 (3.6%) |
| 45 to 59 Minutes | 1 (3.2%) | 16 (29.1%) |
| 60 to 89 Minutes | 0 (0.0%) | 4 (7.3%) |
| 90 or more Minutes | 0 (0.0%) | 16 (29.1%) |
Time of Departure to Work by Sex in Harrietta
The most frequent times of departure to work in Harrietta are 6:30 AM to 6:59 AM (16, 51.6%) for males and 12:00 PM to 3:59 PM (19, 34.5%) for females.
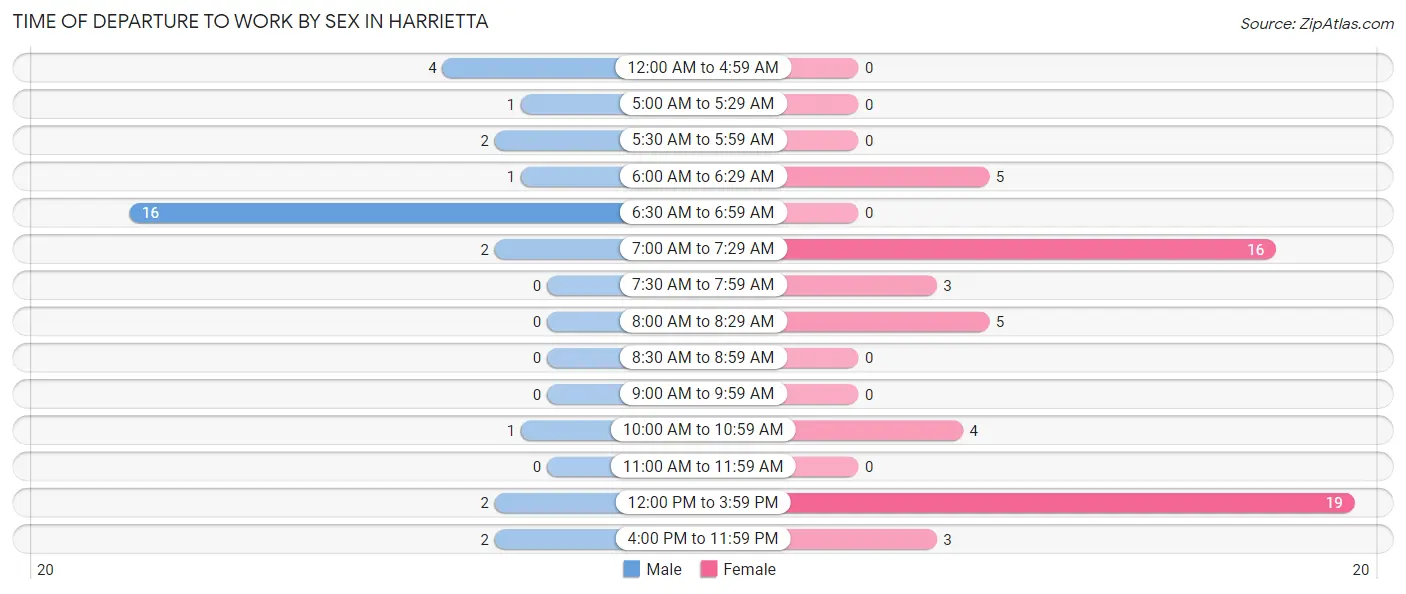
| Time of Departure | Male | Female |
| 12:00 AM to 4:59 AM | 4 (12.9%) | 0 (0.0%) |
| 5:00 AM to 5:29 AM | 1 (3.2%) | 0 (0.0%) |
| 5:30 AM to 5:59 AM | 2 (6.5%) | 0 (0.0%) |
| 6:00 AM to 6:29 AM | 1 (3.2%) | 5 (9.1%) |
| 6:30 AM to 6:59 AM | 16 (51.6%) | 0 (0.0%) |
| 7:00 AM to 7:29 AM | 2 (6.5%) | 16 (29.1%) |
| 7:30 AM to 7:59 AM | 0 (0.0%) | 3 (5.4%) |
| 8:00 AM to 8:29 AM | 0 (0.0%) | 5 (9.1%) |
| 8:30 AM to 8:59 AM | 0 (0.0%) | 0 (0.0%) |
| 9:00 AM to 9:59 AM | 0 (0.0%) | 0 (0.0%) |
| 10:00 AM to 10:59 AM | 1 (3.2%) | 4 (7.3%) |
| 11:00 AM to 11:59 AM | 0 (0.0%) | 0 (0.0%) |
| 12:00 PM to 3:59 PM | 2 (6.5%) | 19 (34.5%) |
| 4:00 PM to 11:59 PM | 2 (6.5%) | 3 (5.4%) |
| Total | 31 (100.0%) | 55 (100.0%) |
Housing Occupancy in Harrietta
Occupancy by Ownership in Harrietta
Of the total 82 dwellings in Harrietta, owner-occupied units account for 61 (74.4%), while renter-occupied units make up 21 (25.6%).
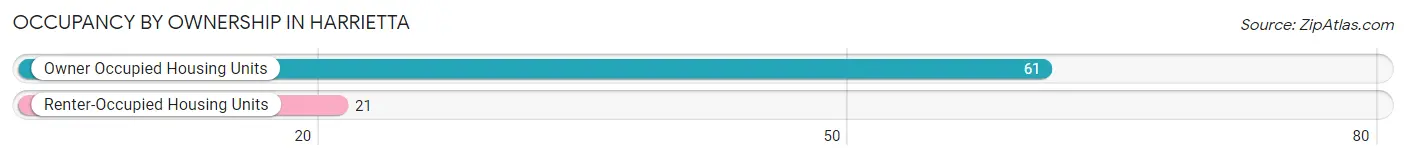
| Occupancy | # Housing Units | % Housing Units |
| Owner Occupied Housing Units | 61 | 74.4% |
| Renter-Occupied Housing Units | 21 | 25.6% |
| Total Occupied Housing Units | 82 | 100.0% |
Occupancy by Household Size in Harrietta

| Household Size | # Housing Units | % Housing Units |
| 1-Person Household | 29 | 35.4% |
| 2-Person Household | 22 | 26.8% |
| 3-Person Household | 4 | 4.9% |
| 4+ Person Household | 27 | 32.9% |
| Total Housing Units | 82 | 100.0% |
Occupancy by Ownership by Household Size in Harrietta
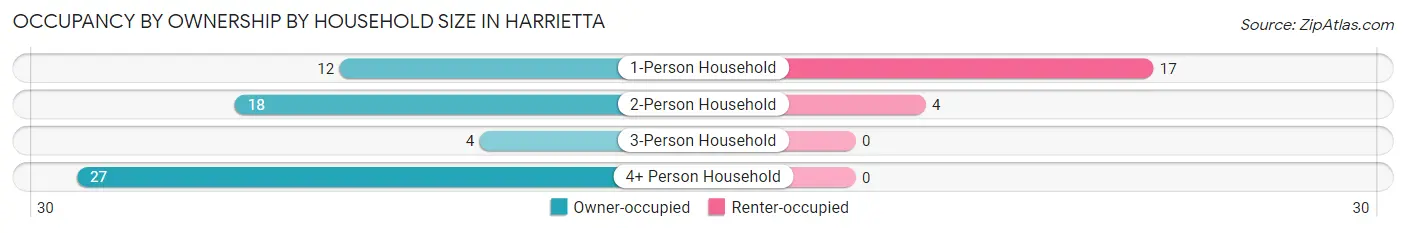
| Household Size | Owner-occupied | Renter-occupied |
| 1-Person Household | 12 (41.4%) | 17 (58.6%) |
| 2-Person Household | 18 (81.8%) | 4 (18.2%) |
| 3-Person Household | 4 (100.0%) | 0 (0.0%) |
| 4+ Person Household | 27 (100.0%) | 0 (0.0%) |
| Total Housing Units | 61 (74.4%) | 21 (25.6%) |
Occupancy by Educational Attainment in Harrietta
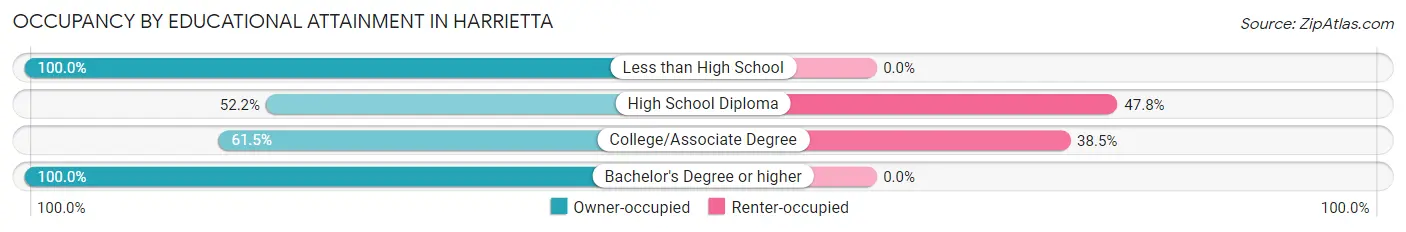
| Household Size | Owner-occupied | Renter-occupied |
| Less than High School | 26 (100.0%) | 0 (0.0%) |
| High School Diploma | 12 (52.2%) | 11 (47.8%) |
| College/Associate Degree | 16 (61.5%) | 10 (38.5%) |
| Bachelor's Degree or higher | 7 (100.0%) | 0 (0.0%) |
Occupancy by Age of Householder in Harrietta
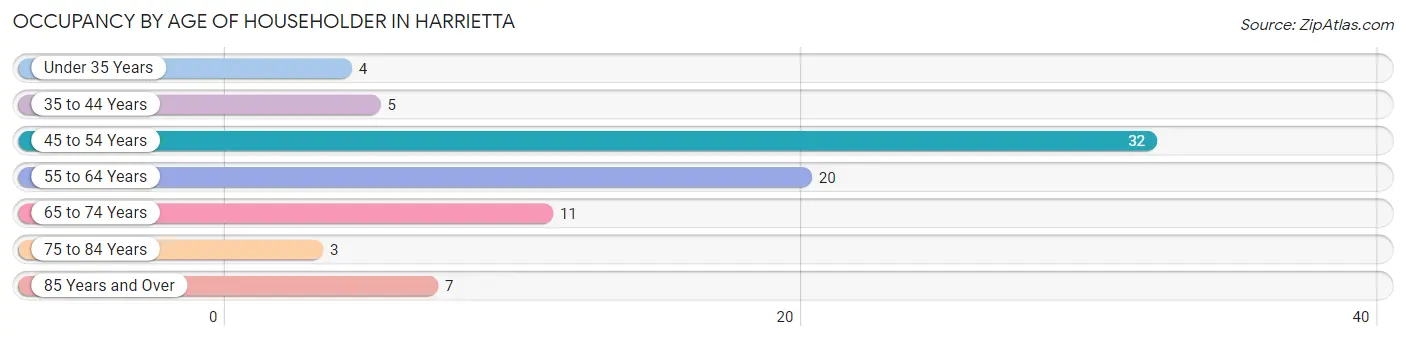
| Age Bracket | # Households | % Households |
| Under 35 Years | 4 | 4.9% |
| 35 to 44 Years | 5 | 6.1% |
| 45 to 54 Years | 32 | 39.0% |
| 55 to 64 Years | 20 | 24.4% |
| 65 to 74 Years | 11 | 13.4% |
| 75 to 84 Years | 3 | 3.7% |
| 85 Years and Over | 7 | 8.5% |
| Total | 82 | 100.0% |
Housing Finances in Harrietta
Median Income by Occupancy in Harrietta
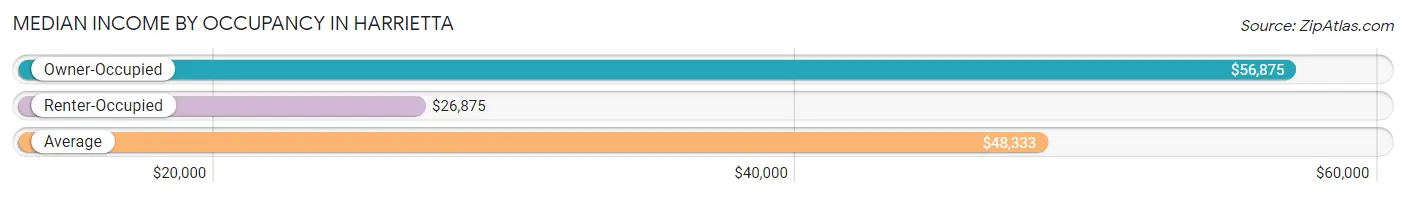
| Occupancy Type | # Households | Median Income |
| Owner-Occupied | 61 (74.4%) | $56,875 |
| Renter-Occupied | 21 (25.6%) | $26,875 |
| Average | 82 (100.0%) | $48,333 |
Occupancy by Householder Income Bracket in Harrietta
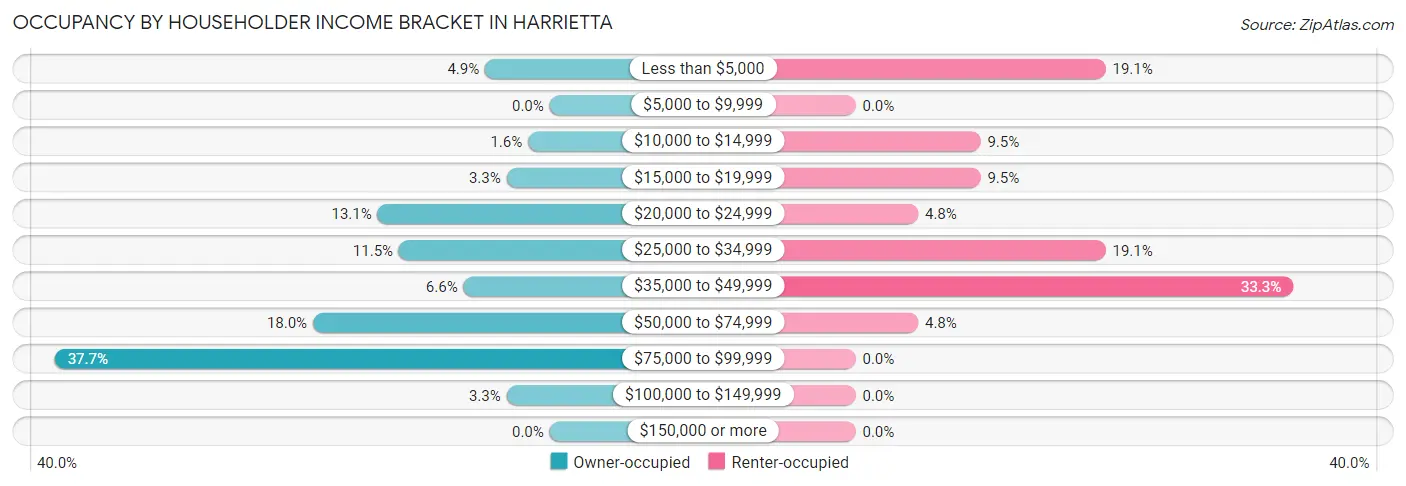
| Income Bracket | Owner-occupied | Renter-occupied |
| Less than $5,000 | 3 (4.9%) | 4 (19.1%) |
| $5,000 to $9,999 | 0 (0.0%) | 0 (0.0%) |
| $10,000 to $14,999 | 1 (1.6%) | 2 (9.5%) |
| $15,000 to $19,999 | 2 (3.3%) | 2 (9.5%) |
| $20,000 to $24,999 | 8 (13.1%) | 1 (4.8%) |
| $25,000 to $34,999 | 7 (11.5%) | 4 (19.1%) |
| $35,000 to $49,999 | 4 (6.6%) | 7 (33.3%) |
| $50,000 to $74,999 | 11 (18.0%) | 1 (4.8%) |
| $75,000 to $99,999 | 23 (37.7%) | 0 (0.0%) |
| $100,000 to $149,999 | 2 (3.3%) | 0 (0.0%) |
| $150,000 or more | 0 (0.0%) | 0 (0.0%) |
| Total | 61 (100.0%) | 21 (100.0%) |
Monthly Housing Cost Tiers in Harrietta
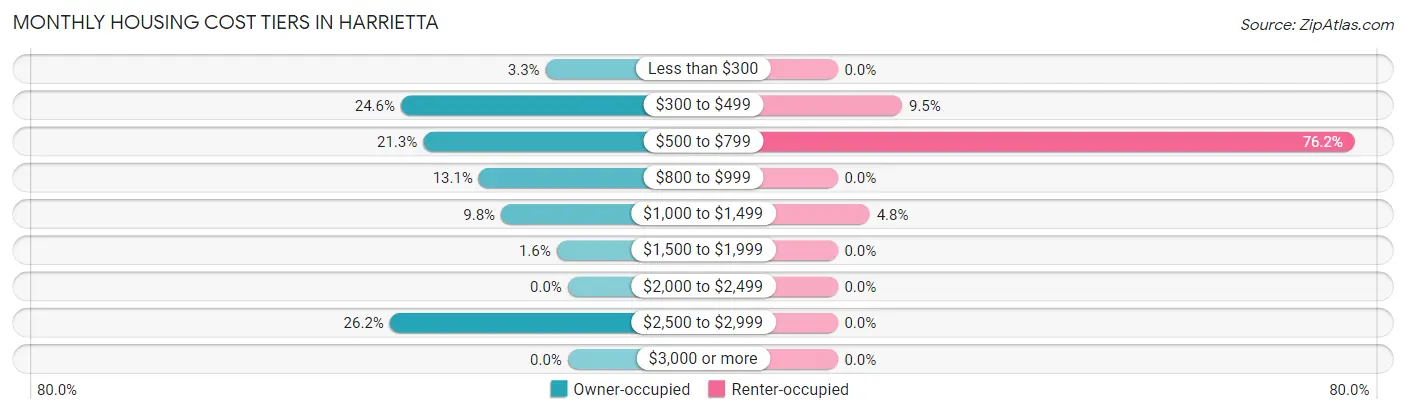
| Monthly Cost | Owner-occupied | Renter-occupied |
| Less than $300 | 2 (3.3%) | 0 (0.0%) |
| $300 to $499 | 15 (24.6%) | 2 (9.5%) |
| $500 to $799 | 13 (21.3%) | 16 (76.2%) |
| $800 to $999 | 8 (13.1%) | 0 (0.0%) |
| $1,000 to $1,499 | 6 (9.8%) | 1 (4.8%) |
| $1,500 to $1,999 | 1 (1.6%) | 0 (0.0%) |
| $2,000 to $2,499 | 0 (0.0%) | 0 (0.0%) |
| $2,500 to $2,999 | 16 (26.2%) | 0 (0.0%) |
| $3,000 or more | 0 (0.0%) | 0 (0.0%) |
| Total | 61 (100.0%) | 21 (100.0%) |
Physical Housing Characteristics in Harrietta
Housing Structures in Harrietta
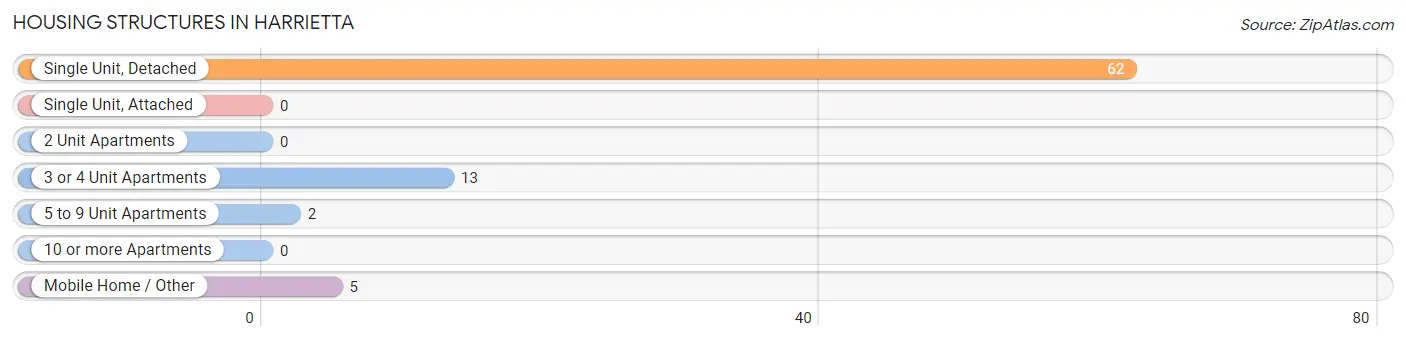
| Structure Type | # Housing Units | % Housing Units |
| Single Unit, Detached | 62 | 75.6% |
| Single Unit, Attached | 0 | 0.0% |
| 2 Unit Apartments | 0 | 0.0% |
| 3 or 4 Unit Apartments | 13 | 15.9% |
| 5 to 9 Unit Apartments | 2 | 2.4% |
| 10 or more Apartments | 0 | 0.0% |
| Mobile Home / Other | 5 | 6.1% |
| Total | 82 | 100.0% |
Housing Structures by Occupancy in Harrietta
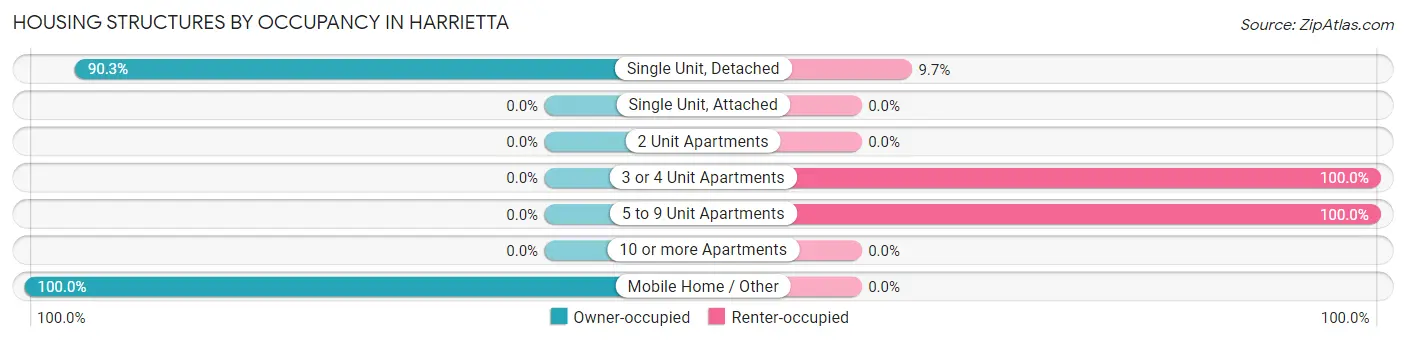
| Structure Type | Owner-occupied | Renter-occupied |
| Single Unit, Detached | 56 (90.3%) | 6 (9.7%) |
| Single Unit, Attached | 0 (0.0%) | 0 (0.0%) |
| 2 Unit Apartments | 0 (0.0%) | 0 (0.0%) |
| 3 or 4 Unit Apartments | 0 (0.0%) | 13 (100.0%) |
| 5 to 9 Unit Apartments | 0 (0.0%) | 2 (100.0%) |
| 10 or more Apartments | 0 (0.0%) | 0 (0.0%) |
| Mobile Home / Other | 5 (100.0%) | 0 (0.0%) |
| Total | 61 (74.4%) | 21 (25.6%) |
Housing Structures by Number of Rooms in Harrietta
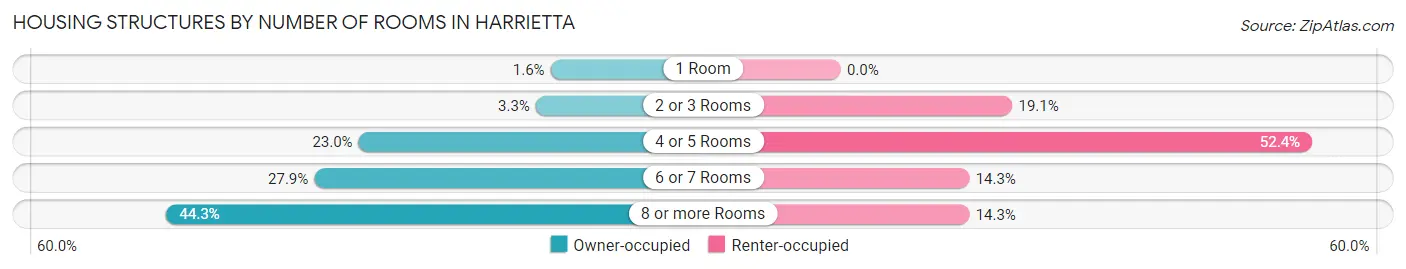
| Number of Rooms | Owner-occupied | Renter-occupied |
| 1 Room | 1 (1.6%) | 0 (0.0%) |
| 2 or 3 Rooms | 2 (3.3%) | 4 (19.1%) |
| 4 or 5 Rooms | 14 (23.0%) | 11 (52.4%) |
| 6 or 7 Rooms | 17 (27.9%) | 3 (14.3%) |
| 8 or more Rooms | 27 (44.3%) | 3 (14.3%) |
| Total | 61 (100.0%) | 21 (100.0%) |
Housing Structure by Heating Type in Harrietta
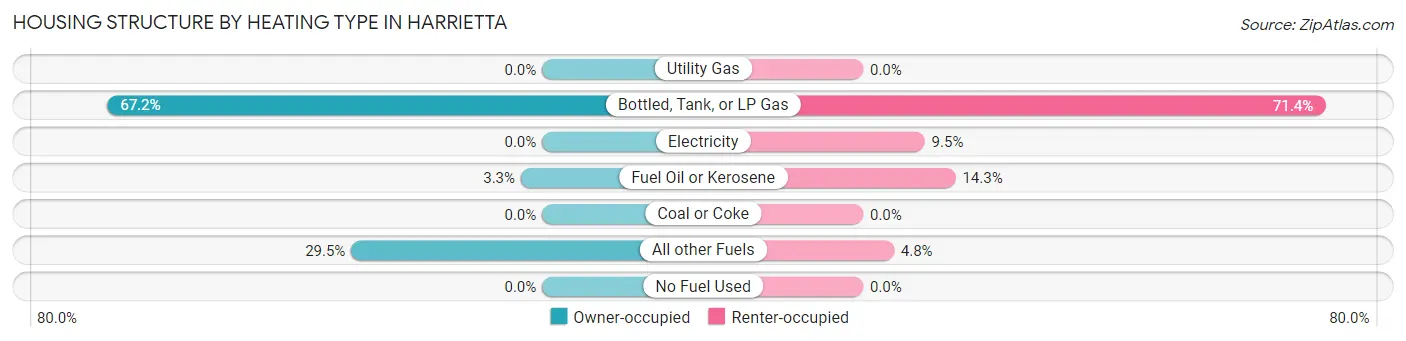
| Heating Type | Owner-occupied | Renter-occupied |
| Utility Gas | 0 (0.0%) | 0 (0.0%) |
| Bottled, Tank, or LP Gas | 41 (67.2%) | 15 (71.4%) |
| Electricity | 0 (0.0%) | 2 (9.5%) |
| Fuel Oil or Kerosene | 2 (3.3%) | 3 (14.3%) |
| Coal or Coke | 0 (0.0%) | 0 (0.0%) |
| All other Fuels | 18 (29.5%) | 1 (4.8%) |
| No Fuel Used | 0 (0.0%) | 0 (0.0%) |
| Total | 61 (100.0%) | 21 (100.0%) |
Household Vehicle Usage in Harrietta
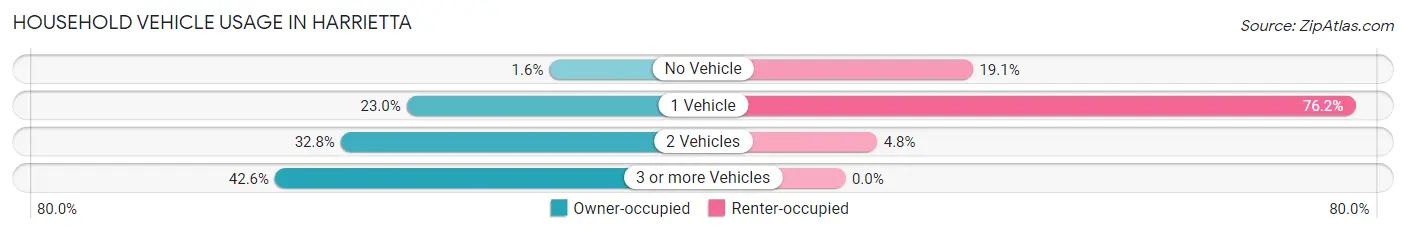
| Vehicles per Household | Owner-occupied | Renter-occupied |
| No Vehicle | 1 (1.6%) | 4 (19.1%) |
| 1 Vehicle | 14 (23.0%) | 16 (76.2%) |
| 2 Vehicles | 20 (32.8%) | 1 (4.8%) |
| 3 or more Vehicles | 26 (42.6%) | 0 (0.0%) |
| Total | 61 (100.0%) | 21 (100.0%) |
Real Estate & Mortgages in Harrietta
Real Estate and Mortgage Overview in Harrietta
| Characteristic | Without Mortgage | With Mortgage |
| Housing Units | 30 | 31 |
| Median Property Value | $72,900 | $0 |
| Median Household Income | $33,125 | $0 |
| Monthly Housing Costs | $471 | $0 |
| Real Estate Taxes | $1,111 | $0 |
Property Value by Mortgage Status in Harrietta
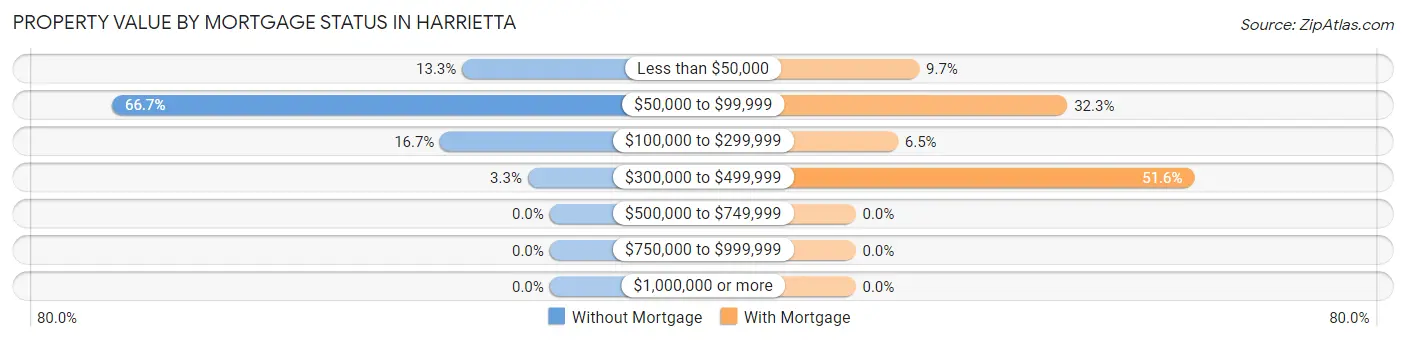
| Property Value | Without Mortgage | With Mortgage |
| Less than $50,000 | 4 (13.3%) | 3 (9.7%) |
| $50,000 to $99,999 | 20 (66.7%) | 10 (32.3%) |
| $100,000 to $299,999 | 5 (16.7%) | 2 (6.5%) |
| $300,000 to $499,999 | 1 (3.3%) | 16 (51.6%) |
| $500,000 to $749,999 | 0 (0.0%) | 0 (0.0%) |
| $750,000 to $999,999 | 0 (0.0%) | 0 (0.0%) |
| $1,000,000 or more | 0 (0.0%) | 0 (0.0%) |
| Total | 30 (100.0%) | 31 (100.0%) |
Household Income by Mortgage Status in Harrietta
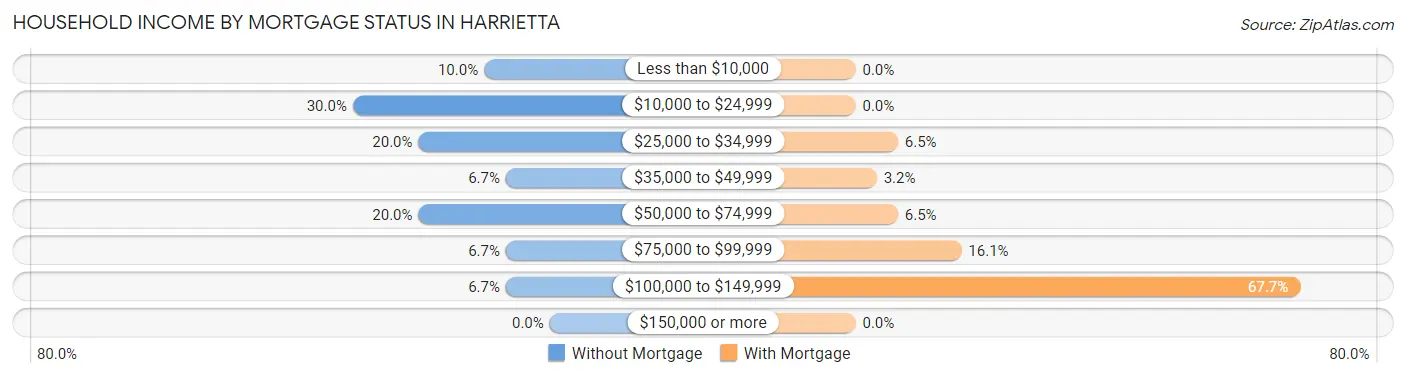
| Household Income | Without Mortgage | With Mortgage |
| Less than $10,000 | 3 (10.0%) | 0 (0.0%) |
| $10,000 to $24,999 | 9 (30.0%) | 0 (0.0%) |
| $25,000 to $34,999 | 6 (20.0%) | 2 (6.5%) |
| $35,000 to $49,999 | 2 (6.7%) | 1 (3.2%) |
| $50,000 to $74,999 | 6 (20.0%) | 2 (6.5%) |
| $75,000 to $99,999 | 2 (6.7%) | 5 (16.1%) |
| $100,000 to $149,999 | 2 (6.7%) | 21 (67.7%) |
| $150,000 or more | 0 (0.0%) | 0 (0.0%) |
| Total | 30 (100.0%) | 31 (100.0%) |
Property Value to Household Income Ratio in Harrietta
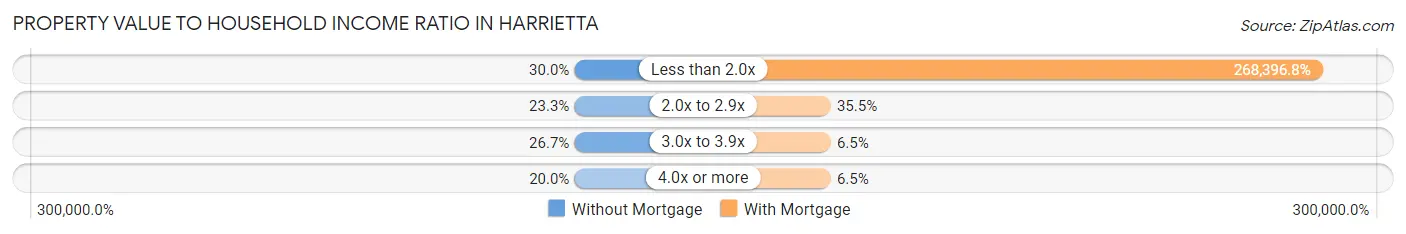
| Value-to-Income Ratio | Without Mortgage | With Mortgage |
| Less than 2.0x | 9 (30.0%) | 83,203 (268,396.8%) |
| 2.0x to 2.9x | 7 (23.3%) | 11 (35.5%) |
| 3.0x to 3.9x | 8 (26.7%) | 2 (6.5%) |
| 4.0x or more | 6 (20.0%) | 2 (6.5%) |
| Total | 30 (100.0%) | 31 (100.0%) |
Real Estate Taxes by Mortgage Status in Harrietta
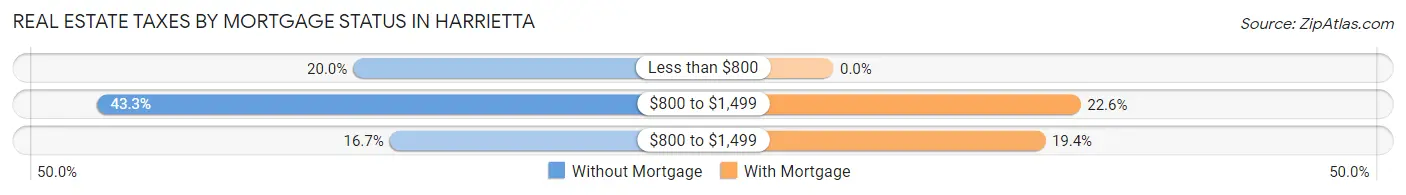
| Property Taxes | Without Mortgage | With Mortgage |
| Less than $800 | 6 (20.0%) | 0 (0.0%) |
| $800 to $1,499 | 13 (43.3%) | 7 (22.6%) |
| $800 to $1,499 | 5 (16.7%) | 6 (19.4%) |
| Total | 30 (100.0%) | 31 (100.0%) |
Health & Disability in Harrietta
Health Insurance Coverage by Age in Harrietta
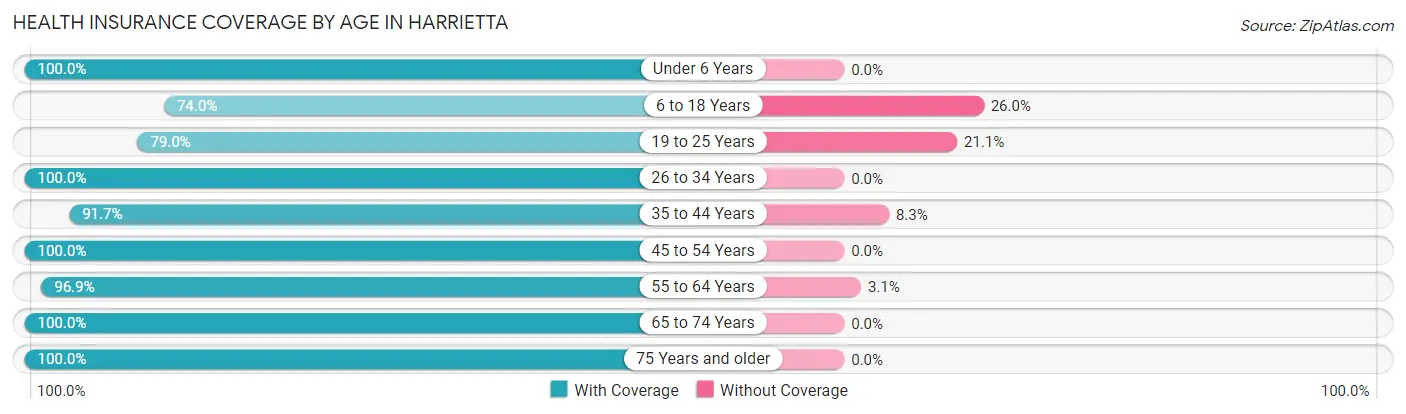
| Age Bracket | With Coverage | Without Coverage |
| Under 6 Years | 5 (100.0%) | 0 (0.0%) |
| 6 to 18 Years | 37 (74.0%) | 13 (26.0%) |
| 19 to 25 Years | 15 (78.9%) | 4 (21.0%) |
| 26 to 34 Years | 4 (100.0%) | 0 (0.0%) |
| 35 to 44 Years | 11 (91.7%) | 1 (8.3%) |
| 45 to 54 Years | 52 (100.0%) | 0 (0.0%) |
| 55 to 64 Years | 31 (96.9%) | 1 (3.1%) |
| 65 to 74 Years | 24 (100.0%) | 0 (0.0%) |
| 75 Years and older | 12 (100.0%) | 0 (0.0%) |
| Total | 191 (90.9%) | 19 (9.0%) |
Health Insurance Coverage by Citizenship Status in Harrietta
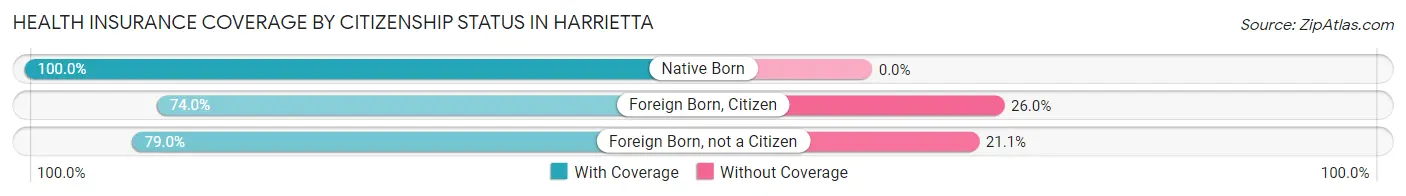
| Citizenship Status | With Coverage | Without Coverage |
| Native Born | 5 (100.0%) | 0 (0.0%) |
| Foreign Born, Citizen | 37 (74.0%) | 13 (26.0%) |
| Foreign Born, not a Citizen | 15 (78.9%) | 4 (21.0%) |
Health Insurance Coverage by Household Income in Harrietta
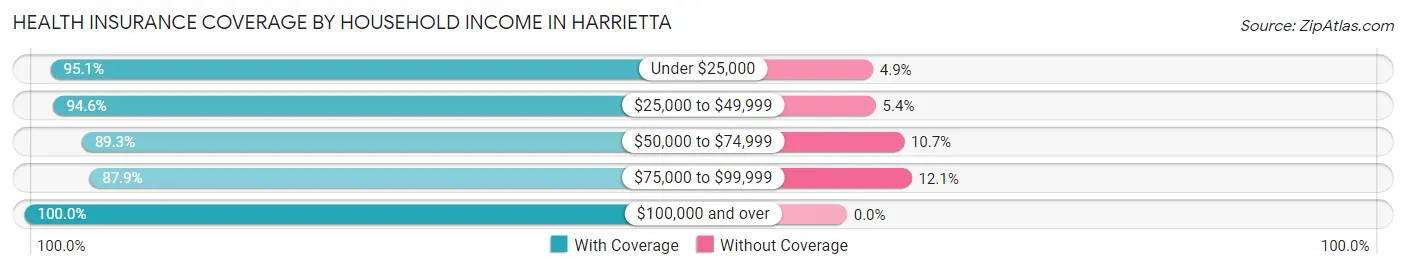
| Household Income | With Coverage | Without Coverage |
| Under $25,000 | 39 (95.1%) | 2 (4.9%) |
| $25,000 to $49,999 | 35 (94.6%) | 2 (5.4%) |
| $50,000 to $74,999 | 25 (89.3%) | 3 (10.7%) |
| $75,000 to $99,999 | 87 (87.9%) | 12 (12.1%) |
| $100,000 and over | 5 (100.0%) | 0 (0.0%) |
Public vs Private Health Insurance Coverage by Age in Harrietta
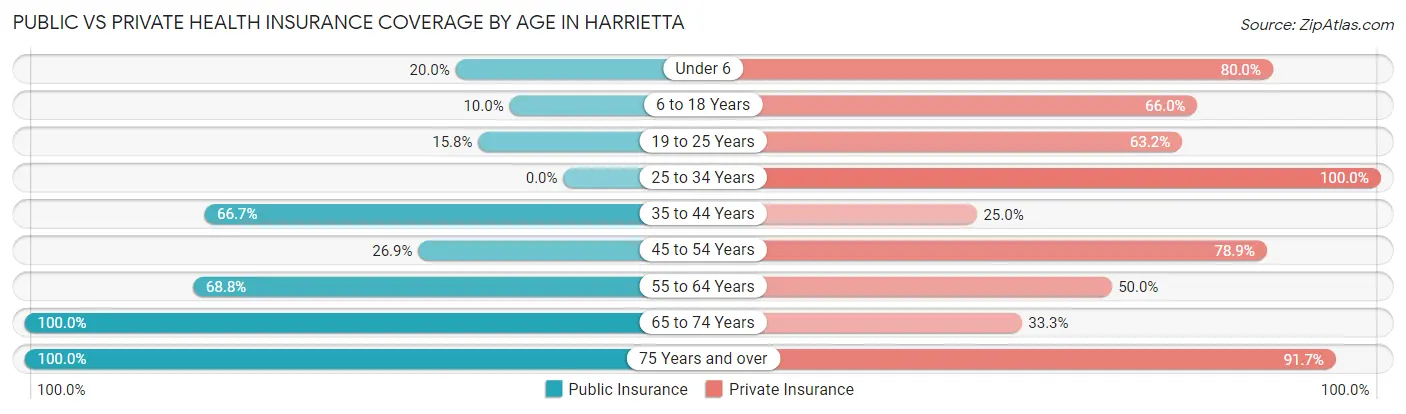
| Age Bracket | Public Insurance | Private Insurance |
| Under 6 | 1 (20.0%) | 4 (80.0%) |
| 6 to 18 Years | 5 (10.0%) | 33 (66.0%) |
| 19 to 25 Years | 3 (15.8%) | 12 (63.2%) |
| 25 to 34 Years | 0 (0.0%) | 4 (100.0%) |
| 35 to 44 Years | 8 (66.7%) | 3 (25.0%) |
| 45 to 54 Years | 14 (26.9%) | 41 (78.8%) |
| 55 to 64 Years | 22 (68.8%) | 16 (50.0%) |
| 65 to 74 Years | 24 (100.0%) | 8 (33.3%) |
| 75 Years and over | 12 (100.0%) | 11 (91.7%) |
| Total | 89 (42.4%) | 132 (62.9%) |
Disability Status by Sex by Age in Harrietta
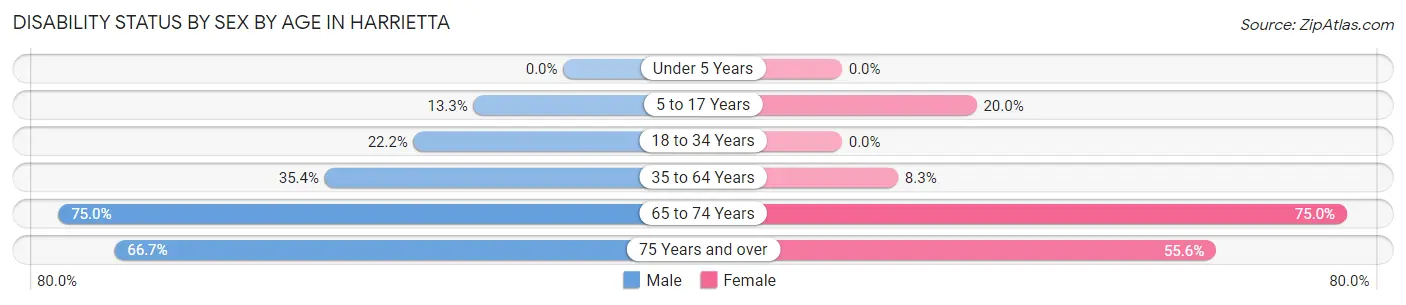
| Age Bracket | Male | Female |
| Under 5 Years | 0 (0.0%) | 0 (0.0%) |
| 5 to 17 Years | 4 (13.3%) | 4 (20.0%) |
| 18 to 34 Years | 2 (22.2%) | 0 (0.0%) |
| 35 to 64 Years | 17 (35.4%) | 4 (8.3%) |
| 65 to 74 Years | 9 (75.0%) | 9 (75.0%) |
| 75 Years and over | 2 (66.7%) | 5 (55.6%) |
Disability Class by Sex by Age in Harrietta
Disability Class: Hearing Difficulty
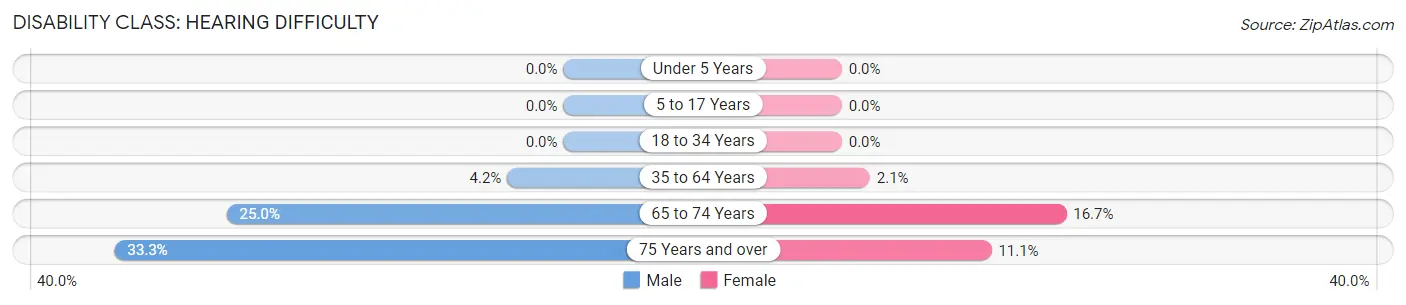
| Age Bracket | Male | Female |
| Under 5 Years | 0 (0.0%) | 0 (0.0%) |
| 5 to 17 Years | 0 (0.0%) | 0 (0.0%) |
| 18 to 34 Years | 0 (0.0%) | 0 (0.0%) |
| 35 to 64 Years | 2 (4.2%) | 1 (2.1%) |
| 65 to 74 Years | 3 (25.0%) | 2 (16.7%) |
| 75 Years and over | 1 (33.3%) | 1 (11.1%) |
Disability Class: Vision Difficulty
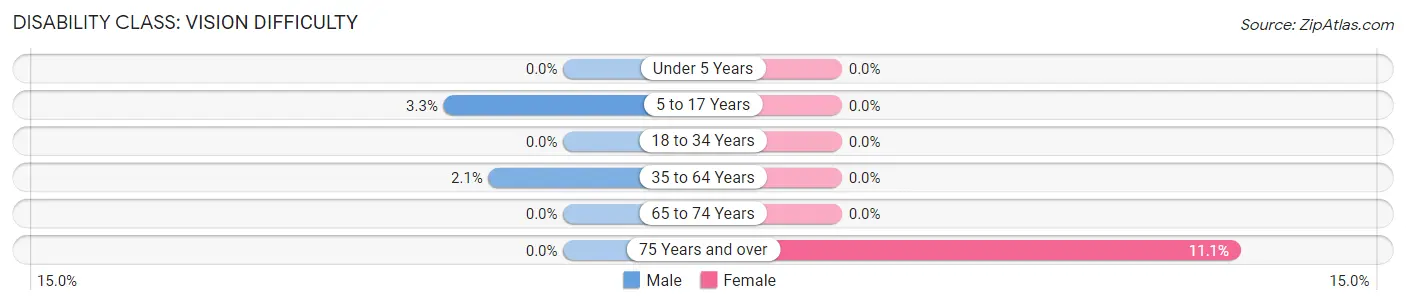
| Age Bracket | Male | Female |
| Under 5 Years | 0 (0.0%) | 0 (0.0%) |
| 5 to 17 Years | 1 (3.3%) | 0 (0.0%) |
| 18 to 34 Years | 0 (0.0%) | 0 (0.0%) |
| 35 to 64 Years | 1 (2.1%) | 0 (0.0%) |
| 65 to 74 Years | 0 (0.0%) | 0 (0.0%) |
| 75 Years and over | 0 (0.0%) | 1 (11.1%) |
Disability Class: Cognitive Difficulty
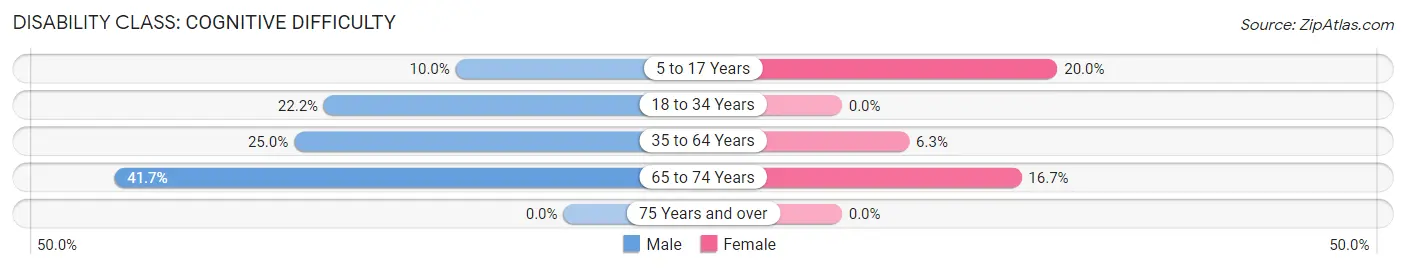
| Age Bracket | Male | Female |
| 5 to 17 Years | 3 (10.0%) | 4 (20.0%) |
| 18 to 34 Years | 2 (22.2%) | 0 (0.0%) |
| 35 to 64 Years | 12 (25.0%) | 3 (6.2%) |
| 65 to 74 Years | 5 (41.7%) | 2 (16.7%) |
| 75 Years and over | 0 (0.0%) | 0 (0.0%) |
Disability Class: Ambulatory Difficulty
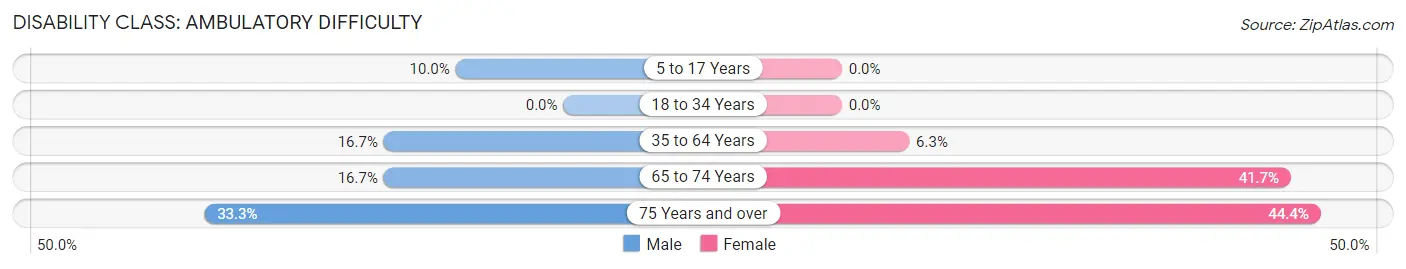
| Age Bracket | Male | Female |
| 5 to 17 Years | 3 (10.0%) | 0 (0.0%) |
| 18 to 34 Years | 0 (0.0%) | 0 (0.0%) |
| 35 to 64 Years | 8 (16.7%) | 3 (6.2%) |
| 65 to 74 Years | 2 (16.7%) | 5 (41.7%) |
| 75 Years and over | 1 (33.3%) | 4 (44.4%) |
Disability Class: Self-Care Difficulty
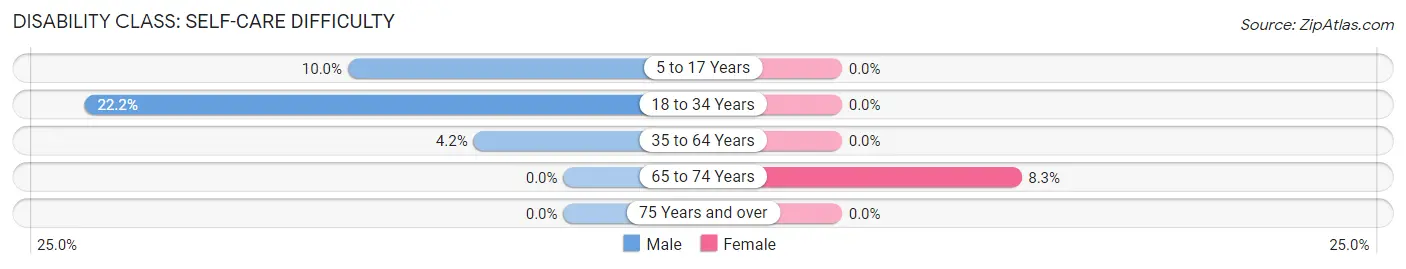
| Age Bracket | Male | Female |
| 5 to 17 Years | 3 (10.0%) | 0 (0.0%) |
| 18 to 34 Years | 2 (22.2%) | 0 (0.0%) |
| 35 to 64 Years | 2 (4.2%) | 0 (0.0%) |
| 65 to 74 Years | 0 (0.0%) | 1 (8.3%) |
| 75 Years and over | 0 (0.0%) | 0 (0.0%) |
Technology Access in Harrietta
Computing Device Access in Harrietta
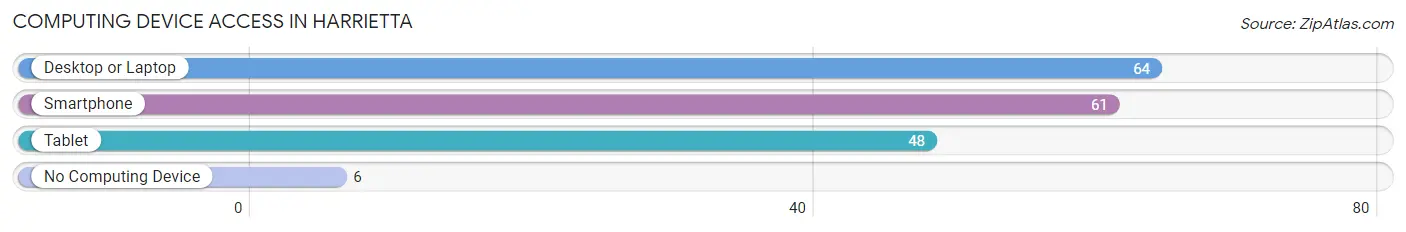
| Device Type | # Households | % Households |
| Desktop or Laptop | 64 | 78.0% |
| Smartphone | 61 | 74.4% |
| Tablet | 48 | 58.5% |
| No Computing Device | 6 | 7.3% |
| Total | 82 | 100.0% |
Internet Access in Harrietta
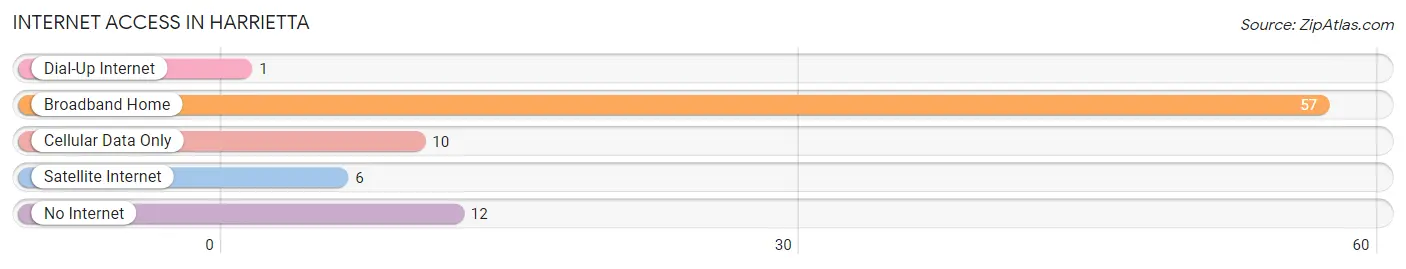
| Internet Type | # Households | % Households |
| Dial-Up Internet | 1 | 1.2% |
| Broadband Home | 57 | 69.5% |
| Cellular Data Only | 10 | 12.2% |
| Satellite Internet | 6 | 7.3% |
| No Internet | 12 | 14.6% |
| Total | 82 | 100.0% |
Harrietta Summary
Harrietta, Michigan is a small village located in the northern part of the state, in the county of Wexford. It is situated on the banks of the Manistee River, and is surrounded by the Manistee National Forest. The village has a population of just over 500 people, and is a popular destination for outdoor recreation.
History
Harrietta was first settled in 1871 by a group of settlers from Ohio. The village was named after the wife of one of the settlers, Harriet. The settlers were attracted to the area due to its abundance of natural resources, including timber and fish. The village quickly grew, and by the early 1900s, it had become a thriving lumber town. The village was home to several sawmills, and the lumber industry was the main source of income for the residents.
In the 1920s, the lumber industry began to decline, and the village began to suffer economically. In the 1930s, the village was hit hard by the Great Depression, and many of the residents were forced to leave in search of work. The village was able to survive, however, and by the 1950s, it had become a popular tourist destination. The village was home to several resorts, and the area was known for its excellent fishing and hunting.
Geography
Harrietta is located in the northern part of Michigan, in the county of Wexford. It is situated on the banks of the Manistee River, and is surrounded by the Manistee National Forest. The village is located approximately 30 miles from Traverse City, and is about a two-hour drive from Grand Rapids. The village is situated in a rural area, and is surrounded by rolling hills and forests.
Economy
The economy of Harrietta is largely based on tourism and outdoor recreation. The village is home to several resorts, and the area is known for its excellent fishing and hunting. The village is also home to several small businesses, including restaurants, shops, and a grocery store. The village is also home to a small manufacturing plant, which produces parts for the automotive industry.
Demographics
As of the 2010 census, the population of Harrietta was 514. The racial makeup of the village was 97.3% White, 0.6% African American, 0.2% Native American, 0.2% Asian, 0.2% from other races, and 1.7% from two or more races. The median household income was $37,500, and the median family income was $45,000. The per capita income was $19,000. The village is home to a large number of retirees, and the median age is 55.
Common Questions
What is Per Capita Income in Harrietta?
Per Capita income in Harrietta is $18,696.
What is the Median Family Income in Harrietta?
Median Family Income in Harrietta is $64,688.
What is the Median Household income in Harrietta?
Median Household Income in Harrietta is $48,333.
What is Income or Wage Gap in Harrietta?
Income or Wage Gap in Harrietta is 7.4%.
Women in Harrietta earn 92.6 cents for every dollar earned by a man.
What is Inequality or Gini Index in Harrietta?
Inequality or Gini Index in Harrietta is 0.35.
What is the Total Population of Harrietta?
Total Population of Harrietta is 210.
What is the Total Male Population of Harrietta?
Total Male Population of Harrietta is 106.
What is the Total Female Population of Harrietta?
Total Female Population of Harrietta is 104.
What is the Ratio of Males per 100 Females in Harrietta?
There are 101.92 Males per 100 Females in Harrietta.
What is the Ratio of Females per 100 Males in Harrietta?
There are 98.11 Females per 100 Males in Harrietta.
What is the Median Population Age in Harrietta?
Median Population Age in Harrietta is 45.8 Years.
What is the Average Family Size in Harrietta
Average Family Size in Harrietta is 3.3 People.
What is the Average Household Size in Harrietta
Average Household Size in Harrietta is 2.6 People.
How Large is the Labor Force in Harrietta?
There are 93 People in the Labor Forcein in Harrietta.
What is the Percentage of People in the Labor Force in Harrietta?
50.8% of People are in the Labor Force in Harrietta.