Free Soil, MI Map & Demographics
Free Soil Map
Free Soil Overview
$25,907
PER CAPITA INCOME
$54,375
AVG FAMILY INCOME
$44,250
AVG HOUSEHOLD INCOME
0.31
INEQUALITY / GINI INDEX
103
TOTAL POPULATION
66
MALE POPULATION
37
FEMALE POPULATION
178.38
MALES / 100 FEMALES
56.06
FEMALES / 100 MALES
54.9
MEDIAN AGE
2.7
AVG FAMILY SIZE
2.1
AVG HOUSEHOLD SIZE
43
LABOR FORCE [ PEOPLE ]
46.7%
PERCENT IN LABOR FORCE
2.3%
UNEMPLOYMENT RATE
Free Soil Zip Codes
Free Soil Area Codes
Income in Free Soil
Income Overview in Free Soil
Per Capita Income in Free Soil is $25,907, while median incomes of families and households are $54,375 and $44,250 respectively.
| Characteristic | Number | Measure |
| Per Capita Income | 103 | $25,907 |
| Median Family Income | 25 | $54,375 |
| Mean Family Income | 25 | $59,748 |
| Median Household Income | 49 | $44,250 |
| Mean Household Income | 49 | $51,463 |
| Income Deficit | 25 | $0 |
| Wage / Income Gap (%) | 103 | 0.00% |
| Wage / Income Gap ($) | 103 | 100.00¢ per $1 |
| Gini / Inequality Index | 103 | 0.31 |
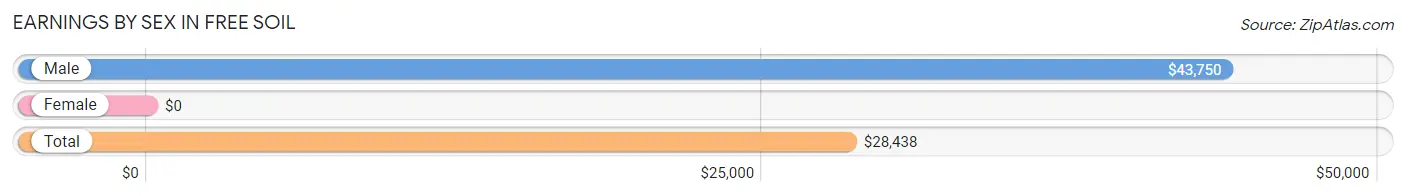
Earnings by Sex in Free Soil
| Sex | Number | Average Earnings |
| Male | 29 (61.7%) | $43,750 |
| Female | 18 (38.3%) | $0 |
| Total | 47 (100.0%) | $28,438 |
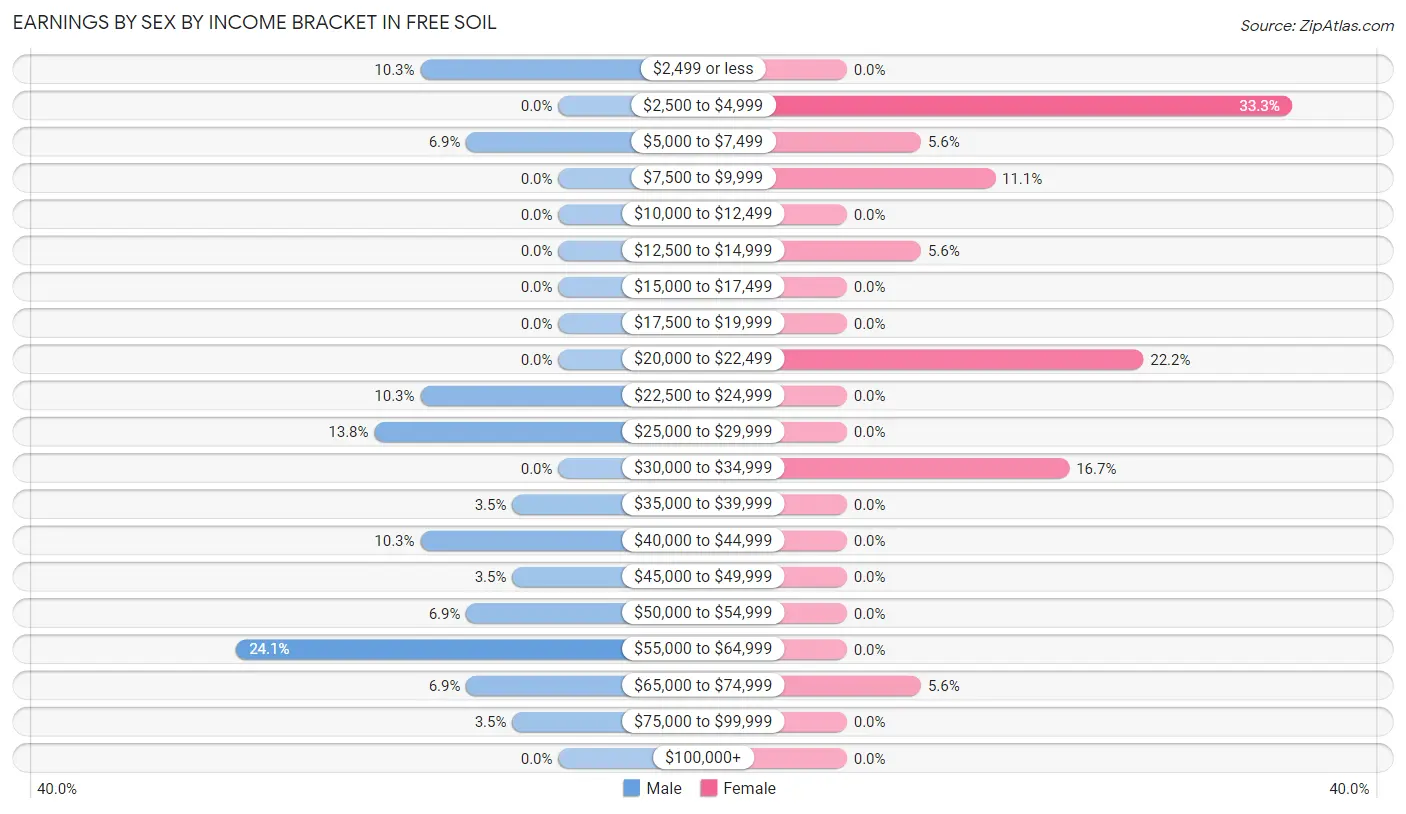
Earnings by Sex by Income Bracket in Free Soil
The most common earnings brackets in Free Soil are $55,000 to $64,999 for men (7 | 24.1%) and $2,500 to $4,999 for women (6 | 33.3%).
| Income | Male | Female |
| $2,499 or less | 3 (10.3%) | 0 (0.0%) |
| $2,500 to $4,999 | 0 (0.0%) | 6 (33.3%) |
| $5,000 to $7,499 | 2 (6.9%) | 1 (5.6%) |
| $7,500 to $9,999 | 0 (0.0%) | 2 (11.1%) |
| $10,000 to $12,499 | 0 (0.0%) | 0 (0.0%) |
| $12,500 to $14,999 | 0 (0.0%) | 1 (5.6%) |
| $15,000 to $17,499 | 0 (0.0%) | 0 (0.0%) |
| $17,500 to $19,999 | 0 (0.0%) | 0 (0.0%) |
| $20,000 to $22,499 | 0 (0.0%) | 4 (22.2%) |
| $22,500 to $24,999 | 3 (10.3%) | 0 (0.0%) |
| $25,000 to $29,999 | 4 (13.8%) | 0 (0.0%) |
| $30,000 to $34,999 | 0 (0.0%) | 3 (16.7%) |
| $35,000 to $39,999 | 1 (3.5%) | 0 (0.0%) |
| $40,000 to $44,999 | 3 (10.3%) | 0 (0.0%) |
| $45,000 to $49,999 | 1 (3.5%) | 0 (0.0%) |
| $50,000 to $54,999 | 2 (6.9%) | 0 (0.0%) |
| $55,000 to $64,999 | 7 (24.1%) | 0 (0.0%) |
| $65,000 to $74,999 | 2 (6.9%) | 1 (5.6%) |
| $75,000 to $99,999 | 1 (3.5%) | 0 (0.0%) |
| $100,000+ | 0 (0.0%) | 0 (0.0%) |
| Total | 29 (100.0%) | 18 (100.0%) |
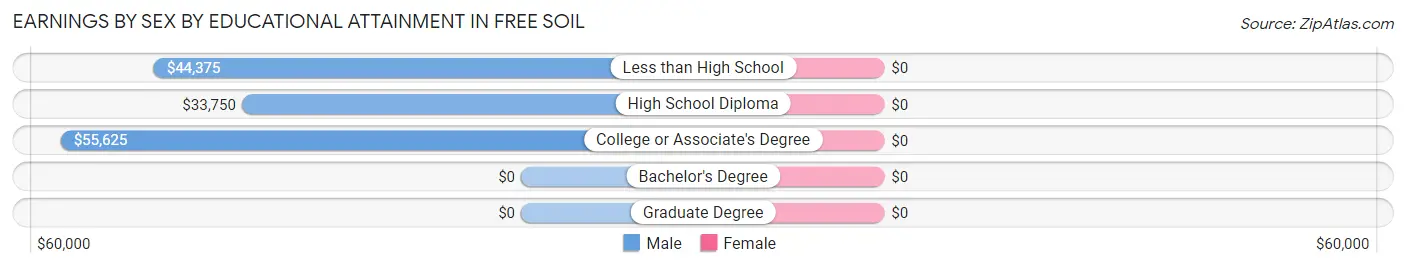
Earnings by Sex by Educational Attainment in Free Soil
| Educational Attainment | Male Income | Female Income |
| Less than High School | $44,375 | $0 |
| High School Diploma | $33,750 | $0 |
| College or Associate's Degree | $55,625 | $0 |
| Bachelor's Degree | - | - |
| Graduate Degree | - | - |
| Total | $44,583 | $0 |
Family Income in Free Soil
Family Income Brackets in Free Soil
According to the Free Soil family income data, there are 8 families falling into the $35,000 to $49,999 income range, which is the most common income bracket and makes up 32.0% of all families.
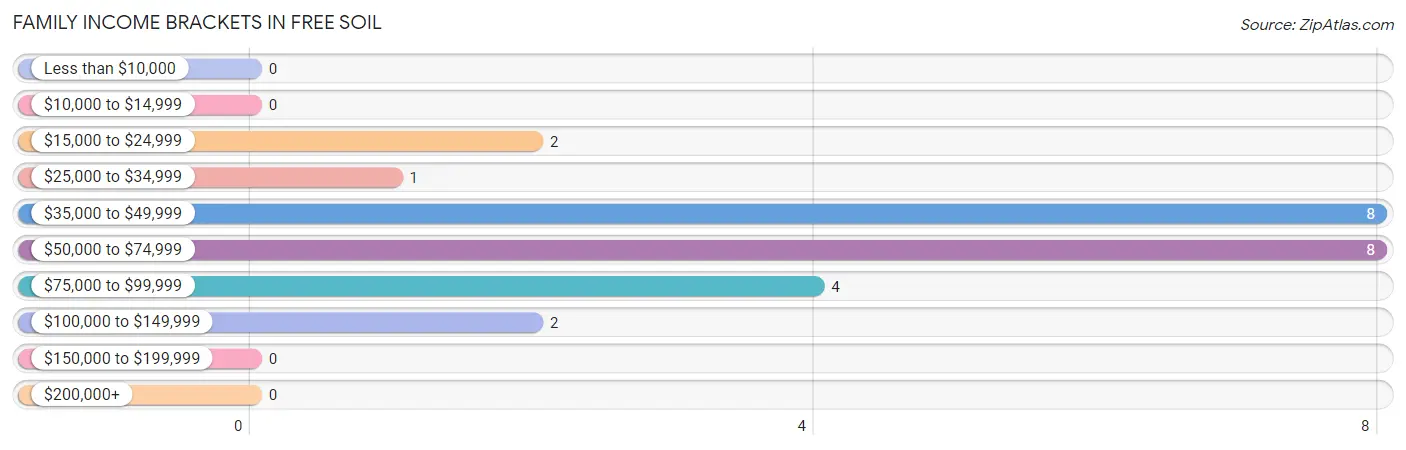
| Income Bracket | # Families | % Families |
| Less than $10,000 | 0 | 0.0% |
| $10,000 to $14,999 | 0 | 0.0% |
| $15,000 to $24,999 | 2 | 8.0% |
| $25,000 to $34,999 | 1 | 4.0% |
| $35,000 to $49,999 | 8 | 32.0% |
| $50,000 to $74,999 | 8 | 32.0% |
| $75,000 to $99,999 | 4 | 16.0% |
| $100,000 to $149,999 | 2 | 8.0% |
| $150,000 to $199,999 | 0 | 0.0% |
| $200,000+ | 0 | 0.0% |
Family Income by Famaliy Size in Free Soil
3-person families (5 | 20.0%) account for the highest median family income in Free Soil with $76,250 per family, while 3-person families (5 | 20.0%) have the highest median income of $25,417 per family member.
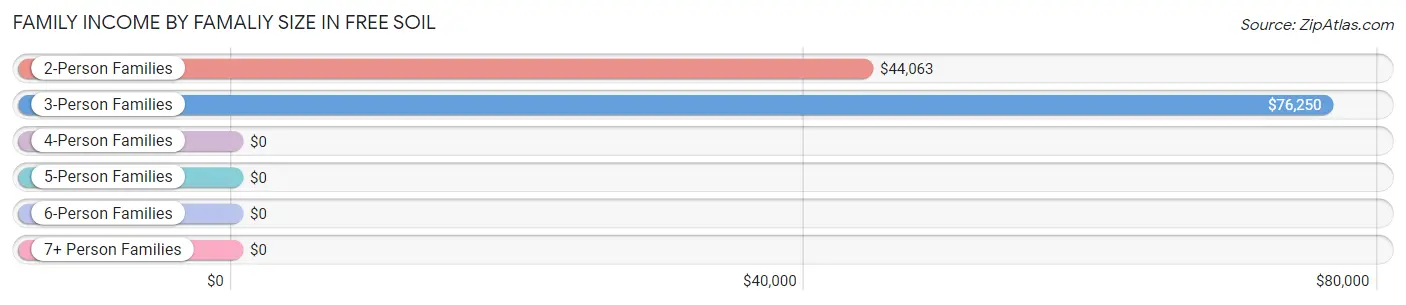
| Income Bracket | # Families | Median Income |
| 2-Person Families | 17 (68.0%) | $44,063 |
| 3-Person Families | 5 (20.0%) | $76,250 |
| 4-Person Families | 3 (12.0%) | $0 |
| 5-Person Families | 0 (0.0%) | $0 |
| 6-Person Families | 0 (0.0%) | $0 |
| 7+ Person Families | 0 (0.0%) | $0 |
| Total | 25 (100.0%) | $54,375 |
Family Income by Number of Earners in Free Soil
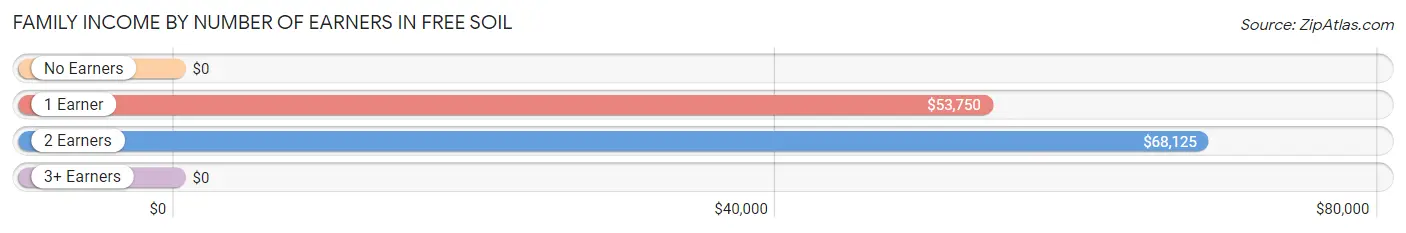
| Number of Earners | # Families | Median Income |
| No Earners | 5 (20.0%) | $0 |
| 1 Earner | 12 (48.0%) | $53,750 |
| 2 Earners | 5 (20.0%) | $68,125 |
| 3+ Earners | 3 (12.0%) | $0 |
| Total | 25 (100.0%) | $54,375 |
Household Income in Free Soil
Household Income Brackets in Free Soil
With 15 households falling in the category, the $35,000 to $49,999 income range is the most frequent in Free Soil, accounting for 30.6% of all households.
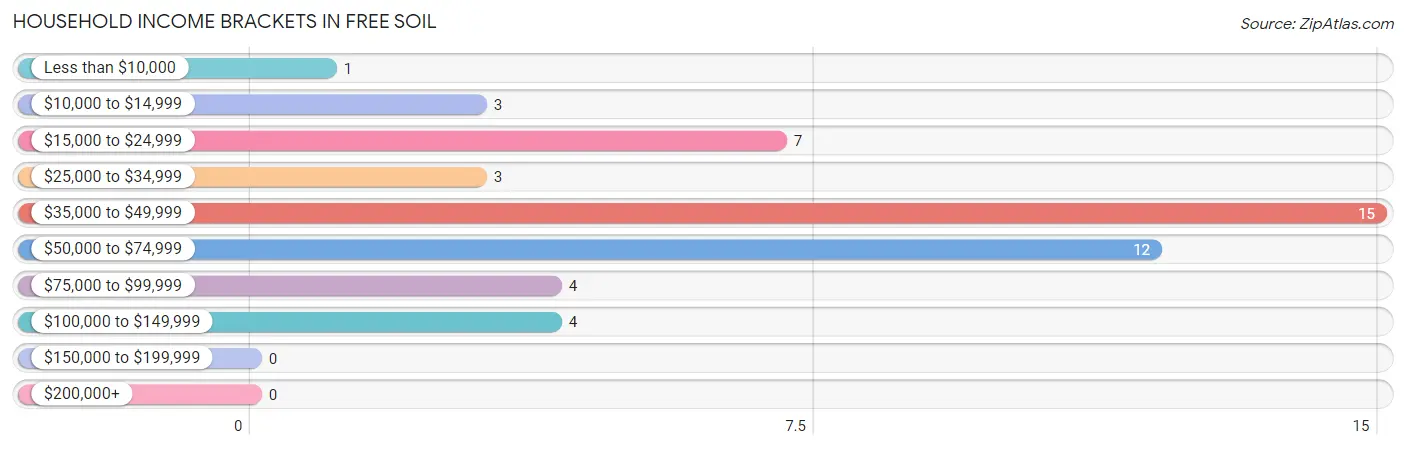
| Income Bracket | # Households | % Households |
| Less than $10,000 | 1 | 2.0% |
| $10,000 to $14,999 | 3 | 6.1% |
| $15,000 to $24,999 | 7 | 14.3% |
| $25,000 to $34,999 | 3 | 6.1% |
| $35,000 to $49,999 | 15 | 30.6% |
| $50,000 to $74,999 | 12 | 24.5% |
| $75,000 to $99,999 | 4 | 8.2% |
| $100,000 to $149,999 | 4 | 8.2% |
| $150,000 to $199,999 | 0 | 0.0% |
| $200,000+ | 0 | 0.0% |
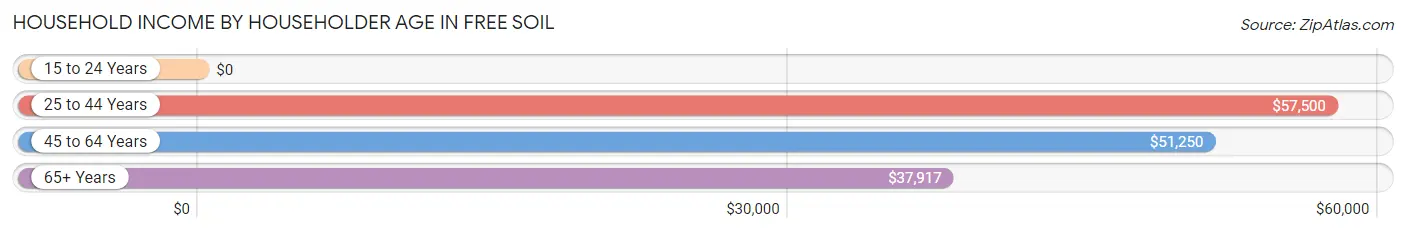
Household Income by Householder Age in Free Soil
The median household income in Free Soil is $44,250, with the highest median household income of $57,500 found in the 25 to 44 years age bracket for the primary householder. A total of 6 households (12.2%) fall into this category.
| Income Bracket | # Households | Median Income |
| 15 to 24 Years | 0 (0.0%) | $0 |
| 25 to 44 Years | 6 (12.2%) | $57,500 |
| 45 to 64 Years | 18 (36.7%) | $51,250 |
| 65+ Years | 25 (51.0%) | $37,917 |
| Total | 49 (100.0%) | $44,250 |
Poverty in Free Soil
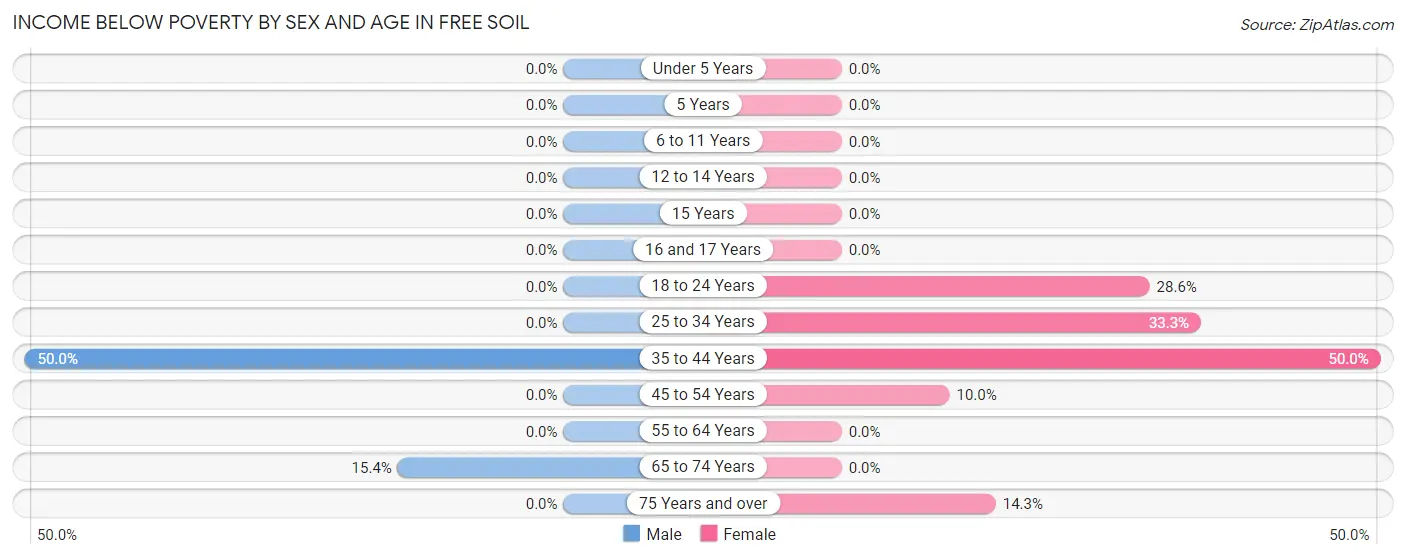
Income Below Poverty by Sex and Age in Free Soil
With 4.5% poverty level for males and 16.2% for females among the residents of Free Soil, 35 to 44 year old males and 35 to 44 year old females are the most vulnerable to poverty, with 1 males (50.0%) and 1 females (50.0%) in their respective age groups living below the poverty level.
| Age Bracket | Male | Female |
| Under 5 Years | 0 (0.0%) | 0 (0.0%) |
| 5 Years | 0 (0.0%) | 0 (0.0%) |
| 6 to 11 Years | 0 (0.0%) | 0 (0.0%) |
| 12 to 14 Years | 0 (0.0%) | 0 (0.0%) |
| 15 Years | 0 (0.0%) | 0 (0.0%) |
| 16 and 17 Years | 0 (0.0%) | 0 (0.0%) |
| 18 to 24 Years | 0 (0.0%) | 2 (28.6%) |
| 25 to 34 Years | 0 (0.0%) | 1 (33.3%) |
| 35 to 44 Years | 1 (50.0%) | 1 (50.0%) |
| 45 to 54 Years | 0 (0.0%) | 1 (10.0%) |
| 55 to 64 Years | 0 (0.0%) | 0 (0.0%) |
| 65 to 74 Years | 2 (15.4%) | 0 (0.0%) |
| 75 Years and over | 0 (0.0%) | 1 (14.3%) |
| Total | 3 (4.5%) | 6 (16.2%) |
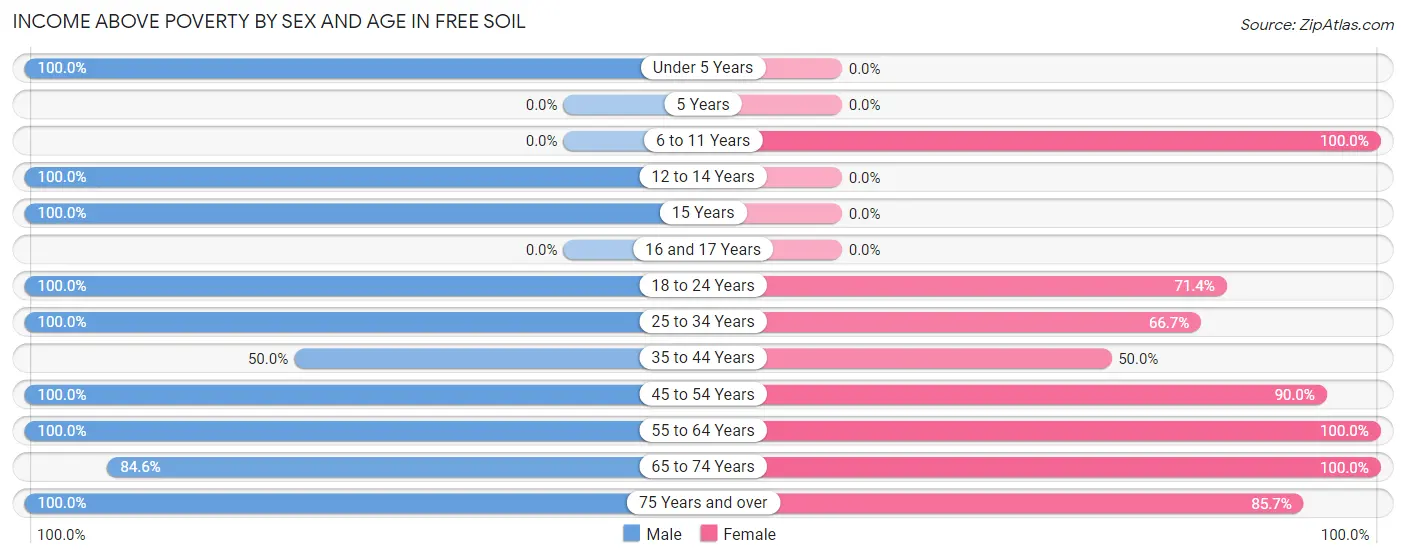
Income Above Poverty by Sex and Age in Free Soil
According to the poverty statistics in Free Soil, males aged under 5 years and females aged 6 to 11 years are the age groups that are most secure financially, with 100.0% of males and 100.0% of females in these age groups living above the poverty line.
| Age Bracket | Male | Female |
| Under 5 Years | 4 (100.0%) | 0 (0.0%) |
| 5 Years | 0 (0.0%) | 0 (0.0%) |
| 6 to 11 Years | 0 (0.0%) | 2 (100.0%) |
| 12 to 14 Years | 4 (100.0%) | 0 (0.0%) |
| 15 Years | 1 (100.0%) | 0 (0.0%) |
| 16 and 17 Years | 0 (0.0%) | 0 (0.0%) |
| 18 to 24 Years | 2 (100.0%) | 5 (71.4%) |
| 25 to 34 Years | 7 (100.0%) | 2 (66.7%) |
| 35 to 44 Years | 1 (50.0%) | 1 (50.0%) |
| 45 to 54 Years | 8 (100.0%) | 9 (90.0%) |
| 55 to 64 Years | 16 (100.0%) | 4 (100.0%) |
| 65 to 74 Years | 11 (84.6%) | 2 (100.0%) |
| 75 Years and over | 9 (100.0%) | 6 (85.7%) |
| Total | 63 (95.5%) | 31 (83.8%) |
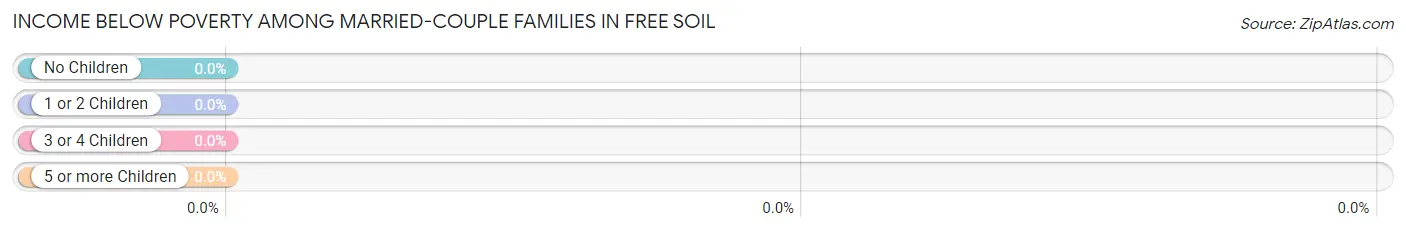
Income Below Poverty Among Married-Couple Families in Free Soil
| Children | Above Poverty | Below Poverty |
| No Children | 14 (100.0%) | 0 (0.0%) |
| 1 or 2 Children | 3 (100.0%) | 0 (0.0%) |
| 3 or 4 Children | 0 (0.0%) | 0 (0.0%) |
| 5 or more Children | 0 (0.0%) | 0 (0.0%) |
| Total | 17 (100.0%) | 0 (0.0%) |
Income Below Poverty Among Single-Parent Households in Free Soil
| Children | Single Father | Single Mother |
| No Children | 0 (0.0%) | 0 (0.0%) |
| 1 or 2 Children | 0 (0.0%) | 0 (0.0%) |
| 3 or 4 Children | 0 (0.0%) | 0 (0.0%) |
| 5 or more Children | 0 (0.0%) | 0 (0.0%) |
| Total | 0 (0.0%) | 0 (0.0%) |
Income Below Poverty Among Married-Couple vs Single-Parent Households in Free Soil
| Children | Married-Couple Families | Single-Parent Households |
| No Children | 0 (0.0%) | 0 (0.0%) |
| 1 or 2 Children | 0 (0.0%) | 0 (0.0%) |
| 3 or 4 Children | 0 (0.0%) | 0 (0.0%) |
| 5 or more Children | 0 (0.0%) | 0 (0.0%) |
| Total | 0 (0.0%) | 0 (0.0%) |
Race in Free Soil
The most populous races in Free Soil are White / Caucasian (99 | 96.1%), and Two or more Races (4 | 3.9%).
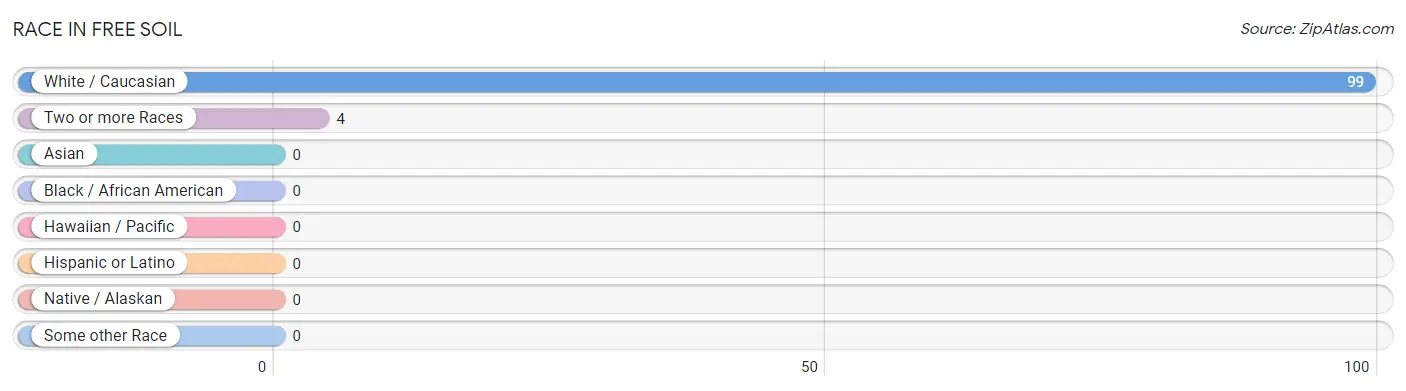
| Race | # Population | % Population |
| Asian | 0 | 0.0% |
| Black / African American | 0 | 0.0% |
| Hawaiian / Pacific | 0 | 0.0% |
| Hispanic or Latino | 0 | 0.0% |
| Native / Alaskan | 0 | 0.0% |
| White / Caucasian | 99 | 96.1% |
| Two or more Races | 4 | 3.9% |
| Some other Race | 0 | 0.0% |
| Total | 103 | 100.0% |
Ancestry in Free Soil
The most populous ancestries reported in Free Soil are English (25 | 24.3%), Irish (20 | 19.4%), German (17 | 16.5%), Polish (12 | 11.7%), and American (6 | 5.8%), together accounting for 77.7% of all Free Soil residents.
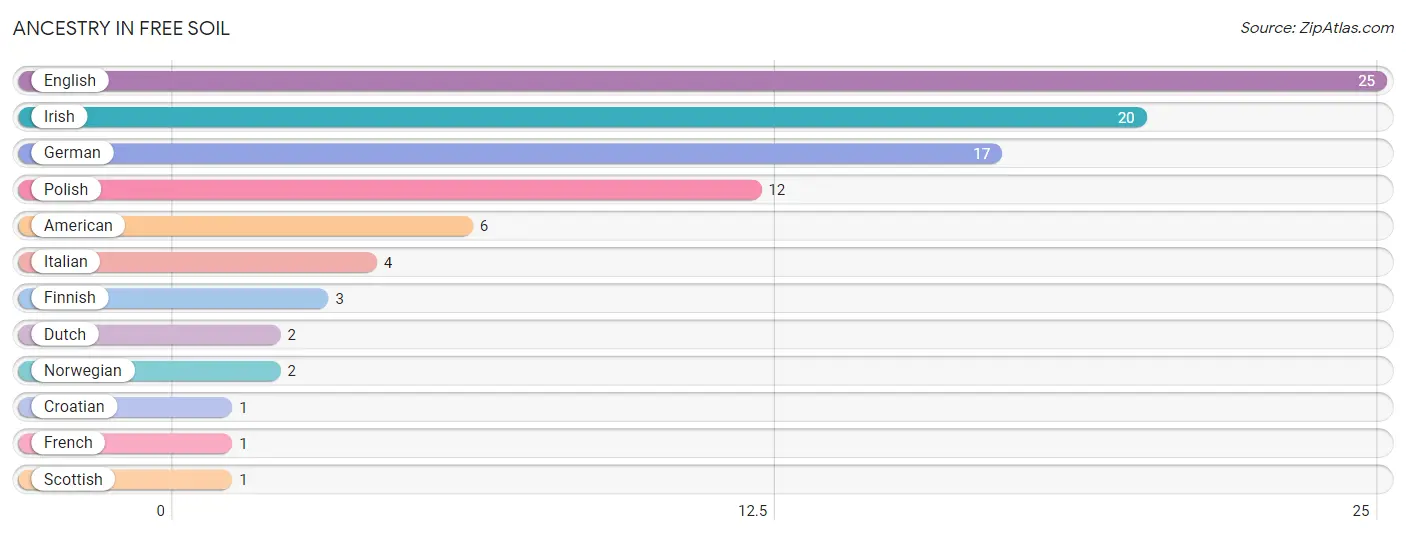
| Ancestry | # Population | % Population |
| American | 6 | 5.8% |
| Croatian | 1 | 1.0% |
| Dutch | 2 | 1.9% |
| English | 25 | 24.3% |
| Finnish | 3 | 2.9% |
| French | 1 | 1.0% |
| German | 17 | 16.5% |
| Irish | 20 | 19.4% |
| Italian | 4 | 3.9% |
| Norwegian | 2 | 1.9% |
| Polish | 12 | 11.7% |
| Scottish | 1 | 1.0% | View All 12 Rows |
Immigrants in Free Soil

| Immigration Origin | # Population | % Population | View All 0 Rows |
Sex and Age in Free Soil
Sex and Age in Free Soil
The most populous age groups in Free Soil are 70 to 74 Years (10 | 15.1%) for men and 20 to 24 Years (6 | 16.2%) for women.
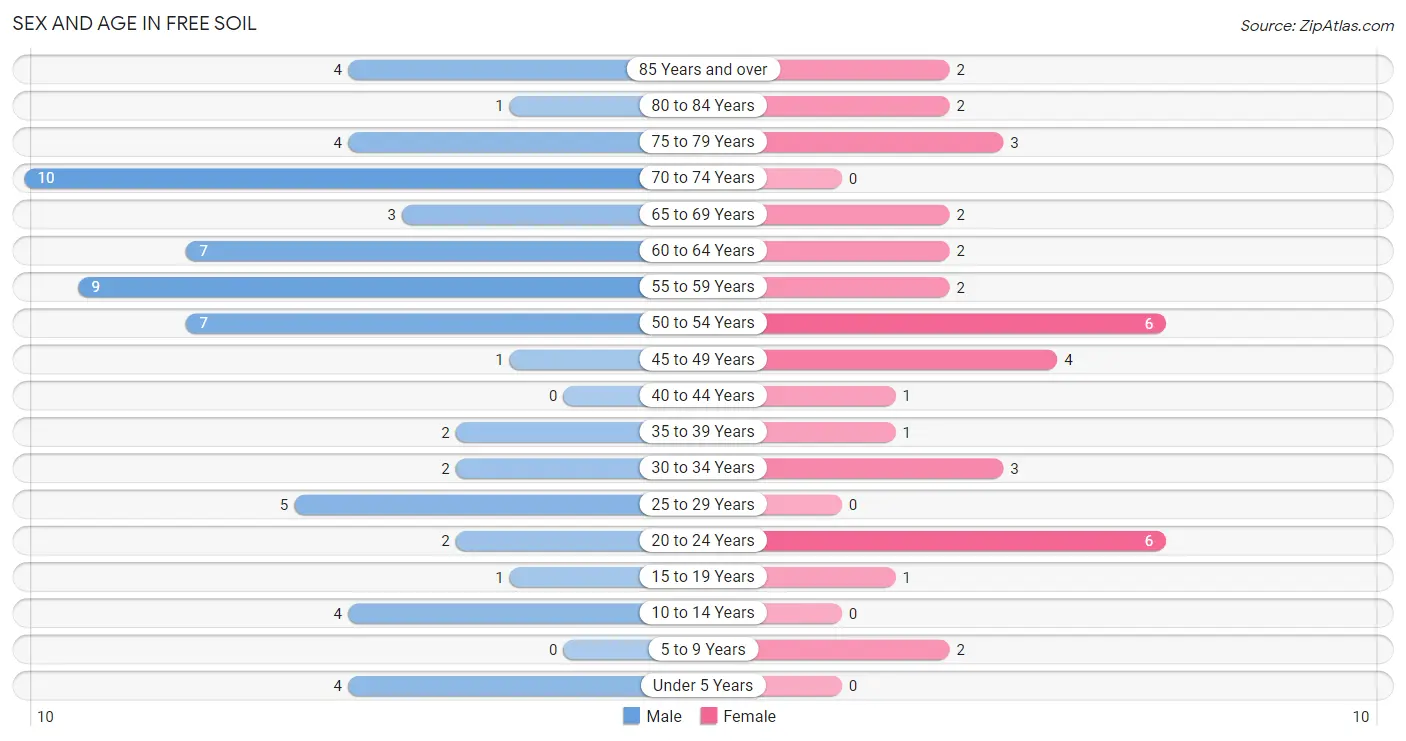
| Age Bracket | Male | Female |
| Under 5 Years | 4 (6.1%) | 0 (0.0%) |
| 5 to 9 Years | 0 (0.0%) | 2 (5.4%) |
| 10 to 14 Years | 4 (6.1%) | 0 (0.0%) |
| 15 to 19 Years | 1 (1.5%) | 1 (2.7%) |
| 20 to 24 Years | 2 (3.0%) | 6 (16.2%) |
| 25 to 29 Years | 5 (7.6%) | 0 (0.0%) |
| 30 to 34 Years | 2 (3.0%) | 3 (8.1%) |
| 35 to 39 Years | 2 (3.0%) | 1 (2.7%) |
| 40 to 44 Years | 0 (0.0%) | 1 (2.7%) |
| 45 to 49 Years | 1 (1.5%) | 4 (10.8%) |
| 50 to 54 Years | 7 (10.6%) | 6 (16.2%) |
| 55 to 59 Years | 9 (13.6%) | 2 (5.4%) |
| 60 to 64 Years | 7 (10.6%) | 2 (5.4%) |
| 65 to 69 Years | 3 (4.5%) | 2 (5.4%) |
| 70 to 74 Years | 10 (15.1%) | 0 (0.0%) |
| 75 to 79 Years | 4 (6.1%) | 3 (8.1%) |
| 80 to 84 Years | 1 (1.5%) | 2 (5.4%) |
| 85 Years and over | 4 (6.1%) | 2 (5.4%) |
| Total | 66 (100.0%) | 37 (100.0%) |
Families and Households in Free Soil
Median Family Size in Free Soil
The median family size in Free Soil is 2.72 persons per family, with single female/mother families (1 | 4.0%) accounting for the largest median family size of 5 persons per family. On the other hand, married-couple families (17 | 68.0%) represent the smallest median family size with 2.53 persons per family.
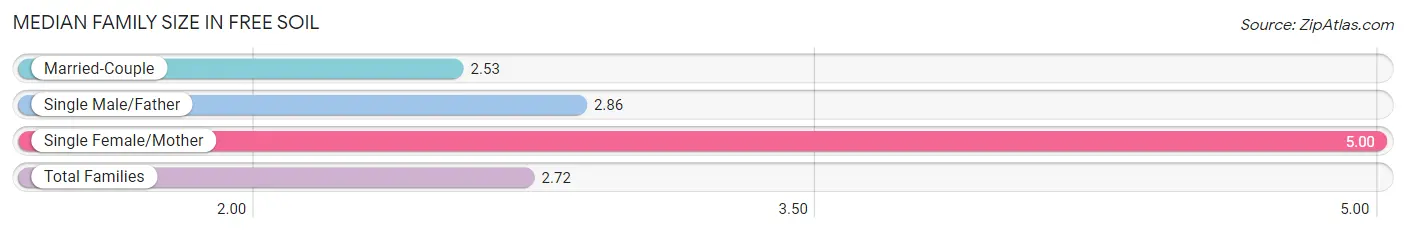
| Family Type | # Families | Family Size |
| Married-Couple | 17 (68.0%) | 2.53 |
| Single Male/Father | 7 (28.0%) | 2.86 |
| Single Female/Mother | 1 (4.0%) | 5.00 |
| Total Families | 25 (100.0%) | 2.72 |
Median Household Size in Free Soil
The median household size in Free Soil is 2.10 persons per household, with single female/mother households (1 | 2.0%) accounting for the largest median household size of 5 persons per household. non-family households (24 | 49.0%) represent the smallest median household size with 1.29 persons per household.
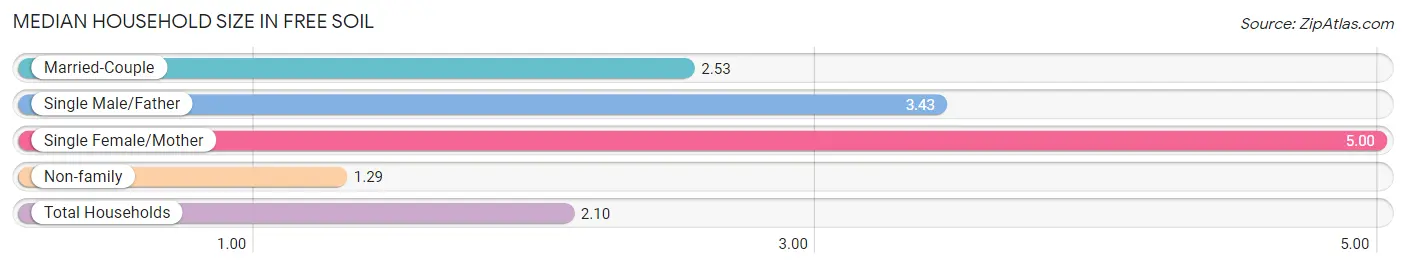
| Household Type | # Households | Household Size |
| Married-Couple | 17 (34.7%) | 2.53 |
| Single Male/Father | 7 (14.3%) | 3.43 |
| Single Female/Mother | 1 (2.0%) | 5.00 |
| Non-family | 24 (49.0%) | 1.29 |
| Total Households | 49 (100.0%) | 2.10 |
Household Size by Marriage Status in Free Soil
Out of a total of 49 households in Free Soil, 25 (51.0%) are family households, while 24 (49.0%) are nonfamily households. The most numerous type of family households are 2-person households, comprising 17, and the most common type of nonfamily households are 1-person households, comprising 18.
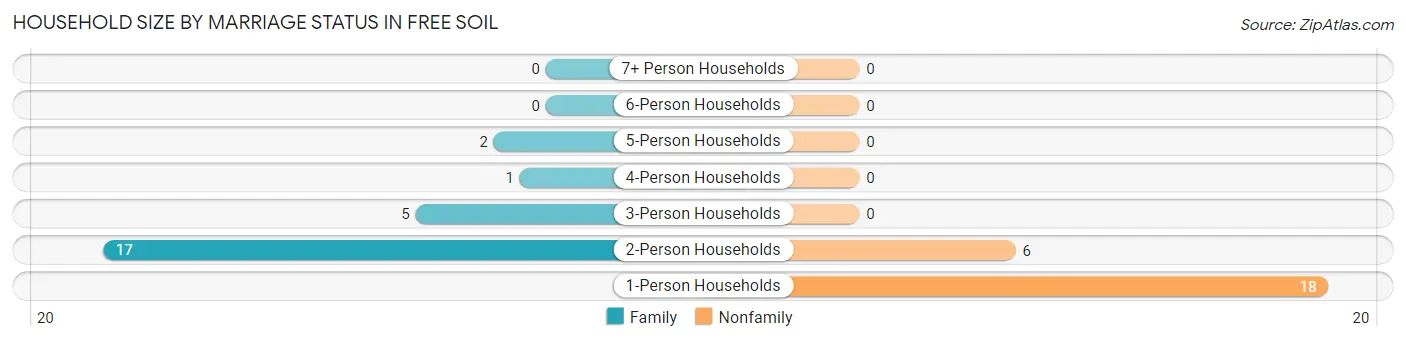
| Household Size | Family Households | Nonfamily Households |
| 1-Person Households | - | 18 (36.7%) |
| 2-Person Households | 17 (34.7%) | 6 (12.2%) |
| 3-Person Households | 5 (10.2%) | 0 (0.0%) |
| 4-Person Households | 1 (2.0%) | 0 (0.0%) |
| 5-Person Households | 2 (4.1%) | 0 (0.0%) |
| 6-Person Households | 0 (0.0%) | 0 (0.0%) |
| 7+ Person Households | 0 (0.0%) | 0 (0.0%) |
| Total | 25 (51.0%) | 24 (49.0%) |
Female Fertility in Free Soil
Fertility by Age in Free Soil
Average fertility rate in Free Soil is 250.0 births per 1,000 women. Women in the age bracket of 20 to 34 years have the highest fertility rate with 444.0 births per 1,000 women. Women in the age bracket of 20 to 34 years acount for 100.0% of all women with births.
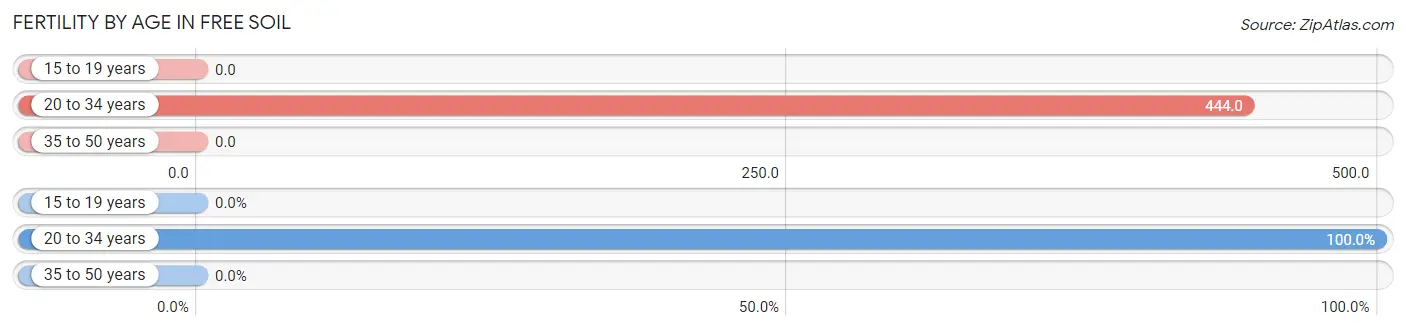
| Age Bracket | Women with Births | Births / 1,000 Women |
| 15 to 19 years | 0 (0.0%) | 0.0 |
| 20 to 34 years | 4 (100.0%) | 444.0 |
| 35 to 50 years | 0 (0.0%) | 0.0 |
| Total | 4 (100.0%) | 250.0 |
Fertility by Age by Marriage Status in Free Soil
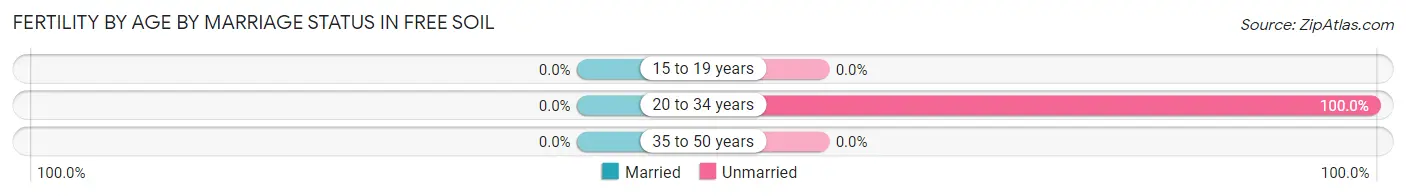
| Age Bracket | Married | Unmarried |
| 15 to 19 years | 0 (0.0%) | 0 (0.0%) |
| 20 to 34 years | 0 (0.0%) | 4 (100.0%) |
| 35 to 50 years | 0 (0.0%) | 0 (0.0%) |
| Total | 0 (0.0%) | 4 (100.0%) |
Fertility by Education in Free Soil
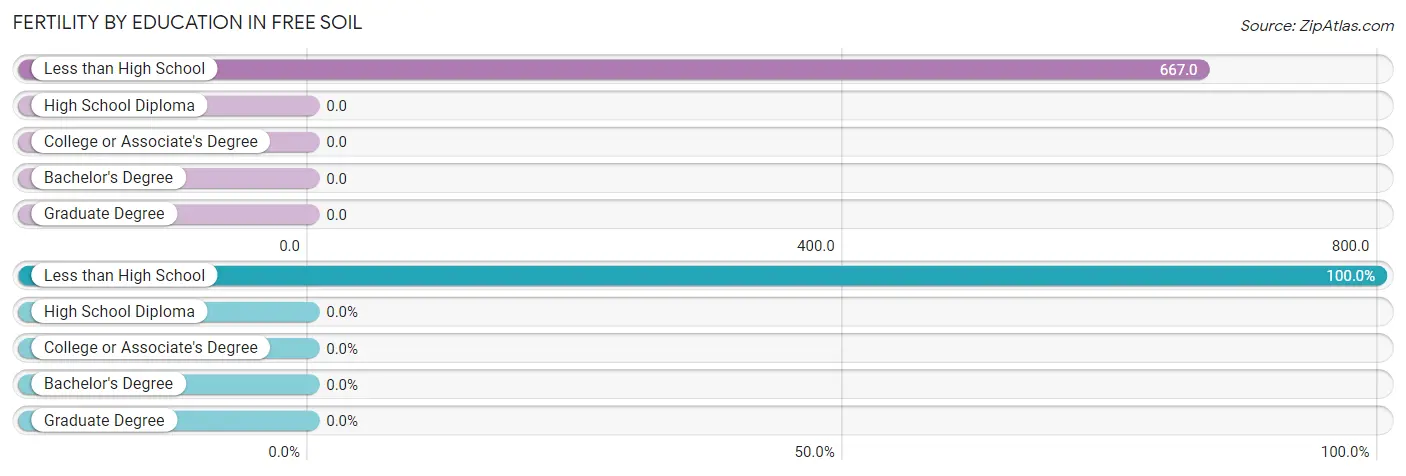
| Educational Attainment | Women with Births | Births / 1,000 Women |
| Less than High School | 4 (100.0%) | 667.0 |
| High School Diploma | 0 (0.0%) | 0.0 |
| College or Associate's Degree | 0 (0.0%) | 0.0 |
| Bachelor's Degree | 0 (0.0%) | 0.0 |
| Graduate Degree | 0 (0.0%) | 0.0 |
| Total | 4 (100.0%) | 250.0 |
Fertility by Education by Marriage Status in Free Soil
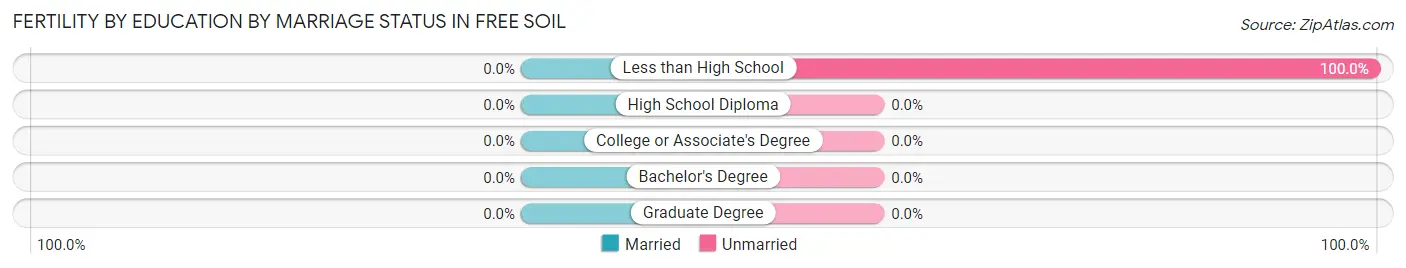
| Educational Attainment | Married | Unmarried |
| Less than High School | 0 (0.0%) | 4 (100.0%) |
| High School Diploma | 0 (0.0%) | 0 (0.0%) |
| College or Associate's Degree | 0 (0.0%) | 0 (0.0%) |
| Bachelor's Degree | 0 (0.0%) | 0 (0.0%) |
| Graduate Degree | 0 (0.0%) | 0 (0.0%) |
| Total | 0 (0.0%) | 4 (100.0%) |
Employment Characteristics in Free Soil
Employment by Class of Employer in Free Soil
Among the 42 employed individuals in Free Soil, private company employees (29 | 69.1%), not-for-profit organizations (6 | 14.3%), and local government employees (5 | 11.9%) make up the most common classes of employment.

| Employer Class | # Employees | % Employees |
| Private Company Employees | 29 | 69.1% |
| Self-Employed (Incorporated) | 0 | 0.0% |
| Self-Employed (Not Incorporated) | 1 | 2.4% |
| Not-for-profit Organizations | 6 | 14.3% |
| Local Government Employees | 5 | 11.9% |
| State Government Employees | 1 | 2.4% |
| Federal Government Employees | 0 | 0.0% |
| Unpaid Family Workers | 0 | 0.0% |
| Total | 42 | 100.0% |
Employment Status by Age in Free Soil
According to the labor force statistics for Free Soil, out of the total population over 16 years of age (92), 46.7% or 43 individuals are in the labor force, with 2.3% or 1 of them unemployed. The age group with the highest labor force participation rate is 16 to 19 years, with 100.0% or 1 individuals in the labor force. Within the labor force, the 30 to 34 years age range has the highest percentage of unemployed individuals, with 33.3% or 1 of them being unemployed.
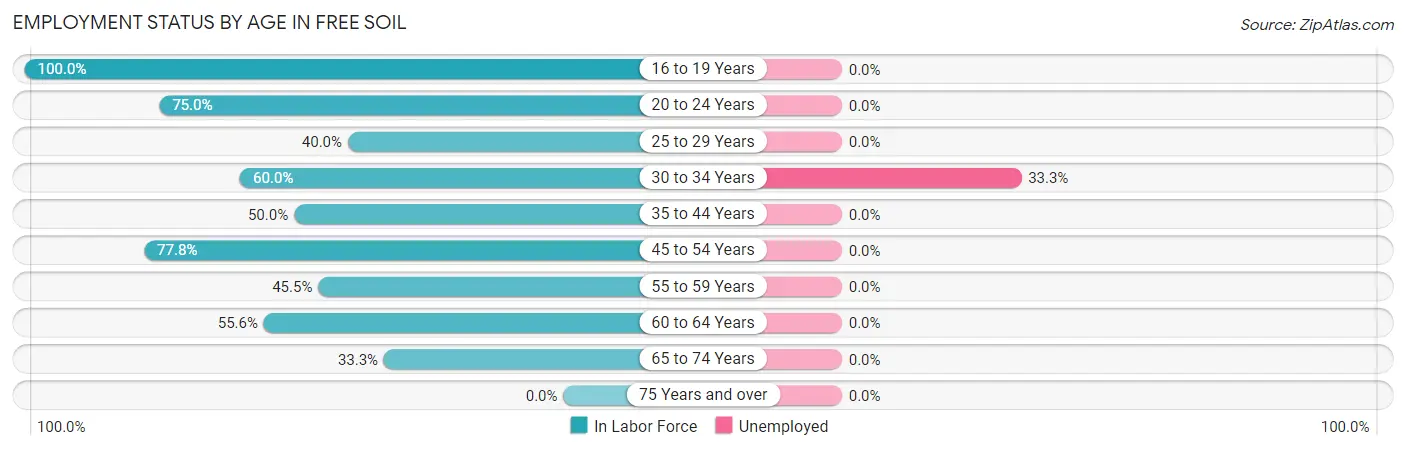
| Age Bracket | In Labor Force | Unemployed |
| 16 to 19 Years | 1 (100.0%) | 0 (0.0%) |
| 20 to 24 Years | 6 (75.0%) | 0 (0.0%) |
| 25 to 29 Years | 2 (40.0%) | 0 (0.0%) |
| 30 to 34 Years | 3 (60.0%) | 1 (33.3%) |
| 35 to 44 Years | 2 (50.0%) | 0 (0.0%) |
| 45 to 54 Years | 14 (77.8%) | 0 (0.0%) |
| 55 to 59 Years | 5 (45.5%) | 0 (0.0%) |
| 60 to 64 Years | 5 (55.6%) | 0 (0.0%) |
| 65 to 74 Years | 5 (33.3%) | 0 (0.0%) |
| 75 Years and over | 0 (0.0%) | 0 (0.0%) |
| Total | 43 (46.7%) | 1 (2.3%) |
Employment Status by Educational Attainment in Free Soil
According to labor force statistics for Free Soil, 59.6% of individuals (31) out of the total population between 25 and 64 years of age (52) are in the labor force, with 3.2% or 1 of them being unemployed. The group with the highest labor force participation rate are those with the educational attainment of bachelor's degree or higher, with 100.0% or 1 individuals in the labor force. Within the labor force, individuals with college / associate degree education have the highest percentage of unemployment, with 7.7% or 1 of them being unemployed.
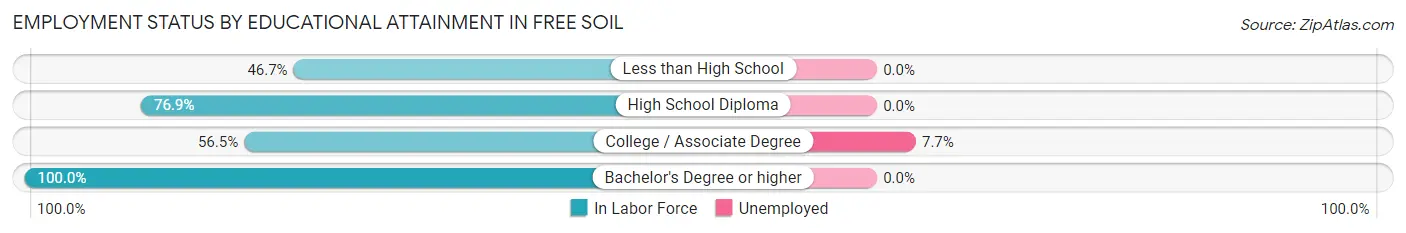
| Educational Attainment | In Labor Force | Unemployed |
| Less than High School | 7 (46.7%) | 0 (0.0%) |
| High School Diploma | 10 (76.9%) | 0 (0.0%) |
| College / Associate Degree | 13 (56.5%) | 2 (7.7%) |
| Bachelor's Degree or higher | 1 (100.0%) | 0 (0.0%) |
| Total | 31 (59.6%) | 2 (3.2%) |
Employment Occupations by Sex in Free Soil
Management, Business, Science and Arts Occupations
The most common Management, Business, Science and Arts occupations in Free Soil are Computers, Engineering & Science (2 | 4.8%), Architecture & Engineering (2 | 4.8%), Community & Social Service (2 | 4.8%), Arts, Media & Entertainment (2 | 4.8%), and Health Diagnosing & Treating (2 | 4.8%).
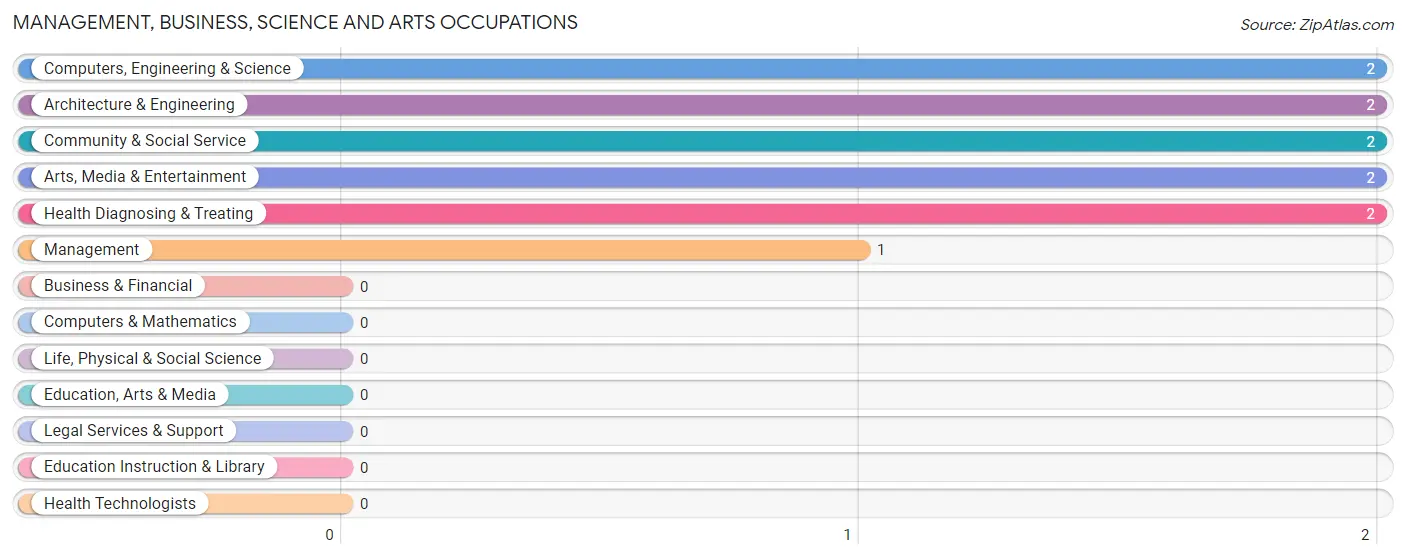
Management, Business, Science and Arts Occupations by Sex
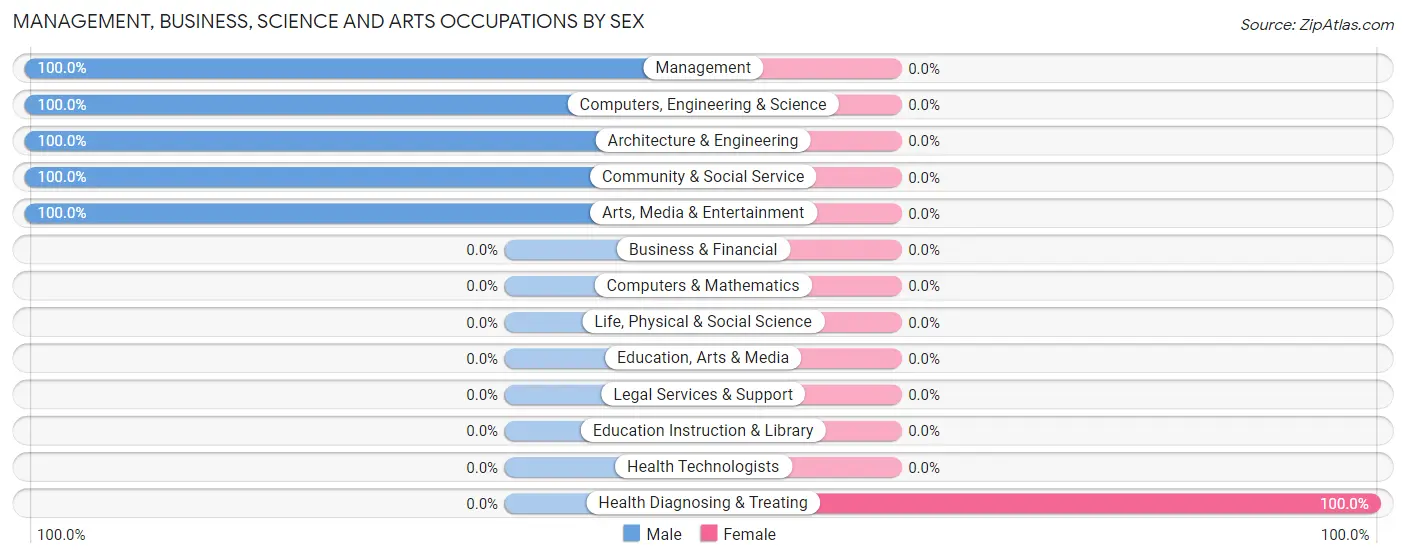
| Occupation | Male | Female |
| Management | 1 (100.0%) | 0 (0.0%) |
| Business & Financial | 0 (0.0%) | 0 (0.0%) |
| Computers, Engineering & Science | 2 (100.0%) | 0 (0.0%) |
| Computers & Mathematics | 0 (0.0%) | 0 (0.0%) |
| Architecture & Engineering | 2 (100.0%) | 0 (0.0%) |
| Life, Physical & Social Science | 0 (0.0%) | 0 (0.0%) |
| Community & Social Service | 2 (100.0%) | 0 (0.0%) |
| Education, Arts & Media | 0 (0.0%) | 0 (0.0%) |
| Legal Services & Support | 0 (0.0%) | 0 (0.0%) |
| Education Instruction & Library | 0 (0.0%) | 0 (0.0%) |
| Arts, Media & Entertainment | 2 (100.0%) | 0 (0.0%) |
| Health Diagnosing & Treating | 0 (0.0%) | 2 (100.0%) |
| Health Technologists | 0 (0.0%) | 0 (0.0%) |
| Total (Category) | 5 (71.4%) | 2 (28.6%) |
| Total (Overall) | 27 (64.3%) | 15 (35.7%) |
Services Occupations
The most common Services occupations in Free Soil are Food Preparation & Serving (4 | 9.5%), and Healthcare Support (2 | 4.8%).
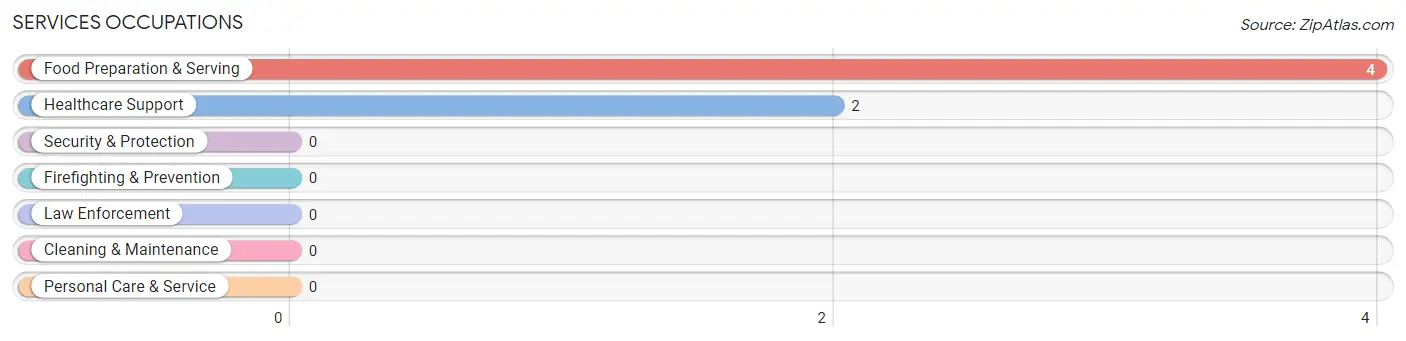
Services Occupations by Sex
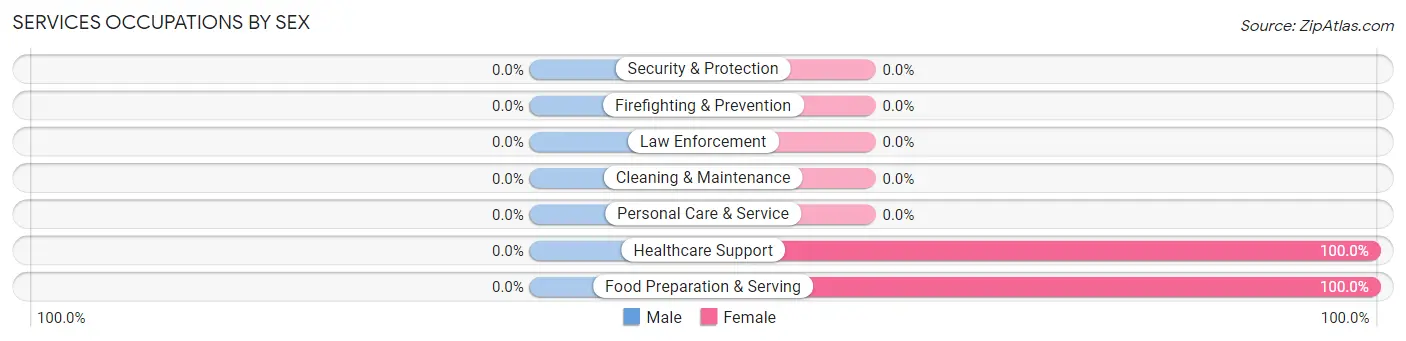
| Occupation | Male | Female |
| Healthcare Support | 0 (0.0%) | 2 (100.0%) |
| Security & Protection | 0 (0.0%) | 0 (0.0%) |
| Firefighting & Prevention | 0 (0.0%) | 0 (0.0%) |
| Law Enforcement | 0 (0.0%) | 0 (0.0%) |
| Food Preparation & Serving | 0 (0.0%) | 4 (100.0%) |
| Cleaning & Maintenance | 0 (0.0%) | 0 (0.0%) |
| Personal Care & Service | 0 (0.0%) | 0 (0.0%) |
| Total (Category) | 0 (0.0%) | 6 (100.0%) |
| Total (Overall) | 27 (64.3%) | 15 (35.7%) |
Sales and Office Occupations
The most common Sales and Office occupations in Free Soil are Sales & Related (2 | 4.8%), and Office & Administration (1 | 2.4%).
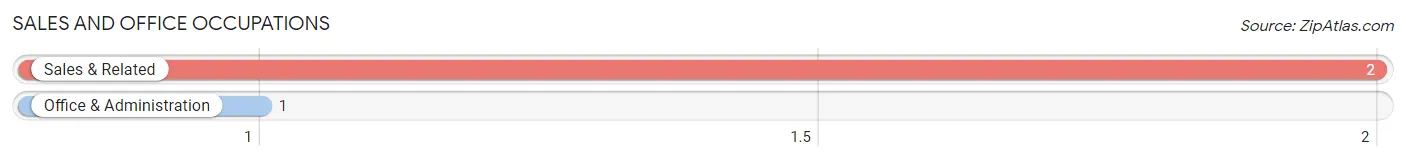
Sales and Office Occupations by Sex
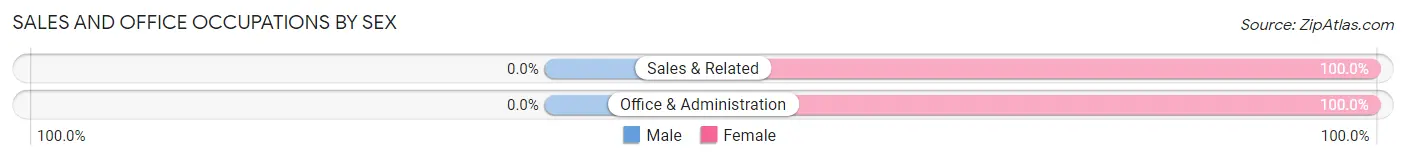
| Occupation | Male | Female |
| Sales & Related | 0 (0.0%) | 2 (100.0%) |
| Office & Administration | 0 (0.0%) | 1 (100.0%) |
| Total (Category) | 0 (0.0%) | 3 (100.0%) |
| Total (Overall) | 27 (64.3%) | 15 (35.7%) |
Natural Resources, Construction and Maintenance Occupations
The most common Natural Resources, Construction and Maintenance occupations in Free Soil are Farming, Fishing & Forestry (1 | 2.4%), and Construction & Extraction (1 | 2.4%).
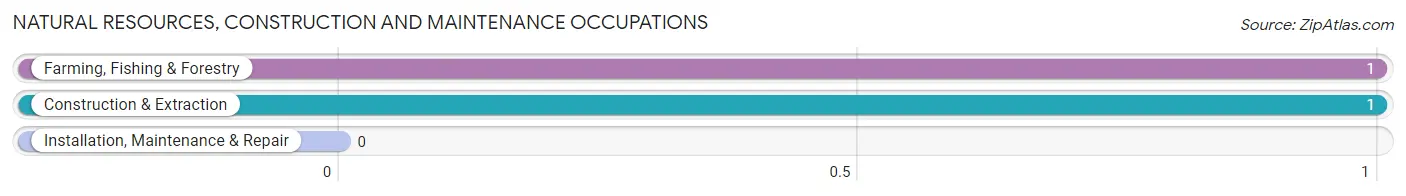
Natural Resources, Construction and Maintenance Occupations by Sex
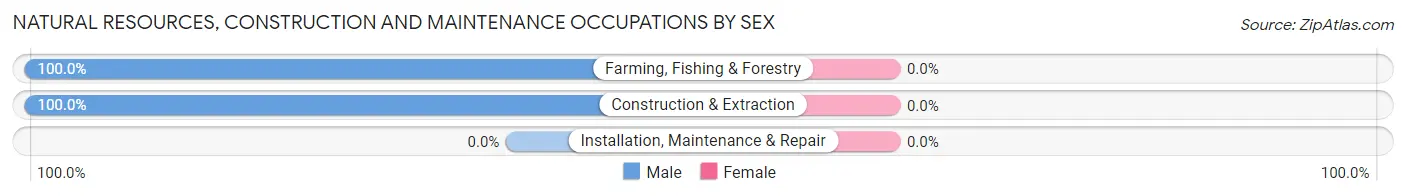
| Occupation | Male | Female |
| Farming, Fishing & Forestry | 1 (100.0%) | 0 (0.0%) |
| Construction & Extraction | 1 (100.0%) | 0 (0.0%) |
| Installation, Maintenance & Repair | 0 (0.0%) | 0 (0.0%) |
| Total (Category) | 2 (100.0%) | 0 (0.0%) |
| Total (Overall) | 27 (64.3%) | 15 (35.7%) |
Production, Transportation and Moving Occupations
The most common Production, Transportation and Moving occupations in Free Soil are Production (12 | 28.6%), Transportation (11 | 26.2%), and Material Moving (1 | 2.4%).
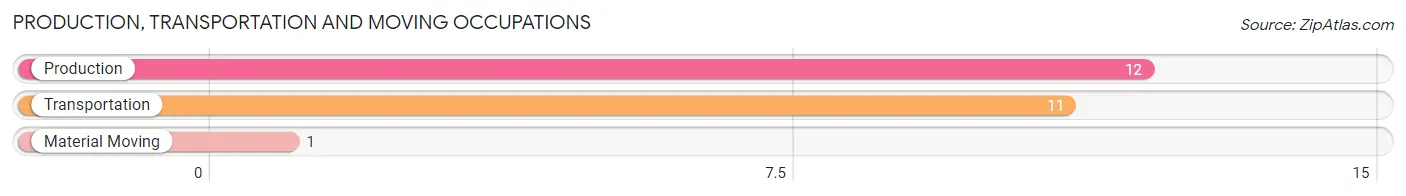
Production, Transportation and Moving Occupations by Sex
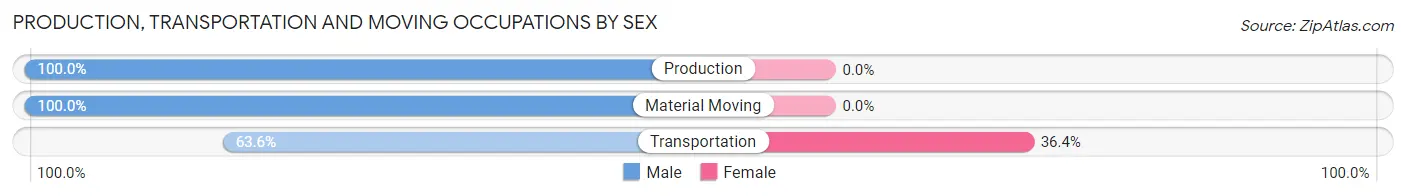
| Occupation | Male | Female |
| Production | 12 (100.0%) | 0 (0.0%) |
| Transportation | 7 (63.6%) | 4 (36.4%) |
| Material Moving | 1 (100.0%) | 0 (0.0%) |
| Total (Category) | 20 (83.3%) | 4 (16.7%) |
| Total (Overall) | 27 (64.3%) | 15 (35.7%) |
Employment Industries by Sex in Free Soil
Employment Industries in Free Soil
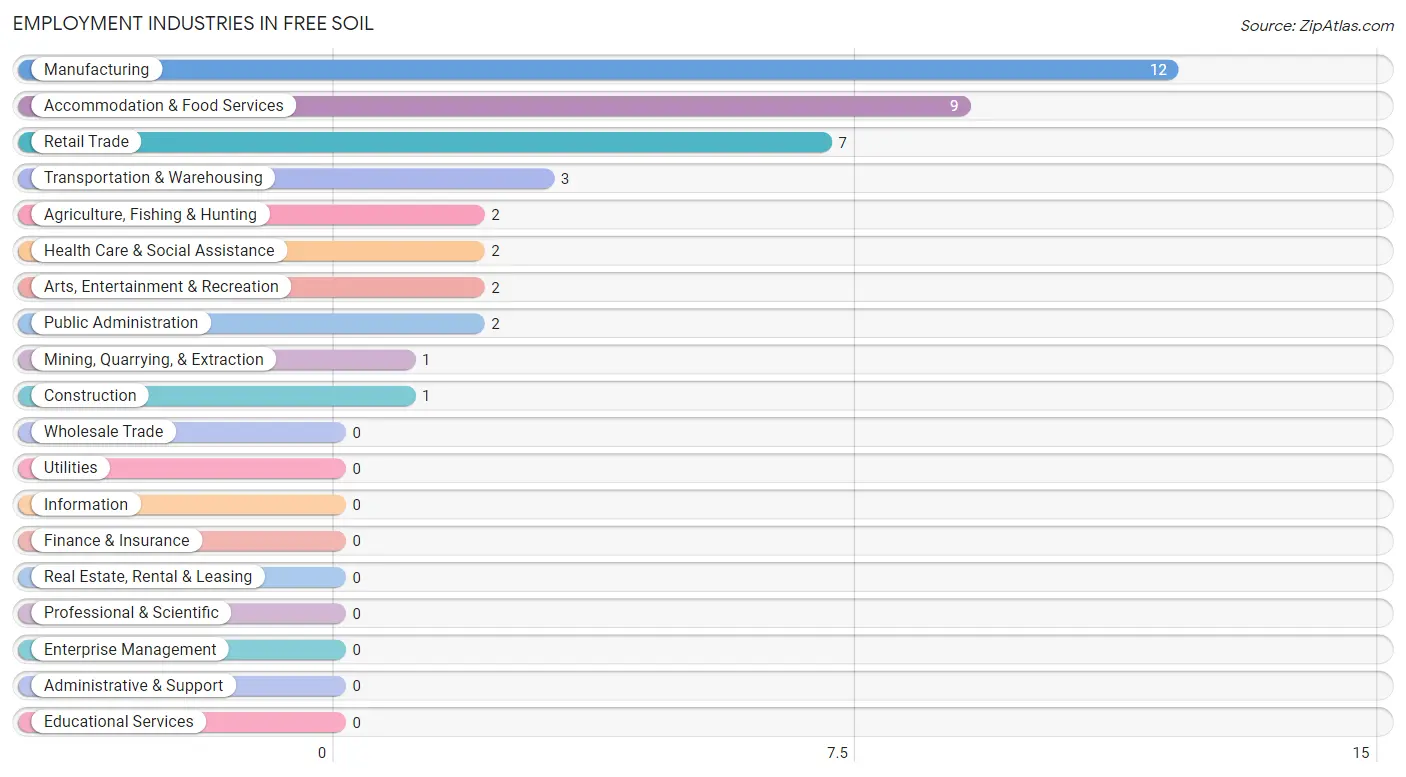
The major employment industries in Free Soil include Manufacturing (12 | 28.6%), Accommodation & Food Services (9 | 21.4%), Retail Trade (7 | 16.7%), Transportation & Warehousing (3 | 7.1%), and Agriculture, Fishing & Hunting (2 | 4.8%).
Employment Industries by Sex in Free Soil
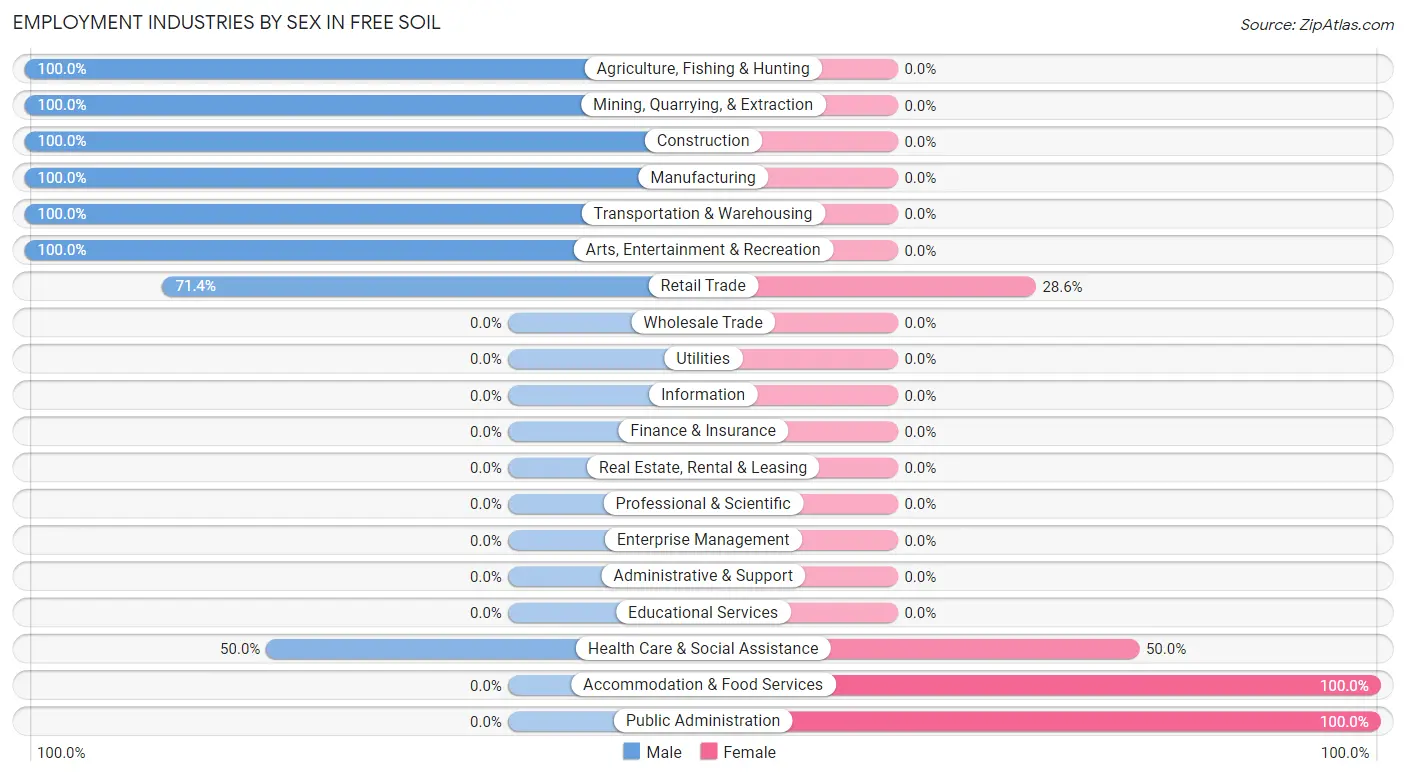
The Free Soil industries that see more men than women are Agriculture, Fishing & Hunting (100.0%), Mining, Quarrying, & Extraction (100.0%), and Construction (100.0%), whereas the industries that tend to have a higher number of women are Accommodation & Food Services (100.0%), Public Administration (100.0%), and Health Care & Social Assistance (50.0%).
| Industry | Male | Female |
| Agriculture, Fishing & Hunting | 2 (100.0%) | 0 (0.0%) |
| Mining, Quarrying, & Extraction | 1 (100.0%) | 0 (0.0%) |
| Construction | 1 (100.0%) | 0 (0.0%) |
| Manufacturing | 12 (100.0%) | 0 (0.0%) |
| Wholesale Trade | 0 (0.0%) | 0 (0.0%) |
| Retail Trade | 5 (71.4%) | 2 (28.6%) |
| Transportation & Warehousing | 3 (100.0%) | 0 (0.0%) |
| Utilities | 0 (0.0%) | 0 (0.0%) |
| Information | 0 (0.0%) | 0 (0.0%) |
| Finance & Insurance | 0 (0.0%) | 0 (0.0%) |
| Real Estate, Rental & Leasing | 0 (0.0%) | 0 (0.0%) |
| Professional & Scientific | 0 (0.0%) | 0 (0.0%) |
| Enterprise Management | 0 (0.0%) | 0 (0.0%) |
| Administrative & Support | 0 (0.0%) | 0 (0.0%) |
| Educational Services | 0 (0.0%) | 0 (0.0%) |
| Health Care & Social Assistance | 1 (50.0%) | 1 (50.0%) |
| Arts, Entertainment & Recreation | 2 (100.0%) | 0 (0.0%) |
| Accommodation & Food Services | 0 (0.0%) | 9 (100.0%) |
| Public Administration | 0 (0.0%) | 2 (100.0%) |
| Total | 27 (64.3%) | 15 (35.7%) |
Education in Free Soil
School Enrollment in Free Soil
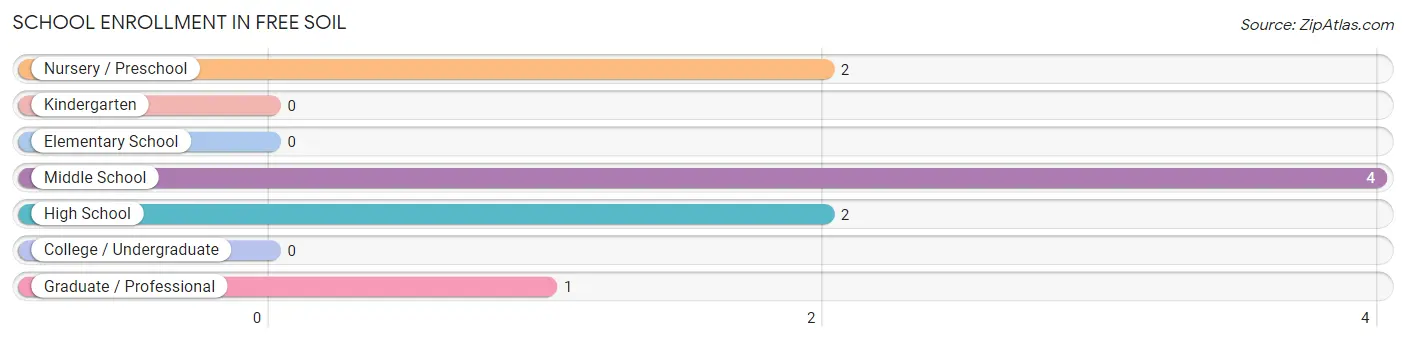
The most common levels of schooling among the 9 students in Free Soil are middle school (4 | 44.4%), nursery / preschool (2 | 22.2%), and high school (2 | 22.2%).
| School Level | # Students | % Students |
| Nursery / Preschool | 2 | 22.2% |
| Kindergarten | 0 | 0.0% |
| Elementary School | 0 | 0.0% |
| Middle School | 4 | 44.4% |
| High School | 2 | 22.2% |
| College / Undergraduate | 0 | 0.0% |
| Graduate / Professional | 1 | 11.1% |
| Total | 9 | 100.0% |
School Enrollment by Age by Funding Source in Free Soil
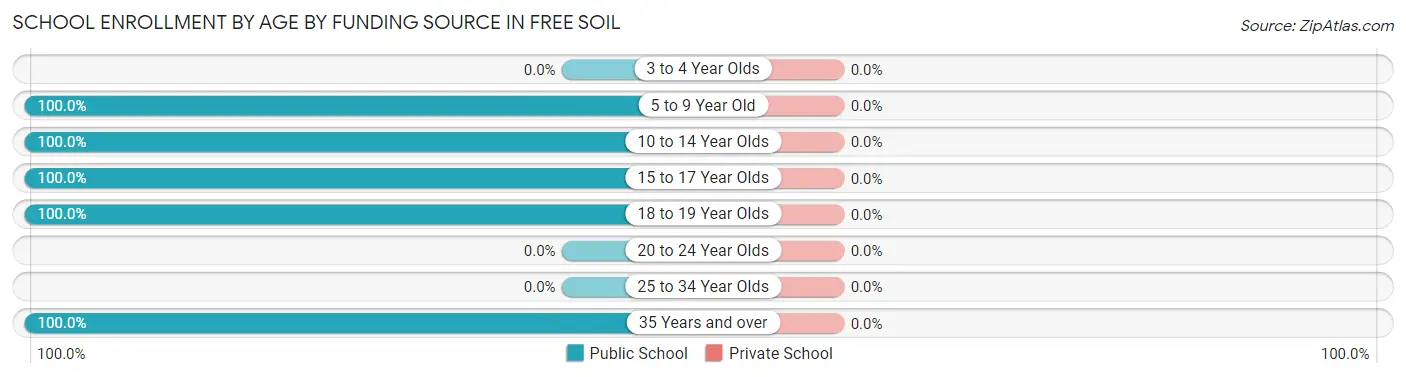
| Age Bracket | Public School | Private School |
| 3 to 4 Year Olds | 0 (0.0%) | 0 (0.0%) |
| 5 to 9 Year Old | 2 (100.0%) | 0 (0.0%) |
| 10 to 14 Year Olds | 4 (100.0%) | 0 (0.0%) |
| 15 to 17 Year Olds | 1 (100.0%) | 0 (0.0%) |
| 18 to 19 Year Olds | 1 (100.0%) | 0 (0.0%) |
| 20 to 24 Year Olds | 0 (0.0%) | 0 (0.0%) |
| 25 to 34 Year Olds | 0 (0.0%) | 0 (0.0%) |
| 35 Years and over | 1 (100.0%) | 0 (0.0%) |
| Total | 9 (100.0%) | 0 (0.0%) |
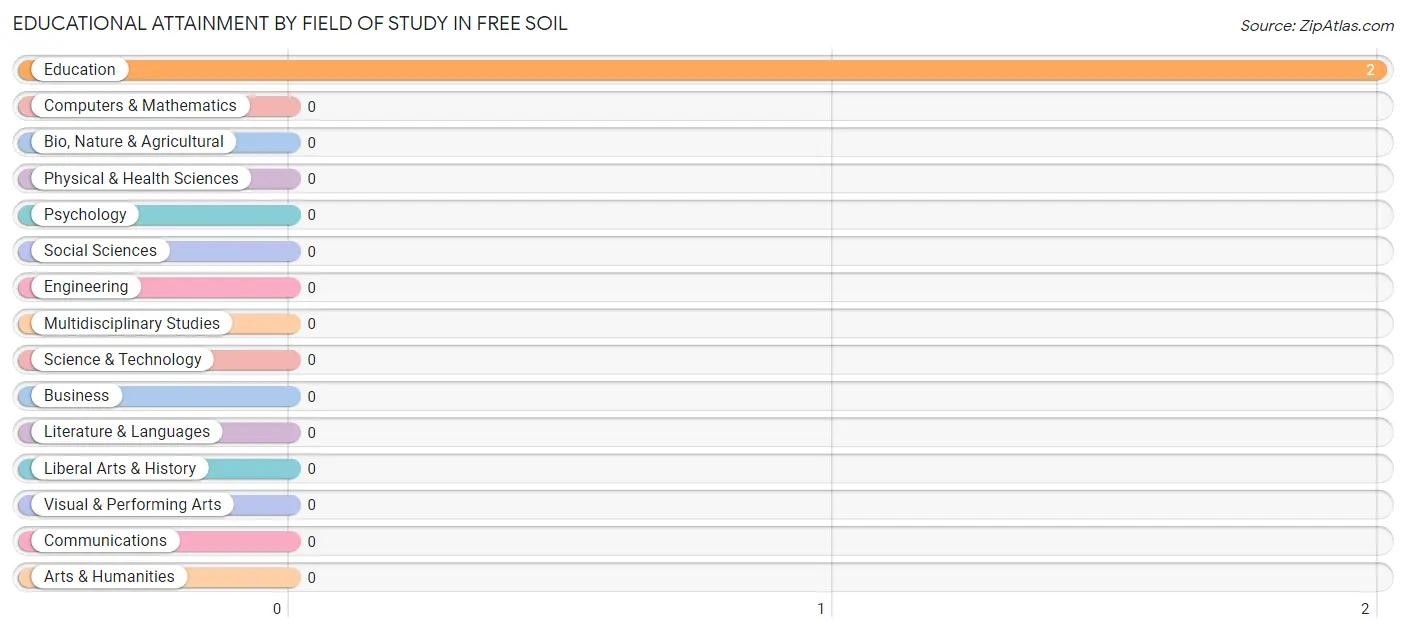
Educational Attainment by Field of Study in Free Soil
, and education (2 | 100.0%) are the most common fields of study among 2 individuals in Free Soil who have obtained a bachelor's degree or higher.
| Field of Study | # Graduates | % Graduates |
| Computers & Mathematics | 0 | 0.0% |
| Bio, Nature & Agricultural | 0 | 0.0% |
| Physical & Health Sciences | 0 | 0.0% |
| Psychology | 0 | 0.0% |
| Social Sciences | 0 | 0.0% |
| Engineering | 0 | 0.0% |
| Multidisciplinary Studies | 0 | 0.0% |
| Science & Technology | 0 | 0.0% |
| Business | 0 | 0.0% |
| Education | 2 | 100.0% |
| Literature & Languages | 0 | 0.0% |
| Liberal Arts & History | 0 | 0.0% |
| Visual & Performing Arts | 0 | 0.0% |
| Communications | 0 | 0.0% |
| Arts & Humanities | 0 | 0.0% |
| Total | 2 | 100.0% |
Transportation & Commute in Free Soil
Vehicle Availability by Sex in Free Soil
The most prevalent vehicle ownership categories in Free Soil are males with 2 vehicles (14, accounting for 51.8%) and females with 2 vehicles (6, making up 93.3%).

| Vehicles Available | Male | Female |
| No Vehicle | 0 (0.0%) | 0 (0.0%) |
| 1 Vehicle | 5 (18.5%) | 2 (13.3%) |
| 2 Vehicles | 14 (51.8%) | 6 (40.0%) |
| 3 Vehicles | 0 (0.0%) | 0 (0.0%) |
| 4 Vehicles | 5 (18.5%) | 3 (20.0%) |
| 5 or more Vehicles | 3 (11.1%) | 4 (26.7%) |
| Total | 27 (100.0%) | 15 (100.0%) |
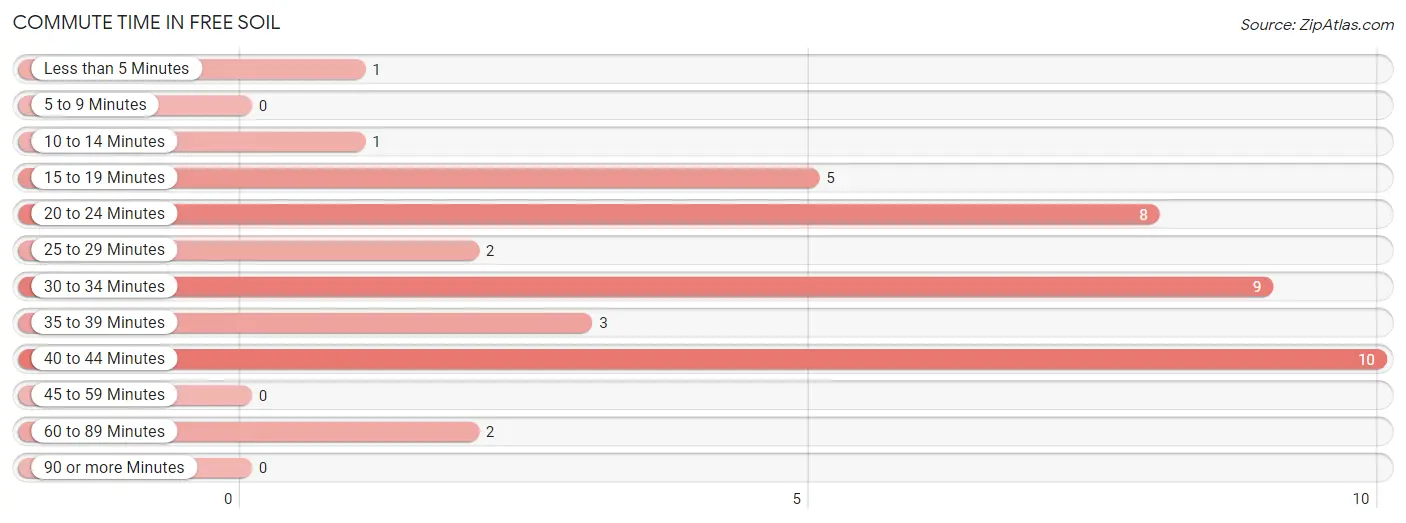
Commute Time in Free Soil
The most frequently occuring commute durations in Free Soil are 40 to 44 minutes (10 commuters, 24.4%), 30 to 34 minutes (9 commuters, 22.0%), and 20 to 24 minutes (8 commuters, 19.5%).
| Commute Time | # Commuters | % Commuters |
| Less than 5 Minutes | 1 | 2.4% |
| 5 to 9 Minutes | 0 | 0.0% |
| 10 to 14 Minutes | 1 | 2.4% |
| 15 to 19 Minutes | 5 | 12.2% |
| 20 to 24 Minutes | 8 | 19.5% |
| 25 to 29 Minutes | 2 | 4.9% |
| 30 to 34 Minutes | 9 | 22.0% |
| 35 to 39 Minutes | 3 | 7.3% |
| 40 to 44 Minutes | 10 | 24.4% |
| 45 to 59 Minutes | 0 | 0.0% |
| 60 to 89 Minutes | 2 | 4.9% |
| 90 or more Minutes | 0 | 0.0% |
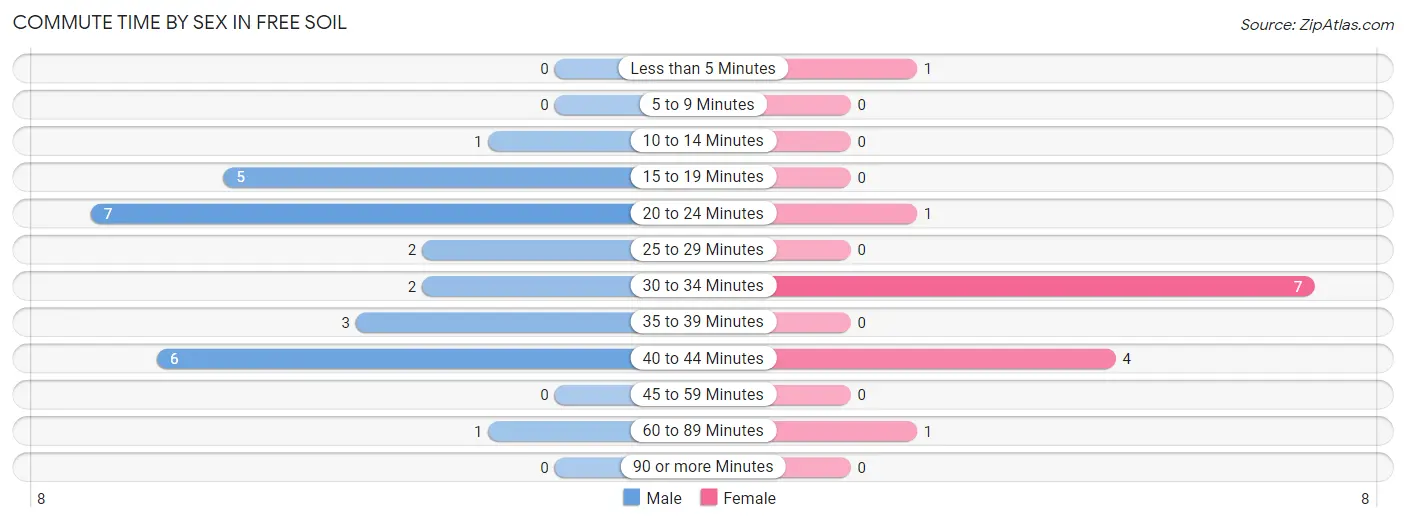
Commute Time by Sex in Free Soil
The most common commute times in Free Soil are 20 to 24 minutes (7 commuters, 25.9%) for males and 30 to 34 minutes (7 commuters, 50.0%) for females.
| Commute Time | Male | Female |
| Less than 5 Minutes | 0 (0.0%) | 1 (7.1%) |
| 5 to 9 Minutes | 0 (0.0%) | 0 (0.0%) |
| 10 to 14 Minutes | 1 (3.7%) | 0 (0.0%) |
| 15 to 19 Minutes | 5 (18.5%) | 0 (0.0%) |
| 20 to 24 Minutes | 7 (25.9%) | 1 (7.1%) |
| 25 to 29 Minutes | 2 (7.4%) | 0 (0.0%) |
| 30 to 34 Minutes | 2 (7.4%) | 7 (50.0%) |
| 35 to 39 Minutes | 3 (11.1%) | 0 (0.0%) |
| 40 to 44 Minutes | 6 (22.2%) | 4 (28.6%) |
| 45 to 59 Minutes | 0 (0.0%) | 0 (0.0%) |
| 60 to 89 Minutes | 1 (3.7%) | 1 (7.1%) |
| 90 or more Minutes | 0 (0.0%) | 0 (0.0%) |
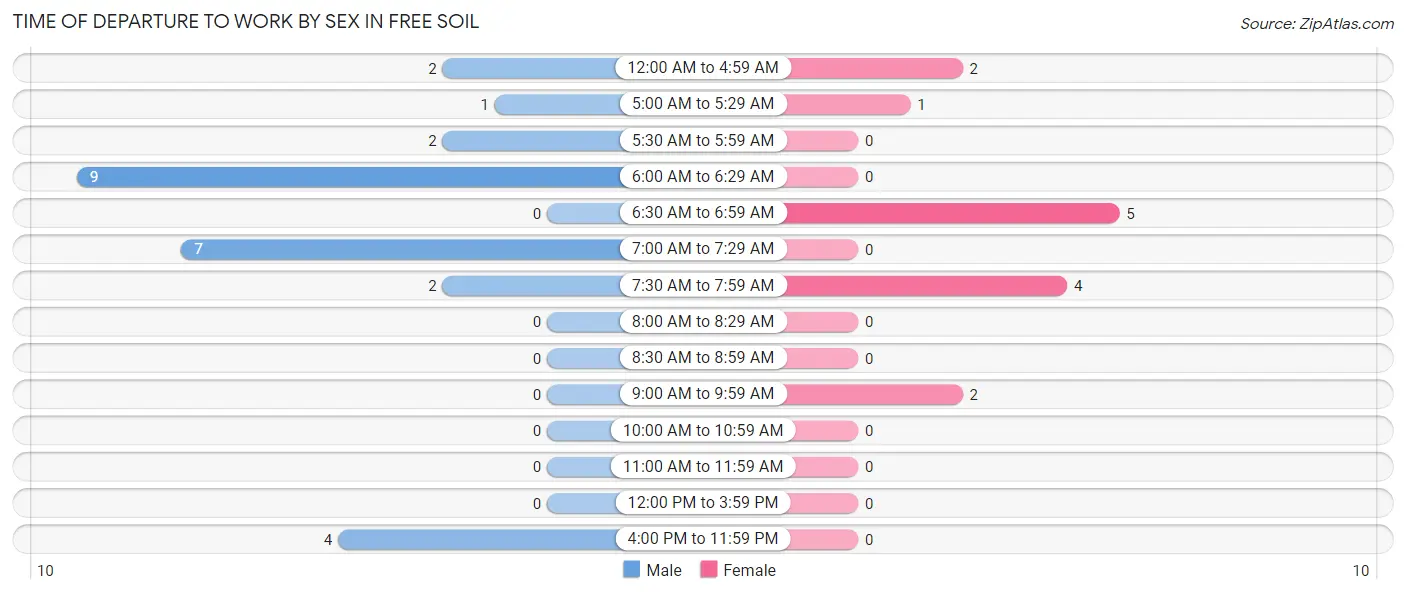
Time of Departure to Work by Sex in Free Soil
The most frequent times of departure to work in Free Soil are 6:00 AM to 6:29 AM (9, 33.3%) for males and 6:30 AM to 6:59 AM (5, 35.7%) for females.
| Time of Departure | Male | Female |
| 12:00 AM to 4:59 AM | 2 (7.4%) | 2 (14.3%) |
| 5:00 AM to 5:29 AM | 1 (3.7%) | 1 (7.1%) |
| 5:30 AM to 5:59 AM | 2 (7.4%) | 0 (0.0%) |
| 6:00 AM to 6:29 AM | 9 (33.3%) | 0 (0.0%) |
| 6:30 AM to 6:59 AM | 0 (0.0%) | 5 (35.7%) |
| 7:00 AM to 7:29 AM | 7 (25.9%) | 0 (0.0%) |
| 7:30 AM to 7:59 AM | 2 (7.4%) | 4 (28.6%) |
| 8:00 AM to 8:29 AM | 0 (0.0%) | 0 (0.0%) |
| 8:30 AM to 8:59 AM | 0 (0.0%) | 0 (0.0%) |
| 9:00 AM to 9:59 AM | 0 (0.0%) | 2 (14.3%) |
| 10:00 AM to 10:59 AM | 0 (0.0%) | 0 (0.0%) |
| 11:00 AM to 11:59 AM | 0 (0.0%) | 0 (0.0%) |
| 12:00 PM to 3:59 PM | 0 (0.0%) | 0 (0.0%) |
| 4:00 PM to 11:59 PM | 4 (14.8%) | 0 (0.0%) |
| Total | 27 (100.0%) | 14 (100.0%) |
Housing Occupancy in Free Soil
Occupancy by Ownership in Free Soil
Of the total 49 dwellings in Free Soil, owner-occupied units account for 42 (85.7%), while renter-occupied units make up 7 (14.3%).
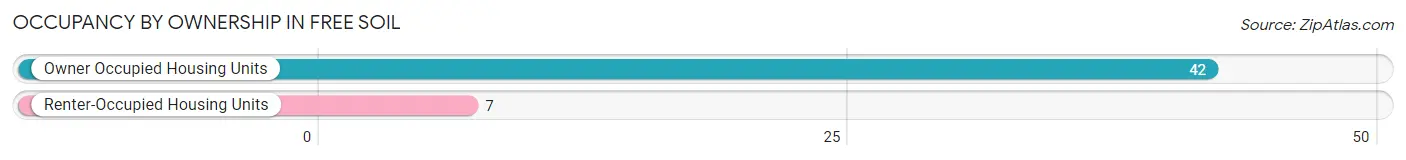
| Occupancy | # Housing Units | % Housing Units |
| Owner Occupied Housing Units | 42 | 85.7% |
| Renter-Occupied Housing Units | 7 | 14.3% |
| Total Occupied Housing Units | 49 | 100.0% |
Occupancy by Household Size in Free Soil
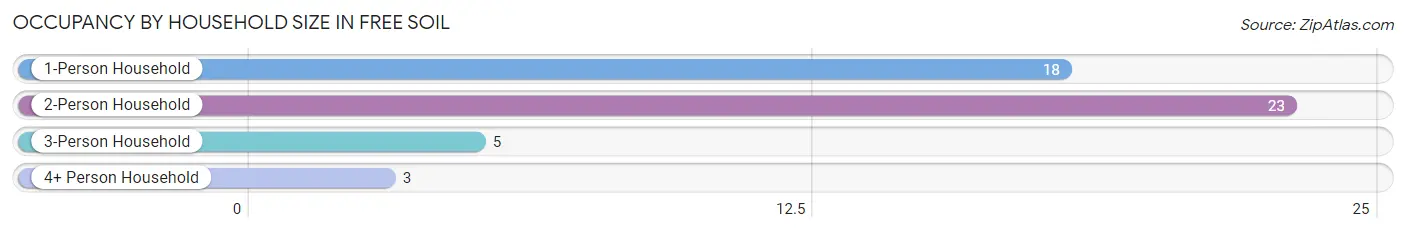
| Household Size | # Housing Units | % Housing Units |
| 1-Person Household | 18 | 36.7% |
| 2-Person Household | 23 | 46.9% |
| 3-Person Household | 5 | 10.2% |
| 4+ Person Household | 3 | 6.1% |
| Total Housing Units | 49 | 100.0% |
Occupancy by Ownership by Household Size in Free Soil
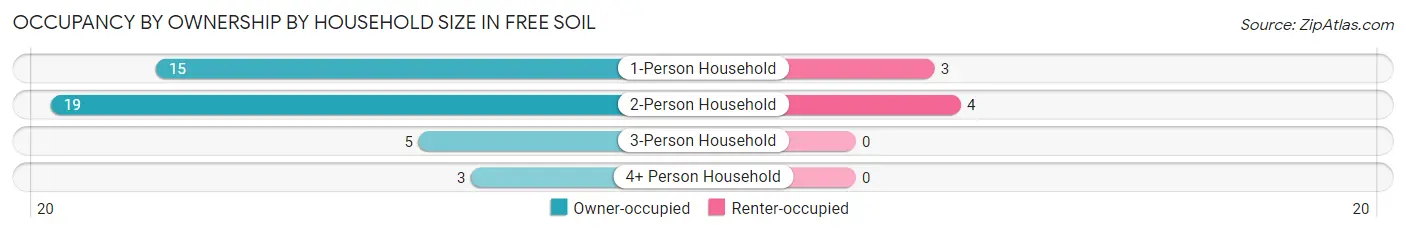
| Household Size | Owner-occupied | Renter-occupied |
| 1-Person Household | 15 (83.3%) | 3 (16.7%) |
| 2-Person Household | 19 (82.6%) | 4 (17.4%) |
| 3-Person Household | 5 (100.0%) | 0 (0.0%) |
| 4+ Person Household | 3 (100.0%) | 0 (0.0%) |
| Total Housing Units | 42 (85.7%) | 7 (14.3%) |
Occupancy by Educational Attainment in Free Soil
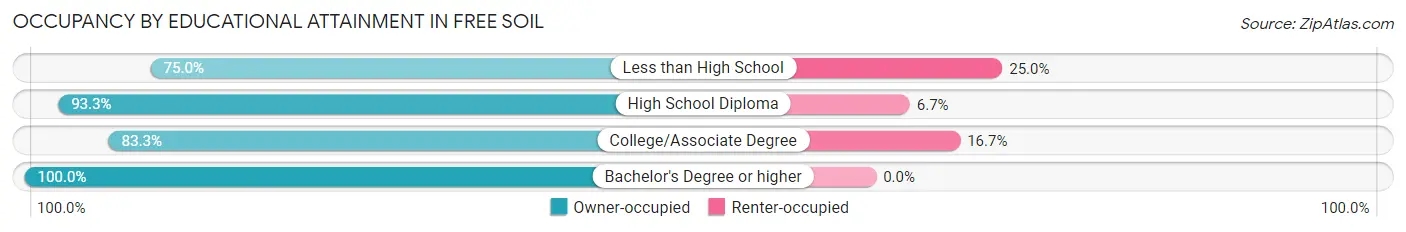
| Household Size | Owner-occupied | Renter-occupied |
| Less than High School | 6 (75.0%) | 2 (25.0%) |
| High School Diploma | 14 (93.3%) | 1 (6.7%) |
| College/Associate Degree | 20 (83.3%) | 4 (16.7%) |
| Bachelor's Degree or higher | 2 (100.0%) | 0 (0.0%) |
Occupancy by Age of Householder in Free Soil
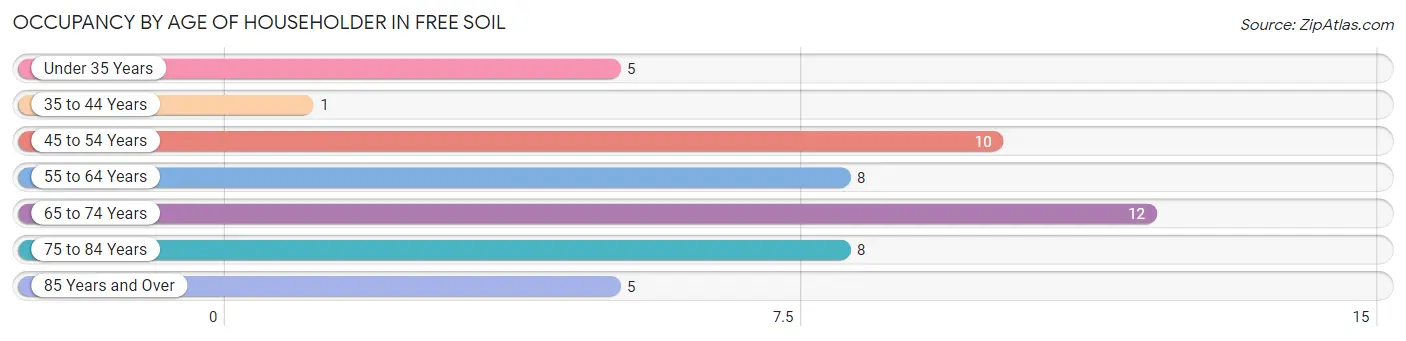
| Age Bracket | # Households | % Households |
| Under 35 Years | 5 | 10.2% |
| 35 to 44 Years | 1 | 2.0% |
| 45 to 54 Years | 10 | 20.4% |
| 55 to 64 Years | 8 | 16.3% |
| 65 to 74 Years | 12 | 24.5% |
| 75 to 84 Years | 8 | 16.3% |
| 85 Years and Over | 5 | 10.2% |
| Total | 49 | 100.0% |
Housing Finances in Free Soil
Median Income by Occupancy in Free Soil
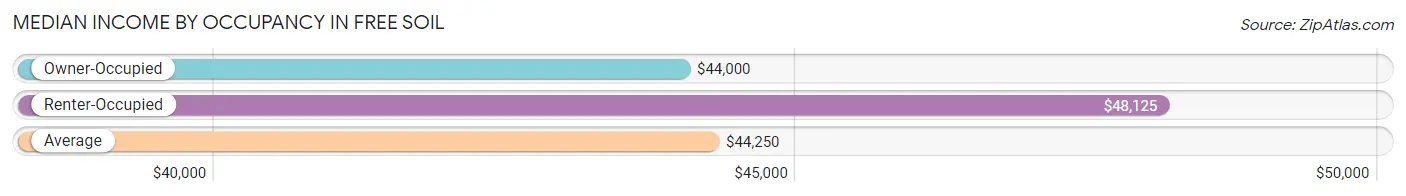
| Occupancy Type | # Households | Median Income |
| Owner-Occupied | 42 (85.7%) | $44,000 |
| Renter-Occupied | 7 (14.3%) | $48,125 |
| Average | 49 (100.0%) | $44,250 |
Occupancy by Householder Income Bracket in Free Soil
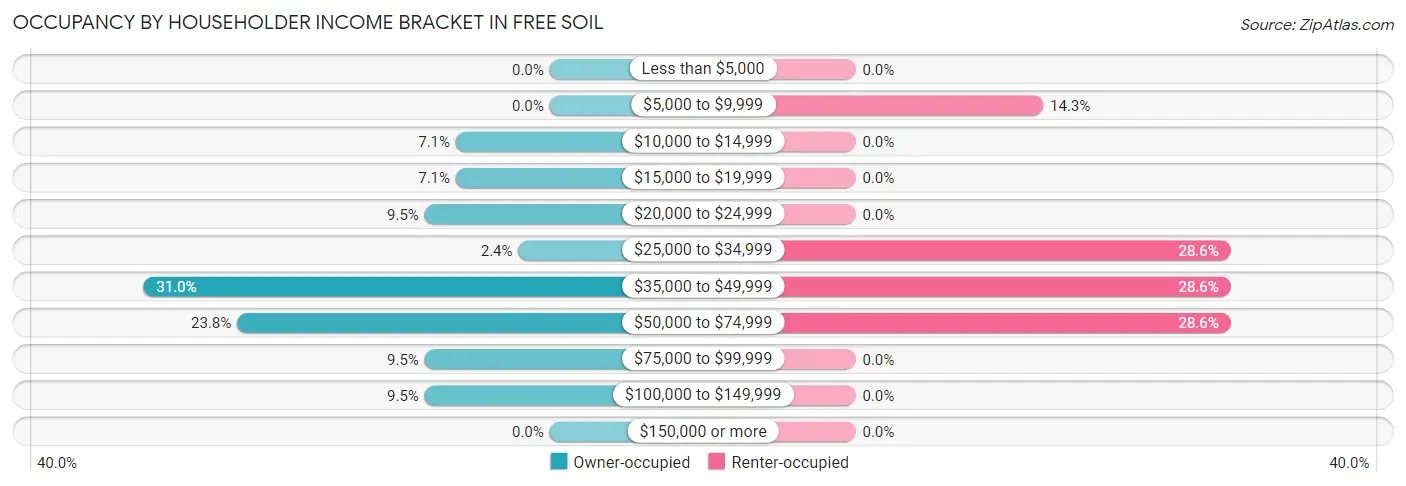
| Income Bracket | Owner-occupied | Renter-occupied |
| Less than $5,000 | 0 (0.0%) | 0 (0.0%) |
| $5,000 to $9,999 | 0 (0.0%) | 1 (14.3%) |
| $10,000 to $14,999 | 3 (7.1%) | 0 (0.0%) |
| $15,000 to $19,999 | 3 (7.1%) | 0 (0.0%) |
| $20,000 to $24,999 | 4 (9.5%) | 0 (0.0%) |
| $25,000 to $34,999 | 1 (2.4%) | 2 (28.6%) |
| $35,000 to $49,999 | 13 (30.9%) | 2 (28.6%) |
| $50,000 to $74,999 | 10 (23.8%) | 2 (28.6%) |
| $75,000 to $99,999 | 4 (9.5%) | 0 (0.0%) |
| $100,000 to $149,999 | 4 (9.5%) | 0 (0.0%) |
| $150,000 or more | 0 (0.0%) | 0 (0.0%) |
| Total | 42 (100.0%) | 7 (100.0%) |
Monthly Housing Cost Tiers in Free Soil
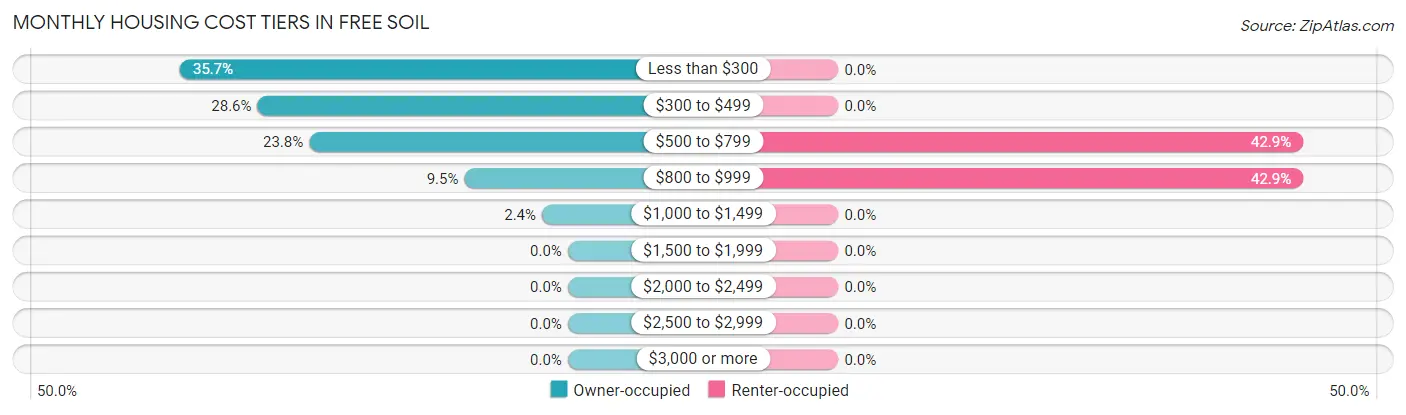
| Monthly Cost | Owner-occupied | Renter-occupied |
| Less than $300 | 15 (35.7%) | 0 (0.0%) |
| $300 to $499 | 12 (28.6%) | 0 (0.0%) |
| $500 to $799 | 10 (23.8%) | 3 (42.9%) |
| $800 to $999 | 4 (9.5%) | 3 (42.9%) |
| $1,000 to $1,499 | 1 (2.4%) | 0 (0.0%) |
| $1,500 to $1,999 | 0 (0.0%) | 0 (0.0%) |
| $2,000 to $2,499 | 0 (0.0%) | 0 (0.0%) |
| $2,500 to $2,999 | 0 (0.0%) | 0 (0.0%) |
| $3,000 or more | 0 (0.0%) | 0 (0.0%) |
| Total | 42 (100.0%) | 7 (100.0%) |
Physical Housing Characteristics in Free Soil
Housing Structures in Free Soil
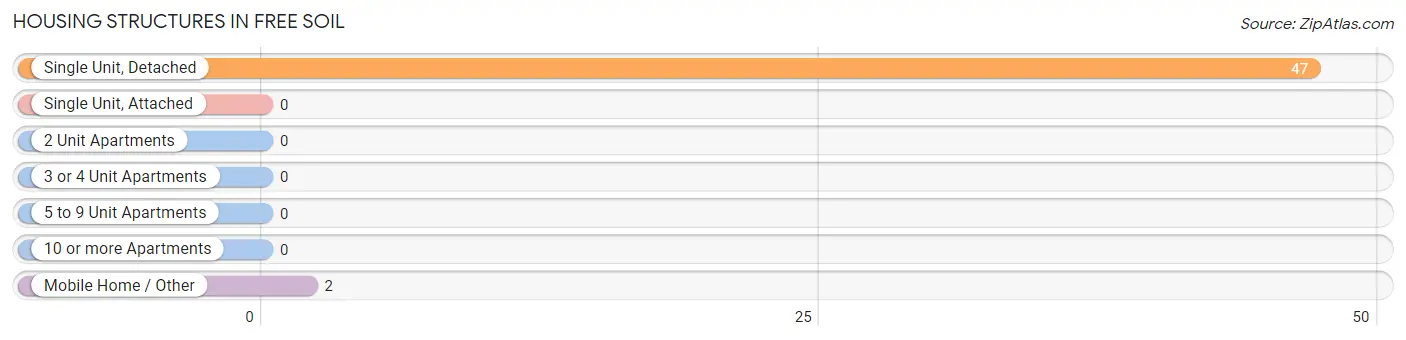
| Structure Type | # Housing Units | % Housing Units |
| Single Unit, Detached | 47 | 95.9% |
| Single Unit, Attached | 0 | 0.0% |
| 2 Unit Apartments | 0 | 0.0% |
| 3 or 4 Unit Apartments | 0 | 0.0% |
| 5 to 9 Unit Apartments | 0 | 0.0% |
| 10 or more Apartments | 0 | 0.0% |
| Mobile Home / Other | 2 | 4.1% |
| Total | 49 | 100.0% |
Housing Structures by Occupancy in Free Soil
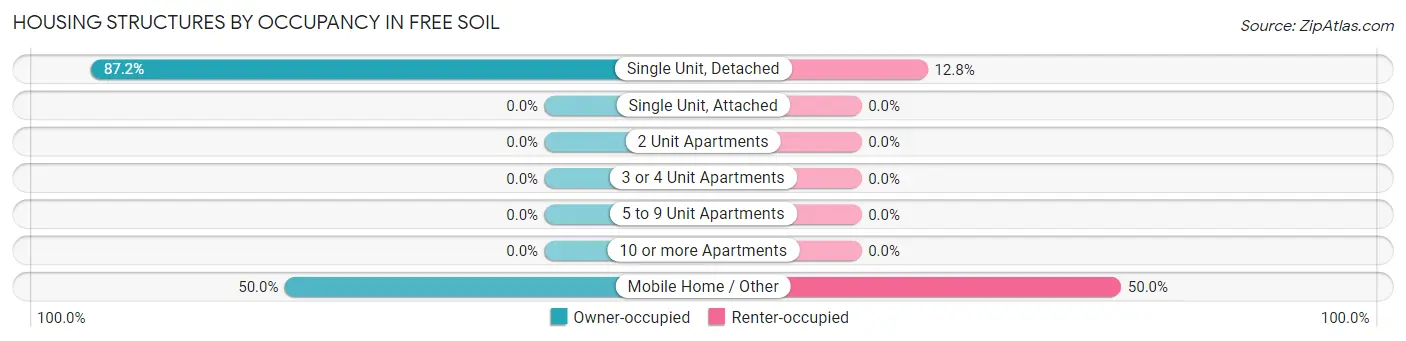
| Structure Type | Owner-occupied | Renter-occupied |
| Single Unit, Detached | 41 (87.2%) | 6 (12.8%) |
| Single Unit, Attached | 0 (0.0%) | 0 (0.0%) |
| 2 Unit Apartments | 0 (0.0%) | 0 (0.0%) |
| 3 or 4 Unit Apartments | 0 (0.0%) | 0 (0.0%) |
| 5 to 9 Unit Apartments | 0 (0.0%) | 0 (0.0%) |
| 10 or more Apartments | 0 (0.0%) | 0 (0.0%) |
| Mobile Home / Other | 1 (50.0%) | 1 (50.0%) |
| Total | 42 (85.7%) | 7 (14.3%) |
Housing Structures by Number of Rooms in Free Soil
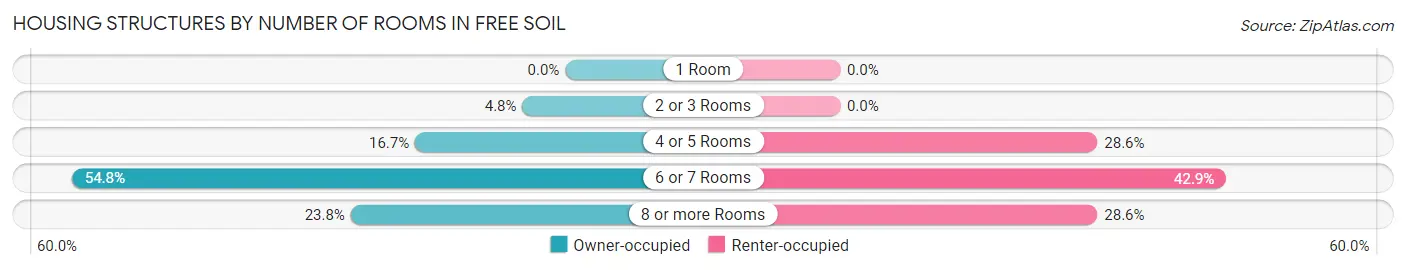
| Number of Rooms | Owner-occupied | Renter-occupied |
| 1 Room | 0 (0.0%) | 0 (0.0%) |
| 2 or 3 Rooms | 2 (4.8%) | 0 (0.0%) |
| 4 or 5 Rooms | 7 (16.7%) | 2 (28.6%) |
| 6 or 7 Rooms | 23 (54.8%) | 3 (42.9%) |
| 8 or more Rooms | 10 (23.8%) | 2 (28.6%) |
| Total | 42 (100.0%) | 7 (100.0%) |
Housing Structure by Heating Type in Free Soil
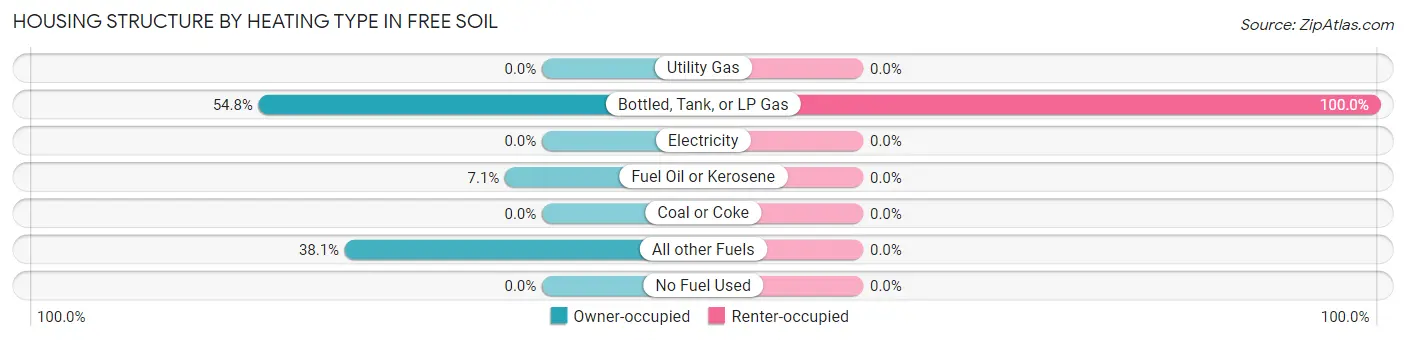
| Heating Type | Owner-occupied | Renter-occupied |
| Utility Gas | 0 (0.0%) | 0 (0.0%) |
| Bottled, Tank, or LP Gas | 23 (54.8%) | 7 (100.0%) |
| Electricity | 0 (0.0%) | 0 (0.0%) |
| Fuel Oil or Kerosene | 3 (7.1%) | 0 (0.0%) |
| Coal or Coke | 0 (0.0%) | 0 (0.0%) |
| All other Fuels | 16 (38.1%) | 0 (0.0%) |
| No Fuel Used | 0 (0.0%) | 0 (0.0%) |
| Total | 42 (100.0%) | 7 (100.0%) |
Household Vehicle Usage in Free Soil
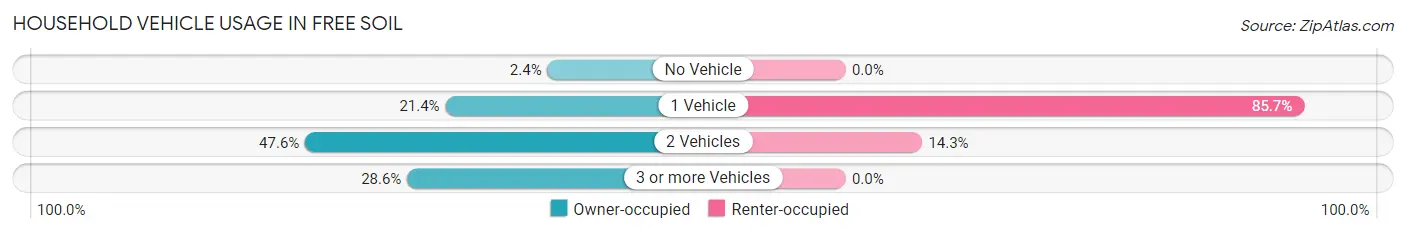
| Vehicles per Household | Owner-occupied | Renter-occupied |
| No Vehicle | 1 (2.4%) | 0 (0.0%) |
| 1 Vehicle | 9 (21.4%) | 6 (85.7%) |
| 2 Vehicles | 20 (47.6%) | 1 (14.3%) |
| 3 or more Vehicles | 12 (28.6%) | 0 (0.0%) |
| Total | 42 (100.0%) | 7 (100.0%) |
Real Estate & Mortgages in Free Soil
Real Estate and Mortgage Overview in Free Soil
| Characteristic | Without Mortgage | With Mortgage |
| Housing Units | 33 | 9 |
| Median Property Value | $88,800 | $52,500 |
| Median Household Income | $42,750 | $0 |
| Monthly Housing Costs | $325 | $0 |
| Real Estate Taxes | $1,069 | $0 |
Property Value by Mortgage Status in Free Soil
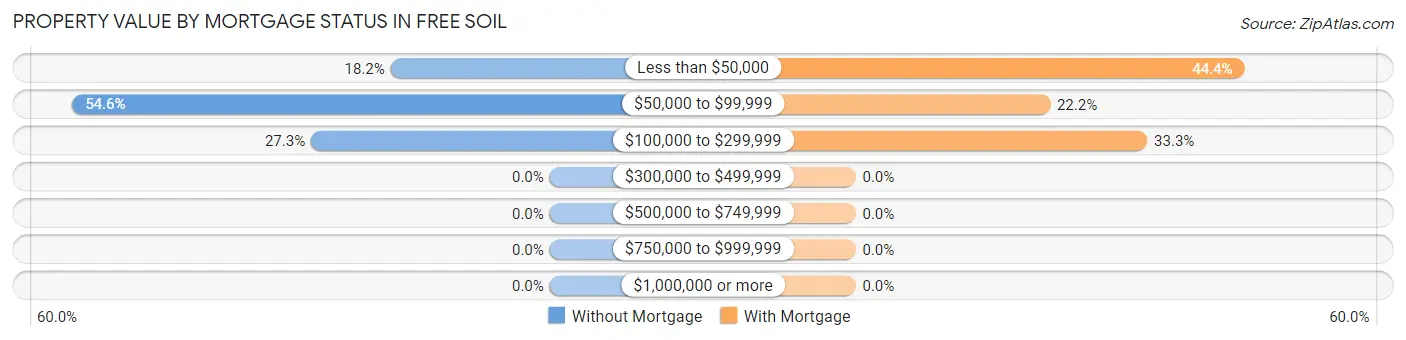
| Property Value | Without Mortgage | With Mortgage |
| Less than $50,000 | 6 (18.2%) | 4 (44.4%) |
| $50,000 to $99,999 | 18 (54.5%) | 2 (22.2%) |
| $100,000 to $299,999 | 9 (27.3%) | 3 (33.3%) |
| $300,000 to $499,999 | 0 (0.0%) | 0 (0.0%) |
| $500,000 to $749,999 | 0 (0.0%) | 0 (0.0%) |
| $750,000 to $999,999 | 0 (0.0%) | 0 (0.0%) |
| $1,000,000 or more | 0 (0.0%) | 0 (0.0%) |
| Total | 33 (100.0%) | 9 (100.0%) |
Household Income by Mortgage Status in Free Soil
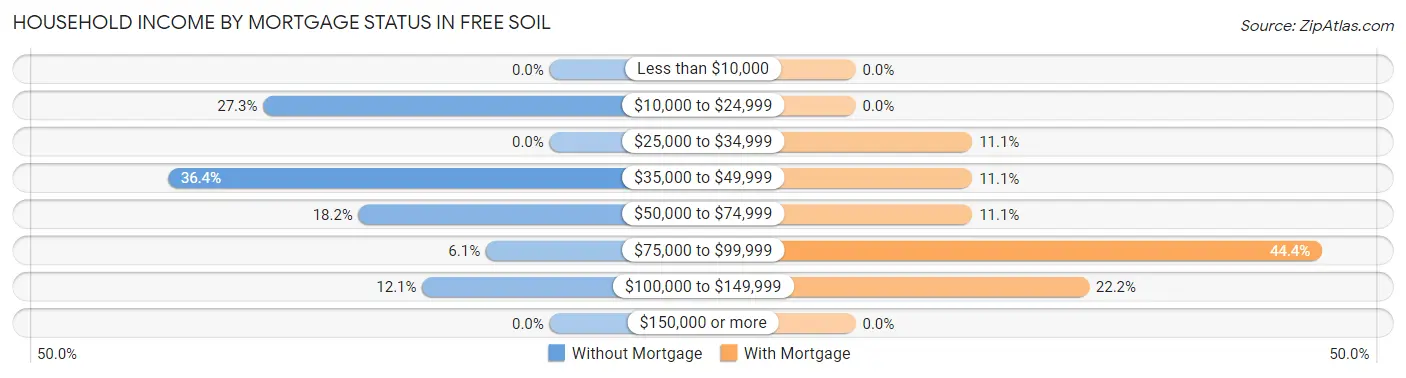
| Household Income | Without Mortgage | With Mortgage |
| Less than $10,000 | 0 (0.0%) | 0 (0.0%) |
| $10,000 to $24,999 | 9 (27.3%) | 0 (0.0%) |
| $25,000 to $34,999 | 0 (0.0%) | 1 (11.1%) |
| $35,000 to $49,999 | 12 (36.4%) | 1 (11.1%) |
| $50,000 to $74,999 | 6 (18.2%) | 1 (11.1%) |
| $75,000 to $99,999 | 2 (6.1%) | 4 (44.4%) |
| $100,000 to $149,999 | 4 (12.1%) | 2 (22.2%) |
| $150,000 or more | 0 (0.0%) | 0 (0.0%) |
| Total | 33 (100.0%) | 9 (100.0%) |
Property Value to Household Income Ratio in Free Soil
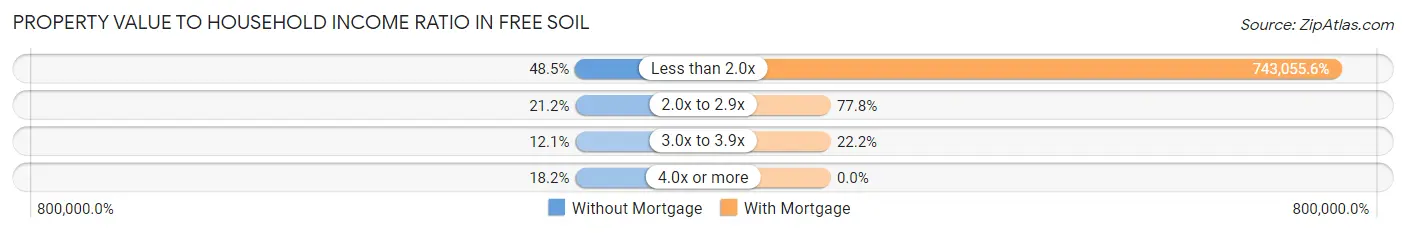
| Value-to-Income Ratio | Without Mortgage | With Mortgage |
| Less than 2.0x | 16 (48.5%) | 66,875 (743,055.6%) |
| 2.0x to 2.9x | 7 (21.2%) | 7 (77.8%) |
| 3.0x to 3.9x | 4 (12.1%) | 2 (22.2%) |
| 4.0x or more | 6 (18.2%) | 0 (0.0%) |
| Total | 33 (100.0%) | 9 (100.0%) |
Real Estate Taxes by Mortgage Status in Free Soil
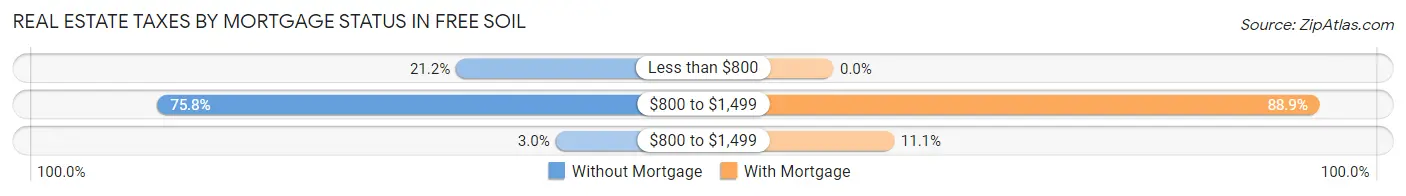
| Property Taxes | Without Mortgage | With Mortgage |
| Less than $800 | 7 (21.2%) | 0 (0.0%) |
| $800 to $1,499 | 25 (75.8%) | 8 (88.9%) |
| $800 to $1,499 | 1 (3.0%) | 1 (11.1%) |
| Total | 33 (100.0%) | 9 (100.0%) |
Health & Disability in Free Soil
Health Insurance Coverage by Age in Free Soil
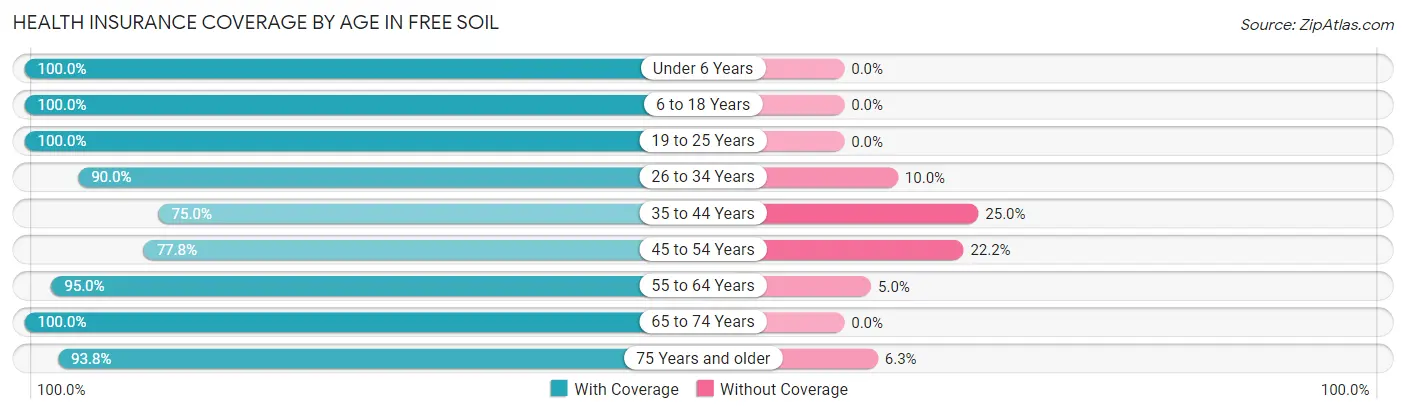
| Age Bracket | With Coverage | Without Coverage |
| Under 6 Years | 4 (100.0%) | 0 (0.0%) |
| 6 to 18 Years | 8 (100.0%) | 0 (0.0%) |
| 19 to 25 Years | 8 (100.0%) | 0 (0.0%) |
| 26 to 34 Years | 9 (90.0%) | 1 (10.0%) |
| 35 to 44 Years | 3 (75.0%) | 1 (25.0%) |
| 45 to 54 Years | 14 (77.8%) | 4 (22.2%) |
| 55 to 64 Years | 19 (95.0%) | 1 (5.0%) |
| 65 to 74 Years | 15 (100.0%) | 0 (0.0%) |
| 75 Years and older | 15 (93.8%) | 1 (6.2%) |
| Total | 95 (92.2%) | 8 (7.8%) |
Health Insurance Coverage by Citizenship Status in Free Soil
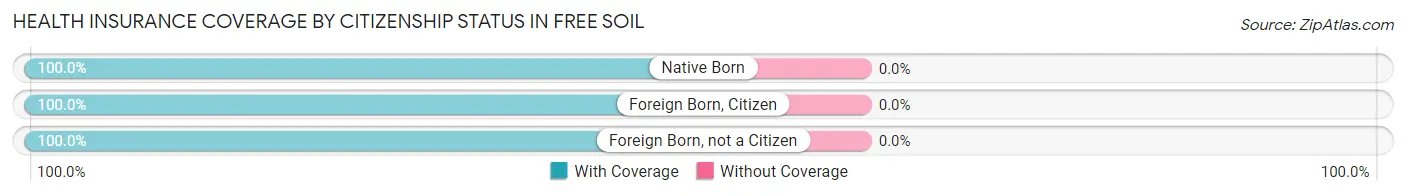
| Citizenship Status | With Coverage | Without Coverage |
| Native Born | 4 (100.0%) | 0 (0.0%) |
| Foreign Born, Citizen | 8 (100.0%) | 0 (0.0%) |
| Foreign Born, not a Citizen | 8 (100.0%) | 0 (0.0%) |
Health Insurance Coverage by Household Income in Free Soil
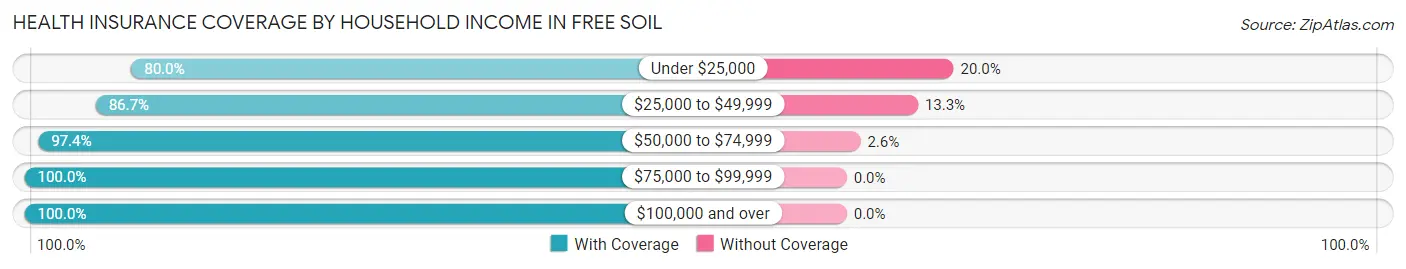
| Household Income | With Coverage | Without Coverage |
| Under $25,000 | 12 (80.0%) | 3 (20.0%) |
| $25,000 to $49,999 | 26 (86.7%) | 4 (13.3%) |
| $50,000 to $74,999 | 38 (97.4%) | 1 (2.6%) |
| $75,000 to $99,999 | 11 (100.0%) | 0 (0.0%) |
| $100,000 and over | 8 (100.0%) | 0 (0.0%) |
Public vs Private Health Insurance Coverage by Age in Free Soil
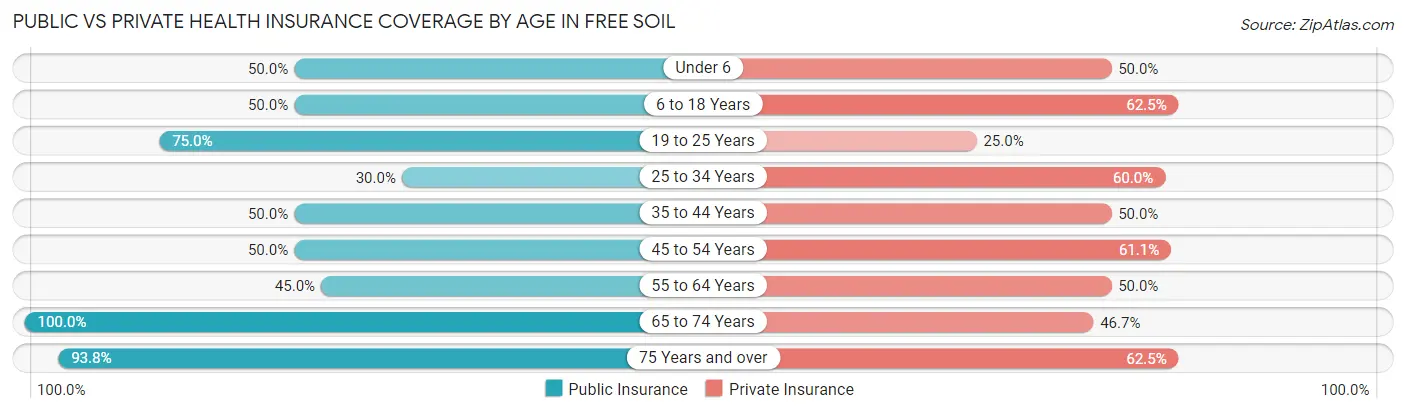
| Age Bracket | Public Insurance | Private Insurance |
| Under 6 | 2 (50.0%) | 2 (50.0%) |
| 6 to 18 Years | 4 (50.0%) | 5 (62.5%) |
| 19 to 25 Years | 6 (75.0%) | 2 (25.0%) |
| 25 to 34 Years | 3 (30.0%) | 6 (60.0%) |
| 35 to 44 Years | 2 (50.0%) | 2 (50.0%) |
| 45 to 54 Years | 9 (50.0%) | 11 (61.1%) |
| 55 to 64 Years | 9 (45.0%) | 10 (50.0%) |
| 65 to 74 Years | 15 (100.0%) | 7 (46.7%) |
| 75 Years and over | 15 (93.8%) | 10 (62.5%) |
| Total | 65 (63.1%) | 55 (53.4%) |
Disability Status by Sex by Age in Free Soil
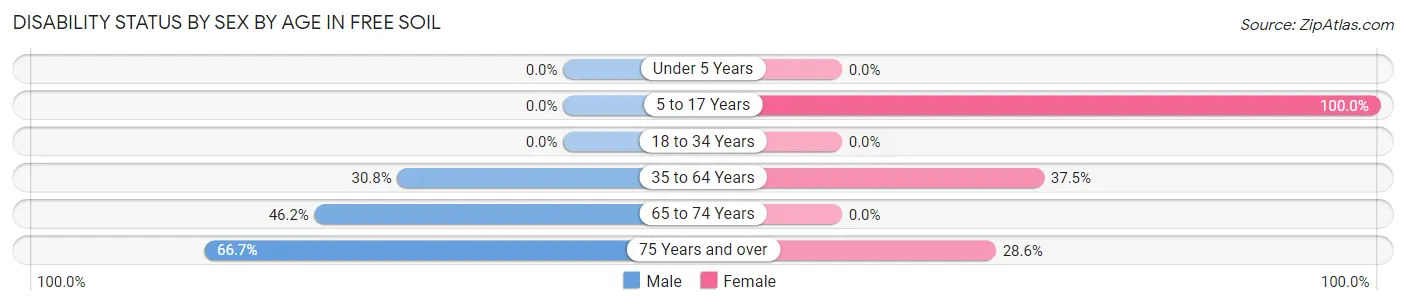
| Age Bracket | Male | Female |
| Under 5 Years | 0 (0.0%) | 0 (0.0%) |
| 5 to 17 Years | 0 (0.0%) | 2 (100.0%) |
| 18 to 34 Years | 0 (0.0%) | 0 (0.0%) |
| 35 to 64 Years | 8 (30.8%) | 6 (37.5%) |
| 65 to 74 Years | 6 (46.2%) | 0 (0.0%) |
| 75 Years and over | 6 (66.7%) | 2 (28.6%) |
Disability Class by Sex by Age in Free Soil
Disability Class: Hearing Difficulty
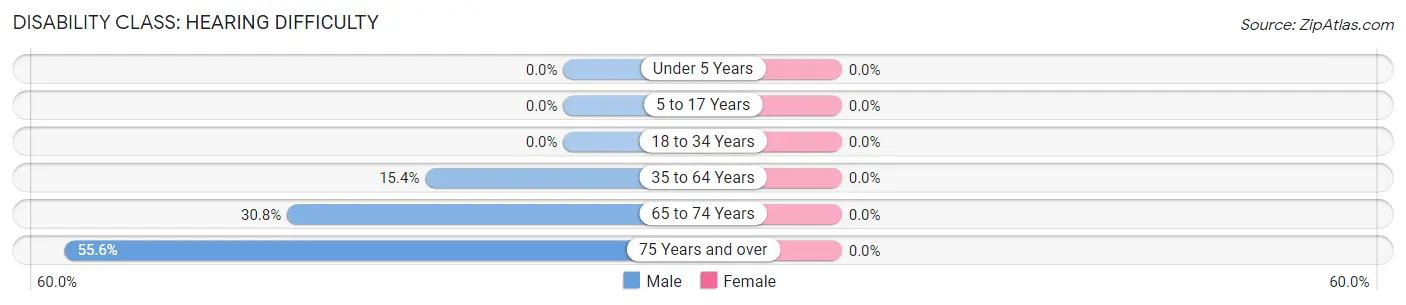
| Age Bracket | Male | Female |
| Under 5 Years | 0 (0.0%) | 0 (0.0%) |
| 5 to 17 Years | 0 (0.0%) | 0 (0.0%) |
| 18 to 34 Years | 0 (0.0%) | 0 (0.0%) |
| 35 to 64 Years | 4 (15.4%) | 0 (0.0%) |
| 65 to 74 Years | 4 (30.8%) | 0 (0.0%) |
| 75 Years and over | 5 (55.6%) | 0 (0.0%) |
Disability Class: Vision Difficulty
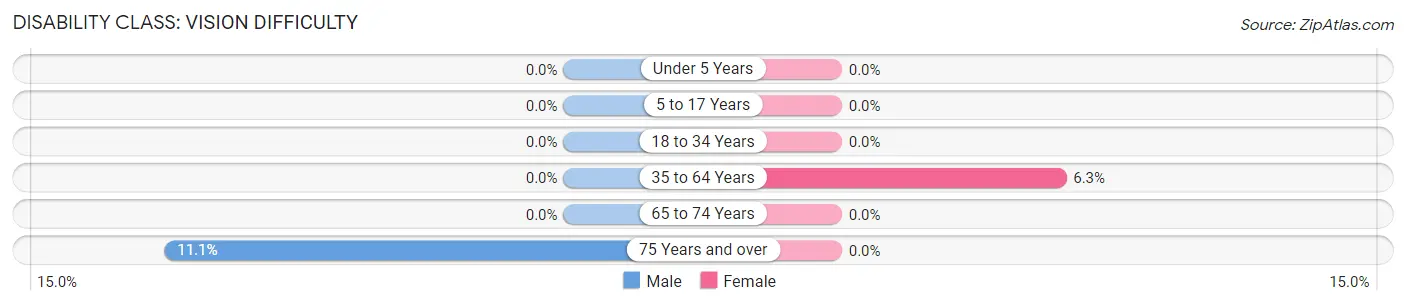
| Age Bracket | Male | Female |
| Under 5 Years | 0 (0.0%) | 0 (0.0%) |
| 5 to 17 Years | 0 (0.0%) | 0 (0.0%) |
| 18 to 34 Years | 0 (0.0%) | 0 (0.0%) |
| 35 to 64 Years | 0 (0.0%) | 1 (6.2%) |
| 65 to 74 Years | 0 (0.0%) | 0 (0.0%) |
| 75 Years and over | 1 (11.1%) | 0 (0.0%) |
Disability Class: Cognitive Difficulty
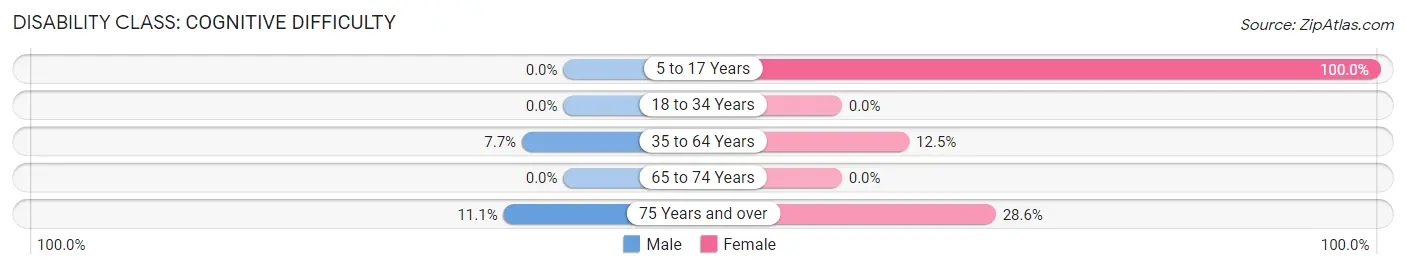
| Age Bracket | Male | Female |
| 5 to 17 Years | 0 (0.0%) | 2 (100.0%) |
| 18 to 34 Years | 0 (0.0%) | 0 (0.0%) |
| 35 to 64 Years | 2 (7.7%) | 2 (12.5%) |
| 65 to 74 Years | 0 (0.0%) | 0 (0.0%) |
| 75 Years and over | 1 (11.1%) | 2 (28.6%) |
Disability Class: Ambulatory Difficulty
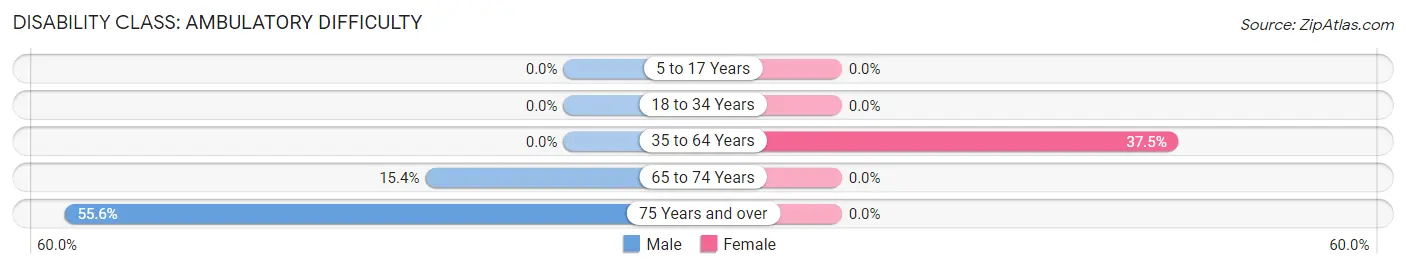
| Age Bracket | Male | Female |
| 5 to 17 Years | 0 (0.0%) | 0 (0.0%) |
| 18 to 34 Years | 0 (0.0%) | 0 (0.0%) |
| 35 to 64 Years | 0 (0.0%) | 6 (37.5%) |
| 65 to 74 Years | 2 (15.4%) | 0 (0.0%) |
| 75 Years and over | 5 (55.6%) | 0 (0.0%) |
Disability Class: Self-Care Difficulty
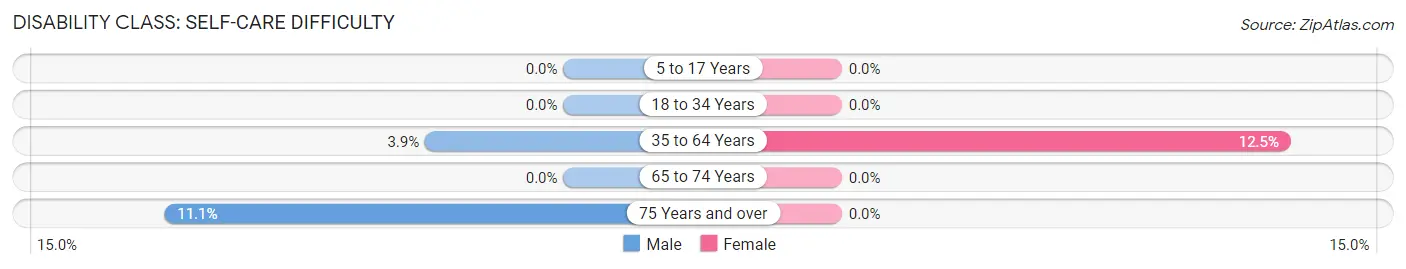
| Age Bracket | Male | Female |
| 5 to 17 Years | 0 (0.0%) | 0 (0.0%) |
| 18 to 34 Years | 0 (0.0%) | 0 (0.0%) |
| 35 to 64 Years | 1 (3.8%) | 2 (12.5%) |
| 65 to 74 Years | 0 (0.0%) | 0 (0.0%) |
| 75 Years and over | 1 (11.1%) | 0 (0.0%) |
Technology Access in Free Soil
Computing Device Access in Free Soil
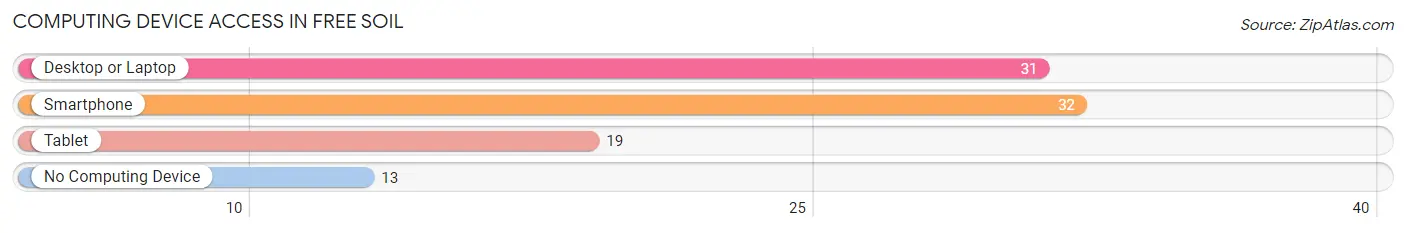
| Device Type | # Households | % Households |
| Desktop or Laptop | 31 | 63.3% |
| Smartphone | 32 | 65.3% |
| Tablet | 19 | 38.8% |
| No Computing Device | 13 | 26.5% |
| Total | 49 | 100.0% |
Internet Access in Free Soil
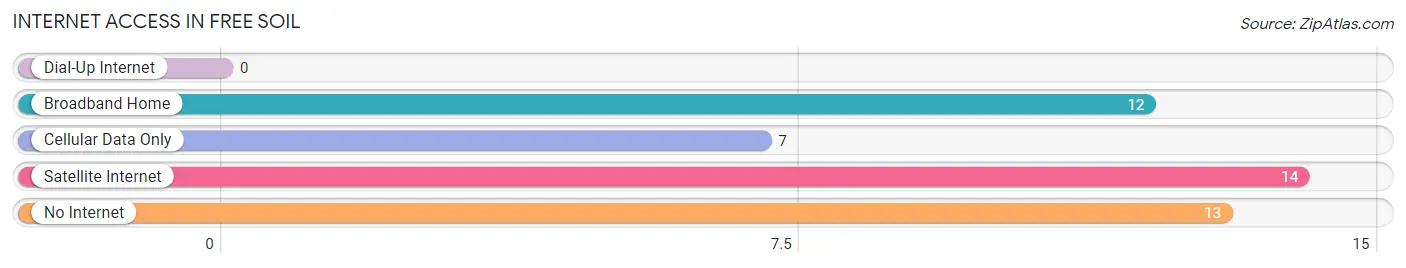
| Internet Type | # Households | % Households |
| Dial-Up Internet | 0 | 0.0% |
| Broadband Home | 12 | 24.5% |
| Cellular Data Only | 7 | 14.3% |
| Satellite Internet | 14 | 28.6% |
| No Internet | 13 | 26.5% |
| Total | 49 | 100.0% |
Free Soil Summary
Soil, Michigan is a small village located in Mason County, Michigan. It is situated on the shores of Lake Michigan, and is part of the Ludington metropolitan area. The village has a population of approximately 500 people, and is a popular tourist destination due to its proximity to the lake.
Geography
Soil, Michigan is located in the northwest corner of Mason County, Michigan. It is situated on the shores of Lake Michigan, and is part of the Ludington metropolitan area. The village is located approximately 10 miles south of Ludington, and is bordered by the towns of Custer and Free Soil Township. The village is situated on a small peninsula, and is surrounded by the waters of Lake Michigan. The village is located at an elevation of 645 feet above sea level.
Climate
Soil, Michigan has a humid continental climate, with warm summers and cold winters. The average temperature in the summer months is around 70 degrees Fahrenheit, while the average temperature in the winter months is around 20 degrees Fahrenheit. The village receives an average of 33 inches of precipitation per year, with most of the precipitation occurring in the spring and summer months.
Demographics
As of the 2010 census, Soil, Michigan had a population of 498 people. The racial makeup of the village was 97.2% White, 0.2% African American, 0.2% Native American, 0.4% Asian, 0.2% from other races, and 1.8% from two or more races. Hispanic or Latino of any race were 0.8% of the population.
Economy
Soil, Michigan is a small village with a limited economy. The village is primarily a tourist destination, and the majority of the local economy is based on tourism. The village is home to several small businesses, including restaurants, gift shops, and a marina. The village also has a small fishing industry, and is home to several charter fishing boats.
History
Soil, Michigan was first settled in the early 1800s by settlers from New England. The village was originally known as Free Soil, and was named after the Free Soil Party, which was a political party that opposed slavery. The village was incorporated in 1867, and the name was changed to Soil in 1871. The village was a popular tourist destination in the late 19th and early 20th centuries, and was home to several resorts and hotels. The village was also home to a large fishing industry, and was a major producer of smoked fish. The village was also home to a large lumber industry, and was home to several sawmills.
In the late 20th century, the village began to decline in population, and many of the businesses and industries in the village closed. The village is now primarily a tourist destination, and is home to several small businesses. The village is also home to a small fishing industry, and is a popular destination for charter fishing.
Common Questions
What is Per Capita Income in Free Soil?
Per Capita income in Free Soil is $25,907.
What is the Median Family Income in Free Soil?
Median Family Income in Free Soil is $54,375.
What is the Median Household income in Free Soil?
Median Household Income in Free Soil is $44,250.
What is Inequality or Gini Index in Free Soil?
Inequality or Gini Index in Free Soil is 0.31.
What is the Total Population of Free Soil?
Total Population of Free Soil is 103.
What is the Total Male Population of Free Soil?
Total Male Population of Free Soil is 66.
What is the Total Female Population of Free Soil?
Total Female Population of Free Soil is 37.
What is the Ratio of Males per 100 Females in Free Soil?
There are 178.38 Males per 100 Females in Free Soil.
What is the Ratio of Females per 100 Males in Free Soil?
There are 56.06 Females per 100 Males in Free Soil.
What is the Median Population Age in Free Soil?
Median Population Age in Free Soil is 54.9 Years.
What is the Average Family Size in Free Soil
Average Family Size in Free Soil is 2.7 People.
What is the Average Household Size in Free Soil
Average Household Size in Free Soil is 2.1 People.
How Large is the Labor Force in Free Soil?
There are 43 People in the Labor Forcein in Free Soil.
What is the Percentage of People in the Labor Force in Free Soil?
46.7% of People are in the Labor Force in Free Soil.
What is the Unemployment Rate in Free Soil?
Unemployment Rate in Free Soil is 2.3%.