Fountain, MI Map & Demographics
Fountain Map
Fountain Overview
$23,205
PER CAPITA INCOME
$55,000
AVG HOUSEHOLD INCOME
17.2%
WAGE / INCOME GAP [ % ]
82.8¢/ $1
WAGE / INCOME GAP [ $ ]
0.38
INEQUALITY / GINI INDEX
214
TOTAL POPULATION
93
MALE POPULATION
121
FEMALE POPULATION
76.86
MALES / 100 FEMALES
130.11
FEMALES / 100 MALES
32.3
MEDIAN AGE
4.0
AVG FAMILY SIZE
2.8
AVG HOUSEHOLD SIZE
81
LABOR FORCE [ PEOPLE ]
61.4%
PERCENT IN LABOR FORCE
8.6%
UNEMPLOYMENT RATE
Fountain Zip Codes
Fountain Area Codes
Income in Fountain
Income Overview in Fountain
| Characteristic | Number | Measure |
| Per Capita Income | 214 | $23,205 |
| Median Family Income | 38 | $0 |
| Mean Family Income | 38 | $58,213 |
| Median Household Income | 76 | $55,000 |
| Mean Household Income | 76 | $67,311 |
| Income Deficit | 38 | $0 |
| Wage / Income Gap (%) | 214 | 17.24% |
| Wage / Income Gap ($) | 214 | 82.76¢ per $1 |
| Gini / Inequality Index | 214 | 0.38 |
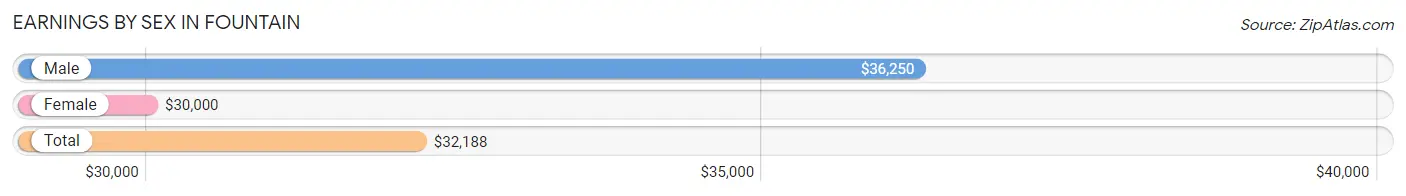
Earnings by Sex in Fountain
Average Earnings in Fountain are $32,188, $36,250 for men and $30,000 for women, a difference of 17.2%.
| Sex | Number | Average Earnings |
| Male | 27 (33.3%) | $36,250 |
| Female | 54 (66.7%) | $30,000 |
| Total | 81 (100.0%) | $32,188 |
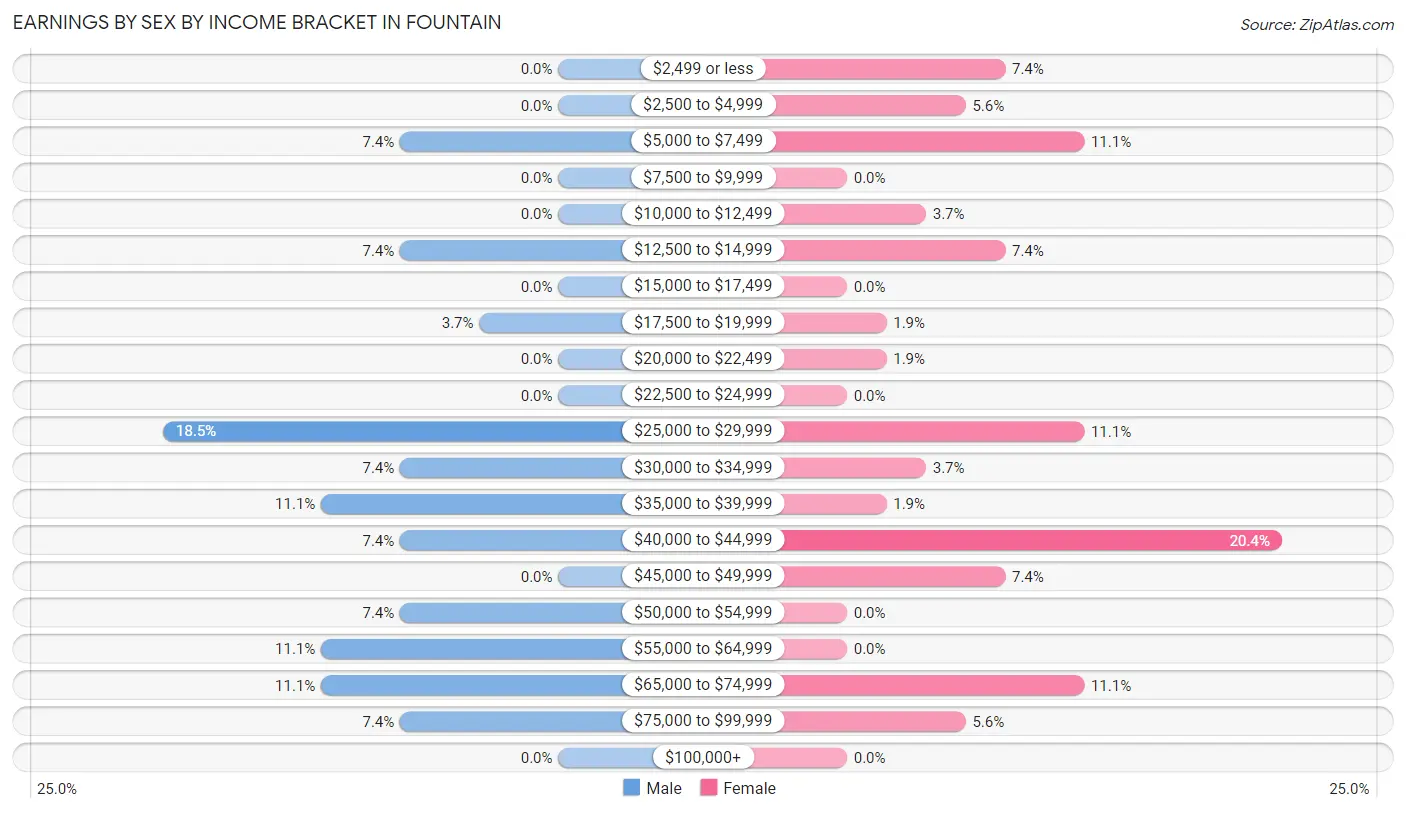
Earnings by Sex by Income Bracket in Fountain
The most common earnings brackets in Fountain are $25,000 to $29,999 for men (5 | 18.5%) and $40,000 to $44,999 for women (11 | 20.4%).
| Income | Male | Female |
| $2,499 or less | 0 (0.0%) | 4 (7.4%) |
| $2,500 to $4,999 | 0 (0.0%) | 3 (5.6%) |
| $5,000 to $7,499 | 2 (7.4%) | 6 (11.1%) |
| $7,500 to $9,999 | 0 (0.0%) | 0 (0.0%) |
| $10,000 to $12,499 | 0 (0.0%) | 2 (3.7%) |
| $12,500 to $14,999 | 2 (7.4%) | 4 (7.4%) |
| $15,000 to $17,499 | 0 (0.0%) | 0 (0.0%) |
| $17,500 to $19,999 | 1 (3.7%) | 1 (1.8%) |
| $20,000 to $22,499 | 0 (0.0%) | 1 (1.8%) |
| $22,500 to $24,999 | 0 (0.0%) | 0 (0.0%) |
| $25,000 to $29,999 | 5 (18.5%) | 6 (11.1%) |
| $30,000 to $34,999 | 2 (7.4%) | 2 (3.7%) |
| $35,000 to $39,999 | 3 (11.1%) | 1 (1.8%) |
| $40,000 to $44,999 | 2 (7.4%) | 11 (20.4%) |
| $45,000 to $49,999 | 0 (0.0%) | 4 (7.4%) |
| $50,000 to $54,999 | 2 (7.4%) | 0 (0.0%) |
| $55,000 to $64,999 | 3 (11.1%) | 0 (0.0%) |
| $65,000 to $74,999 | 3 (11.1%) | 6 (11.1%) |
| $75,000 to $99,999 | 2 (7.4%) | 3 (5.6%) |
| $100,000+ | 0 (0.0%) | 0 (0.0%) |
| Total | 27 (100.0%) | 54 (100.0%) |
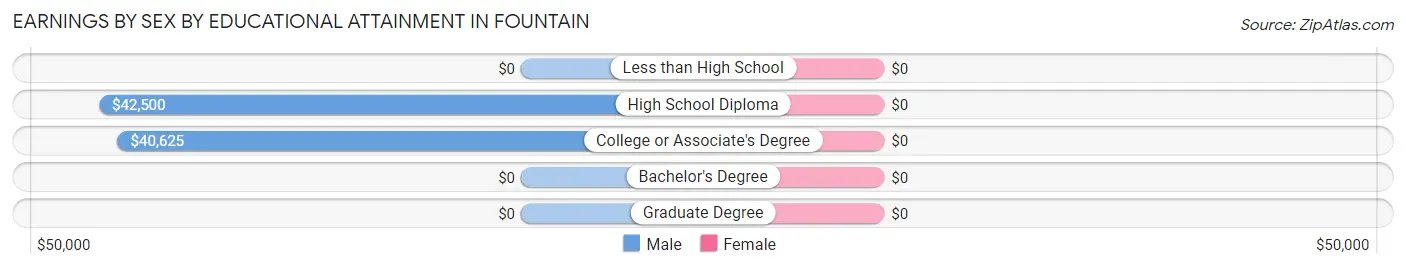
Earnings by Sex by Educational Attainment in Fountain
| Educational Attainment | Male Income | Female Income |
| Less than High School | - | - |
| High School Diploma | $42,500 | $0 |
| College or Associate's Degree | $40,625 | $0 |
| Bachelor's Degree | - | - |
| Graduate Degree | - | - |
| Total | $36,250 | $0 |
Family Income in Fountain
Family Income Brackets in Fountain
According to the Fountain family income data, there are 9 families falling into the $15,000 to $24,999 income range, which is the most common income bracket and makes up 23.7% of all families.
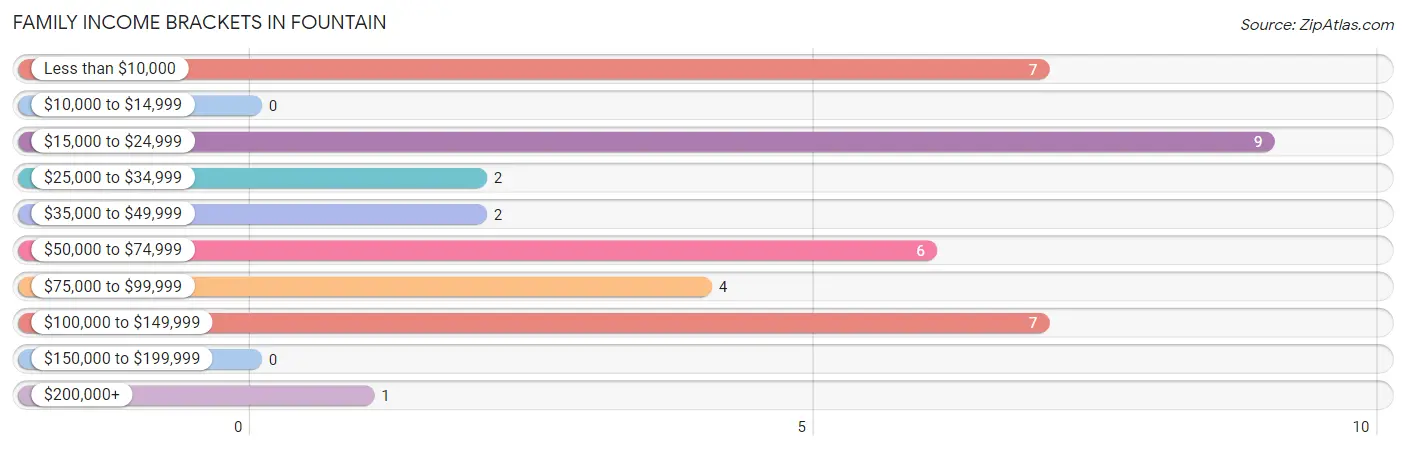
| Income Bracket | # Families | % Families |
| Less than $10,000 | 7 | 18.4% |
| $10,000 to $14,999 | 0 | 0.0% |
| $15,000 to $24,999 | 9 | 23.7% |
| $25,000 to $34,999 | 2 | 5.3% |
| $35,000 to $49,999 | 2 | 5.3% |
| $50,000 to $74,999 | 6 | 15.8% |
| $75,000 to $99,999 | 4 | 10.5% |
| $100,000 to $149,999 | 7 | 18.4% |
| $150,000 to $199,999 | 0 | 0.0% |
| $200,000+ | 1 | 2.6% |
Family Income by Famaliy Size in Fountain
2-person families (11 | 28.9%) account for the highest median family income in Fountain with $113,750 per family, while 2-person families (11 | 28.9%) have the highest median income of $56,875 per family member.
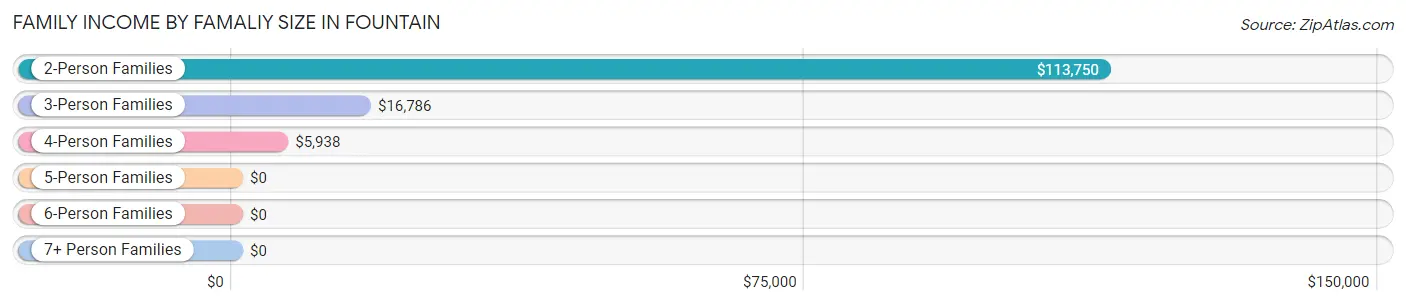
| Income Bracket | # Families | Median Income |
| 2-Person Families | 11 (28.9%) | $113,750 |
| 3-Person Families | 10 (26.3%) | $16,786 |
| 4-Person Families | 9 (23.7%) | $5,938 |
| 5-Person Families | 6 (15.8%) | $0 |
| 6-Person Families | 0 (0.0%) | $0 |
| 7+ Person Families | 2 (5.3%) | $0 |
| Total | 38 (100.0%) | $0 |
Family Income by Number of Earners in Fountain
| Number of Earners | # Families | Median Income |
| No Earners | 11 (28.9%) | $0 |
| 1 Earner | 15 (39.5%) | $0 |
| 2 Earners | 12 (31.6%) | $0 |
| 3+ Earners | 0 (0.0%) | $0 |
| Total | 38 (100.0%) | $0 |
Household Income in Fountain
Household Income Brackets in Fountain
With 18 households falling in the category, the $100,000 to $149,999 income range is the most frequent in Fountain, accounting for 23.7% of all households.
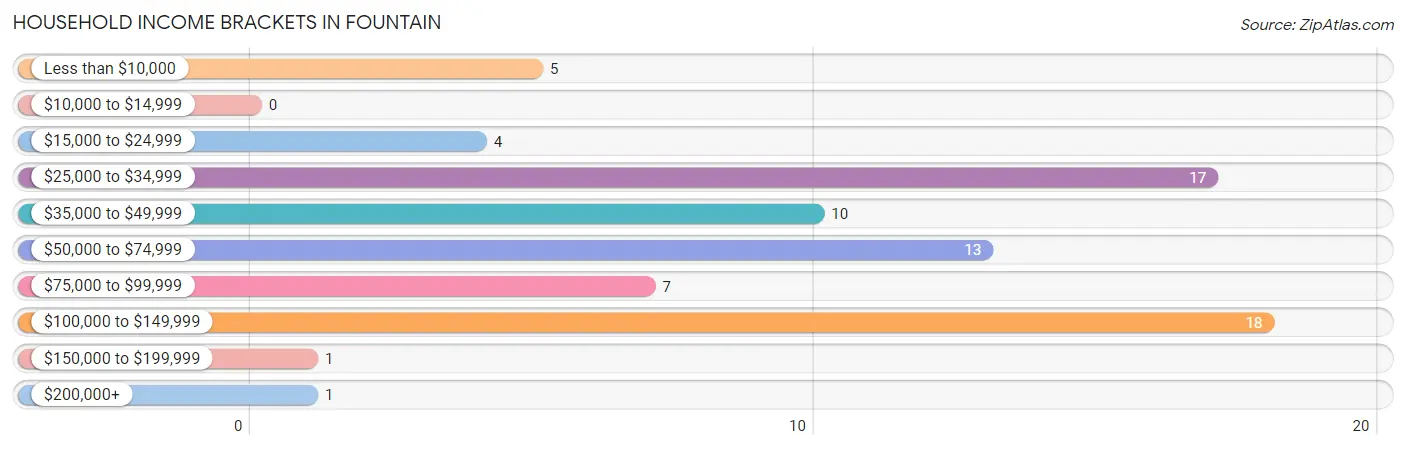
| Income Bracket | # Households | % Households |
| Less than $10,000 | 5 | 6.6% |
| $10,000 to $14,999 | 0 | 0.0% |
| $15,000 to $24,999 | 4 | 5.3% |
| $25,000 to $34,999 | 17 | 22.4% |
| $35,000 to $49,999 | 10 | 13.2% |
| $50,000 to $74,999 | 13 | 17.1% |
| $75,000 to $99,999 | 7 | 9.2% |
| $100,000 to $149,999 | 18 | 23.7% |
| $150,000 to $199,999 | 1 | 1.3% |
| $200,000+ | 1 | 1.3% |
Household Income by Householder Age in Fountain
The median household income in Fountain is $55,000, with the highest median household income of $51,250 found in the 45 to 64 years age bracket for the primary householder. A total of 26 households (34.2%) fall into this category. Meanwhile, the 15 to 24 years age bracket for the primary householder has the lowest median household income of $0, with 13 households (17.1%) in this group.
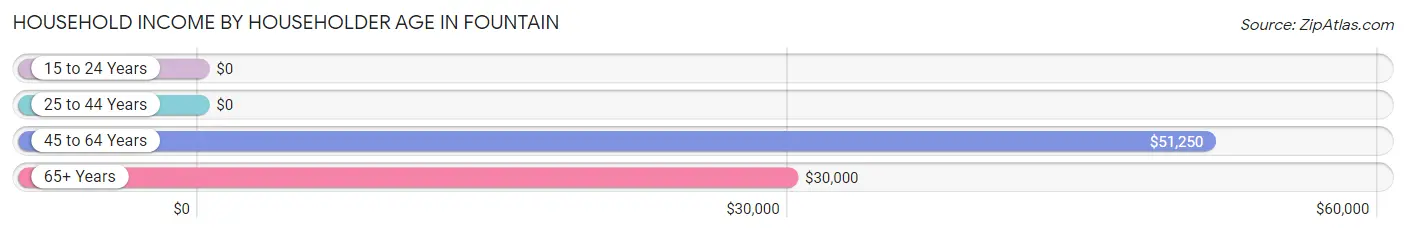
| Income Bracket | # Households | Median Income |
| 15 to 24 Years | 13 (17.1%) | $0 |
| 25 to 44 Years | 19 (25.0%) | $0 |
| 45 to 64 Years | 26 (34.2%) | $51,250 |
| 65+ Years | 18 (23.7%) | $30,000 |
| Total | 76 (100.0%) | $55,000 |
Poverty in Fountain
Income Below Poverty by Sex and Age in Fountain
With 31.2% poverty level for males and 43.8% for females among the residents of Fountain, 16 and 17 year old males and 5 year old females are the most vulnerable to poverty, with 2 males (100.0%) and 8 females (80.0%) in their respective age groups living below the poverty level.
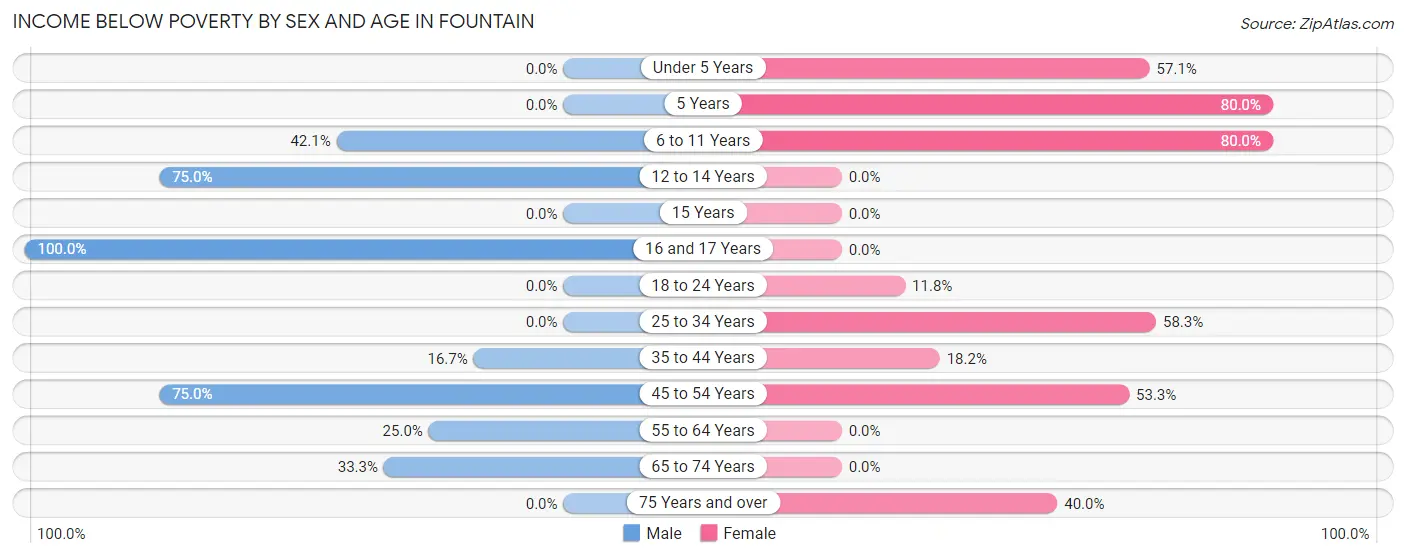
| Age Bracket | Male | Female |
| Under 5 Years | 0 (0.0%) | 8 (57.1%) |
| 5 Years | 0 (0.0%) | 8 (80.0%) |
| 6 to 11 Years | 8 (42.1%) | 16 (80.0%) |
| 12 to 14 Years | 6 (75.0%) | 0 (0.0%) |
| 15 Years | 0 (0.0%) | 0 (0.0%) |
| 16 and 17 Years | 2 (100.0%) | 0 (0.0%) |
| 18 to 24 Years | 0 (0.0%) | 2 (11.8%) |
| 25 to 34 Years | 0 (0.0%) | 7 (58.3%) |
| 35 to 44 Years | 2 (16.7%) | 2 (18.2%) |
| 45 to 54 Years | 6 (75.0%) | 8 (53.3%) |
| 55 to 64 Years | 3 (25.0%) | 0 (0.0%) |
| 65 to 74 Years | 2 (33.3%) | 0 (0.0%) |
| 75 Years and over | 0 (0.0%) | 2 (40.0%) |
| Total | 29 (31.2%) | 53 (43.8%) |
Income Above Poverty by Sex and Age in Fountain
According to the poverty statistics in Fountain, males aged under 5 years and females aged 12 to 14 years are the age groups that are most secure financially, with 100.0% of males and 100.0% of females in these age groups living above the poverty line.
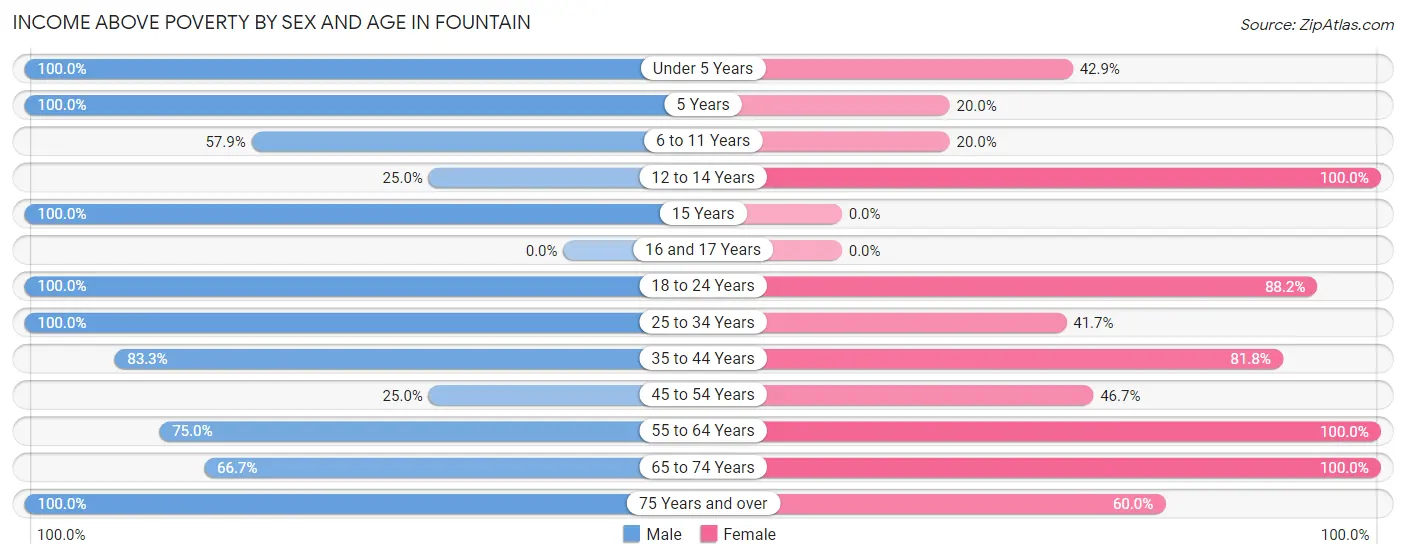
| Age Bracket | Male | Female |
| Under 5 Years | 2 (100.0%) | 6 (42.9%) |
| 5 Years | 2 (100.0%) | 2 (20.0%) |
| 6 to 11 Years | 11 (57.9%) | 4 (20.0%) |
| 12 to 14 Years | 2 (25.0%) | 2 (100.0%) |
| 15 Years | 5 (100.0%) | 0 (0.0%) |
| 16 and 17 Years | 0 (0.0%) | 0 (0.0%) |
| 18 to 24 Years | 2 (100.0%) | 15 (88.2%) |
| 25 to 34 Years | 10 (100.0%) | 5 (41.7%) |
| 35 to 44 Years | 10 (83.3%) | 9 (81.8%) |
| 45 to 54 Years | 2 (25.0%) | 7 (46.7%) |
| 55 to 64 Years | 9 (75.0%) | 8 (100.0%) |
| 65 to 74 Years | 4 (66.7%) | 7 (100.0%) |
| 75 Years and over | 5 (100.0%) | 3 (60.0%) |
| Total | 64 (68.8%) | 68 (56.2%) |
Income Below Poverty Among Married-Couple Families in Fountain
The poverty statistics for married-couple families in Fountain show that 10.0% or 2 of the total 20 families live below the poverty line. Families with 3 or 4 children have the highest poverty rate of 28.6%, comprising of 2 families. On the other hand, families with no children have the lowest poverty rate of 0.0%, which includes 0 families.
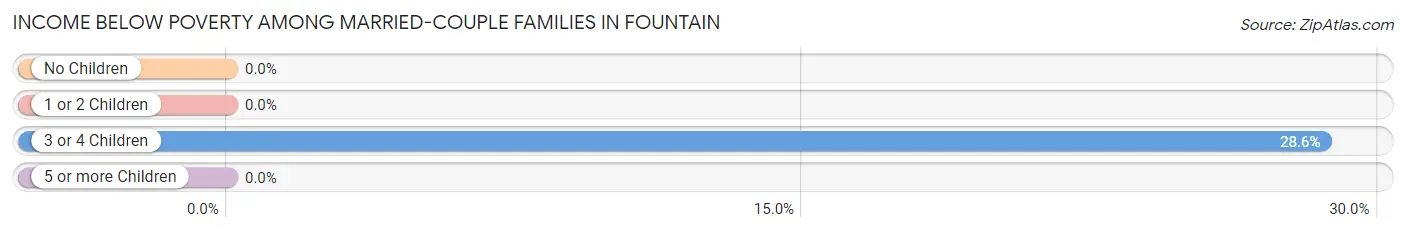
| Children | Above Poverty | Below Poverty |
| No Children | 11 (100.0%) | 0 (0.0%) |
| 1 or 2 Children | 2 (100.0%) | 0 (0.0%) |
| 3 or 4 Children | 5 (71.4%) | 2 (28.6%) |
| 5 or more Children | 0 (0.0%) | 0 (0.0%) |
| Total | 18 (90.0%) | 2 (10.0%) |
Income Below Poverty Among Single-Parent Households in Fountain
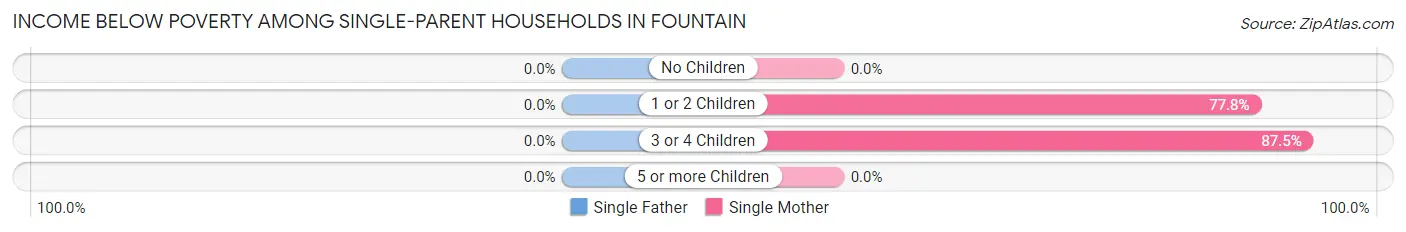
| Children | Single Father | Single Mother |
| No Children | 0 (0.0%) | 0 (0.0%) |
| 1 or 2 Children | 0 (0.0%) | 7 (77.8%) |
| 3 or 4 Children | 0 (0.0%) | 7 (87.5%) |
| 5 or more Children | 0 (0.0%) | 0 (0.0%) |
| Total | 0 (0.0%) | 14 (82.4%) |
Income Below Poverty Among Married-Couple vs Single-Parent Households in Fountain
The poverty data for Fountain shows that 2 of the married-couple family households (10.0%) and 14 of the single-parent households (77.8%) are living below the poverty level. Within the married-couple family households, those with 3 or 4 children have the highest poverty rate, with 2 households (28.6%) falling below the poverty line. Among the single-parent households, those with 3 or 4 children have the highest poverty rate, with 7 household (87.5%) living below poverty.
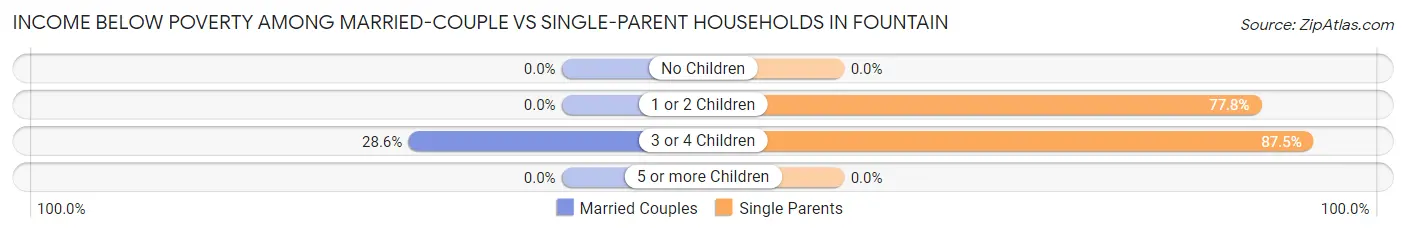
| Children | Married-Couple Families | Single-Parent Households |
| No Children | 0 (0.0%) | 0 (0.0%) |
| 1 or 2 Children | 0 (0.0%) | 7 (77.8%) |
| 3 or 4 Children | 2 (28.6%) | 7 (87.5%) |
| 5 or more Children | 0 (0.0%) | 0 (0.0%) |
| Total | 2 (10.0%) | 14 (77.8%) |
Race in Fountain
The most populous races in Fountain are White / Caucasian (163 | 76.2%), Two or more Races (51 | 23.8%), and Hispanic or Latino (4 | 1.9%).
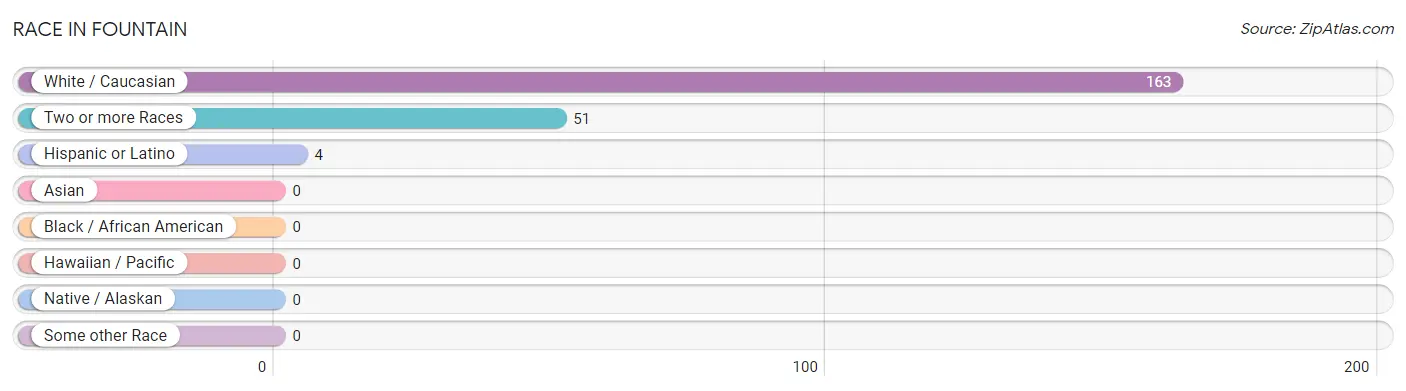
| Race | # Population | % Population |
| Asian | 0 | 0.0% |
| Black / African American | 0 | 0.0% |
| Hawaiian / Pacific | 0 | 0.0% |
| Hispanic or Latino | 4 | 1.9% |
| Native / Alaskan | 0 | 0.0% |
| White / Caucasian | 163 | 76.2% |
| Two or more Races | 51 | 23.8% |
| Some other Race | 0 | 0.0% |
| Total | 214 | 100.0% |
Ancestry in Fountain
The most populous ancestries reported in Fountain are German (54 | 25.2%), Irish (40 | 18.7%), Dutch (20 | 9.3%), African (15 | 7.0%), and Polish (15 | 7.0%), together accounting for 67.3% of all Fountain residents.
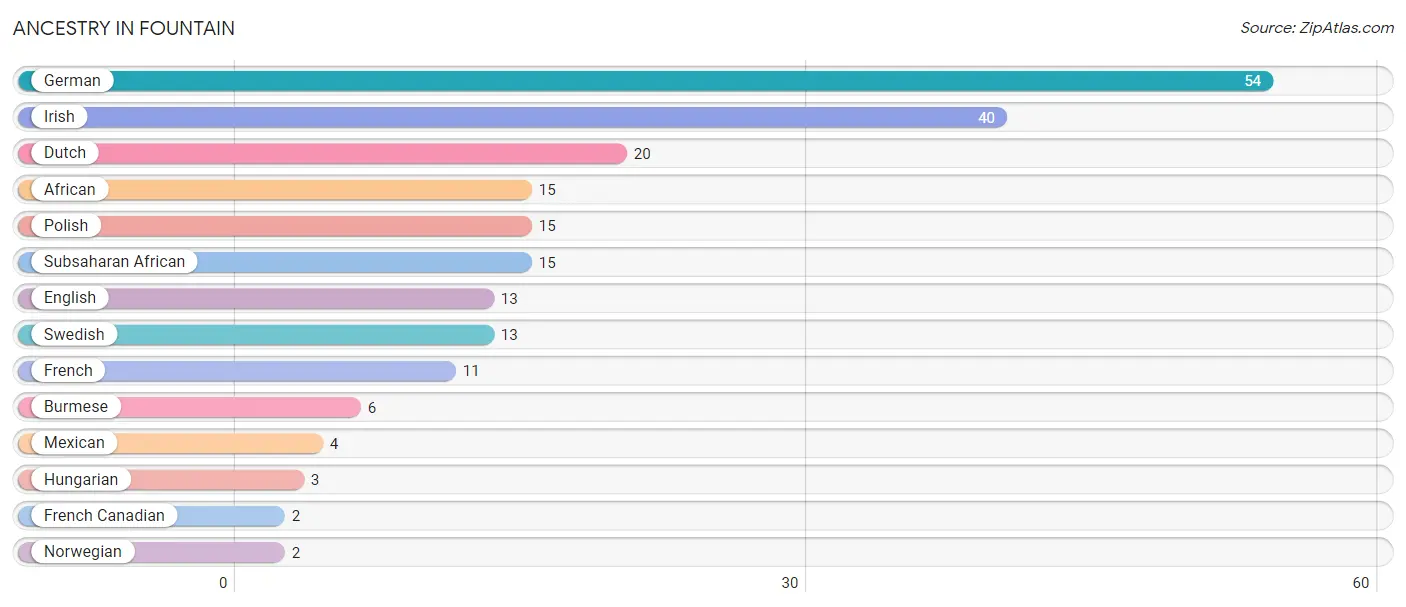
| Ancestry | # Population | % Population |
| African | 15 | 7.0% |
| Burmese | 6 | 2.8% |
| Dutch | 20 | 9.3% |
| English | 13 | 6.1% |
| French | 11 | 5.1% |
| French Canadian | 2 | 0.9% |
| German | 54 | 25.2% |
| Hungarian | 3 | 1.4% |
| Irish | 40 | 18.7% |
| Mexican | 4 | 1.9% |
| Norwegian | 2 | 0.9% |
| Polish | 15 | 7.0% |
| Subsaharan African | 15 | 7.0% |
| Swedish | 13 | 6.1% | View All 14 Rows |
Immigrants in Fountain

| Immigration Origin | # Population | % Population | View All 0 Rows |
Sex and Age in Fountain
Sex and Age in Fountain
The most populous age groups in Fountain are 10 to 14 Years (16 | 17.2%) for men and 5 to 9 Years (26 | 21.5%) for women.
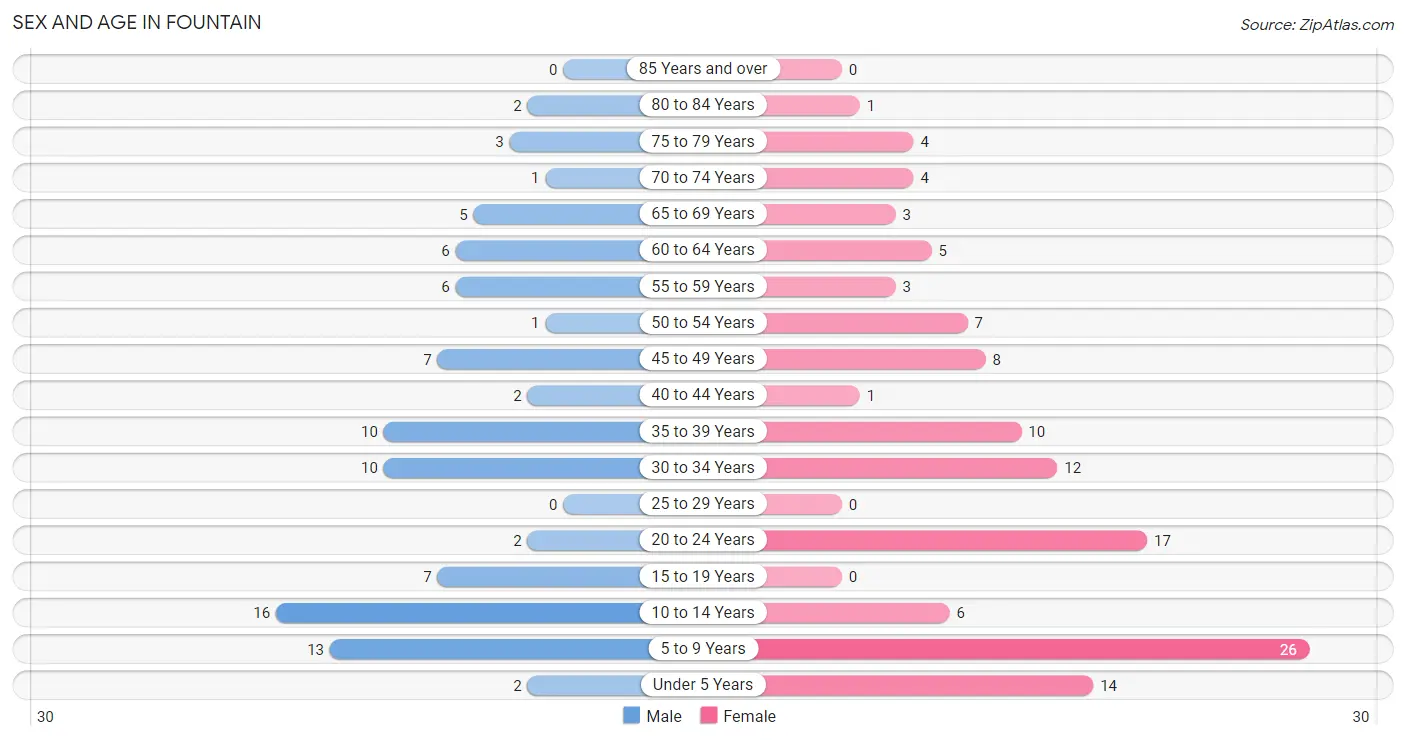
| Age Bracket | Male | Female |
| Under 5 Years | 2 (2.1%) | 14 (11.6%) |
| 5 to 9 Years | 13 (14.0%) | 26 (21.5%) |
| 10 to 14 Years | 16 (17.2%) | 6 (5.0%) |
| 15 to 19 Years | 7 (7.5%) | 0 (0.0%) |
| 20 to 24 Years | 2 (2.1%) | 17 (14.1%) |
| 25 to 29 Years | 0 (0.0%) | 0 (0.0%) |
| 30 to 34 Years | 10 (10.7%) | 12 (9.9%) |
| 35 to 39 Years | 10 (10.7%) | 10 (8.3%) |
| 40 to 44 Years | 2 (2.1%) | 1 (0.8%) |
| 45 to 49 Years | 7 (7.5%) | 8 (6.6%) |
| 50 to 54 Years | 1 (1.1%) | 7 (5.8%) |
| 55 to 59 Years | 6 (6.5%) | 3 (2.5%) |
| 60 to 64 Years | 6 (6.5%) | 5 (4.1%) |
| 65 to 69 Years | 5 (5.4%) | 3 (2.5%) |
| 70 to 74 Years | 1 (1.1%) | 4 (3.3%) |
| 75 to 79 Years | 3 (3.2%) | 4 (3.3%) |
| 80 to 84 Years | 2 (2.1%) | 1 (0.8%) |
| 85 Years and over | 0 (0.0%) | 0 (0.0%) |
| Total | 93 (100.0%) | 121 (100.0%) |
Families and Households in Fountain
Median Family Size in Fountain
The median family size in Fountain is 3.97 persons per family, with single female/mother families (17 | 44.7%) accounting for the largest median family size of 4.35 persons per family. On the other hand, single male/father families (1 | 2.6%) represent the smallest median family size with 2.00 persons per family.
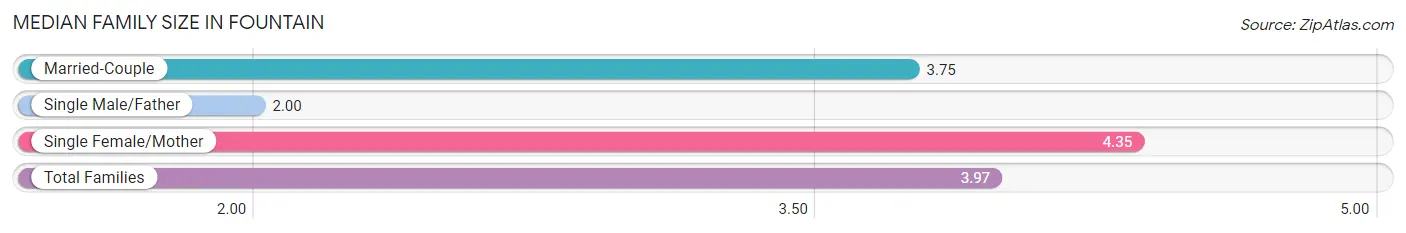
| Family Type | # Families | Family Size |
| Married-Couple | 20 (52.6%) | 3.75 |
| Single Male/Father | 1 (2.6%) | 2.00 |
| Single Female/Mother | 17 (44.7%) | 4.35 |
| Total Families | 38 (100.0%) | 3.97 |
Median Household Size in Fountain
The median household size in Fountain is 2.82 persons per household, with single female/mother households (17 | 22.4%) accounting for the largest median household size of 5.06 persons per household. non-family households (38 | 50.0%) represent the smallest median household size with 1.26 persons per household.
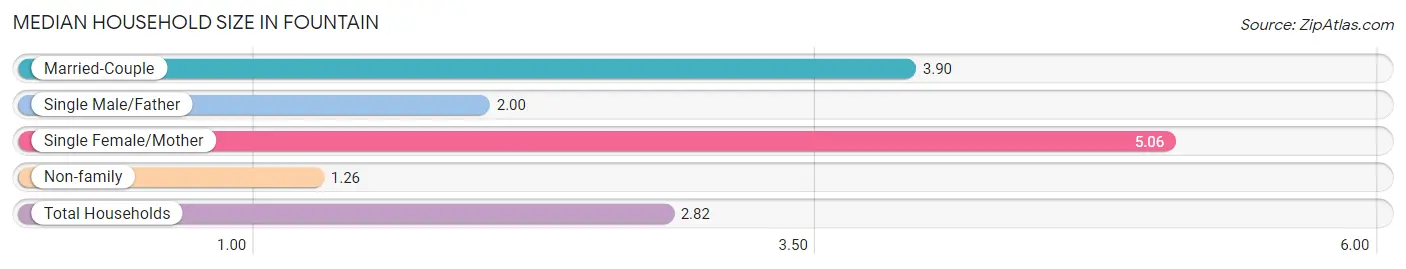
| Household Type | # Households | Household Size |
| Married-Couple | 20 (26.3%) | 3.90 |
| Single Male/Father | 1 (1.3%) | 2.00 |
| Single Female/Mother | 17 (22.4%) | 5.06 |
| Non-family | 38 (50.0%) | 1.26 |
| Total Households | 76 (100.0%) | 2.82 |
Household Size by Marriage Status in Fountain
Out of a total of 76 households in Fountain, 38 (50.0%) are family households, while 38 (50.0%) are nonfamily households. The most numerous type of family households are 2-person households, comprising 11, and the most common type of nonfamily households are 1-person households, comprising 23.
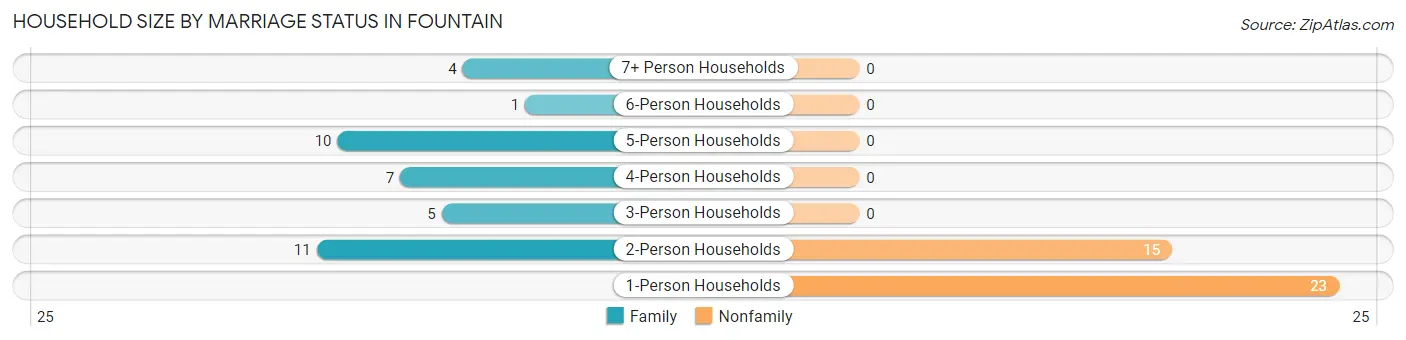
| Household Size | Family Households | Nonfamily Households |
| 1-Person Households | - | 23 (30.3%) |
| 2-Person Households | 11 (14.5%) | 15 (19.7%) |
| 3-Person Households | 5 (6.6%) | 0 (0.0%) |
| 4-Person Households | 7 (9.2%) | 0 (0.0%) |
| 5-Person Households | 10 (13.2%) | 0 (0.0%) |
| 6-Person Households | 1 (1.3%) | 0 (0.0%) |
| 7+ Person Households | 4 (5.3%) | 0 (0.0%) |
| Total | 38 (50.0%) | 38 (50.0%) |
Female Fertility in Fountain
Fertility by Age in Fountain
Average fertility rate in Fountain is 83.0 births per 1,000 women. Women in the age bracket of 35 to 50 years have the highest fertility rate with 211.0 births per 1,000 women. Women in the age bracket of 35 to 50 years acount for 100.0% of all women with births.
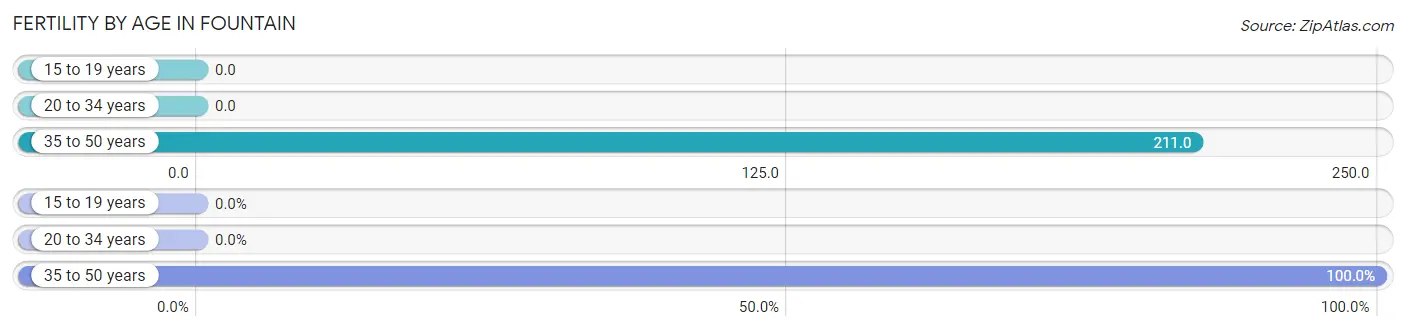
| Age Bracket | Women with Births | Births / 1,000 Women |
| 15 to 19 years | 0 (0.0%) | 0.0 |
| 20 to 34 years | 0 (0.0%) | 0.0 |
| 35 to 50 years | 4 (100.0%) | 211.0 |
| Total | 4 (100.0%) | 83.0 |
Fertility by Age by Marriage Status in Fountain
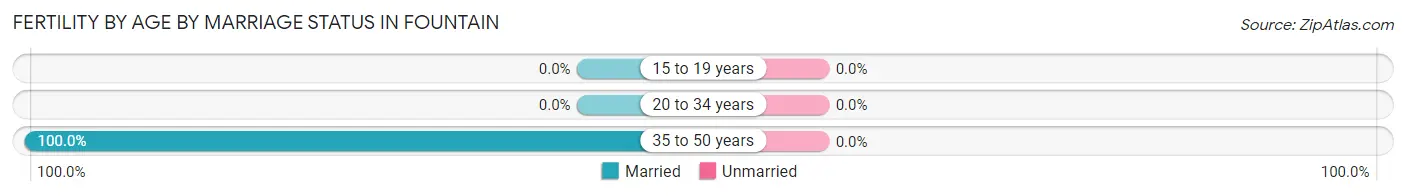
| Age Bracket | Married | Unmarried |
| 15 to 19 years | 0 (0.0%) | 0 (0.0%) |
| 20 to 34 years | 0 (0.0%) | 0 (0.0%) |
| 35 to 50 years | 4 (100.0%) | 0 (0.0%) |
| Total | 4 (100.0%) | 0 (0.0%) |
Fertility by Education in Fountain
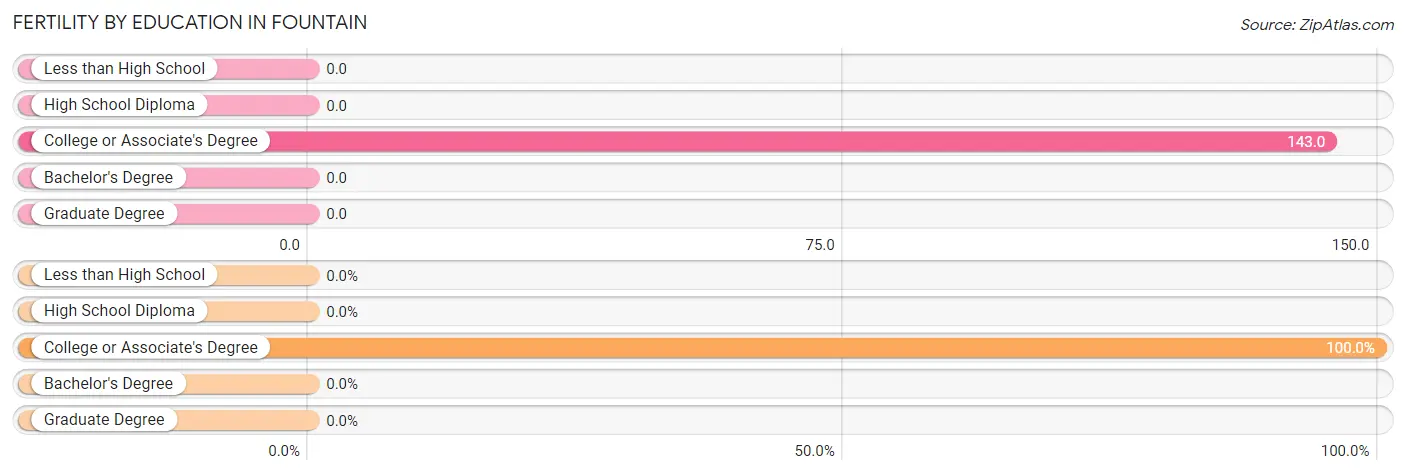
| Educational Attainment | Women with Births | Births / 1,000 Women |
| Less than High School | 0 (0.0%) | 0.0 |
| High School Diploma | 0 (0.0%) | 0.0 |
| College or Associate's Degree | 4 (100.0%) | 143.0 |
| Bachelor's Degree | 0 (0.0%) | 0.0 |
| Graduate Degree | 0 (0.0%) | 0.0 |
| Total | 4 (100.0%) | 83.0 |
Fertility by Education by Marriage Status in Fountain
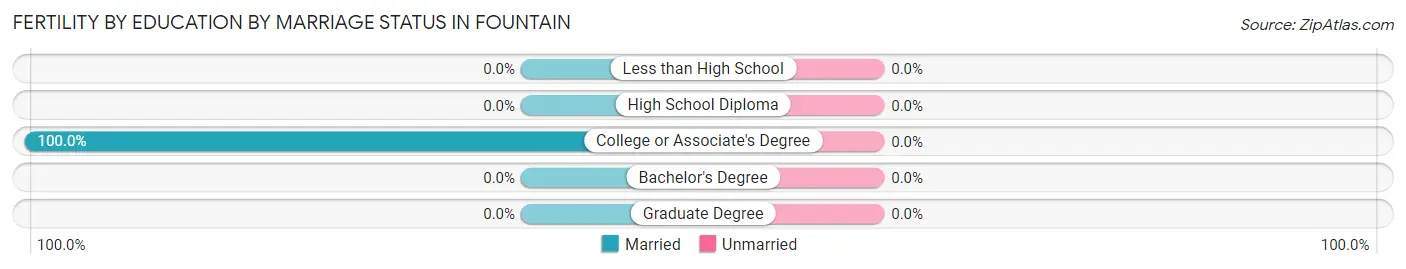
| Educational Attainment | Married | Unmarried |
| Less than High School | 0 (0.0%) | 0 (0.0%) |
| High School Diploma | 0 (0.0%) | 0 (0.0%) |
| College or Associate's Degree | 4 (100.0%) | 0 (0.0%) |
| Bachelor's Degree | 0 (0.0%) | 0 (0.0%) |
| Graduate Degree | 0 (0.0%) | 0 (0.0%) |
| Total | 4 (100.0%) | 0 (0.0%) |
Employment Characteristics in Fountain
Employment by Class of Employer in Fountain
Among the 73 employed individuals in Fountain, private company employees (53 | 72.6%), not-for-profit organizations (5 | 6.9%), and local government employees (5 | 6.9%) make up the most common classes of employment.
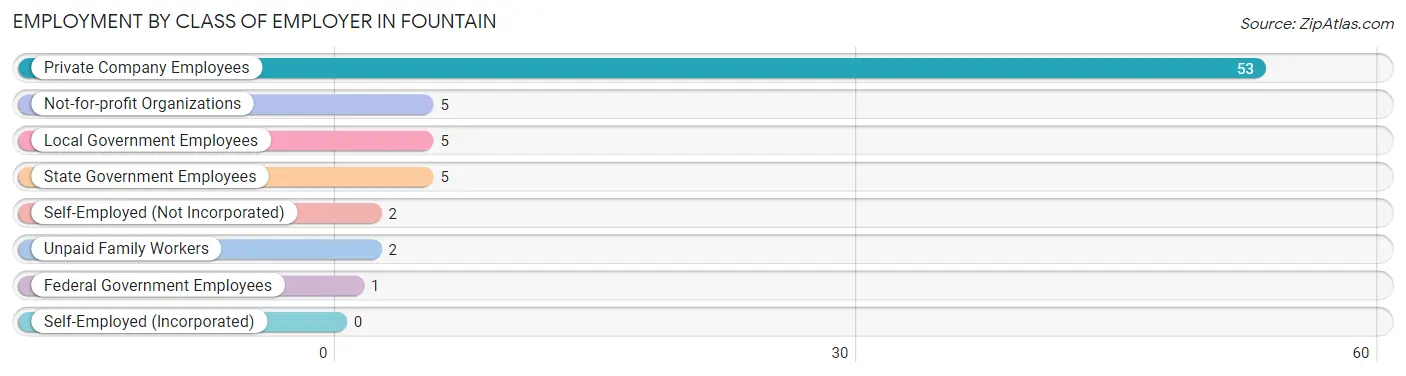
| Employer Class | # Employees | % Employees |
| Private Company Employees | 53 | 72.6% |
| Self-Employed (Incorporated) | 0 | 0.0% |
| Self-Employed (Not Incorporated) | 2 | 2.7% |
| Not-for-profit Organizations | 5 | 6.9% |
| Local Government Employees | 5 | 6.9% |
| State Government Employees | 5 | 6.9% |
| Federal Government Employees | 1 | 1.4% |
| Unpaid Family Workers | 2 | 2.7% |
| Total | 73 | 100.0% |
Employment Status by Age in Fountain
According to the labor force statistics for Fountain, out of the total population over 16 years of age (132), 61.4% or 81 individuals are in the labor force, with 8.6% or 7 of them unemployed. The age group with the highest labor force participation rate is 35 to 44 years, with 100.0% or 23 individuals in the labor force. Within the labor force, the 30 to 34 years age range has the highest percentage of unemployed individuals, with 28.6% or 4 of them being unemployed.
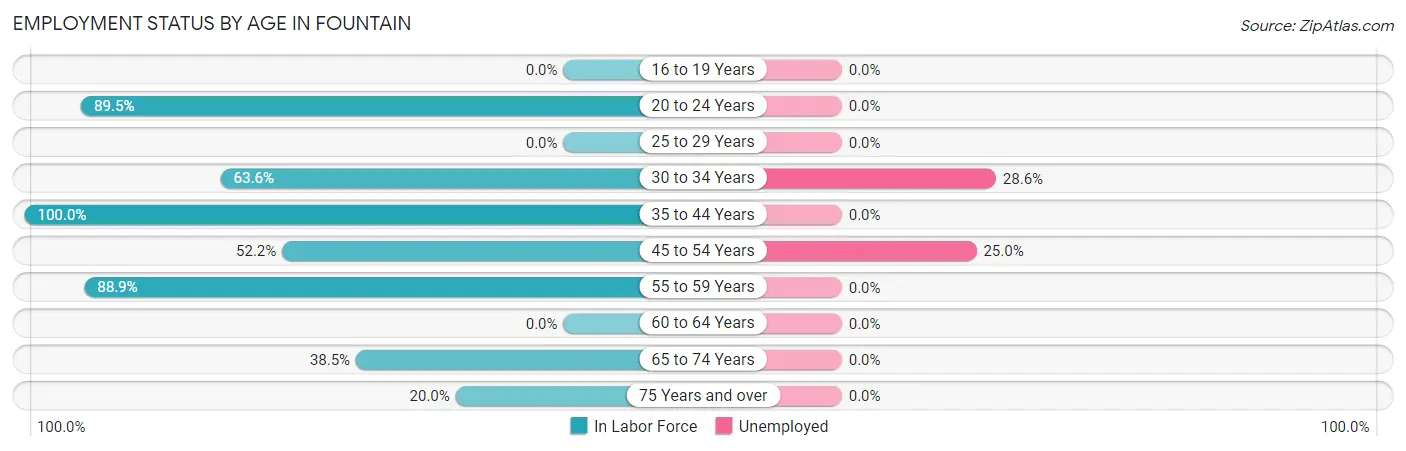
| Age Bracket | In Labor Force | Unemployed |
| 16 to 19 Years | 0 (0.0%) | 0 (0.0%) |
| 20 to 24 Years | 17 (89.5%) | 0 (0.0%) |
| 25 to 29 Years | 0 (0.0%) | 0 (0.0%) |
| 30 to 34 Years | 14 (63.6%) | 4 (28.6%) |
| 35 to 44 Years | 23 (100.0%) | 0 (0.0%) |
| 45 to 54 Years | 12 (52.2%) | 3 (25.0%) |
| 55 to 59 Years | 8 (88.9%) | 0 (0.0%) |
| 60 to 64 Years | 0 (0.0%) | 0 (0.0%) |
| 65 to 74 Years | 5 (38.5%) | 0 (0.0%) |
| 75 Years and over | 2 (20.0%) | 0 (0.0%) |
| Total | 81 (61.4%) | 7 (8.6%) |
Employment Status by Educational Attainment in Fountain
According to labor force statistics for Fountain, 64.8% of individuals (57) out of the total population between 25 and 64 years of age (88) are in the labor force, with 12.3% or 7 of them being unemployed. The group with the highest labor force participation rate are those with the educational attainment of college / associate degree, with 77.8% or 35 individuals in the labor force. Within the labor force, individuals with college / associate degree education have the highest percentage of unemployment, with 20.0% or 7 of them being unemployed.
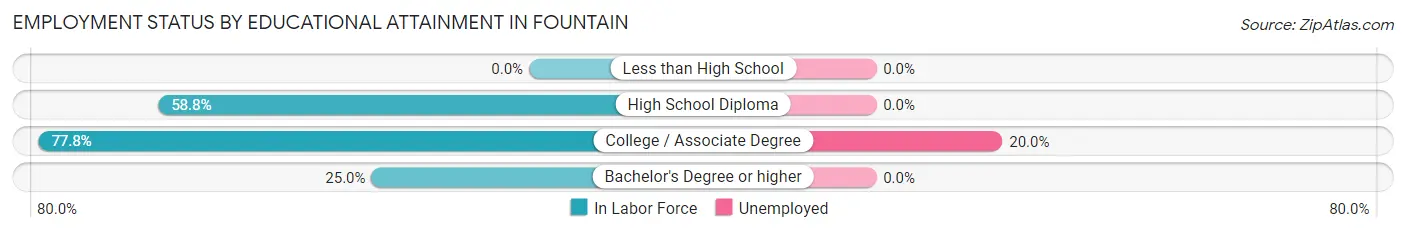
| Educational Attainment | In Labor Force | Unemployed |
| Less than High School | 0 (0.0%) | 0 (0.0%) |
| High School Diploma | 20 (58.8%) | 0 (0.0%) |
| College / Associate Degree | 35 (77.8%) | 9 (20.0%) |
| Bachelor's Degree or higher | 2 (25.0%) | 0 (0.0%) |
| Total | 57 (64.8%) | 11 (12.3%) |
Employment Occupations by Sex in Fountain
Management, Business, Science and Arts Occupations
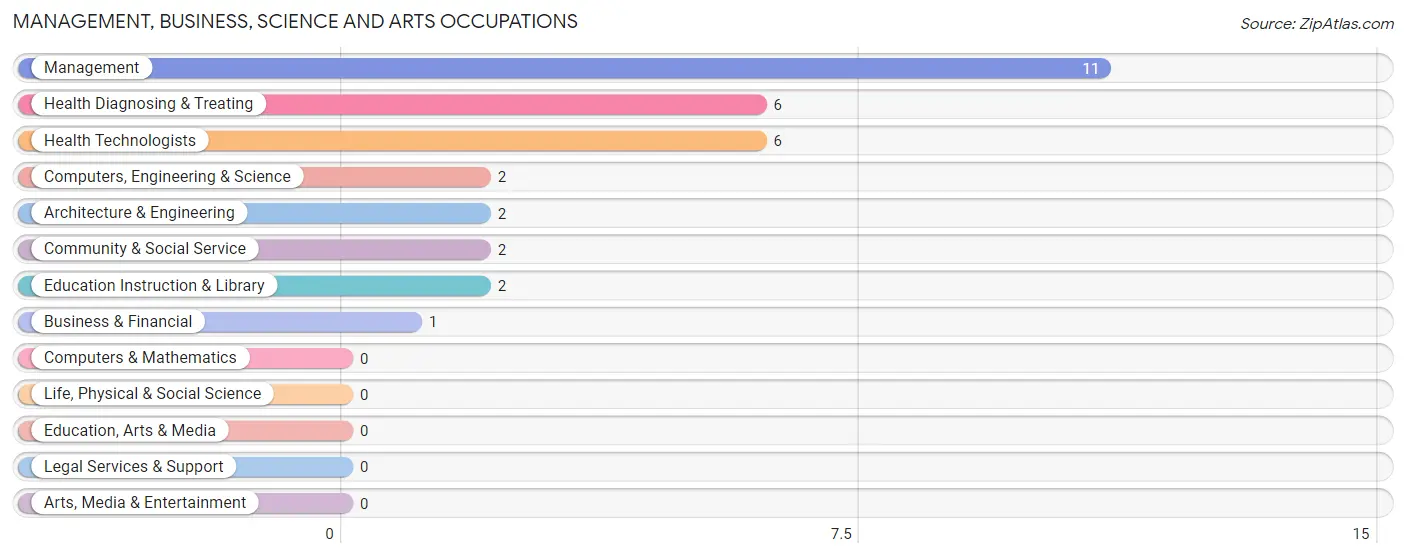
The most common Management, Business, Science and Arts occupations in Fountain are Management (11 | 14.9%), Health Diagnosing & Treating (6 | 8.1%), Health Technologists (6 | 8.1%), Computers, Engineering & Science (2 | 2.7%), and Architecture & Engineering (2 | 2.7%).
Management, Business, Science and Arts Occupations by Sex
Within the Management, Business, Science and Arts occupations in Fountain, the most male-oriented occupations are Computers, Engineering & Science (100.0%), and Architecture & Engineering (100.0%), while the most female-oriented occupations are Management (100.0%), Business & Financial (100.0%), and Community & Social Service (100.0%).
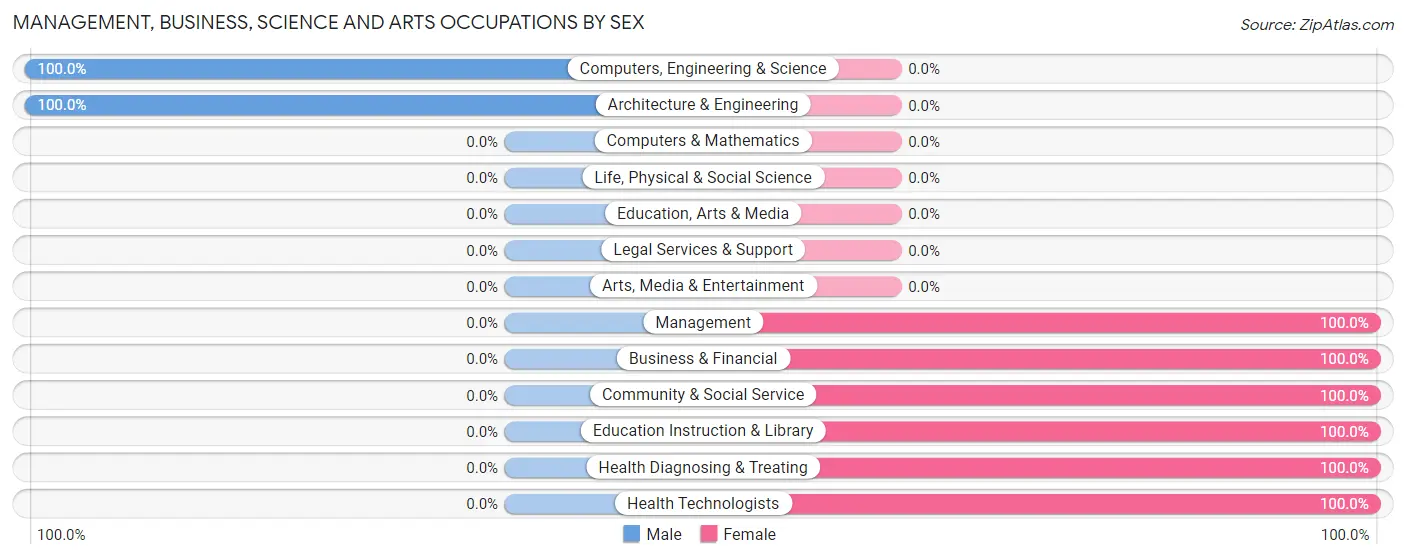
| Occupation | Male | Female |
| Management | 0 (0.0%) | 11 (100.0%) |
| Business & Financial | 0 (0.0%) | 1 (100.0%) |
| Computers, Engineering & Science | 2 (100.0%) | 0 (0.0%) |
| Computers & Mathematics | 0 (0.0%) | 0 (0.0%) |
| Architecture & Engineering | 2 (100.0%) | 0 (0.0%) |
| Life, Physical & Social Science | 0 (0.0%) | 0 (0.0%) |
| Community & Social Service | 0 (0.0%) | 2 (100.0%) |
| Education, Arts & Media | 0 (0.0%) | 0 (0.0%) |
| Legal Services & Support | 0 (0.0%) | 0 (0.0%) |
| Education Instruction & Library | 0 (0.0%) | 2 (100.0%) |
| Arts, Media & Entertainment | 0 (0.0%) | 0 (0.0%) |
| Health Diagnosing & Treating | 0 (0.0%) | 6 (100.0%) |
| Health Technologists | 0 (0.0%) | 6 (100.0%) |
| Total (Category) | 2 (9.1%) | 20 (90.9%) |
| Total (Overall) | 27 (36.5%) | 47 (63.5%) |
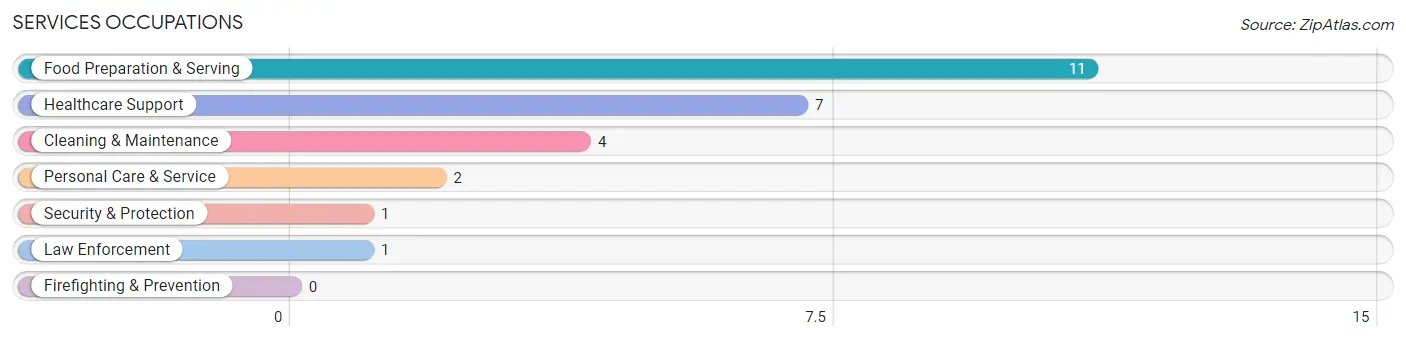
Services Occupations
The most common Services occupations in Fountain are Food Preparation & Serving (11 | 14.9%), Healthcare Support (7 | 9.5%), Cleaning & Maintenance (4 | 5.4%), Personal Care & Service (2 | 2.7%), and Security & Protection (1 | 1.3%).
Services Occupations by Sex
Within the Services occupations in Fountain, the most male-oriented occupations are Security & Protection (100.0%), Law Enforcement (100.0%), and Cleaning & Maintenance (100.0%), while the most female-oriented occupations are Healthcare Support (100.0%), Personal Care & Service (100.0%), and Food Preparation & Serving (81.8%).
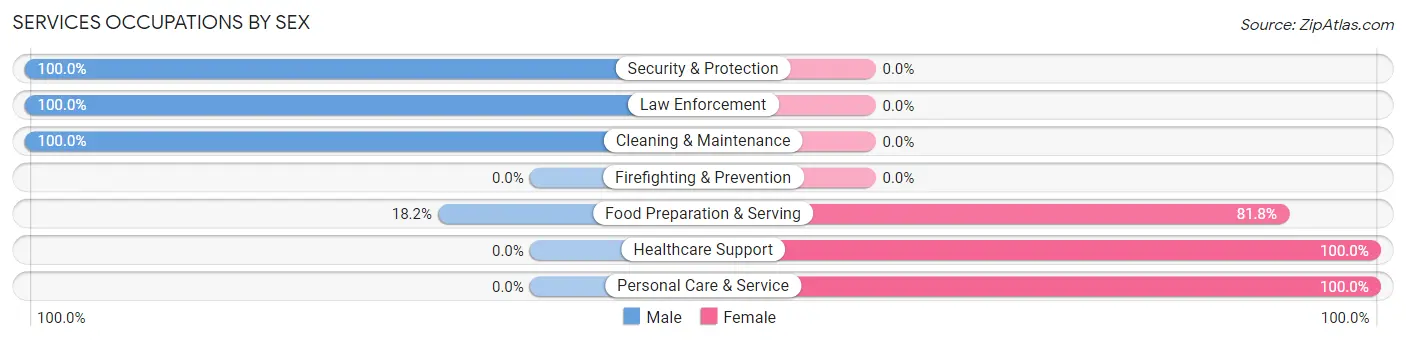
| Occupation | Male | Female |
| Healthcare Support | 0 (0.0%) | 7 (100.0%) |
| Security & Protection | 1 (100.0%) | 0 (0.0%) |
| Firefighting & Prevention | 0 (0.0%) | 0 (0.0%) |
| Law Enforcement | 1 (100.0%) | 0 (0.0%) |
| Food Preparation & Serving | 2 (18.2%) | 9 (81.8%) |
| Cleaning & Maintenance | 4 (100.0%) | 0 (0.0%) |
| Personal Care & Service | 0 (0.0%) | 2 (100.0%) |
| Total (Category) | 7 (28.0%) | 18 (72.0%) |
| Total (Overall) | 27 (36.5%) | 47 (63.5%) |
Sales and Office Occupations
The most common Sales and Office occupations in Fountain are Sales & Related (5 | 6.8%), and Office & Administration (3 | 4.1%).
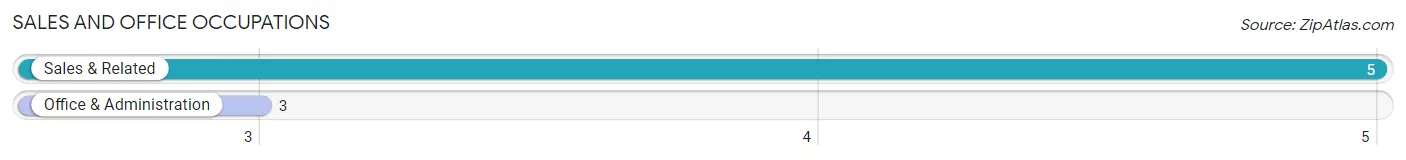
Sales and Office Occupations by Sex
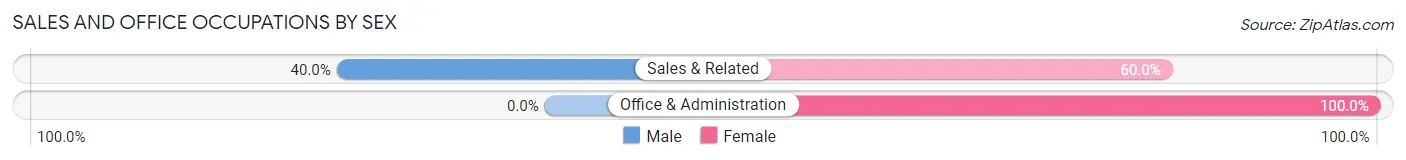
| Occupation | Male | Female |
| Sales & Related | 2 (40.0%) | 3 (60.0%) |
| Office & Administration | 0 (0.0%) | 3 (100.0%) |
| Total (Category) | 2 (25.0%) | 6 (75.0%) |
| Total (Overall) | 27 (36.5%) | 47 (63.5%) |
Natural Resources, Construction and Maintenance Occupations
The most common Natural Resources, Construction and Maintenance occupations in Fountain are Installation, Maintenance & Repair (5 | 6.8%), and Farming, Fishing & Forestry (4 | 5.4%).

Natural Resources, Construction and Maintenance Occupations by Sex
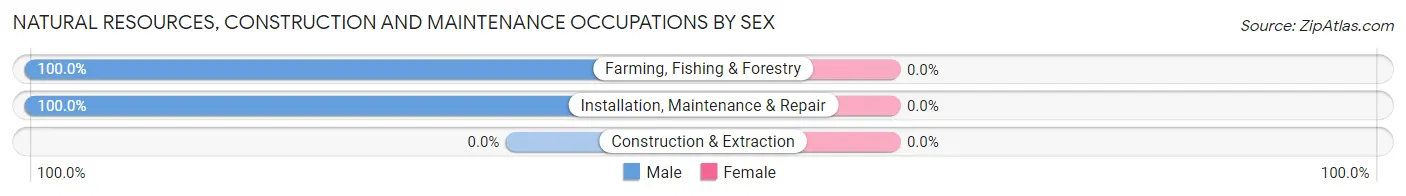
| Occupation | Male | Female |
| Farming, Fishing & Forestry | 4 (100.0%) | 0 (0.0%) |
| Construction & Extraction | 0 (0.0%) | 0 (0.0%) |
| Installation, Maintenance & Repair | 5 (100.0%) | 0 (0.0%) |
| Total (Category) | 9 (100.0%) | 0 (0.0%) |
| Total (Overall) | 27 (36.5%) | 47 (63.5%) |
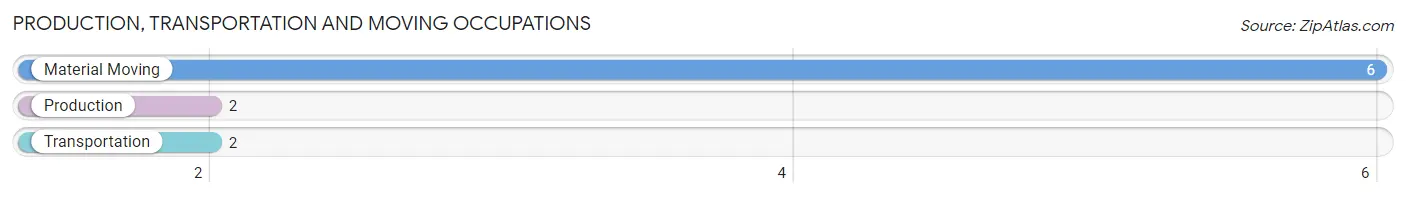
Production, Transportation and Moving Occupations
The most common Production, Transportation and Moving occupations in Fountain are Material Moving (6 | 8.1%), Production (2 | 2.7%), and Transportation (2 | 2.7%).
Production, Transportation and Moving Occupations by Sex
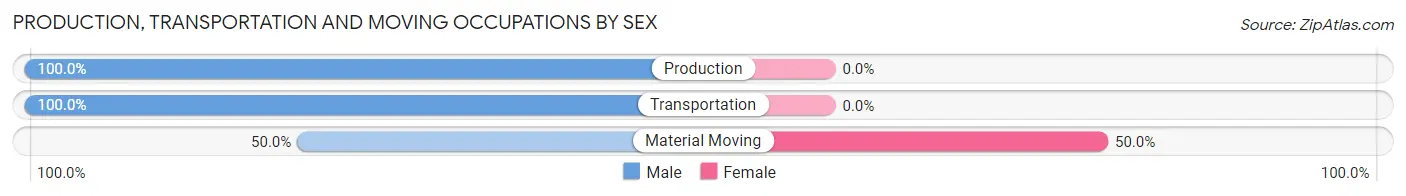
| Occupation | Male | Female |
| Production | 2 (100.0%) | 0 (0.0%) |
| Transportation | 2 (100.0%) | 0 (0.0%) |
| Material Moving | 3 (50.0%) | 3 (50.0%) |
| Total (Category) | 7 (70.0%) | 3 (30.0%) |
| Total (Overall) | 27 (36.5%) | 47 (63.5%) |
Employment Industries by Sex in Fountain
Employment Industries in Fountain
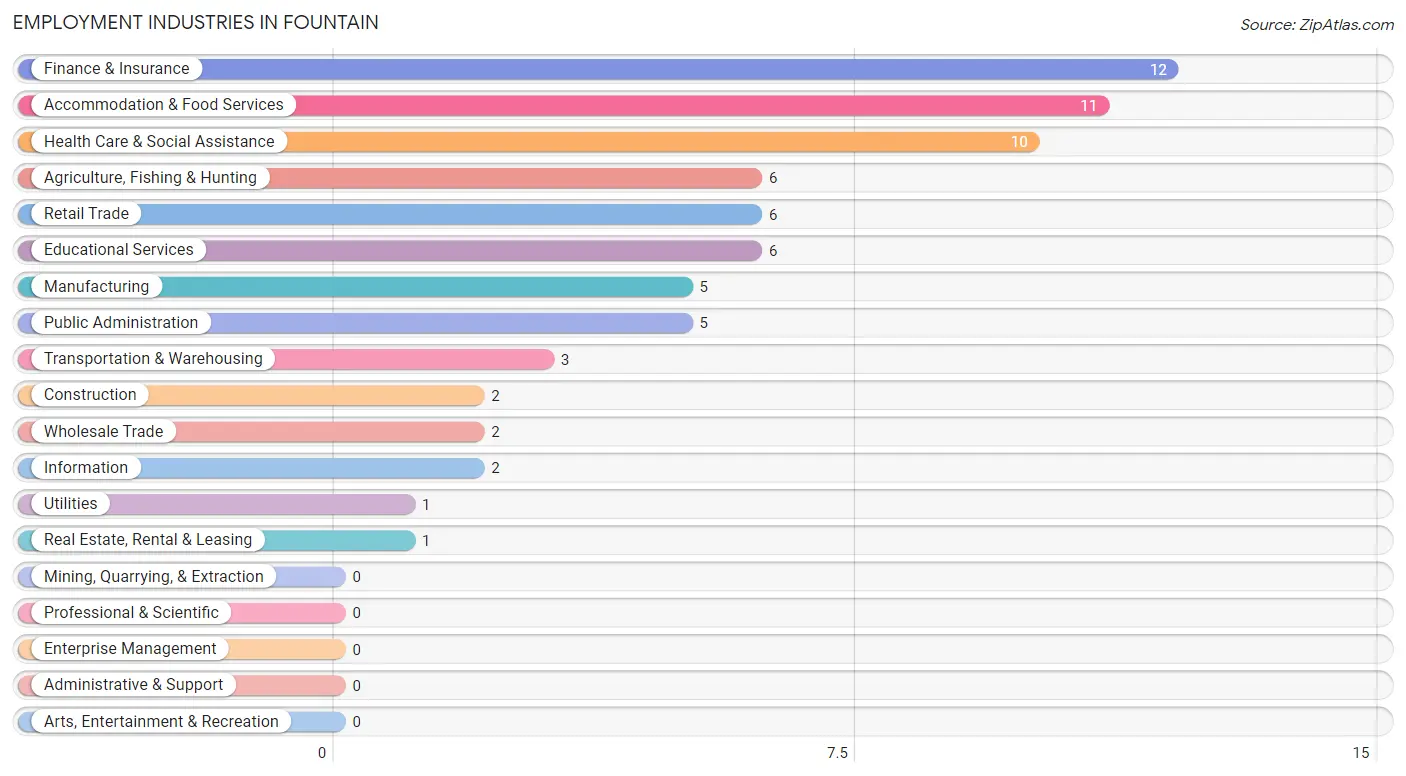
The major employment industries in Fountain include Finance & Insurance (12 | 16.2%), Accommodation & Food Services (11 | 14.9%), Health Care & Social Assistance (10 | 13.5%), Agriculture, Fishing & Hunting (6 | 8.1%), and Retail Trade (6 | 8.1%).
Employment Industries by Sex in Fountain
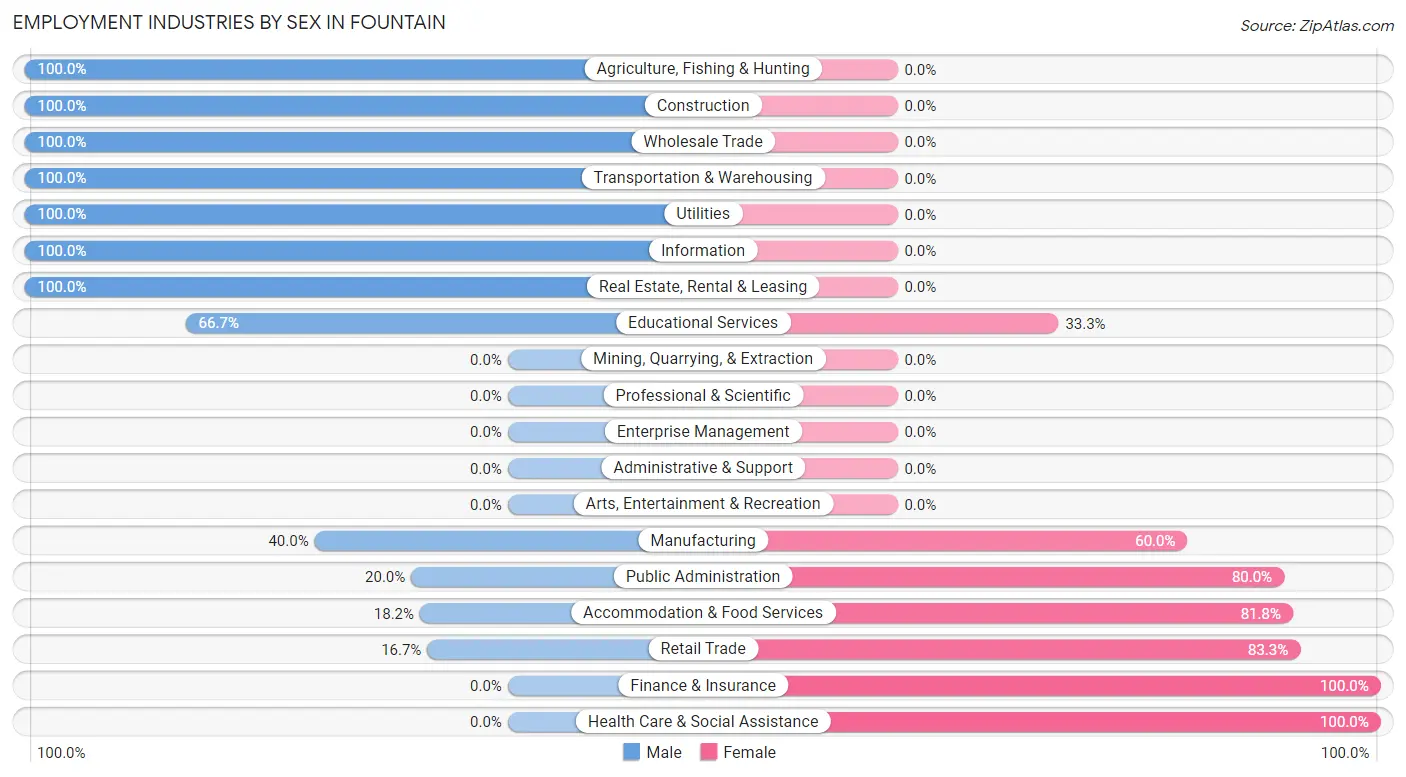
The Fountain industries that see more men than women are Agriculture, Fishing & Hunting (100.0%), Construction (100.0%), and Wholesale Trade (100.0%), whereas the industries that tend to have a higher number of women are Finance & Insurance (100.0%), Health Care & Social Assistance (100.0%), and Retail Trade (83.3%).
| Industry | Male | Female |
| Agriculture, Fishing & Hunting | 6 (100.0%) | 0 (0.0%) |
| Mining, Quarrying, & Extraction | 0 (0.0%) | 0 (0.0%) |
| Construction | 2 (100.0%) | 0 (0.0%) |
| Manufacturing | 2 (40.0%) | 3 (60.0%) |
| Wholesale Trade | 2 (100.0%) | 0 (0.0%) |
| Retail Trade | 1 (16.7%) | 5 (83.3%) |
| Transportation & Warehousing | 3 (100.0%) | 0 (0.0%) |
| Utilities | 1 (100.0%) | 0 (0.0%) |
| Information | 2 (100.0%) | 0 (0.0%) |
| Finance & Insurance | 0 (0.0%) | 12 (100.0%) |
| Real Estate, Rental & Leasing | 1 (100.0%) | 0 (0.0%) |
| Professional & Scientific | 0 (0.0%) | 0 (0.0%) |
| Enterprise Management | 0 (0.0%) | 0 (0.0%) |
| Administrative & Support | 0 (0.0%) | 0 (0.0%) |
| Educational Services | 4 (66.7%) | 2 (33.3%) |
| Health Care & Social Assistance | 0 (0.0%) | 10 (100.0%) |
| Arts, Entertainment & Recreation | 0 (0.0%) | 0 (0.0%) |
| Accommodation & Food Services | 2 (18.2%) | 9 (81.8%) |
| Public Administration | 1 (20.0%) | 4 (80.0%) |
| Total | 27 (36.5%) | 47 (63.5%) |
Education in Fountain
School Enrollment in Fountain
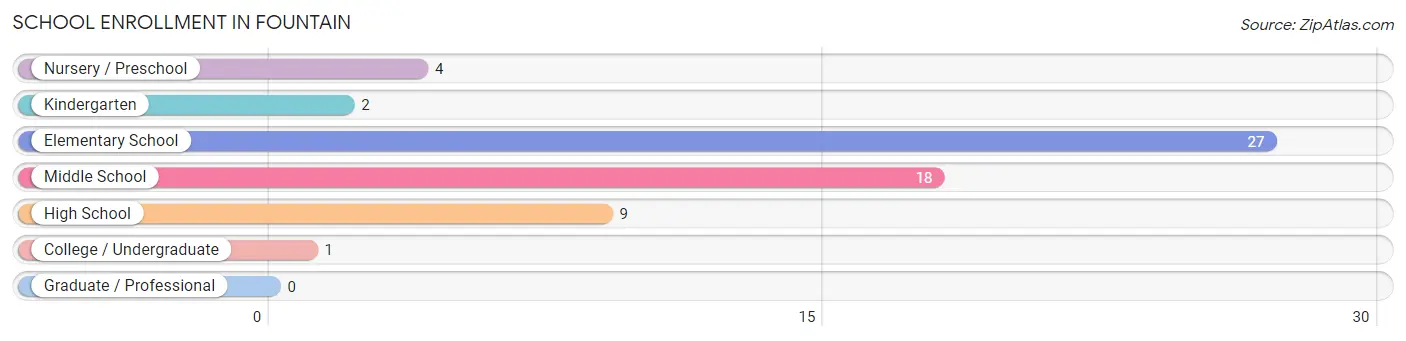
The most common levels of schooling among the 61 students in Fountain are elementary school (27 | 44.3%), middle school (18 | 29.5%), and high school (9 | 14.7%).
| School Level | # Students | % Students |
| Nursery / Preschool | 4 | 6.6% |
| Kindergarten | 2 | 3.3% |
| Elementary School | 27 | 44.3% |
| Middle School | 18 | 29.5% |
| High School | 9 | 14.7% |
| College / Undergraduate | 1 | 1.6% |
| Graduate / Professional | 0 | 0.0% |
| Total | 61 | 100.0% |
School Enrollment by Age by Funding Source in Fountain
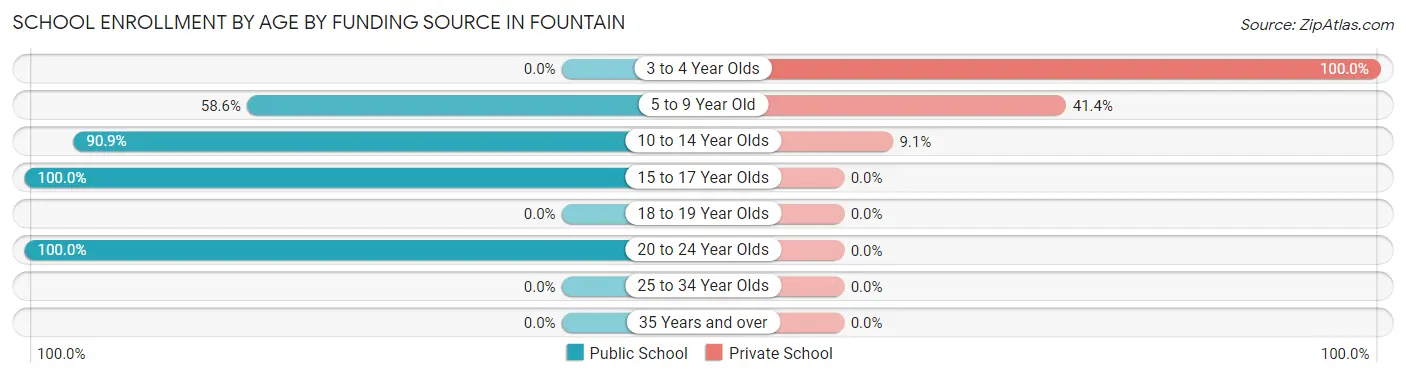
Out of a total of 61 students who are enrolled in schools in Fountain, 16 (26.2%) attend a private institution, while the remaining 45 (73.8%) are enrolled in public schools. The age group of 3 to 4 year olds has the highest likelihood of being enrolled in private schools, with 2 (100.0% in the age bracket) enrolled. Conversely, the age group of 15 to 17 year olds has the lowest likelihood of being enrolled in a private school, with 7 (100.0% in the age bracket) attending a public institution.
| Age Bracket | Public School | Private School |
| 3 to 4 Year Olds | 0 (0.0%) | 2 (100.0%) |
| 5 to 9 Year Old | 17 (58.6%) | 12 (41.4%) |
| 10 to 14 Year Olds | 20 (90.9%) | 2 (9.1%) |
| 15 to 17 Year Olds | 7 (100.0%) | 0 (0.0%) |
| 18 to 19 Year Olds | 0 (0.0%) | 0 (0.0%) |
| 20 to 24 Year Olds | 1 (100.0%) | 0 (0.0%) |
| 25 to 34 Year Olds | 0 (0.0%) | 0 (0.0%) |
| 35 Years and over | 0 (0.0%) | 0 (0.0%) |
| Total | 45 (73.8%) | 16 (26.2%) |
Educational Attainment by Field of Study in Fountain
Business (6 | 42.9%), arts & humanities (6 | 42.9%), and education (2 | 14.3%) are the most common fields of study among 14 individuals in Fountain who have obtained a bachelor's degree or higher.
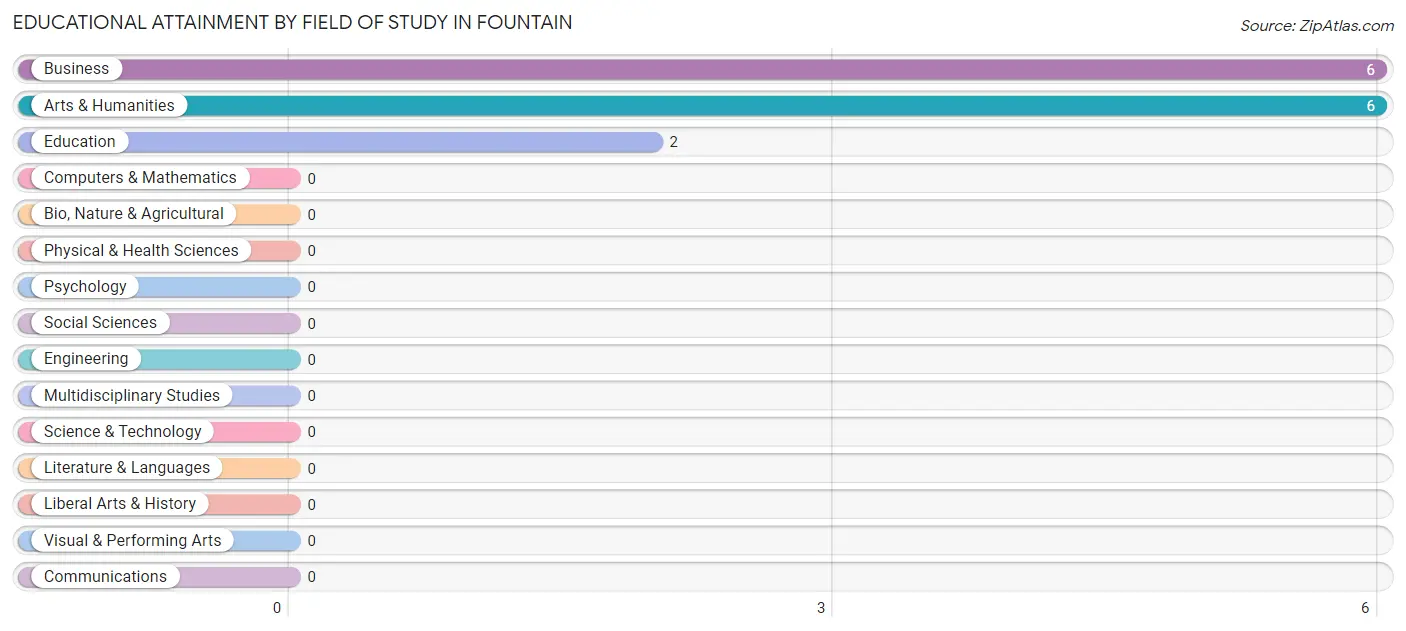
| Field of Study | # Graduates | % Graduates |
| Computers & Mathematics | 0 | 0.0% |
| Bio, Nature & Agricultural | 0 | 0.0% |
| Physical & Health Sciences | 0 | 0.0% |
| Psychology | 0 | 0.0% |
| Social Sciences | 0 | 0.0% |
| Engineering | 0 | 0.0% |
| Multidisciplinary Studies | 0 | 0.0% |
| Science & Technology | 0 | 0.0% |
| Business | 6 | 42.9% |
| Education | 2 | 14.3% |
| Literature & Languages | 0 | 0.0% |
| Liberal Arts & History | 0 | 0.0% |
| Visual & Performing Arts | 0 | 0.0% |
| Communications | 0 | 0.0% |
| Arts & Humanities | 6 | 42.9% |
| Total | 14 | 100.0% |
Transportation & Commute in Fountain
Vehicle Availability by Sex in Fountain
The most prevalent vehicle ownership categories in Fountain are males with 2 vehicles (10, accounting for 38.5%) and females with 2 vehicles (25, making up 21.3%).
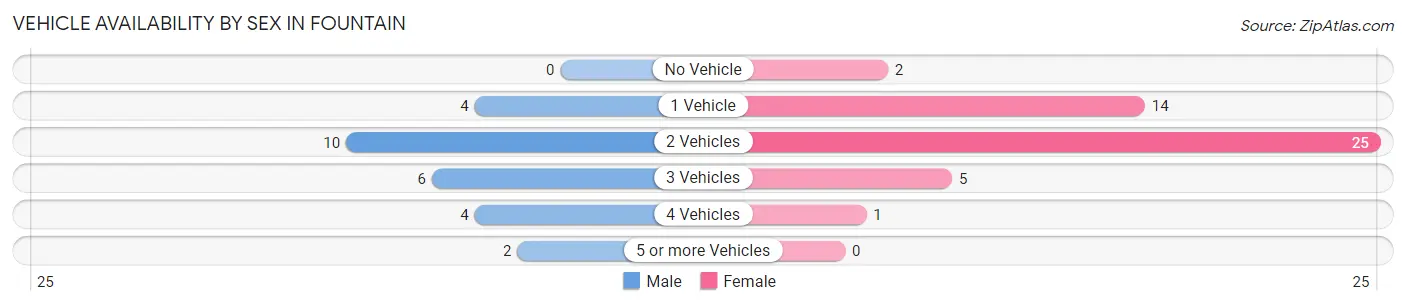
| Vehicles Available | Male | Female |
| No Vehicle | 0 (0.0%) | 2 (4.3%) |
| 1 Vehicle | 4 (15.4%) | 14 (29.8%) |
| 2 Vehicles | 10 (38.5%) | 25 (53.2%) |
| 3 Vehicles | 6 (23.1%) | 5 (10.6%) |
| 4 Vehicles | 4 (15.4%) | 1 (2.1%) |
| 5 or more Vehicles | 2 (7.7%) | 0 (0.0%) |
| Total | 26 (100.0%) | 47 (100.0%) |
Commute Time in Fountain
The most frequently occuring commute durations in Fountain are 25 to 29 minutes (25 commuters, 34.3%), 15 to 19 minutes (14 commuters, 19.2%), and 20 to 24 minutes (11 commuters, 15.1%).
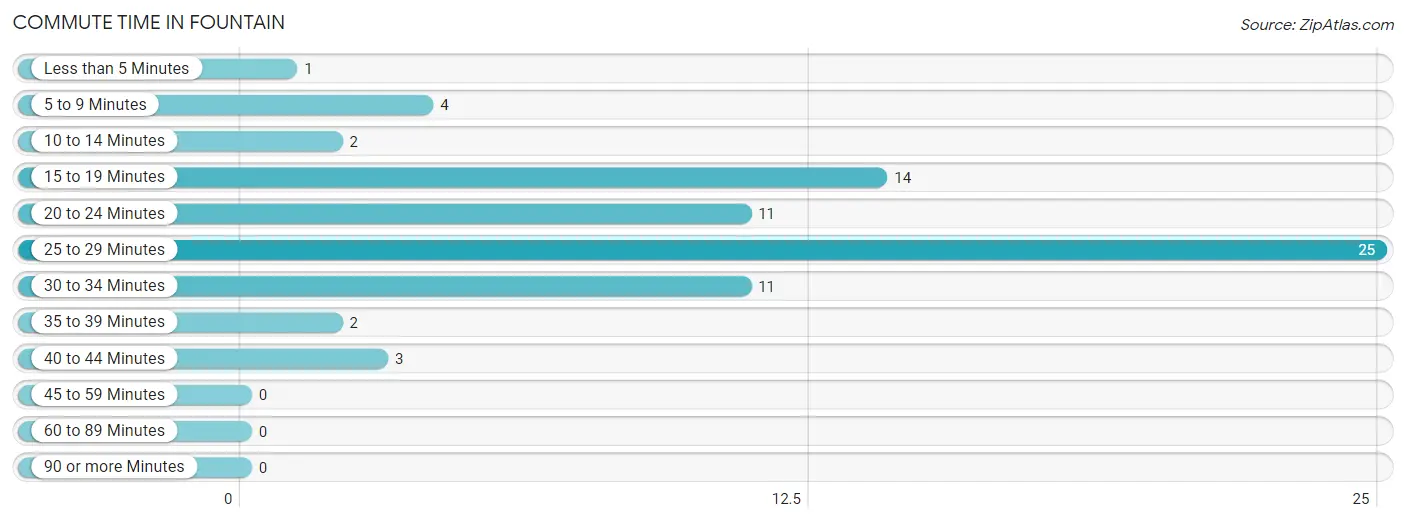
| Commute Time | # Commuters | % Commuters |
| Less than 5 Minutes | 1 | 1.4% |
| 5 to 9 Minutes | 4 | 5.5% |
| 10 to 14 Minutes | 2 | 2.7% |
| 15 to 19 Minutes | 14 | 19.2% |
| 20 to 24 Minutes | 11 | 15.1% |
| 25 to 29 Minutes | 25 | 34.3% |
| 30 to 34 Minutes | 11 | 15.1% |
| 35 to 39 Minutes | 2 | 2.7% |
| 40 to 44 Minutes | 3 | 4.1% |
| 45 to 59 Minutes | 0 | 0.0% |
| 60 to 89 Minutes | 0 | 0.0% |
| 90 or more Minutes | 0 | 0.0% |
Commute Time by Sex in Fountain
The most common commute times in Fountain are 25 to 29 minutes (10 commuters, 38.5%) for males and 25 to 29 minutes (15 commuters, 31.9%) for females.
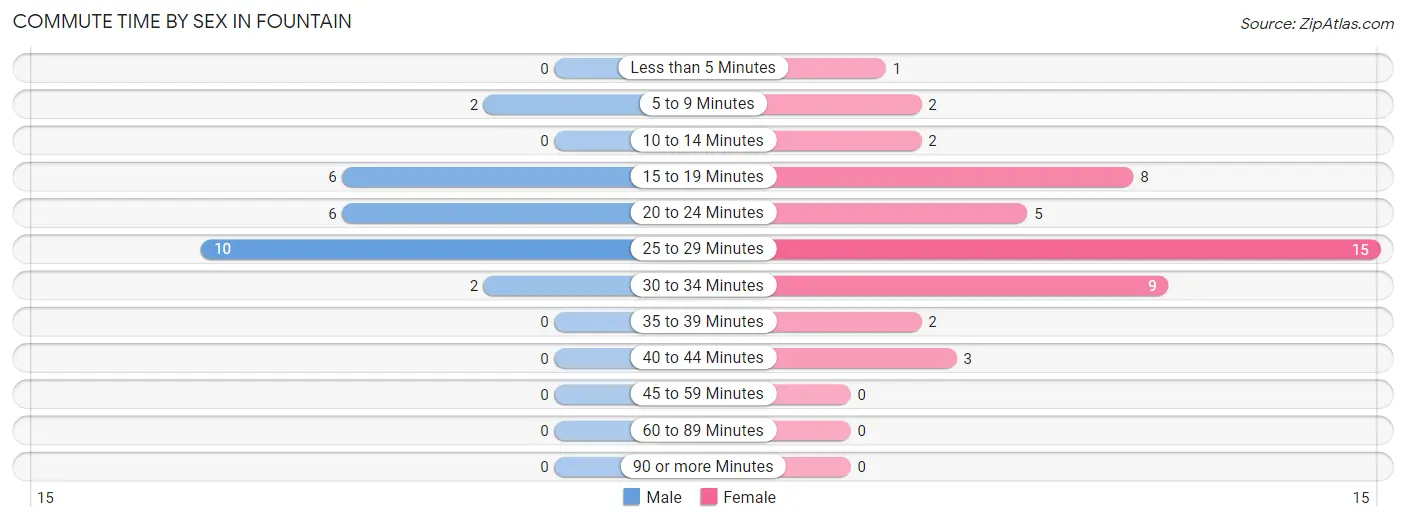
| Commute Time | Male | Female |
| Less than 5 Minutes | 0 (0.0%) | 1 (2.1%) |
| 5 to 9 Minutes | 2 (7.7%) | 2 (4.3%) |
| 10 to 14 Minutes | 0 (0.0%) | 2 (4.3%) |
| 15 to 19 Minutes | 6 (23.1%) | 8 (17.0%) |
| 20 to 24 Minutes | 6 (23.1%) | 5 (10.6%) |
| 25 to 29 Minutes | 10 (38.5%) | 15 (31.9%) |
| 30 to 34 Minutes | 2 (7.7%) | 9 (19.2%) |
| 35 to 39 Minutes | 0 (0.0%) | 2 (4.3%) |
| 40 to 44 Minutes | 0 (0.0%) | 3 (6.4%) |
| 45 to 59 Minutes | 0 (0.0%) | 0 (0.0%) |
| 60 to 89 Minutes | 0 (0.0%) | 0 (0.0%) |
| 90 or more Minutes | 0 (0.0%) | 0 (0.0%) |
Time of Departure to Work by Sex in Fountain
The most frequent times of departure to work in Fountain are 12:00 AM to 4:59 AM (5, 19.2%) for males and 8:00 AM to 8:29 AM (17, 36.2%) for females.
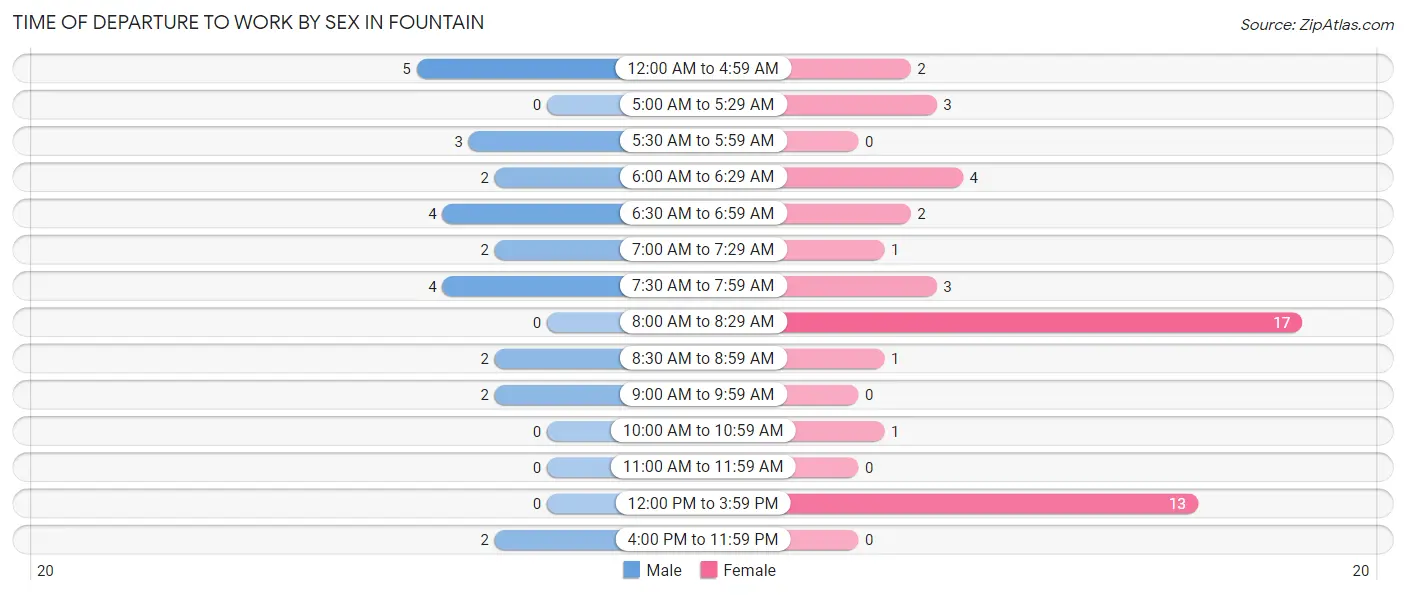
| Time of Departure | Male | Female |
| 12:00 AM to 4:59 AM | 5 (19.2%) | 2 (4.3%) |
| 5:00 AM to 5:29 AM | 0 (0.0%) | 3 (6.4%) |
| 5:30 AM to 5:59 AM | 3 (11.5%) | 0 (0.0%) |
| 6:00 AM to 6:29 AM | 2 (7.7%) | 4 (8.5%) |
| 6:30 AM to 6:59 AM | 4 (15.4%) | 2 (4.3%) |
| 7:00 AM to 7:29 AM | 2 (7.7%) | 1 (2.1%) |
| 7:30 AM to 7:59 AM | 4 (15.4%) | 3 (6.4%) |
| 8:00 AM to 8:29 AM | 0 (0.0%) | 17 (36.2%) |
| 8:30 AM to 8:59 AM | 2 (7.7%) | 1 (2.1%) |
| 9:00 AM to 9:59 AM | 2 (7.7%) | 0 (0.0%) |
| 10:00 AM to 10:59 AM | 0 (0.0%) | 1 (2.1%) |
| 11:00 AM to 11:59 AM | 0 (0.0%) | 0 (0.0%) |
| 12:00 PM to 3:59 PM | 0 (0.0%) | 13 (27.7%) |
| 4:00 PM to 11:59 PM | 2 (7.7%) | 0 (0.0%) |
| Total | 26 (100.0%) | 47 (100.0%) |
Housing Occupancy in Fountain
Occupancy by Ownership in Fountain
Of the total 76 dwellings in Fountain, owner-occupied units account for 65 (85.5%), while renter-occupied units make up 11 (14.5%).
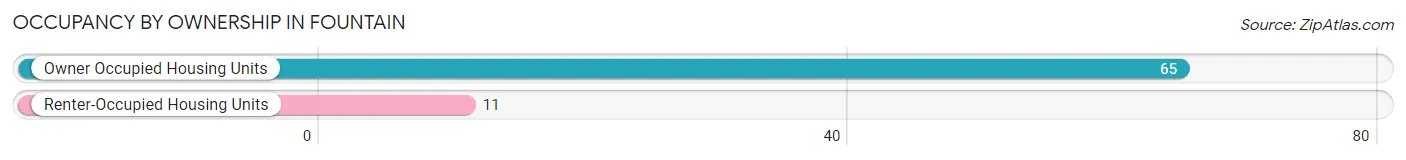
| Occupancy | # Housing Units | % Housing Units |
| Owner Occupied Housing Units | 65 | 85.5% |
| Renter-Occupied Housing Units | 11 | 14.5% |
| Total Occupied Housing Units | 76 | 100.0% |
Occupancy by Household Size in Fountain
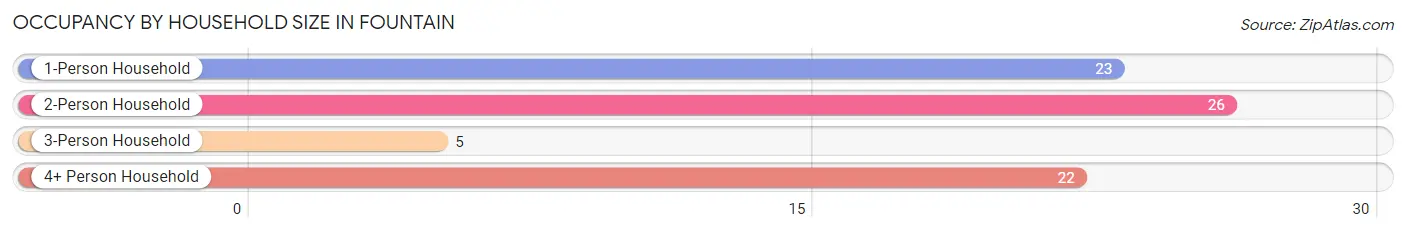
| Household Size | # Housing Units | % Housing Units |
| 1-Person Household | 23 | 30.3% |
| 2-Person Household | 26 | 34.2% |
| 3-Person Household | 5 | 6.6% |
| 4+ Person Household | 22 | 28.9% |
| Total Housing Units | 76 | 100.0% |
Occupancy by Ownership by Household Size in Fountain
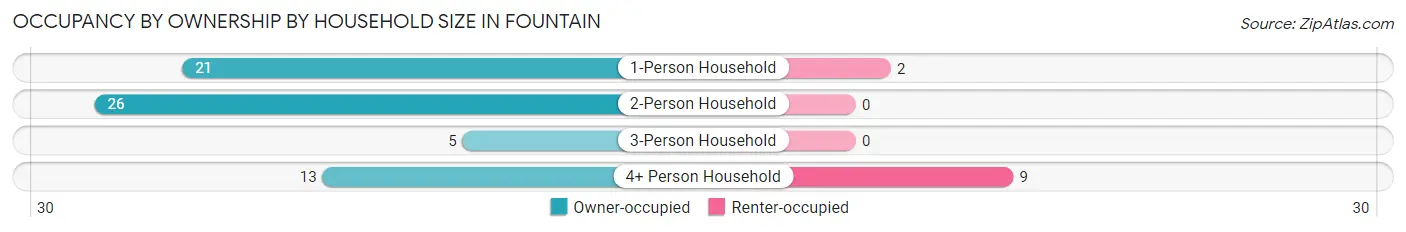
| Household Size | Owner-occupied | Renter-occupied |
| 1-Person Household | 21 (91.3%) | 2 (8.7%) |
| 2-Person Household | 26 (100.0%) | 0 (0.0%) |
| 3-Person Household | 5 (100.0%) | 0 (0.0%) |
| 4+ Person Household | 13 (59.1%) | 9 (40.9%) |
| Total Housing Units | 65 (85.5%) | 11 (14.5%) |
Occupancy by Educational Attainment in Fountain
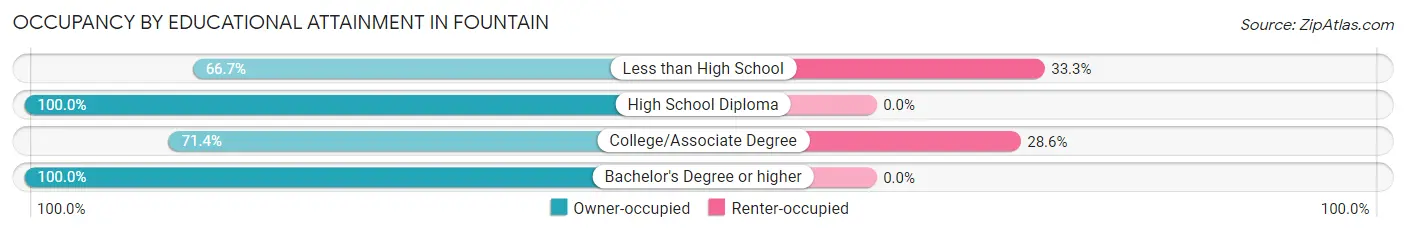
| Household Size | Owner-occupied | Renter-occupied |
| Less than High School | 2 (66.7%) | 1 (33.3%) |
| High School Diploma | 36 (100.0%) | 0 (0.0%) |
| College/Associate Degree | 25 (71.4%) | 10 (28.6%) |
| Bachelor's Degree or higher | 2 (100.0%) | 0 (0.0%) |
Occupancy by Age of Householder in Fountain
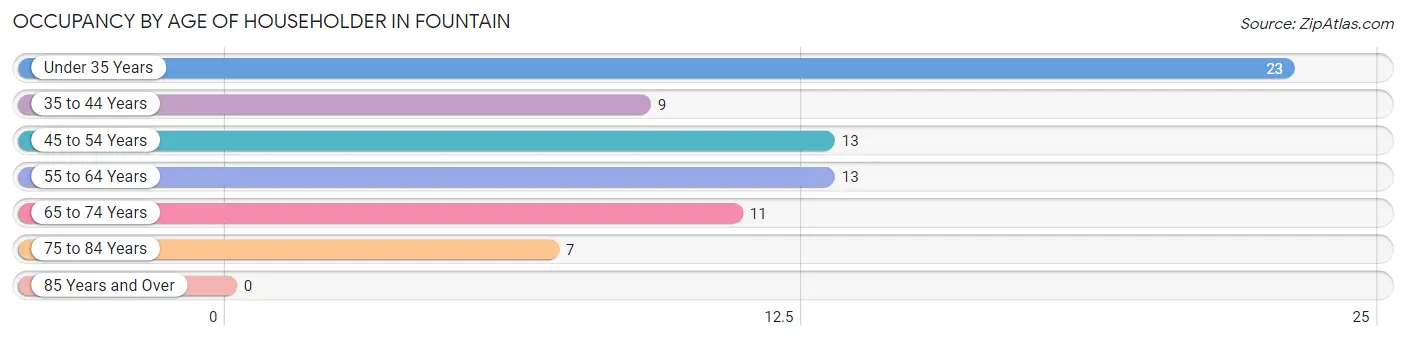
| Age Bracket | # Households | % Households |
| Under 35 Years | 23 | 30.3% |
| 35 to 44 Years | 9 | 11.8% |
| 45 to 54 Years | 13 | 17.1% |
| 55 to 64 Years | 13 | 17.1% |
| 65 to 74 Years | 11 | 14.5% |
| 75 to 84 Years | 7 | 9.2% |
| 85 Years and Over | 0 | 0.0% |
| Total | 76 | 100.0% |
Housing Finances in Fountain
Median Income by Occupancy in Fountain
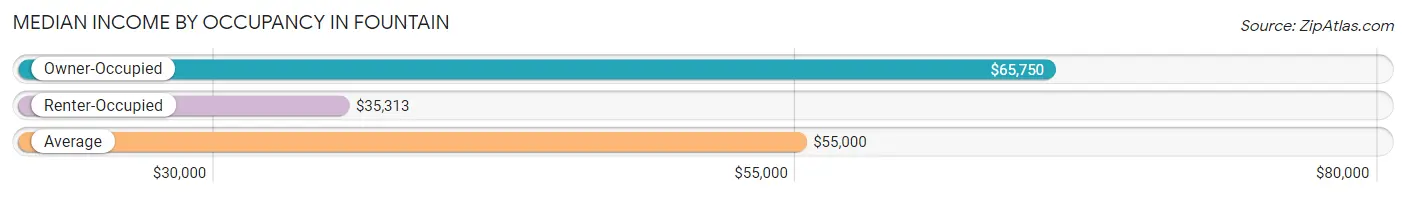
| Occupancy Type | # Households | Median Income |
| Owner-Occupied | 65 (85.5%) | $65,750 |
| Renter-Occupied | 11 (14.5%) | $35,313 |
| Average | 76 (100.0%) | $55,000 |
Occupancy by Householder Income Bracket in Fountain
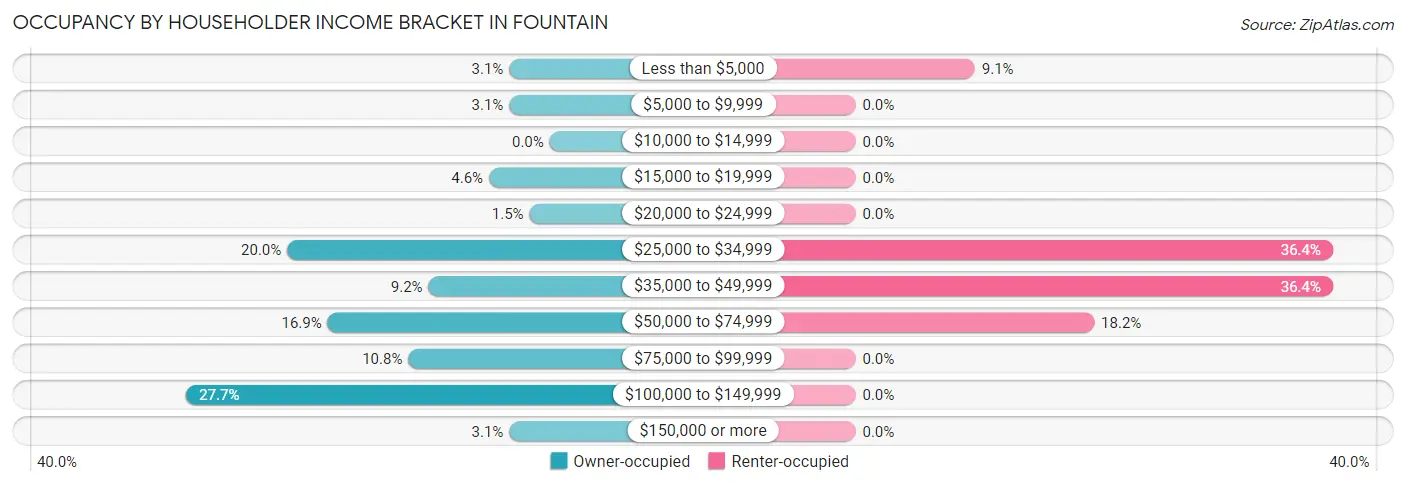
| Income Bracket | Owner-occupied | Renter-occupied |
| Less than $5,000 | 2 (3.1%) | 1 (9.1%) |
| $5,000 to $9,999 | 2 (3.1%) | 0 (0.0%) |
| $10,000 to $14,999 | 0 (0.0%) | 0 (0.0%) |
| $15,000 to $19,999 | 3 (4.6%) | 0 (0.0%) |
| $20,000 to $24,999 | 1 (1.5%) | 0 (0.0%) |
| $25,000 to $34,999 | 13 (20.0%) | 4 (36.4%) |
| $35,000 to $49,999 | 6 (9.2%) | 4 (36.4%) |
| $50,000 to $74,999 | 11 (16.9%) | 2 (18.2%) |
| $75,000 to $99,999 | 7 (10.8%) | 0 (0.0%) |
| $100,000 to $149,999 | 18 (27.7%) | 0 (0.0%) |
| $150,000 or more | 2 (3.1%) | 0 (0.0%) |
| Total | 65 (100.0%) | 11 (100.0%) |
Monthly Housing Cost Tiers in Fountain
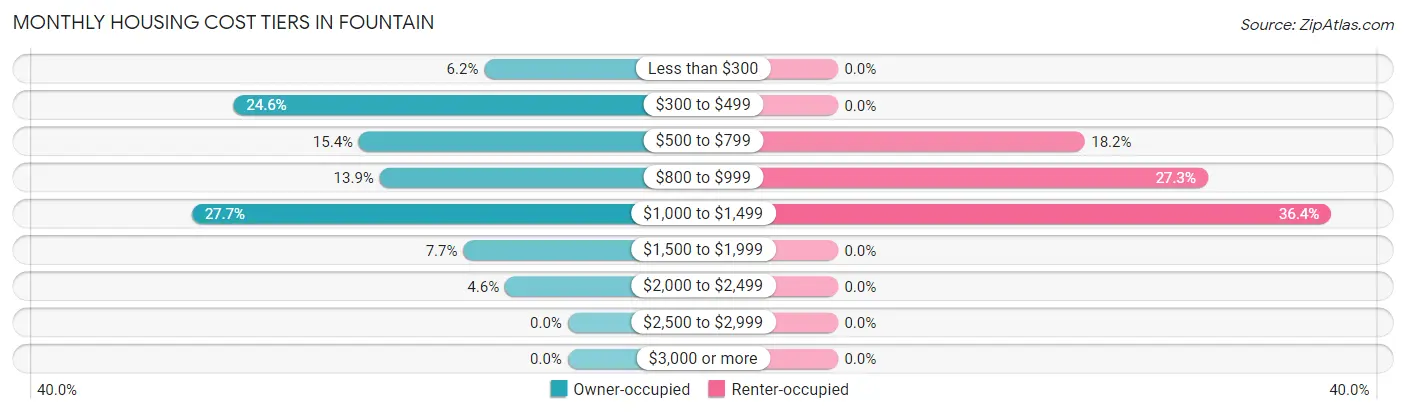
| Monthly Cost | Owner-occupied | Renter-occupied |
| Less than $300 | 4 (6.1%) | 0 (0.0%) |
| $300 to $499 | 16 (24.6%) | 0 (0.0%) |
| $500 to $799 | 10 (15.4%) | 2 (18.2%) |
| $800 to $999 | 9 (13.9%) | 3 (27.3%) |
| $1,000 to $1,499 | 18 (27.7%) | 4 (36.4%) |
| $1,500 to $1,999 | 5 (7.7%) | 0 (0.0%) |
| $2,000 to $2,499 | 3 (4.6%) | 0 (0.0%) |
| $2,500 to $2,999 | 0 (0.0%) | 0 (0.0%) |
| $3,000 or more | 0 (0.0%) | 0 (0.0%) |
| Total | 65 (100.0%) | 11 (100.0%) |
Physical Housing Characteristics in Fountain
Housing Structures in Fountain
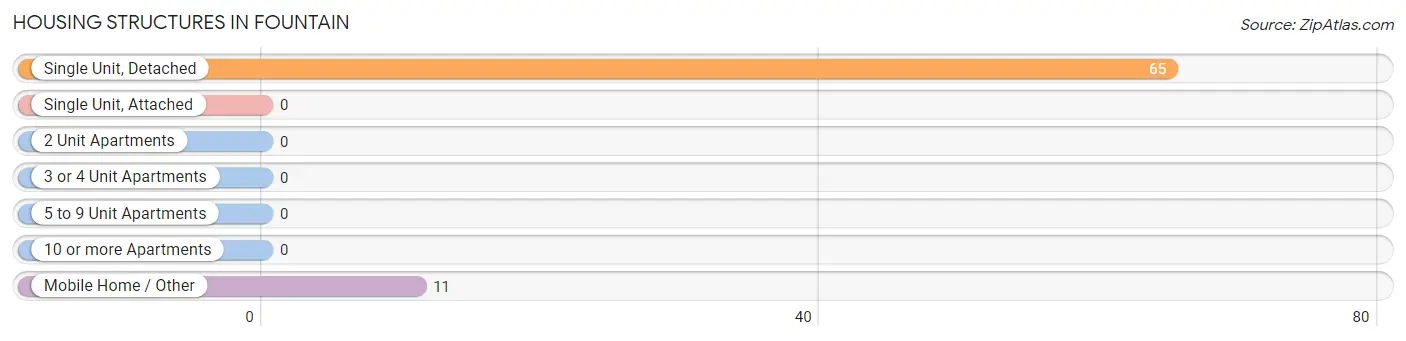
| Structure Type | # Housing Units | % Housing Units |
| Single Unit, Detached | 65 | 85.5% |
| Single Unit, Attached | 0 | 0.0% |
| 2 Unit Apartments | 0 | 0.0% |
| 3 or 4 Unit Apartments | 0 | 0.0% |
| 5 to 9 Unit Apartments | 0 | 0.0% |
| 10 or more Apartments | 0 | 0.0% |
| Mobile Home / Other | 11 | 14.5% |
| Total | 76 | 100.0% |
Housing Structures by Occupancy in Fountain
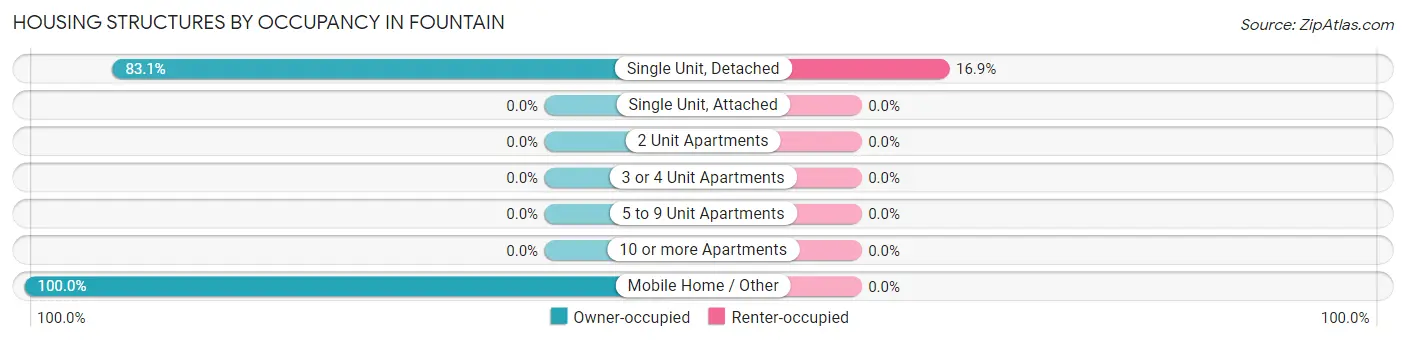
| Structure Type | Owner-occupied | Renter-occupied |
| Single Unit, Detached | 54 (83.1%) | 11 (16.9%) |
| Single Unit, Attached | 0 (0.0%) | 0 (0.0%) |
| 2 Unit Apartments | 0 (0.0%) | 0 (0.0%) |
| 3 or 4 Unit Apartments | 0 (0.0%) | 0 (0.0%) |
| 5 to 9 Unit Apartments | 0 (0.0%) | 0 (0.0%) |
| 10 or more Apartments | 0 (0.0%) | 0 (0.0%) |
| Mobile Home / Other | 11 (100.0%) | 0 (0.0%) |
| Total | 65 (85.5%) | 11 (14.5%) |
Housing Structures by Number of Rooms in Fountain
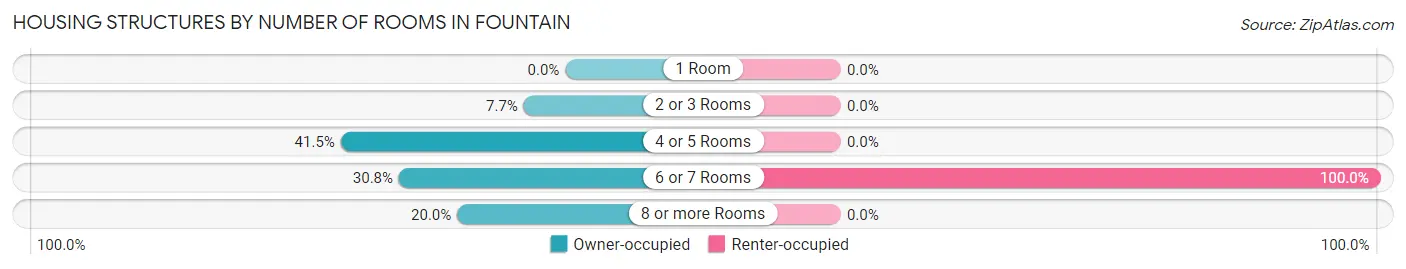
| Number of Rooms | Owner-occupied | Renter-occupied |
| 1 Room | 0 (0.0%) | 0 (0.0%) |
| 2 or 3 Rooms | 5 (7.7%) | 0 (0.0%) |
| 4 or 5 Rooms | 27 (41.5%) | 0 (0.0%) |
| 6 or 7 Rooms | 20 (30.8%) | 11 (100.0%) |
| 8 or more Rooms | 13 (20.0%) | 0 (0.0%) |
| Total | 65 (100.0%) | 11 (100.0%) |
Housing Structure by Heating Type in Fountain
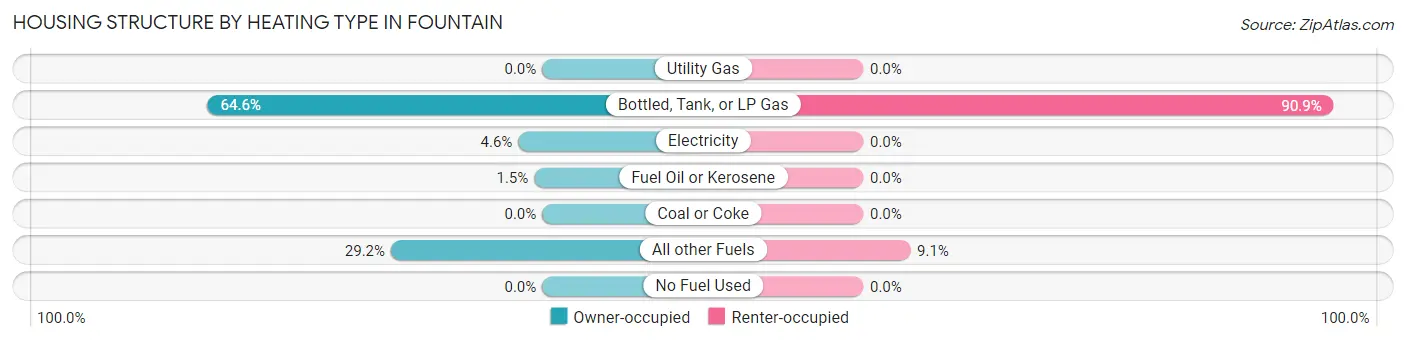
| Heating Type | Owner-occupied | Renter-occupied |
| Utility Gas | 0 (0.0%) | 0 (0.0%) |
| Bottled, Tank, or LP Gas | 42 (64.6%) | 10 (90.9%) |
| Electricity | 3 (4.6%) | 0 (0.0%) |
| Fuel Oil or Kerosene | 1 (1.5%) | 0 (0.0%) |
| Coal or Coke | 0 (0.0%) | 0 (0.0%) |
| All other Fuels | 19 (29.2%) | 1 (9.1%) |
| No Fuel Used | 0 (0.0%) | 0 (0.0%) |
| Total | 65 (100.0%) | 11 (100.0%) |
Household Vehicle Usage in Fountain
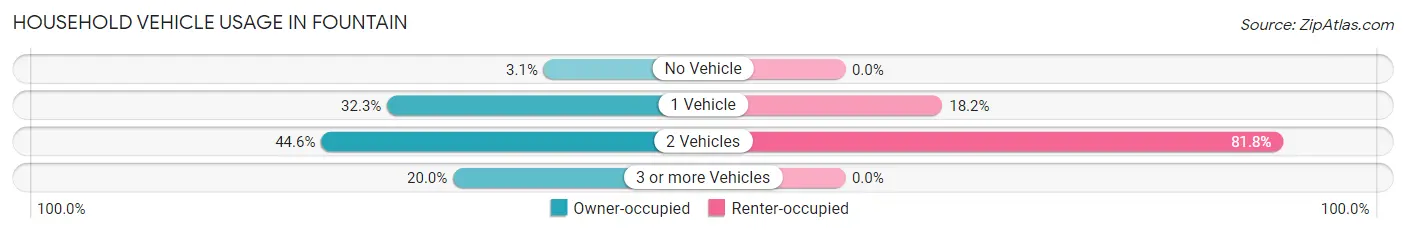
| Vehicles per Household | Owner-occupied | Renter-occupied |
| No Vehicle | 2 (3.1%) | 0 (0.0%) |
| 1 Vehicle | 21 (32.3%) | 2 (18.2%) |
| 2 Vehicles | 29 (44.6%) | 9 (81.8%) |
| 3 or more Vehicles | 13 (20.0%) | 0 (0.0%) |
| Total | 65 (100.0%) | 11 (100.0%) |
Real Estate & Mortgages in Fountain
Real Estate and Mortgage Overview in Fountain
| Characteristic | Without Mortgage | With Mortgage |
| Housing Units | 26 | 39 |
| Median Property Value | $68,300 | $122,900 |
| Median Household Income | $31,667 | $1 |
| Monthly Housing Costs | $422 | $0 |
| Real Estate Taxes | $1,042 | $0 |
Property Value by Mortgage Status in Fountain
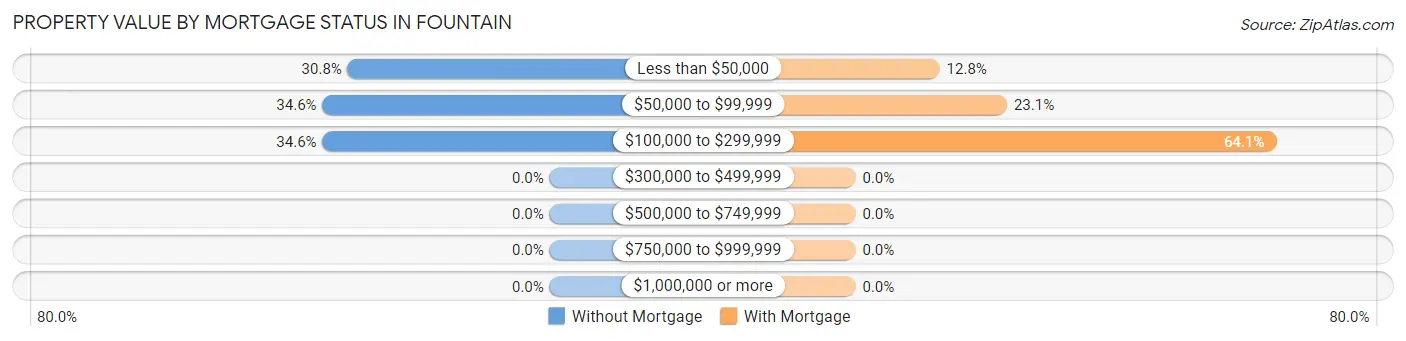
| Property Value | Without Mortgage | With Mortgage |
| Less than $50,000 | 8 (30.8%) | 5 (12.8%) |
| $50,000 to $99,999 | 9 (34.6%) | 9 (23.1%) |
| $100,000 to $299,999 | 9 (34.6%) | 25 (64.1%) |
| $300,000 to $499,999 | 0 (0.0%) | 0 (0.0%) |
| $500,000 to $749,999 | 0 (0.0%) | 0 (0.0%) |
| $750,000 to $999,999 | 0 (0.0%) | 0 (0.0%) |
| $1,000,000 or more | 0 (0.0%) | 0 (0.0%) |
| Total | 26 (100.0%) | 39 (100.0%) |
Household Income by Mortgage Status in Fountain
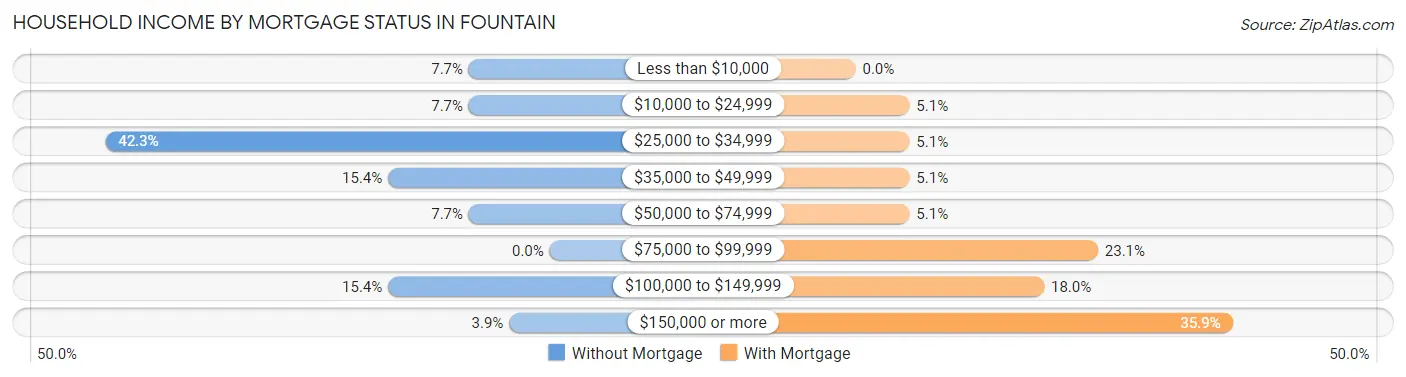
| Household Income | Without Mortgage | With Mortgage |
| Less than $10,000 | 2 (7.7%) | 0 (0.0%) |
| $10,000 to $24,999 | 2 (7.7%) | 2 (5.1%) |
| $25,000 to $34,999 | 11 (42.3%) | 2 (5.1%) |
| $35,000 to $49,999 | 4 (15.4%) | 2 (5.1%) |
| $50,000 to $74,999 | 2 (7.7%) | 2 (5.1%) |
| $75,000 to $99,999 | 0 (0.0%) | 9 (23.1%) |
| $100,000 to $149,999 | 4 (15.4%) | 7 (17.9%) |
| $150,000 or more | 1 (3.8%) | 14 (35.9%) |
| Total | 26 (100.0%) | 39 (100.0%) |
Property Value to Household Income Ratio in Fountain
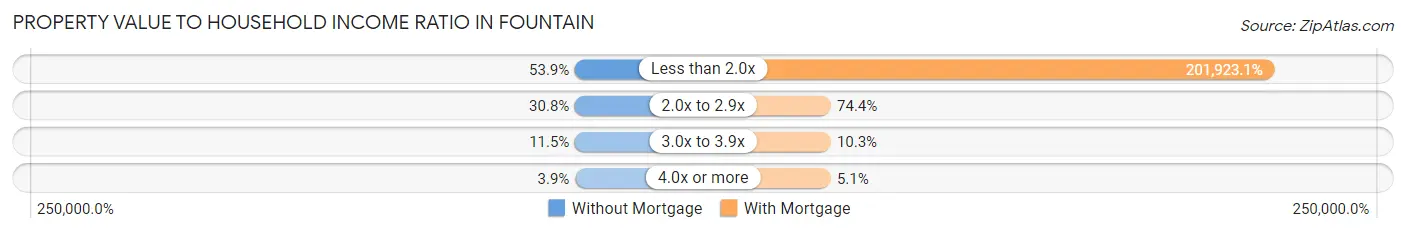
| Value-to-Income Ratio | Without Mortgage | With Mortgage |
| Less than 2.0x | 14 (53.8%) | 78,750 (201,923.1%) |
| 2.0x to 2.9x | 8 (30.8%) | 29 (74.4%) |
| 3.0x to 3.9x | 3 (11.5%) | 4 (10.3%) |
| 4.0x or more | 1 (3.8%) | 2 (5.1%) |
| Total | 26 (100.0%) | 39 (100.0%) |
Real Estate Taxes by Mortgage Status in Fountain
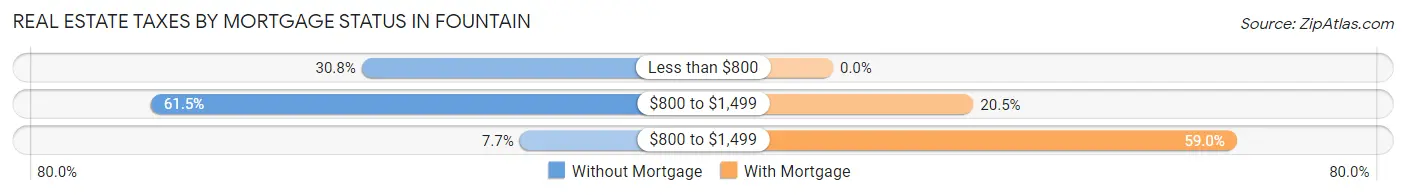
| Property Taxes | Without Mortgage | With Mortgage |
| Less than $800 | 8 (30.8%) | 0 (0.0%) |
| $800 to $1,499 | 16 (61.5%) | 8 (20.5%) |
| $800 to $1,499 | 2 (7.7%) | 23 (59.0%) |
| Total | 26 (100.0%) | 39 (100.0%) |
Health & Disability in Fountain
Health Insurance Coverage by Age in Fountain
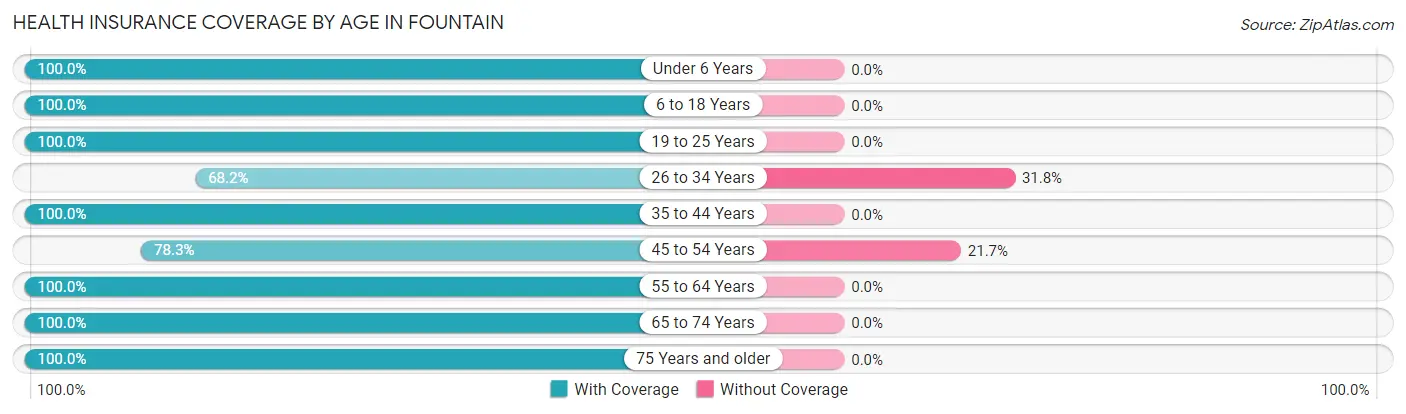
| Age Bracket | With Coverage | Without Coverage |
| Under 6 Years | 28 (100.0%) | 0 (0.0%) |
| 6 to 18 Years | 56 (100.0%) | 0 (0.0%) |
| 19 to 25 Years | 19 (100.0%) | 0 (0.0%) |
| 26 to 34 Years | 15 (68.2%) | 7 (31.8%) |
| 35 to 44 Years | 23 (100.0%) | 0 (0.0%) |
| 45 to 54 Years | 18 (78.3%) | 5 (21.7%) |
| 55 to 64 Years | 20 (100.0%) | 0 (0.0%) |
| 65 to 74 Years | 13 (100.0%) | 0 (0.0%) |
| 75 Years and older | 10 (100.0%) | 0 (0.0%) |
| Total | 202 (94.4%) | 12 (5.6%) |
Health Insurance Coverage by Citizenship Status in Fountain
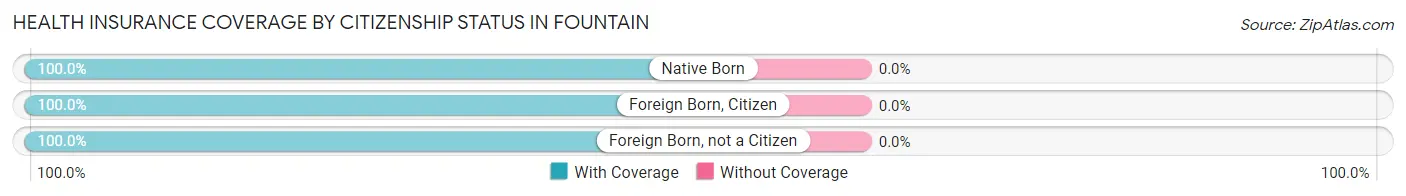
| Citizenship Status | With Coverage | Without Coverage |
| Native Born | 28 (100.0%) | 0 (0.0%) |
| Foreign Born, Citizen | 56 (100.0%) | 0 (0.0%) |
| Foreign Born, not a Citizen | 19 (100.0%) | 0 (0.0%) |
Health Insurance Coverage by Household Income in Fountain
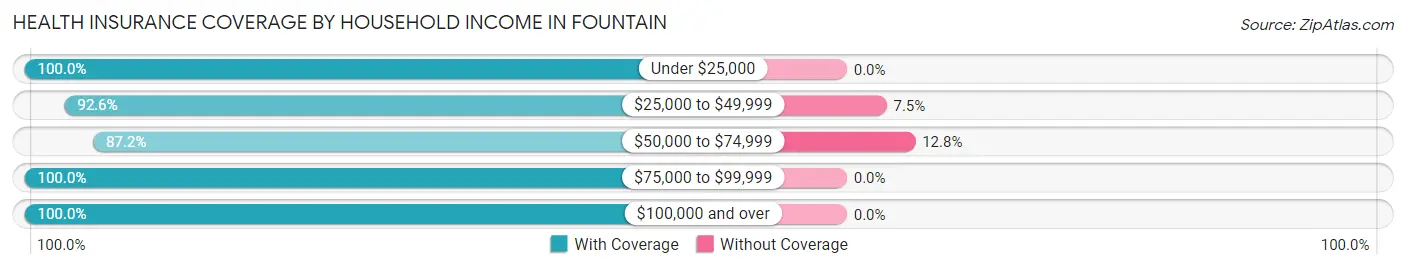
| Household Income | With Coverage | Without Coverage |
| Under $25,000 | 14 (100.0%) | 0 (0.0%) |
| $25,000 to $49,999 | 87 (92.5%) | 7 (7.4%) |
| $50,000 to $74,999 | 34 (87.2%) | 5 (12.8%) |
| $75,000 to $99,999 | 14 (100.0%) | 0 (0.0%) |
| $100,000 and over | 53 (100.0%) | 0 (0.0%) |
Public vs Private Health Insurance Coverage by Age in Fountain
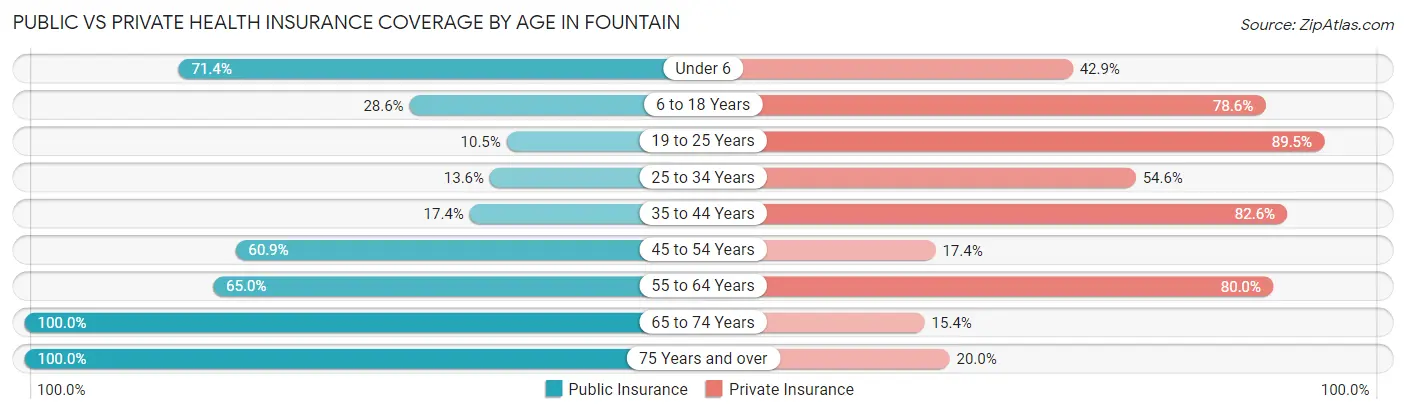
| Age Bracket | Public Insurance | Private Insurance |
| Under 6 | 20 (71.4%) | 12 (42.9%) |
| 6 to 18 Years | 16 (28.6%) | 44 (78.6%) |
| 19 to 25 Years | 2 (10.5%) | 17 (89.5%) |
| 25 to 34 Years | 3 (13.6%) | 12 (54.5%) |
| 35 to 44 Years | 4 (17.4%) | 19 (82.6%) |
| 45 to 54 Years | 14 (60.9%) | 4 (17.4%) |
| 55 to 64 Years | 13 (65.0%) | 16 (80.0%) |
| 65 to 74 Years | 13 (100.0%) | 2 (15.4%) |
| 75 Years and over | 10 (100.0%) | 2 (20.0%) |
| Total | 95 (44.4%) | 128 (59.8%) |
Disability Status by Sex by Age in Fountain
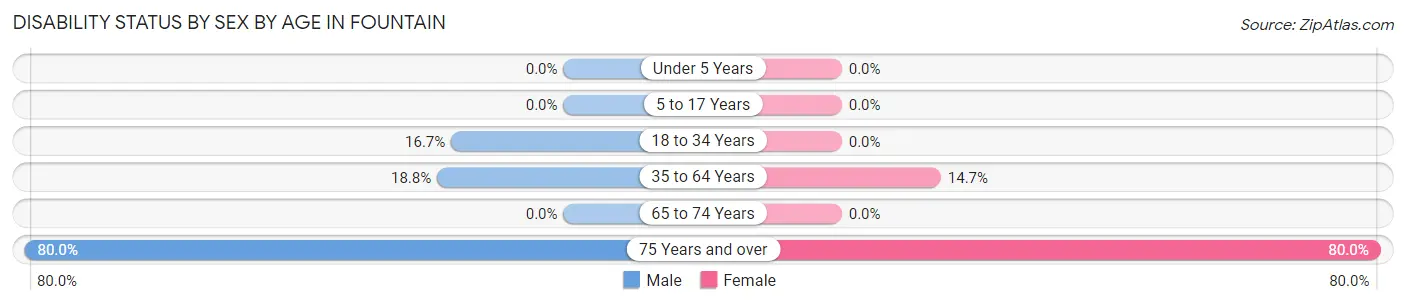
| Age Bracket | Male | Female |
| Under 5 Years | 0 (0.0%) | 0 (0.0%) |
| 5 to 17 Years | 0 (0.0%) | 0 (0.0%) |
| 18 to 34 Years | 2 (16.7%) | 0 (0.0%) |
| 35 to 64 Years | 6 (18.8%) | 5 (14.7%) |
| 65 to 74 Years | 0 (0.0%) | 0 (0.0%) |
| 75 Years and over | 4 (80.0%) | 4 (80.0%) |
Disability Class by Sex by Age in Fountain
Disability Class: Hearing Difficulty
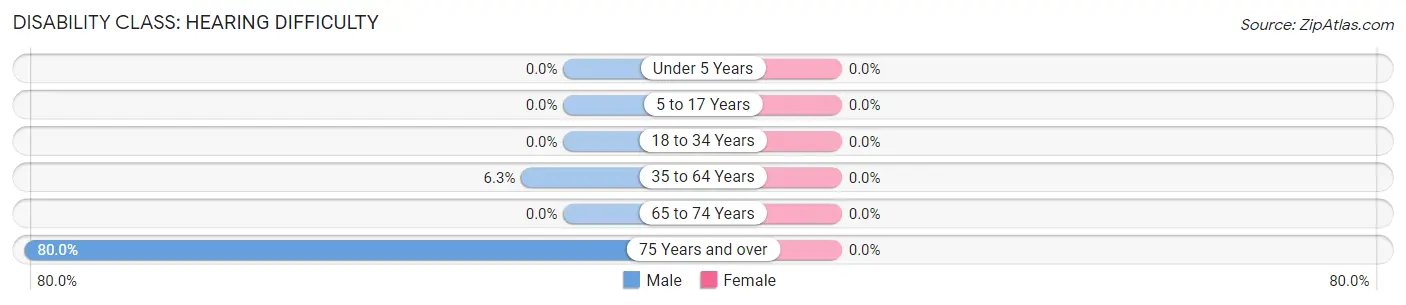
| Age Bracket | Male | Female |
| Under 5 Years | 0 (0.0%) | 0 (0.0%) |
| 5 to 17 Years | 0 (0.0%) | 0 (0.0%) |
| 18 to 34 Years | 0 (0.0%) | 0 (0.0%) |
| 35 to 64 Years | 2 (6.2%) | 0 (0.0%) |
| 65 to 74 Years | 0 (0.0%) | 0 (0.0%) |
| 75 Years and over | 4 (80.0%) | 0 (0.0%) |
Disability Class: Vision Difficulty
| Age Bracket | Male | Female |
| Under 5 Years | 0 (0.0%) | 0 (0.0%) |
| 5 to 17 Years | 0 (0.0%) | 0 (0.0%) |
| 18 to 34 Years | 0 (0.0%) | 0 (0.0%) |
| 35 to 64 Years | 0 (0.0%) | 0 (0.0%) |
| 65 to 74 Years | 0 (0.0%) | 0 (0.0%) |
| 75 Years and over | 0 (0.0%) | 0 (0.0%) |
Disability Class: Cognitive Difficulty
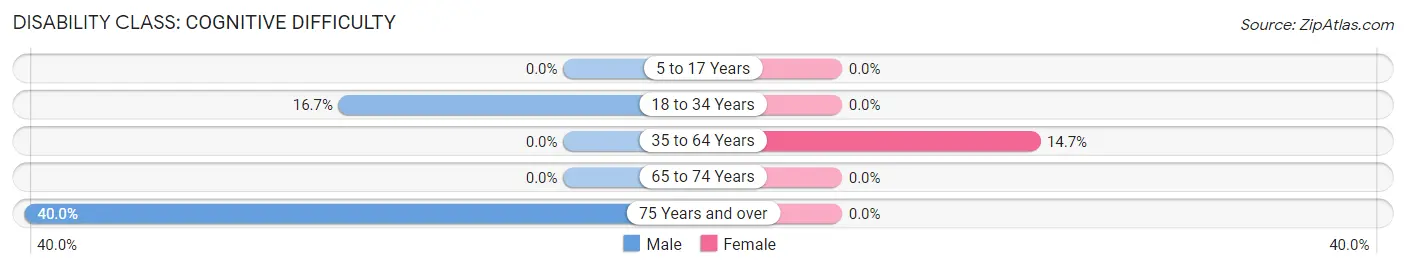
| Age Bracket | Male | Female |
| 5 to 17 Years | 0 (0.0%) | 0 (0.0%) |
| 18 to 34 Years | 2 (16.7%) | 0 (0.0%) |
| 35 to 64 Years | 0 (0.0%) | 5 (14.7%) |
| 65 to 74 Years | 0 (0.0%) | 0 (0.0%) |
| 75 Years and over | 2 (40.0%) | 0 (0.0%) |
Disability Class: Ambulatory Difficulty
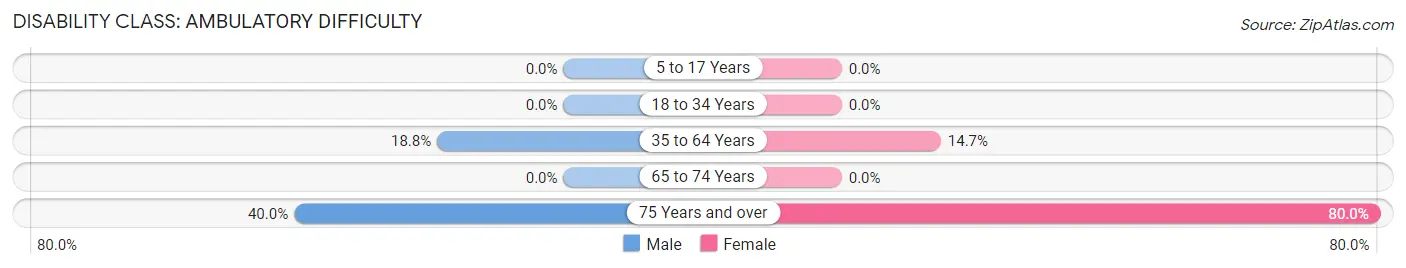
| Age Bracket | Male | Female |
| 5 to 17 Years | 0 (0.0%) | 0 (0.0%) |
| 18 to 34 Years | 0 (0.0%) | 0 (0.0%) |
| 35 to 64 Years | 6 (18.8%) | 5 (14.7%) |
| 65 to 74 Years | 0 (0.0%) | 0 (0.0%) |
| 75 Years and over | 2 (40.0%) | 4 (80.0%) |
Disability Class: Self-Care Difficulty
| Age Bracket | Male | Female |
| 5 to 17 Years | 0 (0.0%) | 0 (0.0%) |
| 18 to 34 Years | 0 (0.0%) | 0 (0.0%) |
| 35 to 64 Years | 0 (0.0%) | 0 (0.0%) |
| 65 to 74 Years | 0 (0.0%) | 0 (0.0%) |
| 75 Years and over | 2 (40.0%) | 0 (0.0%) |
Technology Access in Fountain
Computing Device Access in Fountain
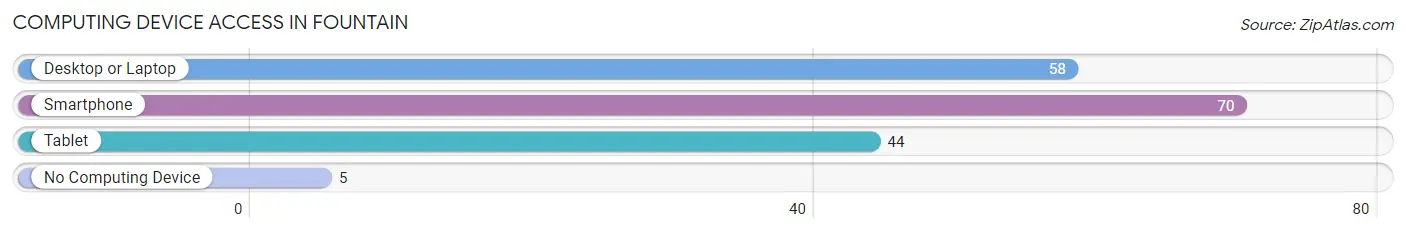
| Device Type | # Households | % Households |
| Desktop or Laptop | 58 | 76.3% |
| Smartphone | 70 | 92.1% |
| Tablet | 44 | 57.9% |
| No Computing Device | 5 | 6.6% |
| Total | 76 | 100.0% |
Internet Access in Fountain
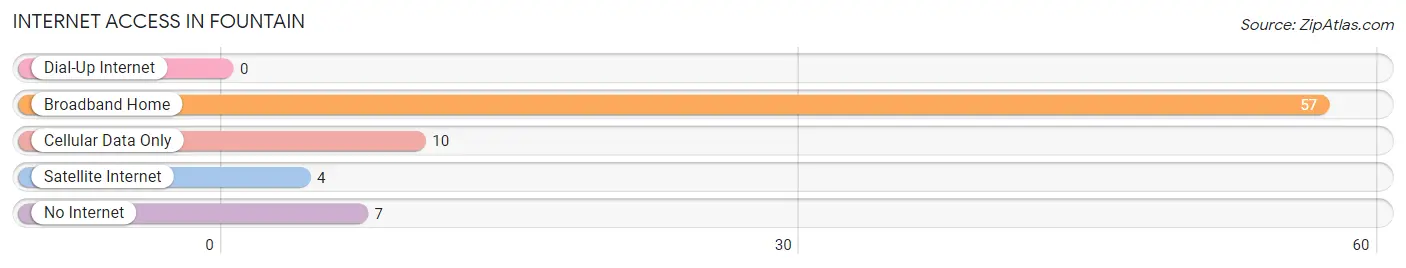
| Internet Type | # Households | % Households |
| Dial-Up Internet | 0 | 0.0% |
| Broadband Home | 57 | 75.0% |
| Cellular Data Only | 10 | 13.2% |
| Satellite Internet | 4 | 5.3% |
| No Internet | 7 | 9.2% |
| Total | 76 | 100.0% |
Fountain Summary
Fountain, Michigan is a small unincorporated community located in the Upper Peninsula of Michigan. It is situated in the western part of Menominee County, near the Wisconsin border. The community is located on the banks of the Menominee River, and is surrounded by forests and rolling hills. The population of Fountain was estimated to be around 200 people in 2020.
History
Fountain was first settled in the late 1800s by a group of Finnish immigrants. The settlers were attracted to the area due to its abundance of natural resources, including timber and fish. The community was originally known as “Finnish Town”, and the settlers built a sawmill and a gristmill to take advantage of the resources. The community was officially incorporated in 1891, and the name was changed to Fountain.
The community grew slowly over the years, and by the early 1900s, it had become a popular destination for tourists. The area was known for its beautiful scenery and outdoor activities, such as fishing and hunting. The community also had a few small businesses, including a general store, a blacksmith shop, and a post office.
Geography
Fountain is located in the western part of Menominee County, near the Wisconsin border. The community is situated on the banks of the Menominee River, and is surrounded by forests and rolling hills. The area is known for its scenic beauty, and is home to a variety of wildlife, including deer, bear, and other small animals.
The climate in Fountain is typical of the Upper Peninsula of Michigan, with cold winters and warm summers. The average temperature in the winter is around 20 degrees Fahrenheit, and the average temperature in the summer is around 70 degrees Fahrenheit.
Economy
Fountain is a small, rural community, and the economy is largely based on tourism and outdoor recreation. The area is known for its beautiful scenery and outdoor activities, such as fishing and hunting. The community also has a few small businesses, including a general store, a blacksmith shop, and a post office.
Demographics
The population of Fountain was estimated to be around 200 people in 2020. The majority of the population is of Finnish descent, and the community is predominantly white. The median household income in Fountain is around $30,000, and the median home value is around $100,000. The unemployment rate in the community is around 5%, which is slightly higher than the national average.
Common Questions
What is Per Capita Income in Fountain?
Per Capita income in Fountain is $23,205.
What is the Median Household income in Fountain?
Median Household Income in Fountain is $55,000.
What is Income or Wage Gap in Fountain?
Income or Wage Gap in Fountain is 17.2%.
Women in Fountain earn 82.8 cents for every dollar earned by a man.
What is Inequality or Gini Index in Fountain?
Inequality or Gini Index in Fountain is 0.38.
What is the Total Population of Fountain?
Total Population of Fountain is 214.
What is the Total Male Population of Fountain?
Total Male Population of Fountain is 93.
What is the Total Female Population of Fountain?
Total Female Population of Fountain is 121.
What is the Ratio of Males per 100 Females in Fountain?
There are 76.86 Males per 100 Females in Fountain.
What is the Ratio of Females per 100 Males in Fountain?
There are 130.11 Females per 100 Males in Fountain.
What is the Median Population Age in Fountain?
Median Population Age in Fountain is 32.3 Years.
What is the Average Family Size in Fountain
Average Family Size in Fountain is 4.0 People.
What is the Average Household Size in Fountain
Average Household Size in Fountain is 2.8 People.
How Large is the Labor Force in Fountain?
There are 81 People in the Labor Forcein in Fountain.
What is the Percentage of People in the Labor Force in Fountain?
61.4% of People are in the Labor Force in Fountain.
What is the Unemployment Rate in Fountain?
Unemployment Rate in Fountain is 8.6%.