Zip Codes with the Highest Percentage of Population Employed in Sales & Related in Dearborn, MI
RELATED REPORTS & OPTIONS
Sales & Related
Dearborn
Compare Zip Codes
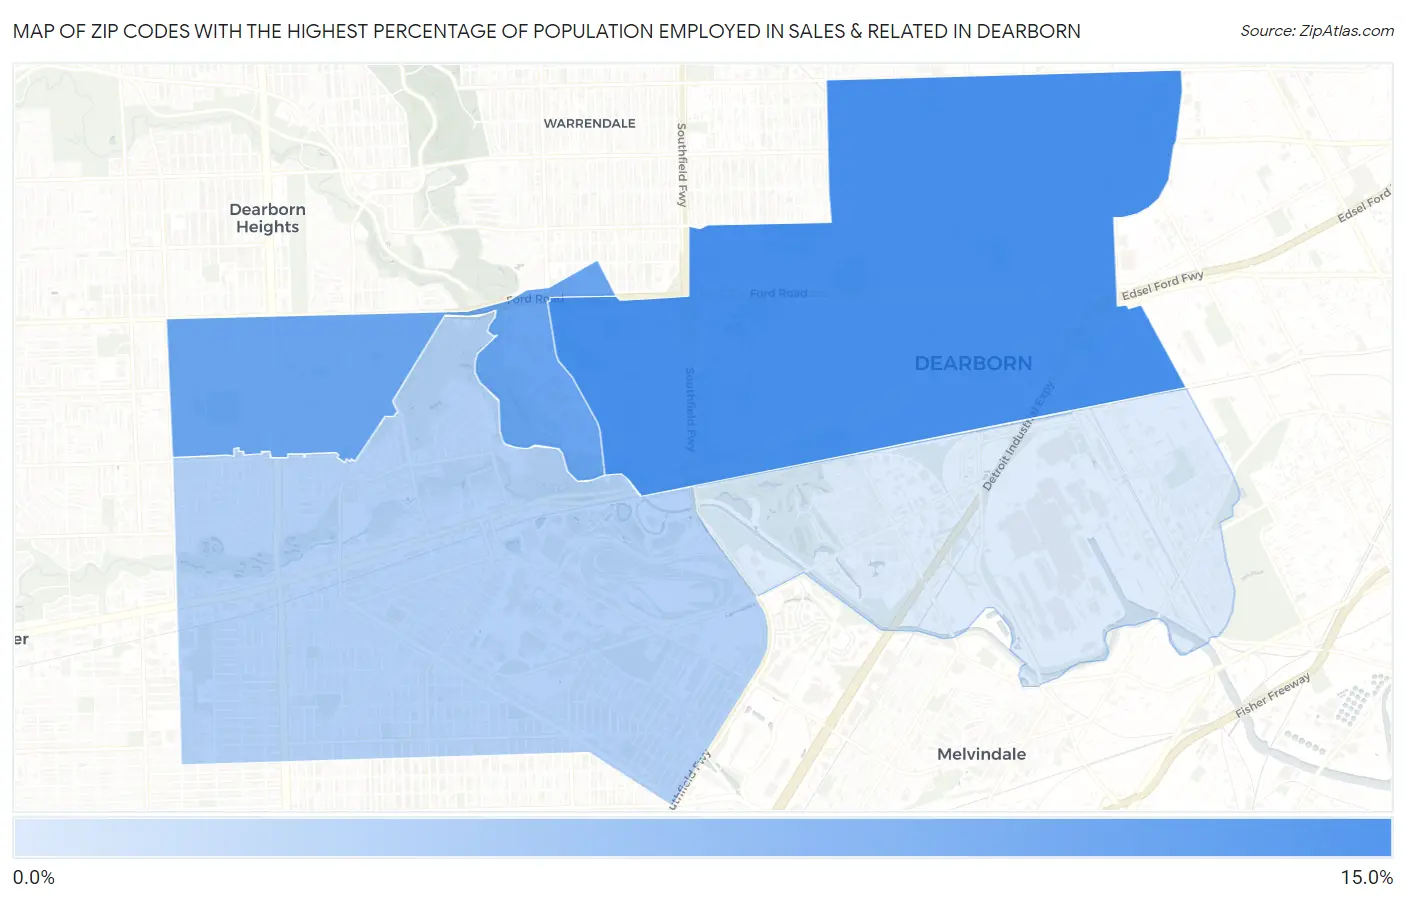
Map of Zip Codes with the Highest Percentage of Population Employed in Sales & Related in Dearborn
3.8%
11.5%
Zip Codes with the Highest Percentage of Population Employed in Sales & Related in Dearborn, MI
| Zip Code | % Employed | vs State | vs National | |
| 1. | 48126 | 11.5% | 9.1%(+2.32)#180 | 9.6%(+1.87)#7,106 |
| 2. | 48128 | 9.6% | 9.1%(+0.482)#338 | 9.6%(+0.024)#12,317 |
| 3. | 48124 | 5.8% | 9.1%(-3.31)#807 | 9.6%(-3.77)#24,008 |
| 4. | 48120 | 3.8% | 9.1%(-5.34)#902 | 9.6%(-5.80)#27,270 |
1
Common Questions
What are the Top 3 Zip Codes with the Highest Percentage of Population Employed in Sales & Related in Dearborn, MI?
Top 3 Zip Codes with the Highest Percentage of Population Employed in Sales & Related in Dearborn, MI are:
What zip code has the Highest Percentage of Population Employed in Sales & Related in Dearborn, MI?
48126 has the Highest Percentage of Population Employed in Sales & Related in Dearborn, MI with 11.5%.
What is the Percentage of Population Employed in Sales & Related in Dearborn, MI?
Percentage of Population Employed in Sales & Related in Dearborn is 8.5%.
What is the Percentage of Population Employed in Sales & Related in Michigan?
Percentage of Population Employed in Sales & Related in Michigan is 9.1%.
What is the Percentage of Population Employed in Sales & Related in the United States?
Percentage of Population Employed in Sales & Related in the United States is 9.6%.