Zip Codes with the Highest Percentage of Population Employed in Sales & Related in Howell, MI
RELATED REPORTS & OPTIONS
Sales & Related
Howell
Compare Zip Codes
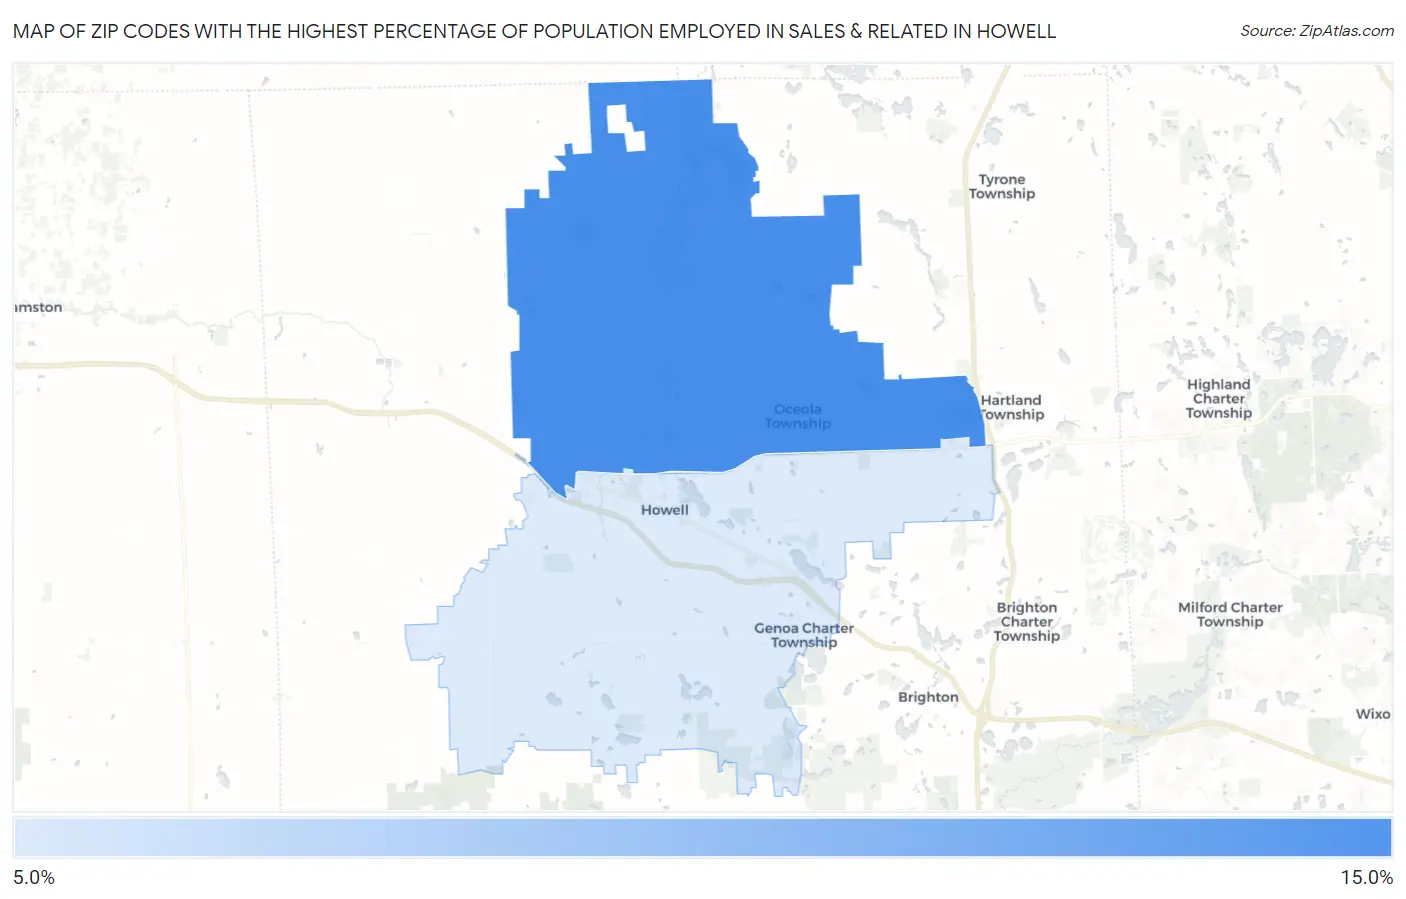
Map of Zip Codes with the Highest Percentage of Population Employed in Sales & Related in Howell
12.1%
12.4%
Zip Codes with the Highest Percentage of Population Employed in Sales & Related in Howell, MI
| Zip Code | % Employed | vs State | vs National | |
| 1. | 48855 | 12.4% | 9.1%(+3.28)#128 | 9.6%(+2.82)#5,298 |
| 2. | 48843 | 12.1% | 9.1%(+3.00)#142 | 9.6%(+2.54)#5,788 |
1
Common Questions
What are the Top Zip Codes with the Highest Percentage of Population Employed in Sales & Related in Howell, MI?
Top Zip Codes with the Highest Percentage of Population Employed in Sales & Related in Howell, MI are:
What zip code has the Highest Percentage of Population Employed in Sales & Related in Howell, MI?
48855 has the Highest Percentage of Population Employed in Sales & Related in Howell, MI with 12.4%.
What is the Percentage of Population Employed in Sales & Related in Howell, MI?
Percentage of Population Employed in Sales & Related in Howell is 10.8%.
What is the Percentage of Population Employed in Sales & Related in Michigan?
Percentage of Population Employed in Sales & Related in Michigan is 9.1%.
What is the Percentage of Population Employed in Sales & Related in the United States?
Percentage of Population Employed in Sales & Related in the United States is 9.6%.