Charlevoix, MI Map & Demographics
Charlevoix Map
Charlevoix Overview
$44,563
PER CAPITA INCOME
$70,481
AVG FAMILY INCOME
$30,114
AVG HOUSEHOLD INCOME
31.2%
WAGE / INCOME GAP [ % ]
68.8¢/ $1
WAGE / INCOME GAP [ $ ]
0.60
INEQUALITY / GINI INDEX
2,474
TOTAL POPULATION
1,052
MALE POPULATION
1,422
FEMALE POPULATION
73.98
MALES / 100 FEMALES
135.17
FEMALES / 100 MALES
44.7
MEDIAN AGE
2.5
AVG FAMILY SIZE
1.7
AVG HOUSEHOLD SIZE
1,233
LABOR FORCE [ PEOPLE ]
59.4%
PERCENT IN LABOR FORCE
4.7%
UNEMPLOYMENT RATE
Charlevoix Zip Codes
Charlevoix Area Codes
Income in Charlevoix
Income Overview in Charlevoix
Per Capita Income in Charlevoix is $44,563, while median incomes of families and households are $70,481 and $30,114 respectively.
| Characteristic | Number | Measure |
| Per Capita Income | 2,474 | $44,563 |
| Median Family Income | 609 | $70,481 |
| Mean Family Income | 609 | $124,191 |
| Median Household Income | 1,410 | $30,114 |
| Mean Household Income | 1,410 | $79,033 |
| Income Deficit | 609 | $0 |
| Wage / Income Gap (%) | 2,474 | 31.19% |
| Wage / Income Gap ($) | 2,474 | 68.81¢ per $1 |
| Gini / Inequality Index | 2,474 | 0.60 |
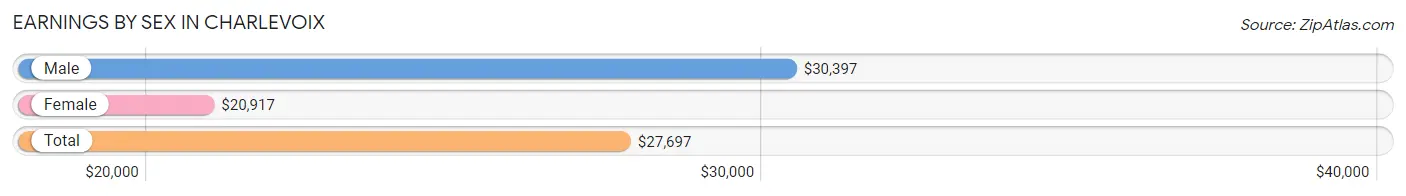
Earnings by Sex in Charlevoix
Average Earnings in Charlevoix are $27,697, $30,397 for men and $20,917 for women, a difference of 31.2%.
| Sex | Number | Average Earnings |
| Male | 594 (45.0%) | $30,397 |
| Female | 725 (55.0%) | $20,917 |
| Total | 1,319 (100.0%) | $27,697 |
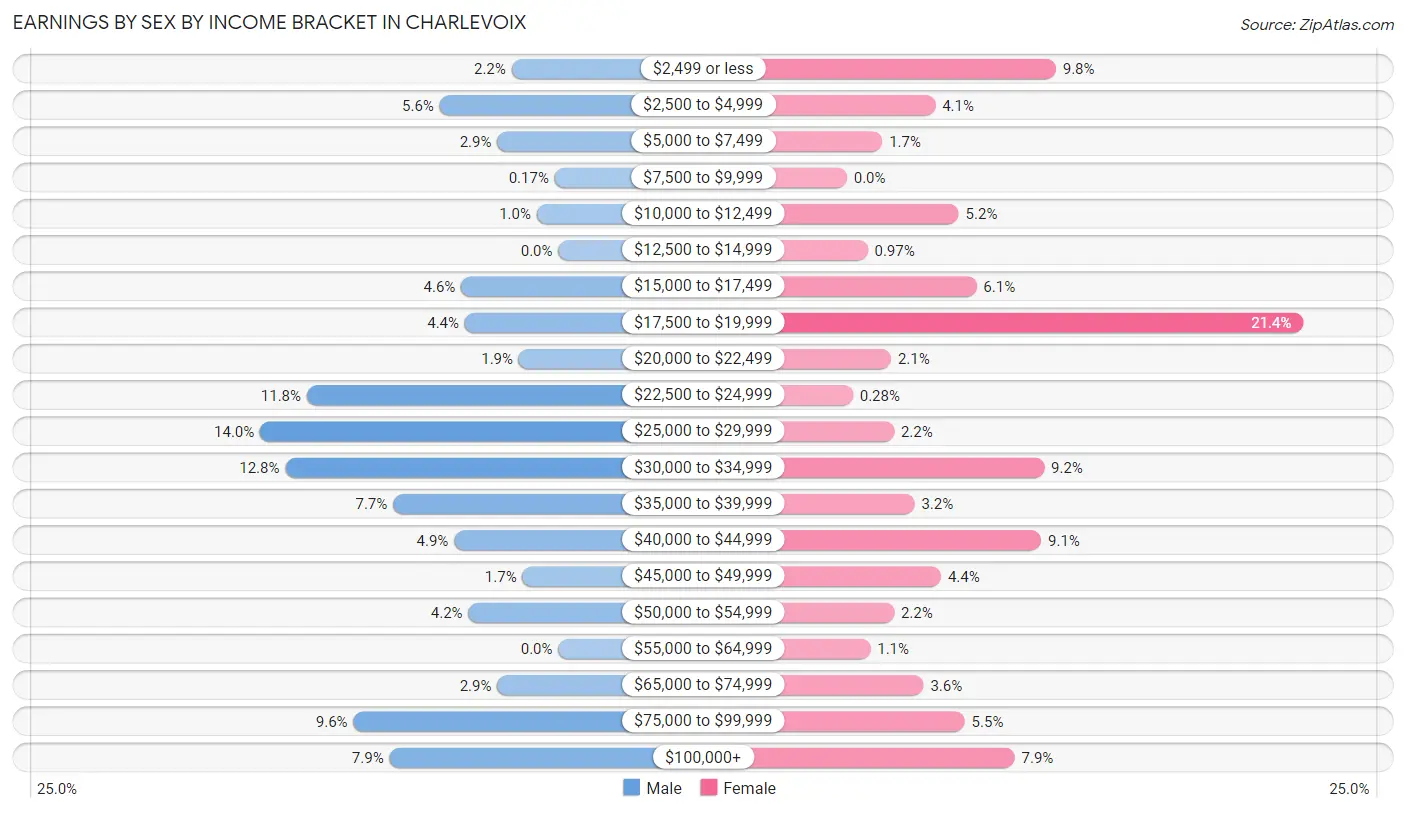
Earnings by Sex by Income Bracket in Charlevoix
The most common earnings brackets in Charlevoix are $25,000 to $29,999 for men (83 | 14.0%) and $17,500 to $19,999 for women (155 | 21.4%).
| Income | Male | Female |
| $2,499 or less | 13 (2.2%) | 71 (9.8%) |
| $2,500 to $4,999 | 33 (5.6%) | 30 (4.1%) |
| $5,000 to $7,499 | 17 (2.9%) | 12 (1.7%) |
| $7,500 to $9,999 | 1 (0.2%) | 0 (0.0%) |
| $10,000 to $12,499 | 6 (1.0%) | 38 (5.2%) |
| $12,500 to $14,999 | 0 (0.0%) | 7 (1.0%) |
| $15,000 to $17,499 | 27 (4.5%) | 44 (6.1%) |
| $17,500 to $19,999 | 26 (4.4%) | 155 (21.4%) |
| $20,000 to $22,499 | 11 (1.8%) | 15 (2.1%) |
| $22,500 to $24,999 | 70 (11.8%) | 2 (0.3%) |
| $25,000 to $29,999 | 83 (14.0%) | 16 (2.2%) |
| $30,000 to $34,999 | 76 (12.8%) | 67 (9.2%) |
| $35,000 to $39,999 | 46 (7.7%) | 23 (3.2%) |
| $40,000 to $44,999 | 29 (4.9%) | 66 (9.1%) |
| $45,000 to $49,999 | 10 (1.7%) | 32 (4.4%) |
| $50,000 to $54,999 | 25 (4.2%) | 16 (2.2%) |
| $55,000 to $64,999 | 0 (0.0%) | 8 (1.1%) |
| $65,000 to $74,999 | 17 (2.9%) | 26 (3.6%) |
| $75,000 to $99,999 | 57 (9.6%) | 40 (5.5%) |
| $100,000+ | 47 (7.9%) | 57 (7.9%) |
| Total | 594 (100.0%) | 725 (100.0%) |
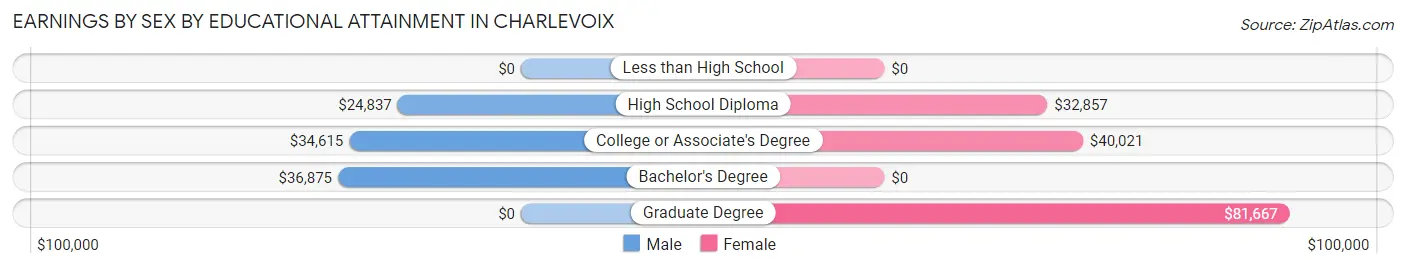
Earnings by Sex by Educational Attainment in Charlevoix
Average earnings in Charlevoix are $30,714 for men and $36,597 for women, a difference of 16.1%. Men with an educational attainment of bachelor's degree enjoy the highest average annual earnings of $36,875, while those with high school diploma education earn the least with $24,837. Women with an educational attainment of graduate degree earn the most with the average annual earnings of $81,667, while those with high school diploma education have the smallest earnings of $32,857.
| Educational Attainment | Male Income | Female Income |
| Less than High School | - | - |
| High School Diploma | $24,837 | $32,857 |
| College or Associate's Degree | $34,615 | $40,021 |
| Bachelor's Degree | $36,875 | $0 |
| Graduate Degree | - | - |
| Total | $30,714 | $36,597 |
Family Income in Charlevoix
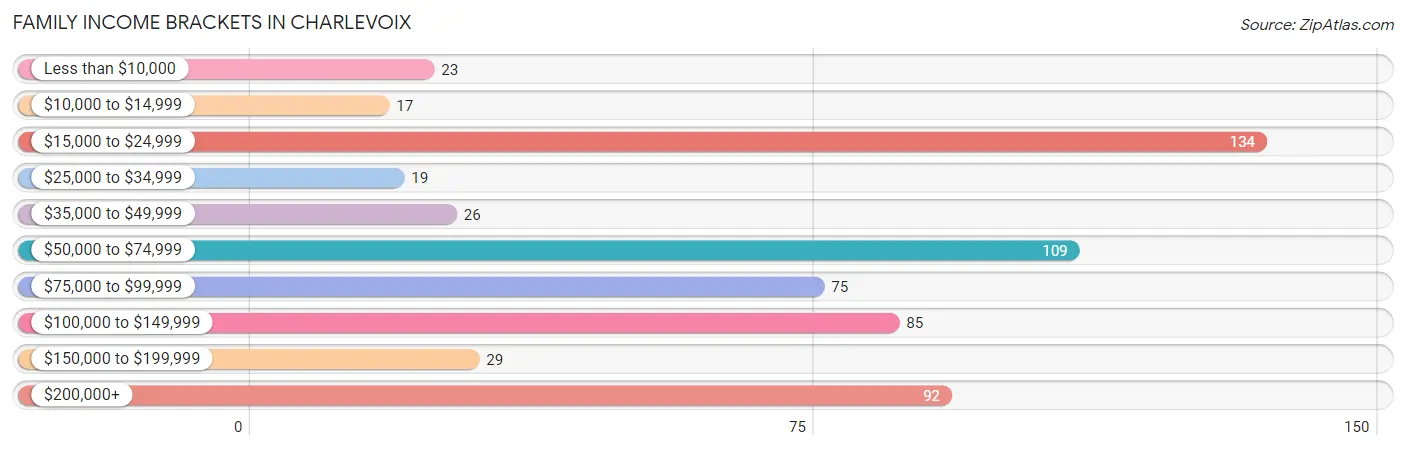
Family Income Brackets in Charlevoix
According to the Charlevoix family income data, there are 134 families falling into the $15,000 to $24,999 income range, which is the most common income bracket and makes up 22.0% of all families. Conversely, the $10,000 to $14,999 income bracket is the least frequent group with only 17 families (2.8%) belonging to this category.
| Income Bracket | # Families | % Families |
| Less than $10,000 | 23 | 3.8% |
| $10,000 to $14,999 | 17 | 2.8% |
| $15,000 to $24,999 | 134 | 22.0% |
| $25,000 to $34,999 | 19 | 3.1% |
| $35,000 to $49,999 | 26 | 4.3% |
| $50,000 to $74,999 | 109 | 17.9% |
| $75,000 to $99,999 | 75 | 12.3% |
| $100,000 to $149,999 | 85 | 14.0% |
| $150,000 to $199,999 | 29 | 4.8% |
| $200,000+ | 92 | 15.1% |
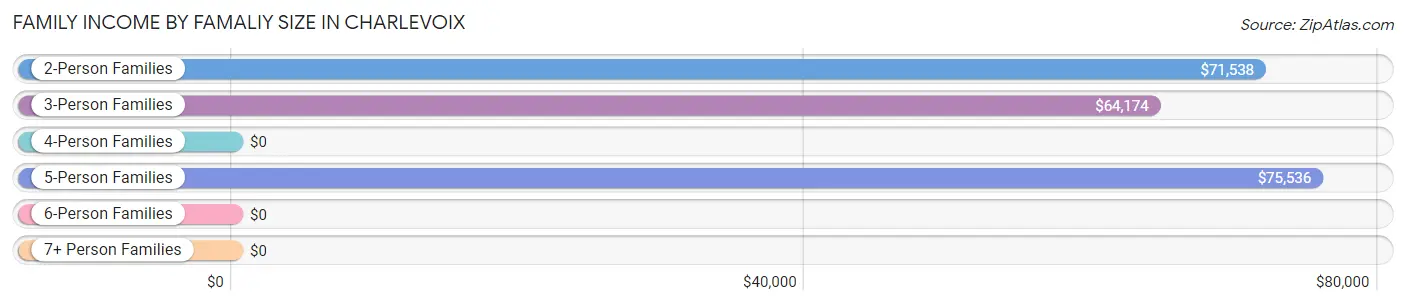
Family Income by Famaliy Size in Charlevoix
5-person families (32 | 5.2%) account for the highest median family income in Charlevoix with $75,536 per family, while 2-person families (364 | 59.8%) have the highest median income of $35,769 per family member.
| Income Bracket | # Families | Median Income |
| 2-Person Families | 364 (59.8%) | $71,538 |
| 3-Person Families | 177 (29.1%) | $64,174 |
| 4-Person Families | 21 (3.5%) | $0 |
| 5-Person Families | 32 (5.2%) | $75,536 |
| 6-Person Families | 0 (0.0%) | $0 |
| 7+ Person Families | 15 (2.5%) | $0 |
| Total | 609 (100.0%) | $70,481 |
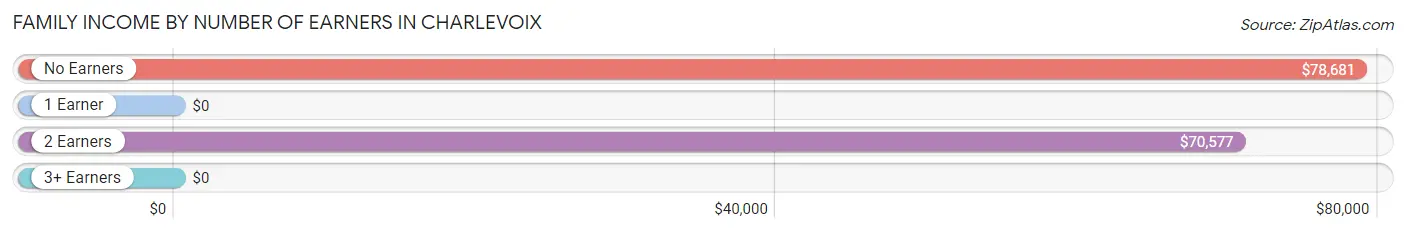
Family Income by Number of Earners in Charlevoix
| Number of Earners | # Families | Median Income |
| No Earners | 141 (23.2%) | $78,681 |
| 1 Earner | 174 (28.6%) | $0 |
| 2 Earners | 266 (43.7%) | $70,577 |
| 3+ Earners | 28 (4.6%) | $0 |
| Total | 609 (100.0%) | $70,481 |
Household Income in Charlevoix
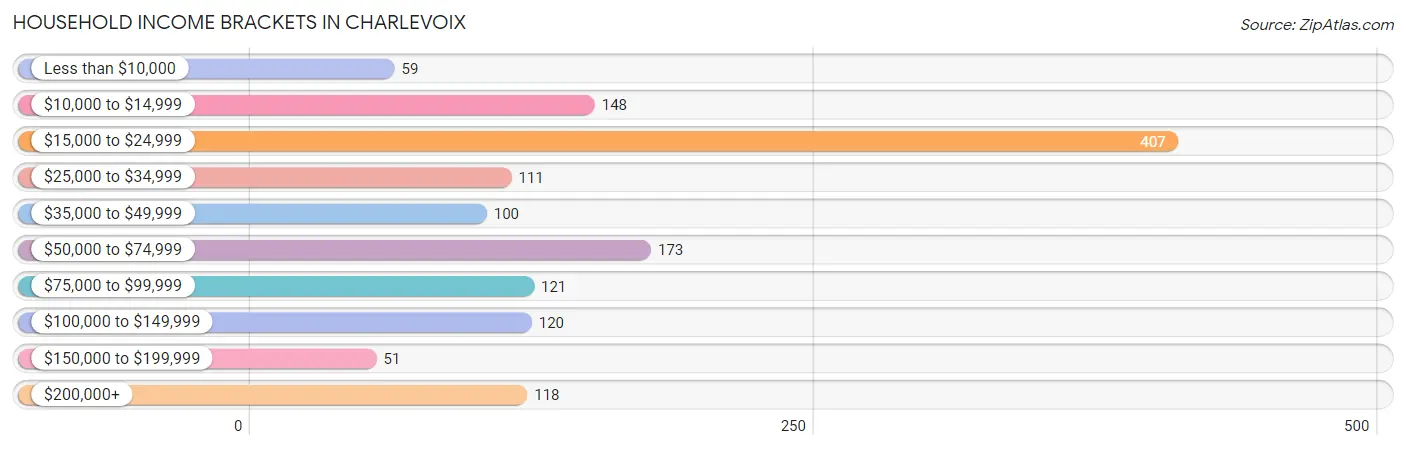
Household Income Brackets in Charlevoix
With 407 households falling in the category, the $15,000 to $24,999 income range is the most frequent in Charlevoix, accounting for 28.9% of all households. In contrast, only 51 households (3.6%) fall into the $150,000 to $199,999 income bracket, making it the least populous group.
| Income Bracket | # Households | % Households |
| Less than $10,000 | 59 | 4.2% |
| $10,000 to $14,999 | 148 | 10.5% |
| $15,000 to $24,999 | 407 | 28.9% |
| $25,000 to $34,999 | 111 | 7.9% |
| $35,000 to $49,999 | 100 | 7.1% |
| $50,000 to $74,999 | 173 | 12.3% |
| $75,000 to $99,999 | 121 | 8.6% |
| $100,000 to $149,999 | 120 | 8.5% |
| $150,000 to $199,999 | 51 | 3.6% |
| $200,000+ | 118 | 8.4% |
Household Income by Householder Age in Charlevoix
The median household income in Charlevoix is $30,114, with the highest median household income of $44,464 found in the 45 to 64 years age bracket for the primary householder. A total of 407 households (28.9%) fall into this category. Meanwhile, the 15 to 24 years age bracket for the primary householder has the lowest median household income of $0, with 214 households (15.2%) in this group.
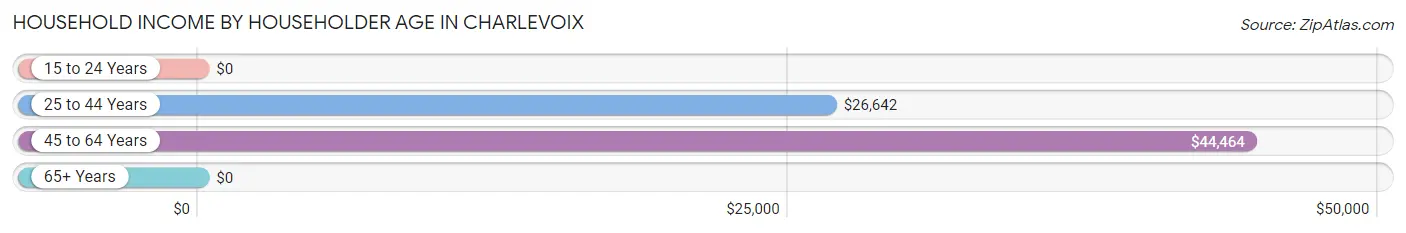
| Income Bracket | # Households | Median Income |
| 15 to 24 Years | 214 (15.2%) | $0 |
| 25 to 44 Years | 313 (22.2%) | $26,642 |
| 45 to 64 Years | 407 (28.9%) | $44,464 |
| 65+ Years | 476 (33.8%) | $0 |
| Total | 1,410 (100.0%) | $30,114 |
Poverty in Charlevoix
Income Below Poverty by Sex and Age in Charlevoix
With 17.3% poverty level for males and 36.1% for females among the residents of Charlevoix, under 5 year old males and 6 to 11 year old females are the most vulnerable to poverty, with 64 males (92.7%) and 47 females (90.4%) in their respective age groups living below the poverty level.
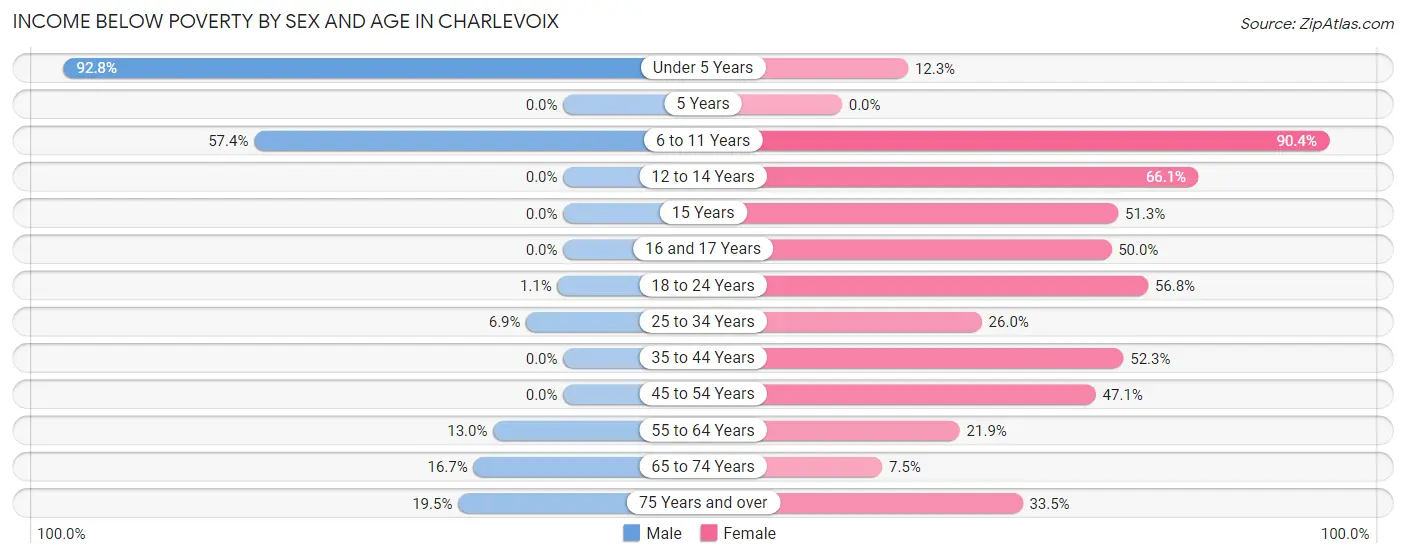
| Age Bracket | Male | Female |
| Under 5 Years | 64 (92.7%) | 7 (12.3%) |
| 5 Years | 0 (0.0%) | 0 (0.0%) |
| 6 to 11 Years | 35 (57.4%) | 47 (90.4%) |
| 12 to 14 Years | 0 (0.0%) | 39 (66.1%) |
| 15 Years | 0 (0.0%) | 20 (51.3%) |
| 16 and 17 Years | 0 (0.0%) | 5 (50.0%) |
| 18 to 24 Years | 1 (1.1%) | 129 (56.8%) |
| 25 to 34 Years | 7 (6.9%) | 27 (26.0%) |
| 35 to 44 Years | 0 (0.0%) | 58 (52.2%) |
| 45 to 54 Years | 0 (0.0%) | 49 (47.1%) |
| 55 to 64 Years | 16 (13.0%) | 56 (21.9%) |
| 65 to 74 Years | 22 (16.7%) | 16 (7.5%) |
| 75 Years and over | 24 (19.5%) | 57 (33.5%) |
| Total | 169 (17.3%) | 510 (36.1%) |
Income Above Poverty by Sex and Age in Charlevoix
According to the poverty statistics in Charlevoix, males aged 12 to 14 years and females aged 5 years are the age groups that are most secure financially, with 100.0% of males and 100.0% of females in these age groups living above the poverty line.
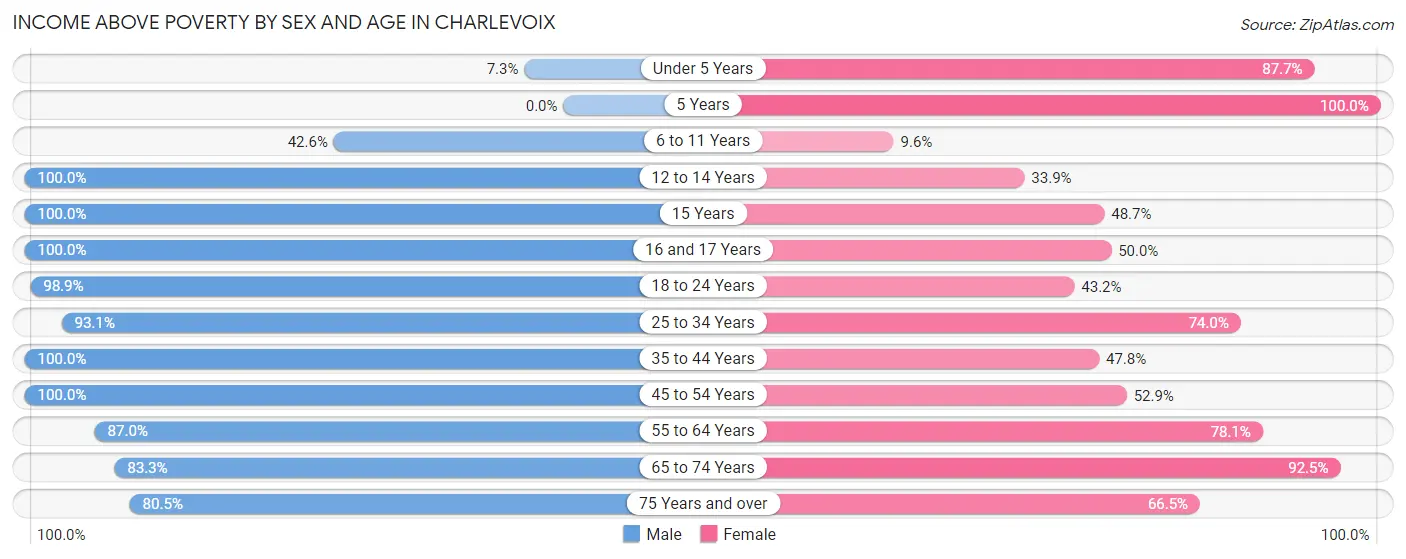
| Age Bracket | Male | Female |
| Under 5 Years | 5 (7.2%) | 50 (87.7%) |
| 5 Years | 0 (0.0%) | 11 (100.0%) |
| 6 to 11 Years | 26 (42.6%) | 5 (9.6%) |
| 12 to 14 Years | 32 (100.0%) | 20 (33.9%) |
| 15 Years | 11 (100.0%) | 19 (48.7%) |
| 16 and 17 Years | 9 (100.0%) | 5 (50.0%) |
| 18 to 24 Years | 93 (98.9%) | 98 (43.2%) |
| 25 to 34 Years | 95 (93.1%) | 77 (74.0%) |
| 35 to 44 Years | 141 (100.0%) | 53 (47.7%) |
| 45 to 54 Years | 82 (100.0%) | 55 (52.9%) |
| 55 to 64 Years | 107 (87.0%) | 200 (78.1%) |
| 65 to 74 Years | 110 (83.3%) | 198 (92.5%) |
| 75 Years and over | 99 (80.5%) | 113 (66.5%) |
| Total | 810 (82.7%) | 904 (63.9%) |
Income Below Poverty Among Married-Couple Families in Charlevoix
The poverty statistics for married-couple families in Charlevoix show that 3.1% or 12 of the total 387 families live below the poverty line. Families with no children have the highest poverty rate of 4.6%, comprising of 12 families. On the other hand, families with 1 or 2 children have the lowest poverty rate of 0.0%, which includes 0 families.
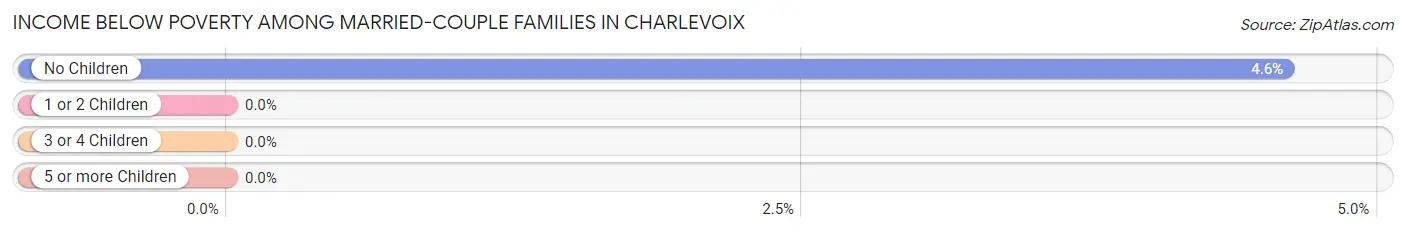
| Children | Above Poverty | Below Poverty |
| No Children | 249 (95.4%) | 12 (4.6%) |
| 1 or 2 Children | 108 (100.0%) | 0 (0.0%) |
| 3 or 4 Children | 18 (100.0%) | 0 (0.0%) |
| 5 or more Children | 0 (0.0%) | 0 (0.0%) |
| Total | 375 (96.9%) | 12 (3.1%) |
Income Below Poverty Among Single-Parent Households in Charlevoix
According to the poverty data in Charlevoix, 75.0% or 18 single-father households and 66.7% or 132 single-mother households are living below the poverty line. Among single-father households, those with 1 or 2 children have the highest poverty rate, with 18 households (75.0%) experiencing poverty. Likewise, among single-mother households, those with 3 or 4 children have the highest poverty rate, with 6 households (100.0%) falling below the poverty line.
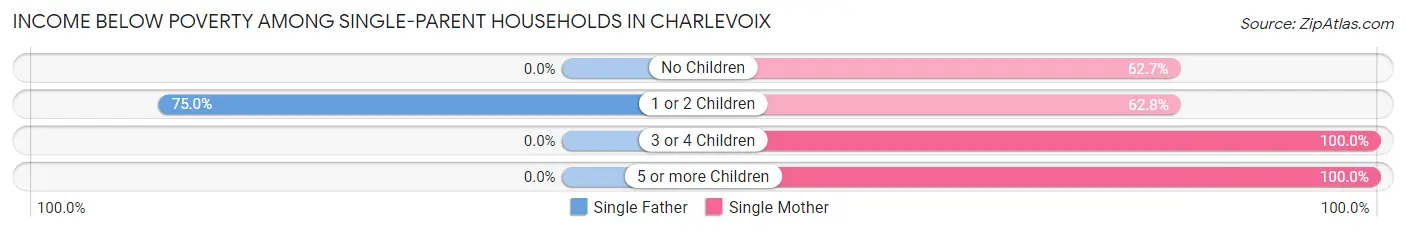
| Children | Single Father | Single Mother |
| No Children | 0 (0.0%) | 47 (62.7%) |
| 1 or 2 Children | 18 (75.0%) | 64 (62.7%) |
| 3 or 4 Children | 0 (0.0%) | 6 (100.0%) |
| 5 or more Children | 0 (0.0%) | 15 (100.0%) |
| Total | 18 (75.0%) | 132 (66.7%) |
Income Below Poverty Among Married-Couple vs Single-Parent Households in Charlevoix
The poverty data for Charlevoix shows that 12 of the married-couple family households (3.1%) and 150 of the single-parent households (67.6%) are living below the poverty level. Within the married-couple family households, those with no children have the highest poverty rate, with 12 households (4.6%) falling below the poverty line. Among the single-parent households, those with 3 or 4 children have the highest poverty rate, with 6 household (100.0%) living below poverty.
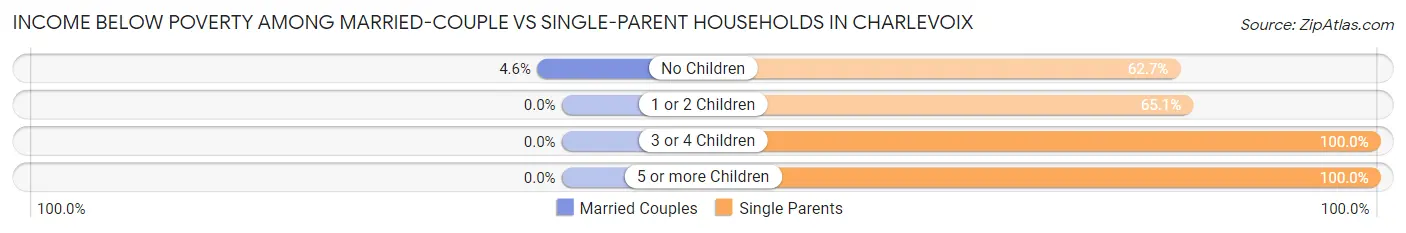
| Children | Married-Couple Families | Single-Parent Households |
| No Children | 12 (4.6%) | 47 (62.7%) |
| 1 or 2 Children | 0 (0.0%) | 82 (65.1%) |
| 3 or 4 Children | 0 (0.0%) | 6 (100.0%) |
| 5 or more Children | 0 (0.0%) | 15 (100.0%) |
| Total | 12 (3.1%) | 150 (67.6%) |
Race in Charlevoix
The most populous races in Charlevoix are White / Caucasian (2,286 | 92.4%), Two or more Races (72 | 2.9%), and Black / African American (67 | 2.7%).
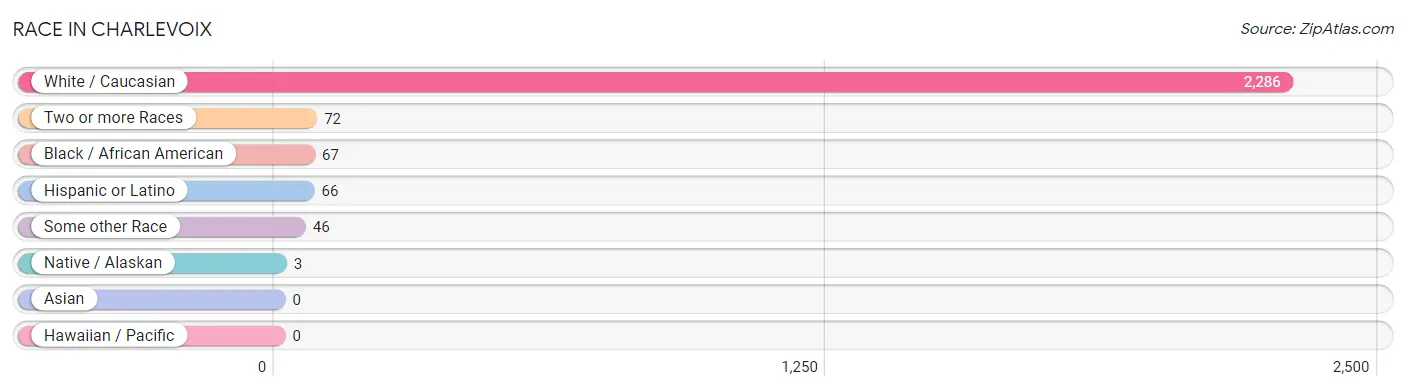
| Race | # Population | % Population |
| Asian | 0 | 0.0% |
| Black / African American | 67 | 2.7% |
| Hawaiian / Pacific | 0 | 0.0% |
| Hispanic or Latino | 66 | 2.7% |
| Native / Alaskan | 3 | 0.1% |
| White / Caucasian | 2,286 | 92.4% |
| Two or more Races | 72 | 2.9% |
| Some other Race | 46 | 1.9% |
| Total | 2,474 | 100.0% |
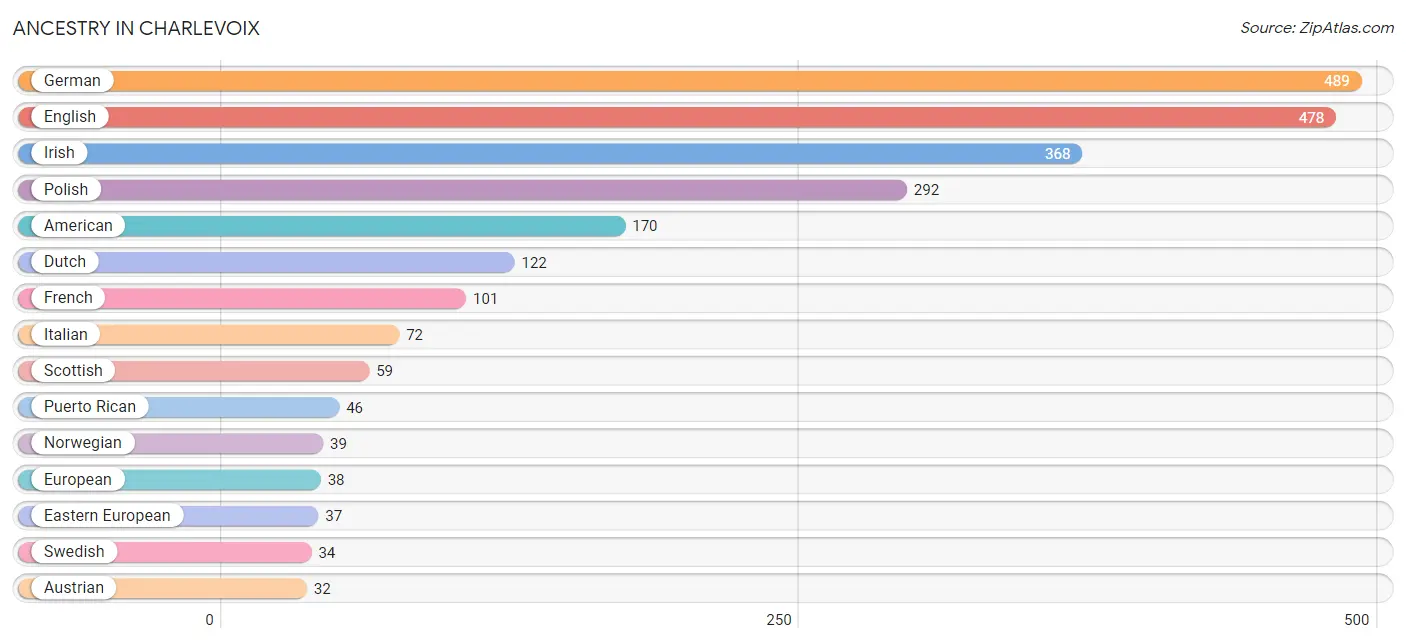
Ancestry in Charlevoix
The most populous ancestries reported in Charlevoix are German (489 | 19.8%), English (478 | 19.3%), Irish (368 | 14.9%), Polish (292 | 11.8%), and American (170 | 6.9%), together accounting for 72.6% of all Charlevoix residents.
| Ancestry | # Population | % Population |
| American | 170 | 6.9% |
| Arab | 10 | 0.4% |
| Austrian | 32 | 1.3% |
| Belgian | 12 | 0.5% |
| British | 13 | 0.5% |
| Central American | 1 | 0.0% |
| Chippewa | 17 | 0.7% |
| Colombian | 1 | 0.0% |
| Czech | 15 | 0.6% |
| Czechoslovakian | 6 | 0.2% |
| Danish | 1 | 0.0% |
| Dutch | 122 | 4.9% |
| Eastern European | 37 | 1.5% |
| English | 478 | 19.3% |
| European | 38 | 1.5% |
| Finnish | 10 | 0.4% |
| French | 101 | 4.1% |
| French Canadian | 6 | 0.2% |
| German | 489 | 19.8% |
| Guatemalan | 1 | 0.0% |
| Hungarian | 11 | 0.4% |
| Irish | 368 | 14.9% |
| Italian | 72 | 2.9% |
| Lebanese | 1 | 0.0% |
| Mexican | 18 | 0.7% |
| Norwegian | 39 | 1.6% |
| Polish | 292 | 11.8% |
| Puerto Rican | 46 | 1.9% |
| Romanian | 9 | 0.4% |
| Scotch-Irish | 9 | 0.4% |
| Scottish | 59 | 2.4% |
| Slovak | 14 | 0.6% |
| South American | 1 | 0.0% |
| Swedish | 34 | 1.4% |
| Ukrainian | 8 | 0.3% |
| Welsh | 11 | 0.4% | View All 36 Rows |
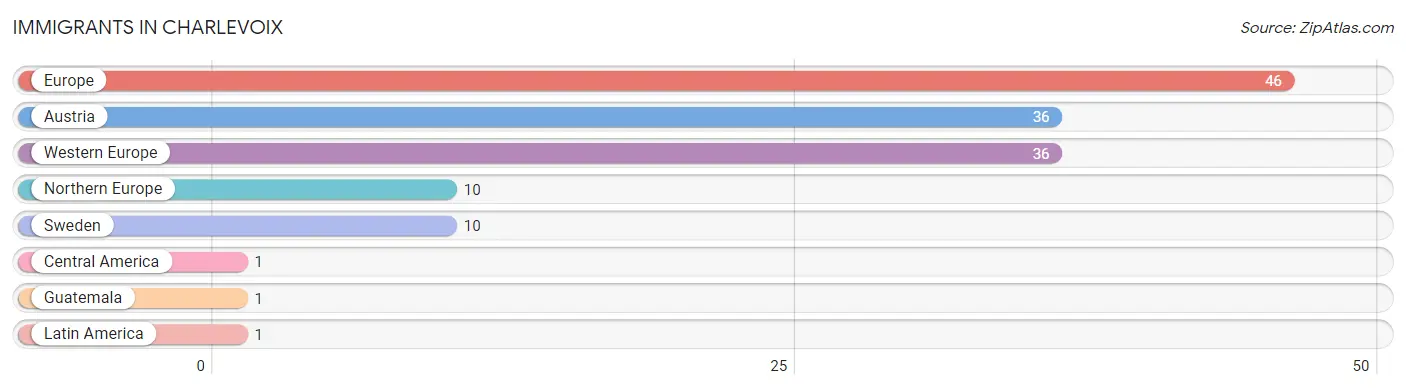
Immigrants in Charlevoix
The most numerous immigrant groups reported in Charlevoix came from Europe (46 | 1.9%), Austria (36 | 1.5%), Western Europe (36 | 1.5%), Northern Europe (10 | 0.4%), and Sweden (10 | 0.4%), together accounting for 5.6% of all Charlevoix residents.
| Immigration Origin | # Population | % Population |
| Austria | 36 | 1.5% |
| Central America | 1 | 0.0% |
| Europe | 46 | 1.9% |
| Guatemala | 1 | 0.0% |
| Latin America | 1 | 0.0% |
| Northern Europe | 10 | 0.4% |
| Sweden | 10 | 0.4% |
| Western Europe | 36 | 1.5% | View All 8 Rows |
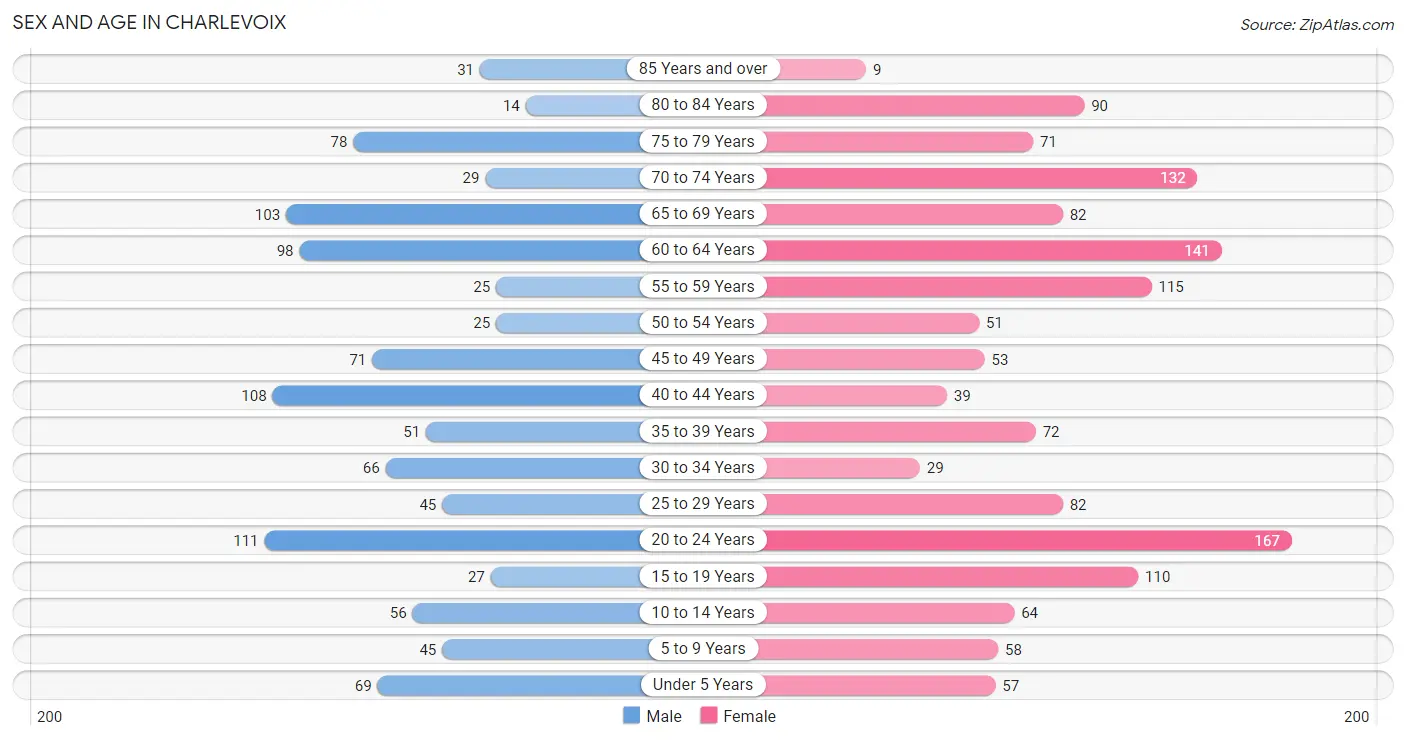
Sex and Age in Charlevoix
Sex and Age in Charlevoix
The most populous age groups in Charlevoix are 20 to 24 Years (111 | 10.5%) for men and 20 to 24 Years (167 | 11.7%) for women.
| Age Bracket | Male | Female |
| Under 5 Years | 69 (6.6%) | 57 (4.0%) |
| 5 to 9 Years | 45 (4.3%) | 58 (4.1%) |
| 10 to 14 Years | 56 (5.3%) | 64 (4.5%) |
| 15 to 19 Years | 27 (2.6%) | 110 (7.7%) |
| 20 to 24 Years | 111 (10.5%) | 167 (11.7%) |
| 25 to 29 Years | 45 (4.3%) | 82 (5.8%) |
| 30 to 34 Years | 66 (6.3%) | 29 (2.0%) |
| 35 to 39 Years | 51 (4.9%) | 72 (5.1%) |
| 40 to 44 Years | 108 (10.3%) | 39 (2.7%) |
| 45 to 49 Years | 71 (6.8%) | 53 (3.7%) |
| 50 to 54 Years | 25 (2.4%) | 51 (3.6%) |
| 55 to 59 Years | 25 (2.4%) | 115 (8.1%) |
| 60 to 64 Years | 98 (9.3%) | 141 (9.9%) |
| 65 to 69 Years | 103 (9.8%) | 82 (5.8%) |
| 70 to 74 Years | 29 (2.8%) | 132 (9.3%) |
| 75 to 79 Years | 78 (7.4%) | 71 (5.0%) |
| 80 to 84 Years | 14 (1.3%) | 90 (6.3%) |
| 85 Years and over | 31 (2.9%) | 9 (0.6%) |
| Total | 1,052 (100.0%) | 1,422 (100.0%) |
Families and Households in Charlevoix
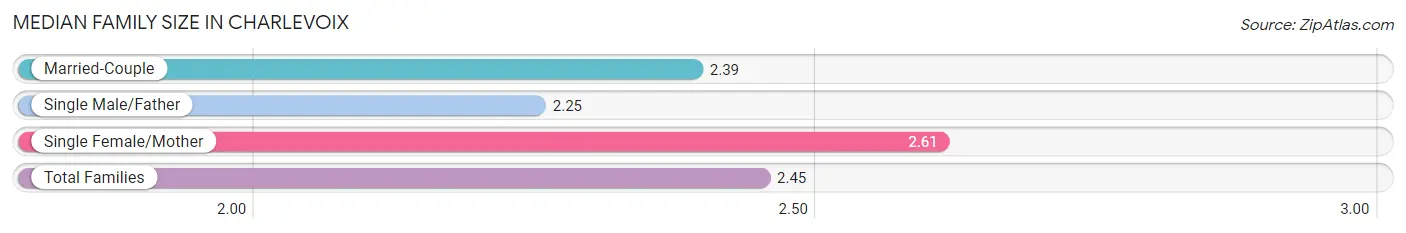
Median Family Size in Charlevoix
The median family size in Charlevoix is 2.45 persons per family, with single female/mother families (198 | 32.5%) accounting for the largest median family size of 2.61 persons per family. On the other hand, single male/father families (24 | 3.9%) represent the smallest median family size with 2.25 persons per family.
| Family Type | # Families | Family Size |
| Married-Couple | 387 (63.5%) | 2.39 |
| Single Male/Father | 24 (3.9%) | 2.25 |
| Single Female/Mother | 198 (32.5%) | 2.61 |
| Total Families | 609 (100.0%) | 2.45 |
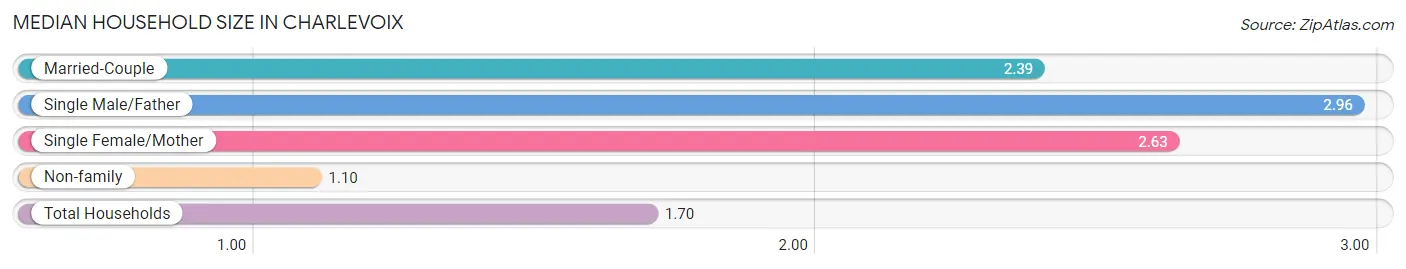
Median Household Size in Charlevoix
The median household size in Charlevoix is 1.70 persons per household, with single male/father households (24 | 1.7%) accounting for the largest median household size of 2.96 persons per household. non-family households (801 | 56.8%) represent the smallest median household size with 1.10 persons per household.
| Household Type | # Households | Household Size |
| Married-Couple | 387 (27.5%) | 2.39 |
| Single Male/Father | 24 (1.7%) | 2.96 |
| Single Female/Mother | 198 (14.0%) | 2.63 |
| Non-family | 801 (56.8%) | 1.10 |
| Total Households | 1,410 (100.0%) | 1.70 |
Household Size by Marriage Status in Charlevoix
Out of a total of 1,410 households in Charlevoix, 609 (43.2%) are family households, while 801 (56.8%) are nonfamily households. The most numerous type of family households are 2-person households, comprising 353, and the most common type of nonfamily households are 1-person households, comprising 708.
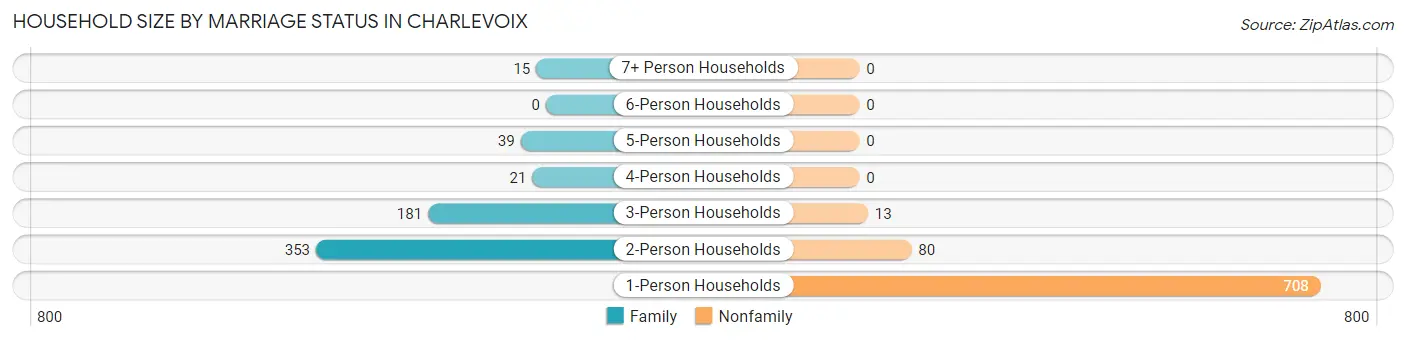
| Household Size | Family Households | Nonfamily Households |
| 1-Person Households | - | 708 (50.2%) |
| 2-Person Households | 353 (25.0%) | 80 (5.7%) |
| 3-Person Households | 181 (12.8%) | 13 (0.9%) |
| 4-Person Households | 21 (1.5%) | 0 (0.0%) |
| 5-Person Households | 39 (2.8%) | 0 (0.0%) |
| 6-Person Households | 0 (0.0%) | 0 (0.0%) |
| 7+ Person Households | 15 (1.1%) | 0 (0.0%) |
| Total | 609 (43.2%) | 801 (56.8%) |
Female Fertility in Charlevoix
Fertility by Age in Charlevoix
Average fertility rate in Charlevoix is 36.0 births per 1,000 women. Women in the age bracket of 20 to 34 years have the highest fertility rate with 72.0 births per 1,000 women. Women in the age bracket of 20 to 34 years acount for 100.0% of all women with births.
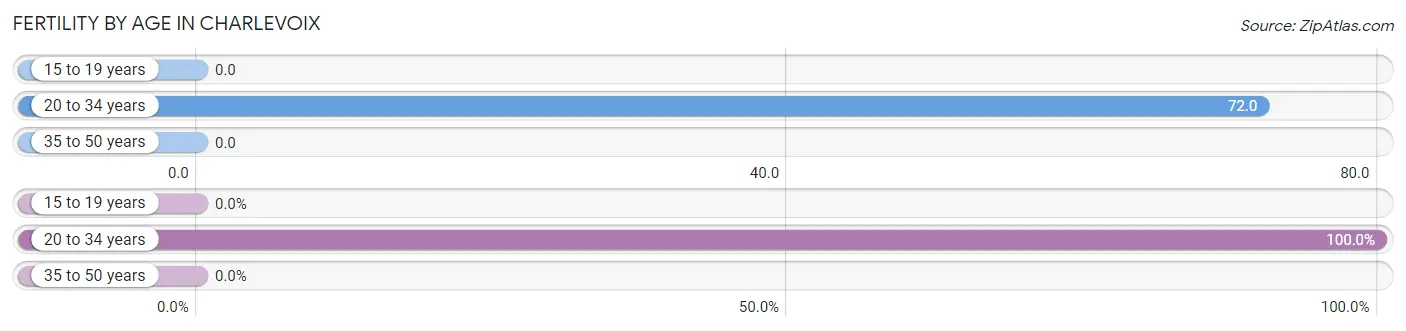
| Age Bracket | Women with Births | Births / 1,000 Women |
| 15 to 19 years | 0 (0.0%) | 0.0 |
| 20 to 34 years | 20 (100.0%) | 72.0 |
| 35 to 50 years | 0 (0.0%) | 0.0 |
| Total | 20 (100.0%) | 36.0 |
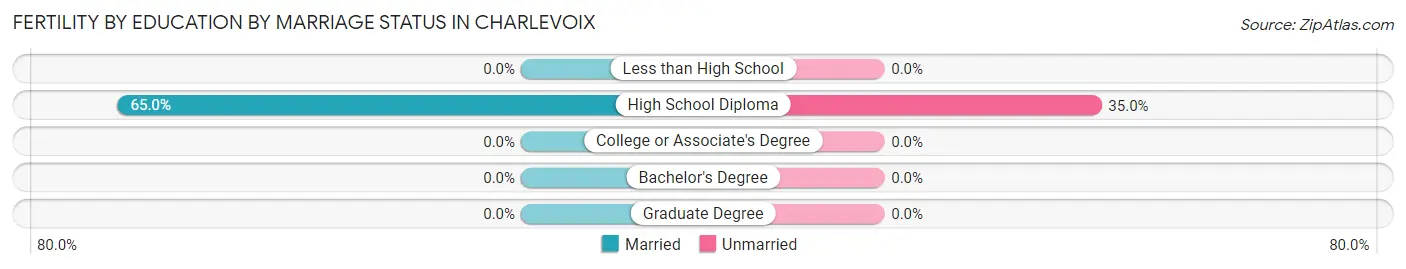
Fertility by Age by Marriage Status in Charlevoix
65.0% of women with births (20) in Charlevoix are married. The highest percentage of unmarried women with births falls into 20 to 34 years age bracket with 35.0% of them unmarried at the time of birth, while the lowest percentage of unmarried women with births belong to 20 to 34 years age bracket with 35.0% of them unmarried.
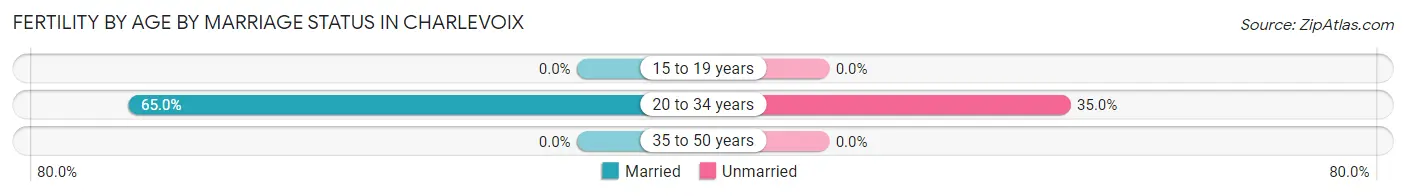
| Age Bracket | Married | Unmarried |
| 15 to 19 years | 0 (0.0%) | 0 (0.0%) |
| 20 to 34 years | 13 (65.0%) | 7 (35.0%) |
| 35 to 50 years | 0 (0.0%) | 0 (0.0%) |
| Total | 13 (65.0%) | 7 (35.0%) |
Fertility by Education in Charlevoix
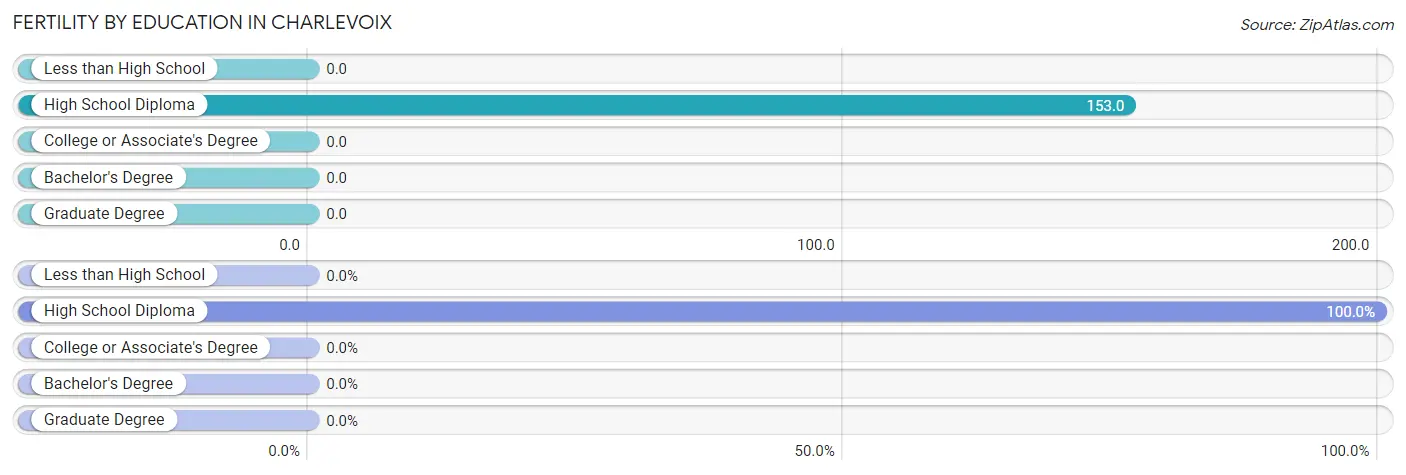
| Educational Attainment | Women with Births | Births / 1,000 Women |
| Less than High School | 0 (0.0%) | 0.0 |
| High School Diploma | 20 (100.0%) | 153.0 |
| College or Associate's Degree | 0 (0.0%) | 0.0 |
| Bachelor's Degree | 0 (0.0%) | 0.0 |
| Graduate Degree | 0 (0.0%) | 0.0 |
| Total | 20 (100.0%) | 36.0 |
Fertility by Education by Marriage Status in Charlevoix
35.0% of women with births in Charlevoix are unmarried. Women with the educational attainment of high school diploma are most likely to be married with 65.0% of them married at childbirth, while women with the educational attainment of high school diploma are least likely to be married with 35.0% of them unmarried at childbirth.
| Educational Attainment | Married | Unmarried |
| Less than High School | 0 (0.0%) | 0 (0.0%) |
| High School Diploma | 13 (65.0%) | 7 (35.0%) |
| College or Associate's Degree | 0 (0.0%) | 0 (0.0%) |
| Bachelor's Degree | 0 (0.0%) | 0 (0.0%) |
| Graduate Degree | 0 (0.0%) | 0 (0.0%) |
| Total | 13 (65.0%) | 7 (35.0%) |
Employment Characteristics in Charlevoix
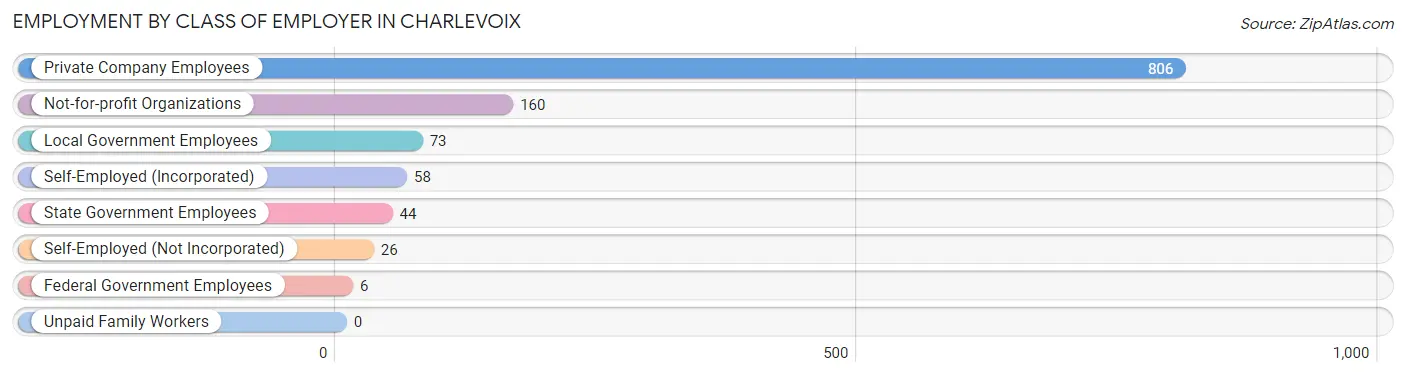
Employment by Class of Employer in Charlevoix
Among the 1,173 employed individuals in Charlevoix, private company employees (806 | 68.7%), not-for-profit organizations (160 | 13.6%), and local government employees (73 | 6.2%) make up the most common classes of employment.
| Employer Class | # Employees | % Employees |
| Private Company Employees | 806 | 68.7% |
| Self-Employed (Incorporated) | 58 | 4.9% |
| Self-Employed (Not Incorporated) | 26 | 2.2% |
| Not-for-profit Organizations | 160 | 13.6% |
| Local Government Employees | 73 | 6.2% |
| State Government Employees | 44 | 3.7% |
| Federal Government Employees | 6 | 0.5% |
| Unpaid Family Workers | 0 | 0.0% |
| Total | 1,173 | 100.0% |
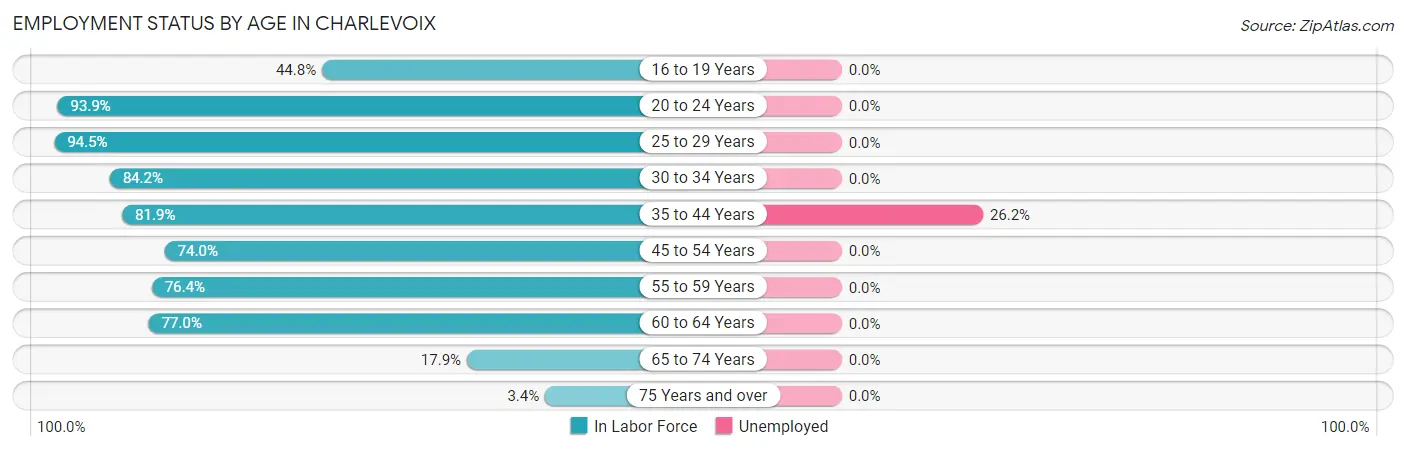
Employment Status by Age in Charlevoix
According to the labor force statistics for Charlevoix, out of the total population over 16 years of age (2,075), 59.4% or 1,233 individuals are in the labor force, with 4.7% or 58 of them unemployed. The age group with the highest labor force participation rate is 25 to 29 years, with 94.5% or 120 individuals in the labor force. Within the labor force, the 35 to 44 years age range has the highest percentage of unemployed individuals, with 26.2% or 58 of them being unemployed.
| Age Bracket | In Labor Force | Unemployed |
| 16 to 19 Years | 39 (44.8%) | 0 (0.0%) |
| 20 to 24 Years | 261 (93.9%) | 0 (0.0%) |
| 25 to 29 Years | 120 (94.5%) | 0 (0.0%) |
| 30 to 34 Years | 80 (84.2%) | 0 (0.0%) |
| 35 to 44 Years | 221 (81.9%) | 58 (26.2%) |
| 45 to 54 Years | 148 (74.0%) | 0 (0.0%) |
| 55 to 59 Years | 107 (76.4%) | 0 (0.0%) |
| 60 to 64 Years | 184 (77.0%) | 0 (0.0%) |
| 65 to 74 Years | 62 (17.9%) | 0 (0.0%) |
| 75 Years and over | 10 (3.4%) | 0 (0.0%) |
| Total | 1,233 (59.4%) | 58 (4.7%) |
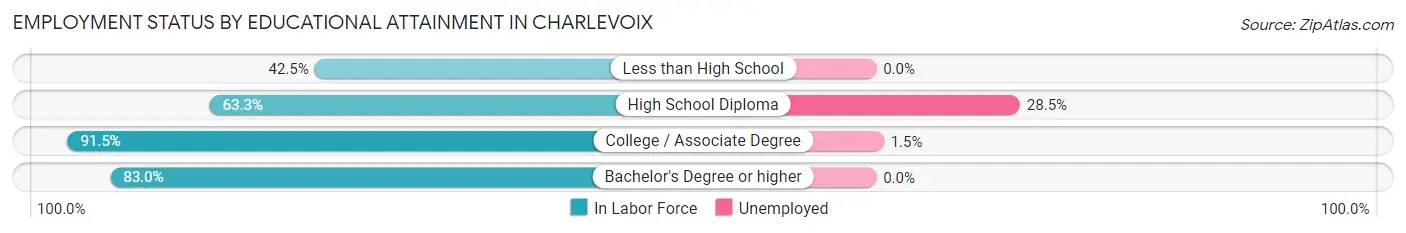
Employment Status by Educational Attainment in Charlevoix
According to labor force statistics for Charlevoix, 80.3% of individuals (860) out of the total population between 25 and 64 years of age (1,071) are in the labor force, with 6.8% or 58 of them being unemployed. The group with the highest labor force participation rate are those with the educational attainment of college / associate degree, with 91.5% or 464 individuals in the labor force. Within the labor force, individuals with high school diploma education have the highest percentage of unemployment, with 28.5% or 51 of them being unemployed.
| Educational Attainment | In Labor Force | Unemployed |
| Less than High School | 17 (42.5%) | 0 (0.0%) |
| High School Diploma | 179 (63.3%) | 81 (28.5%) |
| College / Associate Degree | 464 (91.5%) | 8 (1.5%) |
| Bachelor's Degree or higher | 200 (83.0%) | 0 (0.0%) |
| Total | 860 (80.3%) | 73 (6.8%) |
Employment Occupations by Sex in Charlevoix
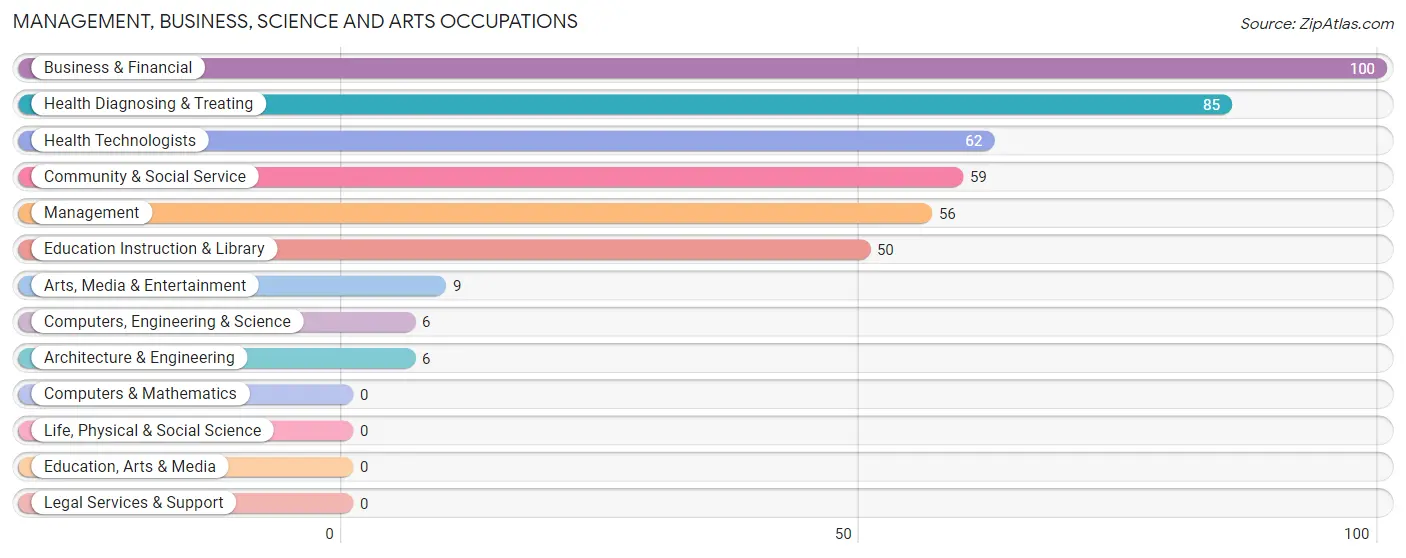
Management, Business, Science and Arts Occupations
The most common Management, Business, Science and Arts occupations in Charlevoix are Business & Financial (100 | 8.6%), Health Diagnosing & Treating (85 | 7.3%), Health Technologists (62 | 5.3%), Community & Social Service (59 | 5.1%), and Management (56 | 4.8%).
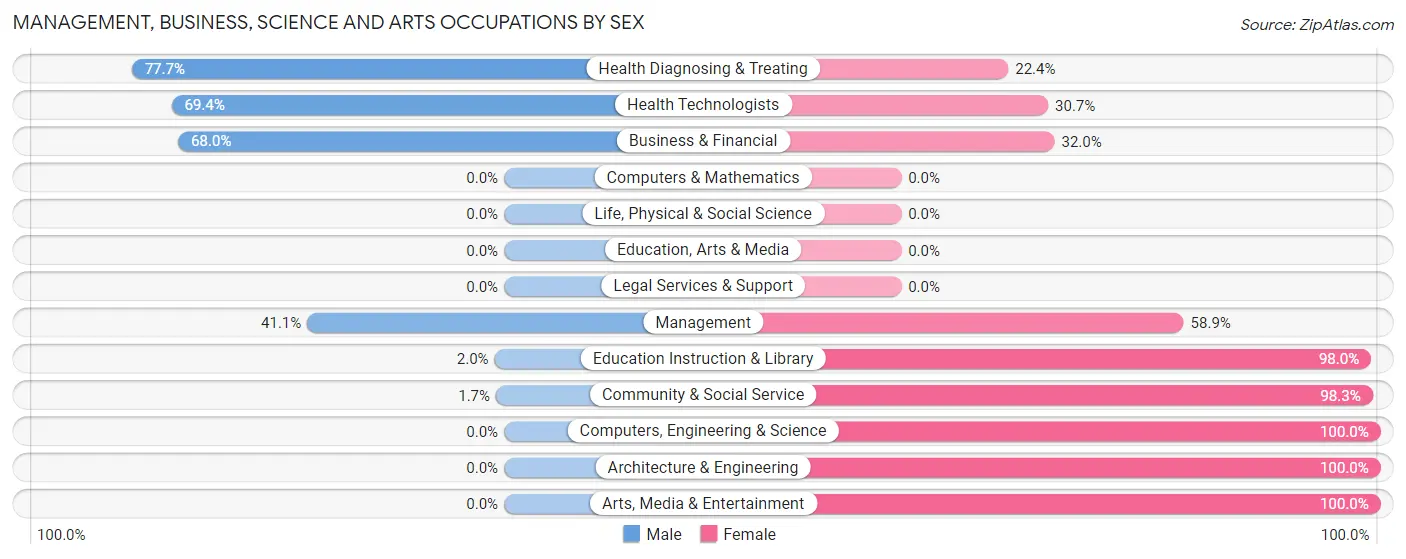
Management, Business, Science and Arts Occupations by Sex
Within the Management, Business, Science and Arts occupations in Charlevoix, the most male-oriented occupations are Health Diagnosing & Treating (77.6%), Health Technologists (69.4%), and Business & Financial (68.0%), while the most female-oriented occupations are Computers, Engineering & Science (100.0%), Architecture & Engineering (100.0%), and Arts, Media & Entertainment (100.0%).
| Occupation | Male | Female |
| Management | 23 (41.1%) | 33 (58.9%) |
| Business & Financial | 68 (68.0%) | 32 (32.0%) |
| Computers, Engineering & Science | 0 (0.0%) | 6 (100.0%) |
| Computers & Mathematics | 0 (0.0%) | 0 (0.0%) |
| Architecture & Engineering | 0 (0.0%) | 6 (100.0%) |
| Life, Physical & Social Science | 0 (0.0%) | 0 (0.0%) |
| Community & Social Service | 1 (1.7%) | 58 (98.3%) |
| Education, Arts & Media | 0 (0.0%) | 0 (0.0%) |
| Legal Services & Support | 0 (0.0%) | 0 (0.0%) |
| Education Instruction & Library | 1 (2.0%) | 49 (98.0%) |
| Arts, Media & Entertainment | 0 (0.0%) | 9 (100.0%) |
| Health Diagnosing & Treating | 66 (77.6%) | 19 (22.4%) |
| Health Technologists | 43 (69.4%) | 19 (30.6%) |
| Total (Category) | 158 (51.6%) | 148 (48.4%) |
| Total (Overall) | 477 (40.9%) | 690 (59.1%) |
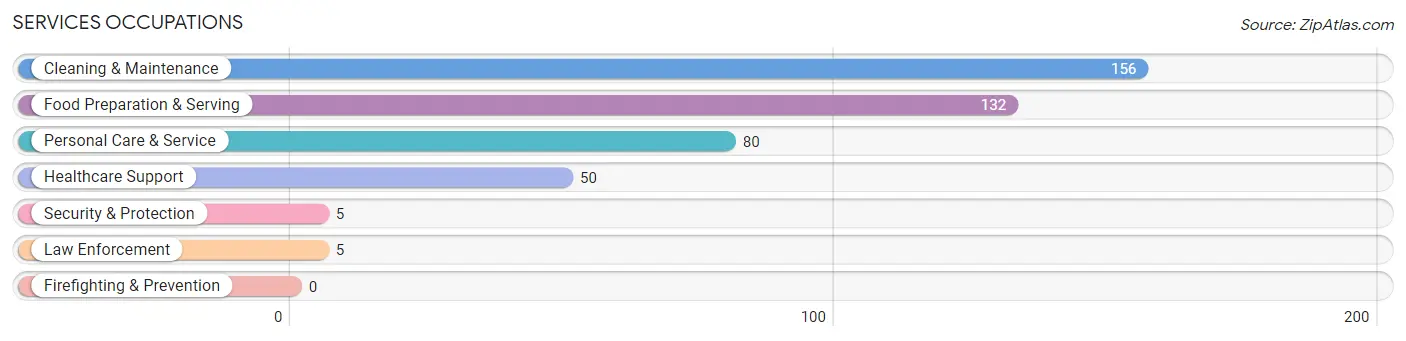
Services Occupations
The most common Services occupations in Charlevoix are Cleaning & Maintenance (156 | 13.4%), Food Preparation & Serving (132 | 11.3%), Personal Care & Service (80 | 6.9%), Healthcare Support (50 | 4.3%), and Security & Protection (5 | 0.4%).
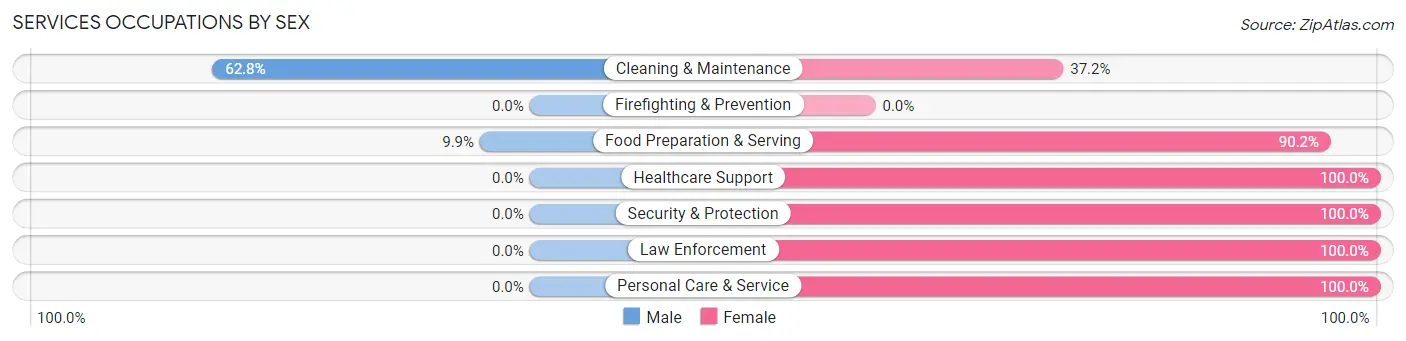
Services Occupations by Sex
Within the Services occupations in Charlevoix, the most male-oriented occupations are Cleaning & Maintenance (62.8%), and Food Preparation & Serving (9.9%), while the most female-oriented occupations are Healthcare Support (100.0%), Security & Protection (100.0%), and Law Enforcement (100.0%).
| Occupation | Male | Female |
| Healthcare Support | 0 (0.0%) | 50 (100.0%) |
| Security & Protection | 0 (0.0%) | 5 (100.0%) |
| Firefighting & Prevention | 0 (0.0%) | 0 (0.0%) |
| Law Enforcement | 0 (0.0%) | 5 (100.0%) |
| Food Preparation & Serving | 13 (9.9%) | 119 (90.1%) |
| Cleaning & Maintenance | 98 (62.8%) | 58 (37.2%) |
| Personal Care & Service | 0 (0.0%) | 80 (100.0%) |
| Total (Category) | 111 (26.2%) | 312 (73.8%) |
| Total (Overall) | 477 (40.9%) | 690 (59.1%) |
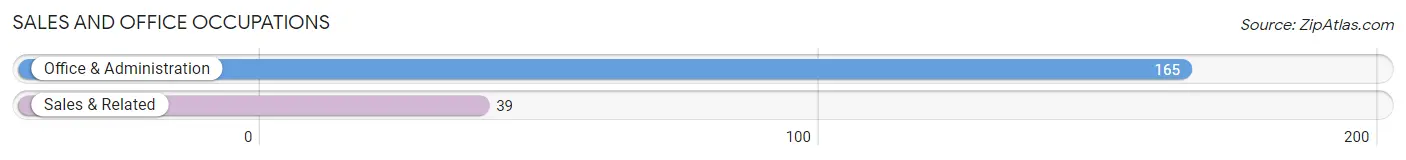
Sales and Office Occupations
The most common Sales and Office occupations in Charlevoix are Office & Administration (165 | 14.1%), and Sales & Related (39 | 3.3%).
Sales and Office Occupations by Sex
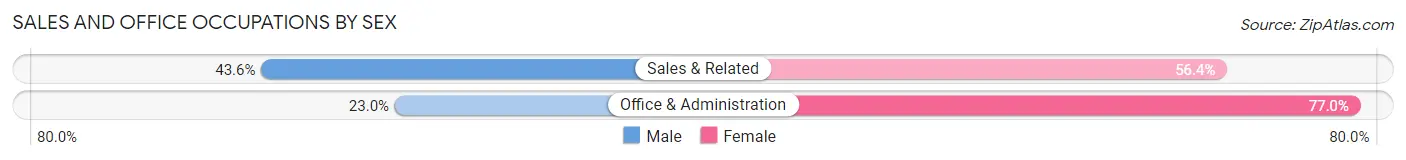
| Occupation | Male | Female |
| Sales & Related | 17 (43.6%) | 22 (56.4%) |
| Office & Administration | 38 (23.0%) | 127 (77.0%) |
| Total (Category) | 55 (27.0%) | 149 (73.0%) |
| Total (Overall) | 477 (40.9%) | 690 (59.1%) |
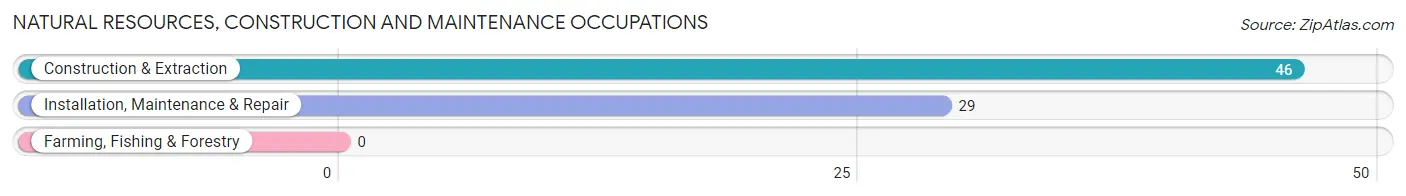
Natural Resources, Construction and Maintenance Occupations
The most common Natural Resources, Construction and Maintenance occupations in Charlevoix are Construction & Extraction (46 | 3.9%), and Installation, Maintenance & Repair (29 | 2.5%).
Natural Resources, Construction and Maintenance Occupations by Sex
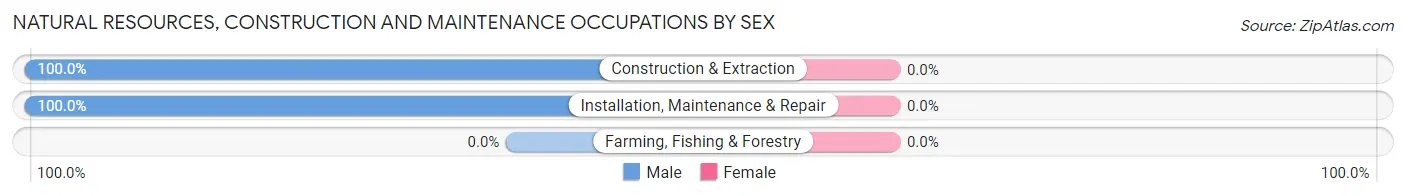
| Occupation | Male | Female |
| Farming, Fishing & Forestry | 0 (0.0%) | 0 (0.0%) |
| Construction & Extraction | 46 (100.0%) | 0 (0.0%) |
| Installation, Maintenance & Repair | 29 (100.0%) | 0 (0.0%) |
| Total (Category) | 75 (100.0%) | 0 (0.0%) |
| Total (Overall) | 477 (40.9%) | 690 (59.1%) |
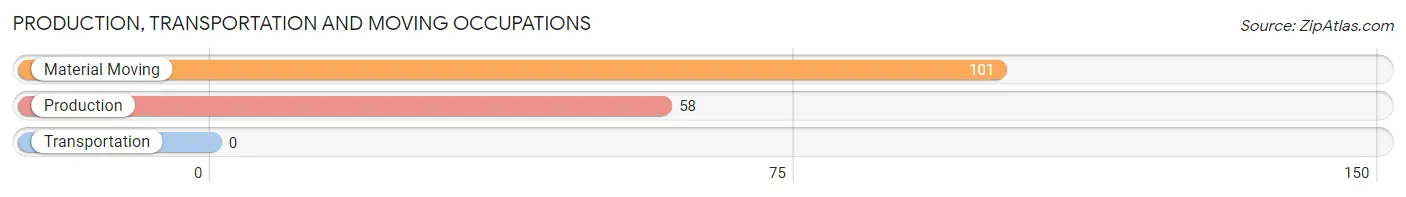
Production, Transportation and Moving Occupations
The most common Production, Transportation and Moving occupations in Charlevoix are Material Moving (101 | 8.6%), and Production (58 | 5.0%).
Production, Transportation and Moving Occupations by Sex
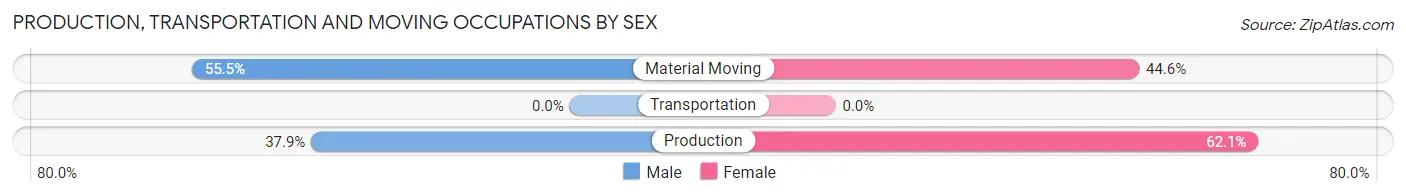
| Occupation | Male | Female |
| Production | 22 (37.9%) | 36 (62.1%) |
| Transportation | 0 (0.0%) | 0 (0.0%) |
| Material Moving | 56 (55.4%) | 45 (44.6%) |
| Total (Category) | 78 (49.1%) | 81 (50.9%) |
| Total (Overall) | 477 (40.9%) | 690 (59.1%) |
Employment Industries by Sex in Charlevoix
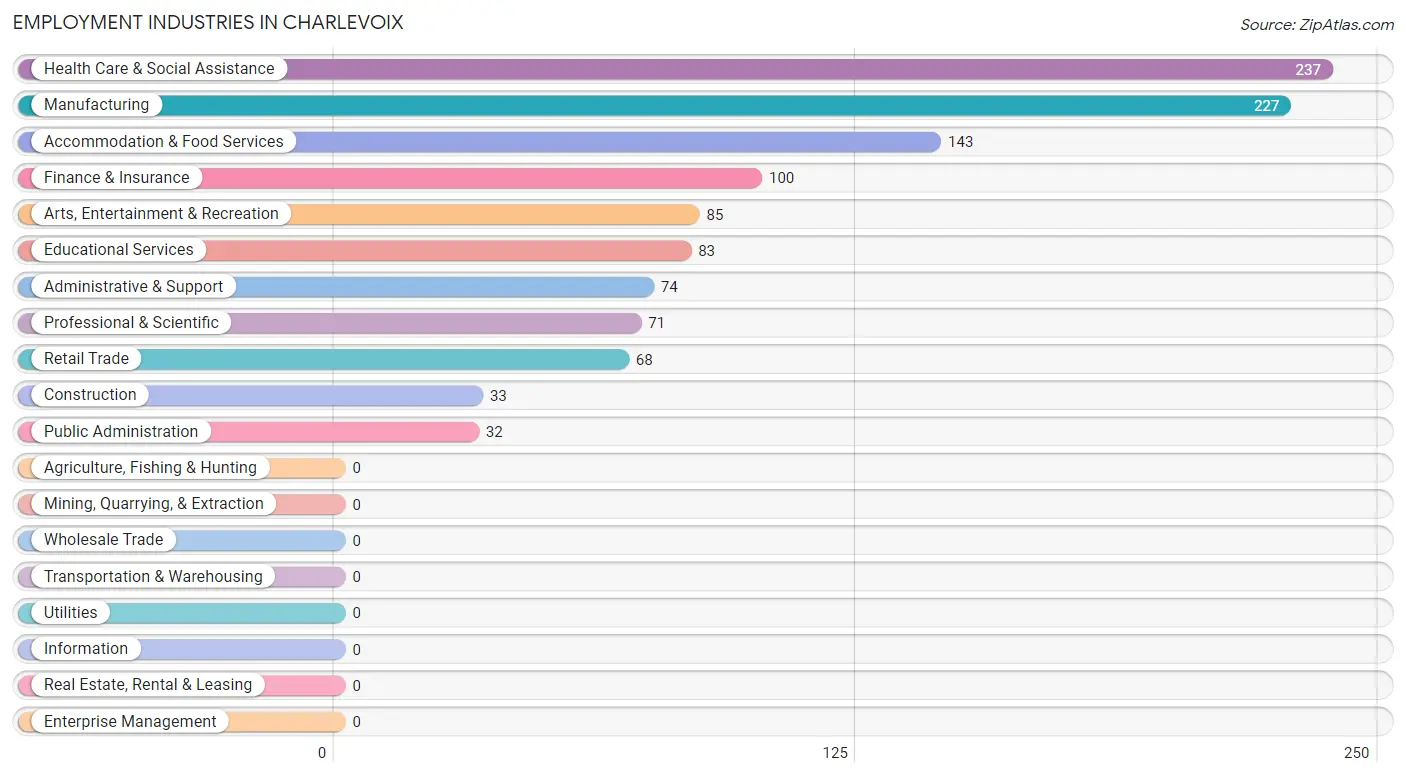
Employment Industries in Charlevoix
The major employment industries in Charlevoix include Health Care & Social Assistance (237 | 20.3%), Manufacturing (227 | 19.5%), Accommodation & Food Services (143 | 12.2%), Finance & Insurance (100 | 8.6%), and Arts, Entertainment & Recreation (85 | 7.3%).
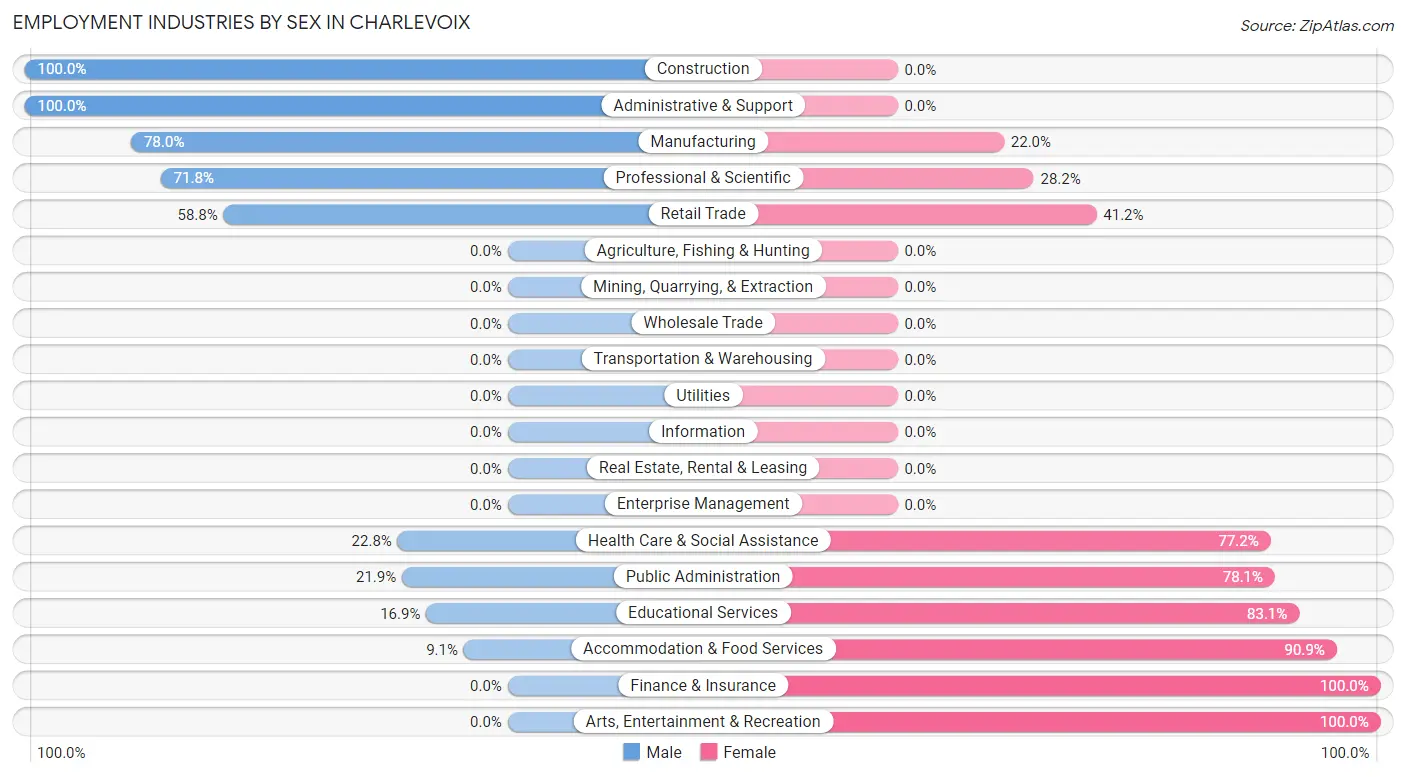
Employment Industries by Sex in Charlevoix
The Charlevoix industries that see more men than women are Construction (100.0%), Administrative & Support (100.0%), and Manufacturing (78.0%), whereas the industries that tend to have a higher number of women are Finance & Insurance (100.0%), Arts, Entertainment & Recreation (100.0%), and Accommodation & Food Services (90.9%).
| Industry | Male | Female |
| Agriculture, Fishing & Hunting | 0 (0.0%) | 0 (0.0%) |
| Mining, Quarrying, & Extraction | 0 (0.0%) | 0 (0.0%) |
| Construction | 33 (100.0%) | 0 (0.0%) |
| Manufacturing | 177 (78.0%) | 50 (22.0%) |
| Wholesale Trade | 0 (0.0%) | 0 (0.0%) |
| Retail Trade | 40 (58.8%) | 28 (41.2%) |
| Transportation & Warehousing | 0 (0.0%) | 0 (0.0%) |
| Utilities | 0 (0.0%) | 0 (0.0%) |
| Information | 0 (0.0%) | 0 (0.0%) |
| Finance & Insurance | 0 (0.0%) | 100 (100.0%) |
| Real Estate, Rental & Leasing | 0 (0.0%) | 0 (0.0%) |
| Professional & Scientific | 51 (71.8%) | 20 (28.2%) |
| Enterprise Management | 0 (0.0%) | 0 (0.0%) |
| Administrative & Support | 74 (100.0%) | 0 (0.0%) |
| Educational Services | 14 (16.9%) | 69 (83.1%) |
| Health Care & Social Assistance | 54 (22.8%) | 183 (77.2%) |
| Arts, Entertainment & Recreation | 0 (0.0%) | 85 (100.0%) |
| Accommodation & Food Services | 13 (9.1%) | 130 (90.9%) |
| Public Administration | 7 (21.9%) | 25 (78.1%) |
| Total | 477 (40.9%) | 690 (59.1%) |
Education in Charlevoix
School Enrollment in Charlevoix
The most common levels of schooling among the 411 students in Charlevoix are high school (114 | 27.7%), middle school (102 | 24.8%), and elementary school (101 | 24.6%).
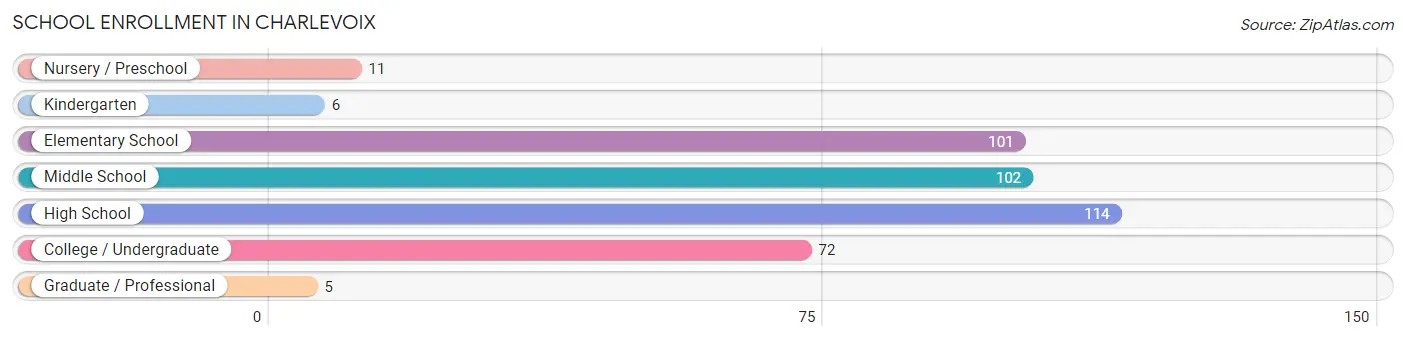
| School Level | # Students | % Students |
| Nursery / Preschool | 11 | 2.7% |
| Kindergarten | 6 | 1.5% |
| Elementary School | 101 | 24.6% |
| Middle School | 102 | 24.8% |
| High School | 114 | 27.7% |
| College / Undergraduate | 72 | 17.5% |
| Graduate / Professional | 5 | 1.2% |
| Total | 411 | 100.0% |
School Enrollment by Age by Funding Source in Charlevoix
Out of a total of 411 students who are enrolled in schools in Charlevoix, 33 (8.0%) attend a private institution, while the remaining 378 (92.0%) are enrolled in public schools. The age group of 10 to 14 year olds has the highest likelihood of being enrolled in private schools, with 24 (22.6% in the age bracket) enrolled. Conversely, the age group of 15 to 17 year olds has the lowest likelihood of being enrolled in a private school, with 69 (100.0% in the age bracket) attending a public institution.
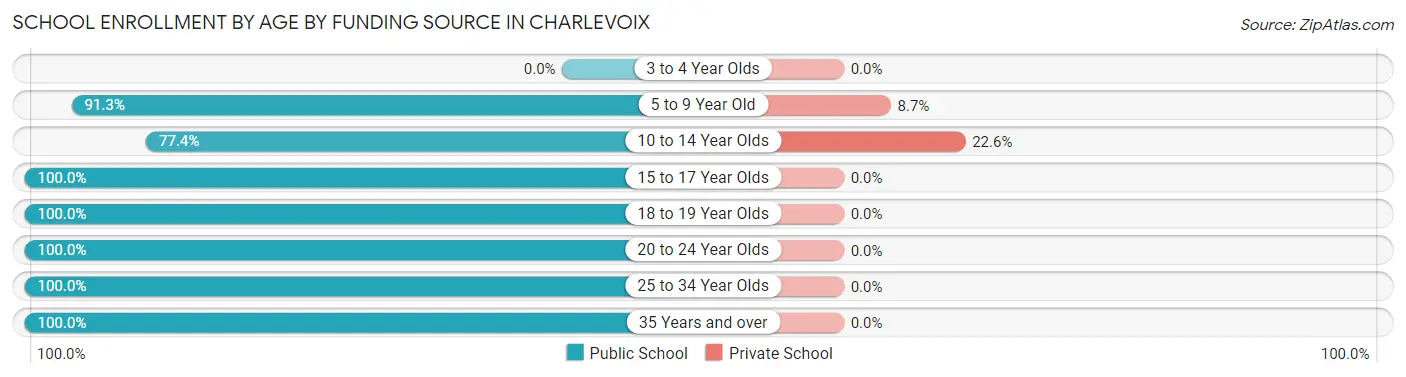
| Age Bracket | Public School | Private School |
| 3 to 4 Year Olds | 0 (0.0%) | 0 (0.0%) |
| 5 to 9 Year Old | 94 (91.3%) | 9 (8.7%) |
| 10 to 14 Year Olds | 82 (77.4%) | 24 (22.6%) |
| 15 to 17 Year Olds | 69 (100.0%) | 0 (0.0%) |
| 18 to 19 Year Olds | 56 (100.0%) | 0 (0.0%) |
| 20 to 24 Year Olds | 67 (100.0%) | 0 (0.0%) |
| 25 to 34 Year Olds | 5 (100.0%) | 0 (0.0%) |
| 35 Years and over | 5 (100.0%) | 0 (0.0%) |
| Total | 378 (92.0%) | 33 (8.0%) |
Educational Attainment by Field of Study in Charlevoix
Business (133 | 26.6%), education (112 | 22.4%), social sciences (42 | 8.4%), engineering (38 | 7.6%), and liberal arts & history (37 | 7.4%) are the most common fields of study among 501 individuals in Charlevoix who have obtained a bachelor's degree or higher.
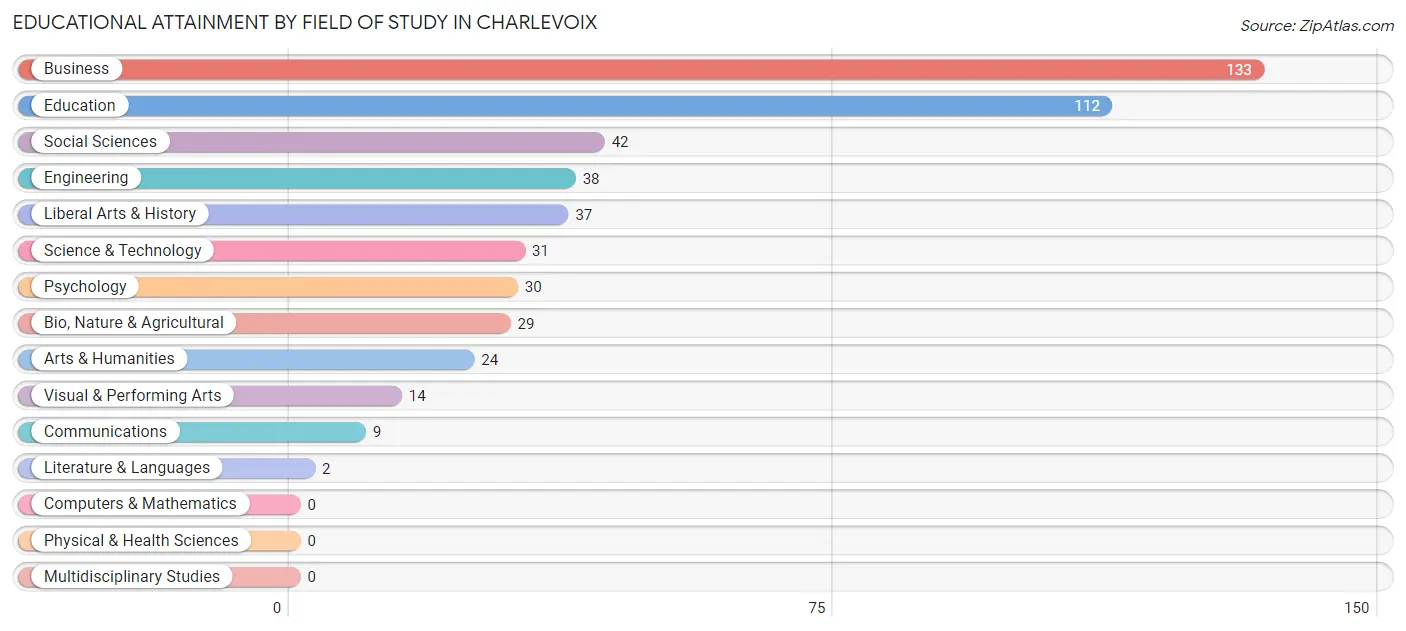
| Field of Study | # Graduates | % Graduates |
| Computers & Mathematics | 0 | 0.0% |
| Bio, Nature & Agricultural | 29 | 5.8% |
| Physical & Health Sciences | 0 | 0.0% |
| Psychology | 30 | 6.0% |
| Social Sciences | 42 | 8.4% |
| Engineering | 38 | 7.6% |
| Multidisciplinary Studies | 0 | 0.0% |
| Science & Technology | 31 | 6.2% |
| Business | 133 | 26.6% |
| Education | 112 | 22.4% |
| Literature & Languages | 2 | 0.4% |
| Liberal Arts & History | 37 | 7.4% |
| Visual & Performing Arts | 14 | 2.8% |
| Communications | 9 | 1.8% |
| Arts & Humanities | 24 | 4.8% |
| Total | 501 | 100.0% |
Transportation & Commute in Charlevoix
Vehicle Availability by Sex in Charlevoix
The most prevalent vehicle ownership categories in Charlevoix are males with 2 vehicles (201, accounting for 42.6%) and females with 2 vehicles (238, making up 29.1%).
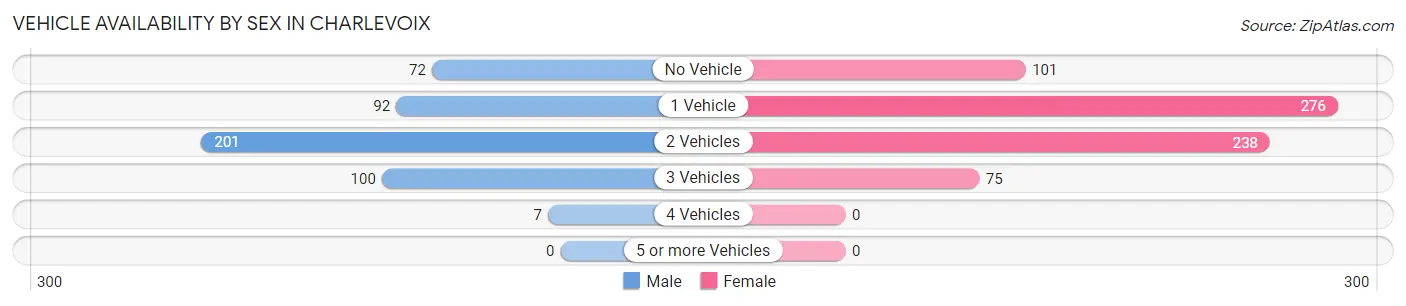
| Vehicles Available | Male | Female |
| No Vehicle | 72 (15.2%) | 101 (14.6%) |
| 1 Vehicle | 92 (19.5%) | 276 (40.0%) |
| 2 Vehicles | 201 (42.6%) | 238 (34.5%) |
| 3 Vehicles | 100 (21.2%) | 75 (10.9%) |
| 4 Vehicles | 7 (1.5%) | 0 (0.0%) |
| 5 or more Vehicles | 0 (0.0%) | 0 (0.0%) |
| Total | 472 (100.0%) | 690 (100.0%) |
Commute Time in Charlevoix
The most frequently occuring commute durations in Charlevoix are 5 to 9 minutes (265 commuters, 23.7%), less than 5 minutes (176 commuters, 15.7%), and 10 to 14 minutes (175 commuters, 15.6%).
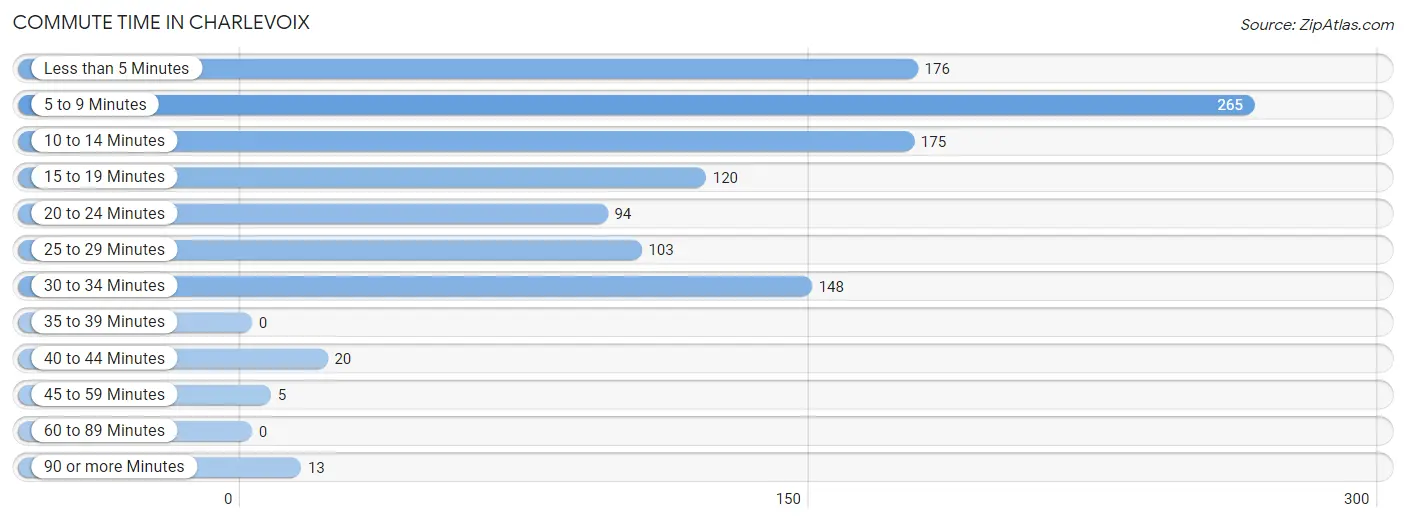
| Commute Time | # Commuters | % Commuters |
| Less than 5 Minutes | 176 | 15.7% |
| 5 to 9 Minutes | 265 | 23.7% |
| 10 to 14 Minutes | 175 | 15.6% |
| 15 to 19 Minutes | 120 | 10.7% |
| 20 to 24 Minutes | 94 | 8.4% |
| 25 to 29 Minutes | 103 | 9.2% |
| 30 to 34 Minutes | 148 | 13.2% |
| 35 to 39 Minutes | 0 | 0.0% |
| 40 to 44 Minutes | 20 | 1.8% |
| 45 to 59 Minutes | 5 | 0.4% |
| 60 to 89 Minutes | 0 | 0.0% |
| 90 or more Minutes | 13 | 1.2% |
Commute Time by Sex in Charlevoix
The most common commute times in Charlevoix are 10 to 14 minutes (129 commuters, 28.2%) for males and 5 to 9 minutes (145 commuters, 21.9%) for females.
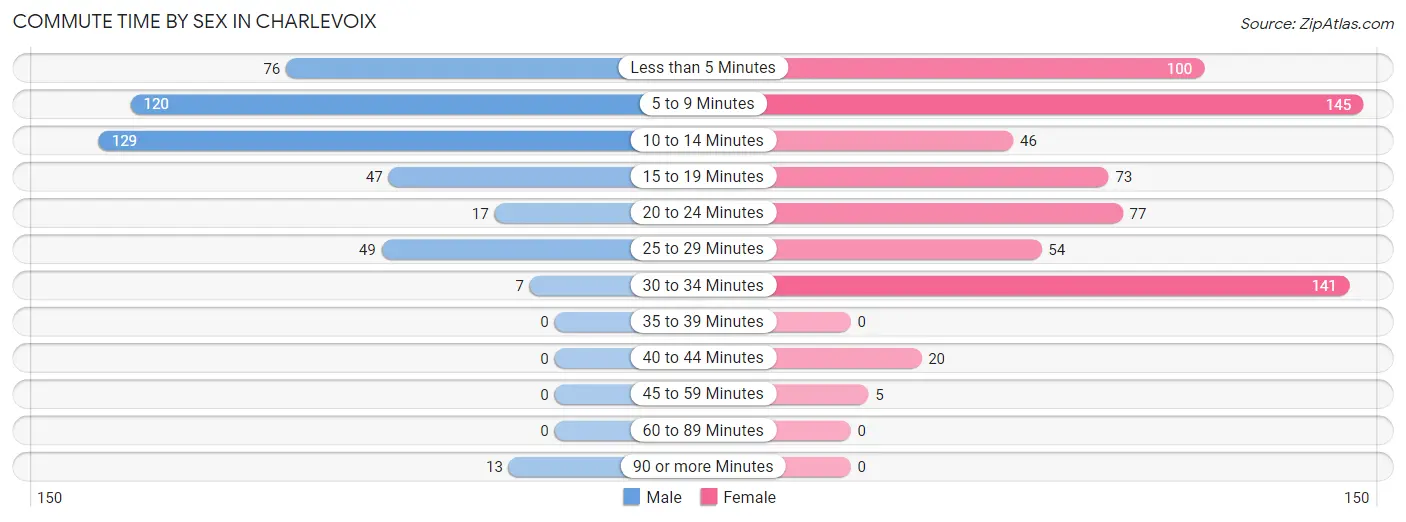
| Commute Time | Male | Female |
| Less than 5 Minutes | 76 (16.6%) | 100 (15.1%) |
| 5 to 9 Minutes | 120 (26.2%) | 145 (21.9%) |
| 10 to 14 Minutes | 129 (28.2%) | 46 (7.0%) |
| 15 to 19 Minutes | 47 (10.3%) | 73 (11.0%) |
| 20 to 24 Minutes | 17 (3.7%) | 77 (11.7%) |
| 25 to 29 Minutes | 49 (10.7%) | 54 (8.2%) |
| 30 to 34 Minutes | 7 (1.5%) | 141 (21.3%) |
| 35 to 39 Minutes | 0 (0.0%) | 0 (0.0%) |
| 40 to 44 Minutes | 0 (0.0%) | 20 (3.0%) |
| 45 to 59 Minutes | 0 (0.0%) | 5 (0.8%) |
| 60 to 89 Minutes | 0 (0.0%) | 0 (0.0%) |
| 90 or more Minutes | 13 (2.8%) | 0 (0.0%) |
Time of Departure to Work by Sex in Charlevoix
The most frequent times of departure to work in Charlevoix are 7:30 AM to 7:59 AM (89, 19.4%) for males and 7:30 AM to 7:59 AM (126, 19.1%) for females.
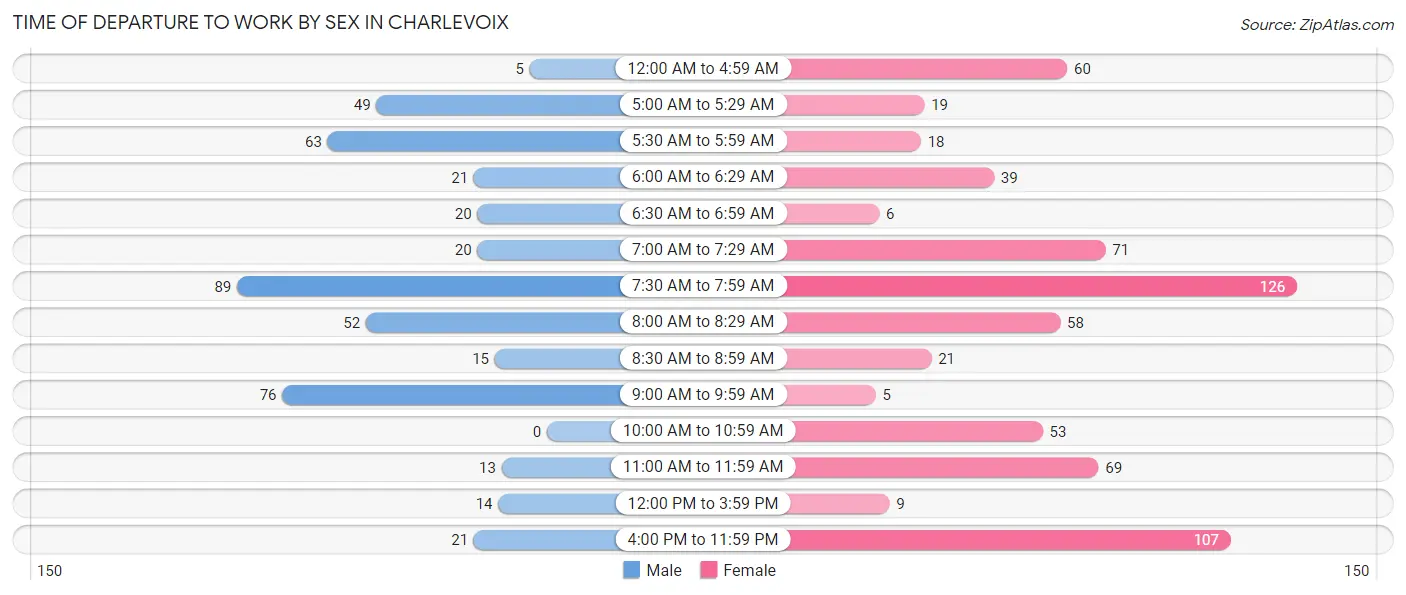
| Time of Departure | Male | Female |
| 12:00 AM to 4:59 AM | 5 (1.1%) | 60 (9.1%) |
| 5:00 AM to 5:29 AM | 49 (10.7%) | 19 (2.9%) |
| 5:30 AM to 5:59 AM | 63 (13.8%) | 18 (2.7%) |
| 6:00 AM to 6:29 AM | 21 (4.6%) | 39 (5.9%) |
| 6:30 AM to 6:59 AM | 20 (4.4%) | 6 (0.9%) |
| 7:00 AM to 7:29 AM | 20 (4.4%) | 71 (10.7%) |
| 7:30 AM to 7:59 AM | 89 (19.4%) | 126 (19.1%) |
| 8:00 AM to 8:29 AM | 52 (11.4%) | 58 (8.8%) |
| 8:30 AM to 8:59 AM | 15 (3.3%) | 21 (3.2%) |
| 9:00 AM to 9:59 AM | 76 (16.6%) | 5 (0.8%) |
| 10:00 AM to 10:59 AM | 0 (0.0%) | 53 (8.0%) |
| 11:00 AM to 11:59 AM | 13 (2.8%) | 69 (10.4%) |
| 12:00 PM to 3:59 PM | 14 (3.1%) | 9 (1.4%) |
| 4:00 PM to 11:59 PM | 21 (4.6%) | 107 (16.2%) |
| Total | 458 (100.0%) | 661 (100.0%) |
Housing Occupancy in Charlevoix
Occupancy by Ownership in Charlevoix
Of the total 1,410 dwellings in Charlevoix, owner-occupied units account for 736 (52.2%), while renter-occupied units make up 674 (47.8%).
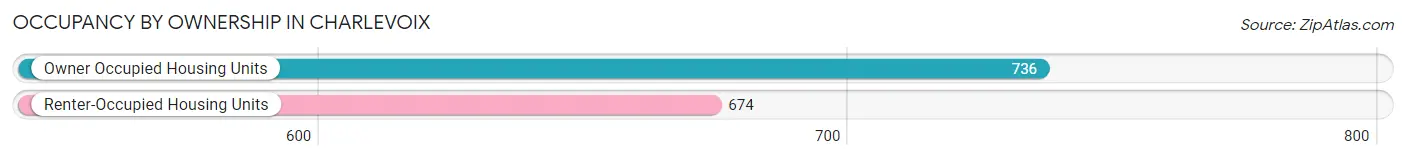
| Occupancy | # Housing Units | % Housing Units |
| Owner Occupied Housing Units | 736 | 52.2% |
| Renter-Occupied Housing Units | 674 | 47.8% |
| Total Occupied Housing Units | 1,410 | 100.0% |
Occupancy by Household Size in Charlevoix
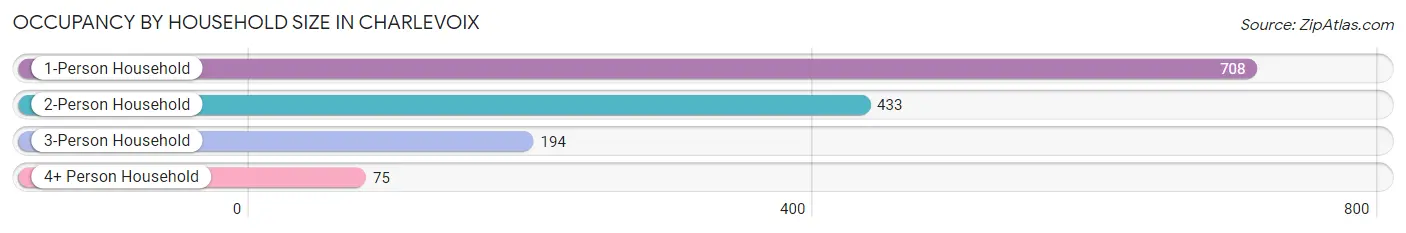
| Household Size | # Housing Units | % Housing Units |
| 1-Person Household | 708 | 50.2% |
| 2-Person Household | 433 | 30.7% |
| 3-Person Household | 194 | 13.8% |
| 4+ Person Household | 75 | 5.3% |
| Total Housing Units | 1,410 | 100.0% |
Occupancy by Ownership by Household Size in Charlevoix
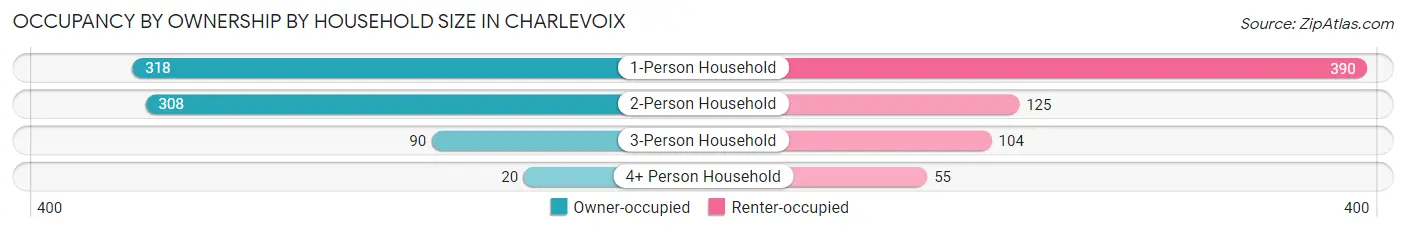
| Household Size | Owner-occupied | Renter-occupied |
| 1-Person Household | 318 (44.9%) | 390 (55.1%) |
| 2-Person Household | 308 (71.1%) | 125 (28.9%) |
| 3-Person Household | 90 (46.4%) | 104 (53.6%) |
| 4+ Person Household | 20 (26.7%) | 55 (73.3%) |
| Total Housing Units | 736 (52.2%) | 674 (47.8%) |
Occupancy by Educational Attainment in Charlevoix
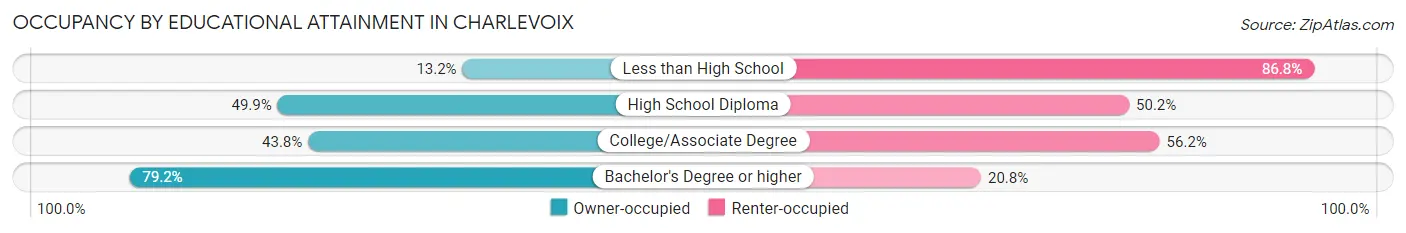
| Household Size | Owner-occupied | Renter-occupied |
| Less than High School | 12 (13.2%) | 79 (86.8%) |
| High School Diploma | 167 (49.8%) | 168 (50.1%) |
| College/Associate Degree | 275 (43.8%) | 353 (56.2%) |
| Bachelor's Degree or higher | 282 (79.2%) | 74 (20.8%) |
Occupancy by Age of Householder in Charlevoix
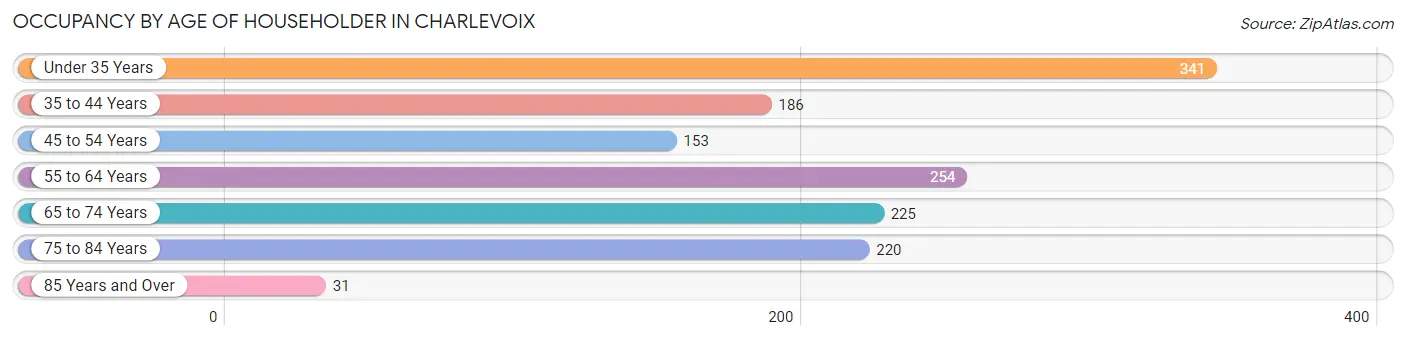
| Age Bracket | # Households | % Households |
| Under 35 Years | 341 | 24.2% |
| 35 to 44 Years | 186 | 13.2% |
| 45 to 54 Years | 153 | 10.8% |
| 55 to 64 Years | 254 | 18.0% |
| 65 to 74 Years | 225 | 16.0% |
| 75 to 84 Years | 220 | 15.6% |
| 85 Years and Over | 31 | 2.2% |
| Total | 1,410 | 100.0% |
Housing Finances in Charlevoix
Median Income by Occupancy in Charlevoix
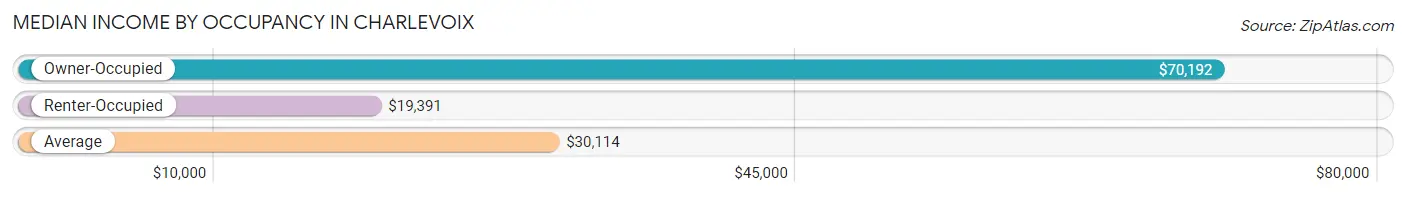
| Occupancy Type | # Households | Median Income |
| Owner-Occupied | 736 (52.2%) | $70,192 |
| Renter-Occupied | 674 (47.8%) | $19,391 |
| Average | 1,410 (100.0%) | $30,114 |
Occupancy by Householder Income Bracket in Charlevoix
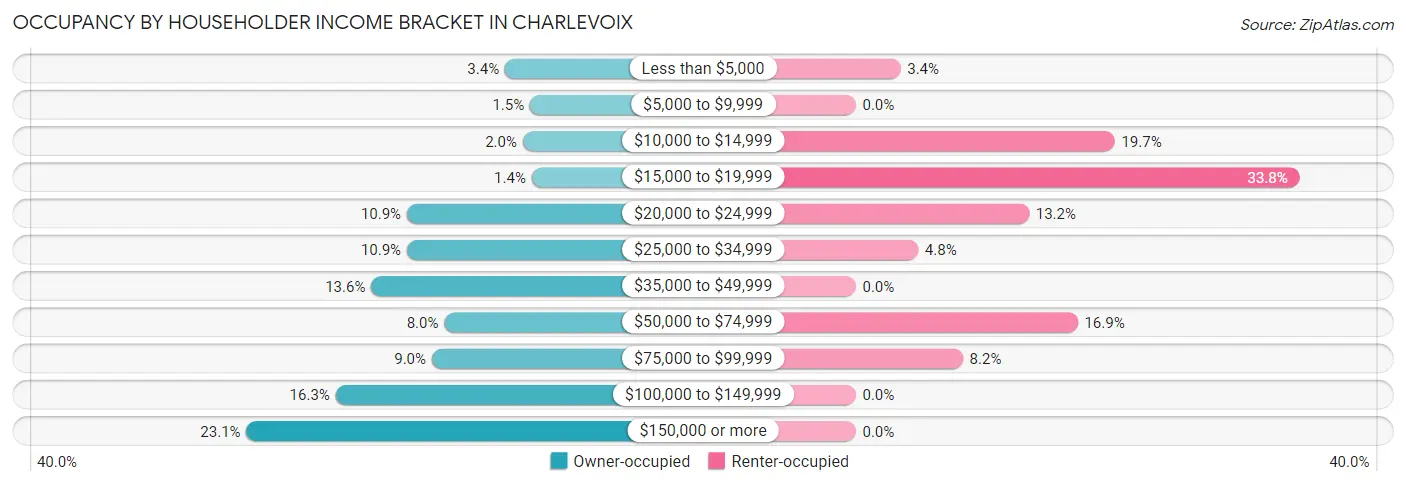
| Income Bracket | Owner-occupied | Renter-occupied |
| Less than $5,000 | 25 (3.4%) | 23 (3.4%) |
| $5,000 to $9,999 | 11 (1.5%) | 0 (0.0%) |
| $10,000 to $14,999 | 15 (2.0%) | 133 (19.7%) |
| $15,000 to $19,999 | 10 (1.4%) | 228 (33.8%) |
| $20,000 to $24,999 | 80 (10.9%) | 89 (13.2%) |
| $25,000 to $34,999 | 80 (10.9%) | 32 (4.8%) |
| $35,000 to $49,999 | 100 (13.6%) | 0 (0.0%) |
| $50,000 to $74,999 | 59 (8.0%) | 114 (16.9%) |
| $75,000 to $99,999 | 66 (9.0%) | 55 (8.2%) |
| $100,000 to $149,999 | 120 (16.3%) | 0 (0.0%) |
| $150,000 or more | 170 (23.1%) | 0 (0.0%) |
| Total | 736 (100.0%) | 674 (100.0%) |
Monthly Housing Cost Tiers in Charlevoix
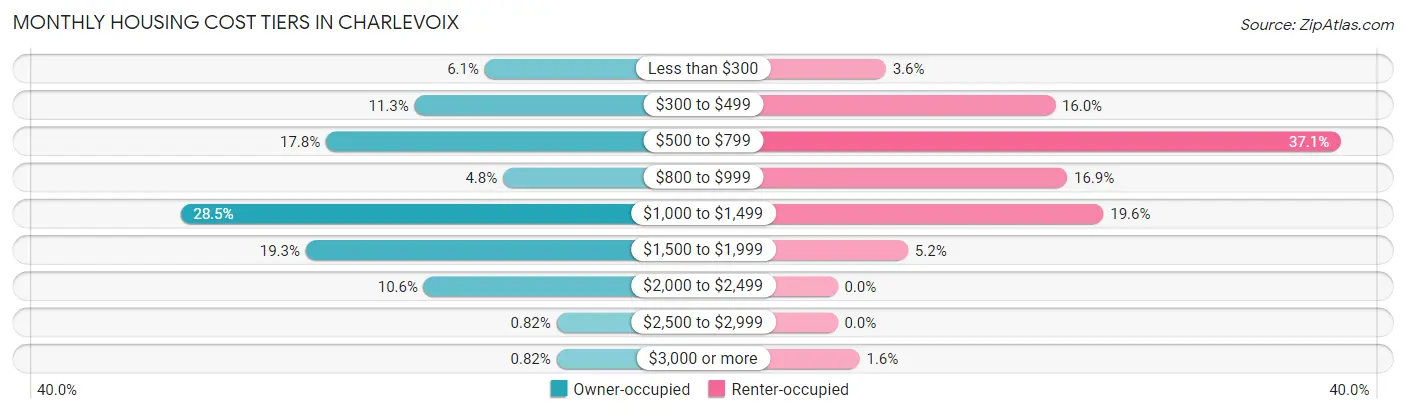
| Monthly Cost | Owner-occupied | Renter-occupied |
| Less than $300 | 45 (6.1%) | 24 (3.6%) |
| $300 to $499 | 83 (11.3%) | 108 (16.0%) |
| $500 to $799 | 131 (17.8%) | 250 (37.1%) |
| $800 to $999 | 35 (4.8%) | 114 (16.9%) |
| $1,000 to $1,499 | 210 (28.5%) | 132 (19.6%) |
| $1,500 to $1,999 | 142 (19.3%) | 35 (5.2%) |
| $2,000 to $2,499 | 78 (10.6%) | 0 (0.0%) |
| $2,500 to $2,999 | 6 (0.8%) | 0 (0.0%) |
| $3,000 or more | 6 (0.8%) | 11 (1.6%) |
| Total | 736 (100.0%) | 674 (100.0%) |
Physical Housing Characteristics in Charlevoix
Housing Structures in Charlevoix
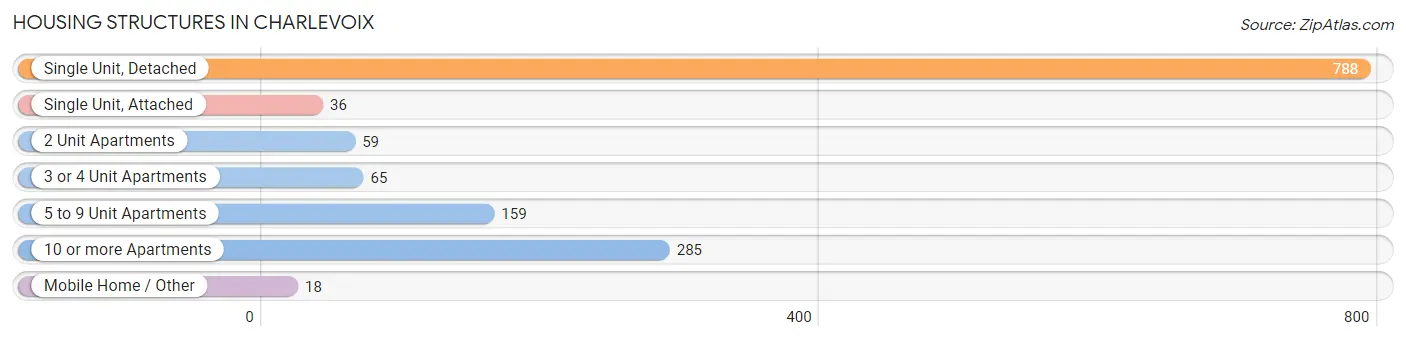
| Structure Type | # Housing Units | % Housing Units |
| Single Unit, Detached | 788 | 55.9% |
| Single Unit, Attached | 36 | 2.5% |
| 2 Unit Apartments | 59 | 4.2% |
| 3 or 4 Unit Apartments | 65 | 4.6% |
| 5 to 9 Unit Apartments | 159 | 11.3% |
| 10 or more Apartments | 285 | 20.2% |
| Mobile Home / Other | 18 | 1.3% |
| Total | 1,410 | 100.0% |
Housing Structures by Occupancy in Charlevoix
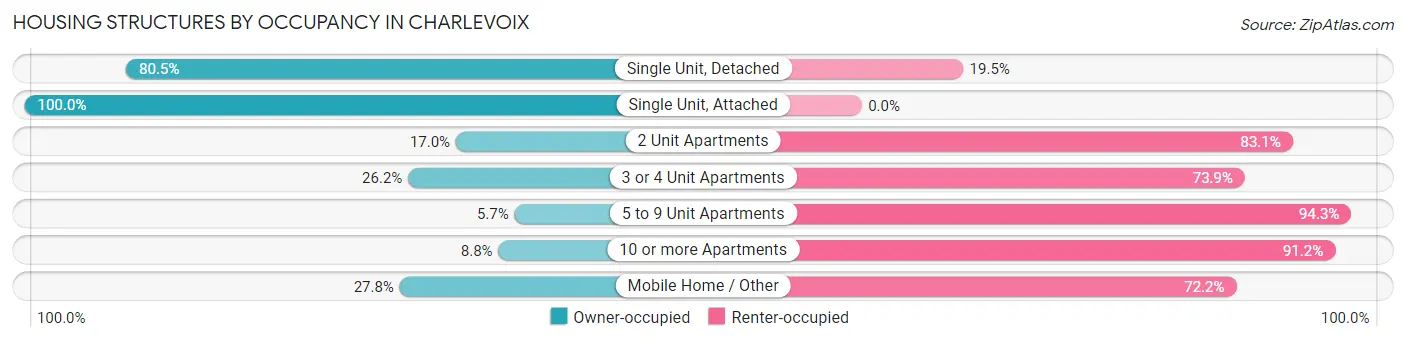
| Structure Type | Owner-occupied | Renter-occupied |
| Single Unit, Detached | 634 (80.5%) | 154 (19.5%) |
| Single Unit, Attached | 36 (100.0%) | 0 (0.0%) |
| 2 Unit Apartments | 10 (17.0%) | 49 (83.1%) |
| 3 or 4 Unit Apartments | 17 (26.2%) | 48 (73.9%) |
| 5 to 9 Unit Apartments | 9 (5.7%) | 150 (94.3%) |
| 10 or more Apartments | 25 (8.8%) | 260 (91.2%) |
| Mobile Home / Other | 5 (27.8%) | 13 (72.2%) |
| Total | 736 (52.2%) | 674 (47.8%) |
Housing Structures by Number of Rooms in Charlevoix
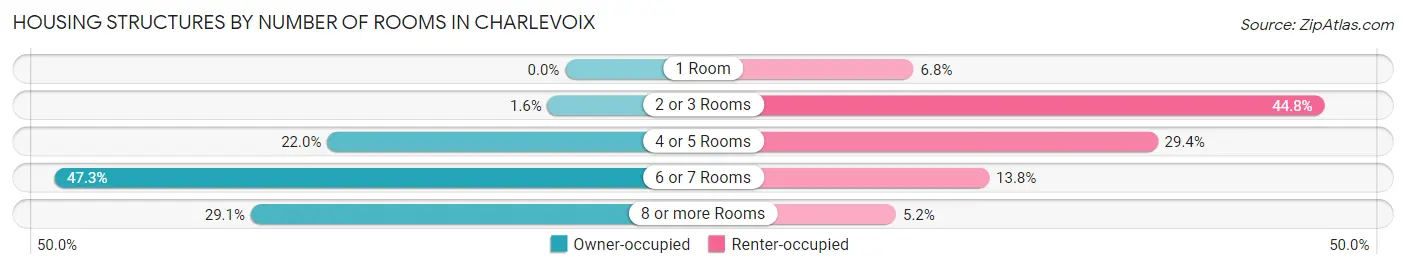
| Number of Rooms | Owner-occupied | Renter-occupied |
| 1 Room | 0 (0.0%) | 46 (6.8%) |
| 2 or 3 Rooms | 12 (1.6%) | 302 (44.8%) |
| 4 or 5 Rooms | 162 (22.0%) | 198 (29.4%) |
| 6 or 7 Rooms | 348 (47.3%) | 93 (13.8%) |
| 8 or more Rooms | 214 (29.1%) | 35 (5.2%) |
| Total | 736 (100.0%) | 674 (100.0%) |
Housing Structure by Heating Type in Charlevoix
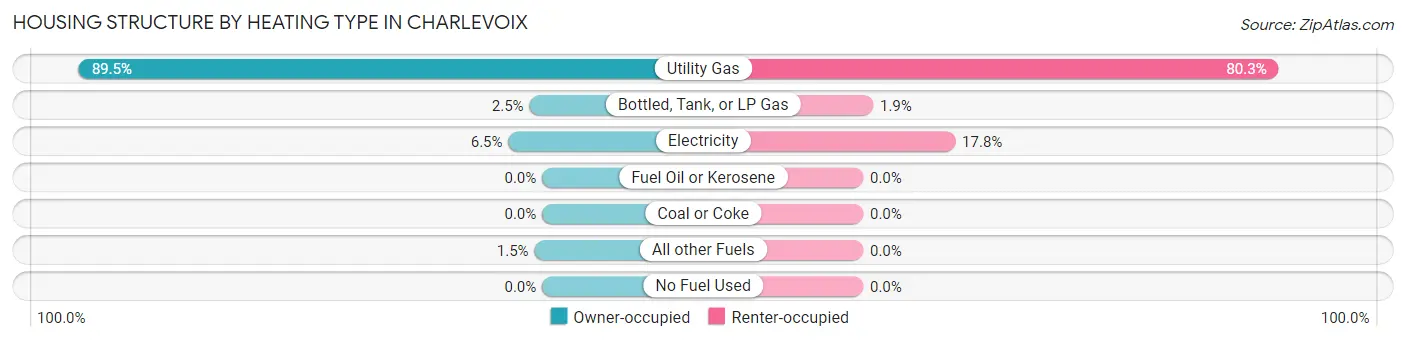
| Heating Type | Owner-occupied | Renter-occupied |
| Utility Gas | 659 (89.5%) | 541 (80.3%) |
| Bottled, Tank, or LP Gas | 18 (2.5%) | 13 (1.9%) |
| Electricity | 48 (6.5%) | 120 (17.8%) |
| Fuel Oil or Kerosene | 0 (0.0%) | 0 (0.0%) |
| Coal or Coke | 0 (0.0%) | 0 (0.0%) |
| All other Fuels | 11 (1.5%) | 0 (0.0%) |
| No Fuel Used | 0 (0.0%) | 0 (0.0%) |
| Total | 736 (100.0%) | 674 (100.0%) |
Household Vehicle Usage in Charlevoix
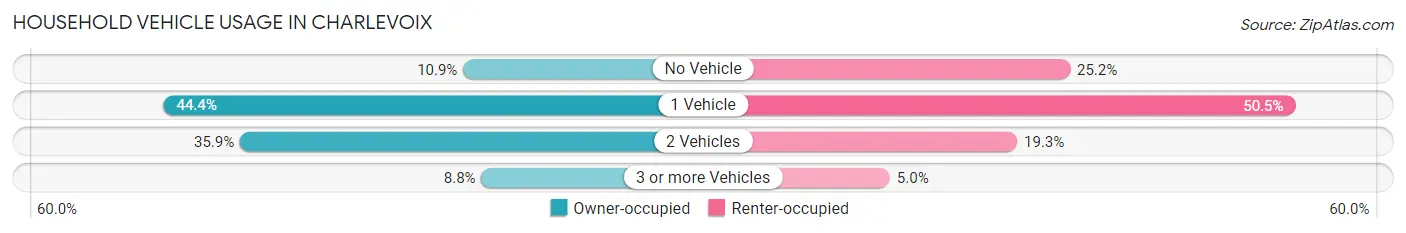
| Vehicles per Household | Owner-occupied | Renter-occupied |
| No Vehicle | 80 (10.9%) | 170 (25.2%) |
| 1 Vehicle | 327 (44.4%) | 340 (50.4%) |
| 2 Vehicles | 264 (35.9%) | 130 (19.3%) |
| 3 or more Vehicles | 65 (8.8%) | 34 (5.0%) |
| Total | 736 (100.0%) | 674 (100.0%) |
Real Estate & Mortgages in Charlevoix
Real Estate and Mortgage Overview in Charlevoix
| Characteristic | Without Mortgage | With Mortgage |
| Housing Units | 273 | 463 |
| Median Property Value | $240,200 | $248,200 |
| Median Household Income | $42,034 | $108 |
| Monthly Housing Costs | $525 | $6 |
| Real Estate Taxes | $2,803 | $0 |
Property Value by Mortgage Status in Charlevoix
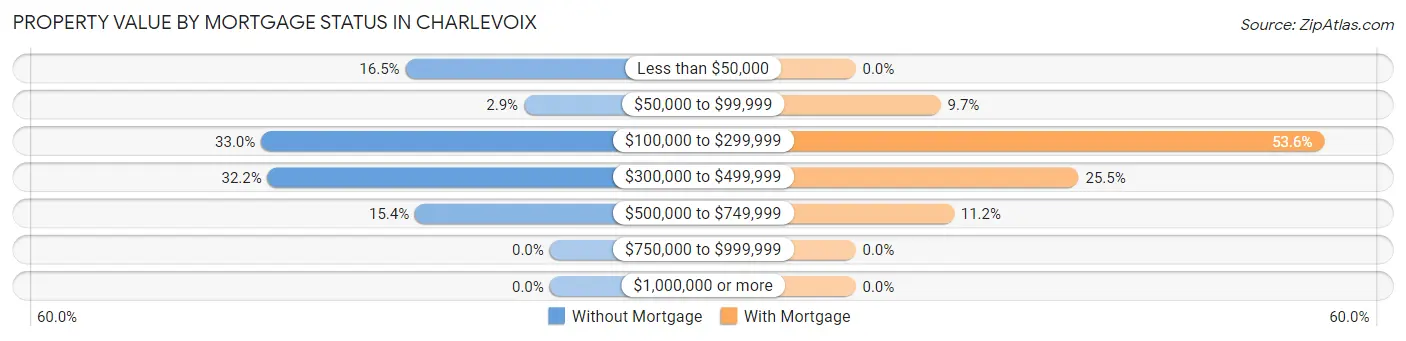
| Property Value | Without Mortgage | With Mortgage |
| Less than $50,000 | 45 (16.5%) | 0 (0.0%) |
| $50,000 to $99,999 | 8 (2.9%) | 45 (9.7%) |
| $100,000 to $299,999 | 90 (33.0%) | 248 (53.6%) |
| $300,000 to $499,999 | 88 (32.2%) | 118 (25.5%) |
| $500,000 to $749,999 | 42 (15.4%) | 52 (11.2%) |
| $750,000 to $999,999 | 0 (0.0%) | 0 (0.0%) |
| $1,000,000 or more | 0 (0.0%) | 0 (0.0%) |
| Total | 273 (100.0%) | 463 (100.0%) |
Household Income by Mortgage Status in Charlevoix
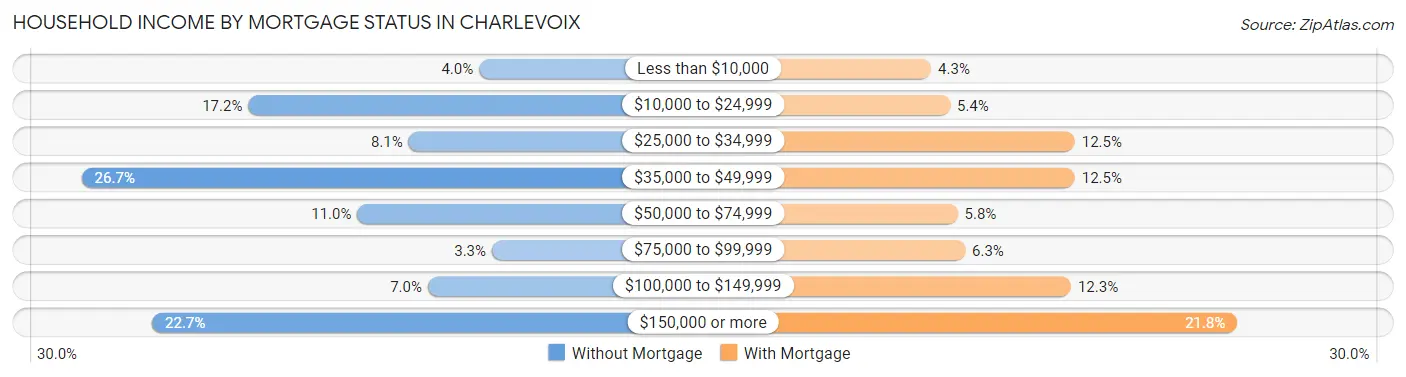
| Household Income | Without Mortgage | With Mortgage |
| Less than $10,000 | 11 (4.0%) | 20 (4.3%) |
| $10,000 to $24,999 | 47 (17.2%) | 25 (5.4%) |
| $25,000 to $34,999 | 22 (8.1%) | 58 (12.5%) |
| $35,000 to $49,999 | 73 (26.7%) | 58 (12.5%) |
| $50,000 to $74,999 | 30 (11.0%) | 27 (5.8%) |
| $75,000 to $99,999 | 9 (3.3%) | 29 (6.3%) |
| $100,000 to $149,999 | 19 (7.0%) | 57 (12.3%) |
| $150,000 or more | 62 (22.7%) | 101 (21.8%) |
| Total | 273 (100.0%) | 463 (100.0%) |
Property Value to Household Income Ratio in Charlevoix
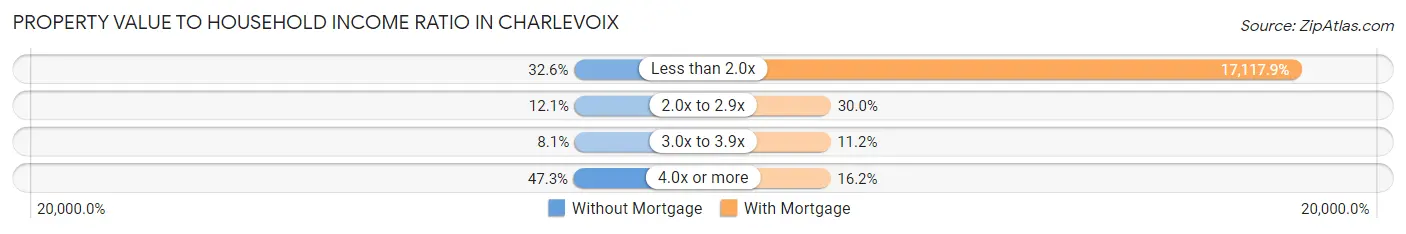
| Value-to-Income Ratio | Without Mortgage | With Mortgage |
| Less than 2.0x | 89 (32.6%) | 79,256 (17,117.9%) |
| 2.0x to 2.9x | 33 (12.1%) | 139 (30.0%) |
| 3.0x to 3.9x | 22 (8.1%) | 52 (11.2%) |
| 4.0x or more | 129 (47.2%) | 75 (16.2%) |
| Total | 273 (100.0%) | 463 (100.0%) |
Real Estate Taxes by Mortgage Status in Charlevoix
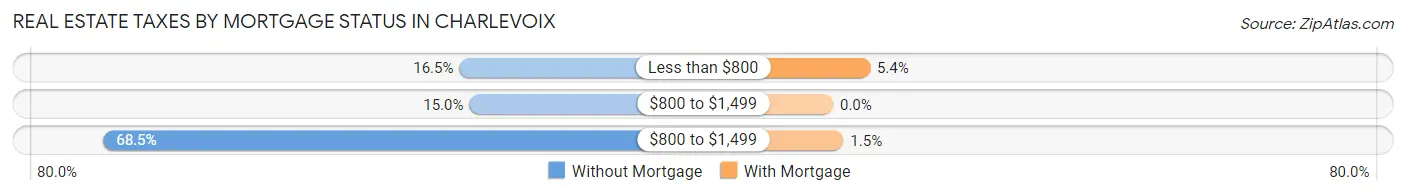
| Property Taxes | Without Mortgage | With Mortgage |
| Less than $800 | 45 (16.5%) | 25 (5.4%) |
| $800 to $1,499 | 41 (15.0%) | 0 (0.0%) |
| $800 to $1,499 | 187 (68.5%) | 7 (1.5%) |
| Total | 273 (100.0%) | 463 (100.0%) |
Health & Disability in Charlevoix
Health Insurance Coverage by Age in Charlevoix
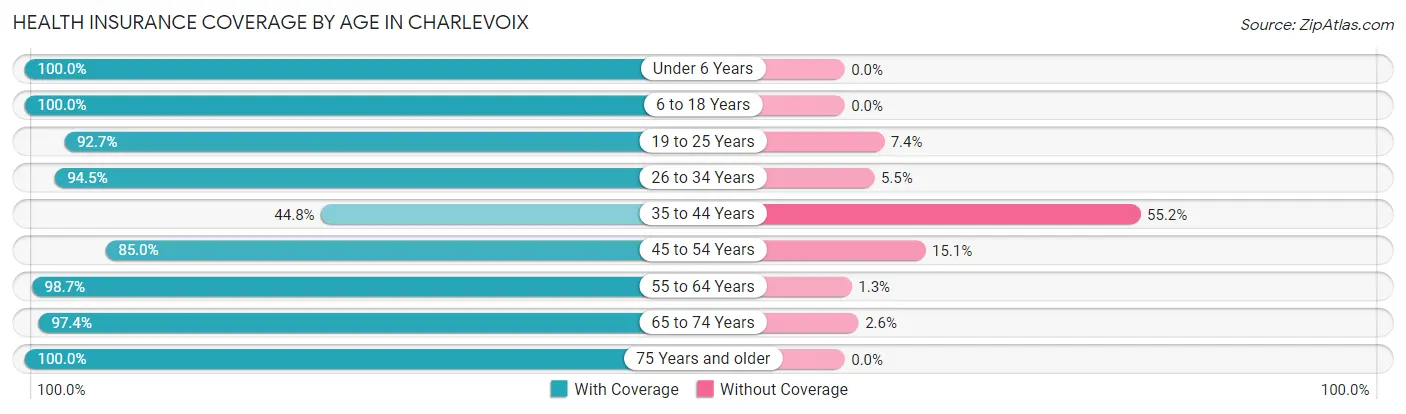
| Age Bracket | With Coverage | Without Coverage |
| Under 6 Years | 137 (100.0%) | 0 (0.0%) |
| 6 to 18 Years | 337 (100.0%) | 0 (0.0%) |
| 19 to 25 Years | 252 (92.6%) | 20 (7.3%) |
| 26 to 34 Years | 188 (94.5%) | 11 (5.5%) |
| 35 to 44 Years | 113 (44.8%) | 139 (55.2%) |
| 45 to 54 Years | 158 (85.0%) | 28 (15.0%) |
| 55 to 64 Years | 374 (98.7%) | 5 (1.3%) |
| 65 to 74 Years | 337 (97.4%) | 9 (2.6%) |
| 75 Years and older | 293 (100.0%) | 0 (0.0%) |
| Total | 2,189 (91.2%) | 212 (8.8%) |
Health Insurance Coverage by Citizenship Status in Charlevoix
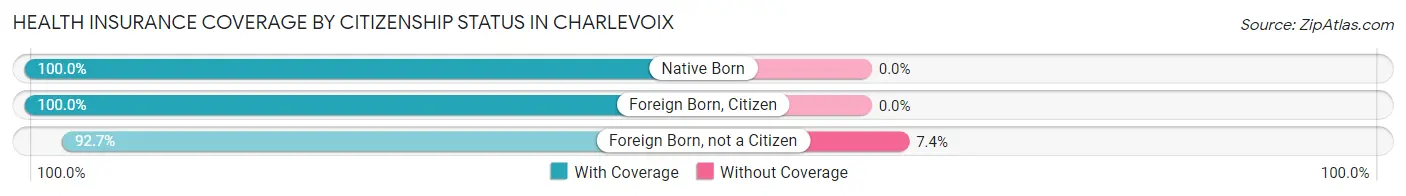
| Citizenship Status | With Coverage | Without Coverage |
| Native Born | 137 (100.0%) | 0 (0.0%) |
| Foreign Born, Citizen | 337 (100.0%) | 0 (0.0%) |
| Foreign Born, not a Citizen | 252 (92.6%) | 20 (7.3%) |
Health Insurance Coverage by Household Income in Charlevoix
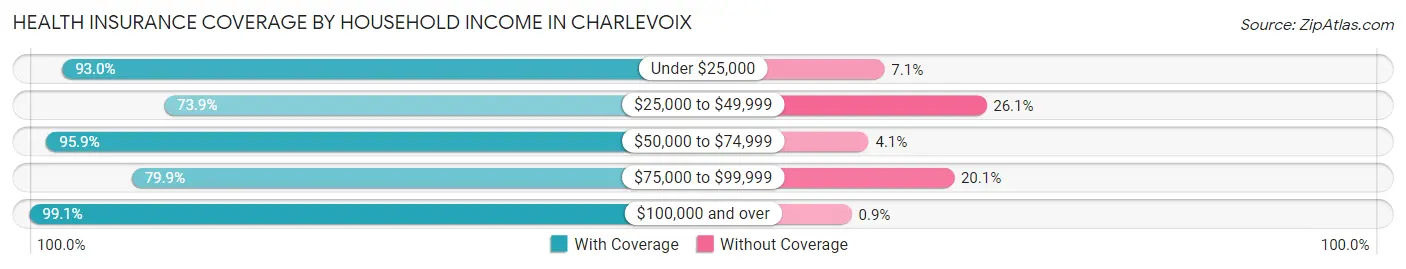
| Household Income | With Coverage | Without Coverage |
| Under $25,000 | 857 (92.9%) | 65 (7.0%) |
| $25,000 to $49,999 | 212 (73.9%) | 75 (26.1%) |
| $50,000 to $74,999 | 354 (95.9%) | 15 (4.1%) |
| $75,000 to $99,999 | 207 (79.9%) | 52 (20.1%) |
| $100,000 and over | 552 (99.1%) | 5 (0.9%) |
Public vs Private Health Insurance Coverage by Age in Charlevoix
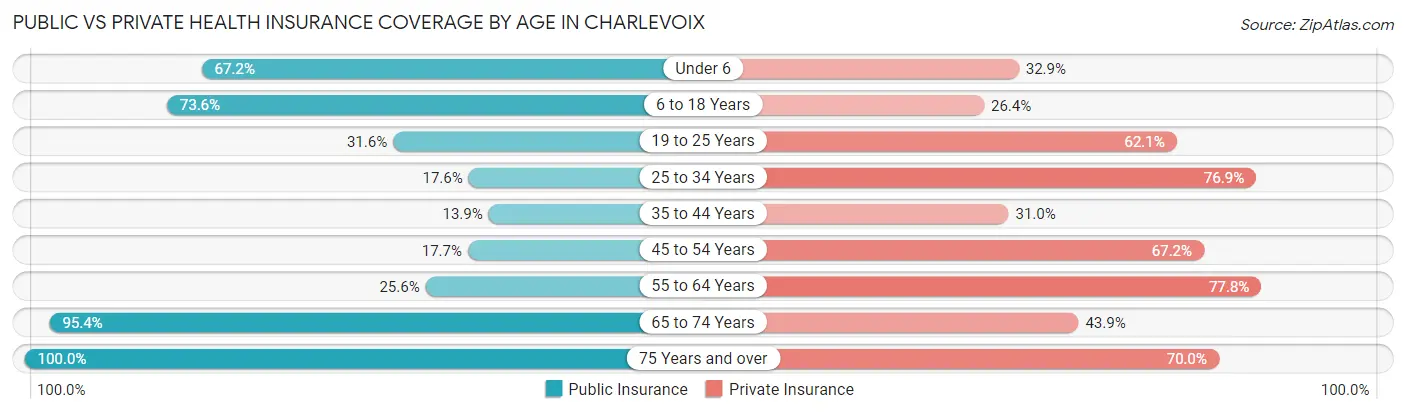
| Age Bracket | Public Insurance | Private Insurance |
| Under 6 | 92 (67.1%) | 45 (32.9%) |
| 6 to 18 Years | 248 (73.6%) | 89 (26.4%) |
| 19 to 25 Years | 86 (31.6%) | 169 (62.1%) |
| 25 to 34 Years | 35 (17.6%) | 153 (76.9%) |
| 35 to 44 Years | 35 (13.9%) | 78 (30.9%) |
| 45 to 54 Years | 33 (17.7%) | 125 (67.2%) |
| 55 to 64 Years | 97 (25.6%) | 295 (77.8%) |
| 65 to 74 Years | 330 (95.4%) | 152 (43.9%) |
| 75 Years and over | 293 (100.0%) | 205 (70.0%) |
| Total | 1,249 (52.0%) | 1,311 (54.6%) |
Disability Status by Sex by Age in Charlevoix
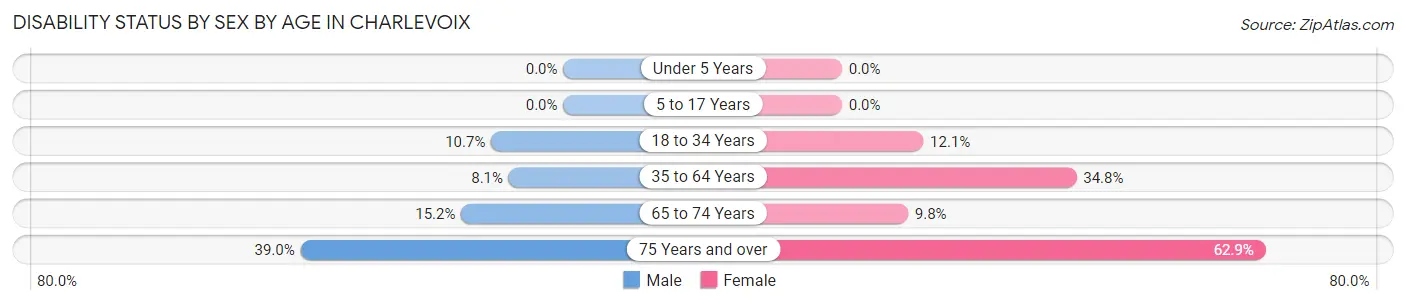
| Age Bracket | Male | Female |
| Under 5 Years | 0 (0.0%) | 0 (0.0%) |
| 5 to 17 Years | 0 (0.0%) | 0 (0.0%) |
| 18 to 34 Years | 21 (10.7%) | 40 (12.1%) |
| 35 to 64 Years | 28 (8.1%) | 164 (34.8%) |
| 65 to 74 Years | 20 (15.1%) | 21 (9.8%) |
| 75 Years and over | 48 (39.0%) | 107 (62.9%) |
Disability Class by Sex by Age in Charlevoix
Disability Class: Hearing Difficulty
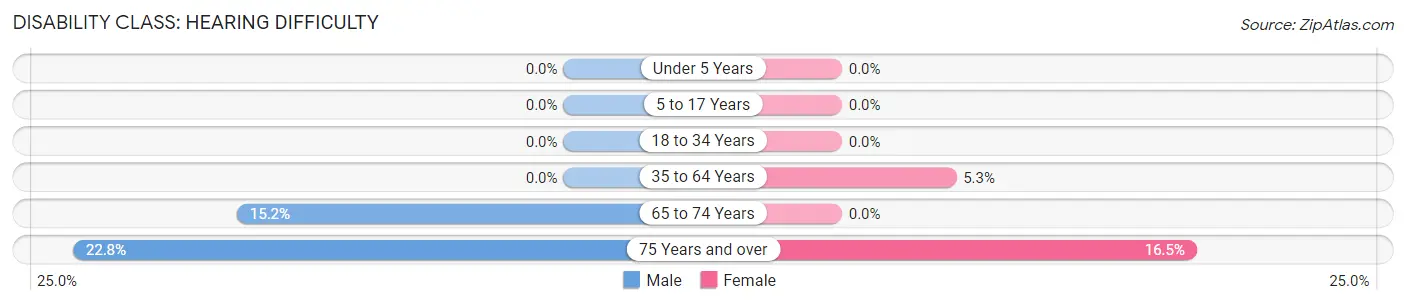
| Age Bracket | Male | Female |
| Under 5 Years | 0 (0.0%) | 0 (0.0%) |
| 5 to 17 Years | 0 (0.0%) | 0 (0.0%) |
| 18 to 34 Years | 0 (0.0%) | 0 (0.0%) |
| 35 to 64 Years | 0 (0.0%) | 25 (5.3%) |
| 65 to 74 Years | 20 (15.1%) | 0 (0.0%) |
| 75 Years and over | 28 (22.8%) | 28 (16.5%) |
Disability Class: Vision Difficulty
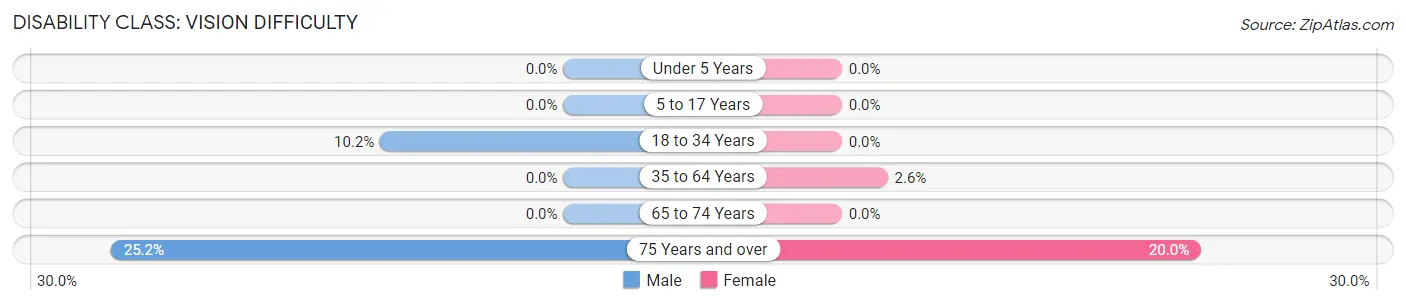
| Age Bracket | Male | Female |
| Under 5 Years | 0 (0.0%) | 0 (0.0%) |
| 5 to 17 Years | 0 (0.0%) | 0 (0.0%) |
| 18 to 34 Years | 20 (10.2%) | 0 (0.0%) |
| 35 to 64 Years | 0 (0.0%) | 12 (2.5%) |
| 65 to 74 Years | 0 (0.0%) | 0 (0.0%) |
| 75 Years and over | 31 (25.2%) | 34 (20.0%) |
Disability Class: Cognitive Difficulty
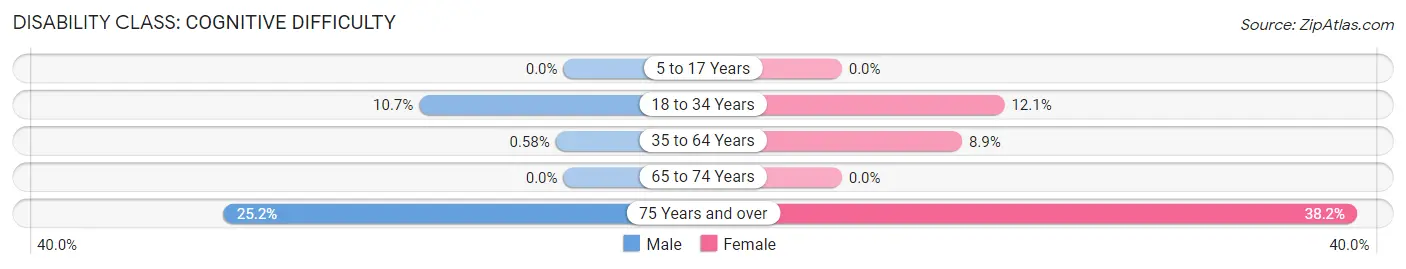
| Age Bracket | Male | Female |
| 5 to 17 Years | 0 (0.0%) | 0 (0.0%) |
| 18 to 34 Years | 21 (10.7%) | 40 (12.1%) |
| 35 to 64 Years | 2 (0.6%) | 42 (8.9%) |
| 65 to 74 Years | 0 (0.0%) | 0 (0.0%) |
| 75 Years and over | 31 (25.2%) | 65 (38.2%) |
Disability Class: Ambulatory Difficulty
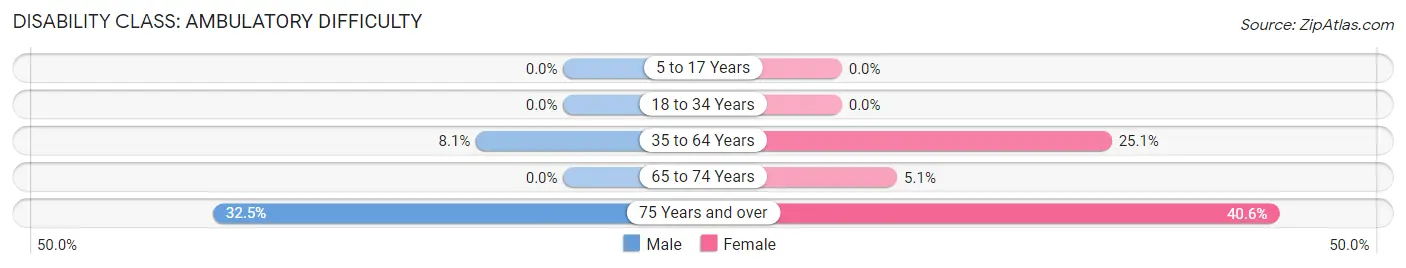
| Age Bracket | Male | Female |
| 5 to 17 Years | 0 (0.0%) | 0 (0.0%) |
| 18 to 34 Years | 0 (0.0%) | 0 (0.0%) |
| 35 to 64 Years | 28 (8.1%) | 118 (25.1%) |
| 65 to 74 Years | 0 (0.0%) | 11 (5.1%) |
| 75 Years and over | 40 (32.5%) | 69 (40.6%) |
Disability Class: Self-Care Difficulty
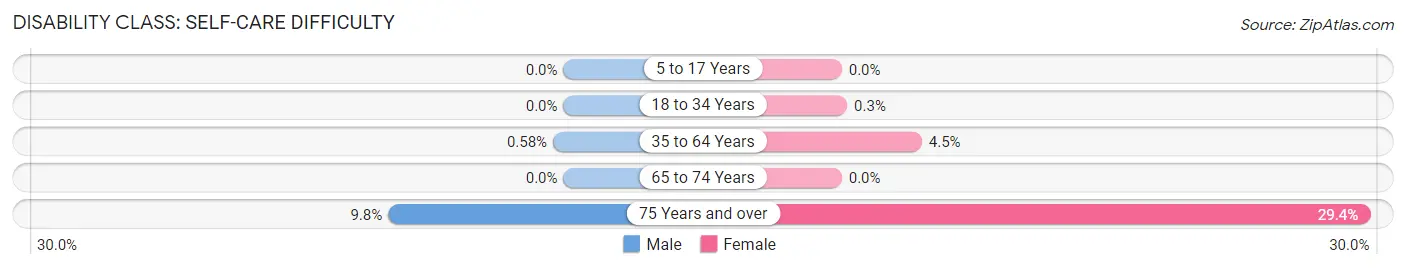
| Age Bracket | Male | Female |
| 5 to 17 Years | 0 (0.0%) | 0 (0.0%) |
| 18 to 34 Years | 0 (0.0%) | 1 (0.3%) |
| 35 to 64 Years | 2 (0.6%) | 21 (4.5%) |
| 65 to 74 Years | 0 (0.0%) | 0 (0.0%) |
| 75 Years and over | 12 (9.8%) | 50 (29.4%) |
Technology Access in Charlevoix
Computing Device Access in Charlevoix
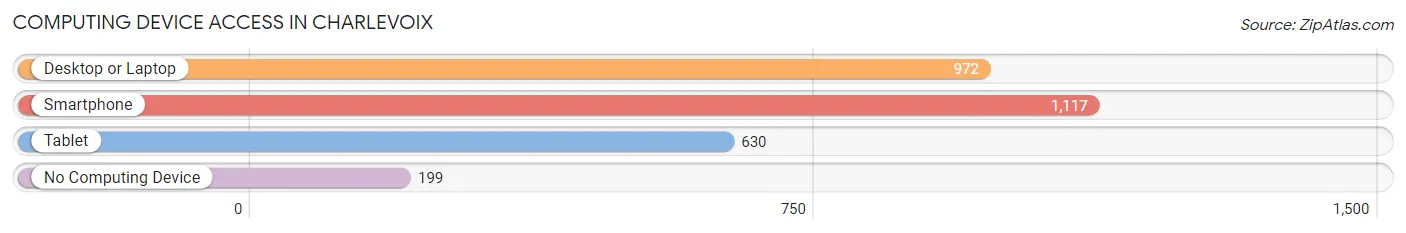
| Device Type | # Households | % Households |
| Desktop or Laptop | 972 | 68.9% |
| Smartphone | 1,117 | 79.2% |
| Tablet | 630 | 44.7% |
| No Computing Device | 199 | 14.1% |
| Total | 1,410 | 100.0% |
Internet Access in Charlevoix
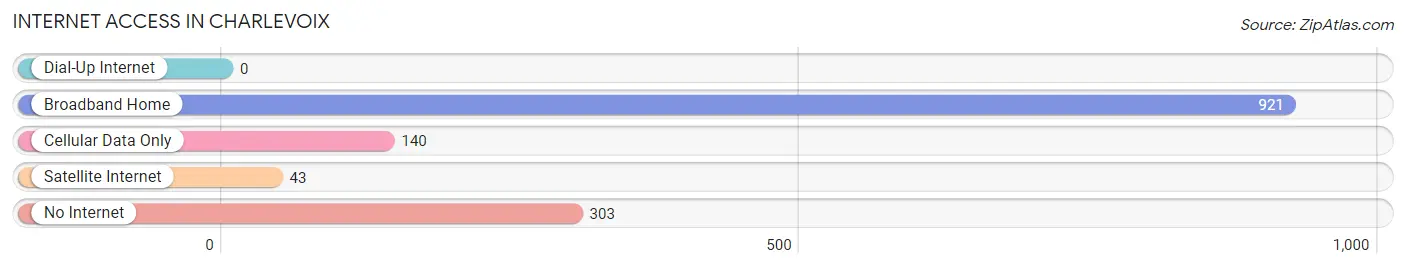
| Internet Type | # Households | % Households |
| Dial-Up Internet | 0 | 0.0% |
| Broadband Home | 921 | 65.3% |
| Cellular Data Only | 140 | 9.9% |
| Satellite Internet | 43 | 3.0% |
| No Internet | 303 | 21.5% |
| Total | 1,410 | 100.0% |
Charlevoix Summary
Charlevoix is a city located in the U.S. state of Michigan. It is situated in Charlevoix County, on the shores of Lake Charlevoix and Lake Michigan. The city is located about 40 miles northeast of Traverse City and about 130 miles northwest of Detroit. The population of Charlevoix was 2,513 at the 2010 census.
History
The area that is now Charlevoix was first inhabited by the Ottawa and Chippewa Native American tribes. The first European settlers arrived in the area in the early 1800s. The city was founded in 1871 by William A. Fisher, who named it after the nearby lake. The city was incorporated in 1879.
In the late 19th century, Charlevoix became a popular summer resort destination for wealthy families from Detroit and other cities. The city was known for its grand hotels, such as the Hotel Charlevoix, which was built in 1891. The city also became a popular destination for fishing and boating.
Geography
Charlevoix is located at 45°21'N 85°20'W (45.35, -85.33). According to the United States Census Bureau, the city has a total area of 2.2 square miles (5.7 km2), of which 1.9 square miles (4.9 km2) is land and 0.3 square miles (0.8 km2) is water.
The city is situated on the shores of Lake Charlevoix and Lake Michigan. The city is surrounded by rolling hills and forests. The nearby Round Lake is also popular for fishing and boating.
Economy
The economy of Charlevoix is largely based on tourism. The city is a popular summer destination for visitors from Michigan and other states. The city is also home to several marinas, which provide services for boaters and fishermen.
The city is also home to several manufacturing companies, including Charlevoix Tool & Die, which produces automotive parts. The city is also home to several retail stores, restaurants, and other businesses.
Demographics
As of the 2010 census, there were 2,513 people, 1,093 households, and 645 families residing in the city. The population density was 1,323.3 people per square mile (509.7/km2). There were 1,231 housing units at an average density of 645.3 per square mile (249.3/km2). The racial makeup of the city was 97.2% White, 0.4% African American, 0.4% Native American, 0.4% Asian, 0.2% from other races, and 1.4% from two or more races. Hispanic or Latino of any race were 1.2% of the population.
There were 1,093 households, out of which 24.2% had children under the age of 18 living with them, 46.2% were married couples living together, 10.2% had a female householder with no husband present, and 39.3% were non-families. 33.2% of all households were made up of individuals, and 15.2% had someone living alone who was 65 years of age or older. The average household size was 2.25 and the average family size was 2.86.
In the city, the population was spread out, with 22.2% under the age of 18, 6.7% from 18 to 24, 24.2% from 25 to 44, 27.2% from 45 to 64, and 19.7% who were 65 years of age or older. The median age was 42 years. For every 100 females, there were 91.2 males. For every 100 females age 18 and over, there were 87.2 males.
The median income for a household in the city was $37,917, and the median income for a family was $48,750. Males had a median income of $35,000 versus $25,000 for females. The per capita income for the city was $21,945. About 6.2% of families and 9.2% of the population were below the poverty line, including 11.2% of those under age 18 and 8.2% of those age 65 or over.
Common Questions
What is Per Capita Income in Charlevoix?
Per Capita income in Charlevoix is $44,563.
What is the Median Family Income in Charlevoix?
Median Family Income in Charlevoix is $70,481.
What is the Median Household income in Charlevoix?
Median Household Income in Charlevoix is $30,114.
What is Income or Wage Gap in Charlevoix?
Income or Wage Gap in Charlevoix is 31.2%.
Women in Charlevoix earn 68.8 cents for every dollar earned by a man.
What is Inequality or Gini Index in Charlevoix?
Inequality or Gini Index in Charlevoix is 0.60.
What is the Total Population of Charlevoix?
Total Population of Charlevoix is 2,474.
What is the Total Male Population of Charlevoix?
Total Male Population of Charlevoix is 1,052.
What is the Total Female Population of Charlevoix?
Total Female Population of Charlevoix is 1,422.
What is the Ratio of Males per 100 Females in Charlevoix?
There are 73.98 Males per 100 Females in Charlevoix.
What is the Ratio of Females per 100 Males in Charlevoix?
There are 135.17 Females per 100 Males in Charlevoix.
What is the Median Population Age in Charlevoix?
Median Population Age in Charlevoix is 44.7 Years.
What is the Average Family Size in Charlevoix
Average Family Size in Charlevoix is 2.5 People.
What is the Average Household Size in Charlevoix
Average Household Size in Charlevoix is 1.7 People.
How Large is the Labor Force in Charlevoix?
There are 1,233 People in the Labor Forcein in Charlevoix.
What is the Percentage of People in the Labor Force in Charlevoix?
59.4% of People are in the Labor Force in Charlevoix.
What is the Unemployment Rate in Charlevoix?
Unemployment Rate in Charlevoix is 4.7%.