Cadillac, MI Map & Demographics
Cadillac Map
Cadillac Overview
$24,218
PER CAPITA INCOME
$61,029
AVG FAMILY INCOME
$45,123
AVG HOUSEHOLD INCOME
22.7%
WAGE / INCOME GAP [ % ]
77.3¢/ $1
WAGE / INCOME GAP [ $ ]
0.42
INEQUALITY / GINI INDEX
10,400
TOTAL POPULATION
5,284
MALE POPULATION
5,116
FEMALE POPULATION
103.28
MALES / 100 FEMALES
96.82
FEMALES / 100 MALES
39.9
MEDIAN AGE
3.0
AVG FAMILY SIZE
2.3
AVG HOUSEHOLD SIZE
4,562
LABOR FORCE [ PEOPLE ]
55.4%
PERCENT IN LABOR FORCE
7.0%
UNEMPLOYMENT RATE
Cadillac Zip Codes
Cadillac Area Codes
Income in Cadillac
Income Overview in Cadillac
Per Capita Income in Cadillac is $24,218, while median incomes of families and households are $61,029 and $45,123 respectively.
| Characteristic | Number | Measure |
| Per Capita Income | 10,400 | $24,218 |
| Median Family Income | 2,342 | $61,029 |
| Mean Family Income | 2,342 | $70,498 |
| Median Household Income | 4,391 | $45,123 |
| Mean Household Income | 4,391 | $55,650 |
| Income Deficit | 2,342 | $0 |
| Wage / Income Gap (%) | 10,400 | 22.74% |
| Wage / Income Gap ($) | 10,400 | 77.26¢ per $1 |
| Gini / Inequality Index | 10,400 | 0.42 |
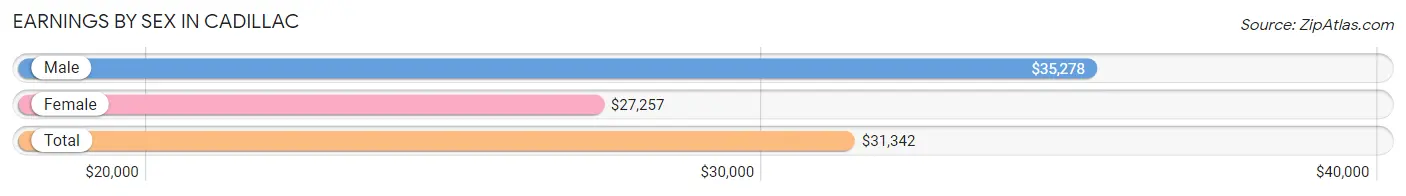
Earnings by Sex in Cadillac
Average Earnings in Cadillac are $31,342, $35,278 for men and $27,257 for women, a difference of 22.7%.
| Sex | Number | Average Earnings |
| Male | 2,508 (52.4%) | $35,278 |
| Female | 2,275 (47.6%) | $27,257 |
| Total | 4,783 (100.0%) | $31,342 |
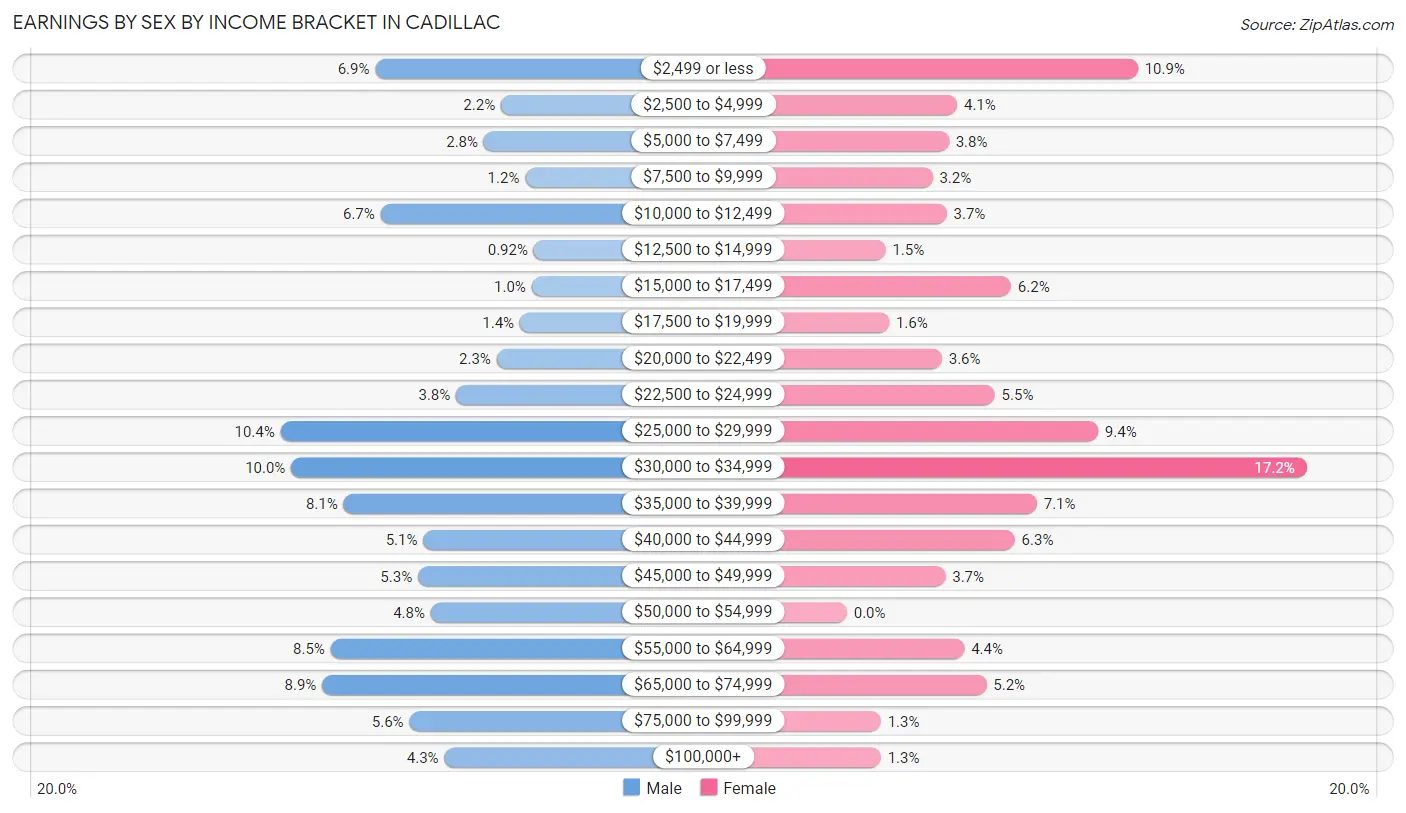
Earnings by Sex by Income Bracket in Cadillac
The most common earnings brackets in Cadillac are $25,000 to $29,999 for men (261 | 10.4%) and $30,000 to $34,999 for women (392 | 17.2%).
| Income | Male | Female |
| $2,499 or less | 172 (6.9%) | 248 (10.9%) |
| $2,500 to $4,999 | 54 (2.1%) | 94 (4.1%) |
| $5,000 to $7,499 | 70 (2.8%) | 87 (3.8%) |
| $7,500 to $9,999 | 31 (1.2%) | 73 (3.2%) |
| $10,000 to $12,499 | 167 (6.7%) | 85 (3.7%) |
| $12,500 to $14,999 | 23 (0.9%) | 33 (1.5%) |
| $15,000 to $17,499 | 25 (1.0%) | 140 (6.1%) |
| $17,500 to $19,999 | 36 (1.4%) | 36 (1.6%) |
| $20,000 to $22,499 | 58 (2.3%) | 81 (3.6%) |
| $22,500 to $24,999 | 96 (3.8%) | 126 (5.5%) |
| $25,000 to $29,999 | 261 (10.4%) | 214 (9.4%) |
| $30,000 to $34,999 | 251 (10.0%) | 392 (17.2%) |
| $35,000 to $39,999 | 202 (8.1%) | 162 (7.1%) |
| $40,000 to $44,999 | 127 (5.1%) | 143 (6.3%) |
| $45,000 to $49,999 | 132 (5.3%) | 84 (3.7%) |
| $50,000 to $54,999 | 120 (4.8%) | 0 (0.0%) |
| $55,000 to $64,999 | 214 (8.5%) | 100 (4.4%) |
| $65,000 to $74,999 | 222 (8.8%) | 119 (5.2%) |
| $75,000 to $99,999 | 140 (5.6%) | 29 (1.3%) |
| $100,000+ | 107 (4.3%) | 29 (1.3%) |
| Total | 2,508 (100.0%) | 2,275 (100.0%) |
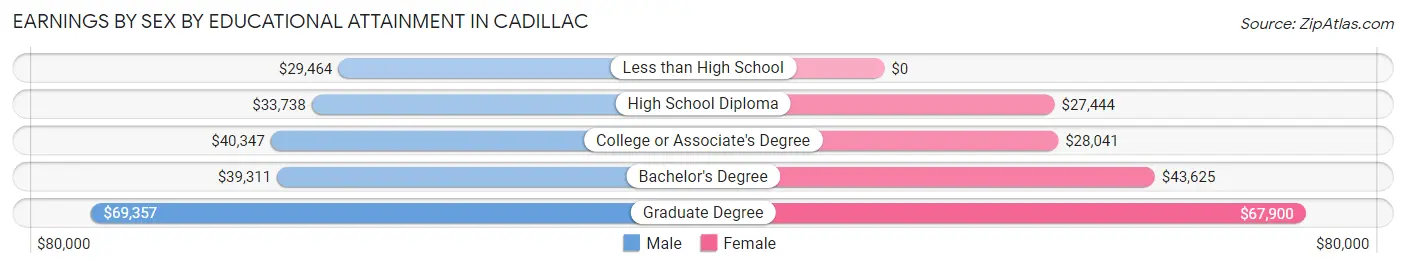
Earnings by Sex by Educational Attainment in Cadillac
Average earnings in Cadillac are $37,958 for men and $30,356 for women, a difference of 20.0%. Men with an educational attainment of graduate degree enjoy the highest average annual earnings of $69,357, while those with less than high school education earn the least with $29,464. Women with an educational attainment of graduate degree earn the most with the average annual earnings of $67,900, while those with high school diploma education have the smallest earnings of $27,444.
| Educational Attainment | Male Income | Female Income |
| Less than High School | $29,464 | $0 |
| High School Diploma | $33,738 | $27,444 |
| College or Associate's Degree | $40,347 | $28,041 |
| Bachelor's Degree | $39,311 | $43,625 |
| Graduate Degree | $69,357 | $67,900 |
| Total | $37,958 | $30,356 |
Family Income in Cadillac
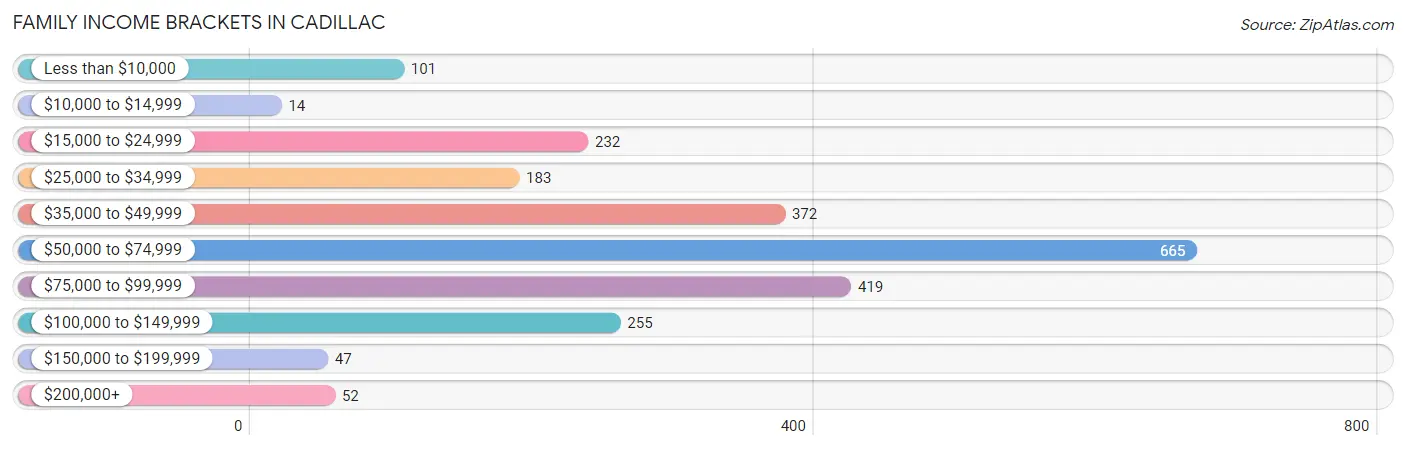
Family Income Brackets in Cadillac
According to the Cadillac family income data, there are 665 families falling into the $50,000 to $74,999 income range, which is the most common income bracket and makes up 28.4% of all families. Conversely, the $10,000 to $14,999 income bracket is the least frequent group with only 14 families (0.6%) belonging to this category.
| Income Bracket | # Families | % Families |
| Less than $10,000 | 101 | 4.3% |
| $10,000 to $14,999 | 14 | 0.6% |
| $15,000 to $24,999 | 232 | 9.9% |
| $25,000 to $34,999 | 183 | 7.8% |
| $35,000 to $49,999 | 372 | 15.9% |
| $50,000 to $74,999 | 665 | 28.4% |
| $75,000 to $99,999 | 419 | 17.9% |
| $100,000 to $149,999 | 255 | 10.9% |
| $150,000 to $199,999 | 47 | 2.0% |
| $200,000+ | 52 | 2.2% |
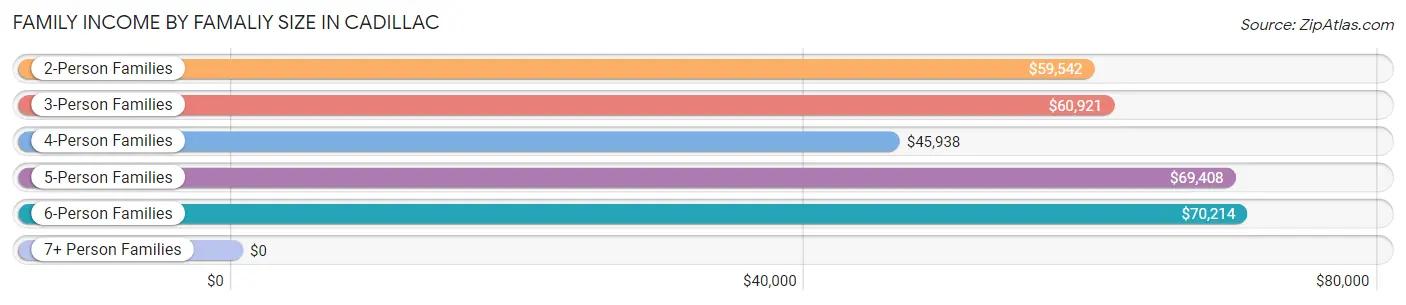
Family Income by Famaliy Size in Cadillac
6-person families (100 | 4.3%) account for the highest median family income in Cadillac with $70,214 per family, while 2-person families (1,302 | 55.6%) have the highest median income of $29,771 per family member.
| Income Bracket | # Families | Median Income |
| 2-Person Families | 1,302 (55.6%) | $59,542 |
| 3-Person Families | 422 (18.0%) | $60,921 |
| 4-Person Families | 356 (15.2%) | $45,938 |
| 5-Person Families | 96 (4.1%) | $69,408 |
| 6-Person Families | 100 (4.3%) | $70,214 |
| 7+ Person Families | 66 (2.8%) | $0 |
| Total | 2,342 (100.0%) | $61,029 |
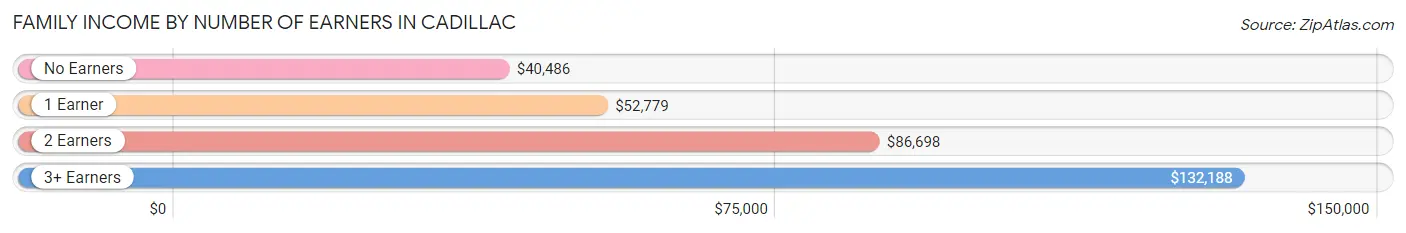
Family Income by Number of Earners in Cadillac
The median family income in Cadillac is $61,029, with families comprising 3+ earners (111) having the highest median family income of $132,188, while families with no earners (521) have the lowest median family income of $40,486, accounting for 4.7% and 22.3% of families, respectively.
| Number of Earners | # Families | Median Income |
| No Earners | 521 (22.3%) | $40,486 |
| 1 Earner | 969 (41.4%) | $52,779 |
| 2 Earners | 741 (31.6%) | $86,698 |
| 3+ Earners | 111 (4.7%) | $132,188 |
| Total | 2,342 (100.0%) | $61,029 |
Household Income in Cadillac
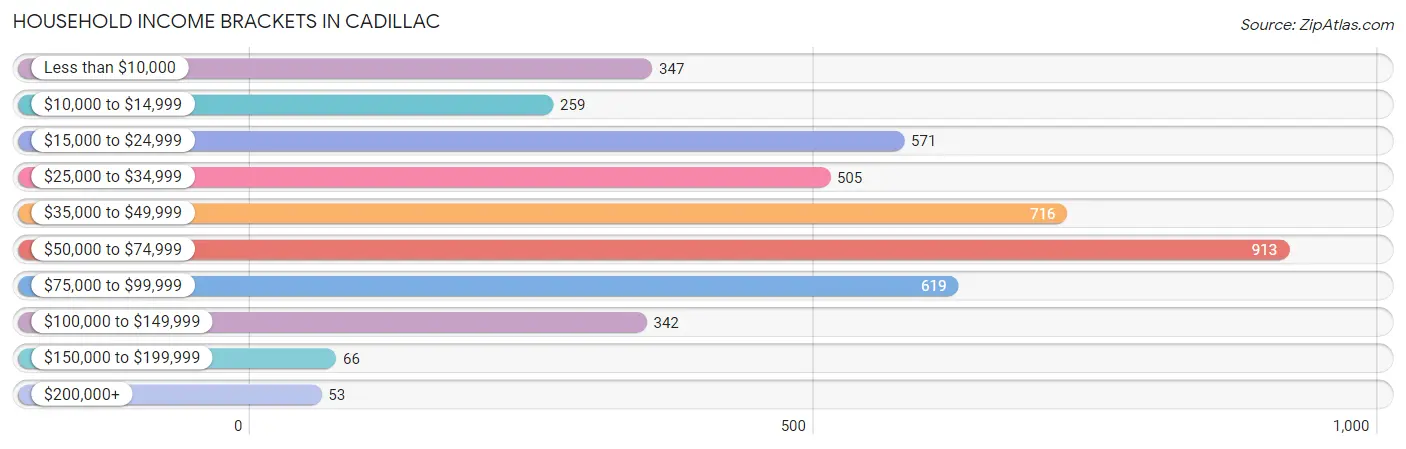
Household Income Brackets in Cadillac
With 913 households falling in the category, the $50,000 to $74,999 income range is the most frequent in Cadillac, accounting for 20.8% of all households. In contrast, only 53 households (1.2%) fall into the $200,000+ income bracket, making it the least populous group.
| Income Bracket | # Households | % Households |
| Less than $10,000 | 347 | 7.9% |
| $10,000 to $14,999 | 259 | 5.9% |
| $15,000 to $24,999 | 571 | 13.0% |
| $25,000 to $34,999 | 505 | 11.5% |
| $35,000 to $49,999 | 716 | 16.3% |
| $50,000 to $74,999 | 913 | 20.8% |
| $75,000 to $99,999 | 619 | 14.1% |
| $100,000 to $149,999 | 342 | 7.8% |
| $150,000 to $199,999 | 66 | 1.5% |
| $200,000+ | 53 | 1.2% |
Household Income by Householder Age in Cadillac
The median household income in Cadillac is $45,123, with the highest median household income of $65,089 found in the 25 to 44 years age bracket for the primary householder. A total of 1,202 households (27.4%) fall into this category. Meanwhile, the 15 to 24 years age bracket for the primary householder has the lowest median household income of $33,125, with 297 households (6.8%) in this group.
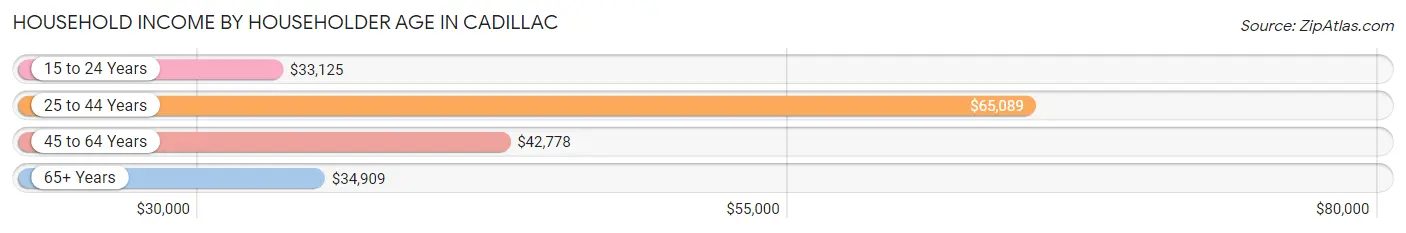
| Income Bracket | # Households | Median Income |
| 15 to 24 Years | 297 (6.8%) | $33,125 |
| 25 to 44 Years | 1,202 (27.4%) | $65,089 |
| 45 to 64 Years | 1,384 (31.5%) | $42,778 |
| 65+ Years | 1,508 (34.3%) | $34,909 |
| Total | 4,391 (100.0%) | $45,123 |
Poverty in Cadillac
Income Below Poverty by Sex and Age in Cadillac
With 17.7% poverty level for males and 21.6% for females among the residents of Cadillac, 55 to 64 year old males and 15 year old females are the most vulnerable to poverty, with 170 males (24.3%) and 110 females (93.2%) in their respective age groups living below the poverty level.
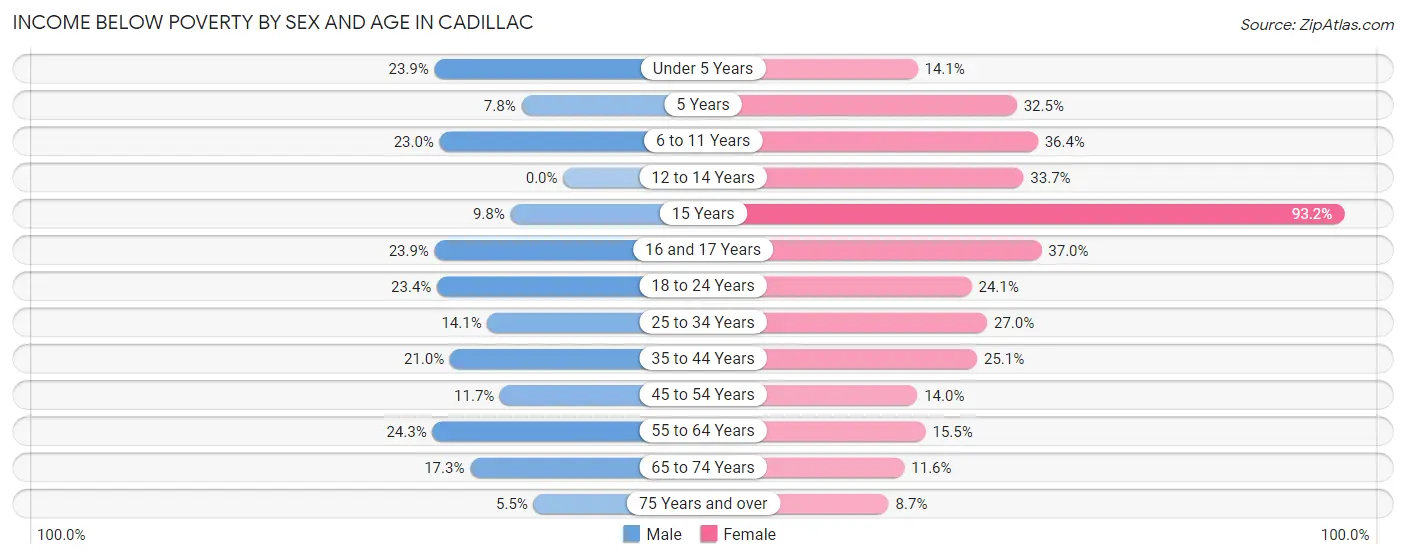
| Age Bracket | Male | Female |
| Under 5 Years | 77 (23.9%) | 36 (14.1%) |
| 5 Years | 8 (7.8%) | 25 (32.5%) |
| 6 to 11 Years | 134 (23.0%) | 112 (36.4%) |
| 12 to 14 Years | 0 (0.0%) | 60 (33.7%) |
| 15 Years | 5 (9.8%) | 110 (93.2%) |
| 16 and 17 Years | 16 (23.9%) | 10 (37.0%) |
| 18 to 24 Years | 74 (23.4%) | 98 (24.1%) |
| 25 to 34 Years | 110 (14.1%) | 210 (27.0%) |
| 35 to 44 Years | 135 (21.0%) | 130 (25.1%) |
| 45 to 54 Years | 63 (11.7%) | 84 (14.0%) |
| 55 to 64 Years | 170 (24.3%) | 92 (15.5%) |
| 65 to 74 Years | 85 (17.3%) | 75 (11.6%) |
| 75 Years and over | 25 (5.5%) | 45 (8.7%) |
| Total | 902 (17.7%) | 1,087 (21.6%) |
Income Above Poverty by Sex and Age in Cadillac
According to the poverty statistics in Cadillac, males aged 12 to 14 years and females aged 75 years and over are the age groups that are most secure financially, with 100.0% of males and 91.3% of females in these age groups living above the poverty line.
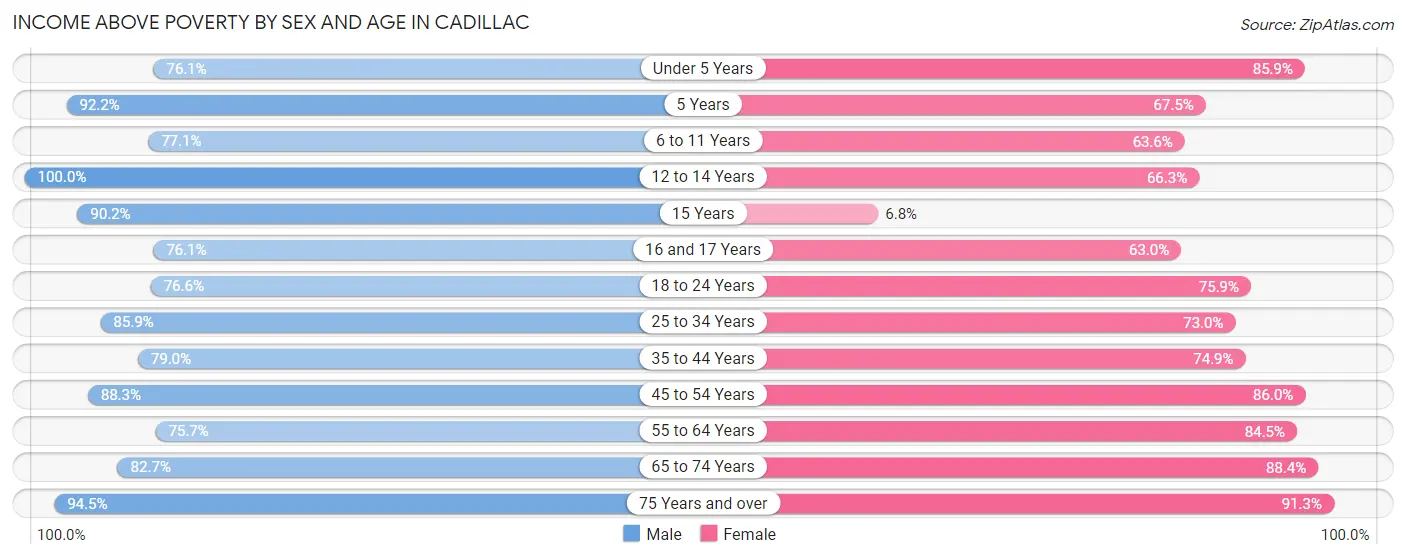
| Age Bracket | Male | Female |
| Under 5 Years | 245 (76.1%) | 220 (85.9%) |
| 5 Years | 95 (92.2%) | 52 (67.5%) |
| 6 to 11 Years | 450 (77.0%) | 196 (63.6%) |
| 12 to 14 Years | 42 (100.0%) | 118 (66.3%) |
| 15 Years | 46 (90.2%) | 8 (6.8%) |
| 16 and 17 Years | 51 (76.1%) | 17 (63.0%) |
| 18 to 24 Years | 242 (76.6%) | 309 (75.9%) |
| 25 to 34 Years | 671 (85.9%) | 569 (73.0%) |
| 35 to 44 Years | 507 (79.0%) | 388 (74.9%) |
| 45 to 54 Years | 474 (88.3%) | 516 (86.0%) |
| 55 to 64 Years | 530 (75.7%) | 500 (84.5%) |
| 65 to 74 Years | 407 (82.7%) | 571 (88.4%) |
| 75 Years and over | 429 (94.5%) | 472 (91.3%) |
| Total | 4,189 (82.3%) | 3,936 (78.4%) |
Income Below Poverty Among Married-Couple Families in Cadillac
The poverty statistics for married-couple families in Cadillac show that 2.5% or 40 of the total 1,599 families live below the poverty line. Families with 3 or 4 children have the highest poverty rate of 9.8%, comprising of 17 families. On the other hand, families with 5 or more children have the lowest poverty rate of 0.0%, which includes 0 families.
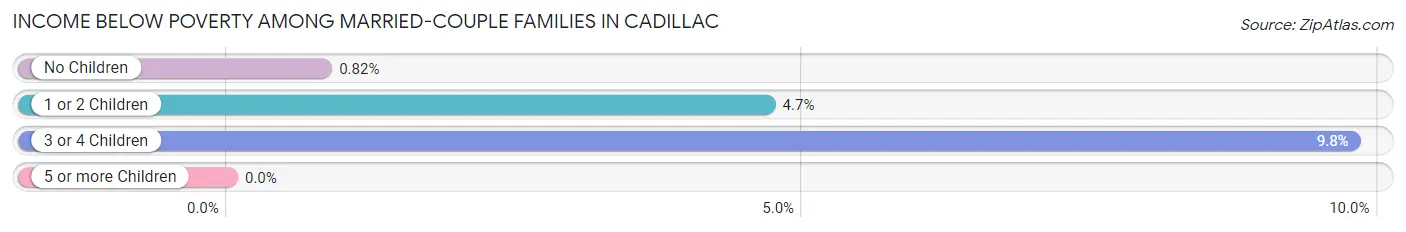
| Children | Above Poverty | Below Poverty |
| No Children | 1,089 (99.2%) | 9 (0.8%) |
| 1 or 2 Children | 285 (95.3%) | 14 (4.7%) |
| 3 or 4 Children | 157 (90.2%) | 17 (9.8%) |
| 5 or more Children | 28 (100.0%) | 0 (0.0%) |
| Total | 1,559 (97.5%) | 40 (2.5%) |
Income Below Poverty Among Single-Parent Households in Cadillac
According to the poverty data in Cadillac, 17.5% or 42 single-father households and 37.4% or 188 single-mother households are living below the poverty line. Among single-father households, those with 3 or 4 children have the highest poverty rate, with 27 households (58.7%) experiencing poverty. Likewise, among single-mother households, those with 3 or 4 children have the highest poverty rate, with 88 households (100.0%) falling below the poverty line.
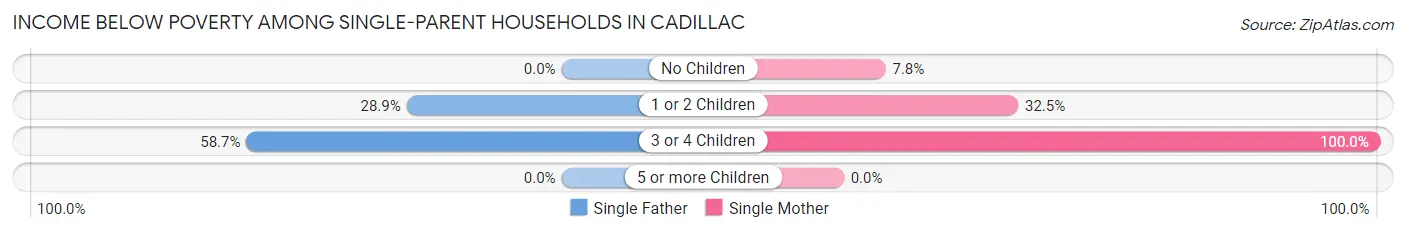
| Children | Single Father | Single Mother |
| No Children | 0 (0.0%) | 11 (7.8%) |
| 1 or 2 Children | 15 (28.8%) | 89 (32.5%) |
| 3 or 4 Children | 27 (58.7%) | 88 (100.0%) |
| 5 or more Children | 0 (0.0%) | 0 (0.0%) |
| Total | 42 (17.5%) | 188 (37.4%) |
Income Below Poverty Among Married-Couple vs Single-Parent Households in Cadillac
The poverty data for Cadillac shows that 40 of the married-couple family households (2.5%) and 230 of the single-parent households (31.0%) are living below the poverty level. Within the married-couple family households, those with 3 or 4 children have the highest poverty rate, with 17 households (9.8%) falling below the poverty line. Among the single-parent households, those with 3 or 4 children have the highest poverty rate, with 115 household (85.8%) living below poverty.
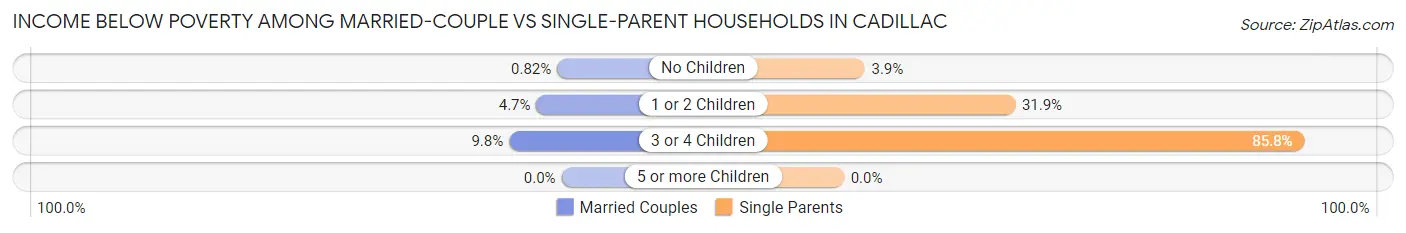
| Children | Married-Couple Families | Single-Parent Households |
| No Children | 9 (0.8%) | 11 (3.9%) |
| 1 or 2 Children | 14 (4.7%) | 104 (31.9%) |
| 3 or 4 Children | 17 (9.8%) | 115 (85.8%) |
| 5 or more Children | 0 (0.0%) | 0 (0.0%) |
| Total | 40 (2.5%) | 230 (31.0%) |
Race in Cadillac
The most populous races in Cadillac are White / Caucasian (9,697 | 93.2%), Two or more Races (306 | 2.9%), and Black / African American (242 | 2.3%).
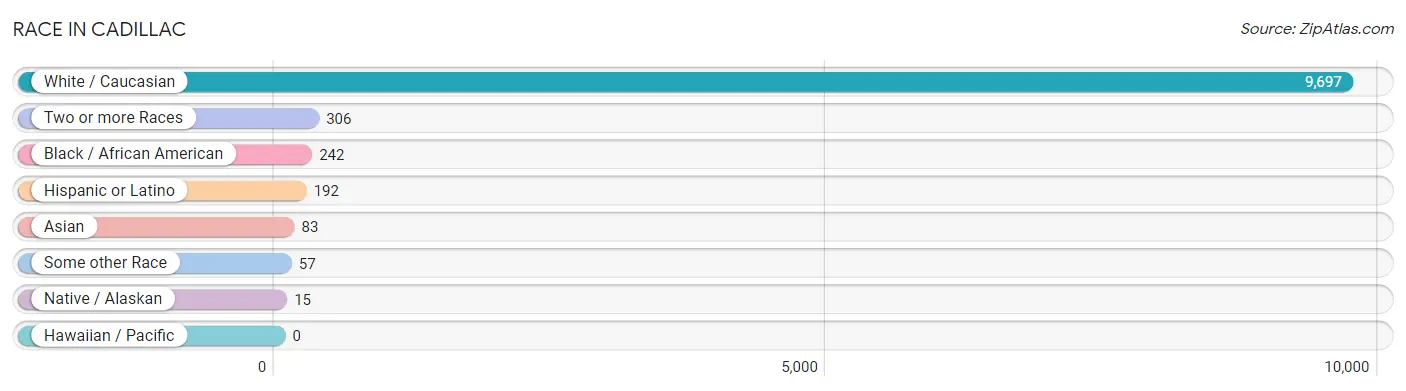
| Race | # Population | % Population |
| Asian | 83 | 0.8% |
| Black / African American | 242 | 2.3% |
| Hawaiian / Pacific | 0 | 0.0% |
| Hispanic or Latino | 192 | 1.8% |
| Native / Alaskan | 15 | 0.1% |
| White / Caucasian | 9,697 | 93.2% |
| Two or more Races | 306 | 2.9% |
| Some other Race | 57 | 0.5% |
| Total | 10,400 | 100.0% |
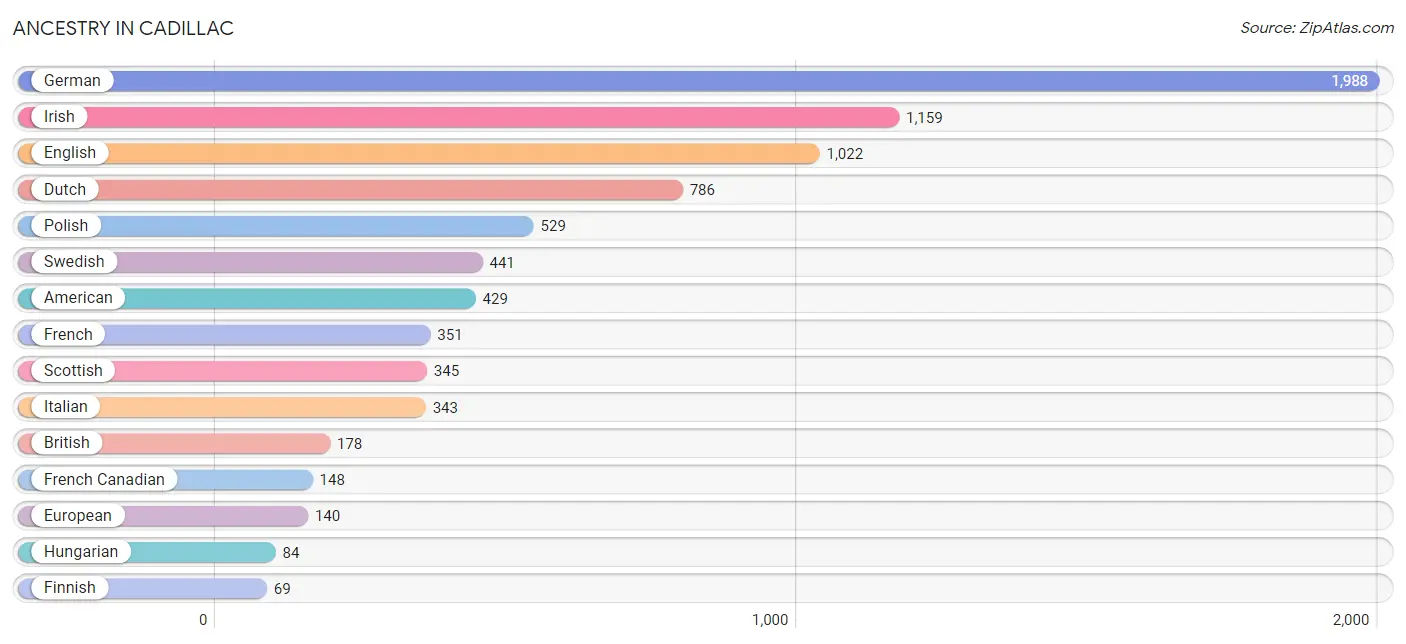
Ancestry in Cadillac
The most populous ancestries reported in Cadillac are German (1,988 | 19.1%), Irish (1,159 | 11.1%), English (1,022 | 9.8%), Dutch (786 | 7.6%), and Polish (529 | 5.1%), together accounting for 52.7% of all Cadillac residents.
| Ancestry | # Population | % Population |
| African | 3 | 0.0% |
| Alaska Native | 28 | 0.3% |
| American | 429 | 4.1% |
| Austrian | 8 | 0.1% |
| Belgian | 11 | 0.1% |
| British | 178 | 1.7% |
| Cajun | 10 | 0.1% |
| Canadian | 53 | 0.5% |
| Central American | 53 | 0.5% |
| Cherokee | 17 | 0.2% |
| Comanche | 4 | 0.0% |
| Czech | 62 | 0.6% |
| Danish | 12 | 0.1% |
| Dominican | 25 | 0.2% |
| Dutch | 786 | 7.6% |
| Ecuadorian | 32 | 0.3% |
| English | 1,022 | 9.8% |
| European | 140 | 1.3% |
| Finnish | 69 | 0.7% |
| French | 351 | 3.4% |
| French Canadian | 148 | 1.4% |
| German | 1,988 | 19.1% |
| Greek | 40 | 0.4% |
| Hungarian | 84 | 0.8% |
| Indian (Asian) | 10 | 0.1% |
| Irish | 1,159 | 11.1% |
| Iroquois | 2 | 0.0% |
| Italian | 343 | 3.3% |
| Korean | 12 | 0.1% |
| Lithuanian | 13 | 0.1% |
| Mexican | 28 | 0.3% |
| Northern European | 16 | 0.2% |
| Norwegian | 44 | 0.4% |
| Panamanian | 53 | 0.5% |
| Polish | 529 | 5.1% |
| Potawatomi | 11 | 0.1% |
| Puerto Rican | 54 | 0.5% |
| Romanian | 16 | 0.2% |
| Russian | 9 | 0.1% |
| Scandinavian | 28 | 0.3% |
| Scotch-Irish | 61 | 0.6% |
| Scottish | 345 | 3.3% |
| South American | 32 | 0.3% |
| Sri Lankan | 25 | 0.2% |
| Subsaharan African | 3 | 0.0% |
| Swedish | 441 | 4.2% |
| Swiss | 7 | 0.1% |
| Ukrainian | 10 | 0.1% |
| Vietnamese | 46 | 0.4% |
| Welsh | 59 | 0.6% | View All 50 Rows |
Immigrants in Cadillac
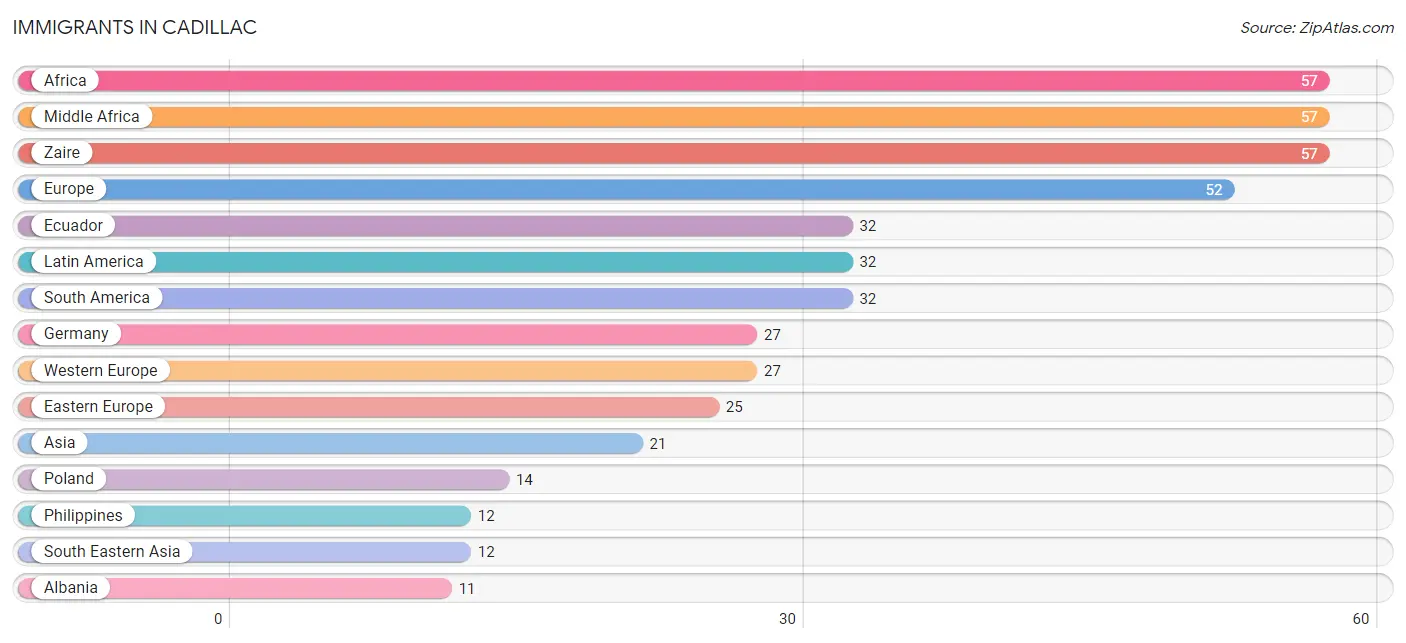
The most numerous immigrant groups reported in Cadillac came from Africa (57 | 0.5%), Middle Africa (57 | 0.5%), Zaire (57 | 0.5%), Europe (52 | 0.5%), and Ecuador (32 | 0.3%), together accounting for 2.5% of all Cadillac residents.
| Immigration Origin | # Population | % Population |
| Africa | 57 | 0.5% |
| Albania | 11 | 0.1% |
| Asia | 21 | 0.2% |
| Bangladesh | 9 | 0.1% |
| Canada | 8 | 0.1% |
| Eastern Europe | 25 | 0.2% |
| Ecuador | 32 | 0.3% |
| Europe | 52 | 0.5% |
| Germany | 27 | 0.3% |
| Latin America | 32 | 0.3% |
| Middle Africa | 57 | 0.5% |
| Philippines | 12 | 0.1% |
| Poland | 14 | 0.1% |
| South America | 32 | 0.3% |
| South Central Asia | 9 | 0.1% |
| South Eastern Asia | 12 | 0.1% |
| Western Europe | 27 | 0.3% |
| Zaire | 57 | 0.5% | View All 18 Rows |
Sex and Age in Cadillac
Sex and Age in Cadillac
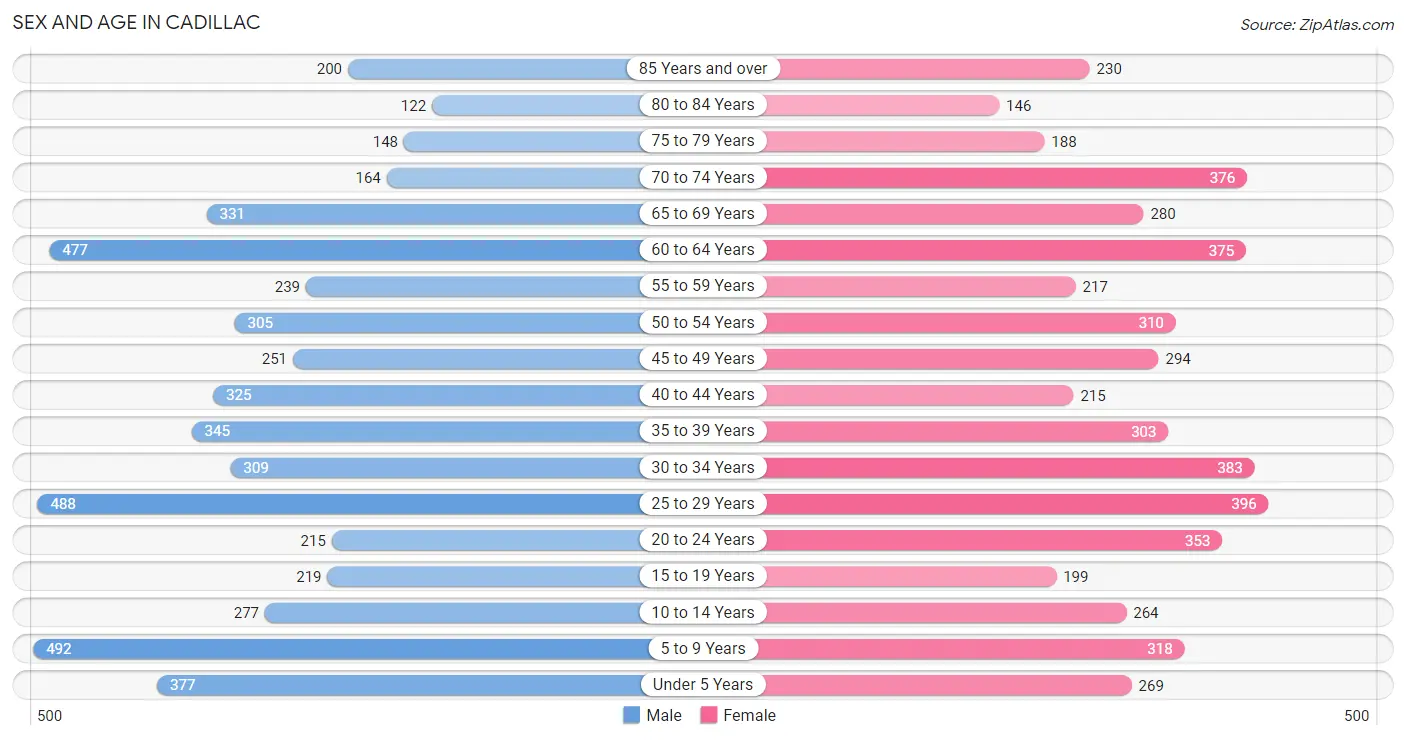
The most populous age groups in Cadillac are 5 to 9 Years (492 | 9.3%) for men and 25 to 29 Years (396 | 7.7%) for women.
| Age Bracket | Male | Female |
| Under 5 Years | 377 (7.1%) | 269 (5.3%) |
| 5 to 9 Years | 492 (9.3%) | 318 (6.2%) |
| 10 to 14 Years | 277 (5.2%) | 264 (5.2%) |
| 15 to 19 Years | 219 (4.1%) | 199 (3.9%) |
| 20 to 24 Years | 215 (4.1%) | 353 (6.9%) |
| 25 to 29 Years | 488 (9.2%) | 396 (7.7%) |
| 30 to 34 Years | 309 (5.9%) | 383 (7.5%) |
| 35 to 39 Years | 345 (6.5%) | 303 (5.9%) |
| 40 to 44 Years | 325 (6.1%) | 215 (4.2%) |
| 45 to 49 Years | 251 (4.8%) | 294 (5.8%) |
| 50 to 54 Years | 305 (5.8%) | 310 (6.1%) |
| 55 to 59 Years | 239 (4.5%) | 217 (4.2%) |
| 60 to 64 Years | 477 (9.0%) | 375 (7.3%) |
| 65 to 69 Years | 331 (6.3%) | 280 (5.5%) |
| 70 to 74 Years | 164 (3.1%) | 376 (7.3%) |
| 75 to 79 Years | 148 (2.8%) | 188 (3.7%) |
| 80 to 84 Years | 122 (2.3%) | 146 (2.9%) |
| 85 Years and over | 200 (3.8%) | 230 (4.5%) |
| Total | 5,284 (100.0%) | 5,116 (100.0%) |
Families and Households in Cadillac
Median Family Size in Cadillac
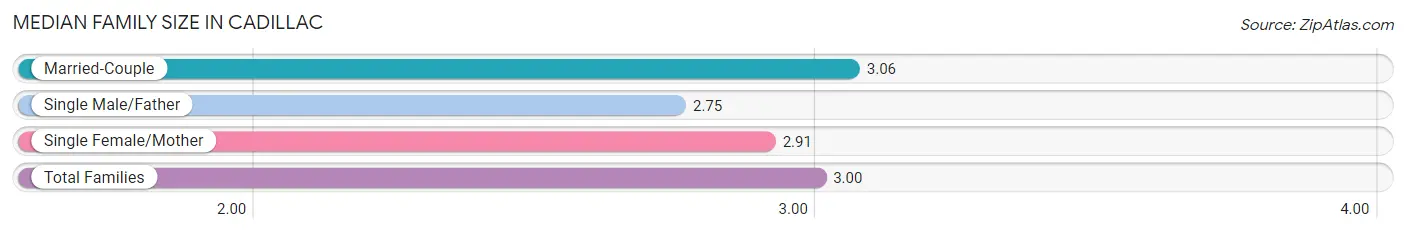
The median family size in Cadillac is 3.00 persons per family, with married-couple families (1,599 | 68.3%) accounting for the largest median family size of 3.06 persons per family. On the other hand, single male/father families (240 | 10.2%) represent the smallest median family size with 2.75 persons per family.
| Family Type | # Families | Family Size |
| Married-Couple | 1,599 (68.3%) | 3.06 |
| Single Male/Father | 240 (10.2%) | 2.75 |
| Single Female/Mother | 503 (21.5%) | 2.91 |
| Total Families | 2,342 (100.0%) | 3.00 |
Median Household Size in Cadillac
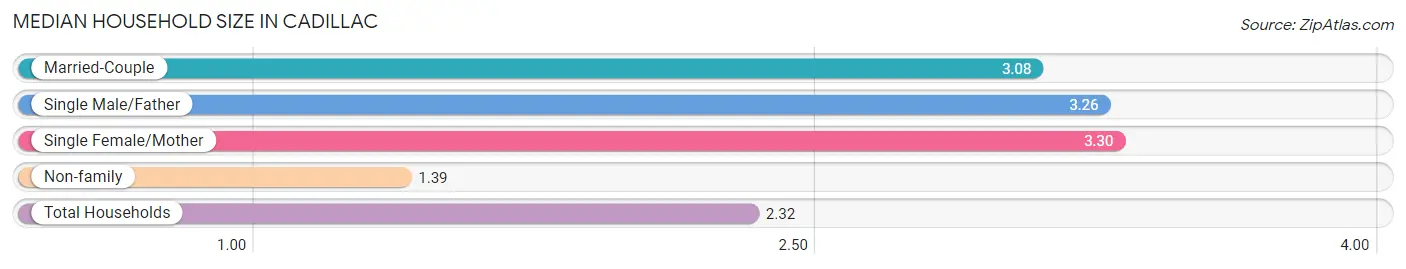
The median household size in Cadillac is 2.32 persons per household, with single female/mother households (503 | 11.5%) accounting for the largest median household size of 3.3 persons per household. non-family households (2,049 | 46.7%) represent the smallest median household size with 1.39 persons per household.
| Household Type | # Households | Household Size |
| Married-Couple | 1,599 (36.4%) | 3.08 |
| Single Male/Father | 240 (5.5%) | 3.26 |
| Single Female/Mother | 503 (11.5%) | 3.30 |
| Non-family | 2,049 (46.7%) | 1.39 |
| Total Households | 4,391 (100.0%) | 2.32 |
Household Size by Marriage Status in Cadillac
Out of a total of 4,391 households in Cadillac, 2,342 (53.3%) are family households, while 2,049 (46.7%) are nonfamily households. The most numerous type of family households are 2-person households, comprising 1,247, and the most common type of nonfamily households are 1-person households, comprising 1,606.
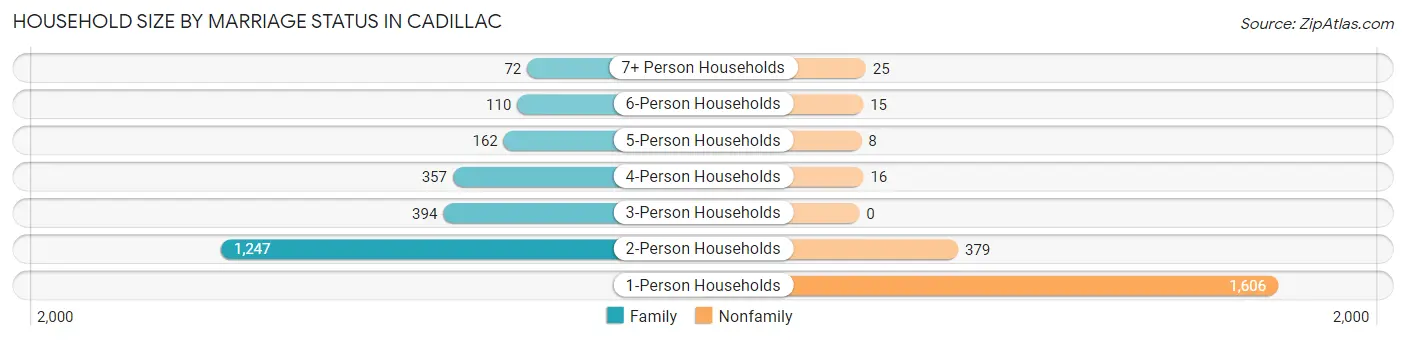
| Household Size | Family Households | Nonfamily Households |
| 1-Person Households | - | 1,606 (36.6%) |
| 2-Person Households | 1,247 (28.4%) | 379 (8.6%) |
| 3-Person Households | 394 (9.0%) | 0 (0.0%) |
| 4-Person Households | 357 (8.1%) | 16 (0.4%) |
| 5-Person Households | 162 (3.7%) | 8 (0.2%) |
| 6-Person Households | 110 (2.5%) | 15 (0.3%) |
| 7+ Person Households | 72 (1.6%) | 25 (0.6%) |
| Total | 2,342 (53.3%) | 2,049 (46.7%) |
Female Fertility in Cadillac
Fertility by Age in Cadillac
Average fertility rate in Cadillac is 84.0 births per 1,000 women. Women in the age bracket of 20 to 34 years have the highest fertility rate with 114.0 births per 1,000 women. Women in the age bracket of 20 to 34 years acount for 69.7% of all women with births.
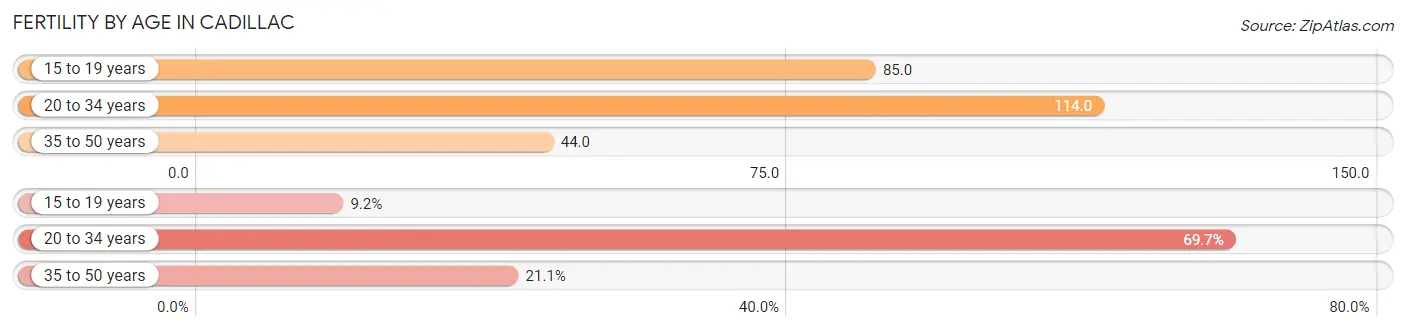
| Age Bracket | Women with Births | Births / 1,000 Women |
| 15 to 19 years | 17 (9.2%) | 85.0 |
| 20 to 34 years | 129 (69.7%) | 114.0 |
| 35 to 50 years | 39 (21.1%) | 44.0 |
| Total | 185 (100.0%) | 84.0 |
Fertility by Age by Marriage Status in Cadillac
41.1% of women with births (185) in Cadillac are married. The highest percentage of unmarried women with births falls into 15 to 19 years age bracket with 100.0% of them unmarried at the time of birth, while the lowest percentage of unmarried women with births belong to 35 to 50 years age bracket with 35.9% of them unmarried.
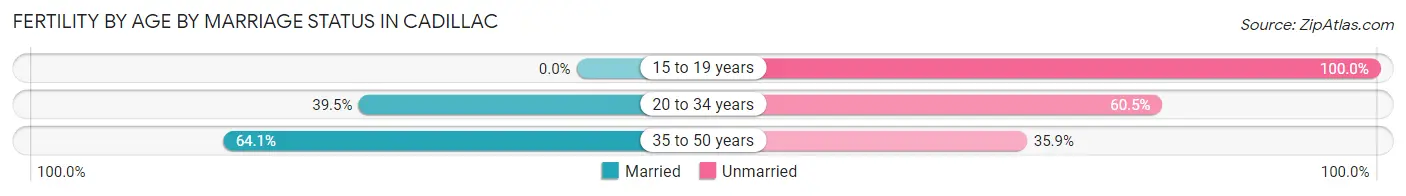
| Age Bracket | Married | Unmarried |
| 15 to 19 years | 0 (0.0%) | 17 (100.0%) |
| 20 to 34 years | 51 (39.5%) | 78 (60.5%) |
| 35 to 50 years | 25 (64.1%) | 14 (35.9%) |
| Total | 76 (41.1%) | 109 (58.9%) |
Fertility by Education in Cadillac
Average fertility rate in Cadillac is 84.0 births per 1,000 women. Women with the education attainment of graduate degree have the highest fertility rate of 198.0 births per 1,000 women, while women with the education attainment of bachelor's degree have the lowest fertility at 30.0 births per 1,000 women. Women with the education attainment of high school diploma represent 31.9% of all women with births.
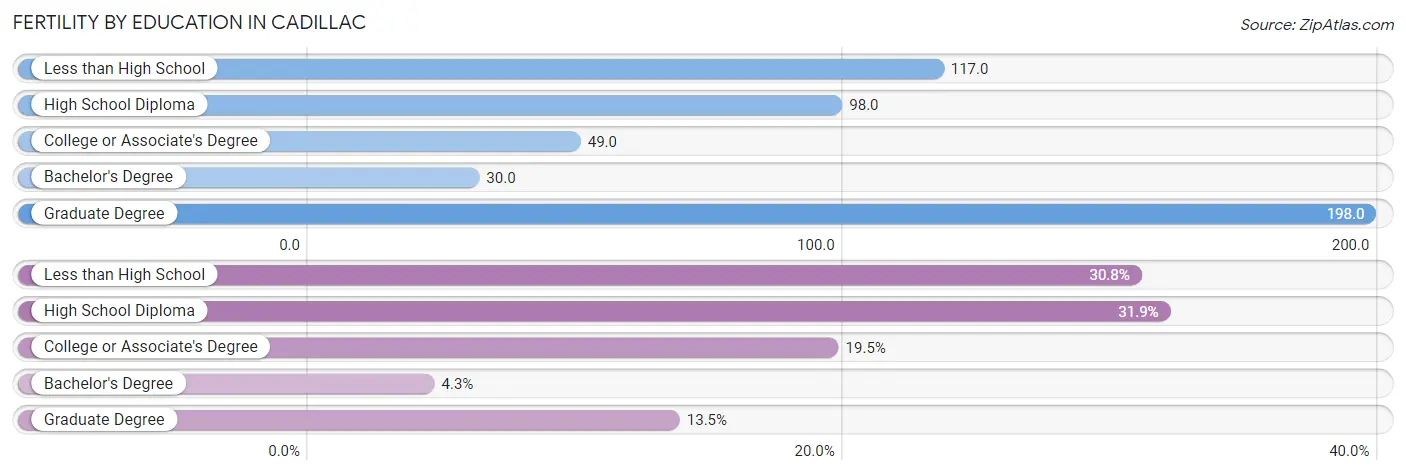
| Educational Attainment | Women with Births | Births / 1,000 Women |
| Less than High School | 57 (30.8%) | 117.0 |
| High School Diploma | 59 (31.9%) | 98.0 |
| College or Associate's Degree | 36 (19.5%) | 49.0 |
| Bachelor's Degree | 8 (4.3%) | 30.0 |
| Graduate Degree | 25 (13.5%) | 198.0 |
| Total | 185 (100.0%) | 84.0 |
Fertility by Education by Marriage Status in Cadillac
58.9% of women with births in Cadillac are unmarried. Women with the educational attainment of bachelor's degree are most likely to be married with 100.0% of them married at childbirth, while women with the educational attainment of less than high school are least likely to be married with 84.2% of them unmarried at childbirth.
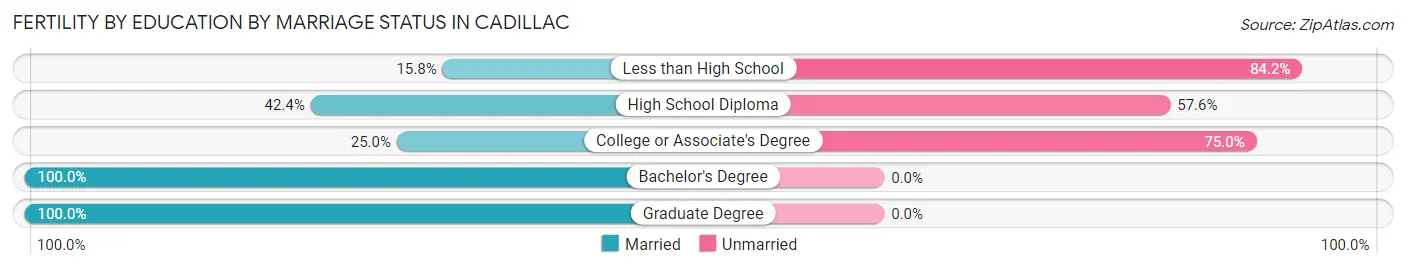
| Educational Attainment | Married | Unmarried |
| Less than High School | 9 (15.8%) | 48 (84.2%) |
| High School Diploma | 25 (42.4%) | 34 (57.6%) |
| College or Associate's Degree | 9 (25.0%) | 27 (75.0%) |
| Bachelor's Degree | 8 (100.0%) | 0 (0.0%) |
| Graduate Degree | 25 (100.0%) | 0 (0.0%) |
| Total | 76 (41.1%) | 109 (58.9%) |
Employment Characteristics in Cadillac
Employment by Class of Employer in Cadillac
Among the 4,178 employed individuals in Cadillac, private company employees (3,376 | 80.8%), local government employees (204 | 4.9%), and self-employed (not incorporated) (195 | 4.7%) make up the most common classes of employment.
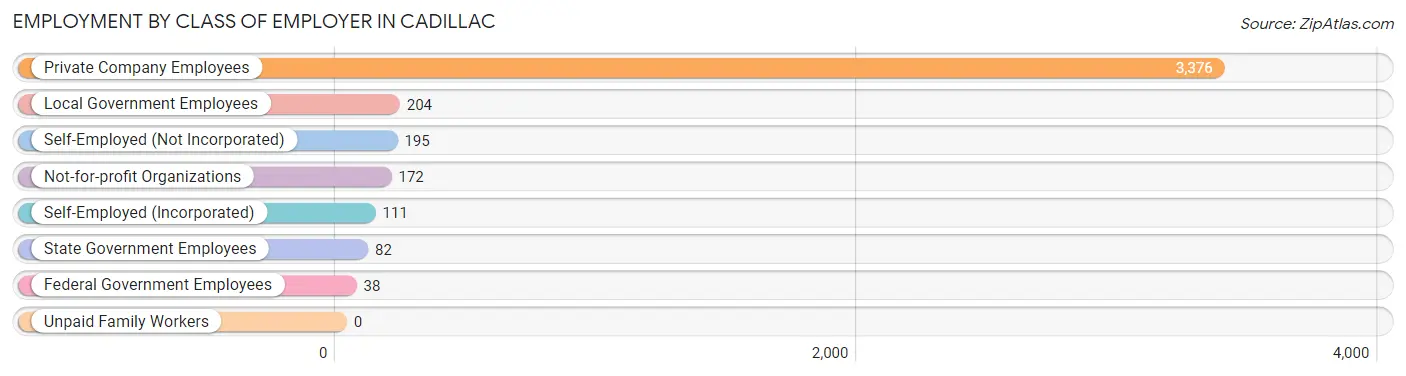
| Employer Class | # Employees | % Employees |
| Private Company Employees | 3,376 | 80.8% |
| Self-Employed (Incorporated) | 111 | 2.7% |
| Self-Employed (Not Incorporated) | 195 | 4.7% |
| Not-for-profit Organizations | 172 | 4.1% |
| Local Government Employees | 204 | 4.9% |
| State Government Employees | 82 | 2.0% |
| Federal Government Employees | 38 | 0.9% |
| Unpaid Family Workers | 0 | 0.0% |
| Total | 4,178 | 100.0% |
Employment Status by Age in Cadillac
According to the labor force statistics for Cadillac, out of the total population over 16 years of age (8,234), 55.4% or 4,562 individuals are in the labor force, with 7.0% or 319 of them unemployed. The age group with the highest labor force participation rate is 20 to 24 years, with 95.8% or 544 individuals in the labor force. Within the labor force, the 16 to 19 years age range has the highest percentage of unemployed individuals, with 42.1% or 48 of them being unemployed.
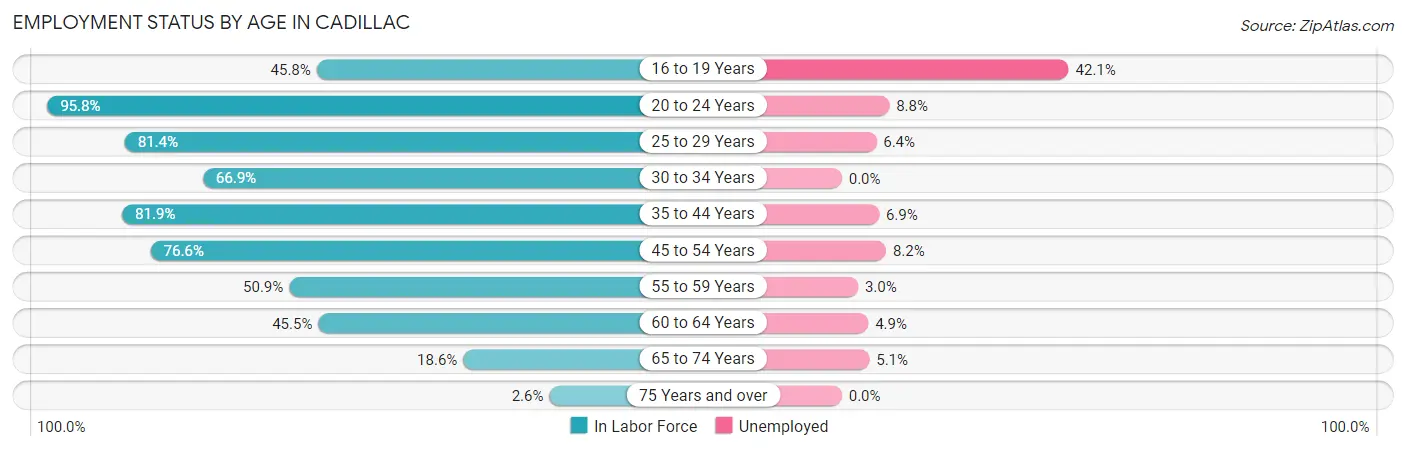
| Age Bracket | In Labor Force | Unemployed |
| 16 to 19 Years | 114 (45.8%) | 48 (42.1%) |
| 20 to 24 Years | 544 (95.8%) | 48 (8.8%) |
| 25 to 29 Years | 720 (81.4%) | 46 (6.4%) |
| 30 to 34 Years | 463 (66.9%) | 0 (0.0%) |
| 35 to 44 Years | 973 (81.9%) | 67 (6.9%) |
| 45 to 54 Years | 889 (76.6%) | 73 (8.2%) |
| 55 to 59 Years | 232 (50.9%) | 7 (3.0%) |
| 60 to 64 Years | 388 (45.5%) | 19 (4.9%) |
| 65 to 74 Years | 214 (18.6%) | 11 (5.1%) |
| 75 Years and over | 27 (2.6%) | 0 (0.0%) |
| Total | 4,562 (55.4%) | 319 (7.0%) |
Employment Status by Educational Attainment in Cadillac
According to labor force statistics for Cadillac, 70.0% of individuals (3,662) out of the total population between 25 and 64 years of age (5,232) are in the labor force, with 5.8% or 212 of them being unemployed. The group with the highest labor force participation rate are those with the educational attainment of bachelor's degree or higher, with 80.1% or 680 individuals in the labor force. Within the labor force, individuals with high school diploma education have the highest percentage of unemployment, with 12.3% or 171 of them being unemployed.
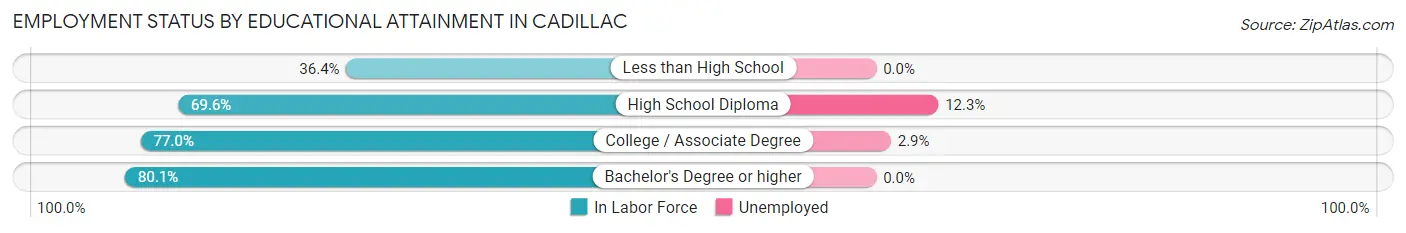
| Educational Attainment | In Labor Force | Unemployed |
| Less than High School | 217 (36.4%) | 0 (0.0%) |
| High School Diploma | 1,394 (69.6%) | 246 (12.3%) |
| College / Associate Degree | 1,374 (77.0%) | 52 (2.9%) |
| Bachelor's Degree or higher | 680 (80.1%) | 0 (0.0%) |
| Total | 3,662 (70.0%) | 303 (5.8%) |
Employment Occupations by Sex in Cadillac
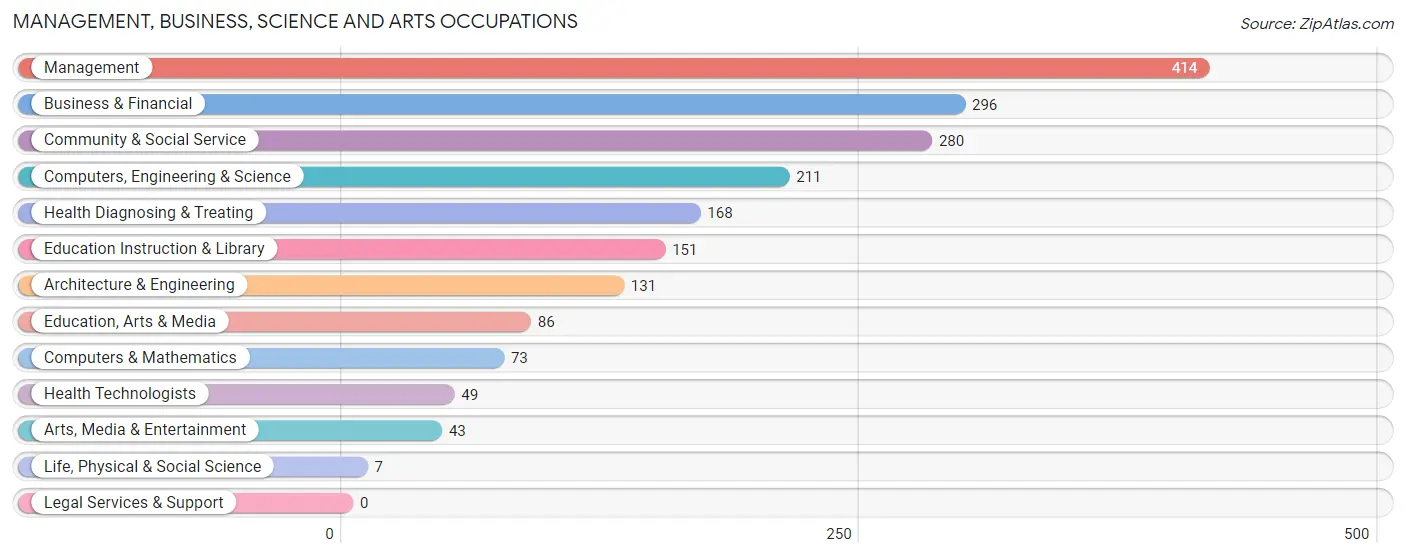
Management, Business, Science and Arts Occupations
The most common Management, Business, Science and Arts occupations in Cadillac are Management (414 | 9.8%), Business & Financial (296 | 7.0%), Community & Social Service (280 | 6.6%), Computers, Engineering & Science (211 | 5.0%), and Health Diagnosing & Treating (168 | 4.0%).
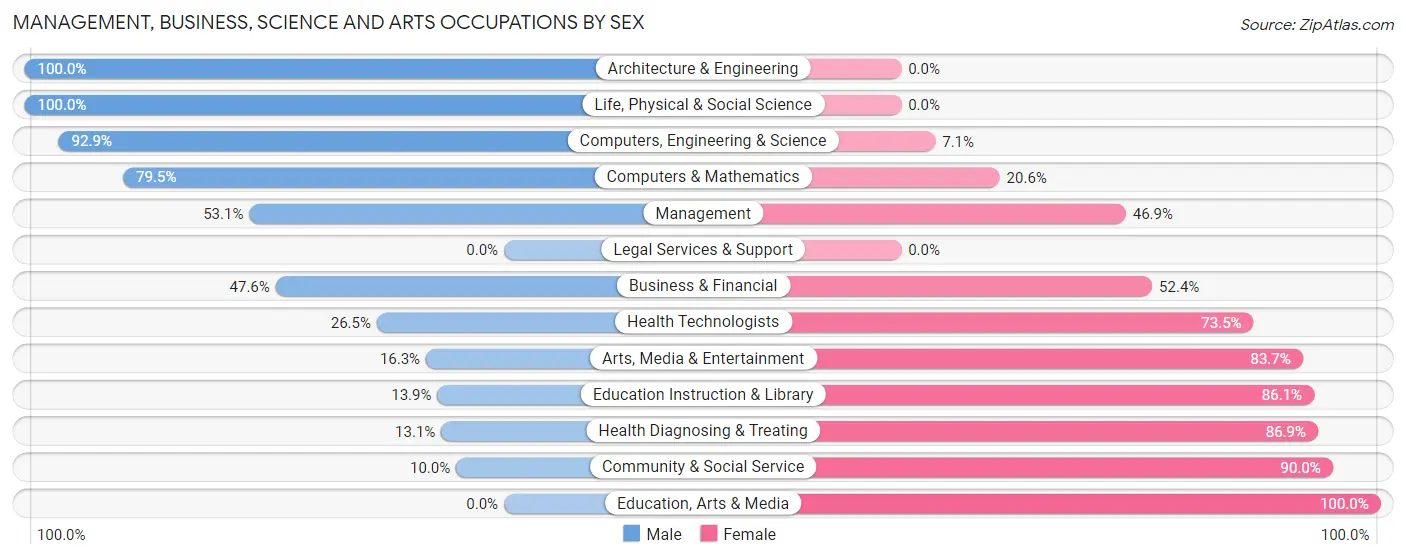
Management, Business, Science and Arts Occupations by Sex
Within the Management, Business, Science and Arts occupations in Cadillac, the most male-oriented occupations are Architecture & Engineering (100.0%), Life, Physical & Social Science (100.0%), and Computers, Engineering & Science (92.9%), while the most female-oriented occupations are Education, Arts & Media (100.0%), Community & Social Service (90.0%), and Health Diagnosing & Treating (86.9%).
| Occupation | Male | Female |
| Management | 220 (53.1%) | 194 (46.9%) |
| Business & Financial | 141 (47.6%) | 155 (52.4%) |
| Computers, Engineering & Science | 196 (92.9%) | 15 (7.1%) |
| Computers & Mathematics | 58 (79.4%) | 15 (20.5%) |
| Architecture & Engineering | 131 (100.0%) | 0 (0.0%) |
| Life, Physical & Social Science | 7 (100.0%) | 0 (0.0%) |
| Community & Social Service | 28 (10.0%) | 252 (90.0%) |
| Education, Arts & Media | 0 (0.0%) | 86 (100.0%) |
| Legal Services & Support | 0 (0.0%) | 0 (0.0%) |
| Education Instruction & Library | 21 (13.9%) | 130 (86.1%) |
| Arts, Media & Entertainment | 7 (16.3%) | 36 (83.7%) |
| Health Diagnosing & Treating | 22 (13.1%) | 146 (86.9%) |
| Health Technologists | 13 (26.5%) | 36 (73.5%) |
| Total (Category) | 607 (44.3%) | 762 (55.7%) |
| Total (Overall) | 2,247 (53.1%) | 1,988 (46.9%) |
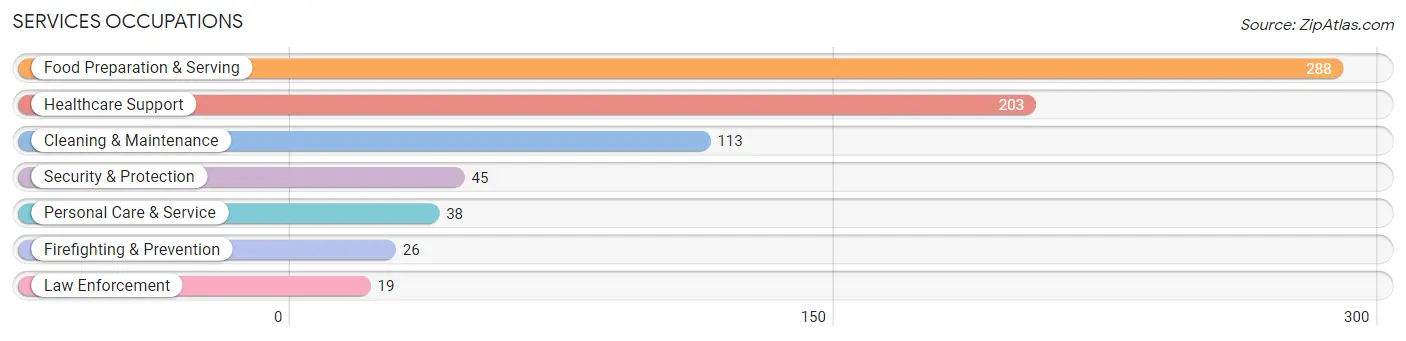
Services Occupations
The most common Services occupations in Cadillac are Food Preparation & Serving (288 | 6.8%), Healthcare Support (203 | 4.8%), Cleaning & Maintenance (113 | 2.7%), Security & Protection (45 | 1.1%), and Personal Care & Service (38 | 0.9%).
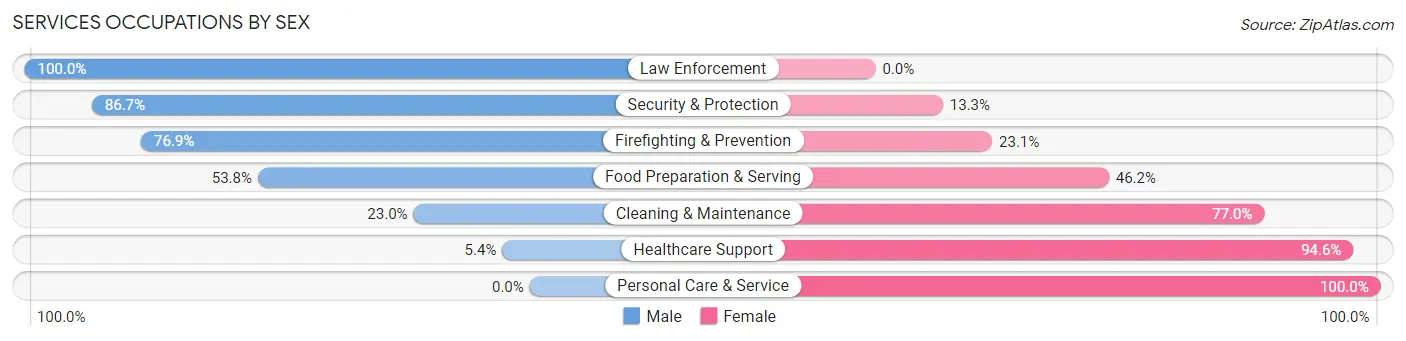
Services Occupations by Sex
Within the Services occupations in Cadillac, the most male-oriented occupations are Law Enforcement (100.0%), Security & Protection (86.7%), and Firefighting & Prevention (76.9%), while the most female-oriented occupations are Personal Care & Service (100.0%), Healthcare Support (94.6%), and Cleaning & Maintenance (77.0%).
| Occupation | Male | Female |
| Healthcare Support | 11 (5.4%) | 192 (94.6%) |
| Security & Protection | 39 (86.7%) | 6 (13.3%) |
| Firefighting & Prevention | 20 (76.9%) | 6 (23.1%) |
| Law Enforcement | 19 (100.0%) | 0 (0.0%) |
| Food Preparation & Serving | 155 (53.8%) | 133 (46.2%) |
| Cleaning & Maintenance | 26 (23.0%) | 87 (77.0%) |
| Personal Care & Service | 0 (0.0%) | 38 (100.0%) |
| Total (Category) | 231 (33.6%) | 456 (66.4%) |
| Total (Overall) | 2,247 (53.1%) | 1,988 (46.9%) |
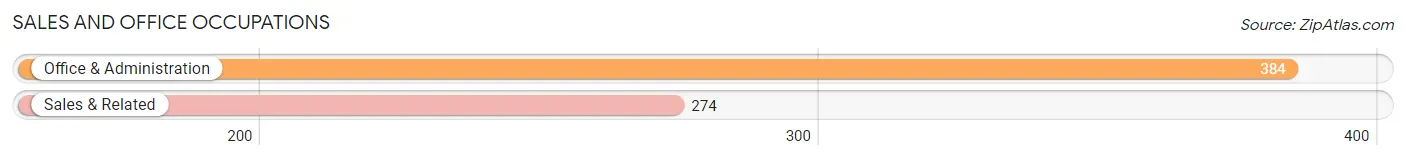
Sales and Office Occupations
The most common Sales and Office occupations in Cadillac are Office & Administration (384 | 9.1%), and Sales & Related (274 | 6.5%).
Sales and Office Occupations by Sex
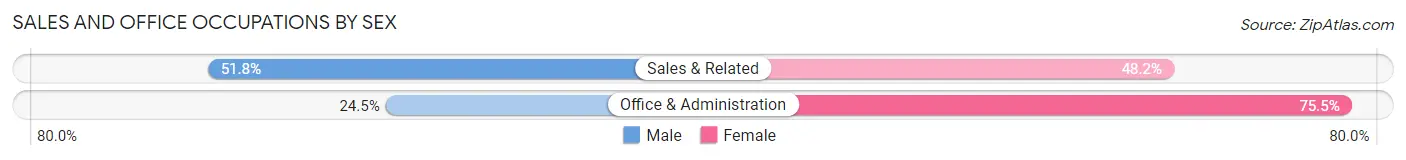
| Occupation | Male | Female |
| Sales & Related | 142 (51.8%) | 132 (48.2%) |
| Office & Administration | 94 (24.5%) | 290 (75.5%) |
| Total (Category) | 236 (35.9%) | 422 (64.1%) |
| Total (Overall) | 2,247 (53.1%) | 1,988 (46.9%) |
Natural Resources, Construction and Maintenance Occupations
The most common Natural Resources, Construction and Maintenance occupations in Cadillac are Installation, Maintenance & Repair (121 | 2.9%), Construction & Extraction (94 | 2.2%), and Farming, Fishing & Forestry (38 | 0.9%).

Natural Resources, Construction and Maintenance Occupations by Sex
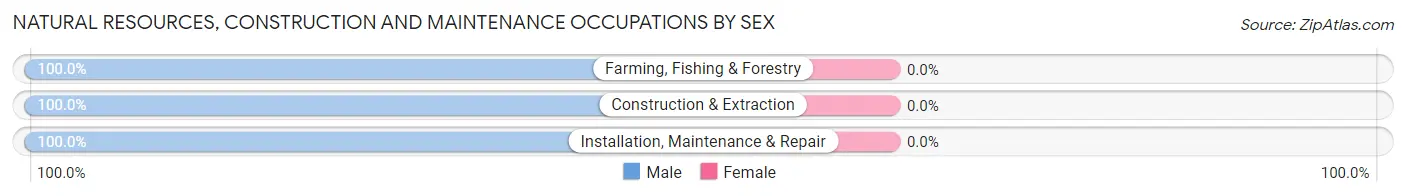
| Occupation | Male | Female |
| Farming, Fishing & Forestry | 38 (100.0%) | 0 (0.0%) |
| Construction & Extraction | 94 (100.0%) | 0 (0.0%) |
| Installation, Maintenance & Repair | 121 (100.0%) | 0 (0.0%) |
| Total (Category) | 253 (100.0%) | 0 (0.0%) |
| Total (Overall) | 2,247 (53.1%) | 1,988 (46.9%) |
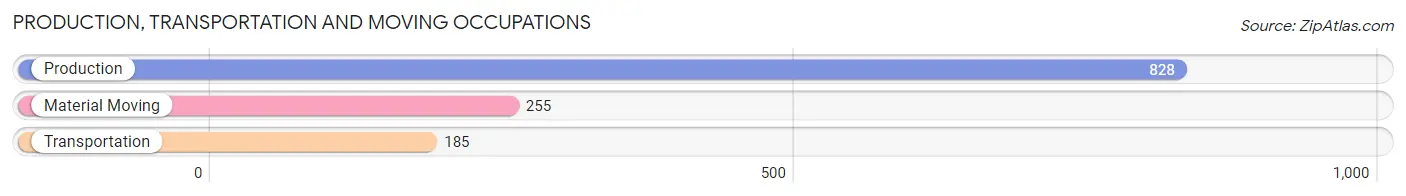
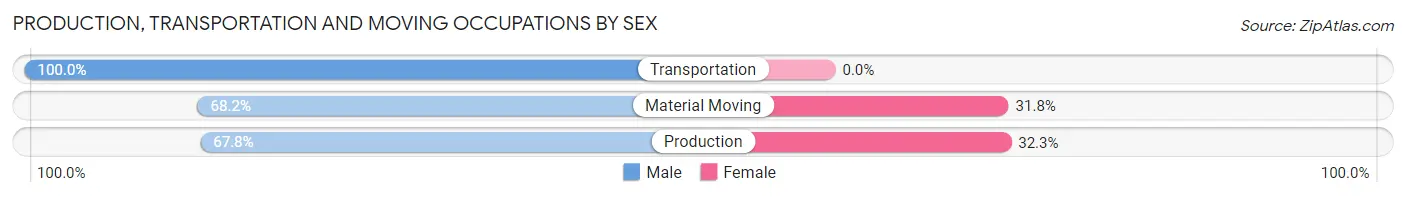
Production, Transportation and Moving Occupations
The most common Production, Transportation and Moving occupations in Cadillac are Production (828 | 19.6%), Material Moving (255 | 6.0%), and Transportation (185 | 4.4%).
Production, Transportation and Moving Occupations by Sex
| Occupation | Male | Female |
| Production | 561 (67.7%) | 267 (32.3%) |
| Transportation | 185 (100.0%) | 0 (0.0%) |
| Material Moving | 174 (68.2%) | 81 (31.8%) |
| Total (Category) | 920 (72.6%) | 348 (27.4%) |
| Total (Overall) | 2,247 (53.1%) | 1,988 (46.9%) |
Employment Industries by Sex in Cadillac
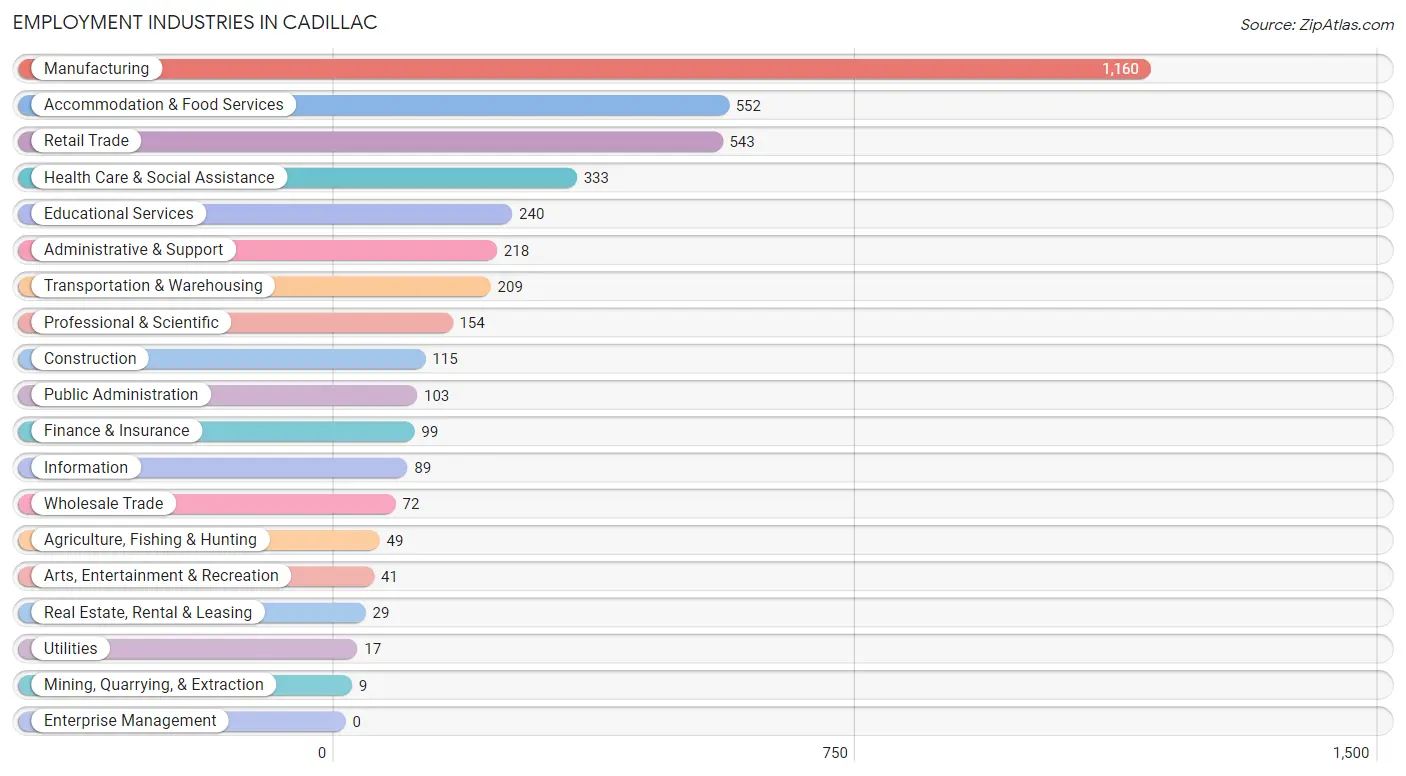
Employment Industries in Cadillac
The major employment industries in Cadillac include Manufacturing (1,160 | 27.4%), Accommodation & Food Services (552 | 13.0%), Retail Trade (543 | 12.8%), Health Care & Social Assistance (333 | 7.9%), and Educational Services (240 | 5.7%).
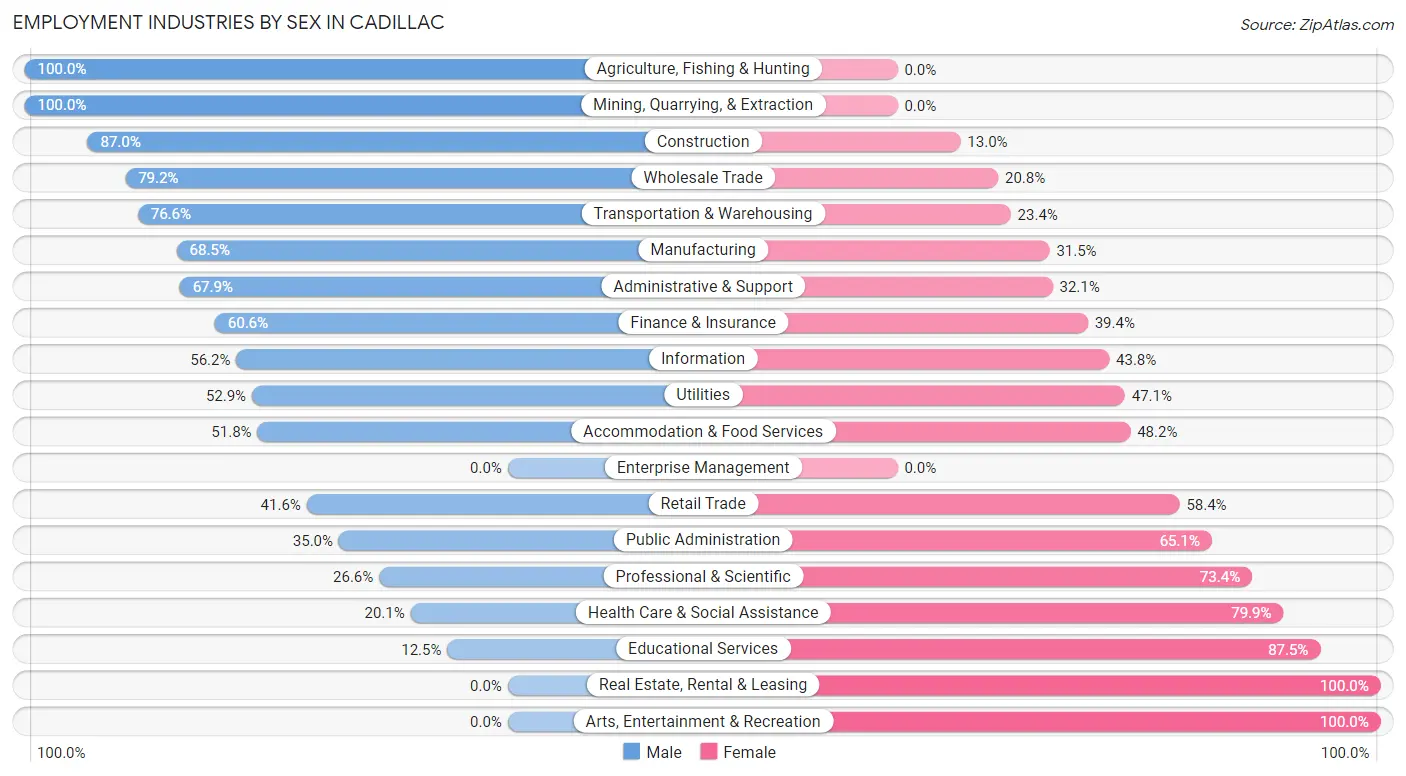
Employment Industries by Sex in Cadillac
The Cadillac industries that see more men than women are Agriculture, Fishing & Hunting (100.0%), Mining, Quarrying, & Extraction (100.0%), and Construction (87.0%), whereas the industries that tend to have a higher number of women are Real Estate, Rental & Leasing (100.0%), Arts, Entertainment & Recreation (100.0%), and Educational Services (87.5%).
| Industry | Male | Female |
| Agriculture, Fishing & Hunting | 49 (100.0%) | 0 (0.0%) |
| Mining, Quarrying, & Extraction | 9 (100.0%) | 0 (0.0%) |
| Construction | 100 (87.0%) | 15 (13.0%) |
| Manufacturing | 795 (68.5%) | 365 (31.5%) |
| Wholesale Trade | 57 (79.2%) | 15 (20.8%) |
| Retail Trade | 226 (41.6%) | 317 (58.4%) |
| Transportation & Warehousing | 160 (76.6%) | 49 (23.4%) |
| Utilities | 9 (52.9%) | 8 (47.1%) |
| Information | 50 (56.2%) | 39 (43.8%) |
| Finance & Insurance | 60 (60.6%) | 39 (39.4%) |
| Real Estate, Rental & Leasing | 0 (0.0%) | 29 (100.0%) |
| Professional & Scientific | 41 (26.6%) | 113 (73.4%) |
| Enterprise Management | 0 (0.0%) | 0 (0.0%) |
| Administrative & Support | 148 (67.9%) | 70 (32.1%) |
| Educational Services | 30 (12.5%) | 210 (87.5%) |
| Health Care & Social Assistance | 67 (20.1%) | 266 (79.9%) |
| Arts, Entertainment & Recreation | 0 (0.0%) | 41 (100.0%) |
| Accommodation & Food Services | 286 (51.8%) | 266 (48.2%) |
| Public Administration | 36 (34.9%) | 67 (65.0%) |
| Total | 2,247 (53.1%) | 1,988 (46.9%) |
Education in Cadillac
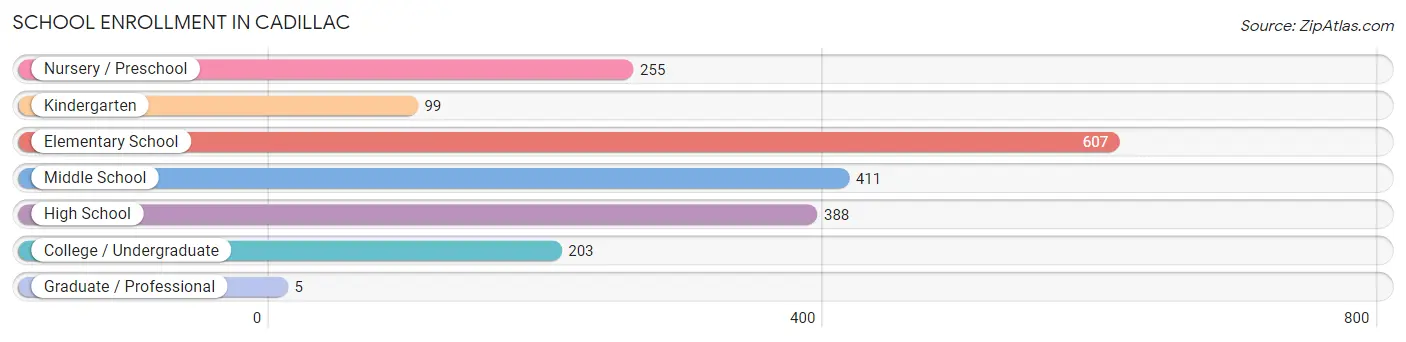
School Enrollment in Cadillac
The most common levels of schooling among the 1,968 students in Cadillac are elementary school (607 | 30.8%), middle school (411 | 20.9%), and high school (388 | 19.7%).
| School Level | # Students | % Students |
| Nursery / Preschool | 255 | 13.0% |
| Kindergarten | 99 | 5.0% |
| Elementary School | 607 | 30.8% |
| Middle School | 411 | 20.9% |
| High School | 388 | 19.7% |
| College / Undergraduate | 203 | 10.3% |
| Graduate / Professional | 5 | 0.3% |
| Total | 1,968 | 100.0% |
School Enrollment by Age by Funding Source in Cadillac
Out of a total of 1,968 students who are enrolled in schools in Cadillac, 447 (22.7%) attend a private institution, while the remaining 1,521 (77.3%) are enrolled in public schools. The age group of 20 to 24 year olds has the highest likelihood of being enrolled in private schools, with 89 (64.5% in the age bracket) enrolled. Conversely, the age group of 18 to 19 year olds has the lowest likelihood of being enrolled in a private school, with 47 (100.0% in the age bracket) attending a public institution.
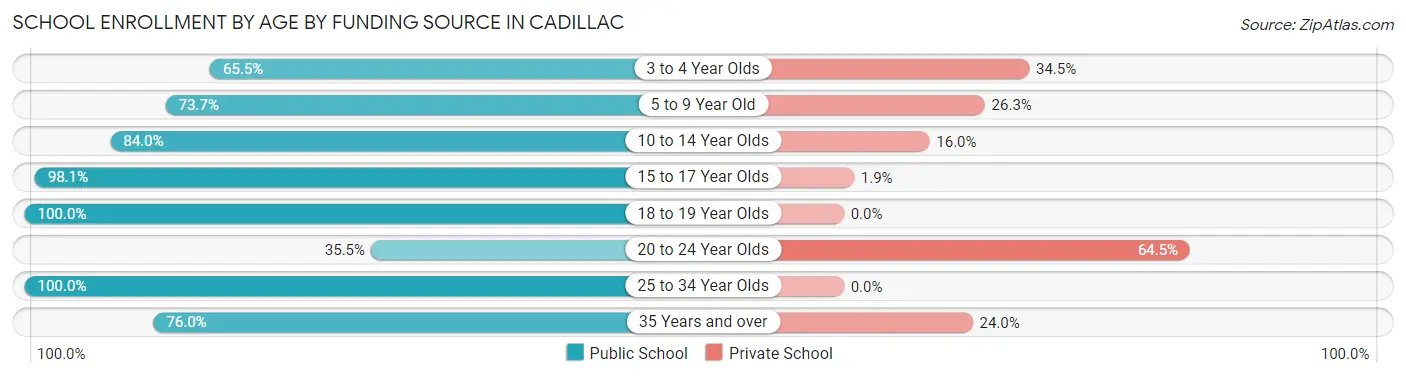
| Age Bracket | Public School | Private School |
| 3 to 4 Year Olds | 91 (65.5%) | 48 (34.5%) |
| 5 to 9 Year Old | 556 (73.7%) | 198 (26.3%) |
| 10 to 14 Year Olds | 437 (84.0%) | 83 (16.0%) |
| 15 to 17 Year Olds | 258 (98.1%) | 5 (1.9%) |
| 18 to 19 Year Olds | 47 (100.0%) | 0 (0.0%) |
| 20 to 24 Year Olds | 49 (35.5%) | 89 (64.5%) |
| 25 to 34 Year Olds | 7 (100.0%) | 0 (0.0%) |
| 35 Years and over | 76 (76.0%) | 24 (24.0%) |
| Total | 1,521 (77.3%) | 447 (22.7%) |
Educational Attainment by Field of Study in Cadillac
Business (351 | 24.0%), education (237 | 16.2%), bio, nature & agricultural (152 | 10.4%), arts & humanities (114 | 7.8%), and science & technology (92 | 6.3%) are the most common fields of study among 1,463 individuals in Cadillac who have obtained a bachelor's degree or higher.
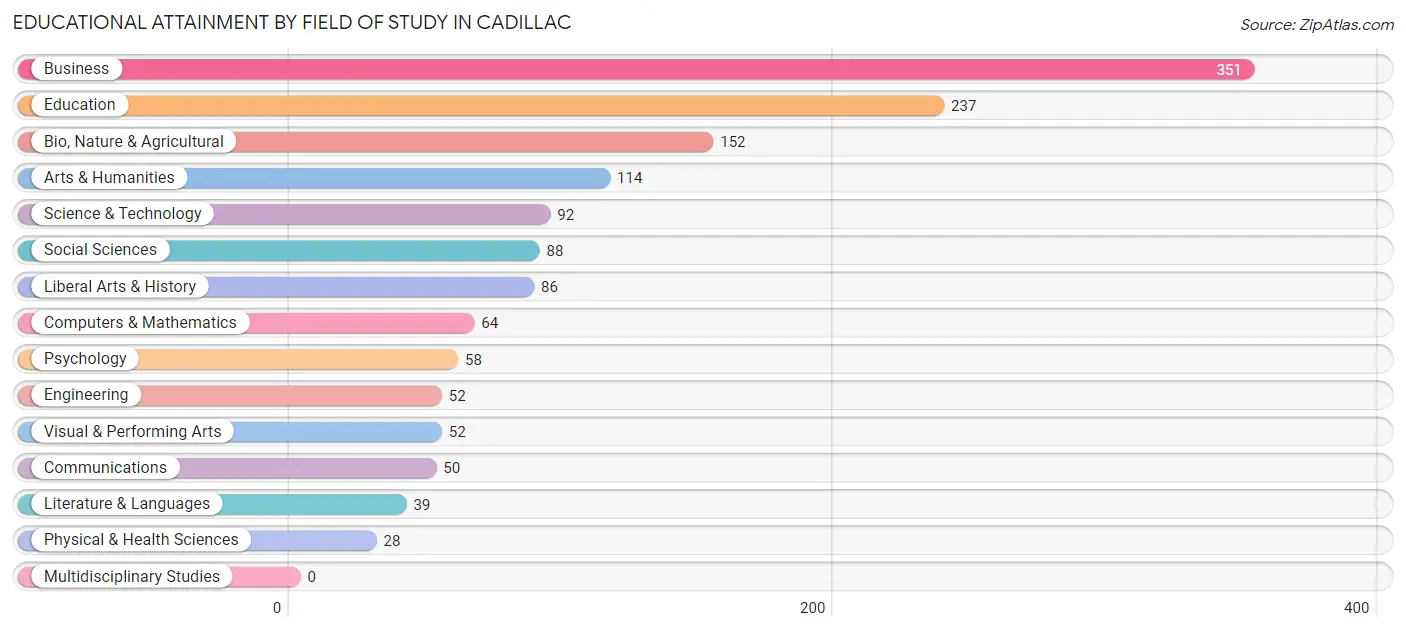
| Field of Study | # Graduates | % Graduates |
| Computers & Mathematics | 64 | 4.4% |
| Bio, Nature & Agricultural | 152 | 10.4% |
| Physical & Health Sciences | 28 | 1.9% |
| Psychology | 58 | 4.0% |
| Social Sciences | 88 | 6.0% |
| Engineering | 52 | 3.5% |
| Multidisciplinary Studies | 0 | 0.0% |
| Science & Technology | 92 | 6.3% |
| Business | 351 | 24.0% |
| Education | 237 | 16.2% |
| Literature & Languages | 39 | 2.7% |
| Liberal Arts & History | 86 | 5.9% |
| Visual & Performing Arts | 52 | 3.5% |
| Communications | 50 | 3.4% |
| Arts & Humanities | 114 | 7.8% |
| Total | 1,463 | 100.0% |
Transportation & Commute in Cadillac
Vehicle Availability by Sex in Cadillac
The most prevalent vehicle ownership categories in Cadillac are males with 2 vehicles (915, accounting for 41.3%) and females with 2 vehicles (877, making up 46.7%).
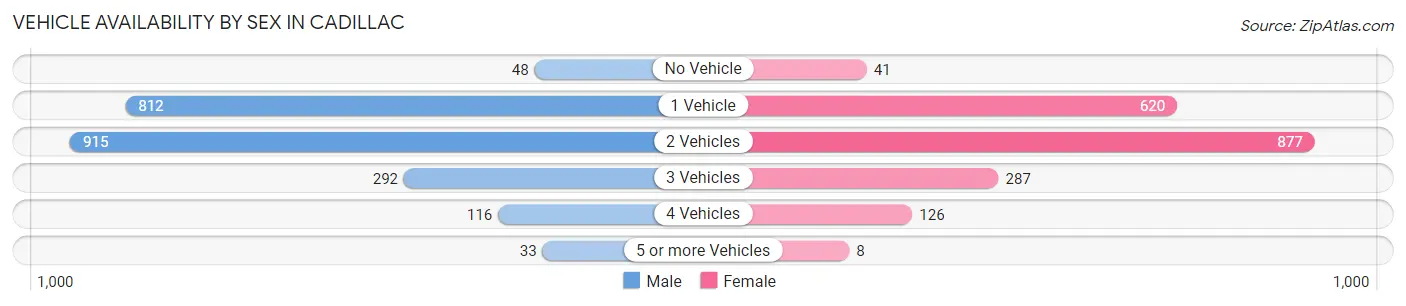
| Vehicles Available | Male | Female |
| No Vehicle | 48 (2.2%) | 41 (2.1%) |
| 1 Vehicle | 812 (36.6%) | 620 (31.7%) |
| 2 Vehicles | 915 (41.3%) | 877 (44.8%) |
| 3 Vehicles | 292 (13.2%) | 287 (14.6%) |
| 4 Vehicles | 116 (5.2%) | 126 (6.4%) |
| 5 or more Vehicles | 33 (1.5%) | 8 (0.4%) |
| Total | 2,216 (100.0%) | 1,959 (100.0%) |
Commute Time in Cadillac
The most frequently occuring commute durations in Cadillac are 5 to 9 minutes (1,589 commuters, 40.1%), 10 to 14 minutes (851 commuters, 21.5%), and less than 5 minutes (560 commuters, 14.1%).
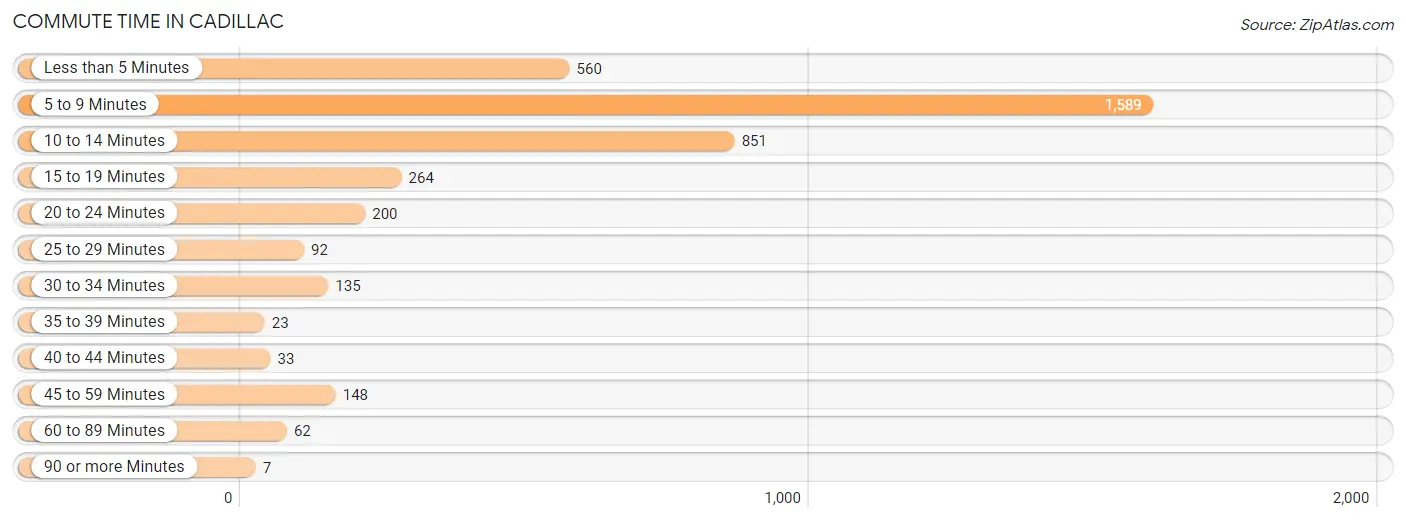
| Commute Time | # Commuters | % Commuters |
| Less than 5 Minutes | 560 | 14.1% |
| 5 to 9 Minutes | 1,589 | 40.1% |
| 10 to 14 Minutes | 851 | 21.5% |
| 15 to 19 Minutes | 264 | 6.7% |
| 20 to 24 Minutes | 200 | 5.1% |
| 25 to 29 Minutes | 92 | 2.3% |
| 30 to 34 Minutes | 135 | 3.4% |
| 35 to 39 Minutes | 23 | 0.6% |
| 40 to 44 Minutes | 33 | 0.8% |
| 45 to 59 Minutes | 148 | 3.7% |
| 60 to 89 Minutes | 62 | 1.6% |
| 90 or more Minutes | 7 | 0.2% |
Commute Time by Sex in Cadillac
The most common commute times in Cadillac are 5 to 9 minutes (779 commuters, 36.1%) for males and 5 to 9 minutes (810 commuters, 44.8%) for females.
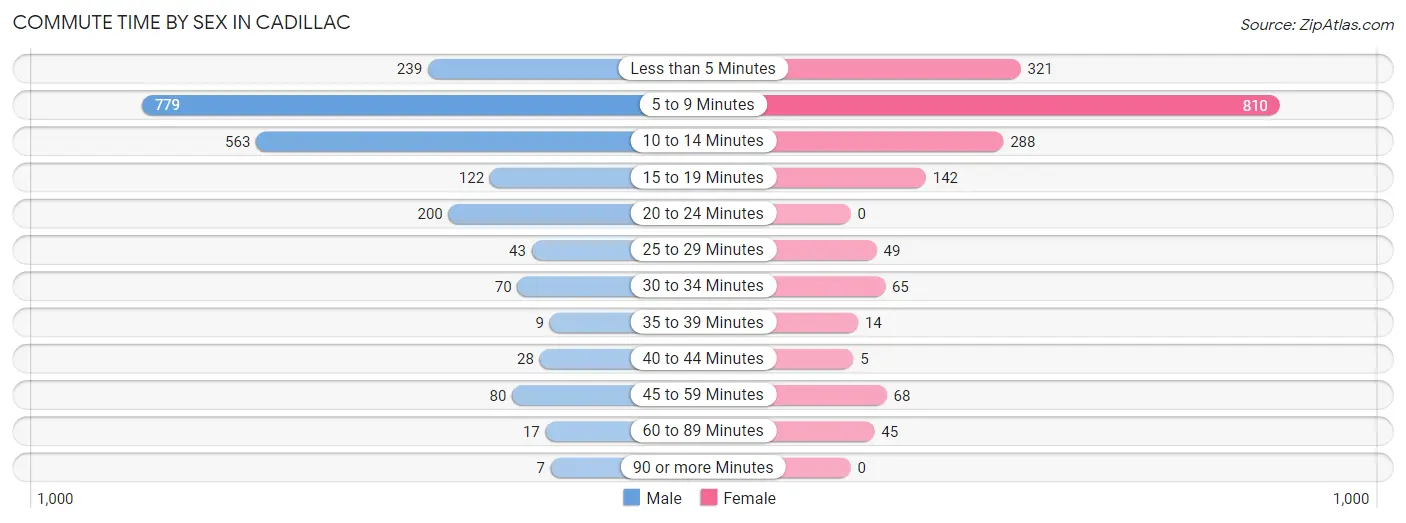
| Commute Time | Male | Female |
| Less than 5 Minutes | 239 (11.1%) | 321 (17.8%) |
| 5 to 9 Minutes | 779 (36.1%) | 810 (44.8%) |
| 10 to 14 Minutes | 563 (26.1%) | 288 (15.9%) |
| 15 to 19 Minutes | 122 (5.7%) | 142 (7.9%) |
| 20 to 24 Minutes | 200 (9.3%) | 0 (0.0%) |
| 25 to 29 Minutes | 43 (2.0%) | 49 (2.7%) |
| 30 to 34 Minutes | 70 (3.3%) | 65 (3.6%) |
| 35 to 39 Minutes | 9 (0.4%) | 14 (0.8%) |
| 40 to 44 Minutes | 28 (1.3%) | 5 (0.3%) |
| 45 to 59 Minutes | 80 (3.7%) | 68 (3.8%) |
| 60 to 89 Minutes | 17 (0.8%) | 45 (2.5%) |
| 90 or more Minutes | 7 (0.3%) | 0 (0.0%) |
Time of Departure to Work by Sex in Cadillac
The most frequent times of departure to work in Cadillac are 12:00 PM to 3:59 PM (306, 14.2%) for males and 7:30 AM to 7:59 AM (305, 16.9%) for females.
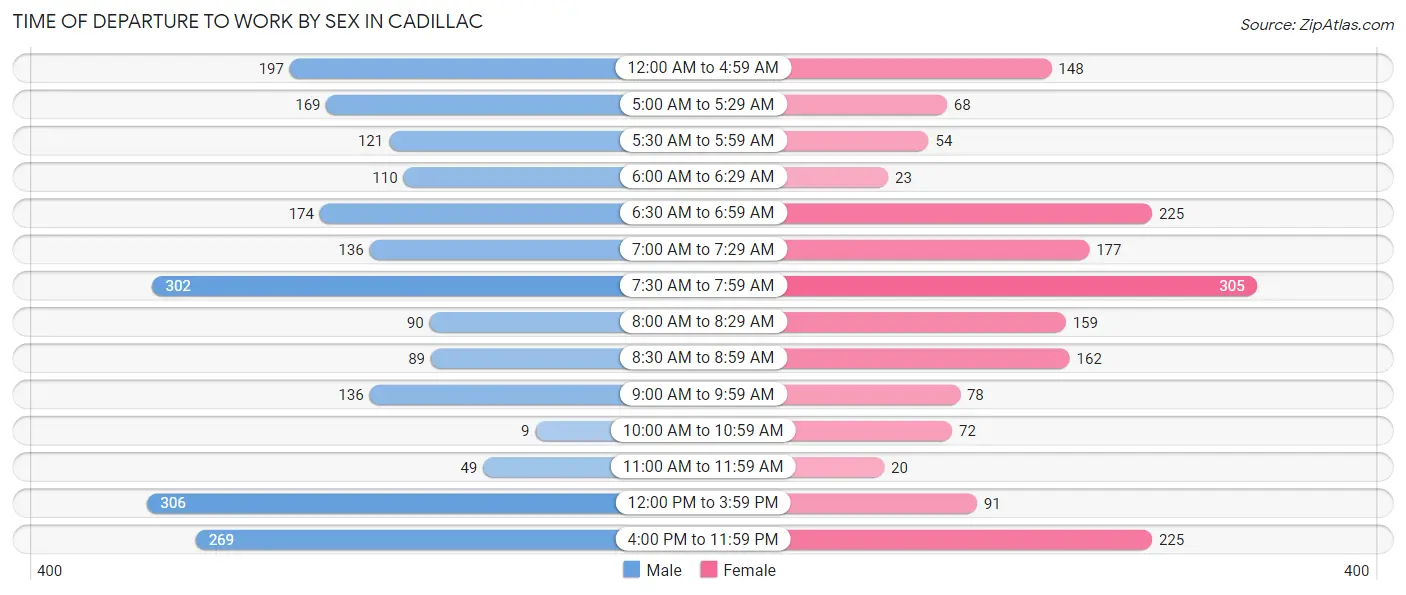
| Time of Departure | Male | Female |
| 12:00 AM to 4:59 AM | 197 (9.1%) | 148 (8.2%) |
| 5:00 AM to 5:29 AM | 169 (7.8%) | 68 (3.8%) |
| 5:30 AM to 5:59 AM | 121 (5.6%) | 54 (3.0%) |
| 6:00 AM to 6:29 AM | 110 (5.1%) | 23 (1.3%) |
| 6:30 AM to 6:59 AM | 174 (8.1%) | 225 (12.4%) |
| 7:00 AM to 7:29 AM | 136 (6.3%) | 177 (9.8%) |
| 7:30 AM to 7:59 AM | 302 (14.0%) | 305 (16.9%) |
| 8:00 AM to 8:29 AM | 90 (4.2%) | 159 (8.8%) |
| 8:30 AM to 8:59 AM | 89 (4.1%) | 162 (9.0%) |
| 9:00 AM to 9:59 AM | 136 (6.3%) | 78 (4.3%) |
| 10:00 AM to 10:59 AM | 9 (0.4%) | 72 (4.0%) |
| 11:00 AM to 11:59 AM | 49 (2.3%) | 20 (1.1%) |
| 12:00 PM to 3:59 PM | 306 (14.2%) | 91 (5.0%) |
| 4:00 PM to 11:59 PM | 269 (12.5%) | 225 (12.4%) |
| Total | 2,157 (100.0%) | 1,807 (100.0%) |
Housing Occupancy in Cadillac
Occupancy by Ownership in Cadillac
Of the total 4,391 dwellings in Cadillac, owner-occupied units account for 2,897 (66.0%), while renter-occupied units make up 1,494 (34.0%).
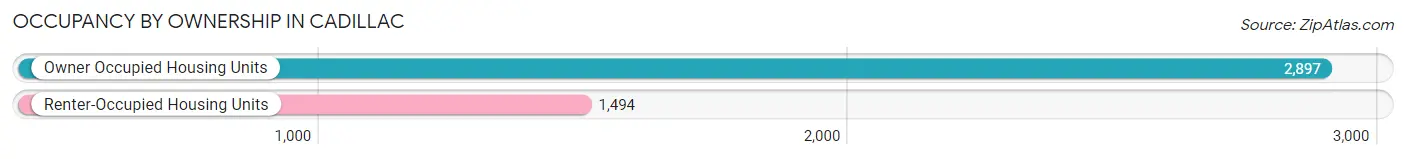
| Occupancy | # Housing Units | % Housing Units |
| Owner Occupied Housing Units | 2,897 | 66.0% |
| Renter-Occupied Housing Units | 1,494 | 34.0% |
| Total Occupied Housing Units | 4,391 | 100.0% |
Occupancy by Household Size in Cadillac
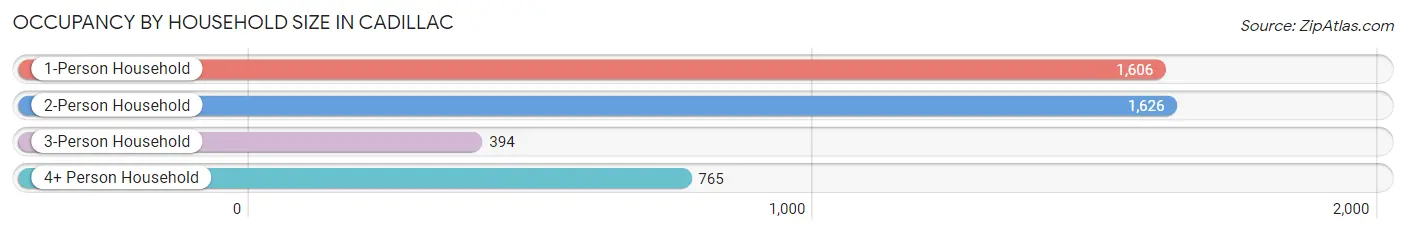
| Household Size | # Housing Units | % Housing Units |
| 1-Person Household | 1,606 | 36.6% |
| 2-Person Household | 1,626 | 37.0% |
| 3-Person Household | 394 | 9.0% |
| 4+ Person Household | 765 | 17.4% |
| Total Housing Units | 4,391 | 100.0% |
Occupancy by Ownership by Household Size in Cadillac
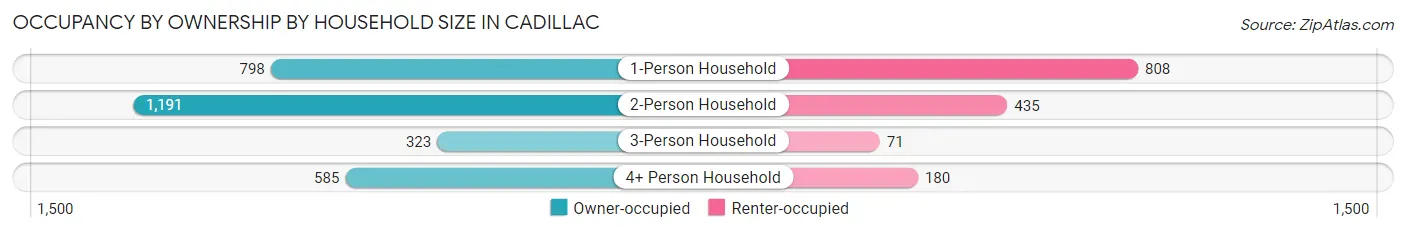
| Household Size | Owner-occupied | Renter-occupied |
| 1-Person Household | 798 (49.7%) | 808 (50.3%) |
| 2-Person Household | 1,191 (73.3%) | 435 (26.8%) |
| 3-Person Household | 323 (82.0%) | 71 (18.0%) |
| 4+ Person Household | 585 (76.5%) | 180 (23.5%) |
| Total Housing Units | 2,897 (66.0%) | 1,494 (34.0%) |
Occupancy by Educational Attainment in Cadillac
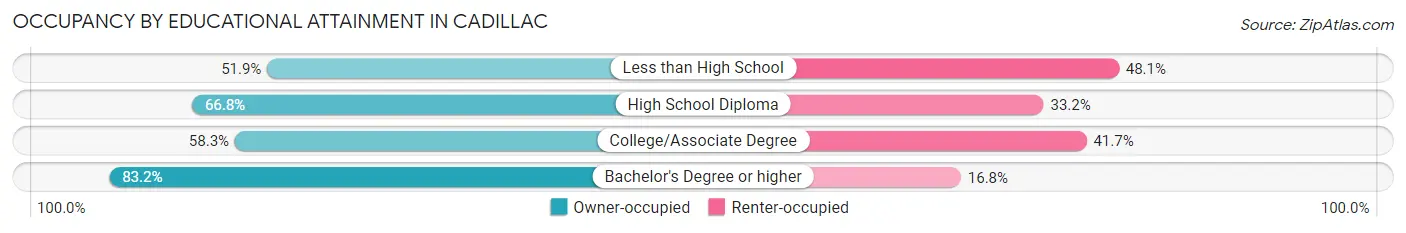
| Household Size | Owner-occupied | Renter-occupied |
| Less than High School | 218 (51.9%) | 202 (48.1%) |
| High School Diploma | 946 (66.8%) | 470 (33.2%) |
| College/Associate Degree | 920 (58.3%) | 658 (41.7%) |
| Bachelor's Degree or higher | 813 (83.2%) | 164 (16.8%) |
Occupancy by Age of Householder in Cadillac
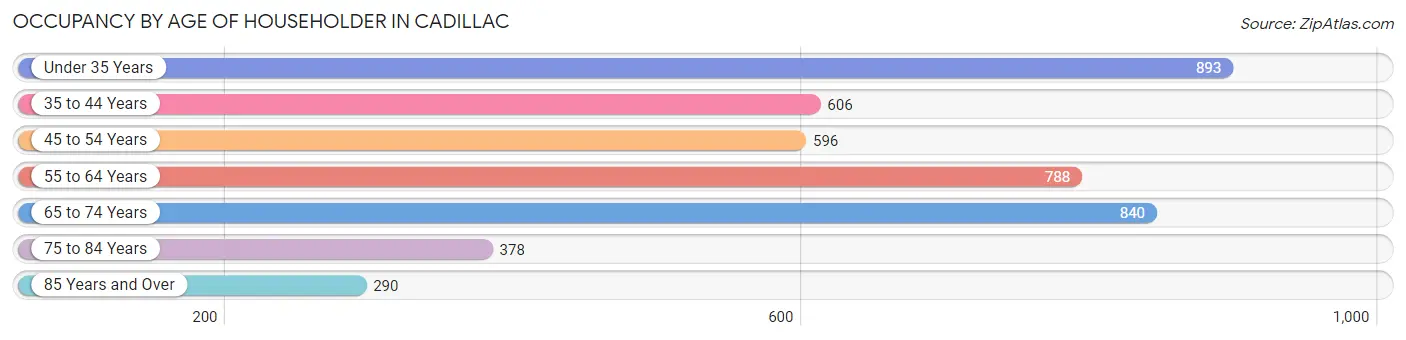
| Age Bracket | # Households | % Households |
| Under 35 Years | 893 | 20.3% |
| 35 to 44 Years | 606 | 13.8% |
| 45 to 54 Years | 596 | 13.6% |
| 55 to 64 Years | 788 | 17.9% |
| 65 to 74 Years | 840 | 19.1% |
| 75 to 84 Years | 378 | 8.6% |
| 85 Years and Over | 290 | 6.6% |
| Total | 4,391 | 100.0% |
Housing Finances in Cadillac
Median Income by Occupancy in Cadillac
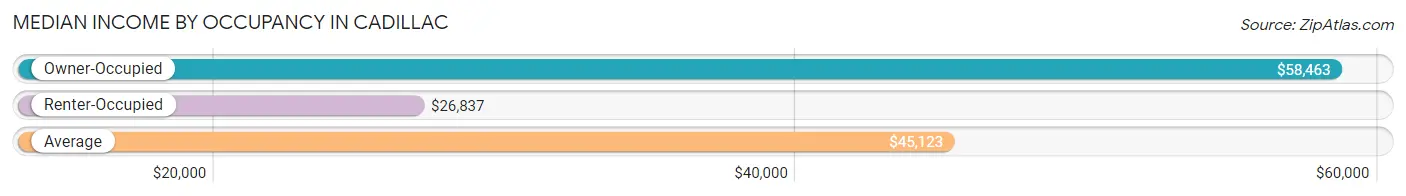
| Occupancy Type | # Households | Median Income |
| Owner-Occupied | 2,897 (66.0%) | $58,463 |
| Renter-Occupied | 1,494 (34.0%) | $26,837 |
| Average | 4,391 (100.0%) | $45,123 |
Occupancy by Householder Income Bracket in Cadillac
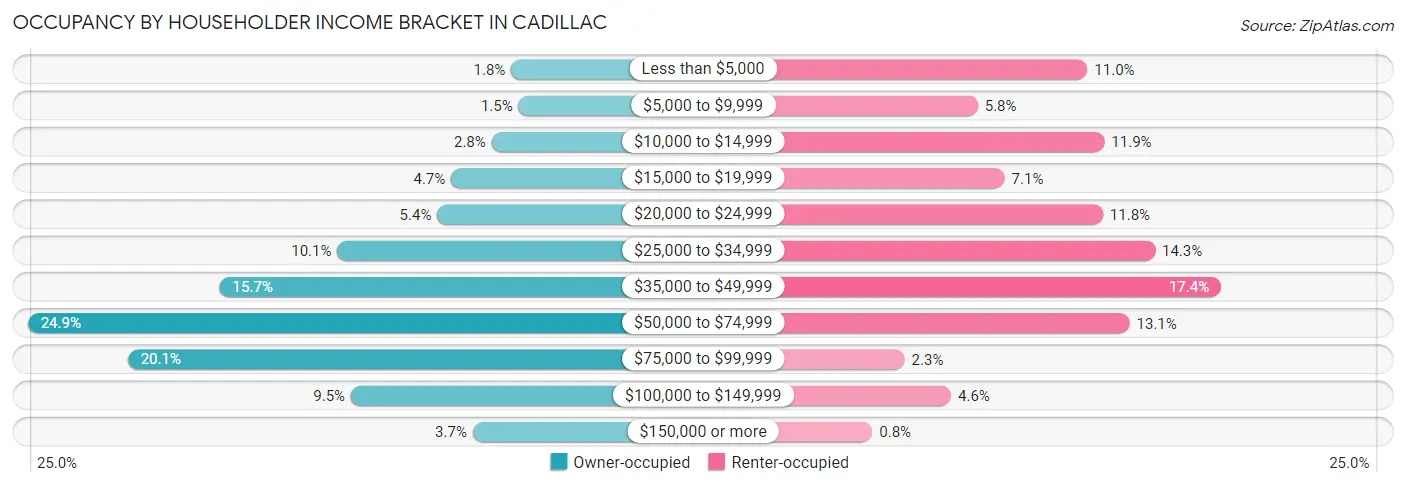
| Income Bracket | Owner-occupied | Renter-occupied |
| Less than $5,000 | 53 (1.8%) | 165 (11.0%) |
| $5,000 to $9,999 | 43 (1.5%) | 87 (5.8%) |
| $10,000 to $14,999 | 80 (2.8%) | 177 (11.8%) |
| $15,000 to $19,999 | 136 (4.7%) | 106 (7.1%) |
| $20,000 to $24,999 | 155 (5.3%) | 176 (11.8%) |
| $25,000 to $34,999 | 293 (10.1%) | 213 (14.3%) |
| $35,000 to $49,999 | 455 (15.7%) | 260 (17.4%) |
| $50,000 to $74,999 | 720 (24.8%) | 195 (13.1%) |
| $75,000 to $99,999 | 582 (20.1%) | 35 (2.3%) |
| $100,000 to $149,999 | 274 (9.5%) | 68 (4.5%) |
| $150,000 or more | 106 (3.7%) | 12 (0.8%) |
| Total | 2,897 (100.0%) | 1,494 (100.0%) |
Monthly Housing Cost Tiers in Cadillac
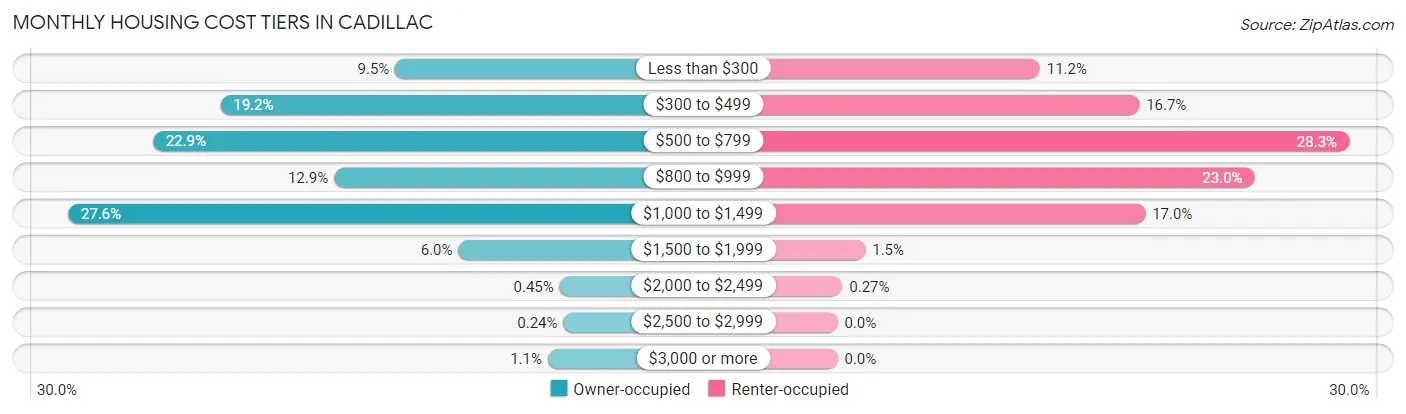
| Monthly Cost | Owner-occupied | Renter-occupied |
| Less than $300 | 276 (9.5%) | 167 (11.2%) |
| $300 to $499 | 556 (19.2%) | 249 (16.7%) |
| $500 to $799 | 664 (22.9%) | 422 (28.2%) |
| $800 to $999 | 374 (12.9%) | 344 (23.0%) |
| $1,000 to $1,499 | 800 (27.6%) | 254 (17.0%) |
| $1,500 to $1,999 | 175 (6.0%) | 23 (1.5%) |
| $2,000 to $2,499 | 13 (0.4%) | 4 (0.3%) |
| $2,500 to $2,999 | 7 (0.2%) | 0 (0.0%) |
| $3,000 or more | 32 (1.1%) | 0 (0.0%) |
| Total | 2,897 (100.0%) | 1,494 (100.0%) |
Physical Housing Characteristics in Cadillac
Housing Structures in Cadillac
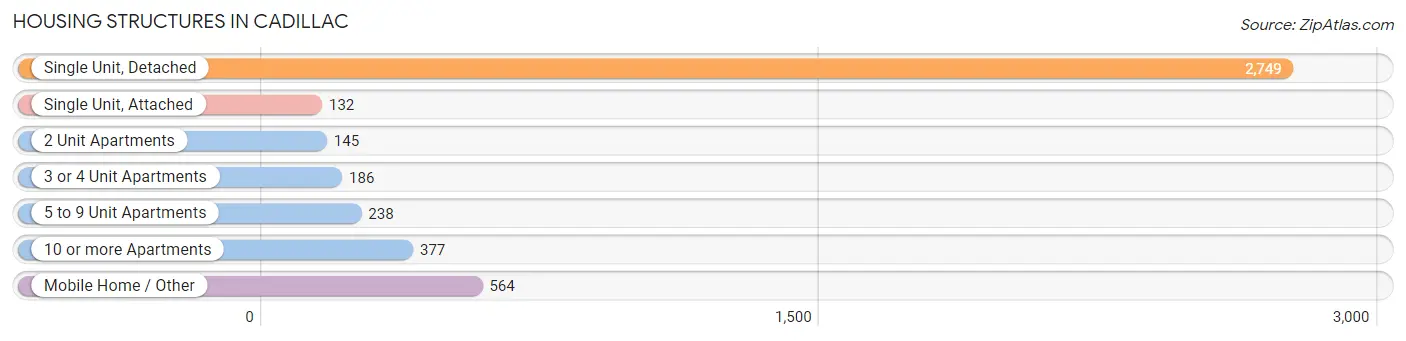
| Structure Type | # Housing Units | % Housing Units |
| Single Unit, Detached | 2,749 | 62.6% |
| Single Unit, Attached | 132 | 3.0% |
| 2 Unit Apartments | 145 | 3.3% |
| 3 or 4 Unit Apartments | 186 | 4.2% |
| 5 to 9 Unit Apartments | 238 | 5.4% |
| 10 or more Apartments | 377 | 8.6% |
| Mobile Home / Other | 564 | 12.8% |
| Total | 4,391 | 100.0% |
Housing Structures by Occupancy in Cadillac
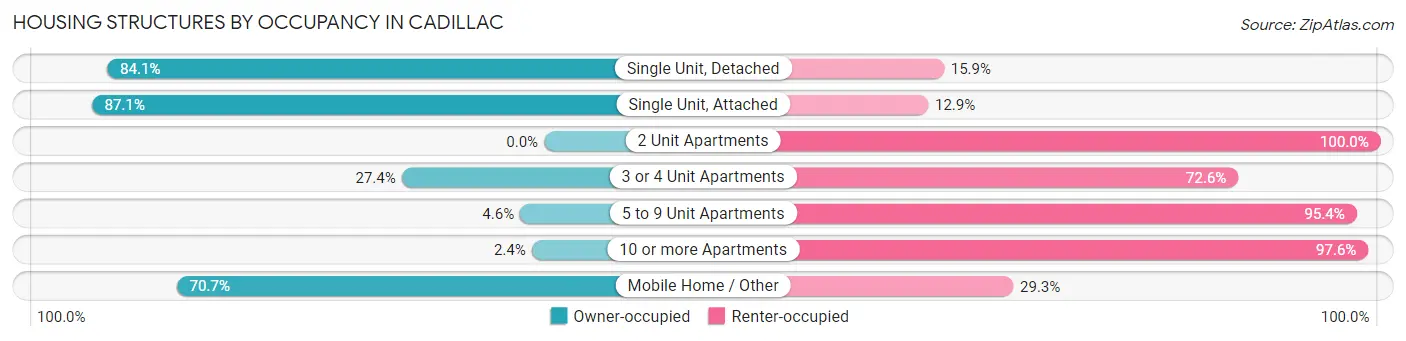
| Structure Type | Owner-occupied | Renter-occupied |
| Single Unit, Detached | 2,312 (84.1%) | 437 (15.9%) |
| Single Unit, Attached | 115 (87.1%) | 17 (12.9%) |
| 2 Unit Apartments | 0 (0.0%) | 145 (100.0%) |
| 3 or 4 Unit Apartments | 51 (27.4%) | 135 (72.6%) |
| 5 to 9 Unit Apartments | 11 (4.6%) | 227 (95.4%) |
| 10 or more Apartments | 9 (2.4%) | 368 (97.6%) |
| Mobile Home / Other | 399 (70.7%) | 165 (29.3%) |
| Total | 2,897 (66.0%) | 1,494 (34.0%) |
Housing Structures by Number of Rooms in Cadillac
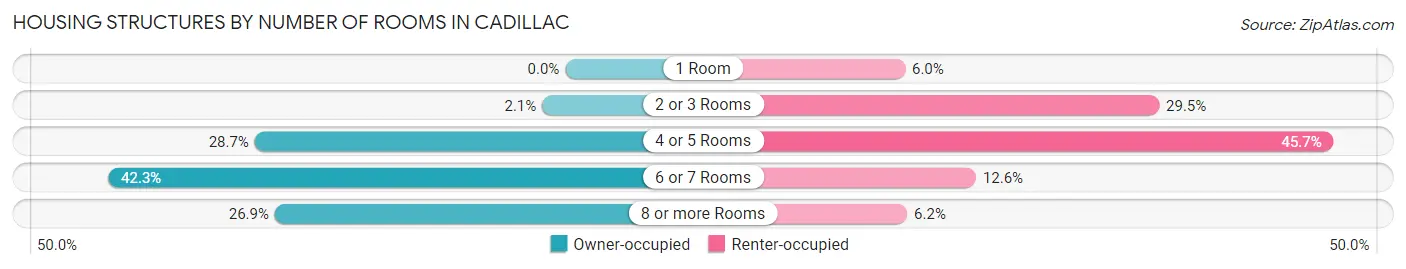
| Number of Rooms | Owner-occupied | Renter-occupied |
| 1 Room | 0 (0.0%) | 90 (6.0%) |
| 2 or 3 Rooms | 62 (2.1%) | 441 (29.5%) |
| 4 or 5 Rooms | 832 (28.7%) | 682 (45.7%) |
| 6 or 7 Rooms | 1,225 (42.3%) | 188 (12.6%) |
| 8 or more Rooms | 778 (26.9%) | 93 (6.2%) |
| Total | 2,897 (100.0%) | 1,494 (100.0%) |
Housing Structure by Heating Type in Cadillac
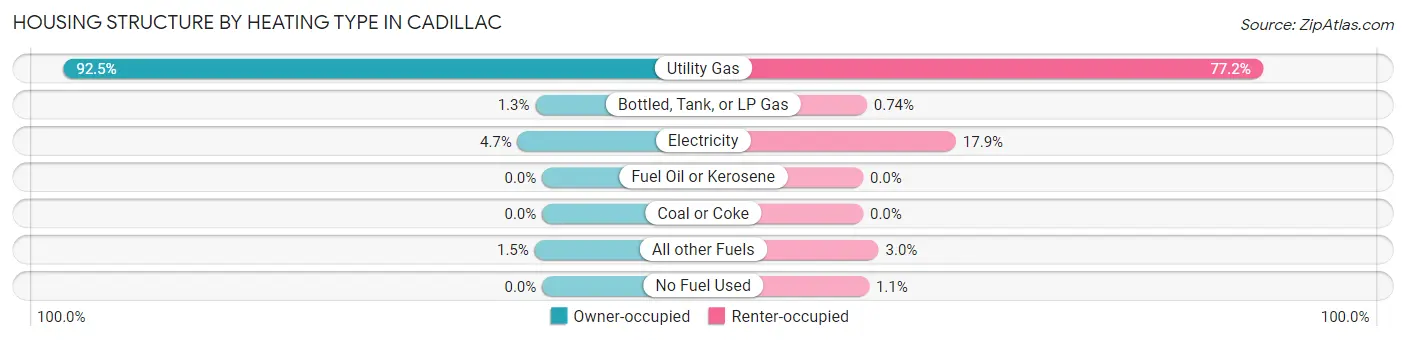
| Heating Type | Owner-occupied | Renter-occupied |
| Utility Gas | 2,680 (92.5%) | 1,153 (77.2%) |
| Bottled, Tank, or LP Gas | 38 (1.3%) | 11 (0.7%) |
| Electricity | 137 (4.7%) | 268 (17.9%) |
| Fuel Oil or Kerosene | 0 (0.0%) | 0 (0.0%) |
| Coal or Coke | 0 (0.0%) | 0 (0.0%) |
| All other Fuels | 42 (1.5%) | 45 (3.0%) |
| No Fuel Used | 0 (0.0%) | 17 (1.1%) |
| Total | 2,897 (100.0%) | 1,494 (100.0%) |
Household Vehicle Usage in Cadillac
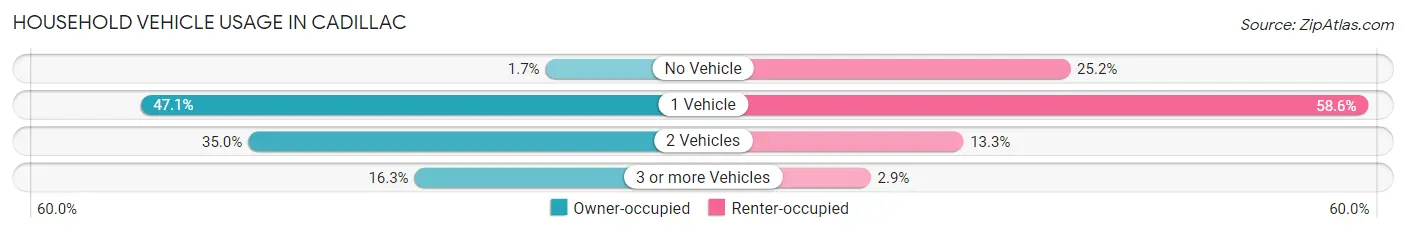
| Vehicles per Household | Owner-occupied | Renter-occupied |
| No Vehicle | 48 (1.7%) | 377 (25.2%) |
| 1 Vehicle | 1,363 (47.0%) | 876 (58.6%) |
| 2 Vehicles | 1,013 (35.0%) | 198 (13.3%) |
| 3 or more Vehicles | 473 (16.3%) | 43 (2.9%) |
| Total | 2,897 (100.0%) | 1,494 (100.0%) |
Real Estate & Mortgages in Cadillac
Real Estate and Mortgage Overview in Cadillac
| Characteristic | Without Mortgage | With Mortgage |
| Housing Units | 1,271 | 1,626 |
| Median Property Value | $96,800 | $113,500 |
| Median Household Income | $44,475 | $84 |
| Monthly Housing Costs | $455 | $32 |
| Real Estate Taxes | $1,871 | $80 |
Property Value by Mortgage Status in Cadillac
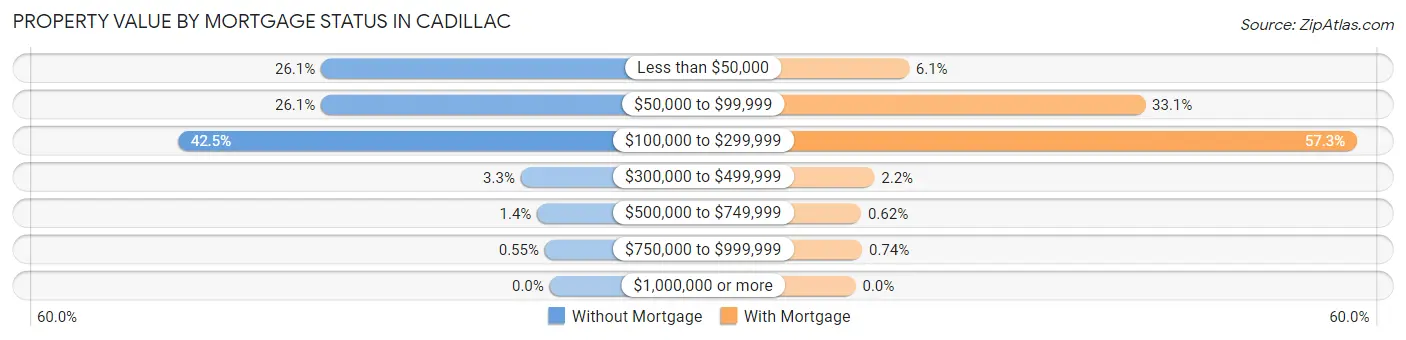
| Property Value | Without Mortgage | With Mortgage |
| Less than $50,000 | 332 (26.1%) | 99 (6.1%) |
| $50,000 to $99,999 | 332 (26.1%) | 538 (33.1%) |
| $100,000 to $299,999 | 540 (42.5%) | 932 (57.3%) |
| $300,000 to $499,999 | 42 (3.3%) | 35 (2.1%) |
| $500,000 to $749,999 | 18 (1.4%) | 10 (0.6%) |
| $750,000 to $999,999 | 7 (0.5%) | 12 (0.7%) |
| $1,000,000 or more | 0 (0.0%) | 0 (0.0%) |
| Total | 1,271 (100.0%) | 1,626 (100.0%) |
Household Income by Mortgage Status in Cadillac
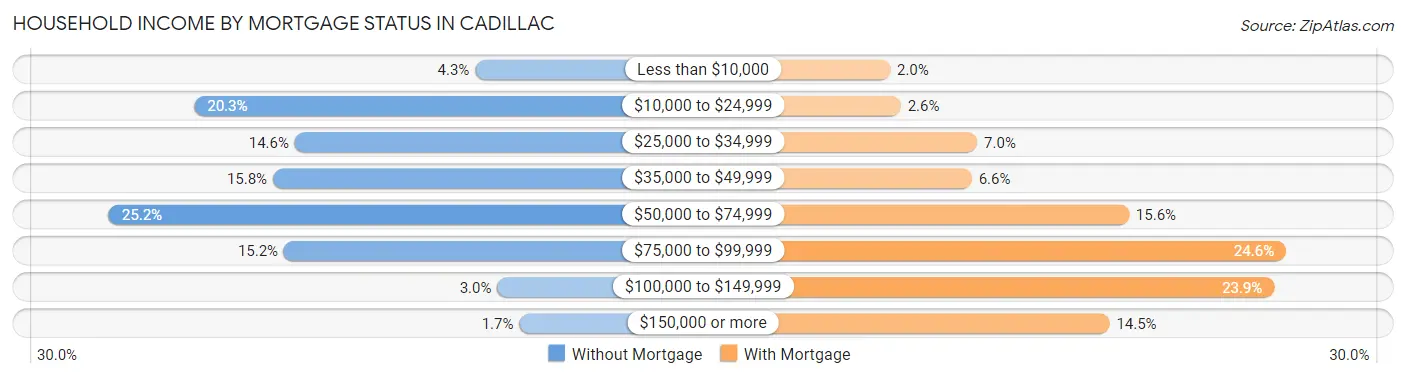
| Household Income | Without Mortgage | With Mortgage |
| Less than $10,000 | 54 (4.3%) | 32 (2.0%) |
| $10,000 to $24,999 | 258 (20.3%) | 42 (2.6%) |
| $25,000 to $34,999 | 185 (14.6%) | 113 (7.0%) |
| $35,000 to $49,999 | 201 (15.8%) | 108 (6.6%) |
| $50,000 to $74,999 | 320 (25.2%) | 254 (15.6%) |
| $75,000 to $99,999 | 193 (15.2%) | 400 (24.6%) |
| $100,000 to $149,999 | 38 (3.0%) | 389 (23.9%) |
| $150,000 or more | 22 (1.7%) | 236 (14.5%) |
| Total | 1,271 (100.0%) | 1,626 (100.0%) |
Property Value to Household Income Ratio in Cadillac
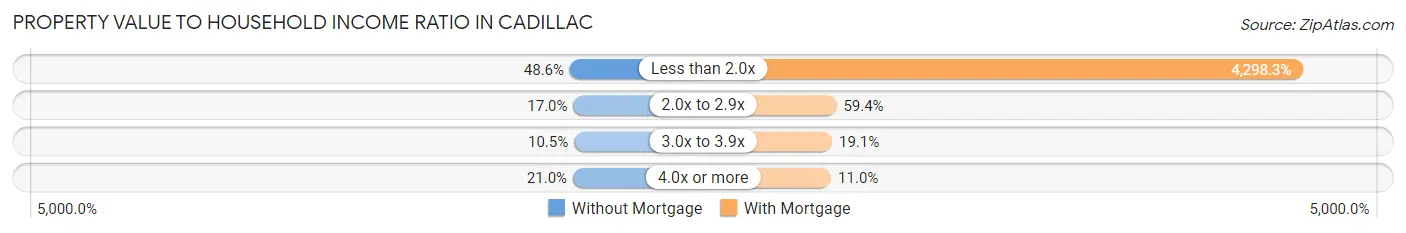
| Value-to-Income Ratio | Without Mortgage | With Mortgage |
| Less than 2.0x | 618 (48.6%) | 69,891 (4,298.3%) |
| 2.0x to 2.9x | 216 (17.0%) | 965 (59.4%) |
| 3.0x to 3.9x | 133 (10.5%) | 310 (19.1%) |
| 4.0x or more | 267 (21.0%) | 179 (11.0%) |
| Total | 1,271 (100.0%) | 1,626 (100.0%) |
Real Estate Taxes by Mortgage Status in Cadillac
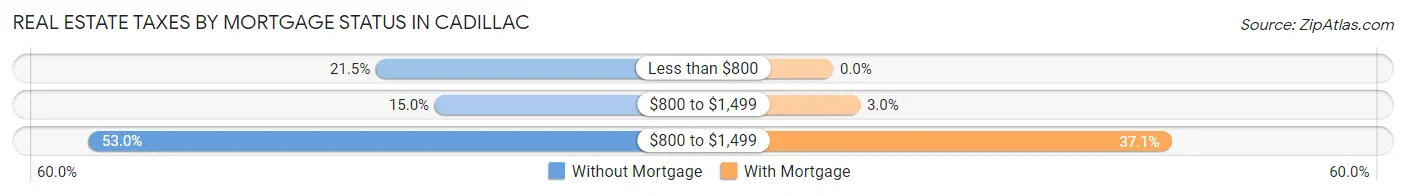
| Property Taxes | Without Mortgage | With Mortgage |
| Less than $800 | 273 (21.5%) | 0 (0.0%) |
| $800 to $1,499 | 191 (15.0%) | 48 (2.9%) |
| $800 to $1,499 | 673 (52.9%) | 603 (37.1%) |
| Total | 1,271 (100.0%) | 1,626 (100.0%) |
Health & Disability in Cadillac
Health Insurance Coverage by Age in Cadillac
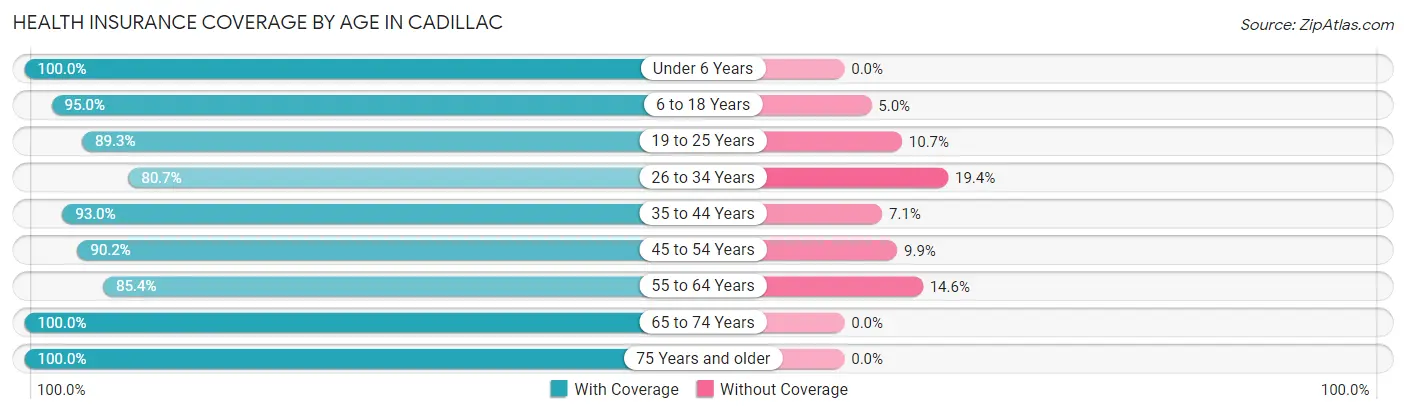
| Age Bracket | With Coverage | Without Coverage |
| Under 6 Years | 841 (100.0%) | 0 (0.0%) |
| 6 to 18 Years | 1,376 (95.0%) | 73 (5.0%) |
| 19 to 25 Years | 1,015 (89.3%) | 122 (10.7%) |
| 26 to 34 Years | 900 (80.6%) | 216 (19.4%) |
| 35 to 44 Years | 1,068 (92.9%) | 81 (7.0%) |
| 45 to 54 Years | 1,025 (90.1%) | 112 (9.9%) |
| 55 to 64 Years | 1,103 (85.4%) | 189 (14.6%) |
| 65 to 74 Years | 1,138 (100.0%) | 0 (0.0%) |
| 75 Years and older | 971 (100.0%) | 0 (0.0%) |
| Total | 9,437 (92.2%) | 793 (7.7%) |
Health Insurance Coverage by Citizenship Status in Cadillac
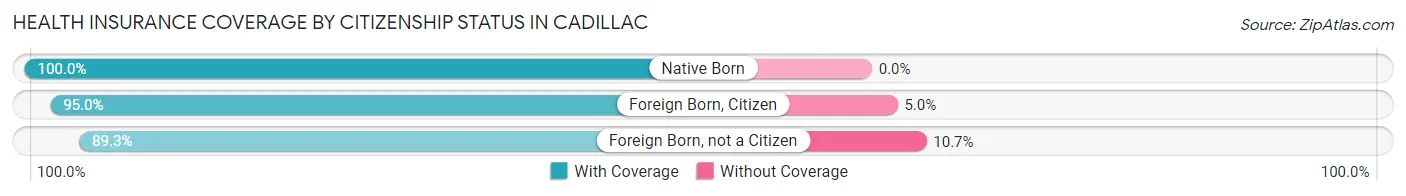
| Citizenship Status | With Coverage | Without Coverage |
| Native Born | 841 (100.0%) | 0 (0.0%) |
| Foreign Born, Citizen | 1,376 (95.0%) | 73 (5.0%) |
| Foreign Born, not a Citizen | 1,015 (89.3%) | 122 (10.7%) |
Health Insurance Coverage by Household Income in Cadillac
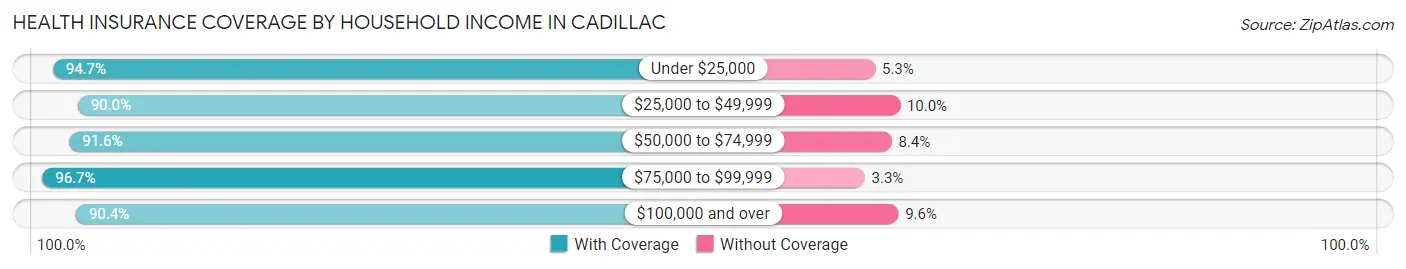
| Household Income | With Coverage | Without Coverage |
| Under $25,000 | 1,756 (94.7%) | 98 (5.3%) |
| $25,000 to $49,999 | 2,079 (90.0%) | 230 (10.0%) |
| $50,000 to $74,999 | 2,559 (91.6%) | 234 (8.4%) |
| $75,000 to $99,999 | 1,452 (96.7%) | 50 (3.3%) |
| $100,000 and over | 1,567 (90.4%) | 167 (9.6%) |
Public vs Private Health Insurance Coverage by Age in Cadillac
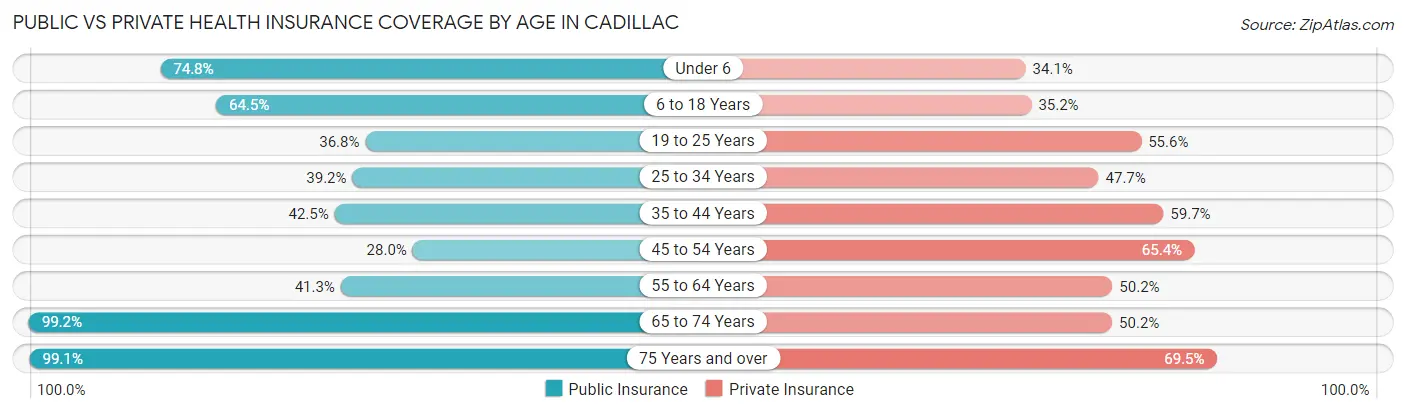
| Age Bracket | Public Insurance | Private Insurance |
| Under 6 | 629 (74.8%) | 287 (34.1%) |
| 6 to 18 Years | 934 (64.5%) | 510 (35.2%) |
| 19 to 25 Years | 418 (36.8%) | 632 (55.6%) |
| 25 to 34 Years | 437 (39.2%) | 532 (47.7%) |
| 35 to 44 Years | 488 (42.5%) | 686 (59.7%) |
| 45 to 54 Years | 318 (28.0%) | 743 (65.3%) |
| 55 to 64 Years | 534 (41.3%) | 649 (50.2%) |
| 65 to 74 Years | 1,129 (99.2%) | 571 (50.2%) |
| 75 Years and over | 962 (99.1%) | 675 (69.5%) |
| Total | 5,849 (57.2%) | 5,285 (51.7%) |
Disability Status by Sex by Age in Cadillac
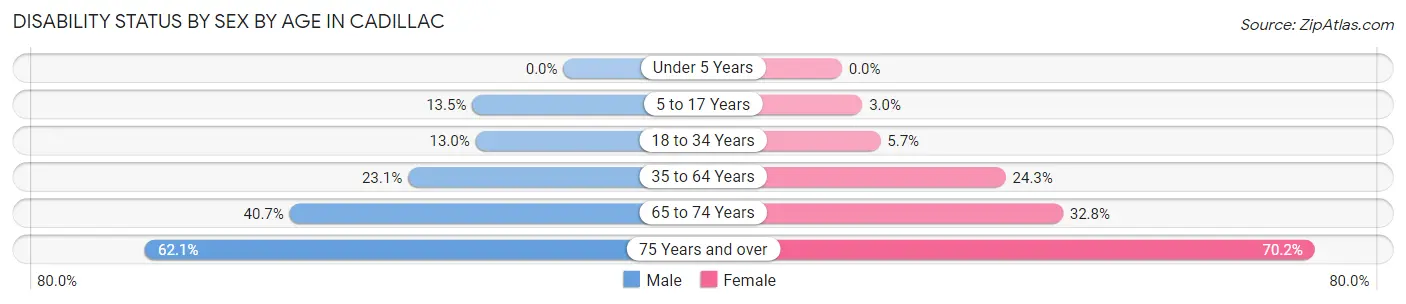
| Age Bracket | Male | Female |
| Under 5 Years | 0 (0.0%) | 0 (0.0%) |
| 5 to 17 Years | 120 (13.5%) | 22 (3.0%) |
| 18 to 34 Years | 143 (13.0%) | 68 (5.7%) |
| 35 to 64 Years | 431 (23.1%) | 416 (24.3%) |
| 65 to 74 Years | 200 (40.6%) | 212 (32.8%) |
| 75 Years and over | 282 (62.1%) | 363 (70.2%) |
Disability Class by Sex by Age in Cadillac
Disability Class: Hearing Difficulty
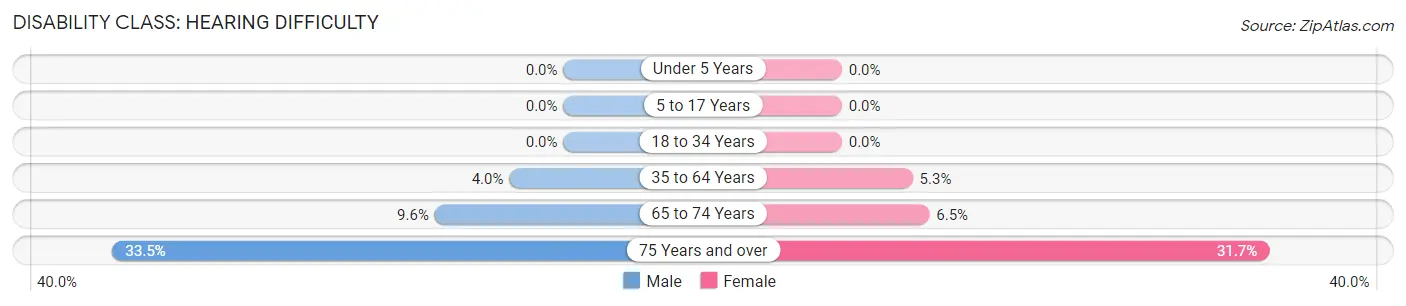
| Age Bracket | Male | Female |
| Under 5 Years | 0 (0.0%) | 0 (0.0%) |
| 5 to 17 Years | 0 (0.0%) | 0 (0.0%) |
| 18 to 34 Years | 0 (0.0%) | 0 (0.0%) |
| 35 to 64 Years | 75 (4.0%) | 90 (5.3%) |
| 65 to 74 Years | 47 (9.6%) | 42 (6.5%) |
| 75 Years and over | 152 (33.5%) | 164 (31.7%) |
Disability Class: Vision Difficulty
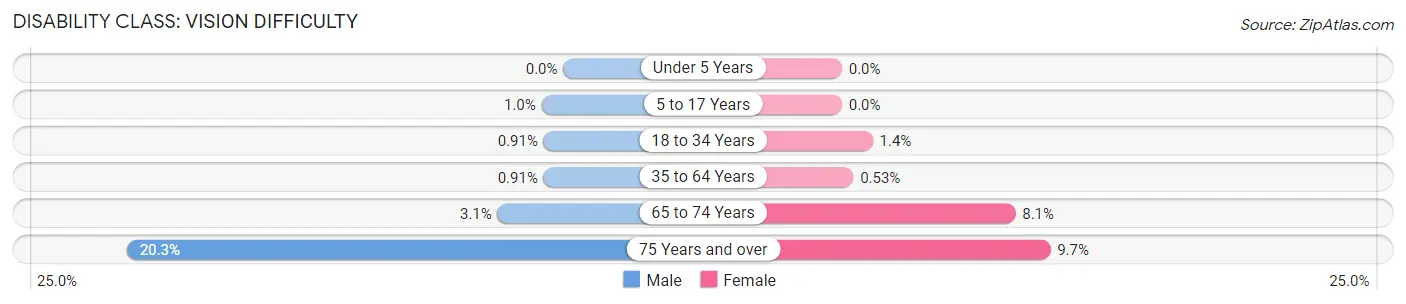
| Age Bracket | Male | Female |
| Under 5 Years | 0 (0.0%) | 0 (0.0%) |
| 5 to 17 Years | 9 (1.0%) | 0 (0.0%) |
| 18 to 34 Years | 10 (0.9%) | 17 (1.4%) |
| 35 to 64 Years | 17 (0.9%) | 9 (0.5%) |
| 65 to 74 Years | 15 (3.0%) | 52 (8.1%) |
| 75 Years and over | 92 (20.3%) | 50 (9.7%) |
Disability Class: Cognitive Difficulty
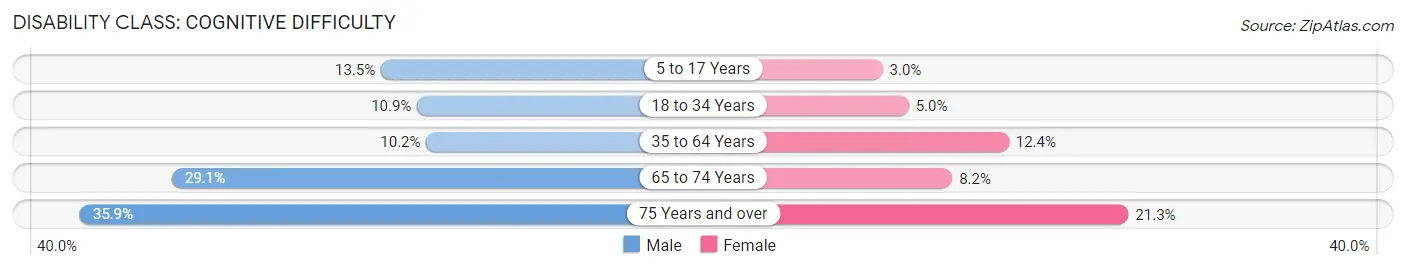
| Age Bracket | Male | Female |
| 5 to 17 Years | 120 (13.5%) | 22 (3.0%) |
| 18 to 34 Years | 119 (10.8%) | 59 (5.0%) |
| 35 to 64 Years | 190 (10.2%) | 212 (12.4%) |
| 65 to 74 Years | 143 (29.1%) | 53 (8.2%) |
| 75 Years and over | 163 (35.9%) | 110 (21.3%) |
Disability Class: Ambulatory Difficulty
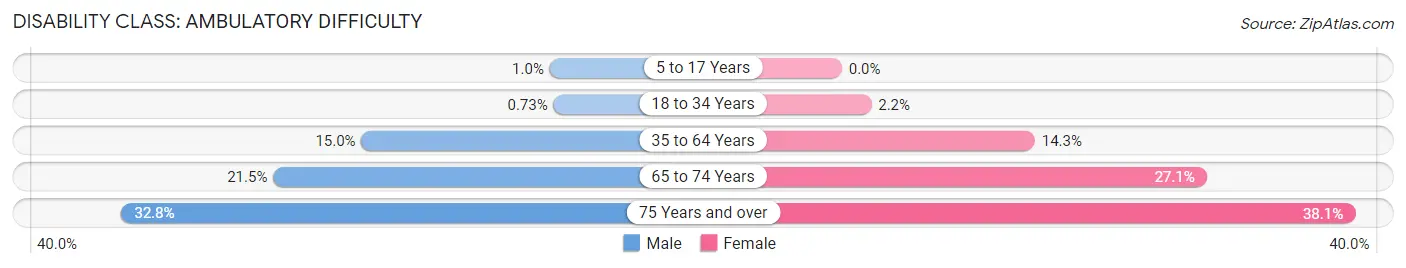
| Age Bracket | Male | Female |
| 5 to 17 Years | 9 (1.0%) | 0 (0.0%) |
| 18 to 34 Years | 8 (0.7%) | 26 (2.2%) |
| 35 to 64 Years | 280 (15.0%) | 245 (14.3%) |
| 65 to 74 Years | 106 (21.5%) | 175 (27.1%) |
| 75 Years and over | 149 (32.8%) | 197 (38.1%) |
Disability Class: Self-Care Difficulty
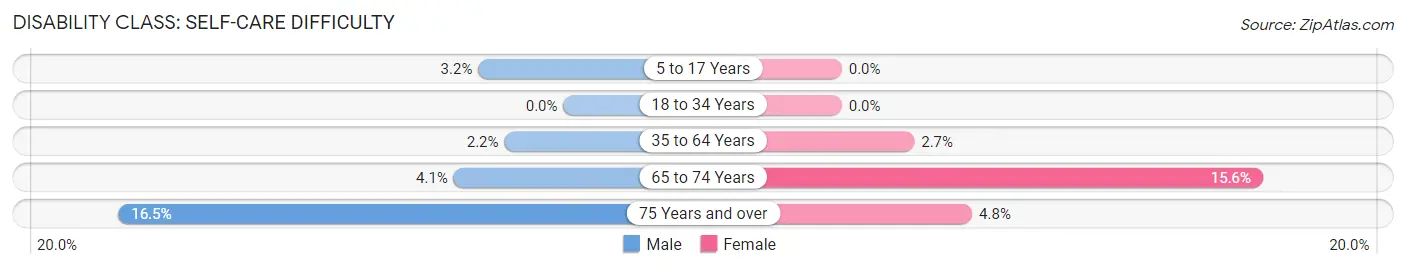
| Age Bracket | Male | Female |
| 5 to 17 Years | 28 (3.2%) | 0 (0.0%) |
| 18 to 34 Years | 0 (0.0%) | 0 (0.0%) |
| 35 to 64 Years | 41 (2.2%) | 46 (2.7%) |
| 65 to 74 Years | 20 (4.1%) | 101 (15.6%) |
| 75 Years and over | 75 (16.5%) | 25 (4.8%) |
Technology Access in Cadillac
Computing Device Access in Cadillac
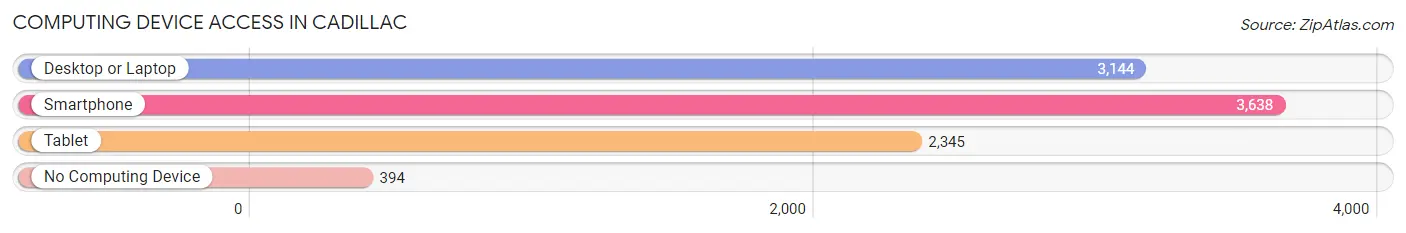
| Device Type | # Households | % Households |
| Desktop or Laptop | 3,144 | 71.6% |
| Smartphone | 3,638 | 82.9% |
| Tablet | 2,345 | 53.4% |
| No Computing Device | 394 | 9.0% |
| Total | 4,391 | 100.0% |
Internet Access in Cadillac
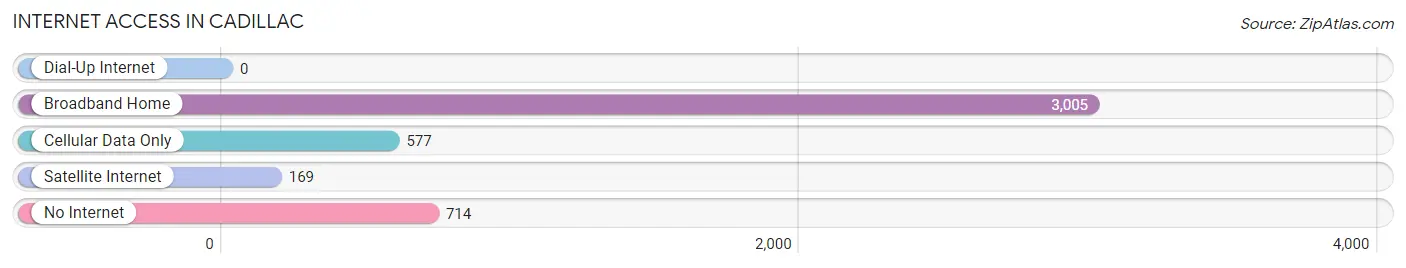
| Internet Type | # Households | % Households |
| Dial-Up Internet | 0 | 0.0% |
| Broadband Home | 3,005 | 68.4% |
| Cellular Data Only | 577 | 13.1% |
| Satellite Internet | 169 | 3.8% |
| No Internet | 714 | 16.3% |
| Total | 4,391 | 100.0% |
Cadillac Summary
Cadillac, Michigan is a city located in the northern part of the state, in Wexford County. It is the county seat and the largest city in the county. The city is situated on the shores of Lake Cadillac and Lake Mitchell, two of the largest lakes in the state. The city is home to a population of 10,355 people, according to the 2010 census.
History
The area that is now Cadillac was first settled in 1871 by a group of settlers from Cadillac, Ontario. The settlers named the area after their hometown in Canada. The first post office was established in 1872 and the city was officially incorporated in 1877.
The city was initially a lumber town, with the lumber industry providing the main source of employment for the early settlers. The city was also home to a number of sawmills and gristmills. In the late 19th century, the city began to diversify its economy, with the establishment of a number of factories, including a furniture factory, a canning factory, and a paper mill.
The city continued to grow throughout the 20th century, with the establishment of a number of new businesses and industries. The city was also home to a number of tourist attractions, including the Cadillac Motor Speedway, which opened in the 1950s.
Geography
Cadillac is located in northern Michigan, in Wexford County. The city is situated on the shores of Lake Cadillac and Lake Mitchell, two of the largest lakes in the state. The city is located about 30 miles north of Traverse City and about 60 miles south of the Mackinac Bridge.
The city has a total area of 8.2 square miles, of which 8.1 square miles is land and 0.1 square miles is water. The city is located in a hilly region, with the highest point in the city being the summit of Cadillac Mountain, which has an elevation of 1,068 feet.
Economy
The economy of Cadillac is largely based on manufacturing and tourism. The city is home to a number of manufacturing companies, including a furniture factory, a canning factory, and a paper mill. The city is also home to a number of tourist attractions, including the Cadillac Motor Speedway, which opened in the 1950s.
The city is also home to a number of retail stores, restaurants, and other businesses. The city is served by a number of major highways, including US-131, M-55, and M-115.
Demographics
According to the 2010 census, the population of Cadillac was 10,355. The racial makeup of the city was 94.3% White, 1.2% African American, 0.7% Native American, 0.7% Asian, 0.1% Pacific Islander, 1.2% from other races, and 2.0% from two or more races. Hispanic or Latino of any race were 3.2% of the population.
The median income for a household in the city was $35,945, and the median income for a family was $45,945. The per capita income for the city was $19,945. About 11.2% of families and 14.2% of the population were below the poverty line, including 19.2% of those under age 18 and 8.2% of those age 65 or over.
Common Questions
What is Per Capita Income in Cadillac?
Per Capita income in Cadillac is $24,218.
What is the Median Family Income in Cadillac?
Median Family Income in Cadillac is $61,029.
What is the Median Household income in Cadillac?
Median Household Income in Cadillac is $45,123.
What is Income or Wage Gap in Cadillac?
Income or Wage Gap in Cadillac is 22.7%.
Women in Cadillac earn 77.3 cents for every dollar earned by a man.
What is Inequality or Gini Index in Cadillac?
Inequality or Gini Index in Cadillac is 0.42.
What is the Total Population of Cadillac?
Total Population of Cadillac is 10,400.
What is the Total Male Population of Cadillac?
Total Male Population of Cadillac is 5,284.
What is the Total Female Population of Cadillac?
Total Female Population of Cadillac is 5,116.
What is the Ratio of Males per 100 Females in Cadillac?
There are 103.28 Males per 100 Females in Cadillac.
What is the Ratio of Females per 100 Males in Cadillac?
There are 96.82 Females per 100 Males in Cadillac.
What is the Median Population Age in Cadillac?
Median Population Age in Cadillac is 39.9 Years.
What is the Average Family Size in Cadillac
Average Family Size in Cadillac is 3.0 People.
What is the Average Household Size in Cadillac
Average Household Size in Cadillac is 2.3 People.
How Large is the Labor Force in Cadillac?
There are 4,562 People in the Labor Forcein in Cadillac.
What is the Percentage of People in the Labor Force in Cadillac?
55.4% of People are in the Labor Force in Cadillac.
What is the Unemployment Rate in Cadillac?
Unemployment Rate in Cadillac is 7.0%.