Brutus, MI Map & Demographics
Brutus Map
Brutus Overview
$23,855
PER CAPITA INCOME
$70,313
AVG FAMILY INCOME
$64,167
AVG HOUSEHOLD INCOME
49.2%
WAGE / INCOME GAP [ % ]
50.8¢/ $1
WAGE / INCOME GAP [ $ ]
0.31
INEQUALITY / GINI INDEX
211
TOTAL POPULATION
93
MALE POPULATION
118
FEMALE POPULATION
78.81
MALES / 100 FEMALES
126.88
FEMALES / 100 MALES
36.1
MEDIAN AGE
3.3
AVG FAMILY SIZE
3.1
AVG HOUSEHOLD SIZE
127
LABOR FORCE [ PEOPLE ]
80.4%
PERCENT IN LABOR FORCE
Brutus Zip Codes
Brutus Area Codes
Income in Brutus
Income Overview in Brutus
Per Capita Income in Brutus is $23,855, while median incomes of families and households are $70,313 and $64,167 respectively.
| Characteristic | Number | Measure |
| Per Capita Income | 211 | $23,855 |
| Median Family Income | 61 | $70,313 |
| Mean Family Income | 61 | $80,805 |
| Median Household Income | 68 | $64,167 |
| Mean Household Income | 68 | $74,409 |
| Income Deficit | 61 | $0 |
| Wage / Income Gap (%) | 211 | 49.16% |
| Wage / Income Gap ($) | 211 | 50.84¢ per $1 |
| Gini / Inequality Index | 211 | 0.31 |
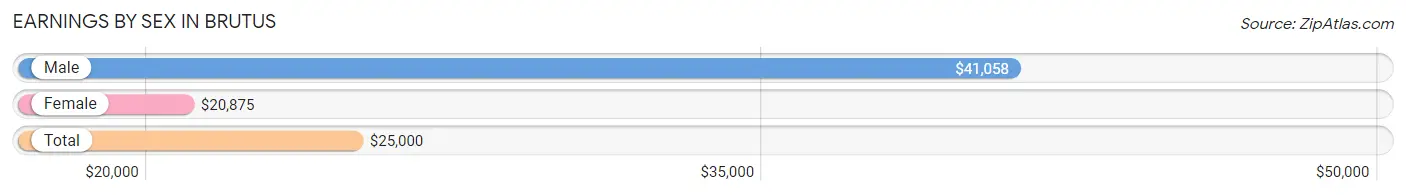
Earnings by Sex in Brutus
Average Earnings in Brutus are $25,000, $41,058 for men and $20,875 for women, a difference of 49.2%.
| Sex | Number | Average Earnings |
| Male | 71 (54.6%) | $41,058 |
| Female | 59 (45.4%) | $20,875 |
| Total | 130 (100.0%) | $25,000 |
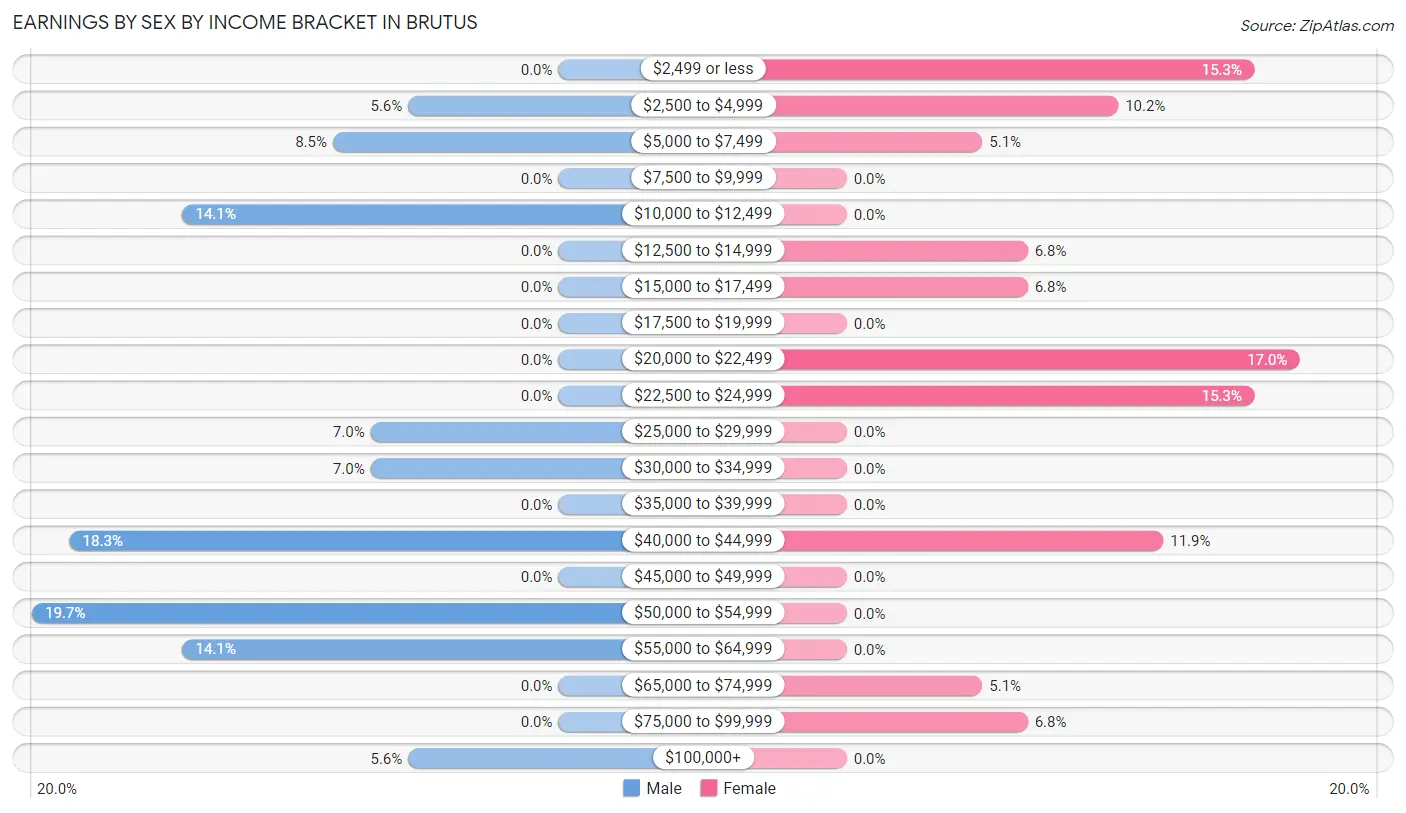
Earnings by Sex by Income Bracket in Brutus
The most common earnings brackets in Brutus are $50,000 to $54,999 for men (14 | 19.7%) and $20,000 to $22,499 for women (10 | 17.0%).
| Income | Male | Female |
| $2,499 or less | 0 (0.0%) | 9 (15.2%) |
| $2,500 to $4,999 | 4 (5.6%) | 6 (10.2%) |
| $5,000 to $7,499 | 6 (8.5%) | 3 (5.1%) |
| $7,500 to $9,999 | 0 (0.0%) | 0 (0.0%) |
| $10,000 to $12,499 | 10 (14.1%) | 0 (0.0%) |
| $12,500 to $14,999 | 0 (0.0%) | 4 (6.8%) |
| $15,000 to $17,499 | 0 (0.0%) | 4 (6.8%) |
| $17,500 to $19,999 | 0 (0.0%) | 0 (0.0%) |
| $20,000 to $22,499 | 0 (0.0%) | 10 (17.0%) |
| $22,500 to $24,999 | 0 (0.0%) | 9 (15.2%) |
| $25,000 to $29,999 | 5 (7.0%) | 0 (0.0%) |
| $30,000 to $34,999 | 5 (7.0%) | 0 (0.0%) |
| $35,000 to $39,999 | 0 (0.0%) | 0 (0.0%) |
| $40,000 to $44,999 | 13 (18.3%) | 7 (11.9%) |
| $45,000 to $49,999 | 0 (0.0%) | 0 (0.0%) |
| $50,000 to $54,999 | 14 (19.7%) | 0 (0.0%) |
| $55,000 to $64,999 | 10 (14.1%) | 0 (0.0%) |
| $65,000 to $74,999 | 0 (0.0%) | 3 (5.1%) |
| $75,000 to $99,999 | 0 (0.0%) | 4 (6.8%) |
| $100,000+ | 4 (5.6%) | 0 (0.0%) |
| Total | 71 (100.0%) | 59 (100.0%) |
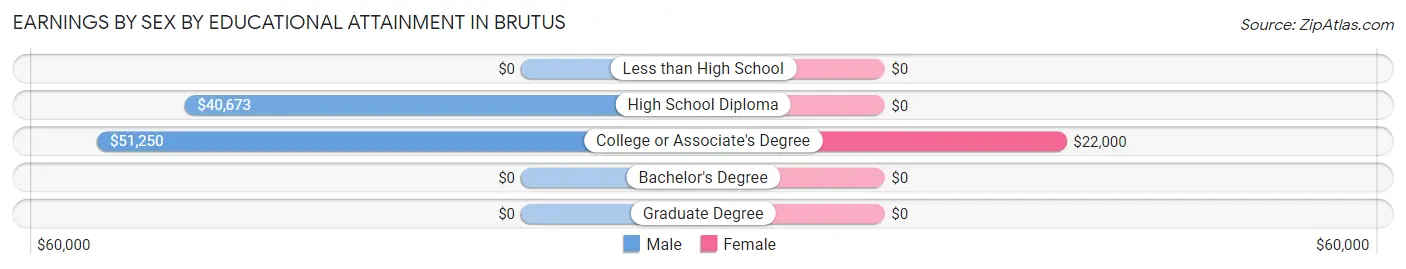
Earnings by Sex by Educational Attainment in Brutus
Average earnings in Brutus are $41,346 for men and $21,750 for women, a difference of 47.4%. Men with an educational attainment of college or associate's degree enjoy the highest average annual earnings of $51,250, while those with high school diploma education earn the least with $40,673. Women with an educational attainment of college or associate's degree earn the most with the average annual earnings of $22,000, while those with college or associate's degree education have the smallest earnings of $22,000.
| Educational Attainment | Male Income | Female Income |
| Less than High School | - | - |
| High School Diploma | $40,673 | $0 |
| College or Associate's Degree | $51,250 | $22,000 |
| Bachelor's Degree | - | - |
| Graduate Degree | - | - |
| Total | $41,346 | $21,750 |
Family Income in Brutus
Family Income Brackets in Brutus
According to the Brutus family income data, there are 19 families falling into the $50,000 to $74,999 income range, which is the most common income bracket and makes up 31.1% of all families.
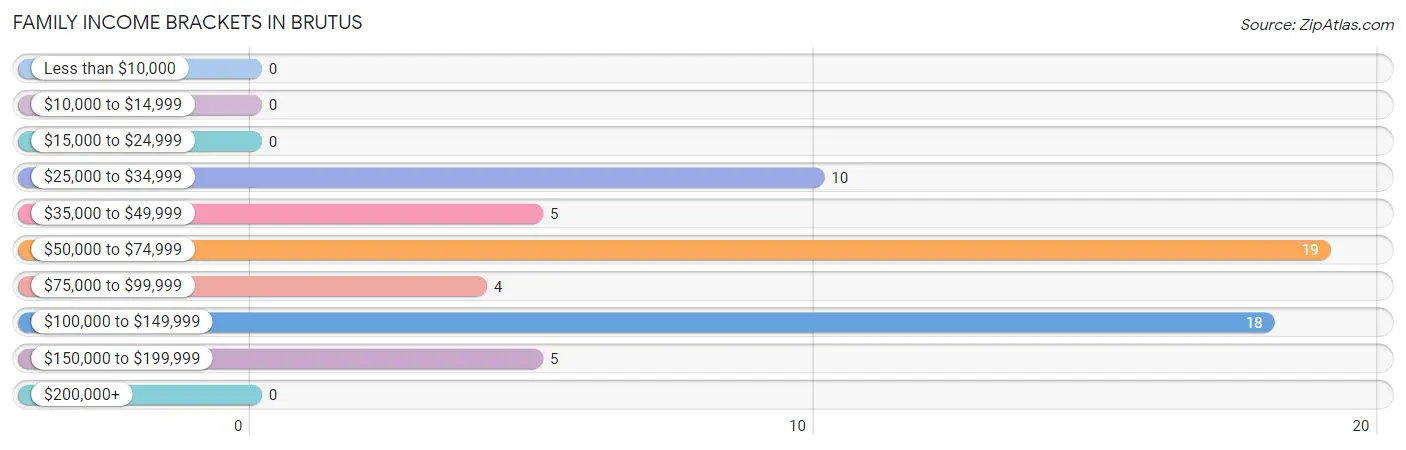
| Income Bracket | # Families | % Families |
| Less than $10,000 | 0 | 0.0% |
| $10,000 to $14,999 | 0 | 0.0% |
| $15,000 to $24,999 | 0 | 0.0% |
| $25,000 to $34,999 | 10 | 16.4% |
| $35,000 to $49,999 | 5 | 8.2% |
| $50,000 to $74,999 | 19 | 31.1% |
| $75,000 to $99,999 | 4 | 6.6% |
| $100,000 to $149,999 | 18 | 29.5% |
| $150,000 to $199,999 | 5 | 8.2% |
| $200,000+ | 0 | 0.0% |
Family Income by Famaliy Size in Brutus
4-person families (19 | 31.1%) account for the highest median family income in Brutus with $70,938 per family, while 4-person families (19 | 31.1%) have the highest median income of $17,734 per family member.
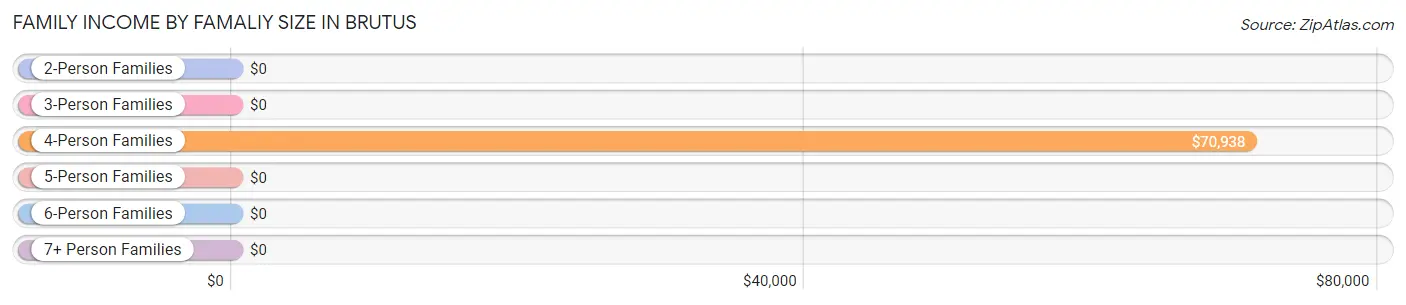
| Income Bracket | # Families | Median Income |
| 2-Person Families | 18 (29.5%) | $0 |
| 3-Person Families | 9 (14.7%) | $0 |
| 4-Person Families | 19 (31.1%) | $70,938 |
| 5-Person Families | 10 (16.4%) | $0 |
| 6-Person Families | 0 (0.0%) | $0 |
| 7+ Person Families | 5 (8.2%) | $0 |
| Total | 61 (100.0%) | $70,313 |
Family Income by Number of Earners in Brutus
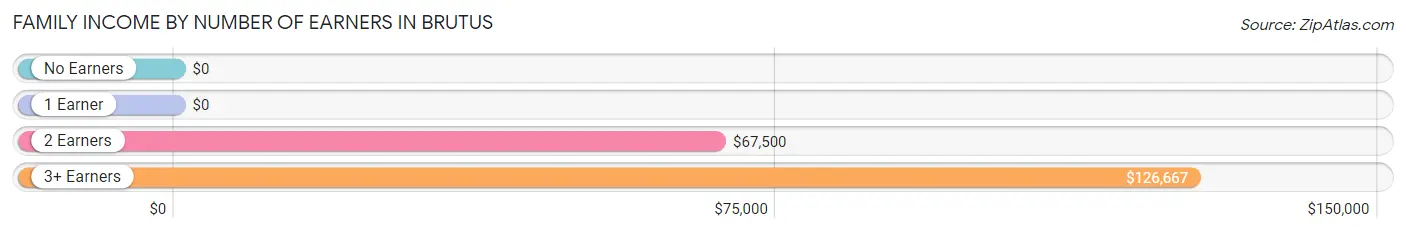
| Number of Earners | # Families | Median Income |
| No Earners | 3 (4.9%) | $0 |
| 1 Earner | 8 (13.1%) | $0 |
| 2 Earners | 38 (62.3%) | $67,500 |
| 3+ Earners | 12 (19.7%) | $126,667 |
| Total | 61 (100.0%) | $70,313 |
Household Income in Brutus
Household Income Brackets in Brutus
With 19 households falling in the category, the $50,000 to $74,999 income range is the most frequent in Brutus, accounting for 27.9% of all households.
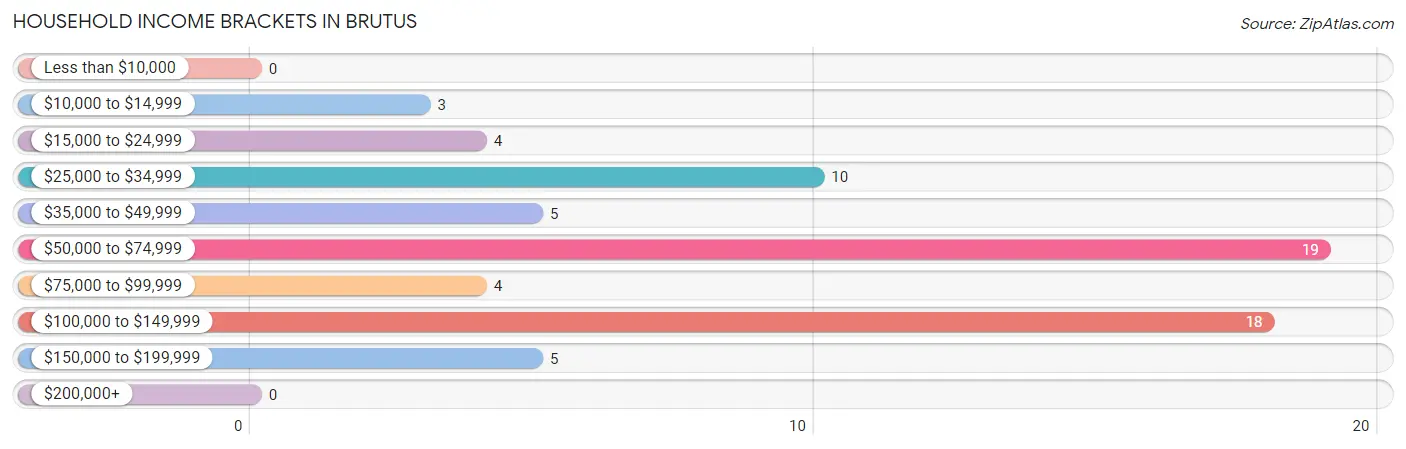
| Income Bracket | # Households | % Households |
| Less than $10,000 | 0 | 0.0% |
| $10,000 to $14,999 | 3 | 4.4% |
| $15,000 to $24,999 | 4 | 5.9% |
| $25,000 to $34,999 | 10 | 14.7% |
| $35,000 to $49,999 | 5 | 7.4% |
| $50,000 to $74,999 | 19 | 27.9% |
| $75,000 to $99,999 | 4 | 5.9% |
| $100,000 to $149,999 | 18 | 26.5% |
| $150,000 to $199,999 | 5 | 7.4% |
| $200,000+ | 0 | 0.0% |
Household Income by Householder Age in Brutus
The median household income in Brutus is $64,167, with the highest median household income of $72,188 found in the 25 to 44 years age bracket for the primary householder. A total of 41 households (60.3%) fall into this category.
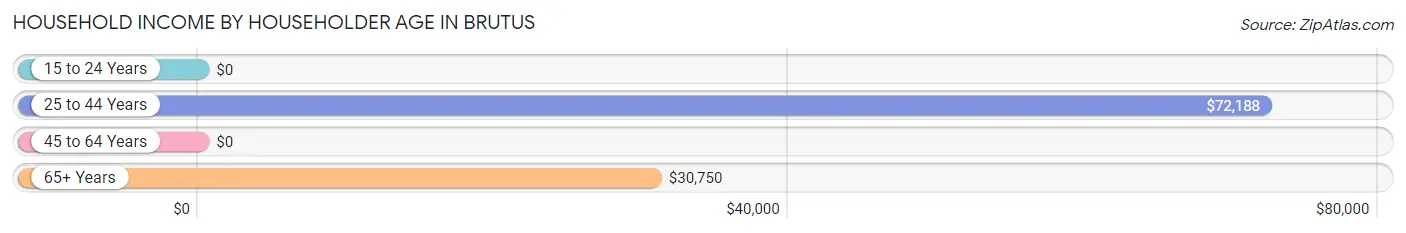
| Income Bracket | # Households | Median Income |
| 15 to 24 Years | 0 (0.0%) | $0 |
| 25 to 44 Years | 41 (60.3%) | $72,188 |
| 45 to 64 Years | 7 (10.3%) | $0 |
| 65+ Years | 20 (29.4%) | $30,750 |
| Total | 68 (100.0%) | $64,167 |
Poverty in Brutus
Income Below Poverty by Sex and Age in Brutus
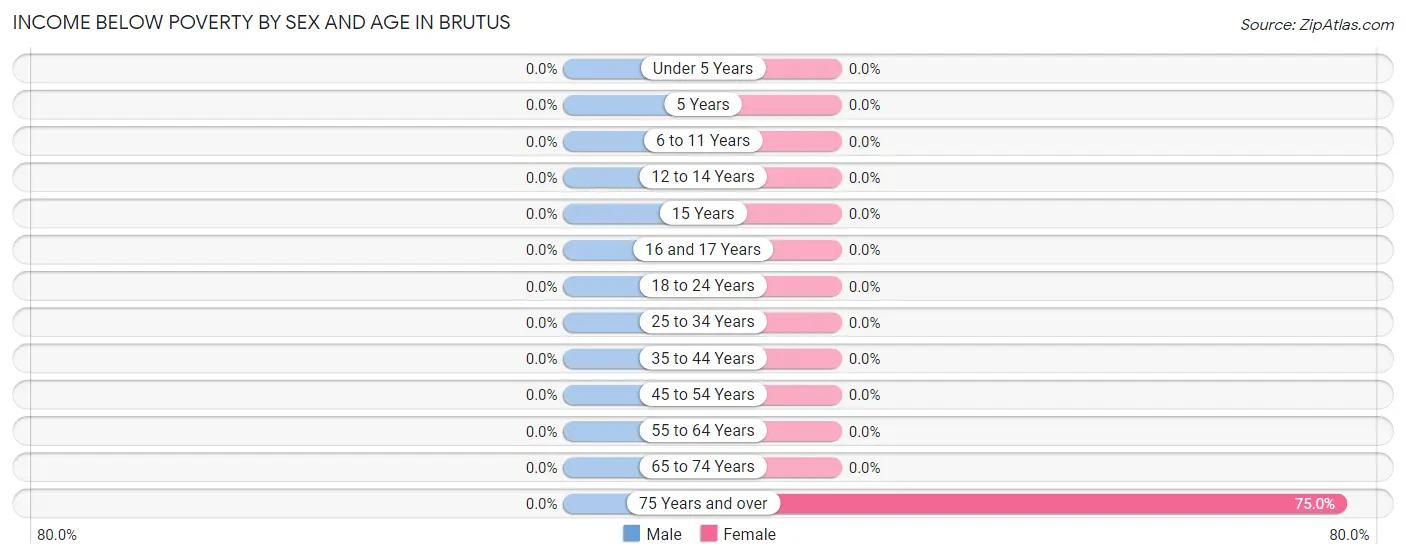
| Age Bracket | Male | Female |
| Under 5 Years | 0 (0.0%) | 0 (0.0%) |
| 5 Years | 0 (0.0%) | 0 (0.0%) |
| 6 to 11 Years | 0 (0.0%) | 0 (0.0%) |
| 12 to 14 Years | 0 (0.0%) | 0 (0.0%) |
| 15 Years | 0 (0.0%) | 0 (0.0%) |
| 16 and 17 Years | 0 (0.0%) | 0 (0.0%) |
| 18 to 24 Years | 0 (0.0%) | 0 (0.0%) |
| 25 to 34 Years | 0 (0.0%) | 0 (0.0%) |
| 35 to 44 Years | 0 (0.0%) | 0 (0.0%) |
| 45 to 54 Years | 0 (0.0%) | 0 (0.0%) |
| 55 to 64 Years | 0 (0.0%) | 0 (0.0%) |
| 65 to 74 Years | 0 (0.0%) | 0 (0.0%) |
| 75 Years and over | 0 (0.0%) | 3 (75.0%) |
| Total | 0 (0.0%) | 3 (2.5%) |
Income Above Poverty by Sex and Age in Brutus
According to the poverty statistics in Brutus, males aged under 5 years and females aged under 5 years are the age groups that are most secure financially, with 100.0% of males and 100.0% of females in these age groups living above the poverty line.
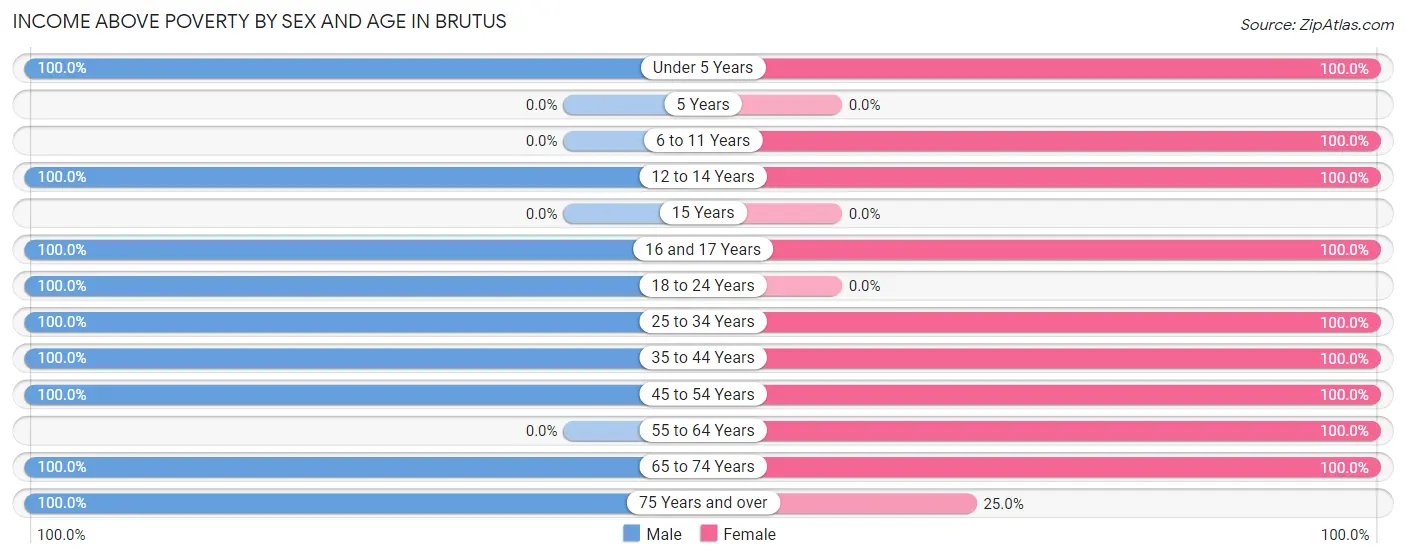
| Age Bracket | Male | Female |
| Under 5 Years | 6 (100.0%) | 8 (100.0%) |
| 5 Years | 0 (0.0%) | 0 (0.0%) |
| 6 to 11 Years | 0 (0.0%) | 17 (100.0%) |
| 12 to 14 Years | 8 (100.0%) | 14 (100.0%) |
| 15 Years | 0 (0.0%) | 0 (0.0%) |
| 16 and 17 Years | 3 (100.0%) | 7 (100.0%) |
| 18 to 24 Years | 3 (100.0%) | 0 (0.0%) |
| 25 to 34 Years | 18 (100.0%) | 20 (100.0%) |
| 35 to 44 Years | 29 (100.0%) | 20 (100.0%) |
| 45 to 54 Years | 4 (100.0%) | 3 (100.0%) |
| 55 to 64 Years | 0 (0.0%) | 4 (100.0%) |
| 65 to 74 Years | 17 (100.0%) | 21 (100.0%) |
| 75 Years and over | 5 (100.0%) | 1 (25.0%) |
| Total | 93 (100.0%) | 115 (97.5%) |
Income Below Poverty Among Married-Couple Families in Brutus
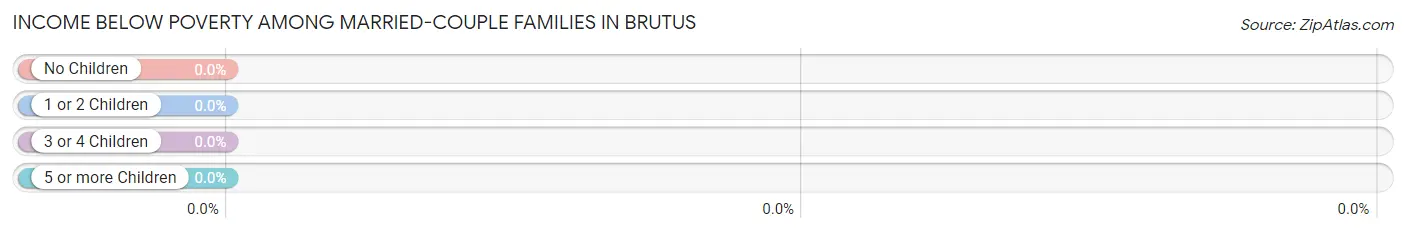
| Children | Above Poverty | Below Poverty |
| No Children | 18 (100.0%) | 0 (0.0%) |
| 1 or 2 Children | 34 (100.0%) | 0 (0.0%) |
| 3 or 4 Children | 5 (100.0%) | 0 (0.0%) |
| 5 or more Children | 0 (0.0%) | 0 (0.0%) |
| Total | 57 (100.0%) | 0 (0.0%) |
Income Below Poverty Among Single-Parent Households in Brutus
| Children | Single Father | Single Mother |
| No Children | 0 (0.0%) | 0 (0.0%) |
| 1 or 2 Children | 0 (0.0%) | 0 (0.0%) |
| 3 or 4 Children | 0 (0.0%) | 0 (0.0%) |
| 5 or more Children | 0 (0.0%) | 0 (0.0%) |
| Total | 0 (0.0%) | 0 (0.0%) |
Income Below Poverty Among Married-Couple vs Single-Parent Households in Brutus
| Children | Married-Couple Families | Single-Parent Households |
| No Children | 0 (0.0%) | 0 (0.0%) |
| 1 or 2 Children | 0 (0.0%) | 0 (0.0%) |
| 3 or 4 Children | 0 (0.0%) | 0 (0.0%) |
| 5 or more Children | 0 (0.0%) | 0 (0.0%) |
| Total | 0 (0.0%) | 0 (0.0%) |
Race in Brutus
The most populous races in Brutus are White / Caucasian (181 | 85.8%), Two or more Races (22 | 10.4%), and Native / Alaskan (7 | 3.3%).
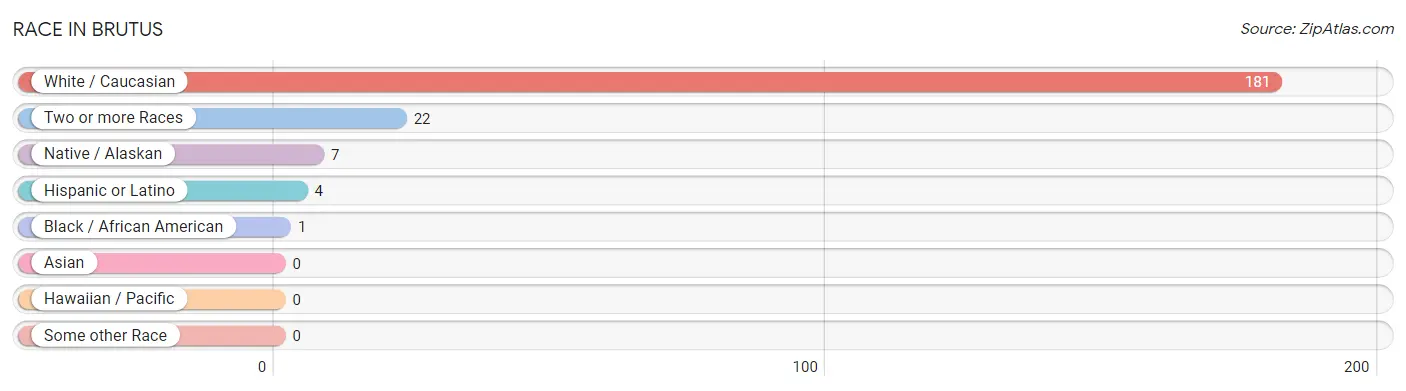
| Race | # Population | % Population |
| Asian | 0 | 0.0% |
| Black / African American | 1 | 0.5% |
| Hawaiian / Pacific | 0 | 0.0% |
| Hispanic or Latino | 4 | 1.9% |
| Native / Alaskan | 7 | 3.3% |
| White / Caucasian | 181 | 85.8% |
| Two or more Races | 22 | 10.4% |
| Some other Race | 0 | 0.0% |
| Total | 211 | 100.0% |
Ancestry in Brutus
The most populous ancestries reported in Brutus are Polish (42 | 19.9%), German (41 | 19.4%), English (35 | 16.6%), Irish (26 | 12.3%), and Arab (14 | 6.6%), together accounting for 74.9% of all Brutus residents.
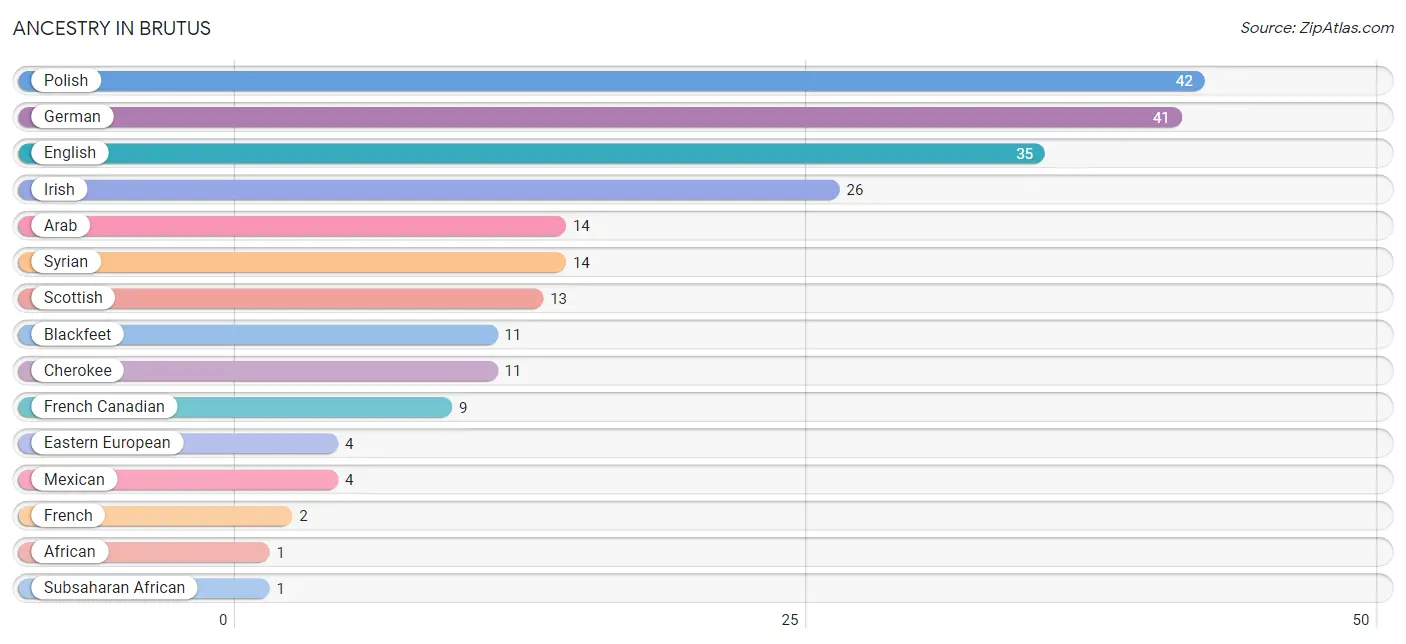
| Ancestry | # Population | % Population |
| African | 1 | 0.5% |
| Arab | 14 | 6.6% |
| Blackfeet | 11 | 5.2% |
| Cherokee | 11 | 5.2% |
| Eastern European | 4 | 1.9% |
| English | 35 | 16.6% |
| French | 2 | 0.9% |
| French Canadian | 9 | 4.3% |
| German | 41 | 19.4% |
| Irish | 26 | 12.3% |
| Mexican | 4 | 1.9% |
| Polish | 42 | 19.9% |
| Scottish | 13 | 6.2% |
| Subsaharan African | 1 | 0.5% |
| Syrian | 14 | 6.6% | View All 15 Rows |
Immigrants in Brutus
The most numerous immigrant groups reported in Brutus came from Africa (1 | 0.5%), and Eastern Africa (1 | 0.5%), together accounting for 0.9% of all Brutus residents.
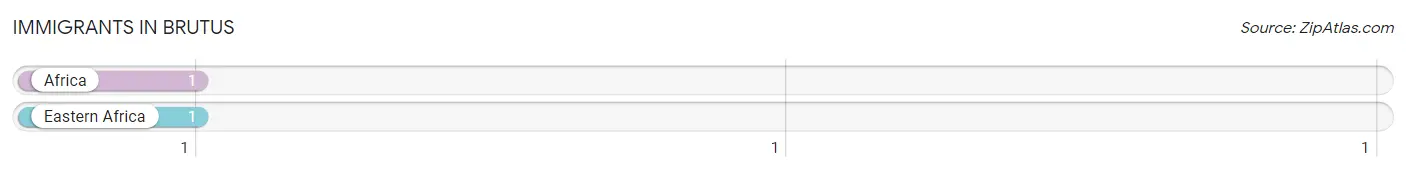
| Immigration Origin | # Population | % Population |
| Africa | 1 | 0.5% |
| Eastern Africa | 1 | 0.5% | View All 2 Rows |
Sex and Age in Brutus
Sex and Age in Brutus
The most populous age groups in Brutus are 35 to 39 Years (20 | 21.5%) for men and 10 to 14 Years (26 | 22.0%) for women.
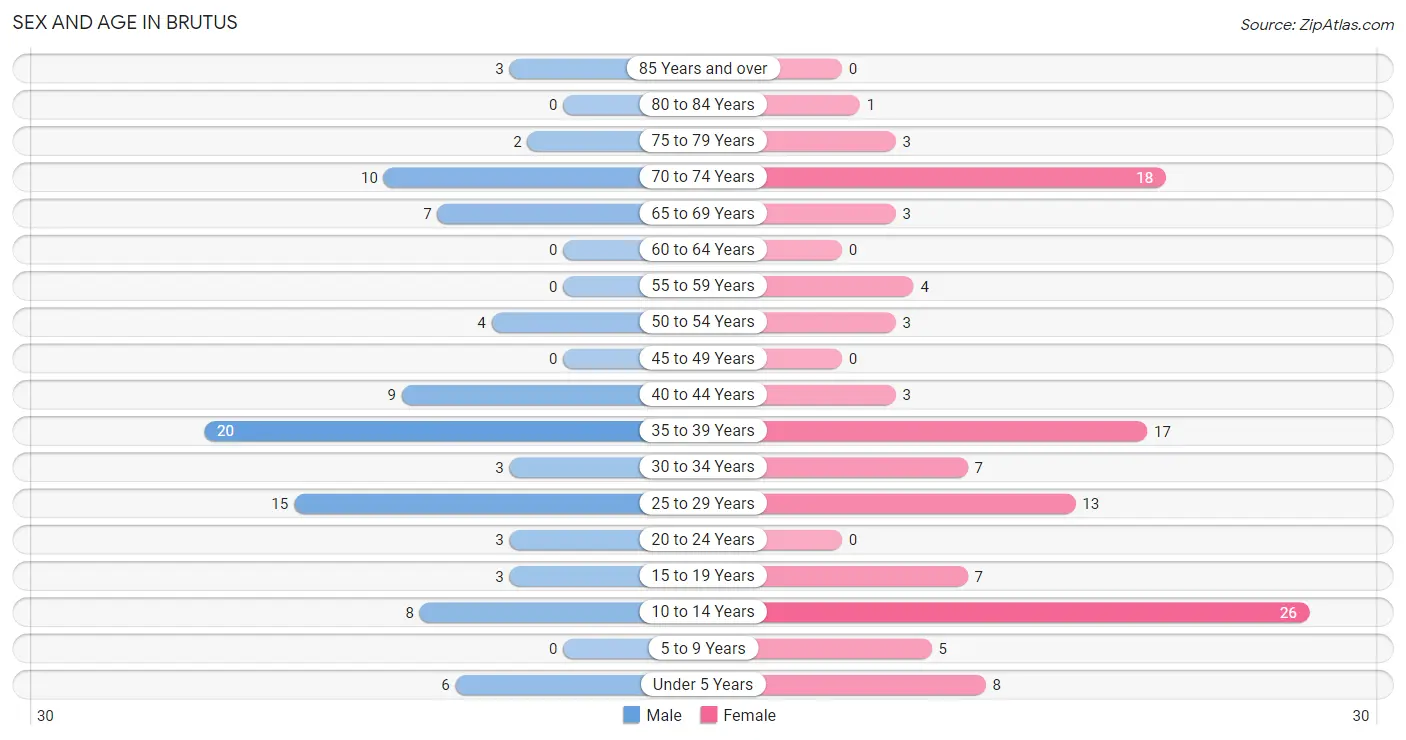
| Age Bracket | Male | Female |
| Under 5 Years | 6 (6.5%) | 8 (6.8%) |
| 5 to 9 Years | 0 (0.0%) | 5 (4.2%) |
| 10 to 14 Years | 8 (8.6%) | 26 (22.0%) |
| 15 to 19 Years | 3 (3.2%) | 7 (5.9%) |
| 20 to 24 Years | 3 (3.2%) | 0 (0.0%) |
| 25 to 29 Years | 15 (16.1%) | 13 (11.0%) |
| 30 to 34 Years | 3 (3.2%) | 7 (5.9%) |
| 35 to 39 Years | 20 (21.5%) | 17 (14.4%) |
| 40 to 44 Years | 9 (9.7%) | 3 (2.5%) |
| 45 to 49 Years | 0 (0.0%) | 0 (0.0%) |
| 50 to 54 Years | 4 (4.3%) | 3 (2.5%) |
| 55 to 59 Years | 0 (0.0%) | 4 (3.4%) |
| 60 to 64 Years | 0 (0.0%) | 0 (0.0%) |
| 65 to 69 Years | 7 (7.5%) | 3 (2.5%) |
| 70 to 74 Years | 10 (10.7%) | 18 (15.2%) |
| 75 to 79 Years | 2 (2.1%) | 3 (2.5%) |
| 80 to 84 Years | 0 (0.0%) | 1 (0.9%) |
| 85 Years and over | 3 (3.2%) | 0 (0.0%) |
| Total | 93 (100.0%) | 118 (100.0%) |
Families and Households in Brutus
Median Family Size in Brutus
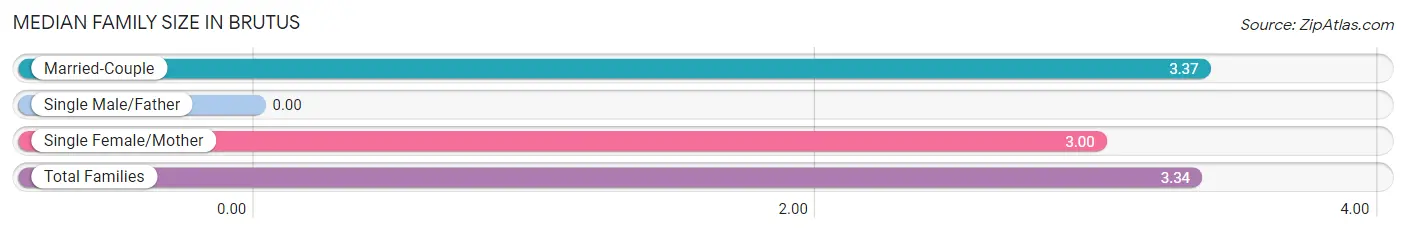
| Family Type | # Families | Family Size |
| Married-Couple | 57 (93.4%) | 3.37 |
| Single Male/Father | 0 (0.0%) | - |
| Single Female/Mother | 4 (6.6%) | 3.00 |
| Total Families | 61 (100.0%) | 3.34 |
Median Household Size in Brutus
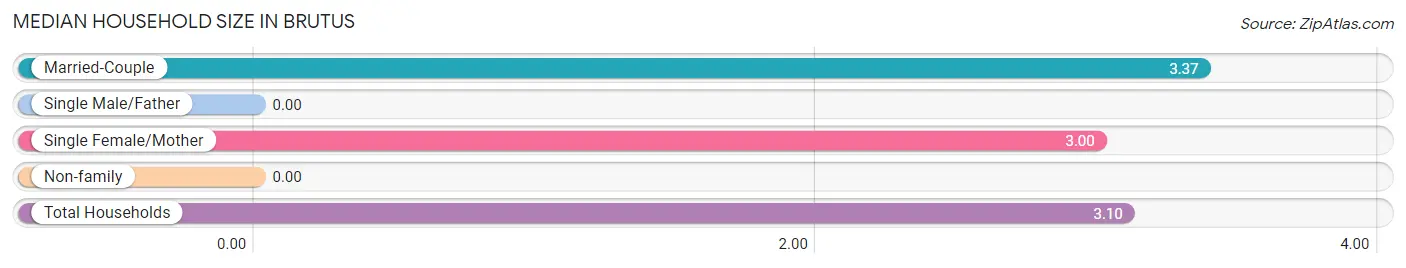
| Household Type | # Households | Household Size |
| Married-Couple | 57 (83.8%) | 3.37 |
| Single Male/Father | 0 (0.0%) | - |
| Single Female/Mother | 4 (5.9%) | 3.00 |
| Non-family | 7 (10.3%) | - |
| Total Households | 68 (100.0%) | 3.10 |
Household Size by Marriage Status in Brutus
Out of a total of 68 households in Brutus, 61 (89.7%) are family households, while 7 (10.3%) are nonfamily households. The most numerous type of family households are 4-person households, comprising 19, and the most common type of nonfamily households are 1-person households, comprising 7.
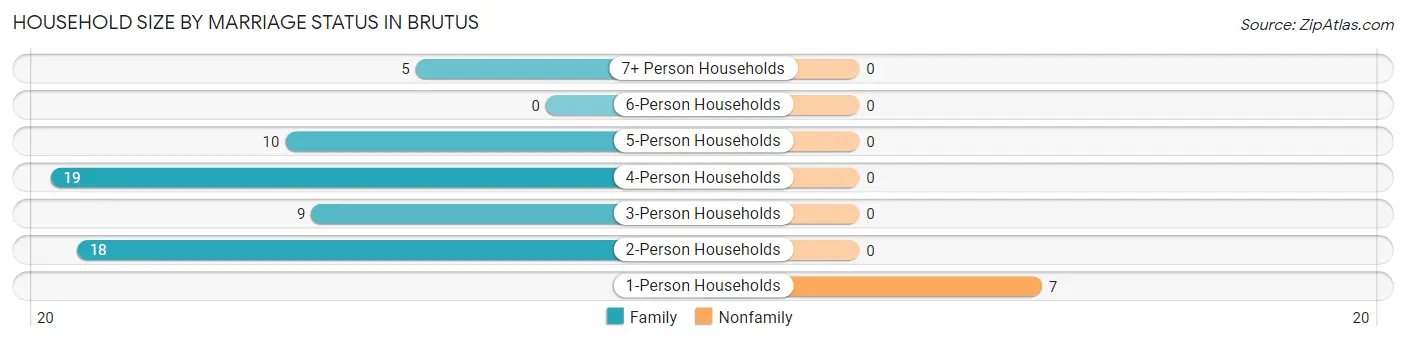
| Household Size | Family Households | Nonfamily Households |
| 1-Person Households | - | 7 (10.3%) |
| 2-Person Households | 18 (26.5%) | 0 (0.0%) |
| 3-Person Households | 9 (13.2%) | 0 (0.0%) |
| 4-Person Households | 19 (27.9%) | 0 (0.0%) |
| 5-Person Households | 10 (14.7%) | 0 (0.0%) |
| 6-Person Households | 0 (0.0%) | 0 (0.0%) |
| 7+ Person Households | 5 (7.3%) | 0 (0.0%) |
| Total | 61 (89.7%) | 7 (10.3%) |
Female Fertility in Brutus
Fertility by Age in Brutus
Average fertility rate in Brutus is 255.0 births per 1,000 women. Women in the age bracket of 20 to 34 years have the highest fertility rate with 600.0 births per 1,000 women. Women in the age bracket of 20 to 34 years acount for 100.0% of all women with births.
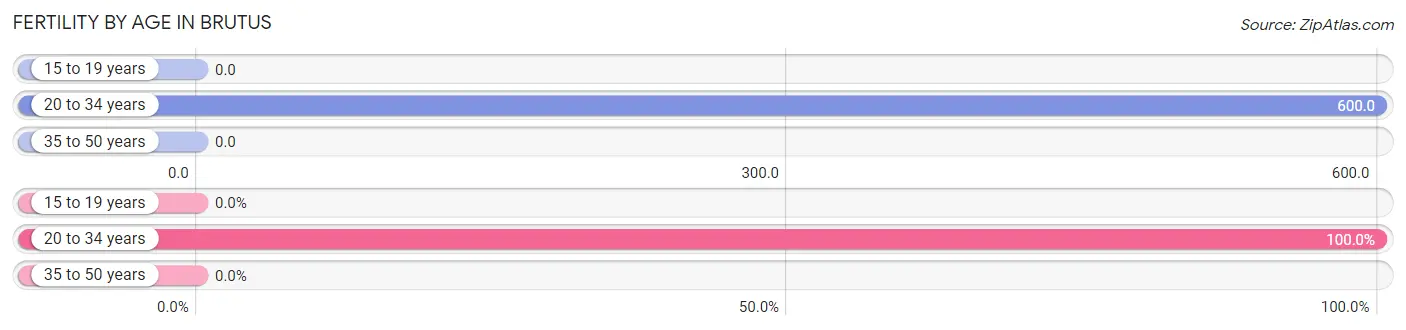
| Age Bracket | Women with Births | Births / 1,000 Women |
| 15 to 19 years | 0 (0.0%) | 0.0 |
| 20 to 34 years | 12 (100.0%) | 600.0 |
| 35 to 50 years | 0 (0.0%) | 0.0 |
| Total | 12 (100.0%) | 255.0 |
Fertility by Age by Marriage Status in Brutus
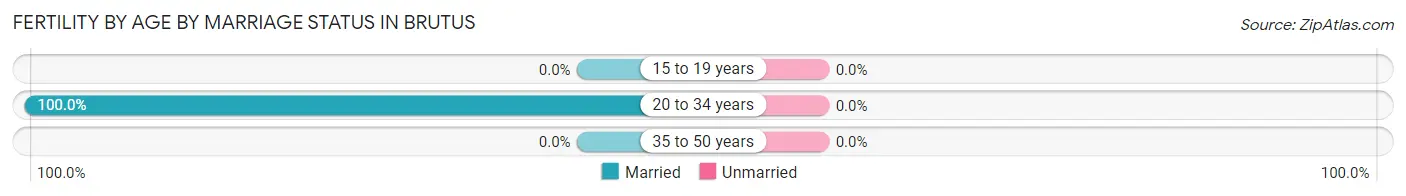
| Age Bracket | Married | Unmarried |
| 15 to 19 years | 0 (0.0%) | 0 (0.0%) |
| 20 to 34 years | 12 (100.0%) | 0 (0.0%) |
| 35 to 50 years | 0 (0.0%) | 0 (0.0%) |
| Total | 12 (100.0%) | 0 (0.0%) |
Fertility by Education in Brutus
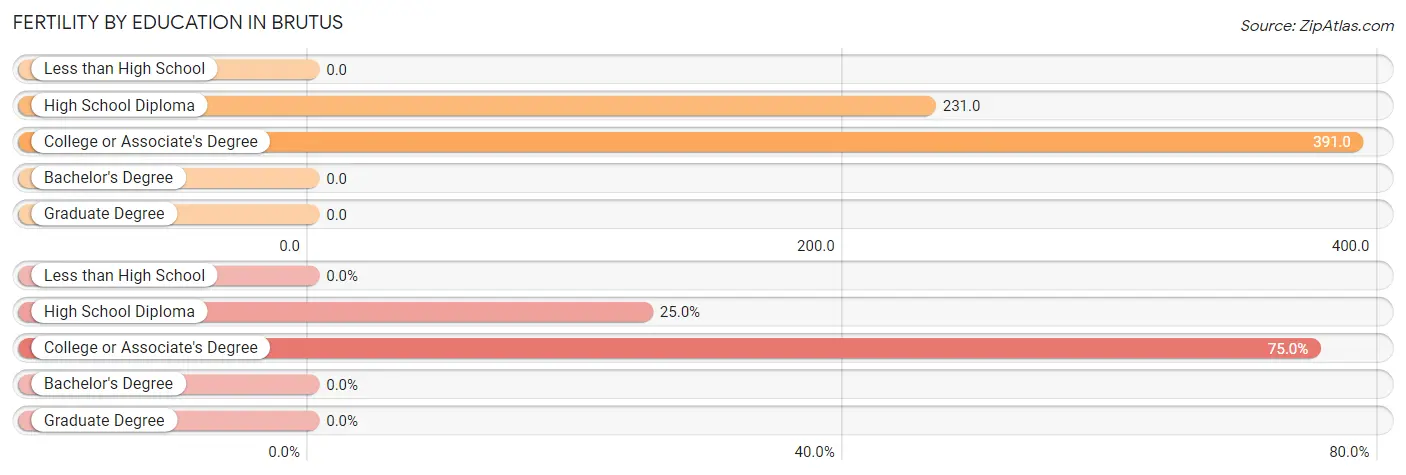
| Educational Attainment | Women with Births | Births / 1,000 Women |
| Less than High School | 0 (0.0%) | 0.0 |
| High School Diploma | 3 (25.0%) | 231.0 |
| College or Associate's Degree | 9 (75.0%) | 391.0 |
| Bachelor's Degree | 0 (0.0%) | 0.0 |
| Graduate Degree | 0 (0.0%) | 0.0 |
| Total | 12 (100.0%) | 255.0 |
Fertility by Education by Marriage Status in Brutus
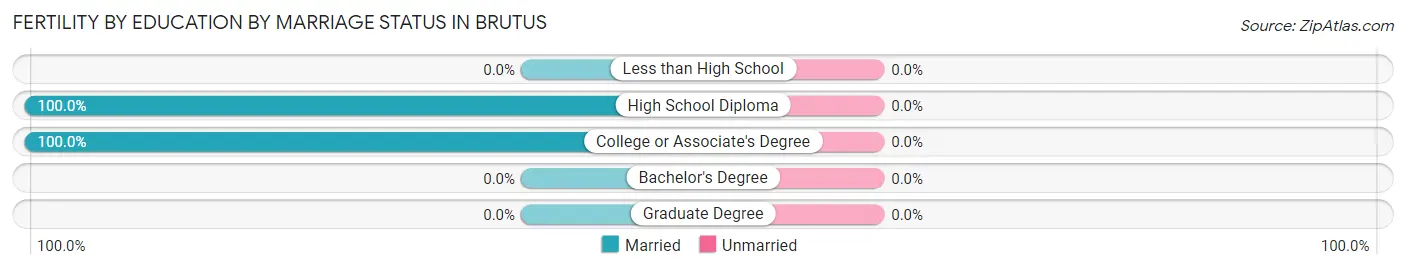
| Educational Attainment | Married | Unmarried |
| Less than High School | 0 (0.0%) | 0 (0.0%) |
| High School Diploma | 3 (100.0%) | 0 (0.0%) |
| College or Associate's Degree | 9 (100.0%) | 0 (0.0%) |
| Bachelor's Degree | 0 (0.0%) | 0 (0.0%) |
| Graduate Degree | 0 (0.0%) | 0 (0.0%) |
| Total | 12 (100.0%) | 0 (0.0%) |
Employment Characteristics in Brutus
Employment by Class of Employer in Brutus
Among the 118 employed individuals in Brutus, private company employees (61 | 51.7%), self-employed (not incorporated) (29 | 24.6%), and local government employees (14 | 11.9%) make up the most common classes of employment.
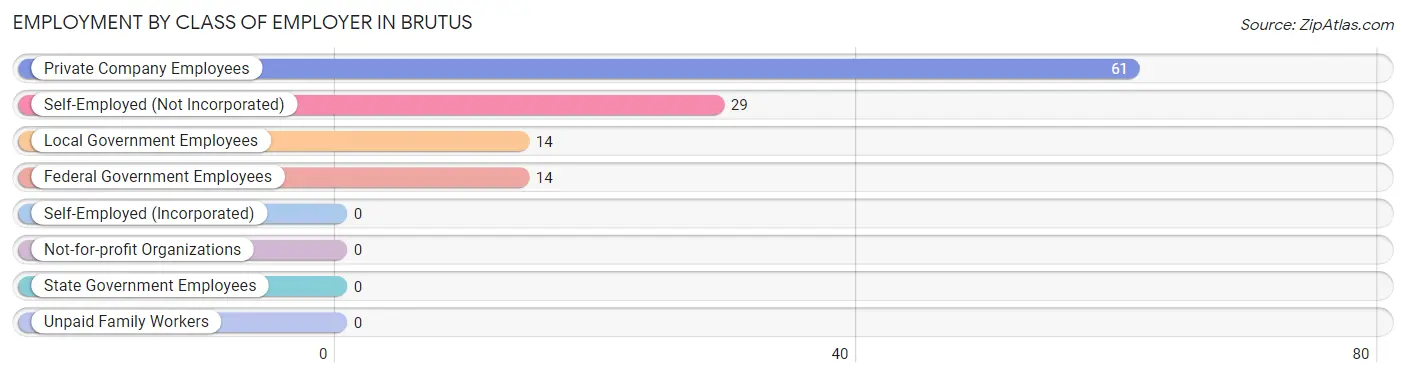
| Employer Class | # Employees | % Employees |
| Private Company Employees | 61 | 51.7% |
| Self-Employed (Incorporated) | 0 | 0.0% |
| Self-Employed (Not Incorporated) | 29 | 24.6% |
| Not-for-profit Organizations | 0 | 0.0% |
| Local Government Employees | 14 | 11.9% |
| State Government Employees | 0 | 0.0% |
| Federal Government Employees | 14 | 11.9% |
| Unpaid Family Workers | 0 | 0.0% |
| Total | 118 | 100.0% |
Employment Status by Age in Brutus
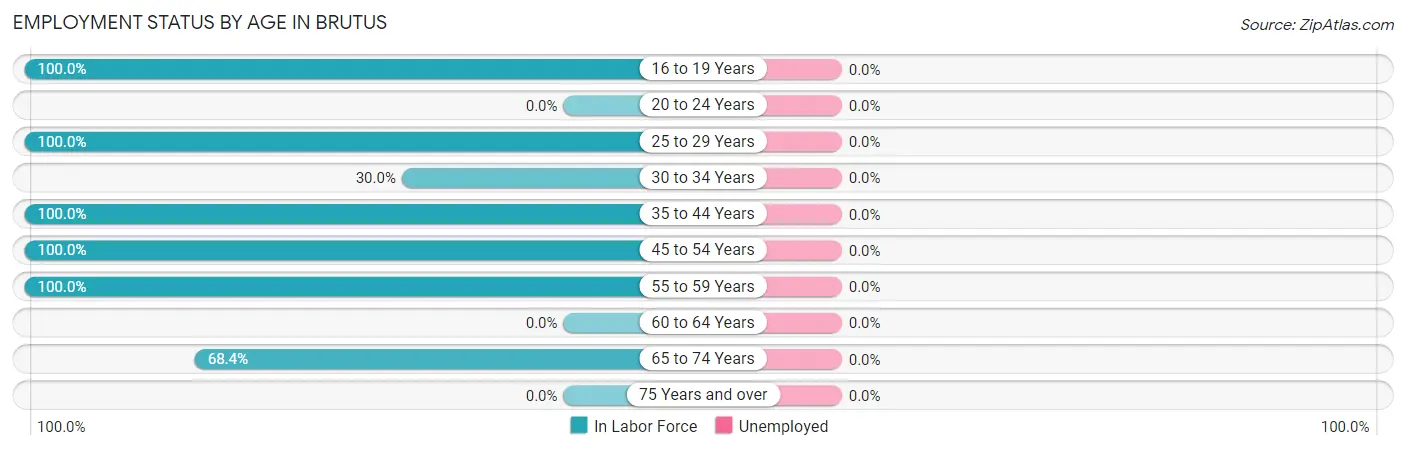
| Age Bracket | In Labor Force | Unemployed |
| 16 to 19 Years | 10 (100.0%) | 0 (0.0%) |
| 20 to 24 Years | 0 (0.0%) | 0 (0.0%) |
| 25 to 29 Years | 28 (100.0%) | 0 (0.0%) |
| 30 to 34 Years | 3 (30.0%) | 0 (0.0%) |
| 35 to 44 Years | 49 (100.0%) | 0 (0.0%) |
| 45 to 54 Years | 7 (100.0%) | 0 (0.0%) |
| 55 to 59 Years | 4 (100.0%) | 0 (0.0%) |
| 60 to 64 Years | 0 (0.0%) | 0 (0.0%) |
| 65 to 74 Years | 26 (68.4%) | 0 (0.0%) |
| 75 Years and over | 0 (0.0%) | 0 (0.0%) |
| Total | 127 (80.4%) | 0 (0.0%) |
Employment Status by Educational Attainment in Brutus
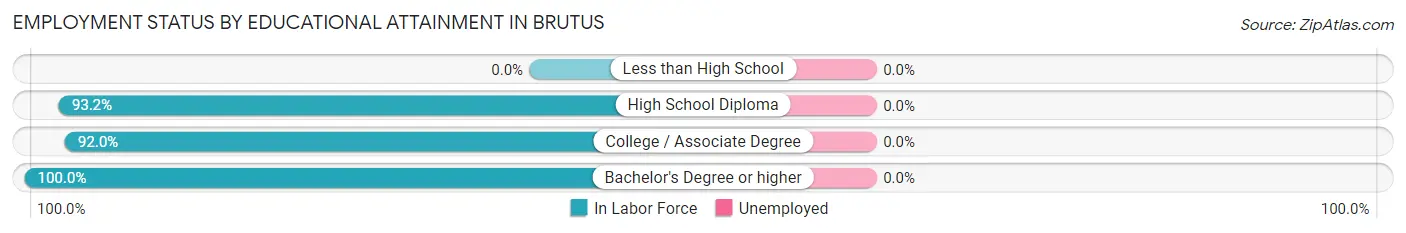
| Educational Attainment | In Labor Force | Unemployed |
| Less than High School | 0 (0.0%) | 0 (0.0%) |
| High School Diploma | 41 (93.2%) | 0 (0.0%) |
| College / Associate Degree | 46 (92.0%) | 0 (0.0%) |
| Bachelor's Degree or higher | 4 (100.0%) | 0 (0.0%) |
| Total | 91 (92.9%) | 0 (0.0%) |
Employment Occupations by Sex in Brutus
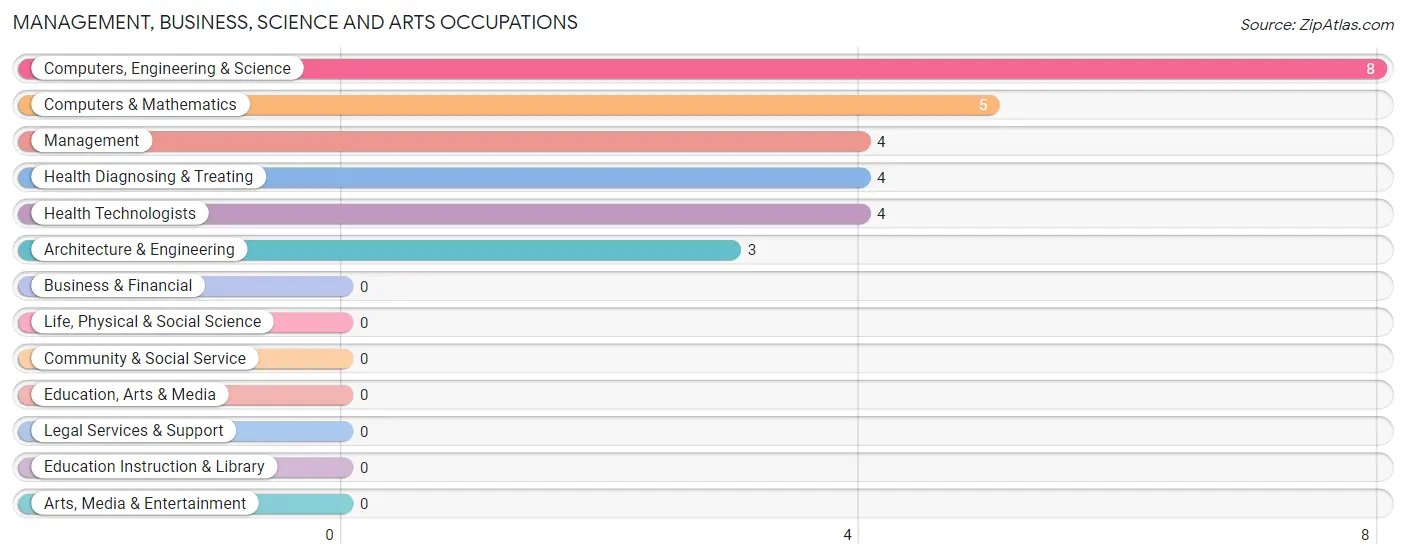
Management, Business, Science and Arts Occupations
The most common Management, Business, Science and Arts occupations in Brutus are Computers, Engineering & Science (8 | 6.3%), Computers & Mathematics (5 | 3.9%), Management (4 | 3.2%), Health Diagnosing & Treating (4 | 3.2%), and Health Technologists (4 | 3.2%).
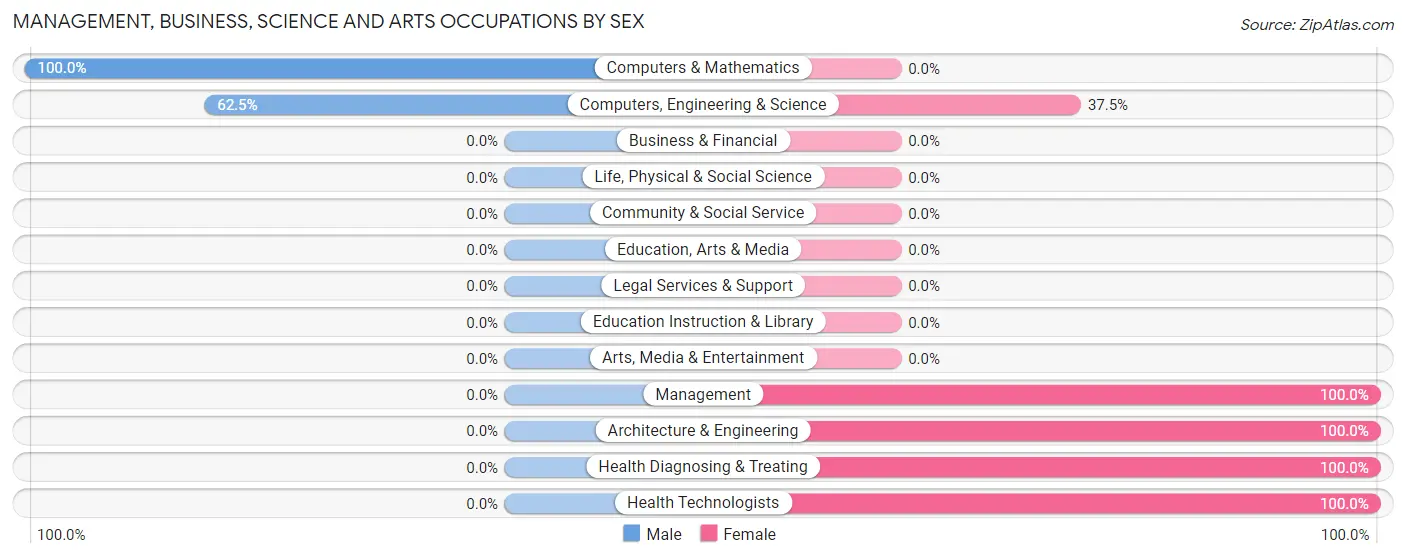
Management, Business, Science and Arts Occupations by Sex
Within the Management, Business, Science and Arts occupations in Brutus, the most male-oriented occupations are Computers & Mathematics (100.0%), and Computers, Engineering & Science (62.5%), while the most female-oriented occupations are Management (100.0%), Architecture & Engineering (100.0%), and Health Diagnosing & Treating (100.0%).
| Occupation | Male | Female |
| Management | 0 (0.0%) | 4 (100.0%) |
| Business & Financial | 0 (0.0%) | 0 (0.0%) |
| Computers, Engineering & Science | 5 (62.5%) | 3 (37.5%) |
| Computers & Mathematics | 5 (100.0%) | 0 (0.0%) |
| Architecture & Engineering | 0 (0.0%) | 3 (100.0%) |
| Life, Physical & Social Science | 0 (0.0%) | 0 (0.0%) |
| Community & Social Service | 0 (0.0%) | 0 (0.0%) |
| Education, Arts & Media | 0 (0.0%) | 0 (0.0%) |
| Legal Services & Support | 0 (0.0%) | 0 (0.0%) |
| Education Instruction & Library | 0 (0.0%) | 0 (0.0%) |
| Arts, Media & Entertainment | 0 (0.0%) | 0 (0.0%) |
| Health Diagnosing & Treating | 0 (0.0%) | 4 (100.0%) |
| Health Technologists | 0 (0.0%) | 4 (100.0%) |
| Total (Category) | 5 (31.2%) | 11 (68.8%) |
| Total (Overall) | 71 (55.9%) | 56 (44.1%) |
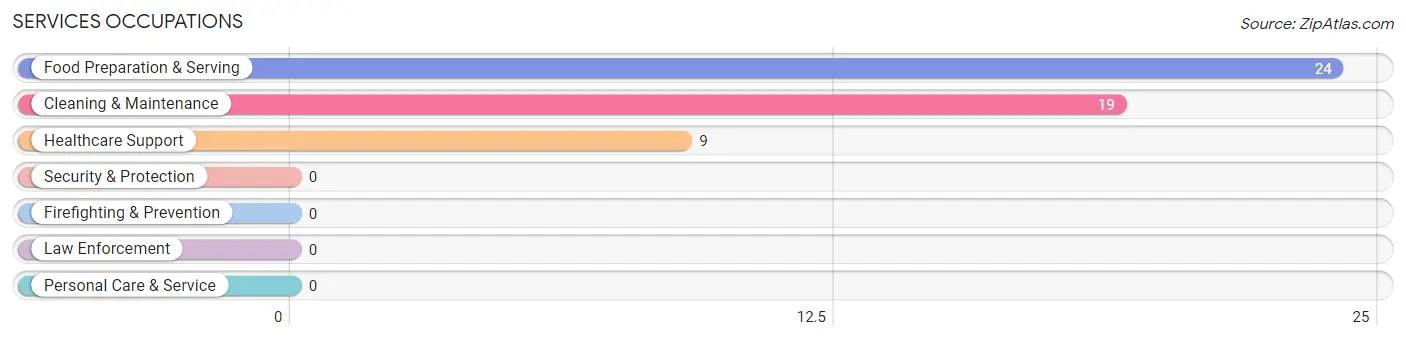
Services Occupations
The most common Services occupations in Brutus are Food Preparation & Serving (24 | 18.9%), Cleaning & Maintenance (19 | 15.0%), and Healthcare Support (9 | 7.1%).
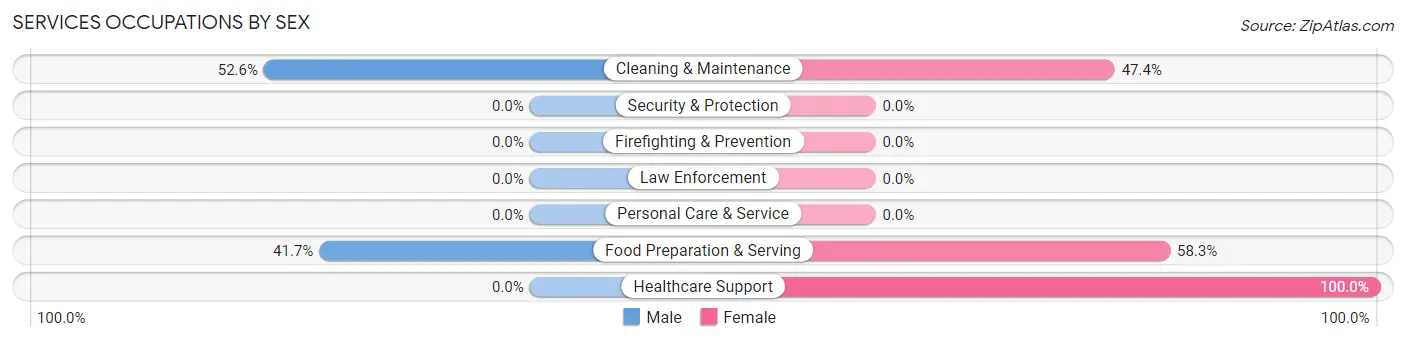
Services Occupations by Sex
Within the Services occupations in Brutus, the most male-oriented occupations are Cleaning & Maintenance (52.6%), and Food Preparation & Serving (41.7%), while the most female-oriented occupations are Healthcare Support (100.0%), Food Preparation & Serving (58.3%), and Cleaning & Maintenance (47.4%).
| Occupation | Male | Female |
| Healthcare Support | 0 (0.0%) | 9 (100.0%) |
| Security & Protection | 0 (0.0%) | 0 (0.0%) |
| Firefighting & Prevention | 0 (0.0%) | 0 (0.0%) |
| Law Enforcement | 0 (0.0%) | 0 (0.0%) |
| Food Preparation & Serving | 10 (41.7%) | 14 (58.3%) |
| Cleaning & Maintenance | 10 (52.6%) | 9 (47.4%) |
| Personal Care & Service | 0 (0.0%) | 0 (0.0%) |
| Total (Category) | 20 (38.5%) | 32 (61.5%) |
| Total (Overall) | 71 (55.9%) | 56 (44.1%) |
Sales and Office Occupations
The most common Sales and Office occupations in Brutus are , and Office & Administration (13 | 10.2%).

Sales and Office Occupations by Sex
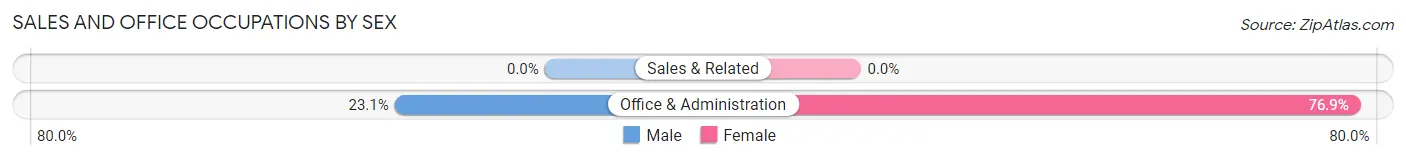
| Occupation | Male | Female |
| Sales & Related | 0 (0.0%) | 0 (0.0%) |
| Office & Administration | 3 (23.1%) | 10 (76.9%) |
| Total (Category) | 3 (23.1%) | 10 (76.9%) |
| Total (Overall) | 71 (55.9%) | 56 (44.1%) |
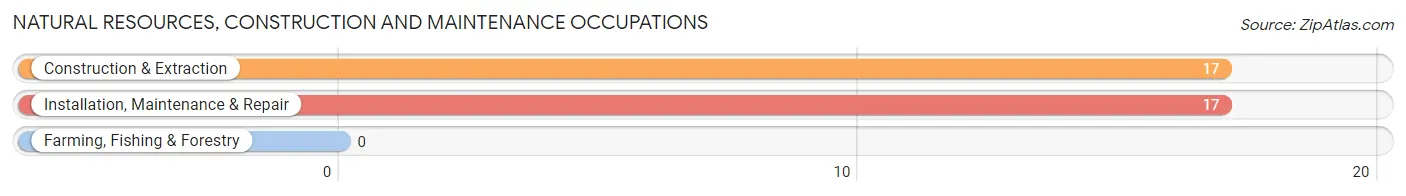
Natural Resources, Construction and Maintenance Occupations
The most common Natural Resources, Construction and Maintenance occupations in Brutus are Construction & Extraction (17 | 13.4%), and Installation, Maintenance & Repair (17 | 13.4%).
Natural Resources, Construction and Maintenance Occupations by Sex
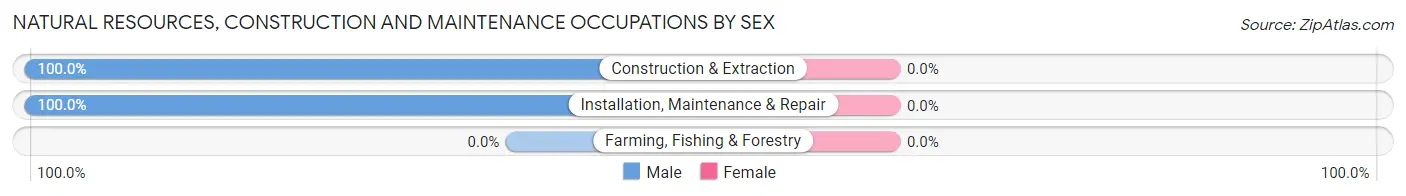
| Occupation | Male | Female |
| Farming, Fishing & Forestry | 0 (0.0%) | 0 (0.0%) |
| Construction & Extraction | 17 (100.0%) | 0 (0.0%) |
| Installation, Maintenance & Repair | 17 (100.0%) | 0 (0.0%) |
| Total (Category) | 34 (100.0%) | 0 (0.0%) |
| Total (Overall) | 71 (55.9%) | 56 (44.1%) |
Production, Transportation and Moving Occupations
The most common Production, Transportation and Moving occupations in Brutus are Transportation (9 | 7.1%), and Production (3 | 2.4%).
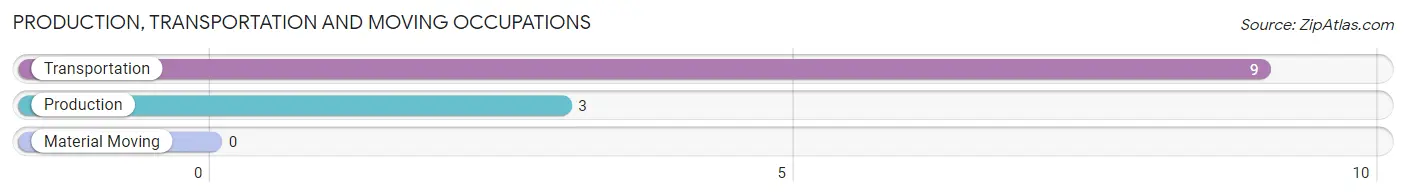
Production, Transportation and Moving Occupations by Sex

| Occupation | Male | Female |
| Production | 0 (0.0%) | 3 (100.0%) |
| Transportation | 9 (100.0%) | 0 (0.0%) |
| Material Moving | 0 (0.0%) | 0 (0.0%) |
| Total (Category) | 9 (75.0%) | 3 (25.0%) |
| Total (Overall) | 71 (55.9%) | 56 (44.1%) |
Employment Industries by Sex in Brutus
Employment Industries in Brutus
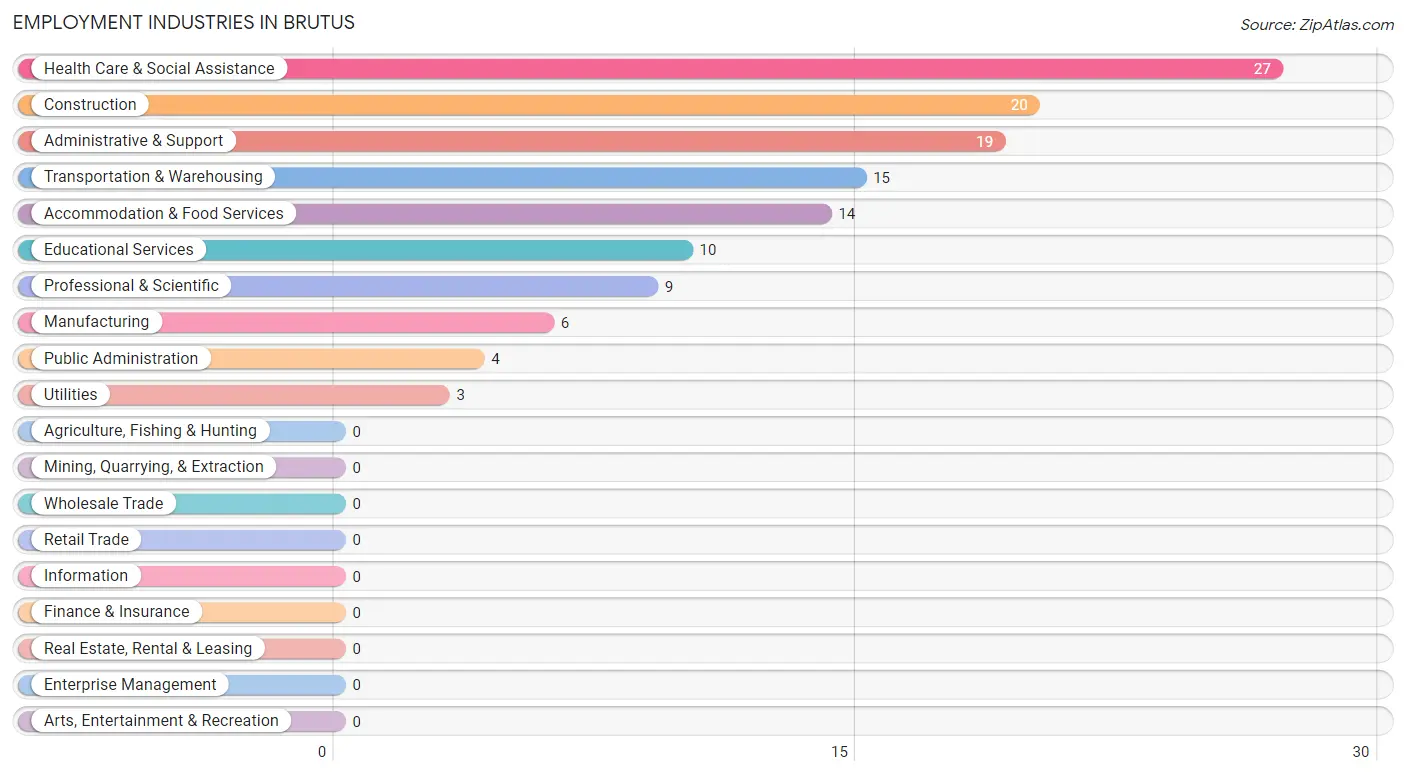
The major employment industries in Brutus include Health Care & Social Assistance (27 | 21.3%), Construction (20 | 15.8%), Administrative & Support (19 | 15.0%), Transportation & Warehousing (15 | 11.8%), and Accommodation & Food Services (14 | 11.0%).
Employment Industries by Sex in Brutus
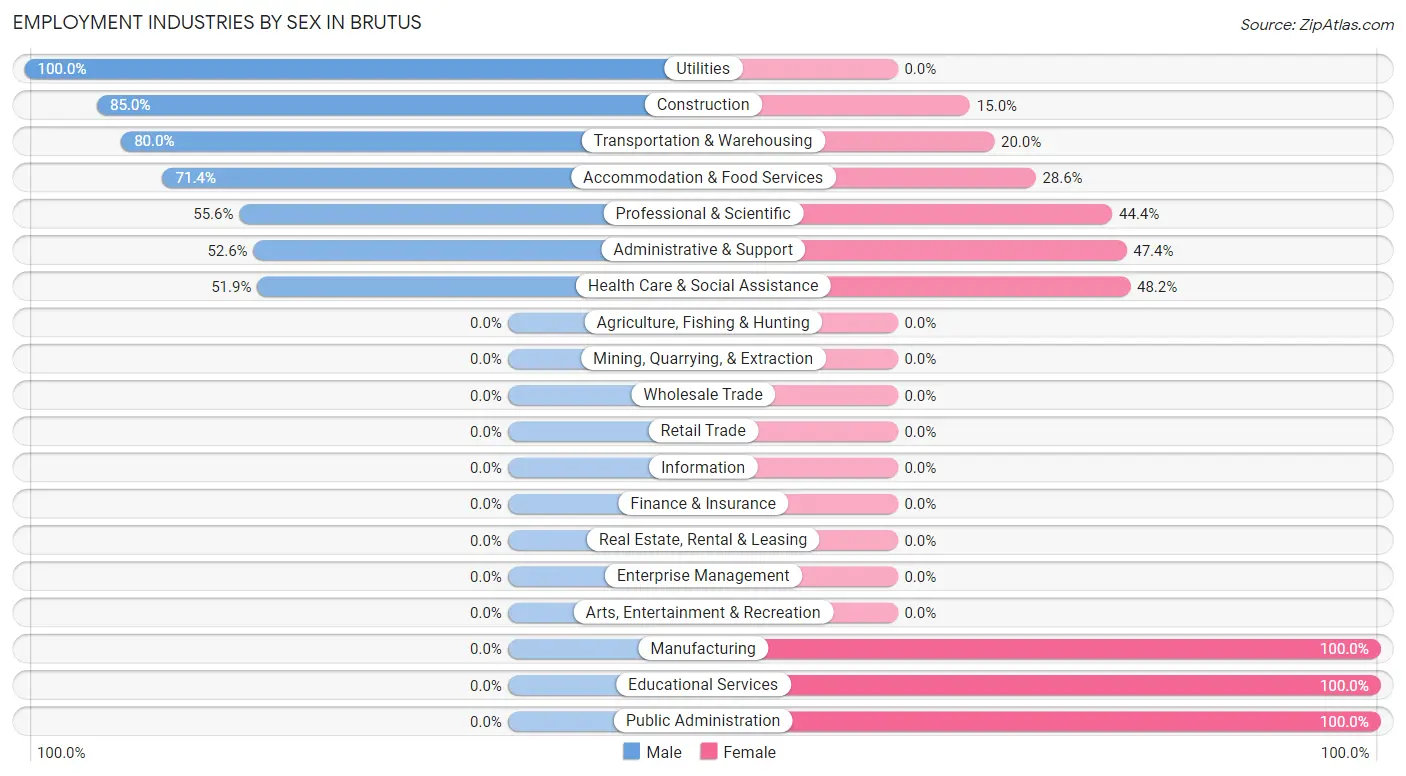
The Brutus industries that see more men than women are Utilities (100.0%), Construction (85.0%), and Transportation & Warehousing (80.0%), whereas the industries that tend to have a higher number of women are Manufacturing (100.0%), Educational Services (100.0%), and Public Administration (100.0%).
| Industry | Male | Female |
| Agriculture, Fishing & Hunting | 0 (0.0%) | 0 (0.0%) |
| Mining, Quarrying, & Extraction | 0 (0.0%) | 0 (0.0%) |
| Construction | 17 (85.0%) | 3 (15.0%) |
| Manufacturing | 0 (0.0%) | 6 (100.0%) |
| Wholesale Trade | 0 (0.0%) | 0 (0.0%) |
| Retail Trade | 0 (0.0%) | 0 (0.0%) |
| Transportation & Warehousing | 12 (80.0%) | 3 (20.0%) |
| Utilities | 3 (100.0%) | 0 (0.0%) |
| Information | 0 (0.0%) | 0 (0.0%) |
| Finance & Insurance | 0 (0.0%) | 0 (0.0%) |
| Real Estate, Rental & Leasing | 0 (0.0%) | 0 (0.0%) |
| Professional & Scientific | 5 (55.6%) | 4 (44.4%) |
| Enterprise Management | 0 (0.0%) | 0 (0.0%) |
| Administrative & Support | 10 (52.6%) | 9 (47.4%) |
| Educational Services | 0 (0.0%) | 10 (100.0%) |
| Health Care & Social Assistance | 14 (51.8%) | 13 (48.1%) |
| Arts, Entertainment & Recreation | 0 (0.0%) | 0 (0.0%) |
| Accommodation & Food Services | 10 (71.4%) | 4 (28.6%) |
| Public Administration | 0 (0.0%) | 4 (100.0%) |
| Total | 71 (55.9%) | 56 (44.1%) |
Education in Brutus
School Enrollment in Brutus
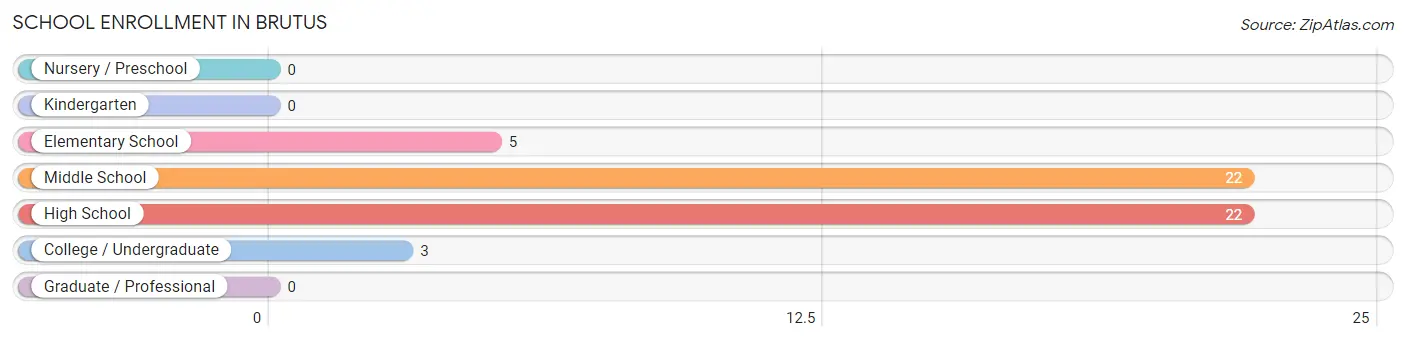
The most common levels of schooling among the 52 students in Brutus are middle school (22 | 42.3%), high school (22 | 42.3%), and elementary school (5 | 9.6%).
| School Level | # Students | % Students |
| Nursery / Preschool | 0 | 0.0% |
| Kindergarten | 0 | 0.0% |
| Elementary School | 5 | 9.6% |
| Middle School | 22 | 42.3% |
| High School | 22 | 42.3% |
| College / Undergraduate | 3 | 5.8% |
| Graduate / Professional | 0 | 0.0% |
| Total | 52 | 100.0% |
School Enrollment by Age by Funding Source in Brutus
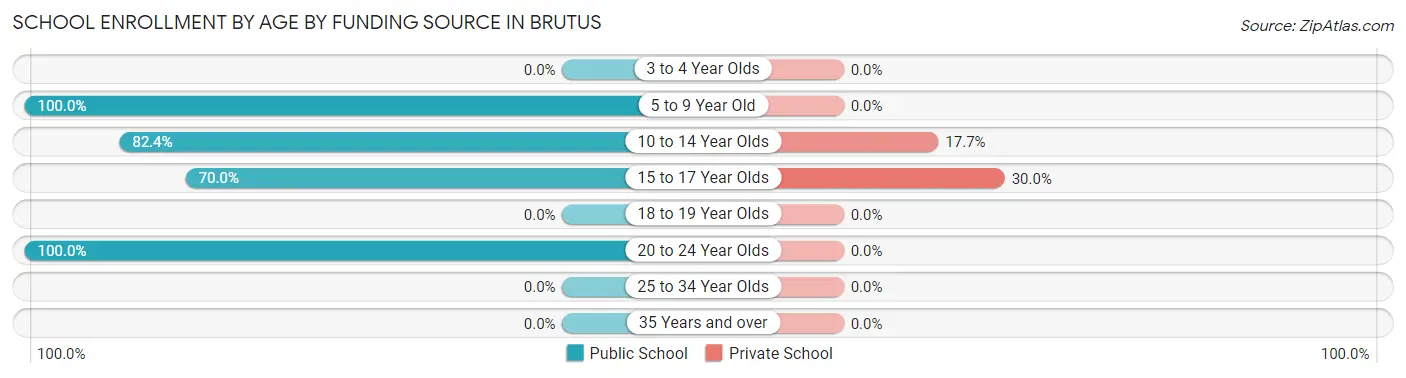
Out of a total of 52 students who are enrolled in schools in Brutus, 9 (17.3%) attend a private institution, while the remaining 43 (82.7%) are enrolled in public schools. The age group of 15 to 17 year olds has the highest likelihood of being enrolled in private schools, with 3 (30.0% in the age bracket) enrolled. Conversely, the age group of 5 to 9 year old has the lowest likelihood of being enrolled in a private school, with 5 (100.0% in the age bracket) attending a public institution.
| Age Bracket | Public School | Private School |
| 3 to 4 Year Olds | 0 (0.0%) | 0 (0.0%) |
| 5 to 9 Year Old | 5 (100.0%) | 0 (0.0%) |
| 10 to 14 Year Olds | 28 (82.4%) | 6 (17.6%) |
| 15 to 17 Year Olds | 7 (70.0%) | 3 (30.0%) |
| 18 to 19 Year Olds | 0 (0.0%) | 0 (0.0%) |
| 20 to 24 Year Olds | 3 (100.0%) | 0 (0.0%) |
| 25 to 34 Year Olds | 0 (0.0%) | 0 (0.0%) |
| 35 Years and over | 0 (0.0%) | 0 (0.0%) |
| Total | 43 (82.7%) | 9 (17.3%) |
Educational Attainment by Field of Study in Brutus
Science & technology (4 | 26.7%), business (4 | 26.7%), literature & languages (4 | 26.7%), and education (3 | 20.0%) are the most common fields of study among 15 individuals in Brutus who have obtained a bachelor's degree or higher.
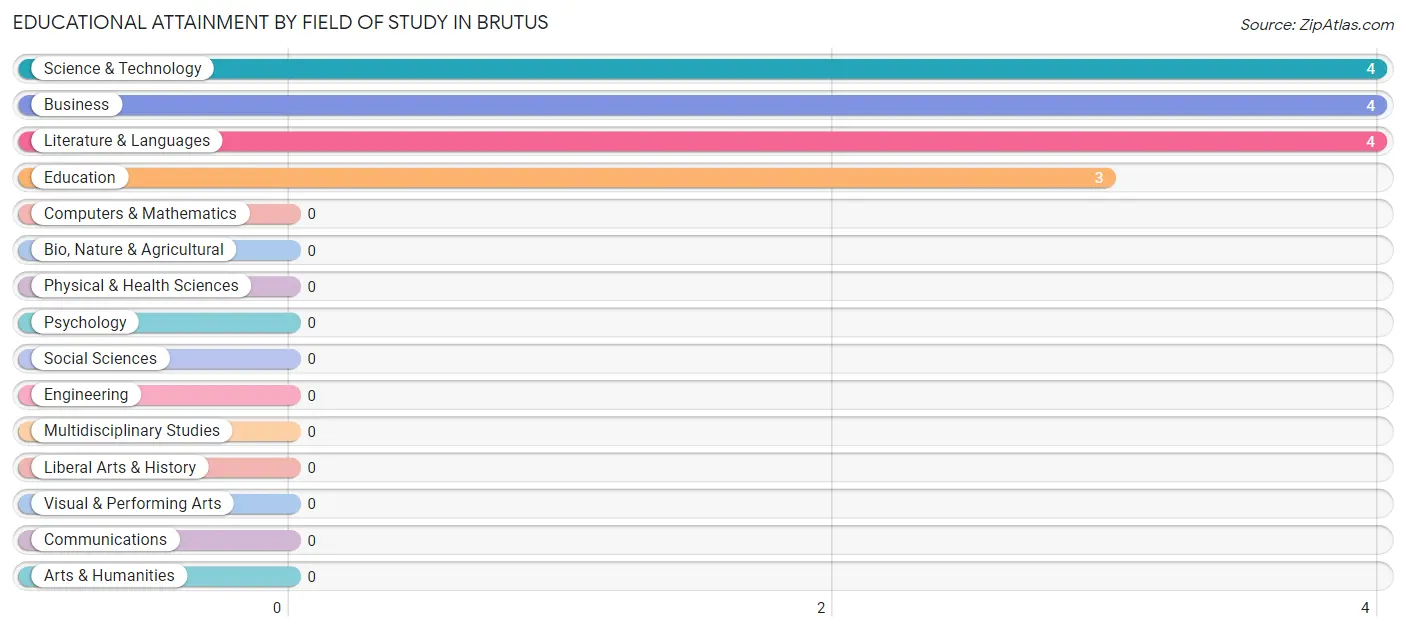
| Field of Study | # Graduates | % Graduates |
| Computers & Mathematics | 0 | 0.0% |
| Bio, Nature & Agricultural | 0 | 0.0% |
| Physical & Health Sciences | 0 | 0.0% |
| Psychology | 0 | 0.0% |
| Social Sciences | 0 | 0.0% |
| Engineering | 0 | 0.0% |
| Multidisciplinary Studies | 0 | 0.0% |
| Science & Technology | 4 | 26.7% |
| Business | 4 | 26.7% |
| Education | 3 | 20.0% |
| Literature & Languages | 4 | 26.7% |
| Liberal Arts & History | 0 | 0.0% |
| Visual & Performing Arts | 0 | 0.0% |
| Communications | 0 | 0.0% |
| Arts & Humanities | 0 | 0.0% |
| Total | 15 | 100.0% |
Transportation & Commute in Brutus
Vehicle Availability by Sex in Brutus
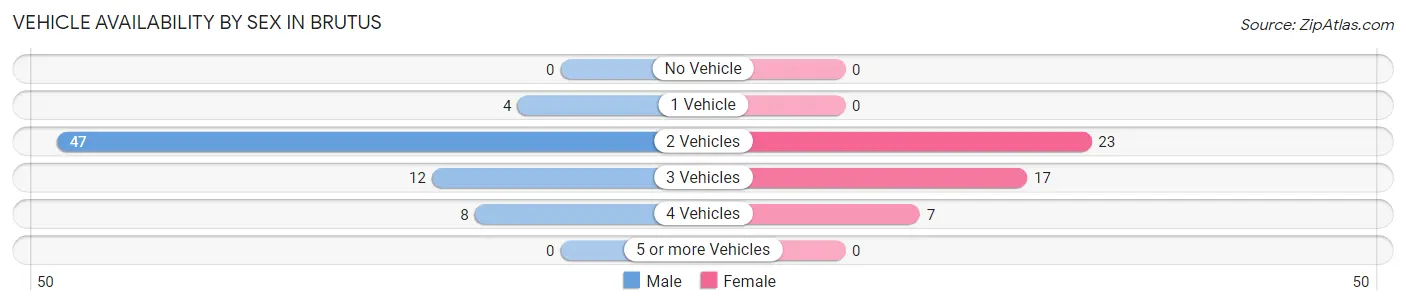
The most prevalent vehicle ownership categories in Brutus are males with 2 vehicles (47, accounting for 66.2%) and females with 2 vehicles (23, making up 100.0%).
| Vehicles Available | Male | Female |
| No Vehicle | 0 (0.0%) | 0 (0.0%) |
| 1 Vehicle | 4 (5.6%) | 0 (0.0%) |
| 2 Vehicles | 47 (66.2%) | 23 (48.9%) |
| 3 Vehicles | 12 (16.9%) | 17 (36.2%) |
| 4 Vehicles | 8 (11.3%) | 7 (14.9%) |
| 5 or more Vehicles | 0 (0.0%) | 0 (0.0%) |
| Total | 71 (100.0%) | 47 (100.0%) |
Commute Time in Brutus
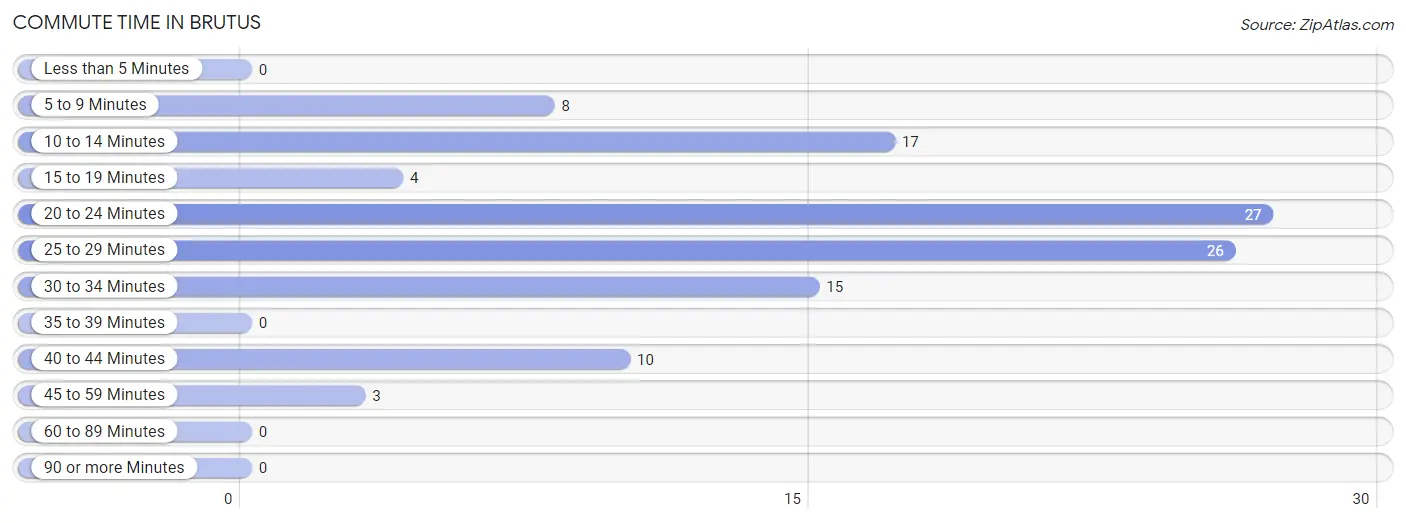
The most frequently occuring commute durations in Brutus are 20 to 24 minutes (27 commuters, 24.5%), 25 to 29 minutes (26 commuters, 23.6%), and 10 to 14 minutes (17 commuters, 15.4%).
| Commute Time | # Commuters | % Commuters |
| Less than 5 Minutes | 0 | 0.0% |
| 5 to 9 Minutes | 8 | 7.3% |
| 10 to 14 Minutes | 17 | 15.4% |
| 15 to 19 Minutes | 4 | 3.6% |
| 20 to 24 Minutes | 27 | 24.5% |
| 25 to 29 Minutes | 26 | 23.6% |
| 30 to 34 Minutes | 15 | 13.6% |
| 35 to 39 Minutes | 0 | 0.0% |
| 40 to 44 Minutes | 10 | 9.1% |
| 45 to 59 Minutes | 3 | 2.7% |
| 60 to 89 Minutes | 0 | 0.0% |
| 90 or more Minutes | 0 | 0.0% |
Commute Time by Sex in Brutus
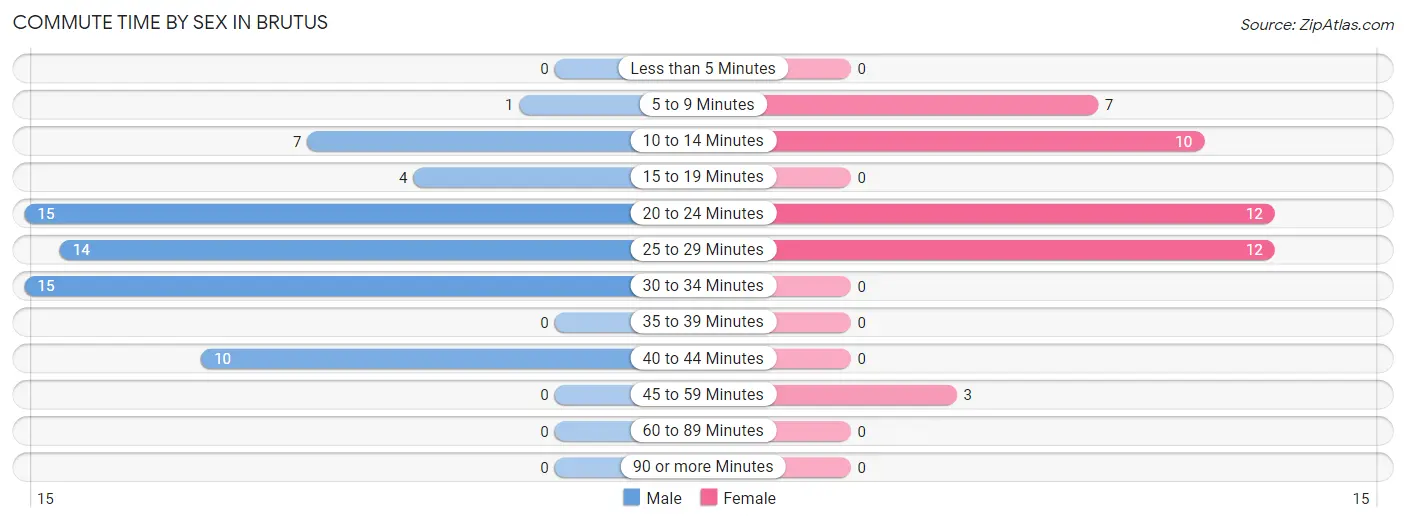
The most common commute times in Brutus are 20 to 24 minutes (15 commuters, 22.7%) for males and 20 to 24 minutes (12 commuters, 27.3%) for females.
| Commute Time | Male | Female |
| Less than 5 Minutes | 0 (0.0%) | 0 (0.0%) |
| 5 to 9 Minutes | 1 (1.5%) | 7 (15.9%) |
| 10 to 14 Minutes | 7 (10.6%) | 10 (22.7%) |
| 15 to 19 Minutes | 4 (6.1%) | 0 (0.0%) |
| 20 to 24 Minutes | 15 (22.7%) | 12 (27.3%) |
| 25 to 29 Minutes | 14 (21.2%) | 12 (27.3%) |
| 30 to 34 Minutes | 15 (22.7%) | 0 (0.0%) |
| 35 to 39 Minutes | 0 (0.0%) | 0 (0.0%) |
| 40 to 44 Minutes | 10 (15.1%) | 0 (0.0%) |
| 45 to 59 Minutes | 0 (0.0%) | 3 (6.8%) |
| 60 to 89 Minutes | 0 (0.0%) | 0 (0.0%) |
| 90 or more Minutes | 0 (0.0%) | 0 (0.0%) |
Time of Departure to Work by Sex in Brutus
The most frequent times of departure to work in Brutus are 8:00 AM to 8:29 AM (24, 36.4%) for males and 4:00 PM to 11:59 PM (13, 29.5%) for females.
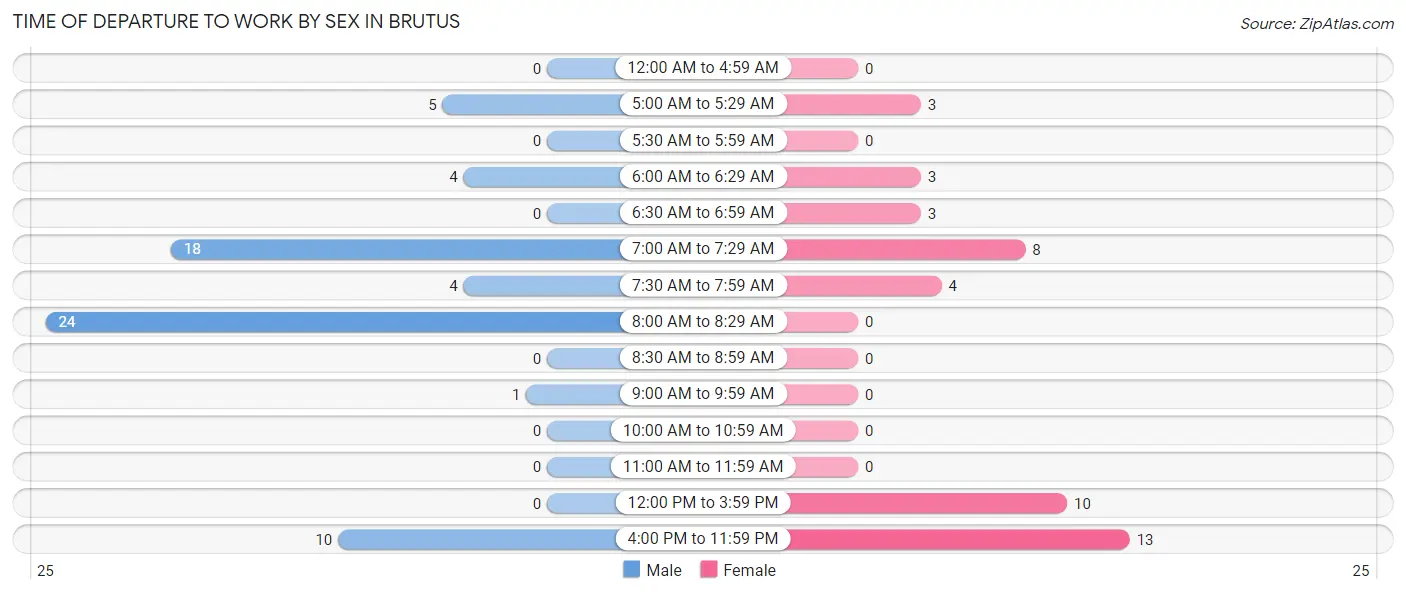
| Time of Departure | Male | Female |
| 12:00 AM to 4:59 AM | 0 (0.0%) | 0 (0.0%) |
| 5:00 AM to 5:29 AM | 5 (7.6%) | 3 (6.8%) |
| 5:30 AM to 5:59 AM | 0 (0.0%) | 0 (0.0%) |
| 6:00 AM to 6:29 AM | 4 (6.1%) | 3 (6.8%) |
| 6:30 AM to 6:59 AM | 0 (0.0%) | 3 (6.8%) |
| 7:00 AM to 7:29 AM | 18 (27.3%) | 8 (18.2%) |
| 7:30 AM to 7:59 AM | 4 (6.1%) | 4 (9.1%) |
| 8:00 AM to 8:29 AM | 24 (36.4%) | 0 (0.0%) |
| 8:30 AM to 8:59 AM | 0 (0.0%) | 0 (0.0%) |
| 9:00 AM to 9:59 AM | 1 (1.5%) | 0 (0.0%) |
| 10:00 AM to 10:59 AM | 0 (0.0%) | 0 (0.0%) |
| 11:00 AM to 11:59 AM | 0 (0.0%) | 0 (0.0%) |
| 12:00 PM to 3:59 PM | 0 (0.0%) | 10 (22.7%) |
| 4:00 PM to 11:59 PM | 10 (15.1%) | 13 (29.5%) |
| Total | 66 (100.0%) | 44 (100.0%) |
Housing Occupancy in Brutus
Occupancy by Ownership in Brutus
Of the total 68 dwellings in Brutus, owner-occupied units account for 59 (86.8%), while renter-occupied units make up 9 (13.2%).
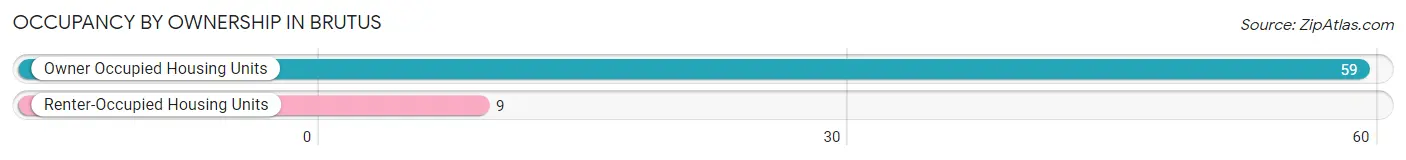
| Occupancy | # Housing Units | % Housing Units |
| Owner Occupied Housing Units | 59 | 86.8% |
| Renter-Occupied Housing Units | 9 | 13.2% |
| Total Occupied Housing Units | 68 | 100.0% |
Occupancy by Household Size in Brutus
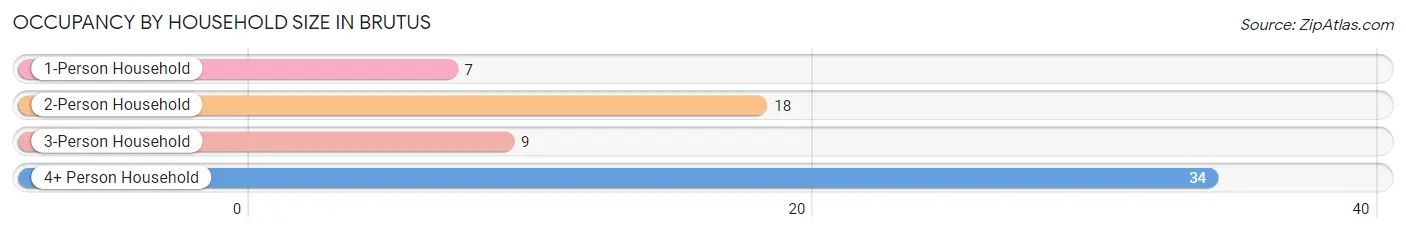
| Household Size | # Housing Units | % Housing Units |
| 1-Person Household | 7 | 10.3% |
| 2-Person Household | 18 | 26.5% |
| 3-Person Household | 9 | 13.2% |
| 4+ Person Household | 34 | 50.0% |
| Total Housing Units | 68 | 100.0% |
Occupancy by Ownership by Household Size in Brutus
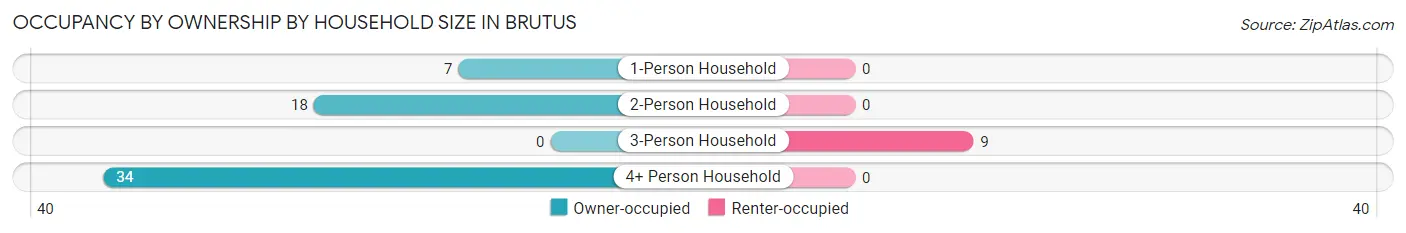
| Household Size | Owner-occupied | Renter-occupied |
| 1-Person Household | 7 (100.0%) | 0 (0.0%) |
| 2-Person Household | 18 (100.0%) | 0 (0.0%) |
| 3-Person Household | 0 (0.0%) | 9 (100.0%) |
| 4+ Person Household | 34 (100.0%) | 0 (0.0%) |
| Total Housing Units | 59 (86.8%) | 9 (13.2%) |
Occupancy by Educational Attainment in Brutus
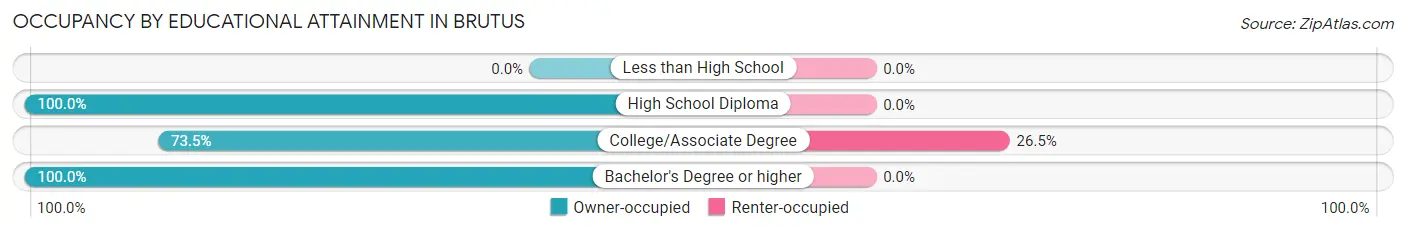
| Household Size | Owner-occupied | Renter-occupied |
| Less than High School | 0 (0.0%) | 0 (0.0%) |
| High School Diploma | 30 (100.0%) | 0 (0.0%) |
| College/Associate Degree | 25 (73.5%) | 9 (26.5%) |
| Bachelor's Degree or higher | 4 (100.0%) | 0 (0.0%) |
Occupancy by Age of Householder in Brutus
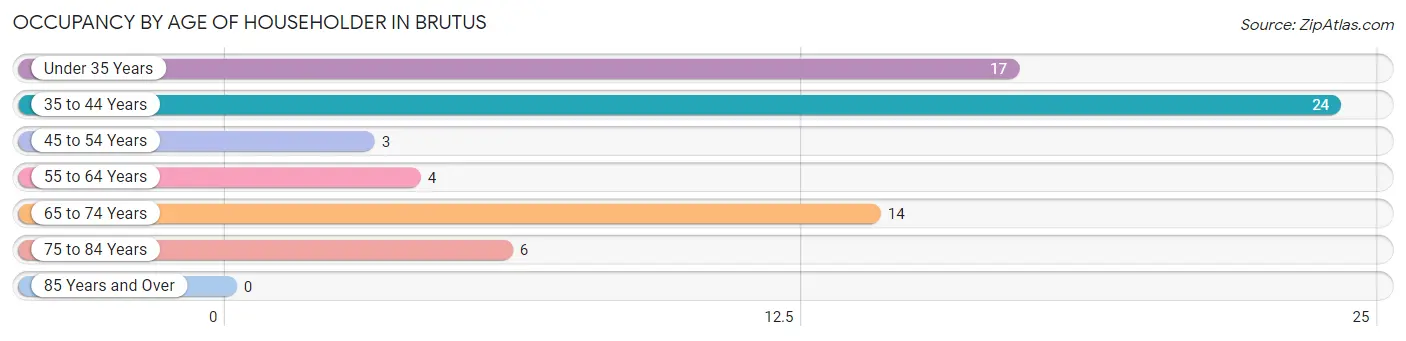
| Age Bracket | # Households | % Households |
| Under 35 Years | 17 | 25.0% |
| 35 to 44 Years | 24 | 35.3% |
| 45 to 54 Years | 3 | 4.4% |
| 55 to 64 Years | 4 | 5.9% |
| 65 to 74 Years | 14 | 20.6% |
| 75 to 84 Years | 6 | 8.8% |
| 85 Years and Over | 0 | 0.0% |
| Total | 68 | 100.0% |
Housing Finances in Brutus
Median Income by Occupancy in Brutus
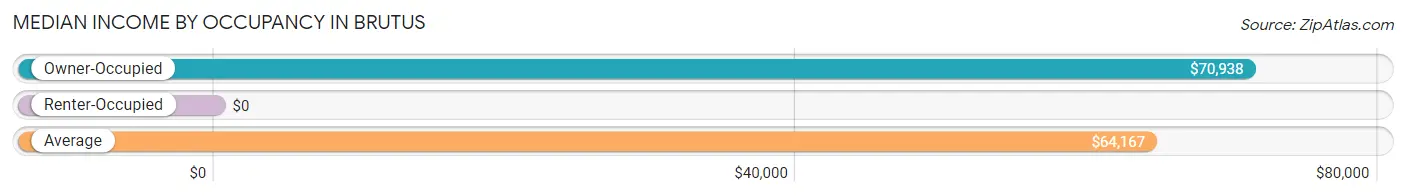
| Occupancy Type | # Households | Median Income |
| Owner-Occupied | 59 (86.8%) | $70,938 |
| Renter-Occupied | 9 (13.2%) | $0 |
| Average | 68 (100.0%) | $64,167 |
Occupancy by Householder Income Bracket in Brutus
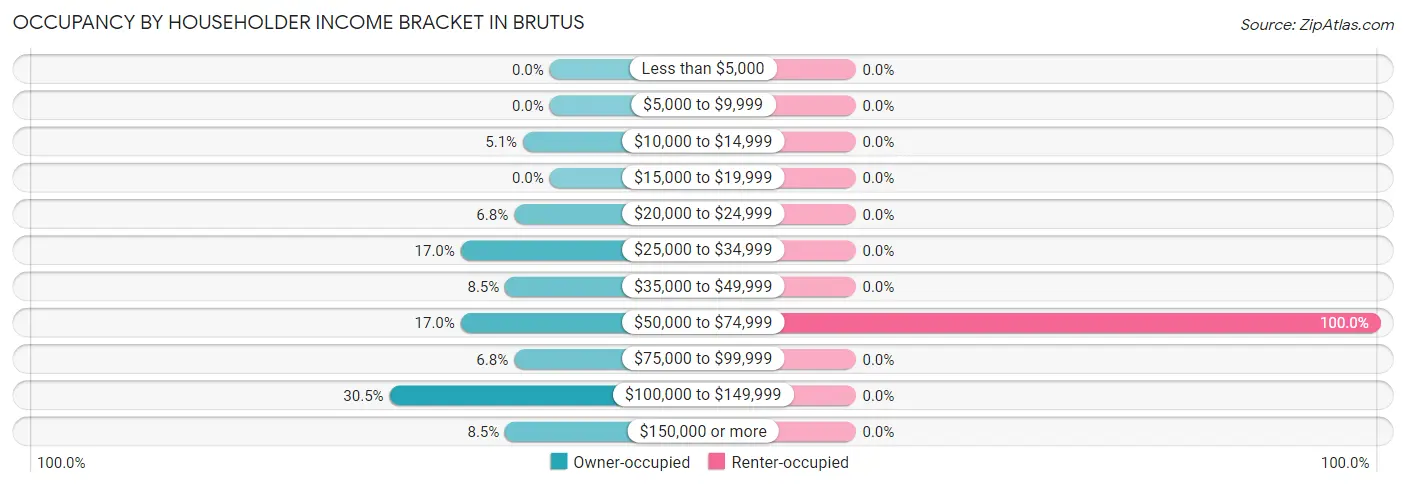
| Income Bracket | Owner-occupied | Renter-occupied |
| Less than $5,000 | 0 (0.0%) | 0 (0.0%) |
| $5,000 to $9,999 | 0 (0.0%) | 0 (0.0%) |
| $10,000 to $14,999 | 3 (5.1%) | 0 (0.0%) |
| $15,000 to $19,999 | 0 (0.0%) | 0 (0.0%) |
| $20,000 to $24,999 | 4 (6.8%) | 0 (0.0%) |
| $25,000 to $34,999 | 10 (17.0%) | 0 (0.0%) |
| $35,000 to $49,999 | 5 (8.5%) | 0 (0.0%) |
| $50,000 to $74,999 | 10 (17.0%) | 9 (100.0%) |
| $75,000 to $99,999 | 4 (6.8%) | 0 (0.0%) |
| $100,000 to $149,999 | 18 (30.5%) | 0 (0.0%) |
| $150,000 or more | 5 (8.5%) | 0 (0.0%) |
| Total | 59 (100.0%) | 9 (100.0%) |
Monthly Housing Cost Tiers in Brutus
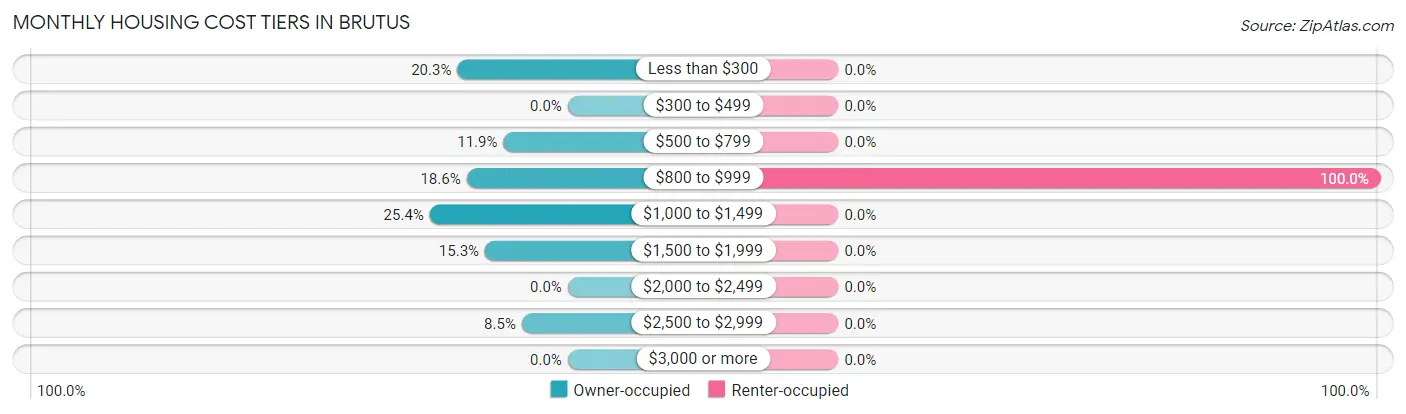
| Monthly Cost | Owner-occupied | Renter-occupied |
| Less than $300 | 12 (20.3%) | 0 (0.0%) |
| $300 to $499 | 0 (0.0%) | 0 (0.0%) |
| $500 to $799 | 7 (11.9%) | 0 (0.0%) |
| $800 to $999 | 11 (18.6%) | 9 (100.0%) |
| $1,000 to $1,499 | 15 (25.4%) | 0 (0.0%) |
| $1,500 to $1,999 | 9 (15.2%) | 0 (0.0%) |
| $2,000 to $2,499 | 0 (0.0%) | 0 (0.0%) |
| $2,500 to $2,999 | 5 (8.5%) | 0 (0.0%) |
| $3,000 or more | 0 (0.0%) | 0 (0.0%) |
| Total | 59 (100.0%) | 9 (100.0%) |
Physical Housing Characteristics in Brutus
Housing Structures in Brutus
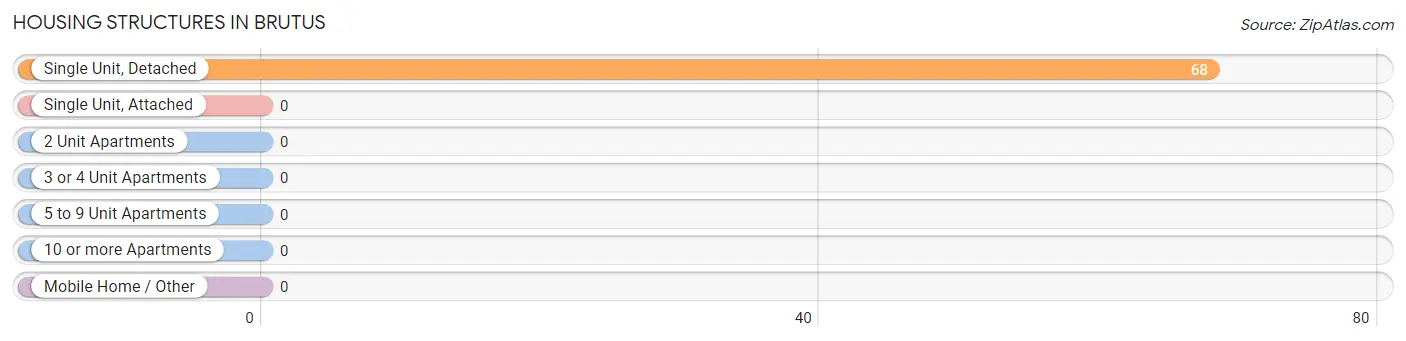
| Structure Type | # Housing Units | % Housing Units |
| Single Unit, Detached | 68 | 100.0% |
| Single Unit, Attached | 0 | 0.0% |
| 2 Unit Apartments | 0 | 0.0% |
| 3 or 4 Unit Apartments | 0 | 0.0% |
| 5 to 9 Unit Apartments | 0 | 0.0% |
| 10 or more Apartments | 0 | 0.0% |
| Mobile Home / Other | 0 | 0.0% |
| Total | 68 | 100.0% |
Housing Structures by Occupancy in Brutus
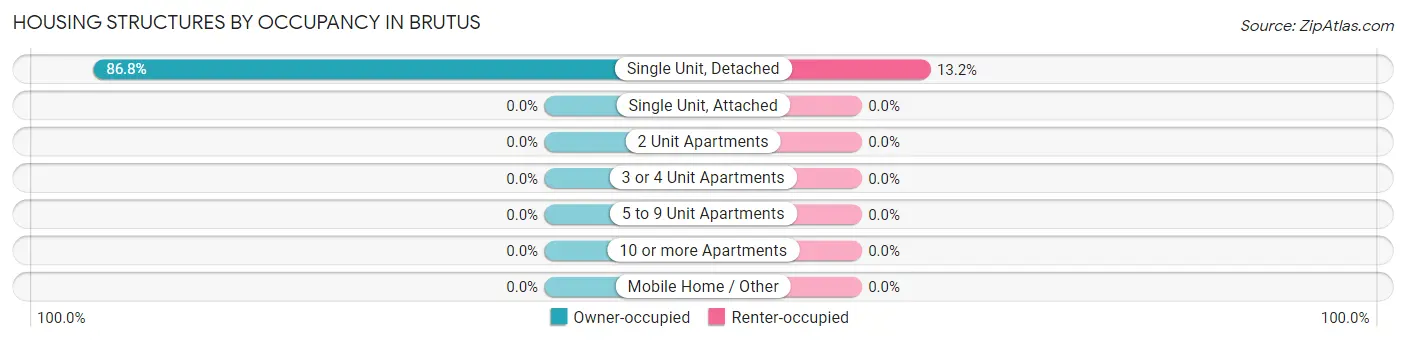
| Structure Type | Owner-occupied | Renter-occupied |
| Single Unit, Detached | 59 (86.8%) | 9 (13.2%) |
| Single Unit, Attached | 0 (0.0%) | 0 (0.0%) |
| 2 Unit Apartments | 0 (0.0%) | 0 (0.0%) |
| 3 or 4 Unit Apartments | 0 (0.0%) | 0 (0.0%) |
| 5 to 9 Unit Apartments | 0 (0.0%) | 0 (0.0%) |
| 10 or more Apartments | 0 (0.0%) | 0 (0.0%) |
| Mobile Home / Other | 0 (0.0%) | 0 (0.0%) |
| Total | 59 (86.8%) | 9 (13.2%) |
Housing Structures by Number of Rooms in Brutus
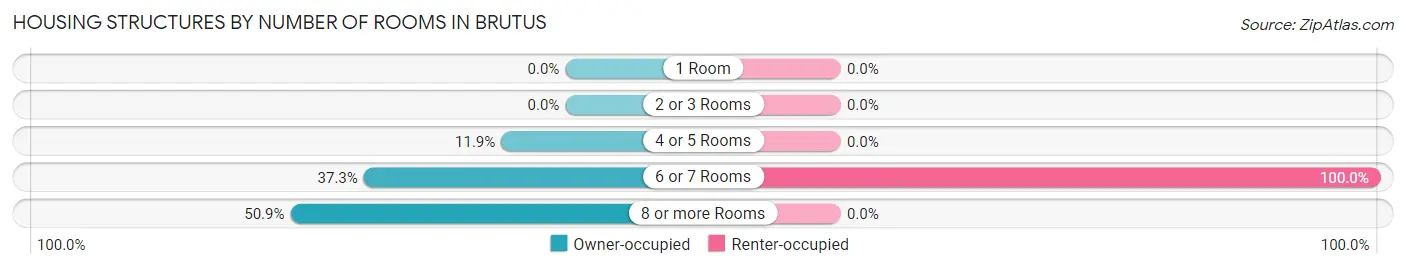
| Number of Rooms | Owner-occupied | Renter-occupied |
| 1 Room | 0 (0.0%) | 0 (0.0%) |
| 2 or 3 Rooms | 0 (0.0%) | 0 (0.0%) |
| 4 or 5 Rooms | 7 (11.9%) | 0 (0.0%) |
| 6 or 7 Rooms | 22 (37.3%) | 9 (100.0%) |
| 8 or more Rooms | 30 (50.8%) | 0 (0.0%) |
| Total | 59 (100.0%) | 9 (100.0%) |
Housing Structure by Heating Type in Brutus
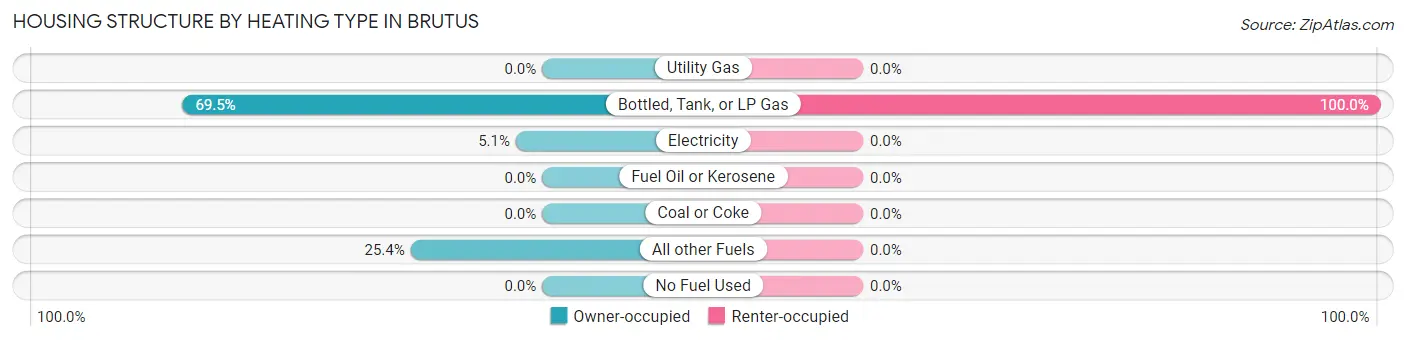
| Heating Type | Owner-occupied | Renter-occupied |
| Utility Gas | 0 (0.0%) | 0 (0.0%) |
| Bottled, Tank, or LP Gas | 41 (69.5%) | 9 (100.0%) |
| Electricity | 3 (5.1%) | 0 (0.0%) |
| Fuel Oil or Kerosene | 0 (0.0%) | 0 (0.0%) |
| Coal or Coke | 0 (0.0%) | 0 (0.0%) |
| All other Fuels | 15 (25.4%) | 0 (0.0%) |
| No Fuel Used | 0 (0.0%) | 0 (0.0%) |
| Total | 59 (100.0%) | 9 (100.0%) |
Household Vehicle Usage in Brutus
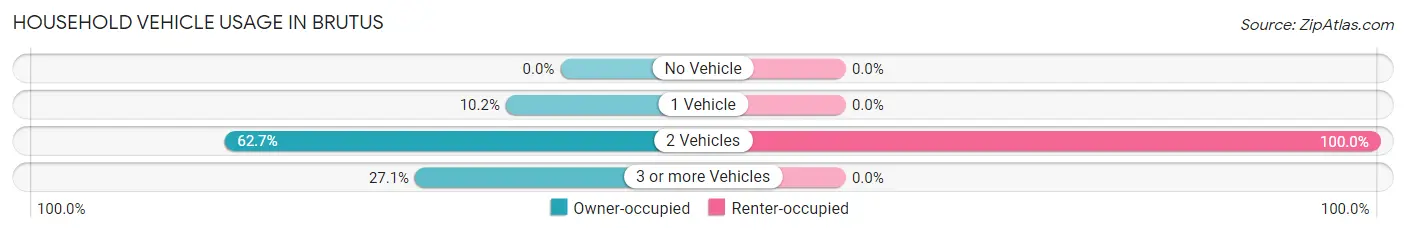
| Vehicles per Household | Owner-occupied | Renter-occupied |
| No Vehicle | 0 (0.0%) | 0 (0.0%) |
| 1 Vehicle | 6 (10.2%) | 0 (0.0%) |
| 2 Vehicles | 37 (62.7%) | 9 (100.0%) |
| 3 or more Vehicles | 16 (27.1%) | 0 (0.0%) |
| Total | 59 (100.0%) | 9 (100.0%) |
Real Estate & Mortgages in Brutus
Real Estate and Mortgage Overview in Brutus
| Characteristic | Without Mortgage | With Mortgage |
| Housing Units | 30 | 29 |
| Median Property Value | $216,700 | $187,500 |
| Median Household Income | - | - |
| Monthly Housing Costs | - | - |
| Real Estate Taxes | - | - |
Property Value by Mortgage Status in Brutus
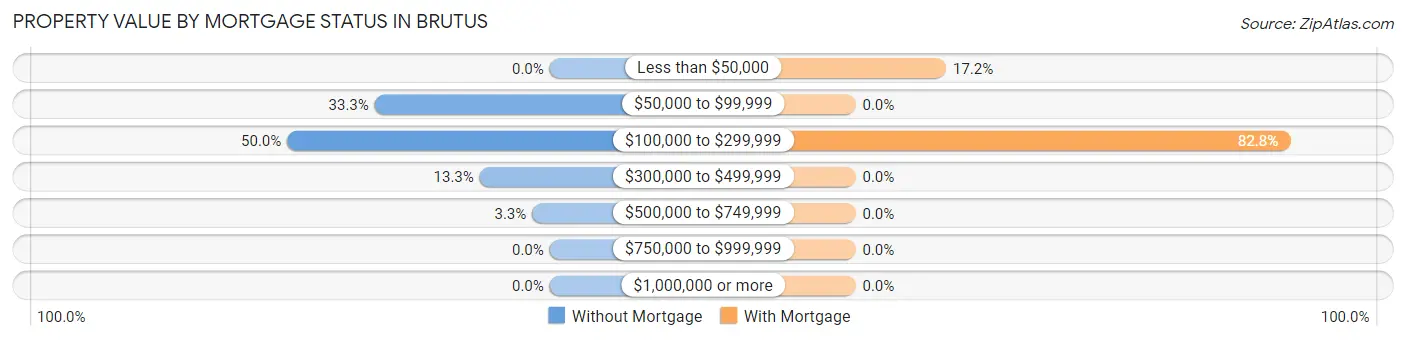
| Property Value | Without Mortgage | With Mortgage |
| Less than $50,000 | 0 (0.0%) | 5 (17.2%) |
| $50,000 to $99,999 | 10 (33.3%) | 0 (0.0%) |
| $100,000 to $299,999 | 15 (50.0%) | 24 (82.8%) |
| $300,000 to $499,999 | 4 (13.3%) | 0 (0.0%) |
| $500,000 to $749,999 | 1 (3.3%) | 0 (0.0%) |
| $750,000 to $999,999 | 0 (0.0%) | 0 (0.0%) |
| $1,000,000 or more | 0 (0.0%) | 0 (0.0%) |
| Total | 30 (100.0%) | 29 (100.0%) |
Household Income by Mortgage Status in Brutus
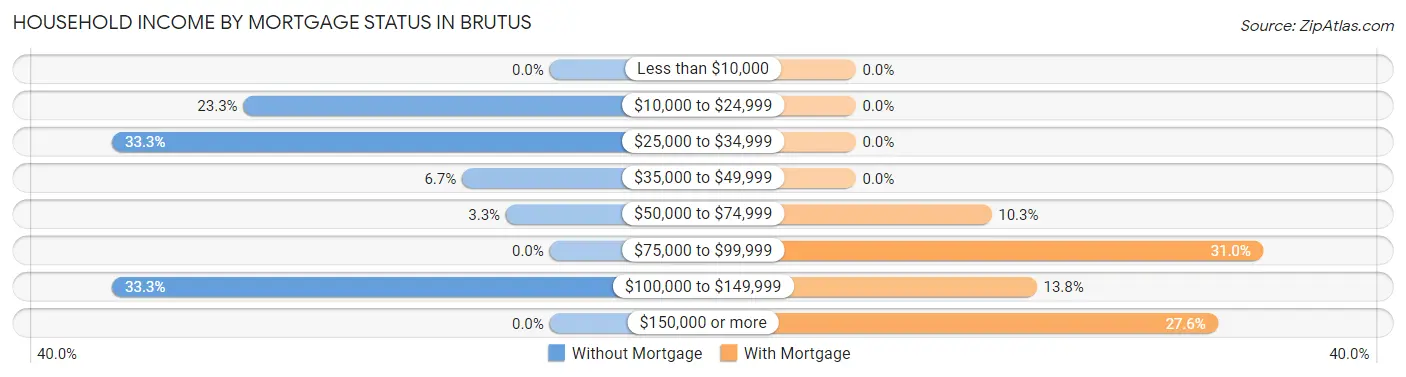
| Household Income | Without Mortgage | With Mortgage |
| Less than $10,000 | 0 (0.0%) | 0 (0.0%) |
| $10,000 to $24,999 | 7 (23.3%) | 0 (0.0%) |
| $25,000 to $34,999 | 10 (33.3%) | 0 (0.0%) |
| $35,000 to $49,999 | 2 (6.7%) | 0 (0.0%) |
| $50,000 to $74,999 | 1 (3.3%) | 3 (10.3%) |
| $75,000 to $99,999 | 0 (0.0%) | 9 (31.0%) |
| $100,000 to $149,999 | 10 (33.3%) | 4 (13.8%) |
| $150,000 or more | 0 (0.0%) | 8 (27.6%) |
| Total | 30 (100.0%) | 29 (100.0%) |
Property Value to Household Income Ratio in Brutus
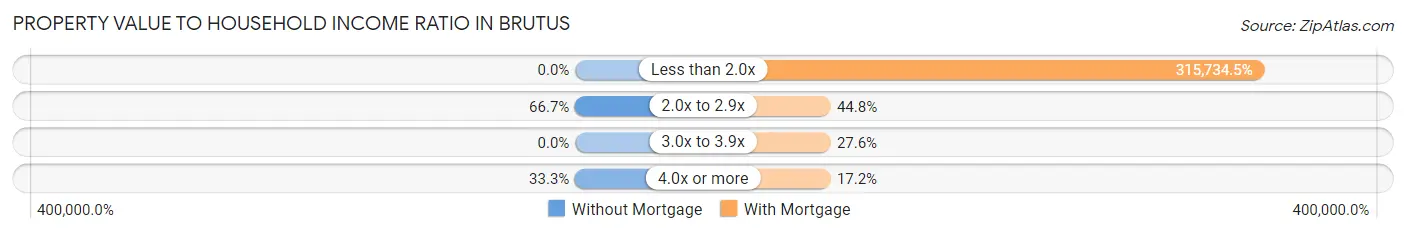
| Value-to-Income Ratio | Without Mortgage | With Mortgage |
| Less than 2.0x | 0 (0.0%) | 91,563 (315,734.5%) |
| 2.0x to 2.9x | 20 (66.7%) | 13 (44.8%) |
| 3.0x to 3.9x | 0 (0.0%) | 8 (27.6%) |
| 4.0x or more | 10 (33.3%) | 5 (17.2%) |
| Total | 30 (100.0%) | 29 (100.0%) |
Real Estate Taxes by Mortgage Status in Brutus

| Property Taxes | Without Mortgage | With Mortgage |
| Less than $800 | 10 (33.3%) | 0 (0.0%) |
| $800 to $1,499 | 3 (10.0%) | 0 (0.0%) |
| $800 to $1,499 | 17 (56.7%) | 18 (62.1%) |
| Total | 30 (100.0%) | 29 (100.0%) |
Health & Disability in Brutus
Health Insurance Coverage by Age in Brutus
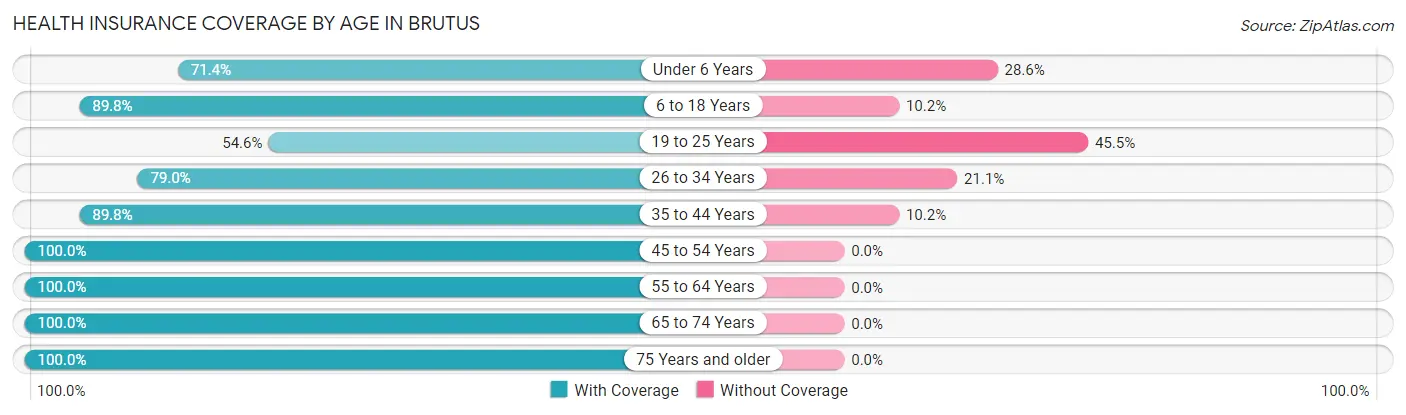
| Age Bracket | With Coverage | Without Coverage |
| Under 6 Years | 10 (71.4%) | 4 (28.6%) |
| 6 to 18 Years | 44 (89.8%) | 5 (10.2%) |
| 19 to 25 Years | 12 (54.5%) | 10 (45.5%) |
| 26 to 34 Years | 15 (78.9%) | 4 (21.0%) |
| 35 to 44 Years | 44 (89.8%) | 5 (10.2%) |
| 45 to 54 Years | 7 (100.0%) | 0 (0.0%) |
| 55 to 64 Years | 4 (100.0%) | 0 (0.0%) |
| 65 to 74 Years | 38 (100.0%) | 0 (0.0%) |
| 75 Years and older | 9 (100.0%) | 0 (0.0%) |
| Total | 183 (86.7%) | 28 (13.3%) |
Health Insurance Coverage by Citizenship Status in Brutus
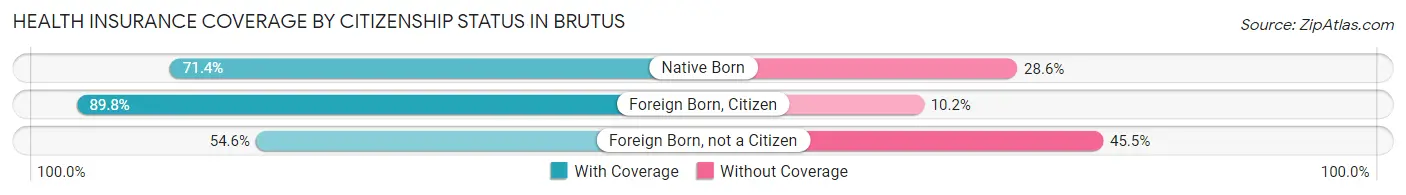
| Citizenship Status | With Coverage | Without Coverage |
| Native Born | 10 (71.4%) | 4 (28.6%) |
| Foreign Born, Citizen | 44 (89.8%) | 5 (10.2%) |
| Foreign Born, not a Citizen | 12 (54.5%) | 10 (45.5%) |
Health Insurance Coverage by Household Income in Brutus
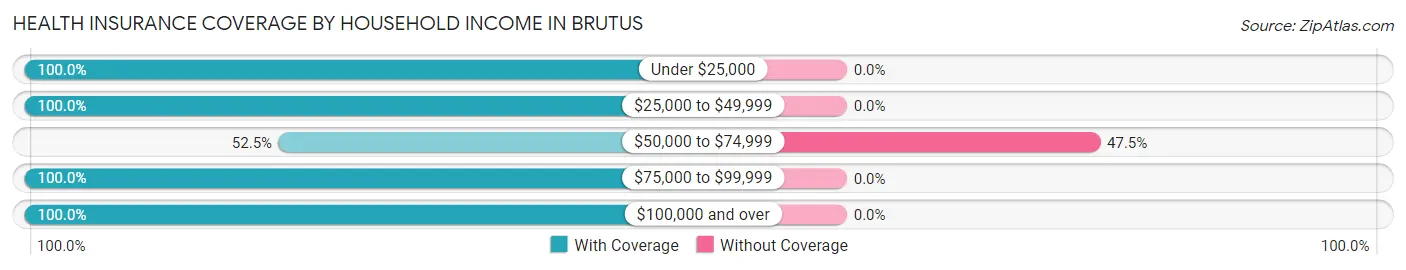
| Household Income | With Coverage | Without Coverage |
| Under $25,000 | 7 (100.0%) | 0 (0.0%) |
| $25,000 to $49,999 | 33 (100.0%) | 0 (0.0%) |
| $50,000 to $74,999 | 31 (52.5%) | 28 (47.5%) |
| $75,000 to $99,999 | 12 (100.0%) | 0 (0.0%) |
| $100,000 and over | 100 (100.0%) | 0 (0.0%) |
Public vs Private Health Insurance Coverage by Age in Brutus
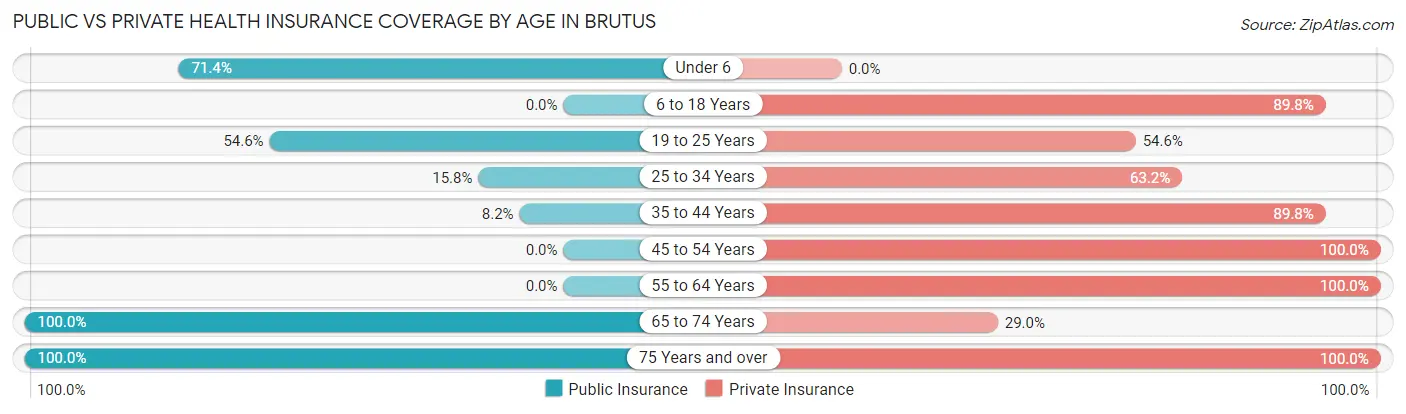
| Age Bracket | Public Insurance | Private Insurance |
| Under 6 | 10 (71.4%) | 0 (0.0%) |
| 6 to 18 Years | 0 (0.0%) | 44 (89.8%) |
| 19 to 25 Years | 12 (54.5%) | 12 (54.5%) |
| 25 to 34 Years | 3 (15.8%) | 12 (63.2%) |
| 35 to 44 Years | 4 (8.2%) | 44 (89.8%) |
| 45 to 54 Years | 0 (0.0%) | 7 (100.0%) |
| 55 to 64 Years | 0 (0.0%) | 4 (100.0%) |
| 65 to 74 Years | 38 (100.0%) | 11 (28.9%) |
| 75 Years and over | 9 (100.0%) | 9 (100.0%) |
| Total | 76 (36.0%) | 143 (67.8%) |
Disability Status by Sex by Age in Brutus
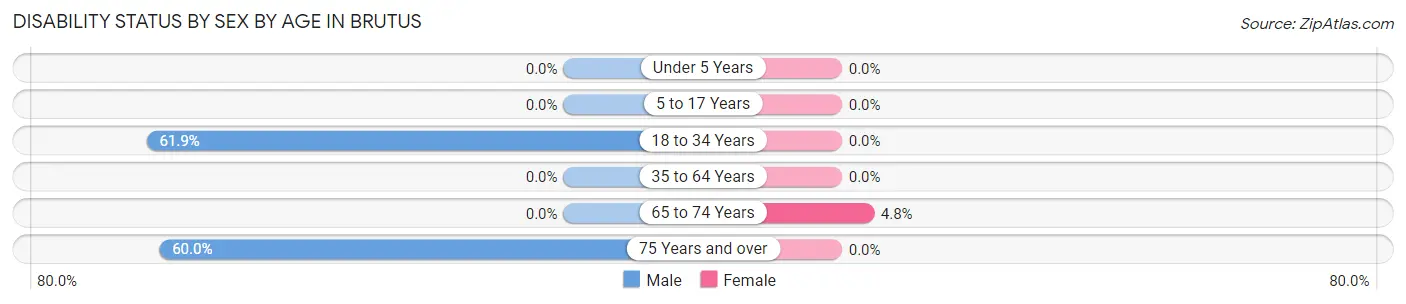
| Age Bracket | Male | Female |
| Under 5 Years | 0 (0.0%) | 0 (0.0%) |
| 5 to 17 Years | 0 (0.0%) | 0 (0.0%) |
| 18 to 34 Years | 13 (61.9%) | 0 (0.0%) |
| 35 to 64 Years | 0 (0.0%) | 0 (0.0%) |
| 65 to 74 Years | 0 (0.0%) | 1 (4.8%) |
| 75 Years and over | 3 (60.0%) | 0 (0.0%) |
Disability Class by Sex by Age in Brutus
Disability Class: Hearing Difficulty
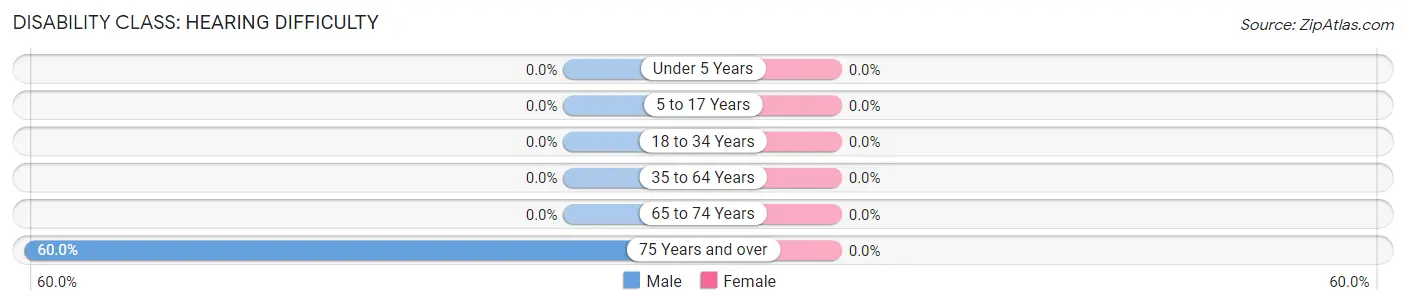
| Age Bracket | Male | Female |
| Under 5 Years | 0 (0.0%) | 0 (0.0%) |
| 5 to 17 Years | 0 (0.0%) | 0 (0.0%) |
| 18 to 34 Years | 0 (0.0%) | 0 (0.0%) |
| 35 to 64 Years | 0 (0.0%) | 0 (0.0%) |
| 65 to 74 Years | 0 (0.0%) | 0 (0.0%) |
| 75 Years and over | 3 (60.0%) | 0 (0.0%) |
Disability Class: Vision Difficulty
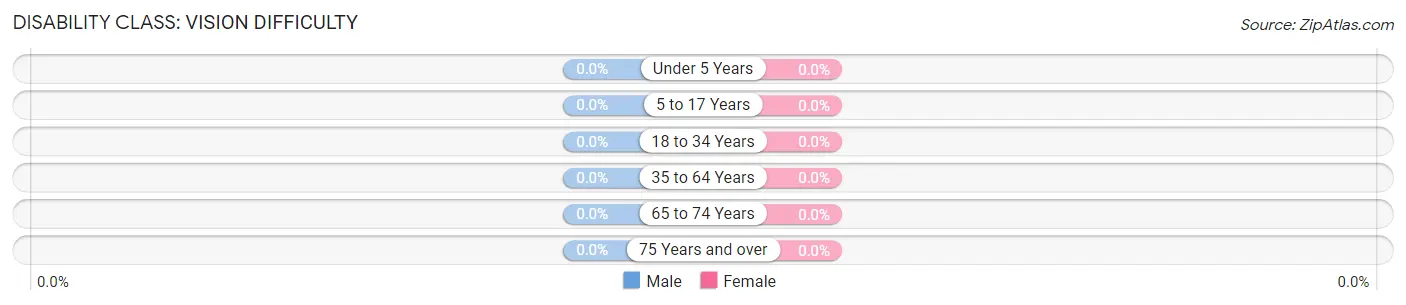
| Age Bracket | Male | Female |
| Under 5 Years | 0 (0.0%) | 0 (0.0%) |
| 5 to 17 Years | 0 (0.0%) | 0 (0.0%) |
| 18 to 34 Years | 0 (0.0%) | 0 (0.0%) |
| 35 to 64 Years | 0 (0.0%) | 0 (0.0%) |
| 65 to 74 Years | 0 (0.0%) | 0 (0.0%) |
| 75 Years and over | 0 (0.0%) | 0 (0.0%) |
Disability Class: Cognitive Difficulty
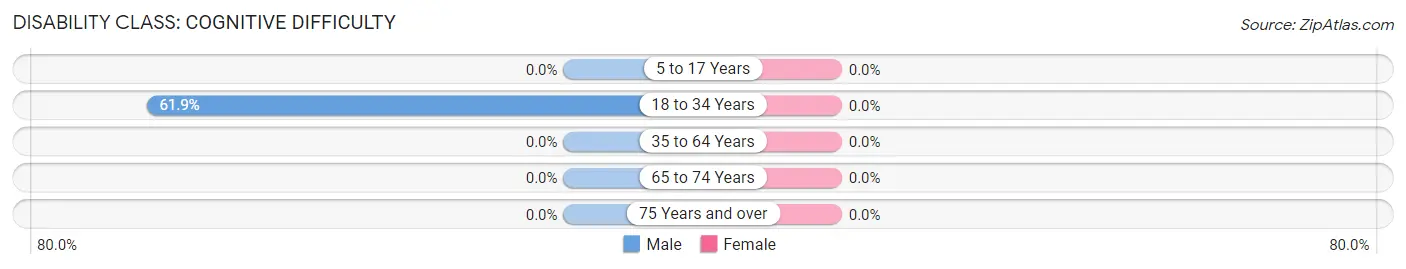
| Age Bracket | Male | Female |
| 5 to 17 Years | 0 (0.0%) | 0 (0.0%) |
| 18 to 34 Years | 13 (61.9%) | 0 (0.0%) |
| 35 to 64 Years | 0 (0.0%) | 0 (0.0%) |
| 65 to 74 Years | 0 (0.0%) | 0 (0.0%) |
| 75 Years and over | 0 (0.0%) | 0 (0.0%) |
Disability Class: Ambulatory Difficulty
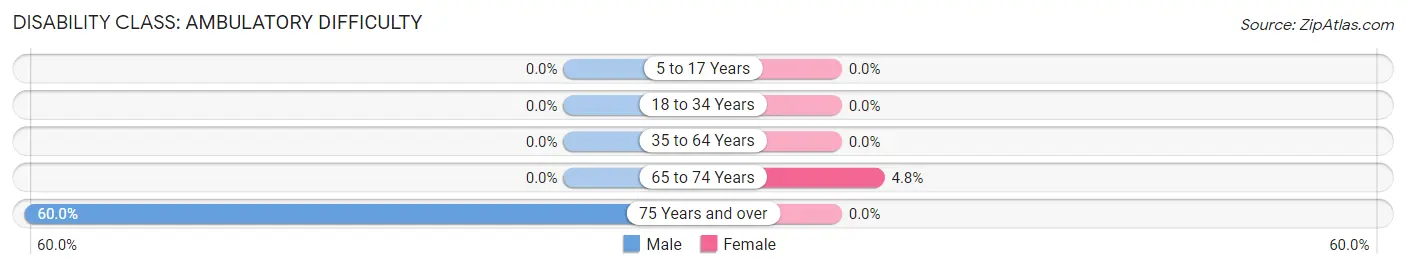
| Age Bracket | Male | Female |
| 5 to 17 Years | 0 (0.0%) | 0 (0.0%) |
| 18 to 34 Years | 0 (0.0%) | 0 (0.0%) |
| 35 to 64 Years | 0 (0.0%) | 0 (0.0%) |
| 65 to 74 Years | 0 (0.0%) | 1 (4.8%) |
| 75 Years and over | 3 (60.0%) | 0 (0.0%) |
Disability Class: Self-Care Difficulty
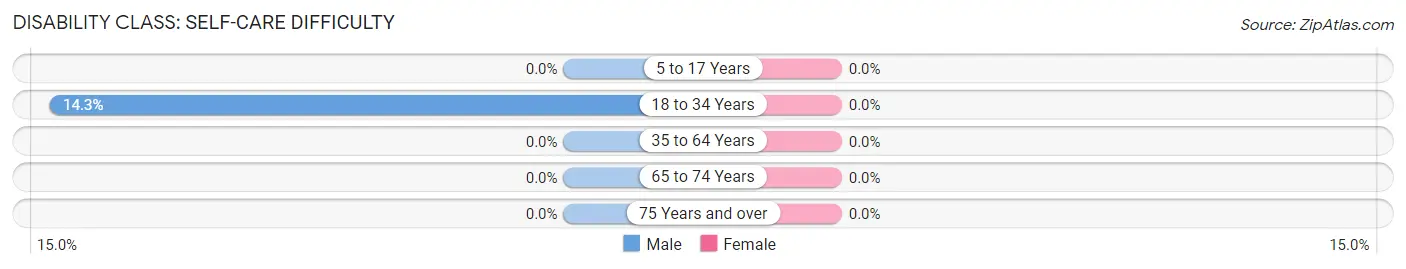
| Age Bracket | Male | Female |
| 5 to 17 Years | 0 (0.0%) | 0 (0.0%) |
| 18 to 34 Years | 3 (14.3%) | 0 (0.0%) |
| 35 to 64 Years | 0 (0.0%) | 0 (0.0%) |
| 65 to 74 Years | 0 (0.0%) | 0 (0.0%) |
| 75 Years and over | 0 (0.0%) | 0 (0.0%) |
Technology Access in Brutus
Computing Device Access in Brutus
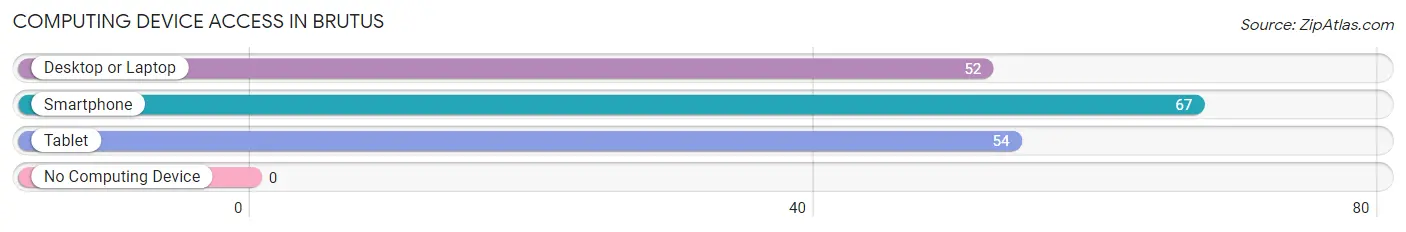
| Device Type | # Households | % Households |
| Desktop or Laptop | 52 | 76.5% |
| Smartphone | 67 | 98.5% |
| Tablet | 54 | 79.4% |
| No Computing Device | 0 | 0.0% |
| Total | 68 | 100.0% |
Internet Access in Brutus
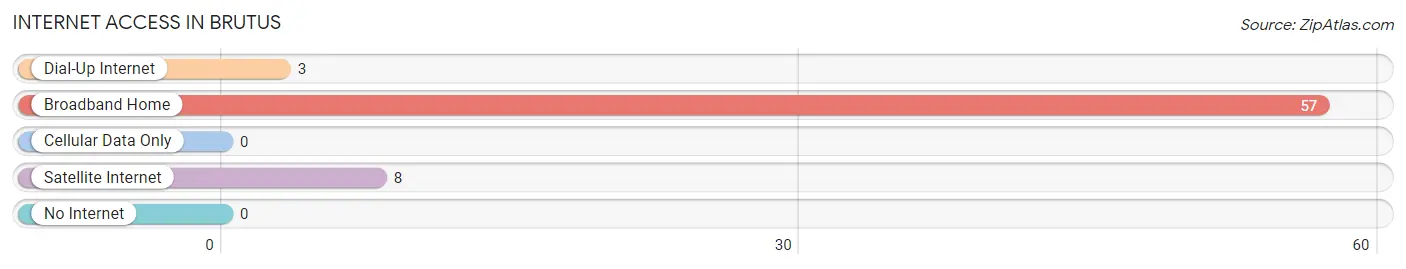
| Internet Type | # Households | % Households |
| Dial-Up Internet | 3 | 4.4% |
| Broadband Home | 57 | 83.8% |
| Cellular Data Only | 0 | 0.0% |
| Satellite Internet | 8 | 11.8% |
| No Internet | 0 | 0.0% |
| Total | 68 | 100.0% |
Brutus Summary
Brutus is a small unincorporated community located in Cheboygan County, Michigan. It is situated on the shores of Burt Lake, a large lake in the northern part of the state. The community is located about 10 miles north of the city of Cheboygan and is part of the Cheboygan-Otsego-Presque Isle Metropolitan Statistical Area.
History
The area that is now known as Brutus was first settled in the late 1800s by a group of French-Canadian immigrants. The settlement was originally known as “La Petite Riviere”, which translates to “The Little River”. The settlement was later renamed to Brutus in honor of the Roman general Marcus Junius Brutus, who was a leader in the overthrow of the Roman Republic.
The area was primarily a logging and fishing community until the early 1900s when the lumber industry began to decline. The area then became a popular tourist destination, with many people coming to enjoy the lake and the surrounding area.
Geography
Brutus is located in the northern part of Michigan, on the shores of Burt Lake. The lake is approximately 8 miles long and 2 miles wide, and is part of the Inland Waterway, a chain of lakes and rivers that connect Lake Huron to Lake Michigan. The area is also home to several smaller lakes, including Crooked Lake, Round Lake, and Long Lake.
The area is mostly flat, with some rolling hills and small valleys. The terrain is mostly covered in forests, with some open fields and meadows. The climate is generally mild, with cold winters and warm summers.
Economy
The economy of Brutus is largely based on tourism and recreation. The area is home to several resorts and campgrounds, as well as a number of marinas and boat launches. Fishing and boating are popular activities in the area, and there are several charter fishing companies that operate in the area.
The area is also home to several small businesses, including restaurants, convenience stores, and gas stations. There is also a small airport located in the area, which is used for private and charter flights.
Demographics
As of the 2010 census, the population of Brutus was 1,093. The population is mostly white (97.3%), with a small percentage of African Americans (1.2%) and Native Americans (0.7%). The median household income is $37,917, and the median age is 44.7 years.
The area is served by the Cheboygan-Otsego-Presque Isle School District, which includes two elementary schools, one middle school, and one high school. The area is also home to a branch of the Cheboygan County Library.
Conclusion
Brutus is a small unincorporated community located in Cheboygan County, Michigan. It is situated on the shores of Burt Lake, and is a popular tourist destination. The economy of the area is largely based on tourism and recreation, and the population is mostly white. The area is served by the Cheboygan-Otsego-Presque Isle School District, and is home to a branch of the Cheboygan County Library.
Common Questions
What is Per Capita Income in Brutus?
Per Capita income in Brutus is $23,855.
What is the Median Family Income in Brutus?
Median Family Income in Brutus is $70,313.
What is the Median Household income in Brutus?
Median Household Income in Brutus is $64,167.
What is Income or Wage Gap in Brutus?
Income or Wage Gap in Brutus is 49.2%.
Women in Brutus earn 50.8 cents for every dollar earned by a man.
What is Inequality or Gini Index in Brutus?
Inequality or Gini Index in Brutus is 0.31.
What is the Total Population of Brutus?
Total Population of Brutus is 211.
What is the Total Male Population of Brutus?
Total Male Population of Brutus is 93.
What is the Total Female Population of Brutus?
Total Female Population of Brutus is 118.
What is the Ratio of Males per 100 Females in Brutus?
There are 78.81 Males per 100 Females in Brutus.
What is the Ratio of Females per 100 Males in Brutus?
There are 126.88 Females per 100 Males in Brutus.
What is the Median Population Age in Brutus?
Median Population Age in Brutus is 36.1 Years.
What is the Average Family Size in Brutus
Average Family Size in Brutus is 3.3 People.
What is the Average Household Size in Brutus
Average Household Size in Brutus is 3.1 People.
How Large is the Labor Force in Brutus?
There are 127 People in the Labor Forcein in Brutus.
What is the Percentage of People in the Labor Force in Brutus?
80.4% of People are in the Labor Force in Brutus.