Boon, MI Map & Demographics
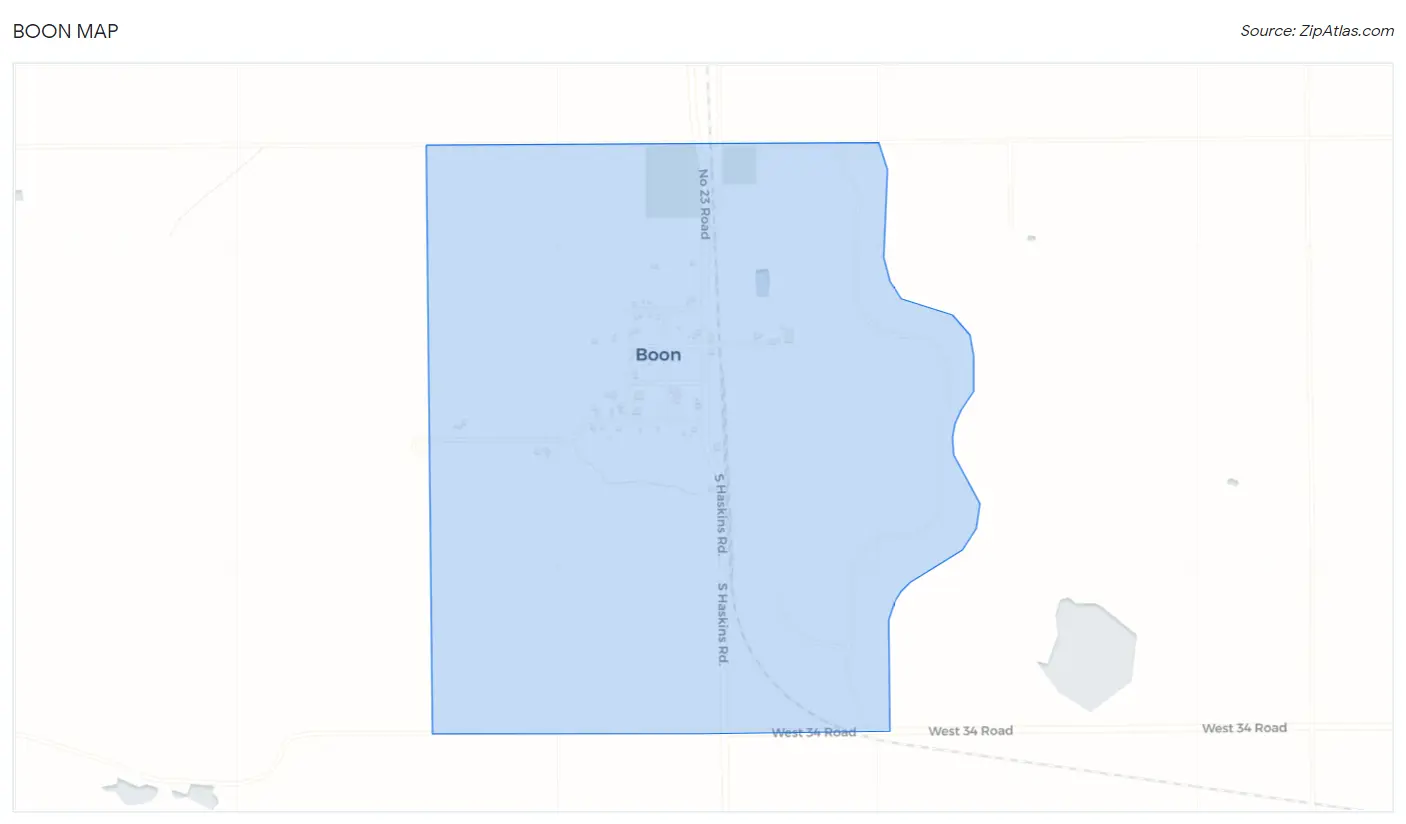
Boon Map
Boon Overview
$43,459
PER CAPITA INCOME
$93,214
AVG FAMILY INCOME
$90,000
AVG HOUSEHOLD INCOME
0.22
INEQUALITY / GINI INDEX
56
TOTAL POPULATION
31
MALE POPULATION
25
FEMALE POPULATION
124.00
MALES / 100 FEMALES
80.65
FEMALES / 100 MALES
52.9
MEDIAN AGE
2.1
AVG FAMILY SIZE
1.9
AVG HOUSEHOLD SIZE
23
LABOR FORCE [ PEOPLE ]
41.1%
PERCENT IN LABOR FORCE
Boon Zip Codes
Boon Area Codes
Income in Boon
Income Overview in Boon
Per Capita Income in Boon is $43,459, while median incomes of families and households are $93,214 and $90,000 respectively.
| Characteristic | Number | Measure |
| Per Capita Income | 56 | $43,459 |
| Median Family Income | 16 | $93,214 |
| Mean Family Income | 16 | $93,031 |
| Median Household Income | 30 | $90,000 |
| Mean Household Income | 30 | $85,563 |
| Income Deficit | 16 | $0 |
| Wage / Income Gap (%) | 56 | 0.00% |
| Wage / Income Gap ($) | 56 | 100.00¢ per $1 |
| Gini / Inequality Index | 56 | 0.22 |
Earnings by Sex in Boon
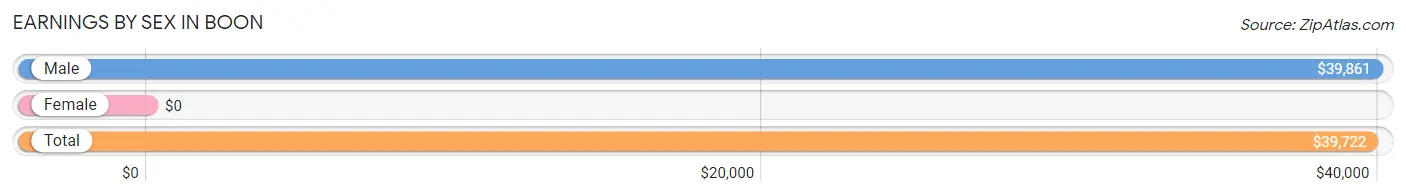
| Sex | Number | Average Earnings |
| Male | 19 (52.8%) | $39,861 |
| Female | 17 (47.2%) | $0 |
| Total | 36 (100.0%) | $39,722 |
Earnings by Sex by Income Bracket in Boon
The most common earnings brackets in Boon are $35,000 to $39,999 for men (9 | 47.4%) and $50,000 to $54,999 for women (6 | 35.3%).
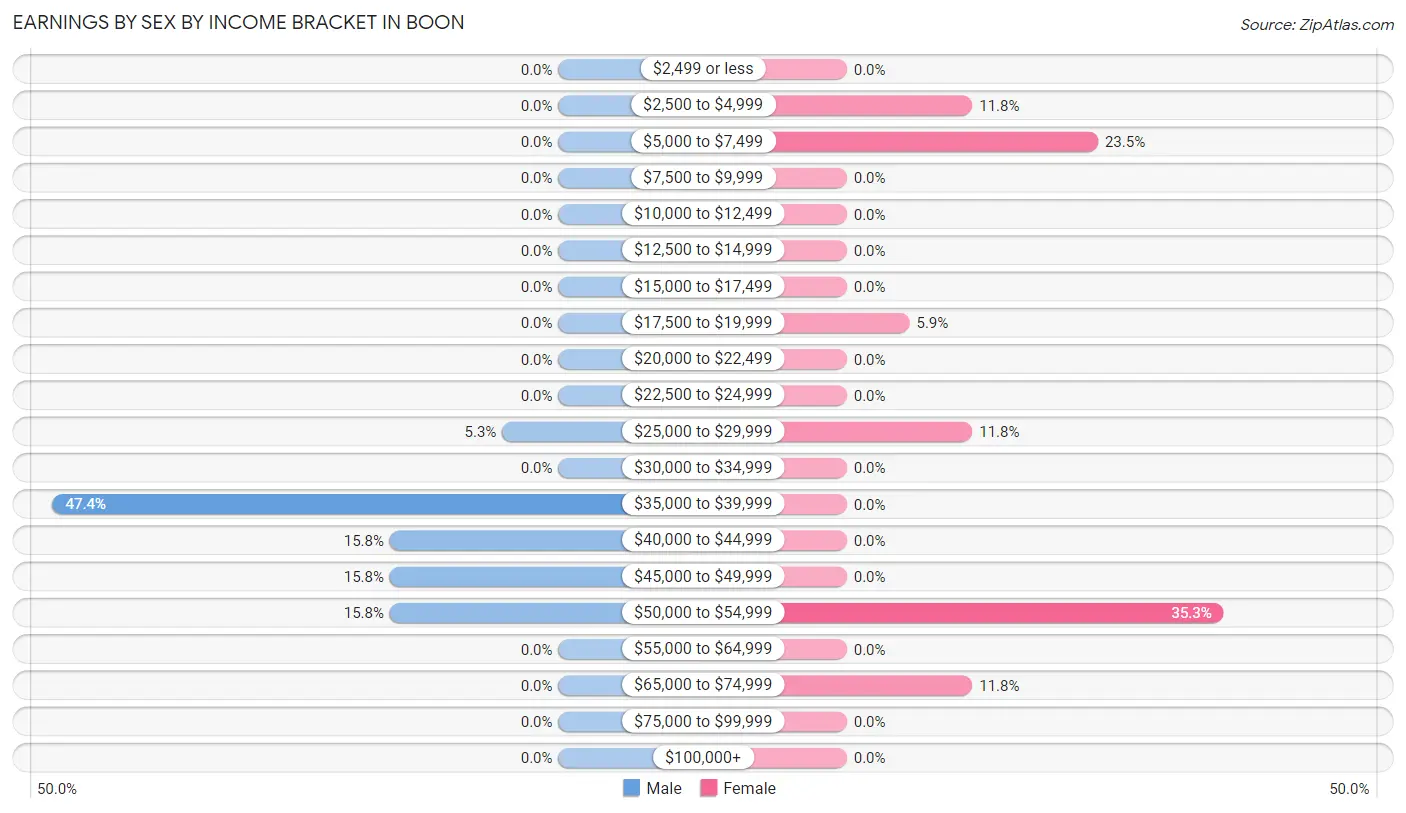
| Income | Male | Female |
| $2,499 or less | 0 (0.0%) | 0 (0.0%) |
| $2,500 to $4,999 | 0 (0.0%) | 2 (11.8%) |
| $5,000 to $7,499 | 0 (0.0%) | 4 (23.5%) |
| $7,500 to $9,999 | 0 (0.0%) | 0 (0.0%) |
| $10,000 to $12,499 | 0 (0.0%) | 0 (0.0%) |
| $12,500 to $14,999 | 0 (0.0%) | 0 (0.0%) |
| $15,000 to $17,499 | 0 (0.0%) | 0 (0.0%) |
| $17,500 to $19,999 | 0 (0.0%) | 1 (5.9%) |
| $20,000 to $22,499 | 0 (0.0%) | 0 (0.0%) |
| $22,500 to $24,999 | 0 (0.0%) | 0 (0.0%) |
| $25,000 to $29,999 | 1 (5.3%) | 2 (11.8%) |
| $30,000 to $34,999 | 0 (0.0%) | 0 (0.0%) |
| $35,000 to $39,999 | 9 (47.4%) | 0 (0.0%) |
| $40,000 to $44,999 | 3 (15.8%) | 0 (0.0%) |
| $45,000 to $49,999 | 3 (15.8%) | 0 (0.0%) |
| $50,000 to $54,999 | 3 (15.8%) | 6 (35.3%) |
| $55,000 to $64,999 | 0 (0.0%) | 0 (0.0%) |
| $65,000 to $74,999 | 0 (0.0%) | 2 (11.8%) |
| $75,000 to $99,999 | 0 (0.0%) | 0 (0.0%) |
| $100,000+ | 0 (0.0%) | 0 (0.0%) |
| Total | 19 (100.0%) | 17 (100.0%) |
Earnings by Sex by Educational Attainment in Boon
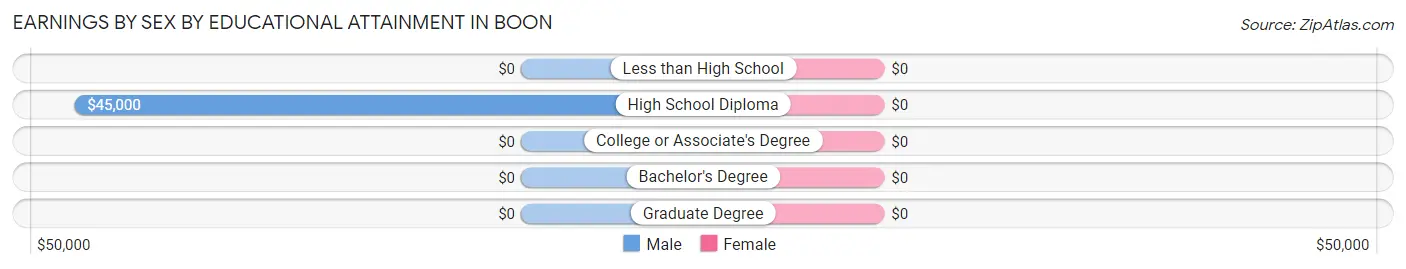
| Educational Attainment | Male Income | Female Income |
| Less than High School | - | - |
| High School Diploma | $45,000 | $0 |
| College or Associate's Degree | - | - |
| Bachelor's Degree | - | - |
| Graduate Degree | - | - |
| Total | $39,861 | $53,125 |
Family Income in Boon
Family Income Brackets in Boon
According to the Boon family income data, there are 10 families falling into the $75,000 to $99,999 income range, which is the most common income bracket and makes up 62.5% of all families.
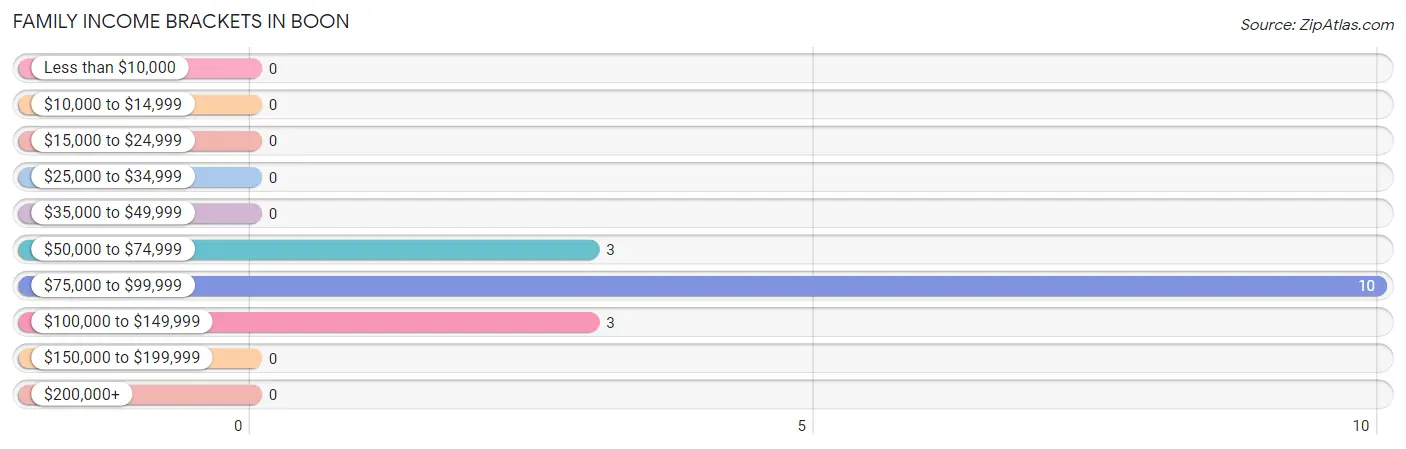
| Income Bracket | # Families | % Families |
| Less than $10,000 | 0 | 0.0% |
| $10,000 to $14,999 | 0 | 0.0% |
| $15,000 to $24,999 | 0 | 0.0% |
| $25,000 to $34,999 | 0 | 0.0% |
| $35,000 to $49,999 | 0 | 0.0% |
| $50,000 to $74,999 | 3 | 18.8% |
| $75,000 to $99,999 | 10 | 62.5% |
| $100,000 to $149,999 | 3 | 18.8% |
| $150,000 to $199,999 | 0 | 0.0% |
| $200,000+ | 0 | 0.0% |
Family Income by Famaliy Size in Boon
2-person families (14 | 87.5%) account for the highest median family income in Boon with $93,571 per family, while 2-person families (14 | 87.5%) have the highest median income of $46,786 per family member.
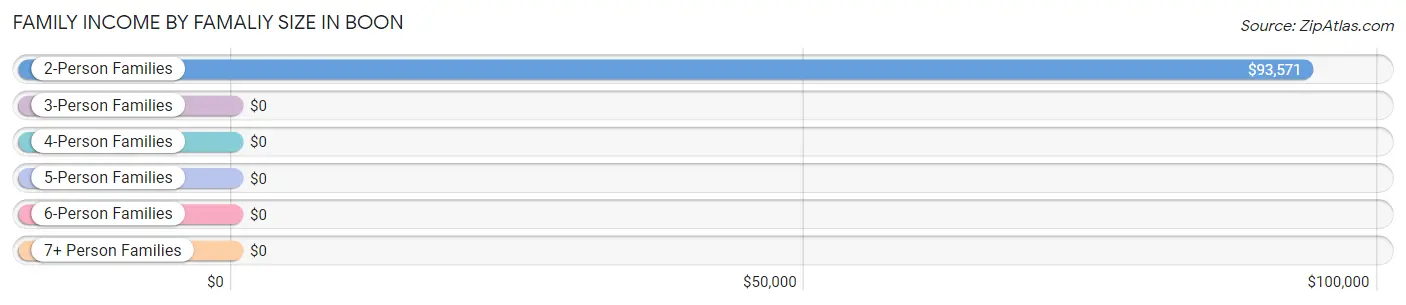
| Income Bracket | # Families | Median Income |
| 2-Person Families | 14 (87.5%) | $93,571 |
| 3-Person Families | 2 (12.5%) | $0 |
| 4-Person Families | 0 (0.0%) | $0 |
| 5-Person Families | 0 (0.0%) | $0 |
| 6-Person Families | 0 (0.0%) | $0 |
| 7+ Person Families | 0 (0.0%) | $0 |
| Total | 16 (100.0%) | $93,214 |
Family Income by Number of Earners in Boon
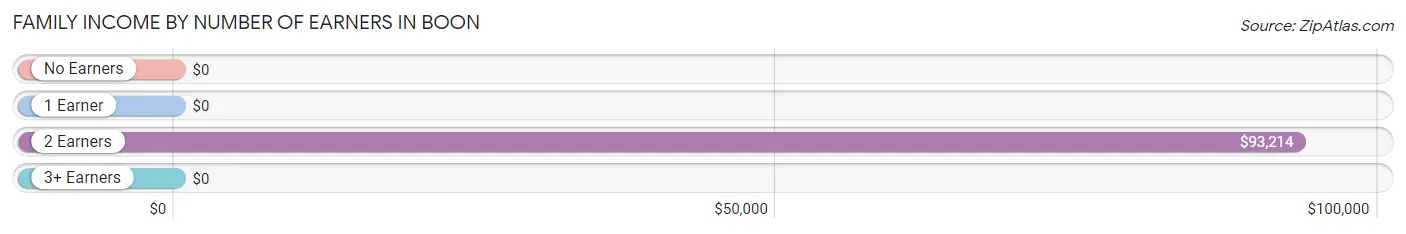
| Number of Earners | # Families | Median Income |
| No Earners | 0 (0.0%) | $0 |
| 1 Earner | 0 (0.0%) | $0 |
| 2 Earners | 16 (100.0%) | $93,214 |
| 3+ Earners | 0 (0.0%) | $0 |
| Total | 16 (100.0%) | $93,214 |
Household Income in Boon
Household Income Brackets in Boon
With 13 households falling in the category, the $75,000 to $99,999 income range is the most frequent in Boon, accounting for 43.3% of all households.
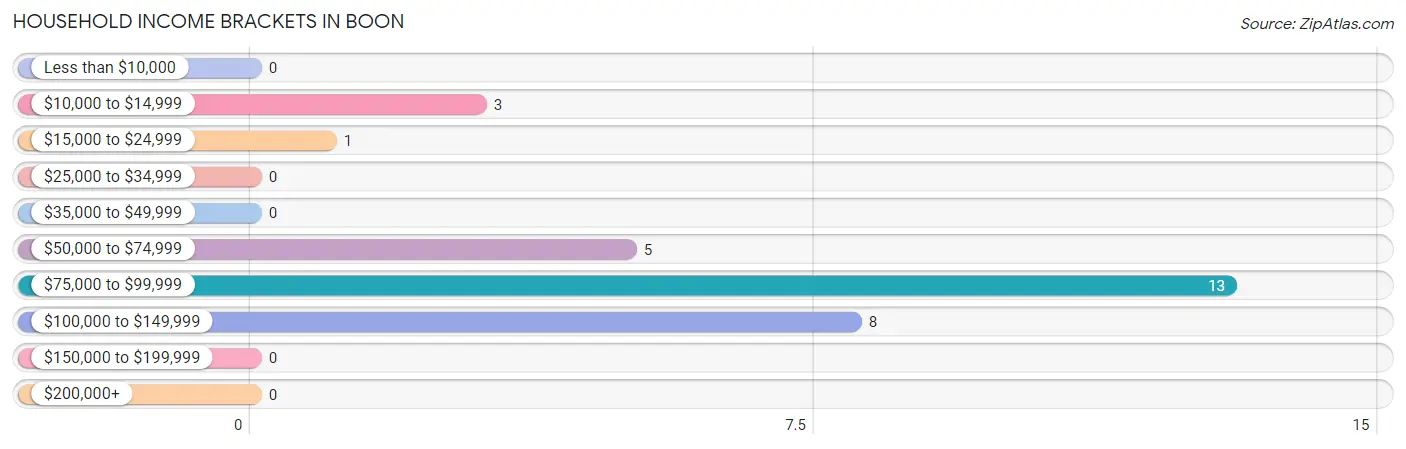
| Income Bracket | # Households | % Households |
| Less than $10,000 | 0 | 0.0% |
| $10,000 to $14,999 | 3 | 10.0% |
| $15,000 to $24,999 | 1 | 3.3% |
| $25,000 to $34,999 | 0 | 0.0% |
| $35,000 to $49,999 | 0 | 0.0% |
| $50,000 to $74,999 | 5 | 16.7% |
| $75,000 to $99,999 | 13 | 43.3% |
| $100,000 to $149,999 | 8 | 26.7% |
| $150,000 to $199,999 | 0 | 0.0% |
| $200,000+ | 0 | 0.0% |
Household Income by Householder Age in Boon
The median household income in Boon is $90,000, with the highest median household income of $128,000 found in the 65+ years age bracket for the primary householder. A total of 8 households (26.7%) fall into this category.
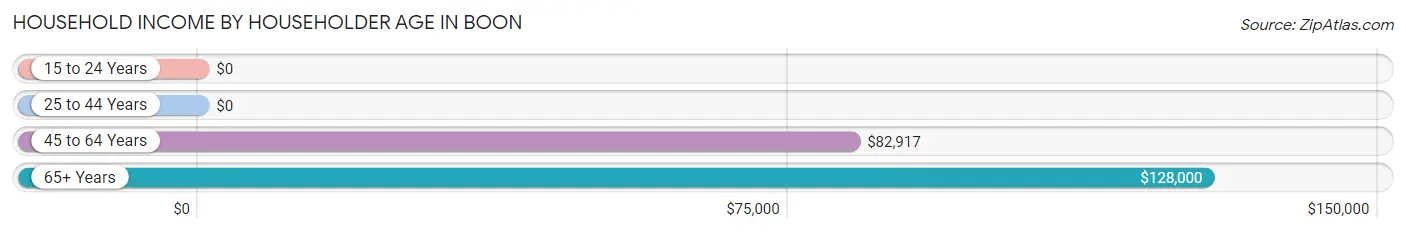
| Income Bracket | # Households | Median Income |
| 15 to 24 Years | 0 (0.0%) | $0 |
| 25 to 44 Years | 7 (23.3%) | $0 |
| 45 to 64 Years | 15 (50.0%) | $82,917 |
| 65+ Years | 8 (26.7%) | $128,000 |
| Total | 30 (100.0%) | $90,000 |
Poverty in Boon
Income Below Poverty by Sex and Age in Boon
With 12.9% poverty level for males and 20.0% for females among the residents of Boon, 65 to 74 year old males and 35 to 44 year old females are the most vulnerable to poverty, with 1 males (100.0%) and 2 females (100.0%) in their respective age groups living below the poverty level.
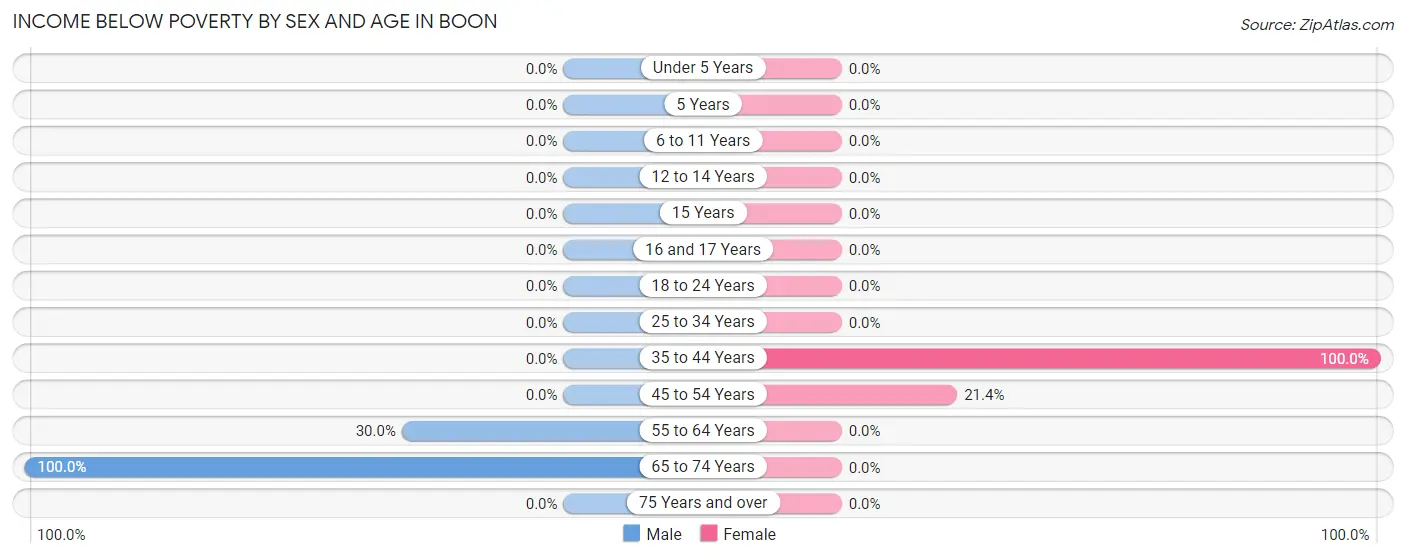
| Age Bracket | Male | Female |
| Under 5 Years | 0 (0.0%) | 0 (0.0%) |
| 5 Years | 0 (0.0%) | 0 (0.0%) |
| 6 to 11 Years | 0 (0.0%) | 0 (0.0%) |
| 12 to 14 Years | 0 (0.0%) | 0 (0.0%) |
| 15 Years | 0 (0.0%) | 0 (0.0%) |
| 16 and 17 Years | 0 (0.0%) | 0 (0.0%) |
| 18 to 24 Years | 0 (0.0%) | 0 (0.0%) |
| 25 to 34 Years | 0 (0.0%) | 0 (0.0%) |
| 35 to 44 Years | 0 (0.0%) | 2 (100.0%) |
| 45 to 54 Years | 0 (0.0%) | 3 (21.4%) |
| 55 to 64 Years | 3 (30.0%) | 0 (0.0%) |
| 65 to 74 Years | 1 (100.0%) | 0 (0.0%) |
| 75 Years and over | 0 (0.0%) | 0 (0.0%) |
| Total | 4 (12.9%) | 5 (20.0%) |
Income Above Poverty by Sex and Age in Boon
According to the poverty statistics in Boon, males aged 35 to 44 years and females aged 18 to 24 years are the age groups that are most secure financially, with 100.0% of males and 100.0% of females in these age groups living above the poverty line.
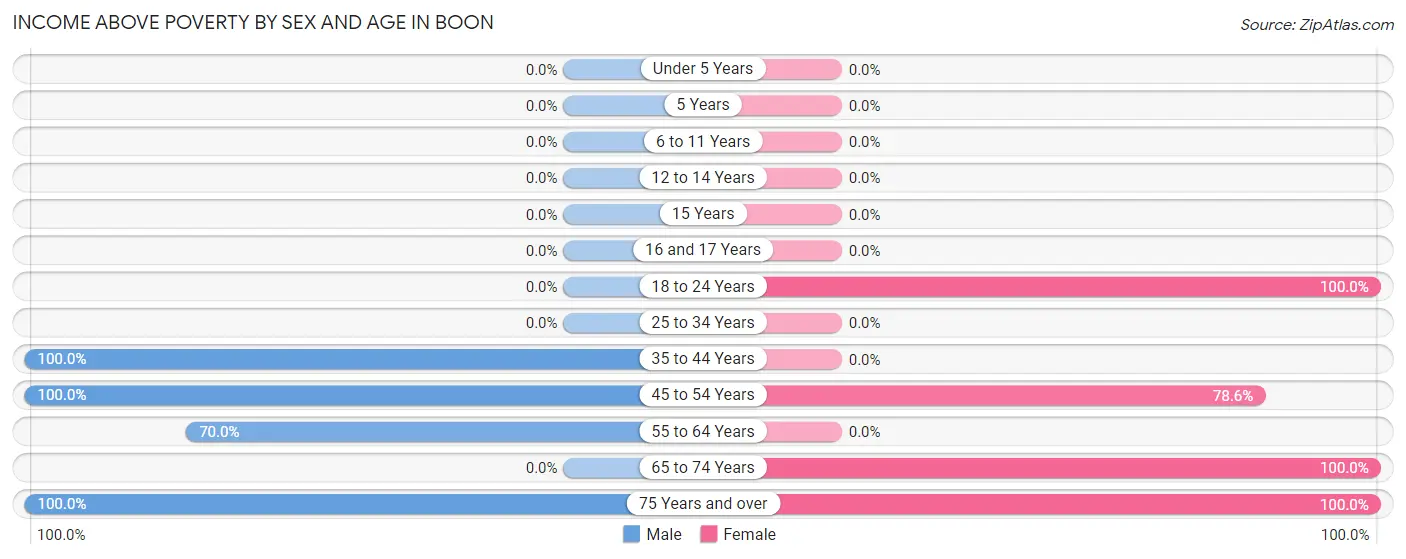
| Age Bracket | Male | Female |
| Under 5 Years | 0 (0.0%) | 0 (0.0%) |
| 5 Years | 0 (0.0%) | 0 (0.0%) |
| 6 to 11 Years | 0 (0.0%) | 0 (0.0%) |
| 12 to 14 Years | 0 (0.0%) | 0 (0.0%) |
| 15 Years | 0 (0.0%) | 0 (0.0%) |
| 16 and 17 Years | 0 (0.0%) | 0 (0.0%) |
| 18 to 24 Years | 0 (0.0%) | 4 (100.0%) |
| 25 to 34 Years | 0 (0.0%) | 0 (0.0%) |
| 35 to 44 Years | 7 (100.0%) | 0 (0.0%) |
| 45 to 54 Years | 8 (100.0%) | 11 (78.6%) |
| 55 to 64 Years | 7 (70.0%) | 0 (0.0%) |
| 65 to 74 Years | 0 (0.0%) | 3 (100.0%) |
| 75 Years and over | 5 (100.0%) | 2 (100.0%) |
| Total | 27 (87.1%) | 20 (80.0%) |
Income Below Poverty Among Married-Couple Families in Boon
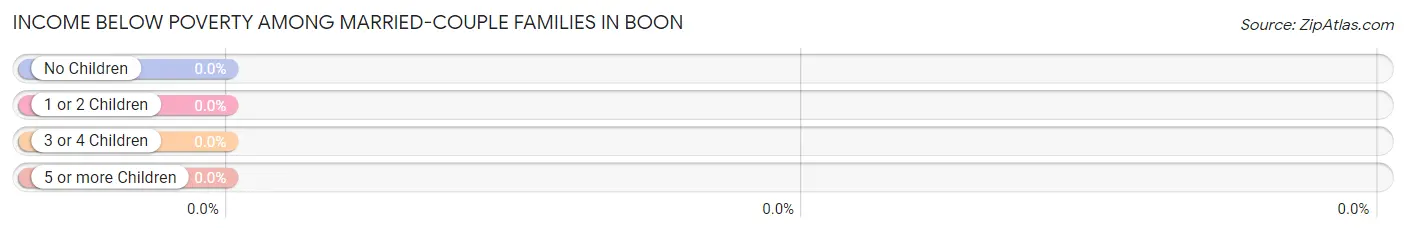
| Children | Above Poverty | Below Poverty |
| No Children | 13 (100.0%) | 0 (0.0%) |
| 1 or 2 Children | 0 (0.0%) | 0 (0.0%) |
| 3 or 4 Children | 0 (0.0%) | 0 (0.0%) |
| 5 or more Children | 0 (0.0%) | 0 (0.0%) |
| Total | 13 (100.0%) | 0 (0.0%) |
Income Below Poverty Among Single-Parent Households in Boon
| Children | Single Father | Single Mother |
| No Children | 0 (0.0%) | 0 (0.0%) |
| 1 or 2 Children | 0 (0.0%) | 0 (0.0%) |
| 3 or 4 Children | 0 (0.0%) | 0 (0.0%) |
| 5 or more Children | 0 (0.0%) | 0 (0.0%) |
| Total | 0 (0.0%) | 0 (0.0%) |
Income Below Poverty Among Married-Couple vs Single-Parent Households in Boon
| Children | Married-Couple Families | Single-Parent Households |
| No Children | 0 (0.0%) | 0 (0.0%) |
| 1 or 2 Children | 0 (0.0%) | 0 (0.0%) |
| 3 or 4 Children | 0 (0.0%) | 0 (0.0%) |
| 5 or more Children | 0 (0.0%) | 0 (0.0%) |
| Total | 0 (0.0%) | 0 (0.0%) |
Race in Boon
The most populous races in Boon are , and White / Caucasian (56 | 100.0%).
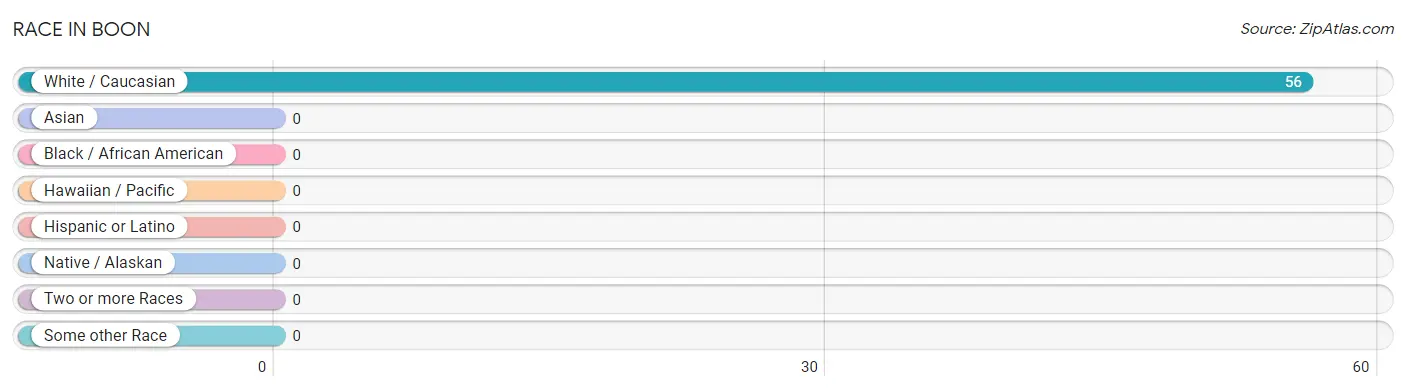
| Race | # Population | % Population |
| Asian | 0 | 0.0% |
| Black / African American | 0 | 0.0% |
| Hawaiian / Pacific | 0 | 0.0% |
| Hispanic or Latino | 0 | 0.0% |
| Native / Alaskan | 0 | 0.0% |
| White / Caucasian | 56 | 100.0% |
| Two or more Races | 0 | 0.0% |
| Some other Race | 0 | 0.0% |
| Total | 56 | 100.0% |
Ancestry in Boon
The most populous ancestries reported in Boon are German (14 | 25.0%), Hungarian (6 | 10.7%), Scottish (6 | 10.7%), Yugoslavian (5 | 8.9%), and English (4 | 7.1%), together accounting for 62.5% of all Boon residents.
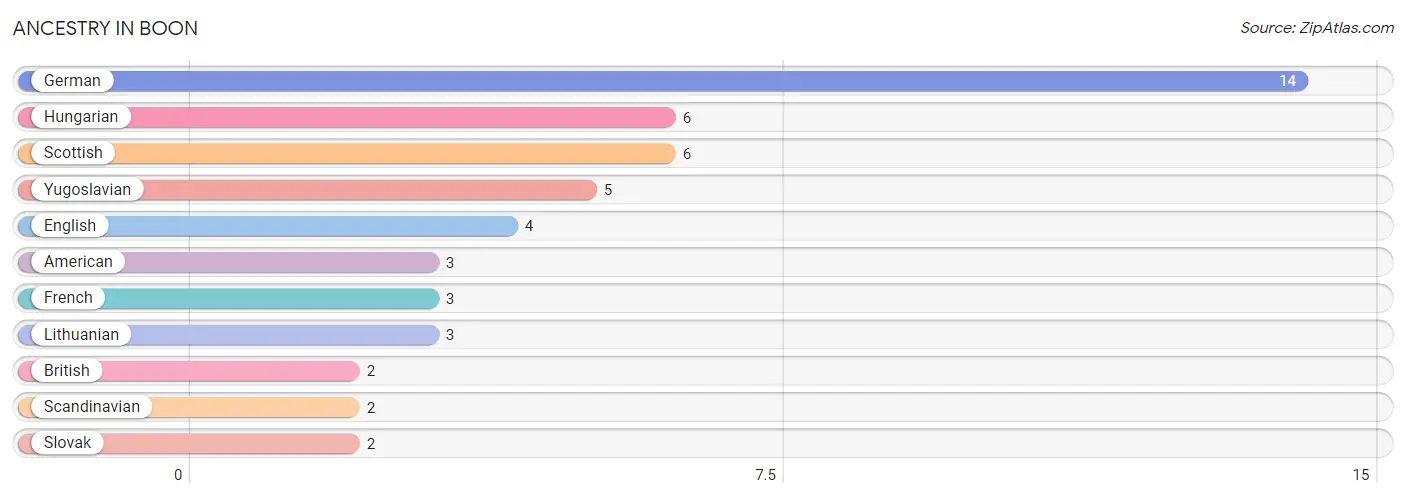
| Ancestry | # Population | % Population |
| American | 3 | 5.4% |
| British | 2 | 3.6% |
| English | 4 | 7.1% |
| French | 3 | 5.4% |
| German | 14 | 25.0% |
| Hungarian | 6 | 10.7% |
| Lithuanian | 3 | 5.4% |
| Scandinavian | 2 | 3.6% |
| Scottish | 6 | 10.7% |
| Slovak | 2 | 3.6% |
| Yugoslavian | 5 | 8.9% | View All 11 Rows |
Immigrants in Boon

| Immigration Origin | # Population | % Population | View All 0 Rows |
Sex and Age in Boon
Sex and Age in Boon
The most populous age groups in Boon are 60 to 64 Years (9 | 29.0%) for men and 45 to 49 Years (9 | 36.0%) for women.
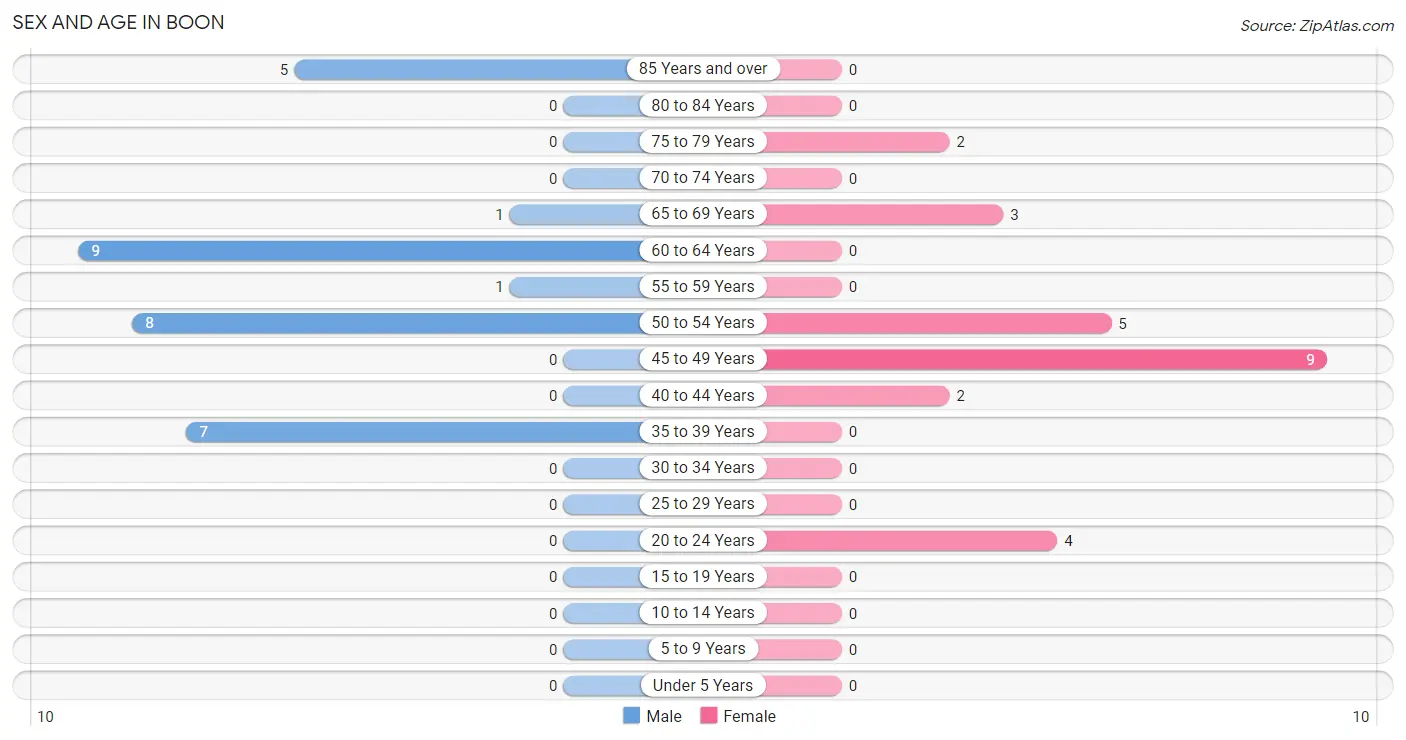
| Age Bracket | Male | Female |
| Under 5 Years | 0 (0.0%) | 0 (0.0%) |
| 5 to 9 Years | 0 (0.0%) | 0 (0.0%) |
| 10 to 14 Years | 0 (0.0%) | 0 (0.0%) |
| 15 to 19 Years | 0 (0.0%) | 0 (0.0%) |
| 20 to 24 Years | 0 (0.0%) | 4 (16.0%) |
| 25 to 29 Years | 0 (0.0%) | 0 (0.0%) |
| 30 to 34 Years | 0 (0.0%) | 0 (0.0%) |
| 35 to 39 Years | 7 (22.6%) | 0 (0.0%) |
| 40 to 44 Years | 0 (0.0%) | 2 (8.0%) |
| 45 to 49 Years | 0 (0.0%) | 9 (36.0%) |
| 50 to 54 Years | 8 (25.8%) | 5 (20.0%) |
| 55 to 59 Years | 1 (3.2%) | 0 (0.0%) |
| 60 to 64 Years | 9 (29.0%) | 0 (0.0%) |
| 65 to 69 Years | 1 (3.2%) | 3 (12.0%) |
| 70 to 74 Years | 0 (0.0%) | 0 (0.0%) |
| 75 to 79 Years | 0 (0.0%) | 2 (8.0%) |
| 80 to 84 Years | 0 (0.0%) | 0 (0.0%) |
| 85 Years and over | 5 (16.1%) | 0 (0.0%) |
| Total | 31 (100.0%) | 25 (100.0%) |
Families and Households in Boon
Median Family Size in Boon
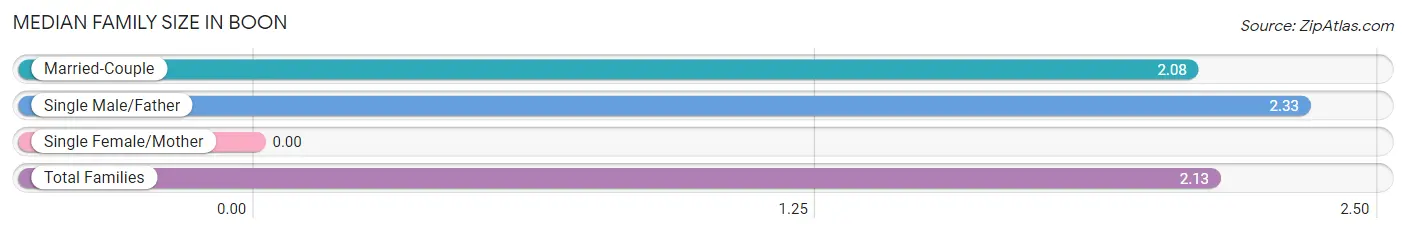
| Family Type | # Families | Family Size |
| Married-Couple | 13 (81.2%) | 2.08 |
| Single Male/Father | 3 (18.8%) | 2.33 |
| Single Female/Mother | 0 (0.0%) | - |
| Total Families | 16 (100.0%) | 2.13 |
Median Household Size in Boon
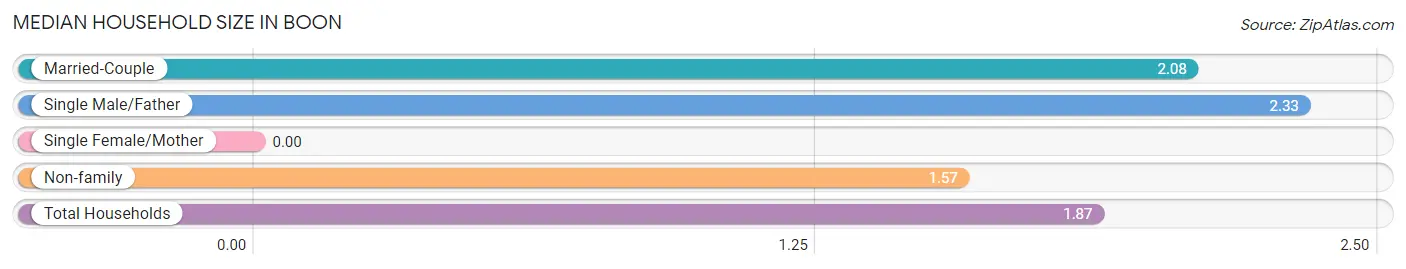
| Household Type | # Households | Household Size |
| Married-Couple | 13 (43.3%) | 2.08 |
| Single Male/Father | 3 (10.0%) | 2.33 |
| Single Female/Mother | 0 (0.0%) | - |
| Non-family | 14 (46.7%) | 1.57 |
| Total Households | 30 (100.0%) | 1.87 |
Household Size by Marriage Status in Boon
Out of a total of 30 households in Boon, 16 (53.3%) are family households, while 14 (46.7%) are nonfamily households. The most numerous type of family households are 2-person households, comprising 14, and the most common type of nonfamily households are 2-person households, comprising 9.
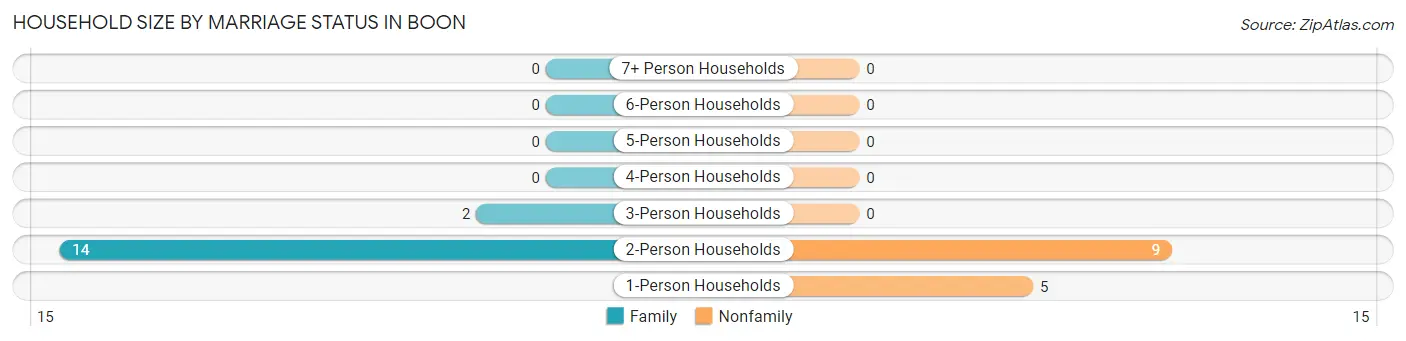
| Household Size | Family Households | Nonfamily Households |
| 1-Person Households | - | 5 (16.7%) |
| 2-Person Households | 14 (46.7%) | 9 (30.0%) |
| 3-Person Households | 2 (6.7%) | 0 (0.0%) |
| 4-Person Households | 0 (0.0%) | 0 (0.0%) |
| 5-Person Households | 0 (0.0%) | 0 (0.0%) |
| 6-Person Households | 0 (0.0%) | 0 (0.0%) |
| 7+ Person Households | 0 (0.0%) | 0 (0.0%) |
| Total | 16 (53.3%) | 14 (46.7%) |
Female Fertility in Boon
Fertility by Age in Boon
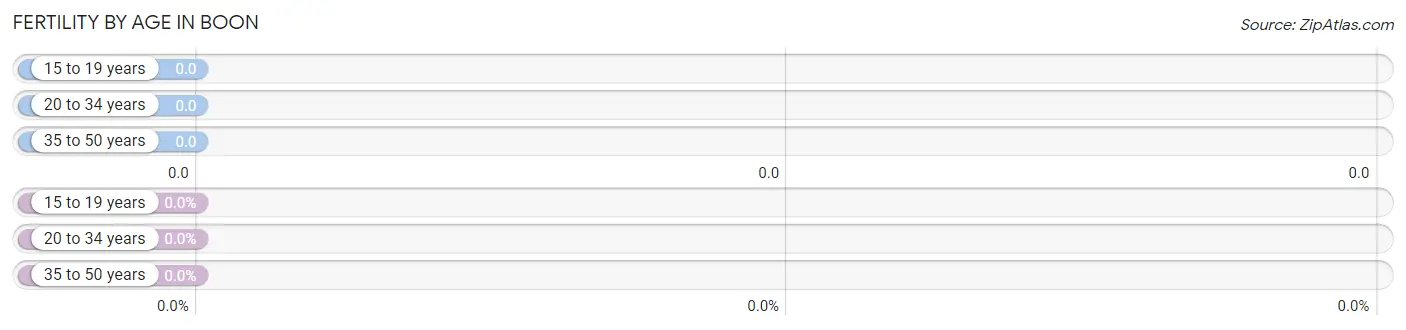
| Age Bracket | Women with Births | Births / 1,000 Women |
| 15 to 19 years | 0 (0.0%) | 0.0 |
| 20 to 34 years | 0 (0.0%) | 0.0 |
| 35 to 50 years | 0 (0.0%) | 0.0 |
| Total | 0 (0.0%) | 0.0 |
Fertility by Age by Marriage Status in Boon
| Age Bracket | Married | Unmarried |
| 15 to 19 years | 0 (0.0%) | 0 (0.0%) |
| 20 to 34 years | 0 (0.0%) | 0 (0.0%) |
| 35 to 50 years | 0 (0.0%) | 0 (0.0%) |
| Total | 0 (0.0%) | 0 (0.0%) |
Fertility by Education in Boon
| Educational Attainment | Women with Births | Births / 1,000 Women |
| Less than High School | 0 (0.0%) | 0.0 |
| High School Diploma | 0 (0.0%) | 0.0 |
| College or Associate's Degree | 0 (0.0%) | 0.0 |
| Bachelor's Degree | 0 (0.0%) | 0.0 |
| Graduate Degree | 0 (0.0%) | 0.0 |
| Total | 0 (0.0%) | 0.0 |
Fertility by Education by Marriage Status in Boon
| Educational Attainment | Married | Unmarried |
| Less than High School | 0 (0.0%) | 0 (0.0%) |
| High School Diploma | 0 (0.0%) | 0 (0.0%) |
| College or Associate's Degree | 0 (0.0%) | 0 (0.0%) |
| Bachelor's Degree | 0 (0.0%) | 0 (0.0%) |
| Graduate Degree | 0 (0.0%) | 0 (0.0%) |
| Total | 0 (0.0%) | 0 (0.0%) |
Employment Characteristics in Boon
Employment by Class of Employer in Boon
Among the 23 employed individuals in Boon, , and private company employees (23 | 100.0%) make up the most common classes of employment.
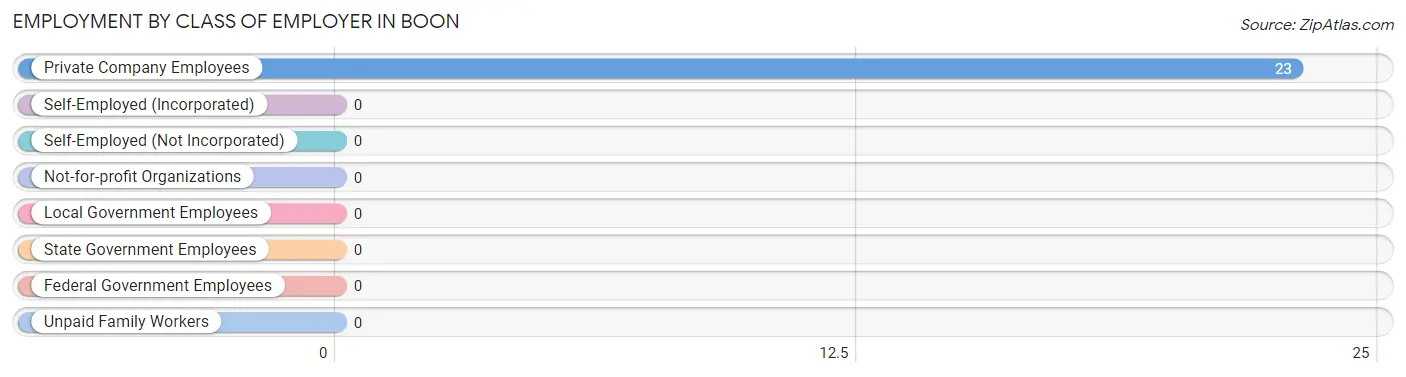
| Employer Class | # Employees | % Employees |
| Private Company Employees | 23 | 100.0% |
| Self-Employed (Incorporated) | 0 | 0.0% |
| Self-Employed (Not Incorporated) | 0 | 0.0% |
| Not-for-profit Organizations | 0 | 0.0% |
| Local Government Employees | 0 | 0.0% |
| State Government Employees | 0 | 0.0% |
| Federal Government Employees | 0 | 0.0% |
| Unpaid Family Workers | 0 | 0.0% |
| Total | 23 | 100.0% |
Employment Status by Age in Boon
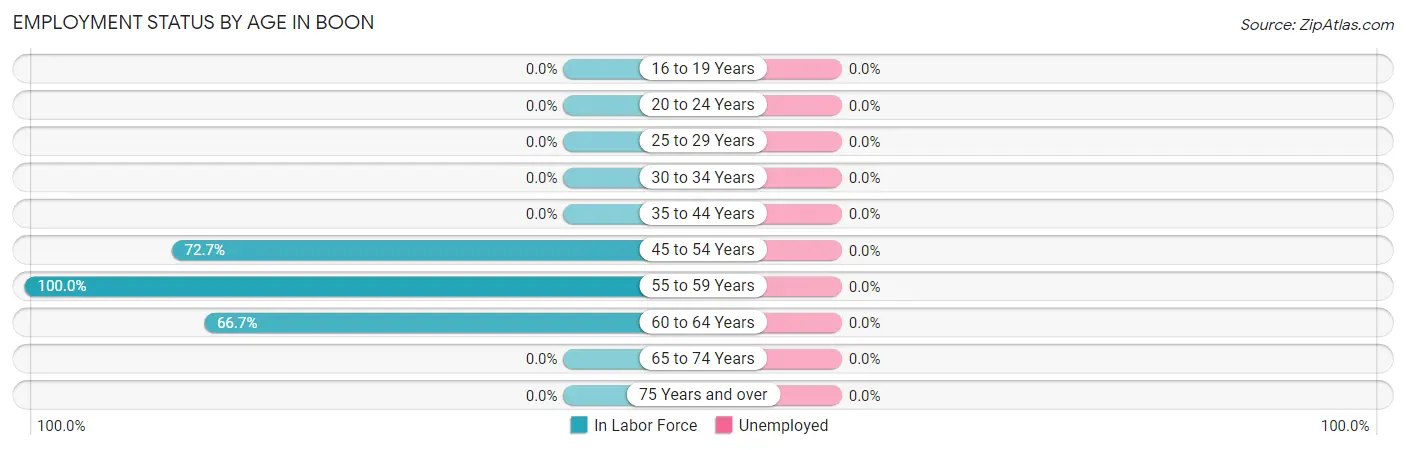
| Age Bracket | In Labor Force | Unemployed |
| 16 to 19 Years | 0 (0.0%) | 0 (0.0%) |
| 20 to 24 Years | 0 (0.0%) | 0 (0.0%) |
| 25 to 29 Years | 0 (0.0%) | 0 (0.0%) |
| 30 to 34 Years | 0 (0.0%) | 0 (0.0%) |
| 35 to 44 Years | 0 (0.0%) | 0 (0.0%) |
| 45 to 54 Years | 16 (72.7%) | 0 (0.0%) |
| 55 to 59 Years | 1 (100.0%) | 0 (0.0%) |
| 60 to 64 Years | 6 (66.7%) | 0 (0.0%) |
| 65 to 74 Years | 0 (0.0%) | 0 (0.0%) |
| 75 Years and over | 0 (0.0%) | 0 (0.0%) |
| Total | 23 (41.1%) | 0 (0.0%) |
Employment Status by Educational Attainment in Boon
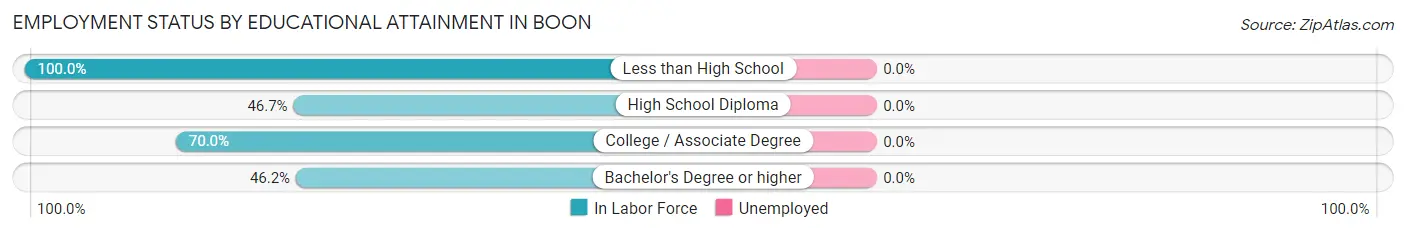
| Educational Attainment | In Labor Force | Unemployed |
| Less than High School | 3 (100.0%) | 0 (0.0%) |
| High School Diploma | 7 (46.7%) | 0 (0.0%) |
| College / Associate Degree | 7 (70.0%) | 0 (0.0%) |
| Bachelor's Degree or higher | 6 (46.2%) | 0 (0.0%) |
| Total | 23 (56.1%) | 0 (0.0%) |
Employment Occupations by Sex in Boon
Management, Business, Science and Arts Occupations
The most common Management, Business, Science and Arts occupations in Boon are Computers, Engineering & Science (6 | 26.1%), and Architecture & Engineering (6 | 26.1%).
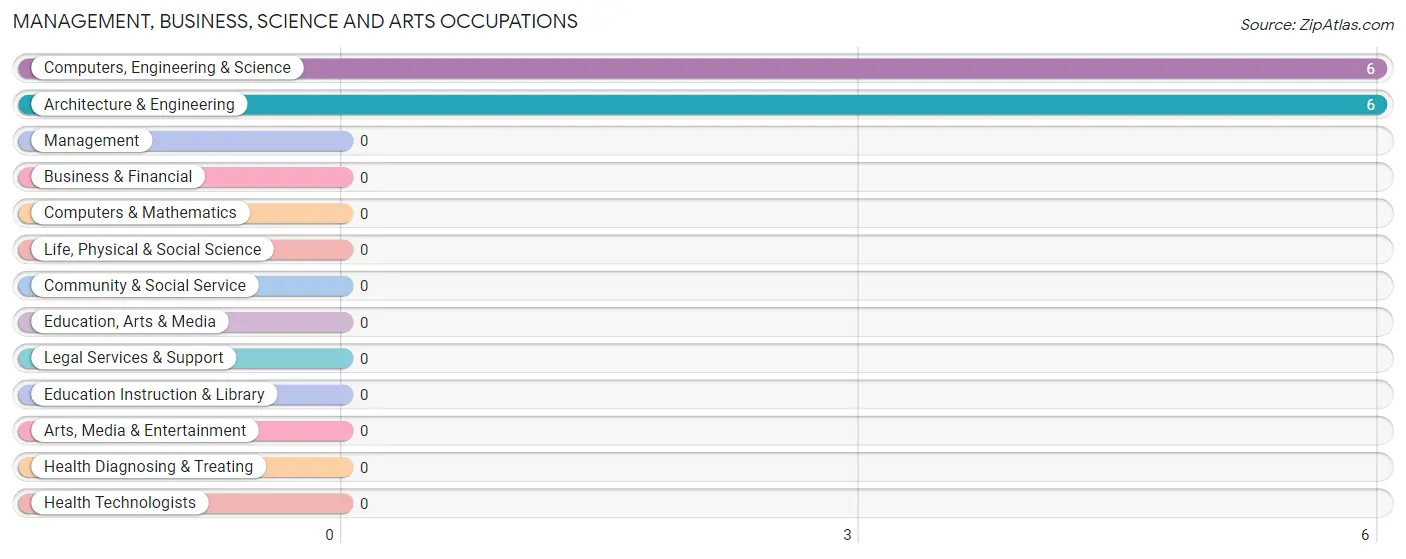
Management, Business, Science and Arts Occupations by Sex
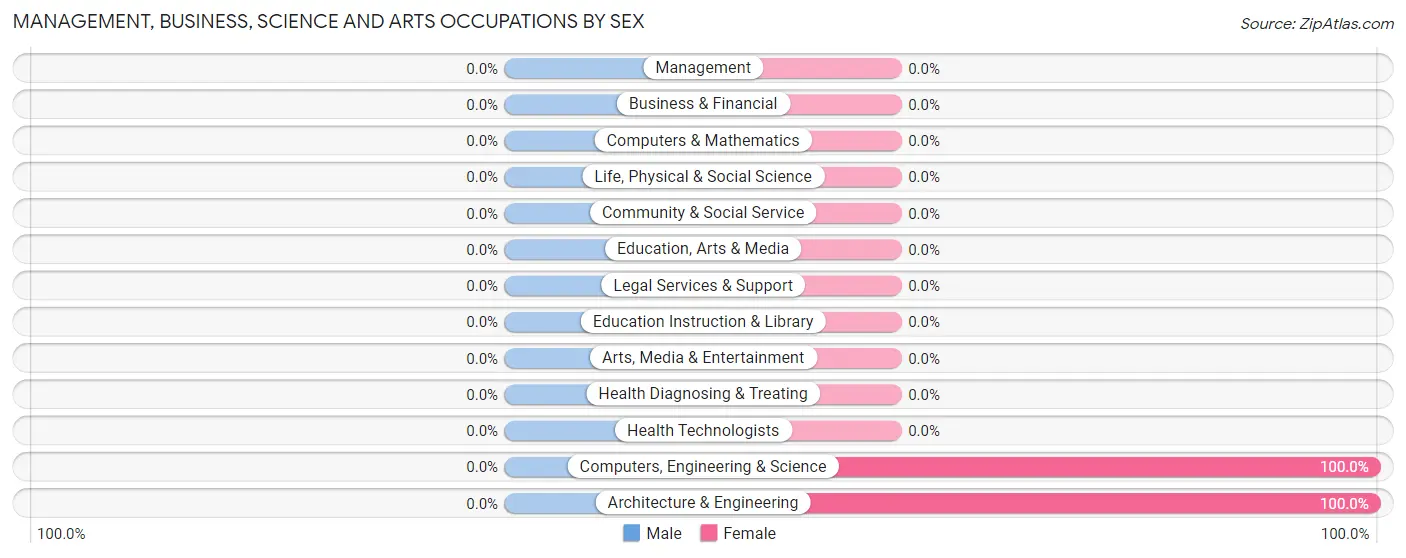
| Occupation | Male | Female |
| Management | 0 (0.0%) | 0 (0.0%) |
| Business & Financial | 0 (0.0%) | 0 (0.0%) |
| Computers, Engineering & Science | 0 (0.0%) | 6 (100.0%) |
| Computers & Mathematics | 0 (0.0%) | 0 (0.0%) |
| Architecture & Engineering | 0 (0.0%) | 6 (100.0%) |
| Life, Physical & Social Science | 0 (0.0%) | 0 (0.0%) |
| Community & Social Service | 0 (0.0%) | 0 (0.0%) |
| Education, Arts & Media | 0 (0.0%) | 0 (0.0%) |
| Legal Services & Support | 0 (0.0%) | 0 (0.0%) |
| Education Instruction & Library | 0 (0.0%) | 0 (0.0%) |
| Arts, Media & Entertainment | 0 (0.0%) | 0 (0.0%) |
| Health Diagnosing & Treating | 0 (0.0%) | 0 (0.0%) |
| Health Technologists | 0 (0.0%) | 0 (0.0%) |
| Total (Category) | 0 (0.0%) | 6 (100.0%) |
| Total (Overall) | 12 (52.2%) | 11 (47.8%) |
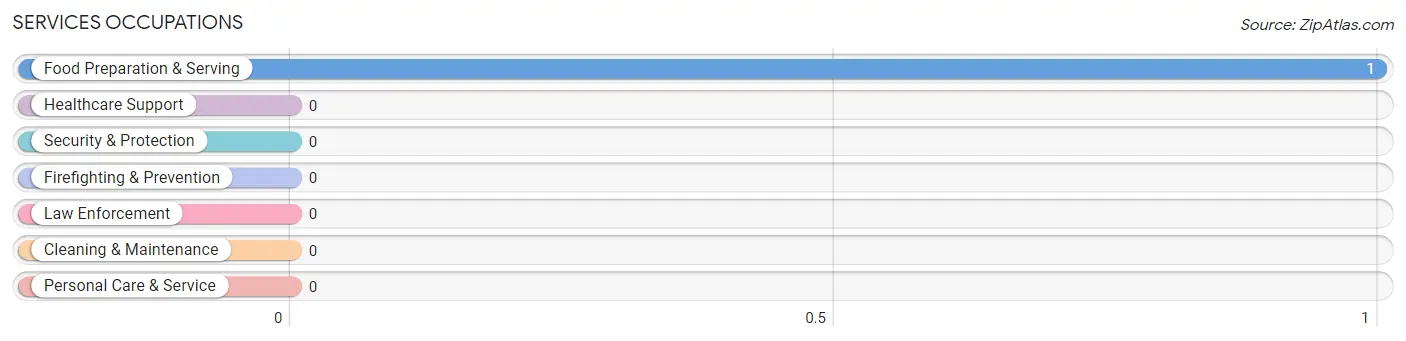
Services Occupations
The most common Services occupations in Boon are , and Food Preparation & Serving (1 | 4.3%).
Services Occupations by Sex
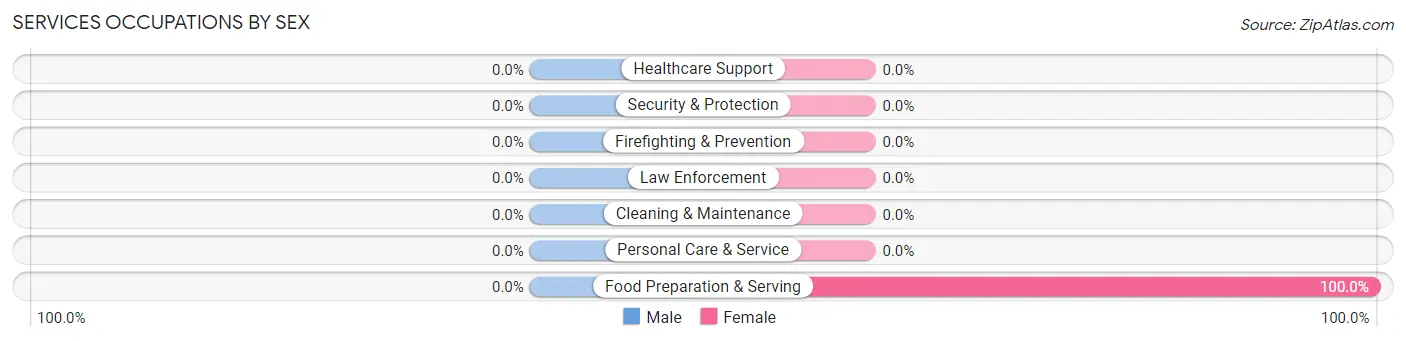
| Occupation | Male | Female |
| Healthcare Support | 0 (0.0%) | 0 (0.0%) |
| Security & Protection | 0 (0.0%) | 0 (0.0%) |
| Firefighting & Prevention | 0 (0.0%) | 0 (0.0%) |
| Law Enforcement | 0 (0.0%) | 0 (0.0%) |
| Food Preparation & Serving | 0 (0.0%) | 1 (100.0%) |
| Cleaning & Maintenance | 0 (0.0%) | 0 (0.0%) |
| Personal Care & Service | 0 (0.0%) | 0 (0.0%) |
| Total (Category) | 0 (0.0%) | 1 (100.0%) |
| Total (Overall) | 12 (52.2%) | 11 (47.8%) |
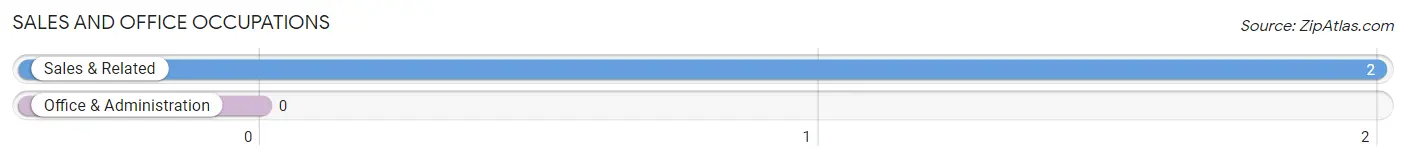
Sales and Office Occupations
The most common Sales and Office occupations in Boon are , and Sales & Related (2 | 8.7%).
Sales and Office Occupations by Sex
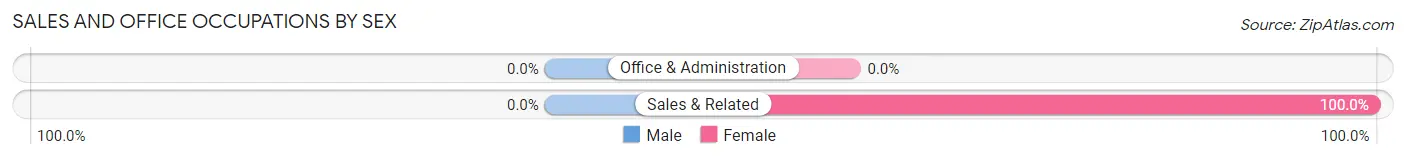
| Occupation | Male | Female |
| Sales & Related | 0 (0.0%) | 2 (100.0%) |
| Office & Administration | 0 (0.0%) | 0 (0.0%) |
| Total (Category) | 0 (0.0%) | 2 (100.0%) |
| Total (Overall) | 12 (52.2%) | 11 (47.8%) |
Natural Resources, Construction and Maintenance Occupations
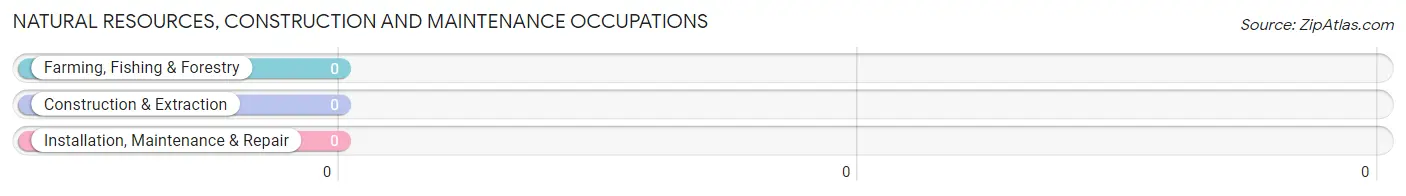
Natural Resources, Construction and Maintenance Occupations by Sex
| Occupation | Male | Female |
| Farming, Fishing & Forestry | 0 (0.0%) | 0 (0.0%) |
| Construction & Extraction | 0 (0.0%) | 0 (0.0%) |
| Installation, Maintenance & Repair | 0 (0.0%) | 0 (0.0%) |
| Total (Category) | 0 (0.0%) | 0 (0.0%) |
| Total (Overall) | 12 (52.2%) | 11 (47.8%) |
Production, Transportation and Moving Occupations
The most common Production, Transportation and Moving occupations in Boon are Production (10 | 43.5%), Transportation (3 | 13.0%), and Material Moving (1 | 4.3%).
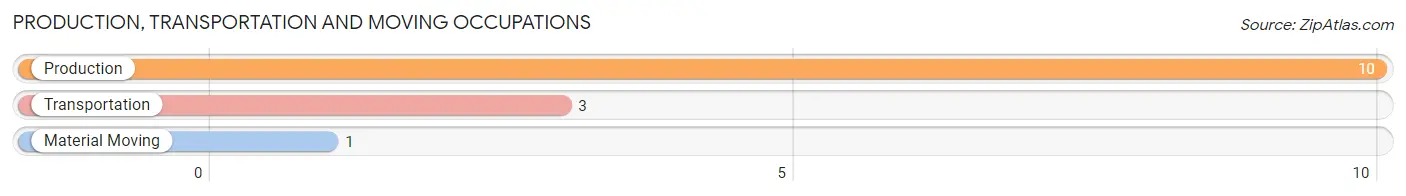
Production, Transportation and Moving Occupations by Sex
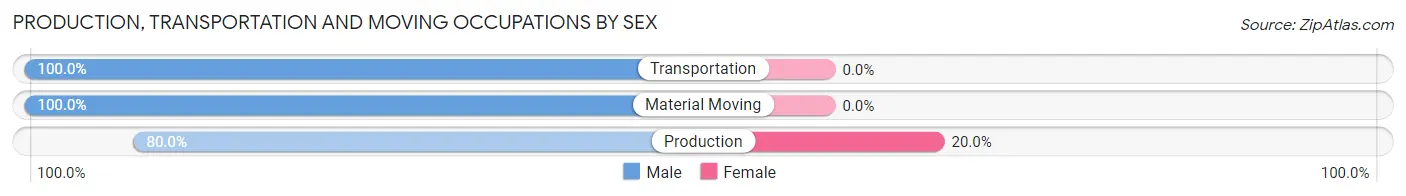
| Occupation | Male | Female |
| Production | 8 (80.0%) | 2 (20.0%) |
| Transportation | 3 (100.0%) | 0 (0.0%) |
| Material Moving | 1 (100.0%) | 0 (0.0%) |
| Total (Category) | 12 (85.7%) | 2 (14.3%) |
| Total (Overall) | 12 (52.2%) | 11 (47.8%) |
Employment Industries by Sex in Boon
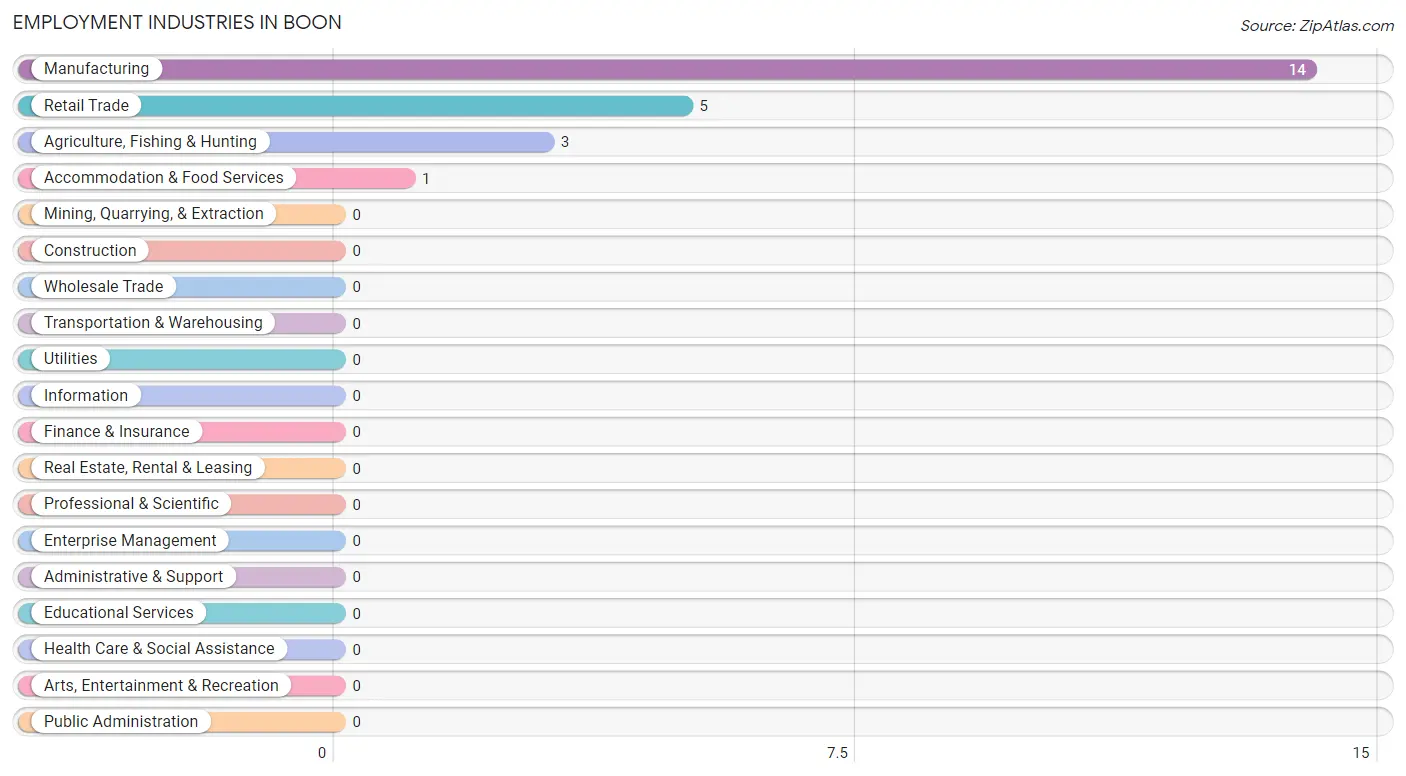
Employment Industries in Boon
The major employment industries in Boon include Manufacturing (14 | 60.9%), Retail Trade (5 | 21.7%), Agriculture, Fishing & Hunting (3 | 13.0%), and Accommodation & Food Services (1 | 4.3%).
Employment Industries by Sex in Boon
The Boon industries that see more men than women are Agriculture, Fishing & Hunting (100.0%), Retail Trade (60.0%), and Manufacturing (42.9%), whereas the industries that tend to have a higher number of women are Accommodation & Food Services (100.0%), Manufacturing (57.1%), and Retail Trade (40.0%).
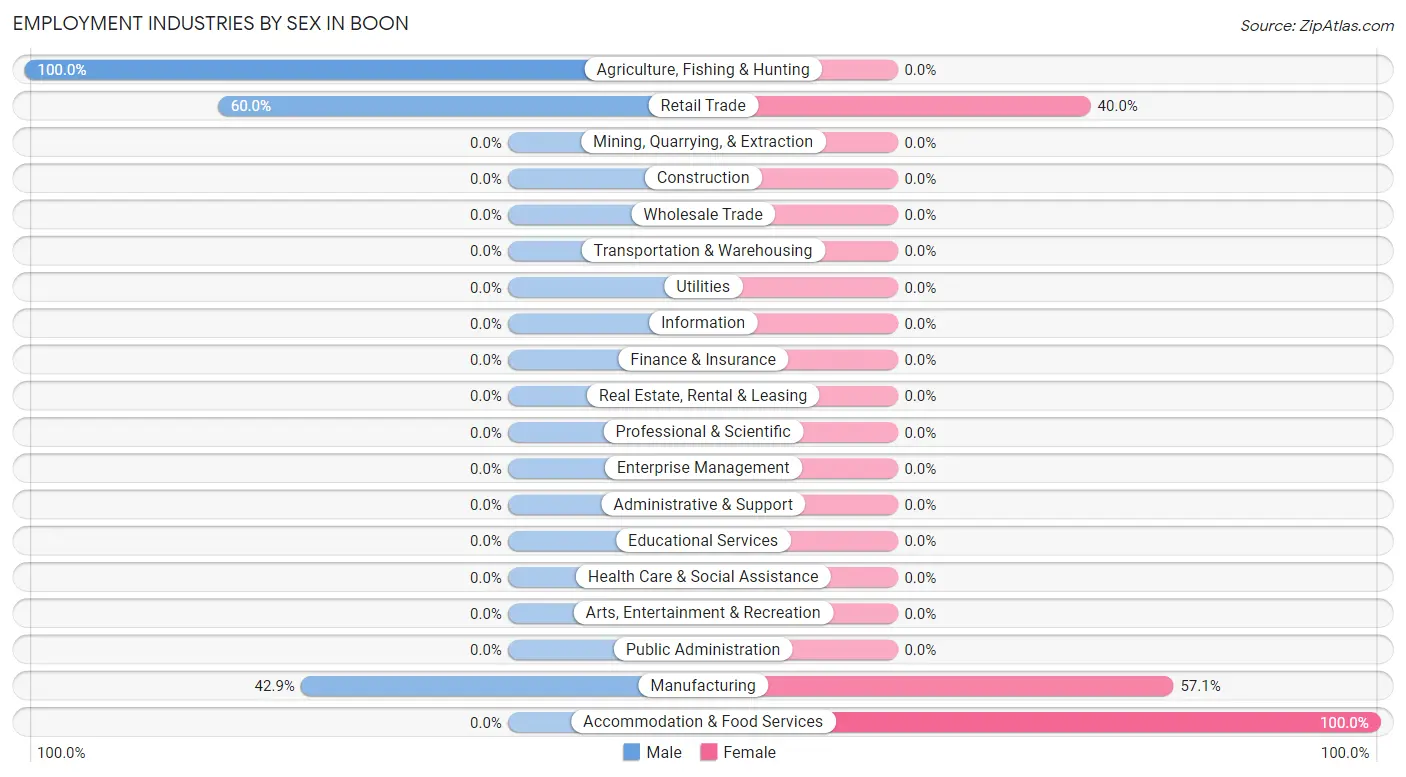
| Industry | Male | Female |
| Agriculture, Fishing & Hunting | 3 (100.0%) | 0 (0.0%) |
| Mining, Quarrying, & Extraction | 0 (0.0%) | 0 (0.0%) |
| Construction | 0 (0.0%) | 0 (0.0%) |
| Manufacturing | 6 (42.9%) | 8 (57.1%) |
| Wholesale Trade | 0 (0.0%) | 0 (0.0%) |
| Retail Trade | 3 (60.0%) | 2 (40.0%) |
| Transportation & Warehousing | 0 (0.0%) | 0 (0.0%) |
| Utilities | 0 (0.0%) | 0 (0.0%) |
| Information | 0 (0.0%) | 0 (0.0%) |
| Finance & Insurance | 0 (0.0%) | 0 (0.0%) |
| Real Estate, Rental & Leasing | 0 (0.0%) | 0 (0.0%) |
| Professional & Scientific | 0 (0.0%) | 0 (0.0%) |
| Enterprise Management | 0 (0.0%) | 0 (0.0%) |
| Administrative & Support | 0 (0.0%) | 0 (0.0%) |
| Educational Services | 0 (0.0%) | 0 (0.0%) |
| Health Care & Social Assistance | 0 (0.0%) | 0 (0.0%) |
| Arts, Entertainment & Recreation | 0 (0.0%) | 0 (0.0%) |
| Accommodation & Food Services | 0 (0.0%) | 1 (100.0%) |
| Public Administration | 0 (0.0%) | 0 (0.0%) |
| Total | 12 (52.2%) | 11 (47.8%) |
Education in Boon
School Enrollment in Boon
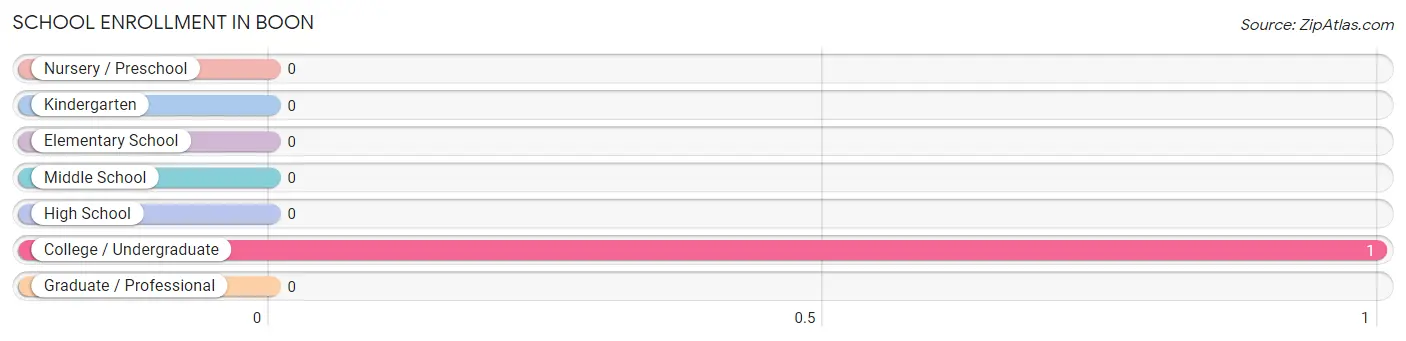
| School Level | # Students | % Students |
| Nursery / Preschool | 0 | 0.0% |
| Kindergarten | 0 | 0.0% |
| Elementary School | 0 | 0.0% |
| Middle School | 0 | 0.0% |
| High School | 0 | 0.0% |
| College / Undergraduate | 1 | 100.0% |
| Graduate / Professional | 0 | 0.0% |
| Total | 1 | 100.0% |
School Enrollment by Age by Funding Source in Boon
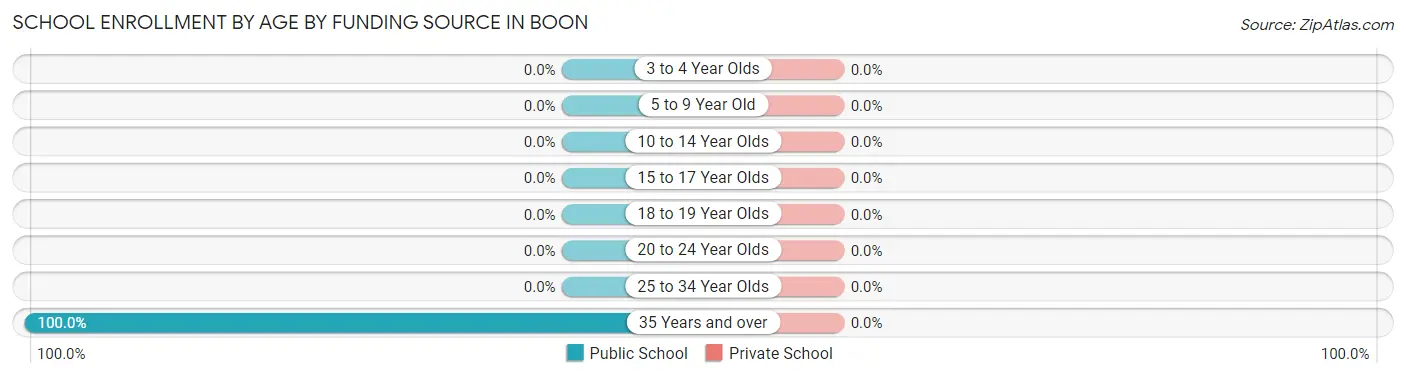
| Age Bracket | Public School | Private School |
| 3 to 4 Year Olds | 0 (0.0%) | 0 (0.0%) |
| 5 to 9 Year Old | 0 (0.0%) | 0 (0.0%) |
| 10 to 14 Year Olds | 0 (0.0%) | 0 (0.0%) |
| 15 to 17 Year Olds | 0 (0.0%) | 0 (0.0%) |
| 18 to 19 Year Olds | 0 (0.0%) | 0 (0.0%) |
| 20 to 24 Year Olds | 0 (0.0%) | 0 (0.0%) |
| 25 to 34 Year Olds | 0 (0.0%) | 0 (0.0%) |
| 35 Years and over | 1 (100.0%) | 0 (0.0%) |
| Total | 1 (100.0%) | 0 (0.0%) |
Educational Attainment by Field of Study in Boon
Science & technology (7 | 46.7%), engineering (6 | 40.0%), and education (2 | 13.3%) are the most common fields of study among 15 individuals in Boon who have obtained a bachelor's degree or higher.
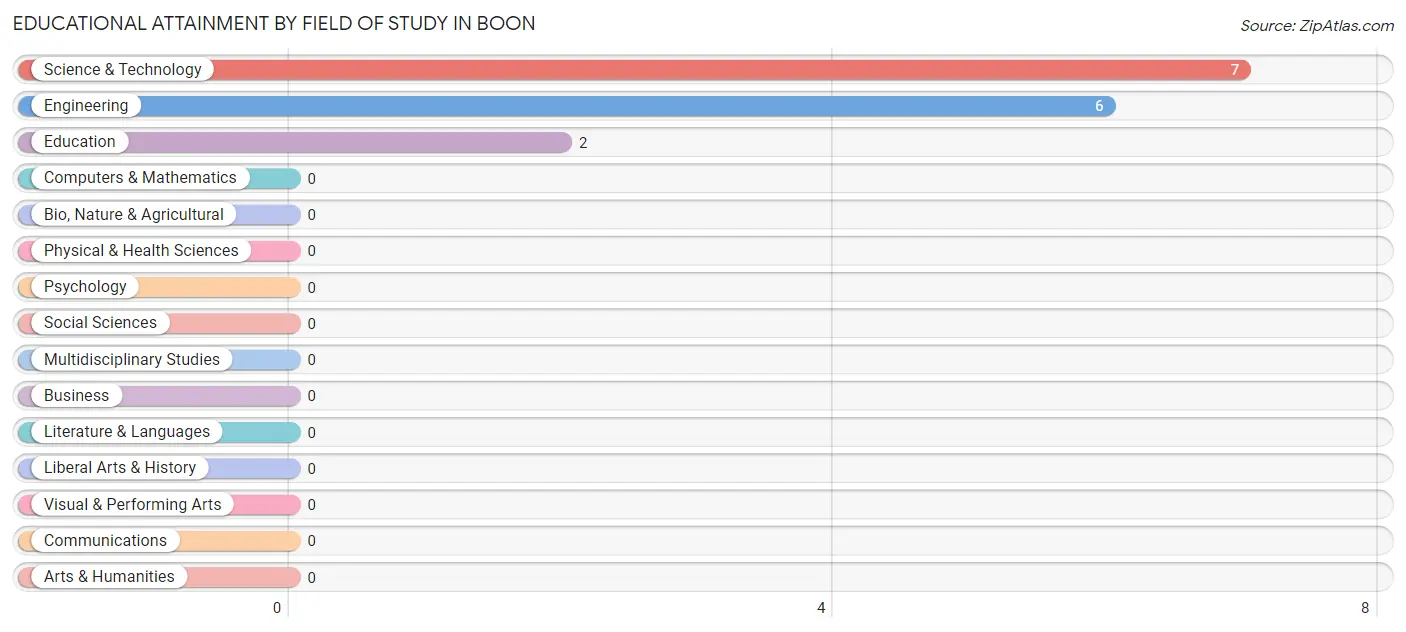
| Field of Study | # Graduates | % Graduates |
| Computers & Mathematics | 0 | 0.0% |
| Bio, Nature & Agricultural | 0 | 0.0% |
| Physical & Health Sciences | 0 | 0.0% |
| Psychology | 0 | 0.0% |
| Social Sciences | 0 | 0.0% |
| Engineering | 6 | 40.0% |
| Multidisciplinary Studies | 0 | 0.0% |
| Science & Technology | 7 | 46.7% |
| Business | 0 | 0.0% |
| Education | 2 | 13.3% |
| Literature & Languages | 0 | 0.0% |
| Liberal Arts & History | 0 | 0.0% |
| Visual & Performing Arts | 0 | 0.0% |
| Communications | 0 | 0.0% |
| Arts & Humanities | 0 | 0.0% |
| Total | 15 | 100.0% |
Transportation & Commute in Boon
Vehicle Availability by Sex in Boon
The most prevalent vehicle ownership categories in Boon are males with 2 vehicles (6, accounting for 50.0%) and females with 2 vehicles (2, making up 54.5%).
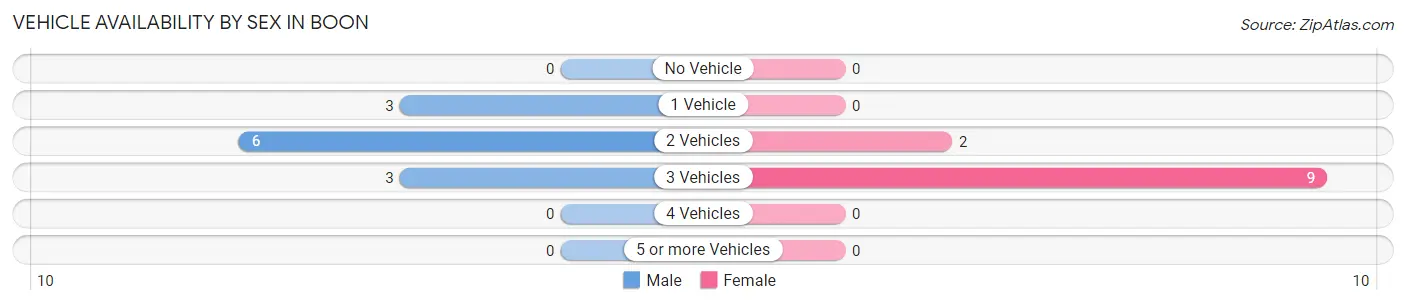
| Vehicles Available | Male | Female |
| No Vehicle | 0 (0.0%) | 0 (0.0%) |
| 1 Vehicle | 3 (25.0%) | 0 (0.0%) |
| 2 Vehicles | 6 (50.0%) | 2 (18.2%) |
| 3 Vehicles | 3 (25.0%) | 9 (81.8%) |
| 4 Vehicles | 0 (0.0%) | 0 (0.0%) |
| 5 or more Vehicles | 0 (0.0%) | 0 (0.0%) |
| Total | 12 (100.0%) | 11 (100.0%) |
Commute Time in Boon
The most frequently occuring commute durations in Boon are 35 to 39 minutes (6 commuters, 26.1%), 10 to 14 minutes (5 commuters, 21.7%), and 5 to 9 minutes (3 commuters, 13.0%).
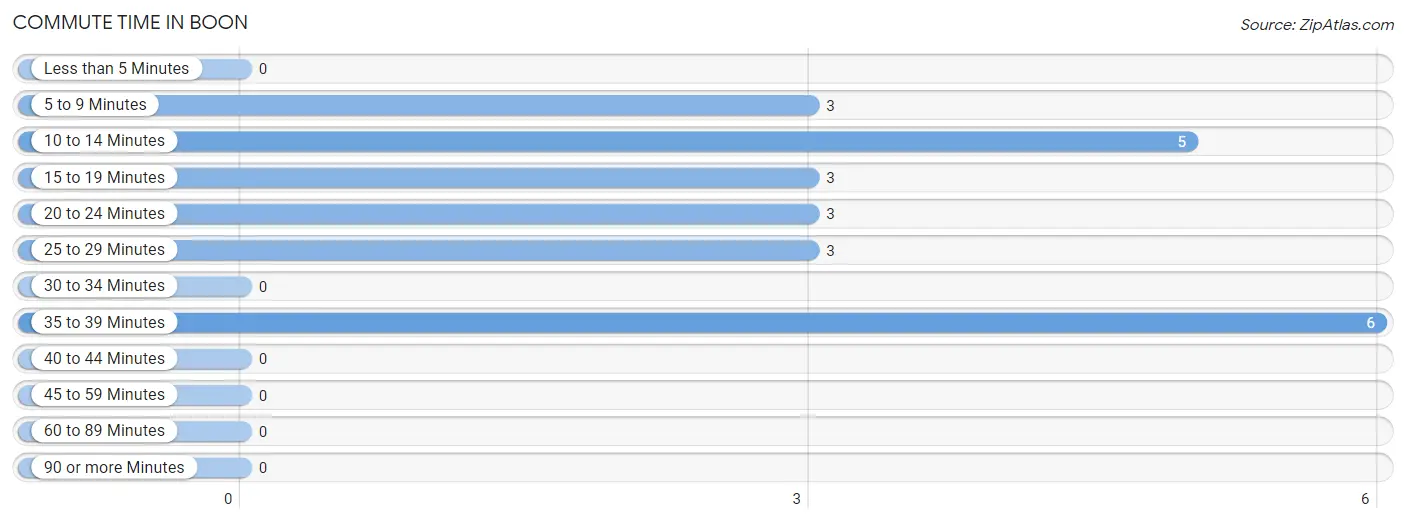
| Commute Time | # Commuters | % Commuters |
| Less than 5 Minutes | 0 | 0.0% |
| 5 to 9 Minutes | 3 | 13.0% |
| 10 to 14 Minutes | 5 | 21.7% |
| 15 to 19 Minutes | 3 | 13.0% |
| 20 to 24 Minutes | 3 | 13.0% |
| 25 to 29 Minutes | 3 | 13.0% |
| 30 to 34 Minutes | 0 | 0.0% |
| 35 to 39 Minutes | 6 | 26.1% |
| 40 to 44 Minutes | 0 | 0.0% |
| 45 to 59 Minutes | 0 | 0.0% |
| 60 to 89 Minutes | 0 | 0.0% |
| 90 or more Minutes | 0 | 0.0% |
Commute Time by Sex in Boon
The most common commute times in Boon are 5 to 9 minutes (3 commuters, 25.0%) for males and 35 to 39 minutes (6 commuters, 54.5%) for females.
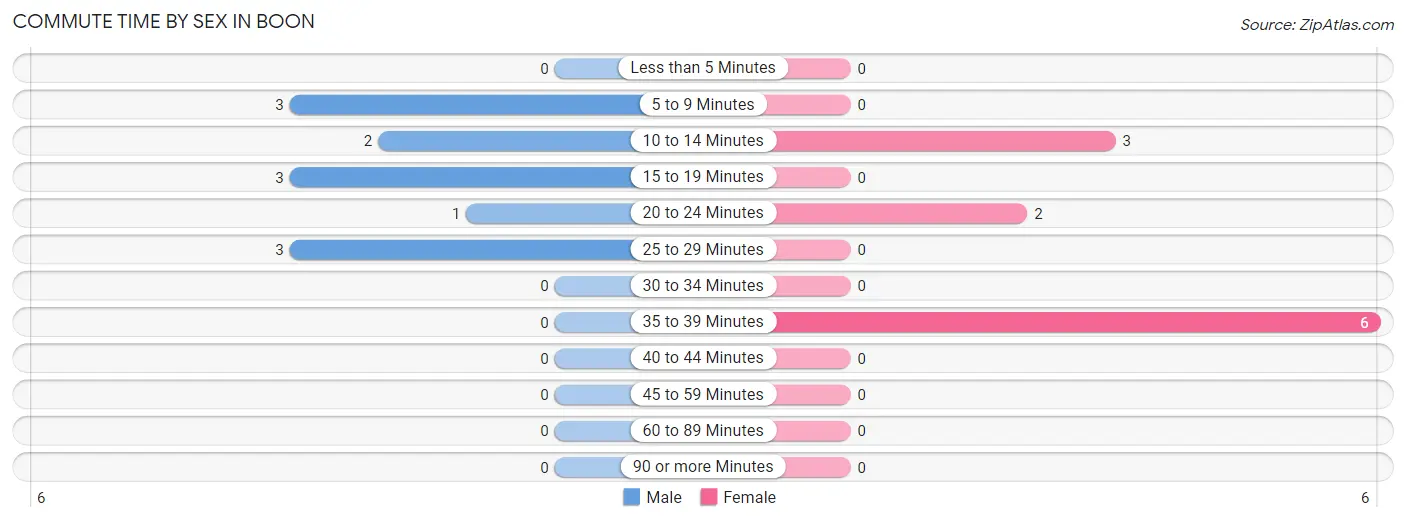
| Commute Time | Male | Female |
| Less than 5 Minutes | 0 (0.0%) | 0 (0.0%) |
| 5 to 9 Minutes | 3 (25.0%) | 0 (0.0%) |
| 10 to 14 Minutes | 2 (16.7%) | 3 (27.3%) |
| 15 to 19 Minutes | 3 (25.0%) | 0 (0.0%) |
| 20 to 24 Minutes | 1 (8.3%) | 2 (18.2%) |
| 25 to 29 Minutes | 3 (25.0%) | 0 (0.0%) |
| 30 to 34 Minutes | 0 (0.0%) | 0 (0.0%) |
| 35 to 39 Minutes | 0 (0.0%) | 6 (54.5%) |
| 40 to 44 Minutes | 0 (0.0%) | 0 (0.0%) |
| 45 to 59 Minutes | 0 (0.0%) | 0 (0.0%) |
| 60 to 89 Minutes | 0 (0.0%) | 0 (0.0%) |
| 90 or more Minutes | 0 (0.0%) | 0 (0.0%) |
Time of Departure to Work by Sex in Boon
The most frequent times of departure to work in Boon are 6:00 AM to 6:29 AM (3, 25.0%) for males and 6:00 AM to 6:29 AM (6, 54.5%) for females.
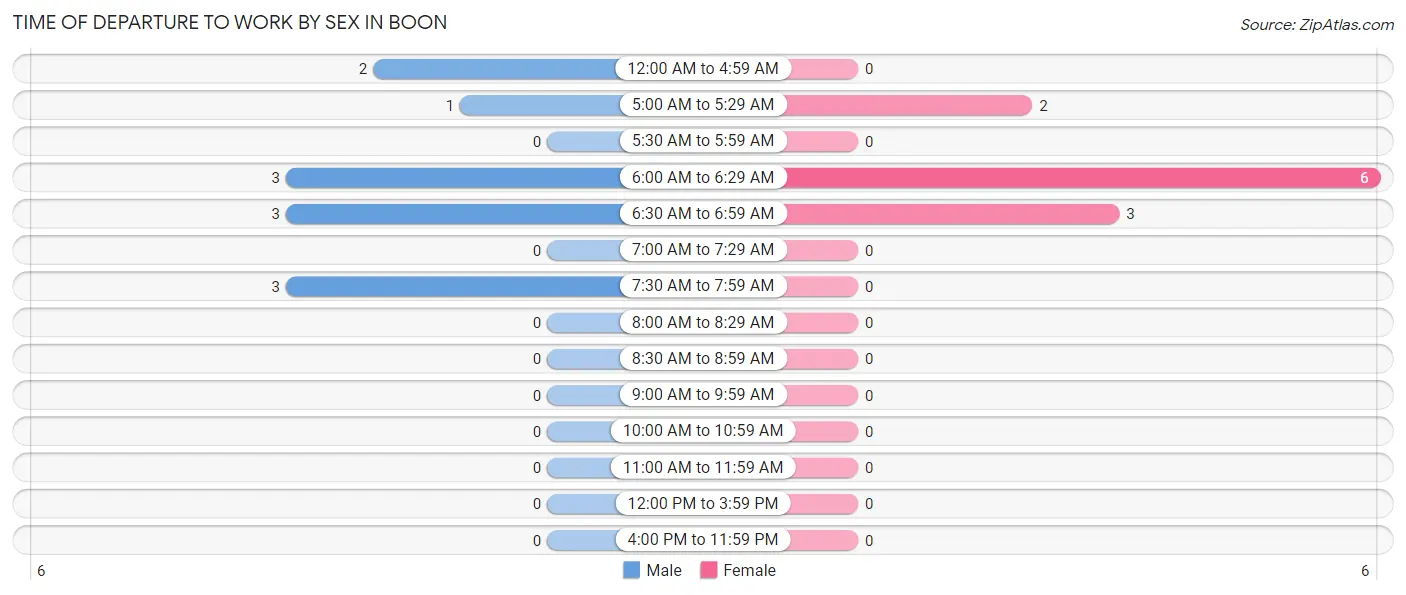
| Time of Departure | Male | Female |
| 12:00 AM to 4:59 AM | 2 (16.7%) | 0 (0.0%) |
| 5:00 AM to 5:29 AM | 1 (8.3%) | 2 (18.2%) |
| 5:30 AM to 5:59 AM | 0 (0.0%) | 0 (0.0%) |
| 6:00 AM to 6:29 AM | 3 (25.0%) | 6 (54.5%) |
| 6:30 AM to 6:59 AM | 3 (25.0%) | 3 (27.3%) |
| 7:00 AM to 7:29 AM | 0 (0.0%) | 0 (0.0%) |
| 7:30 AM to 7:59 AM | 3 (25.0%) | 0 (0.0%) |
| 8:00 AM to 8:29 AM | 0 (0.0%) | 0 (0.0%) |
| 8:30 AM to 8:59 AM | 0 (0.0%) | 0 (0.0%) |
| 9:00 AM to 9:59 AM | 0 (0.0%) | 0 (0.0%) |
| 10:00 AM to 10:59 AM | 0 (0.0%) | 0 (0.0%) |
| 11:00 AM to 11:59 AM | 0 (0.0%) | 0 (0.0%) |
| 12:00 PM to 3:59 PM | 0 (0.0%) | 0 (0.0%) |
| 4:00 PM to 11:59 PM | 0 (0.0%) | 0 (0.0%) |
| Total | 12 (100.0%) | 11 (100.0%) |
Housing Occupancy in Boon
Occupancy by Ownership in Boon
Of the total 30 dwellings in Boon, owner-occupied units account for 23 (76.7%), while renter-occupied units make up 7 (23.3%).
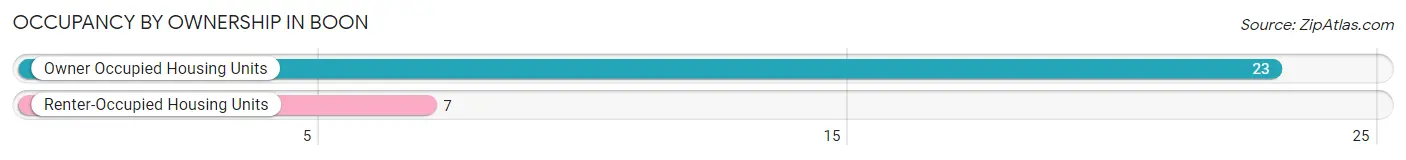
| Occupancy | # Housing Units | % Housing Units |
| Owner Occupied Housing Units | 23 | 76.7% |
| Renter-Occupied Housing Units | 7 | 23.3% |
| Total Occupied Housing Units | 30 | 100.0% |
Occupancy by Household Size in Boon
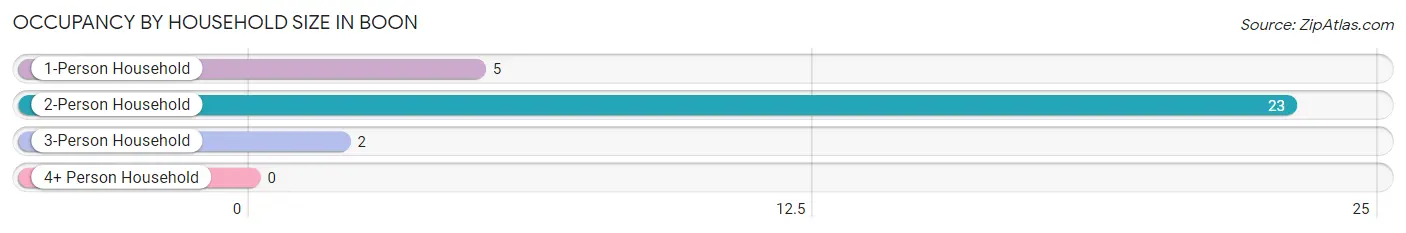
| Household Size | # Housing Units | % Housing Units |
| 1-Person Household | 5 | 16.7% |
| 2-Person Household | 23 | 76.7% |
| 3-Person Household | 2 | 6.7% |
| 4+ Person Household | 0 | 0.0% |
| Total Housing Units | 30 | 100.0% |
Occupancy by Ownership by Household Size in Boon
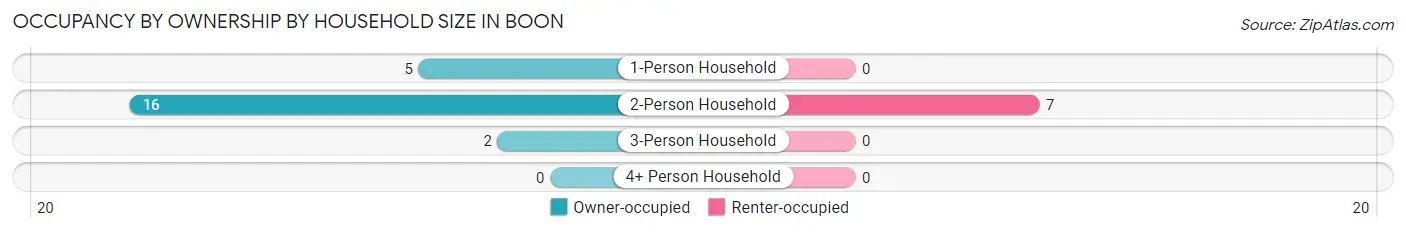
| Household Size | Owner-occupied | Renter-occupied |
| 1-Person Household | 5 (100.0%) | 0 (0.0%) |
| 2-Person Household | 16 (69.6%) | 7 (30.4%) |
| 3-Person Household | 2 (100.0%) | 0 (0.0%) |
| 4+ Person Household | 0 (0.0%) | 0 (0.0%) |
| Total Housing Units | 23 (76.7%) | 7 (23.3%) |
Occupancy by Educational Attainment in Boon
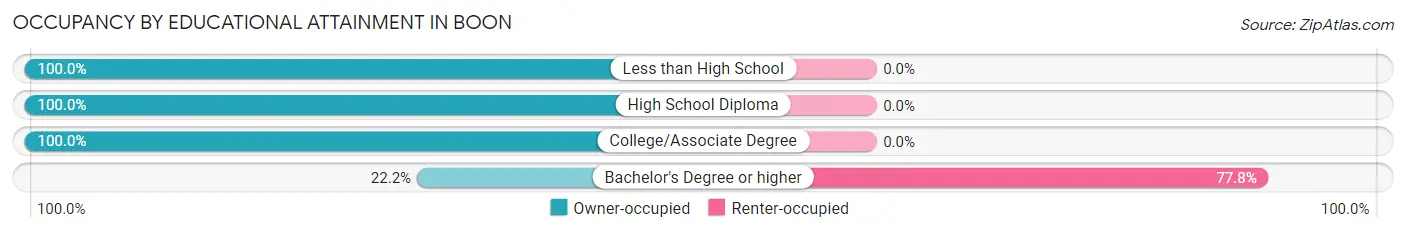
| Household Size | Owner-occupied | Renter-occupied |
| Less than High School | 3 (100.0%) | 0 (0.0%) |
| High School Diploma | 9 (100.0%) | 0 (0.0%) |
| College/Associate Degree | 9 (100.0%) | 0 (0.0%) |
| Bachelor's Degree or higher | 2 (22.2%) | 7 (77.8%) |
Occupancy by Age of Householder in Boon
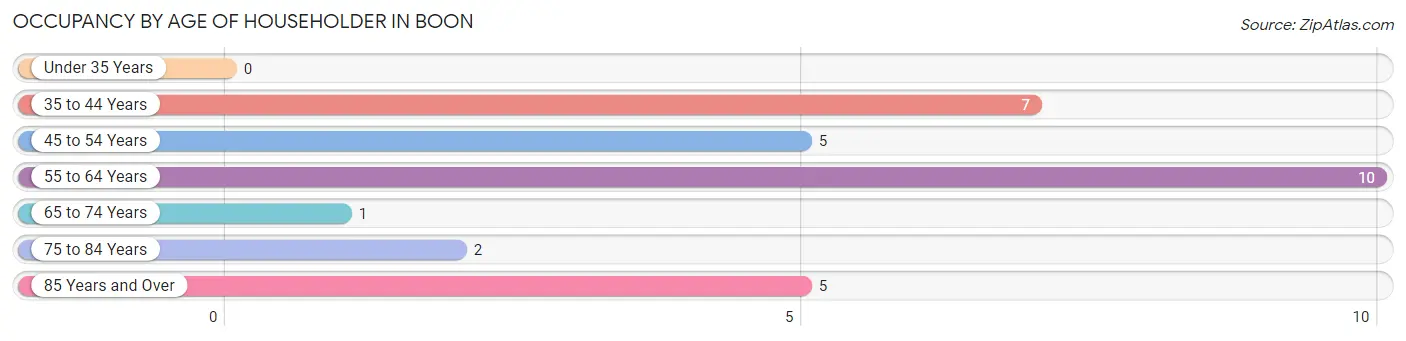
| Age Bracket | # Households | % Households |
| Under 35 Years | 0 | 0.0% |
| 35 to 44 Years | 7 | 23.3% |
| 45 to 54 Years | 5 | 16.7% |
| 55 to 64 Years | 10 | 33.3% |
| 65 to 74 Years | 1 | 3.3% |
| 75 to 84 Years | 2 | 6.7% |
| 85 Years and Over | 5 | 16.7% |
| Total | 30 | 100.0% |
Housing Finances in Boon
Median Income by Occupancy in Boon
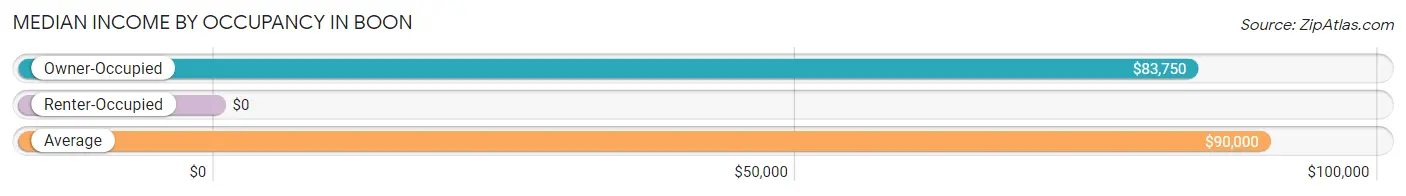
| Occupancy Type | # Households | Median Income |
| Owner-Occupied | 23 (76.7%) | $83,750 |
| Renter-Occupied | 7 (23.3%) | $0 |
| Average | 30 (100.0%) | $90,000 |
Occupancy by Householder Income Bracket in Boon
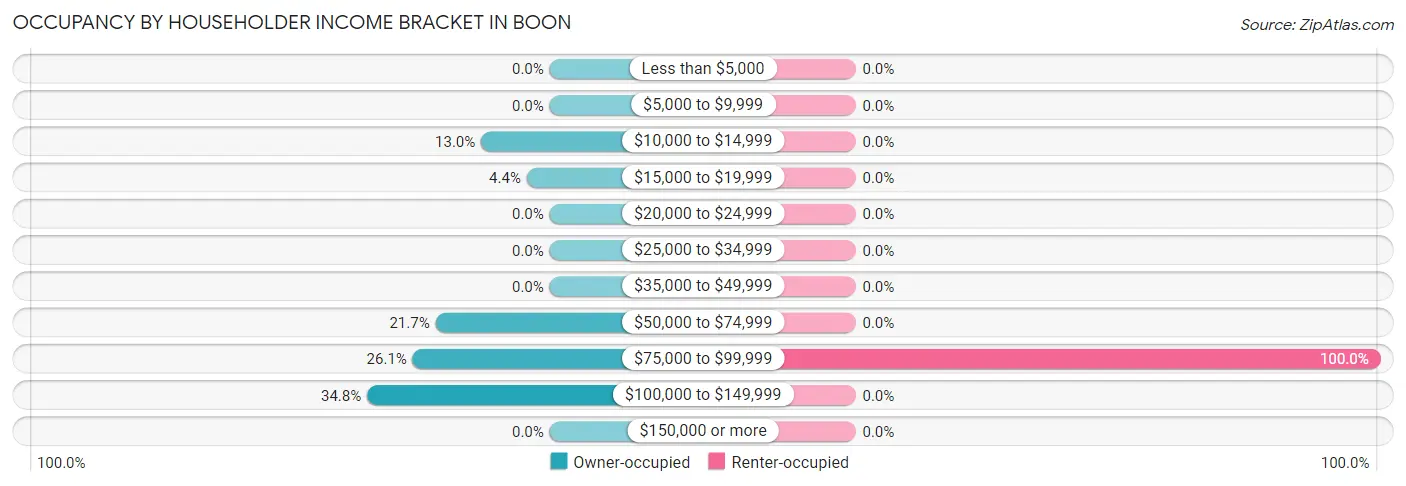
| Income Bracket | Owner-occupied | Renter-occupied |
| Less than $5,000 | 0 (0.0%) | 0 (0.0%) |
| $5,000 to $9,999 | 0 (0.0%) | 0 (0.0%) |
| $10,000 to $14,999 | 3 (13.0%) | 0 (0.0%) |
| $15,000 to $19,999 | 1 (4.3%) | 0 (0.0%) |
| $20,000 to $24,999 | 0 (0.0%) | 0 (0.0%) |
| $25,000 to $34,999 | 0 (0.0%) | 0 (0.0%) |
| $35,000 to $49,999 | 0 (0.0%) | 0 (0.0%) |
| $50,000 to $74,999 | 5 (21.7%) | 0 (0.0%) |
| $75,000 to $99,999 | 6 (26.1%) | 7 (100.0%) |
| $100,000 to $149,999 | 8 (34.8%) | 0 (0.0%) |
| $150,000 or more | 0 (0.0%) | 0 (0.0%) |
| Total | 23 (100.0%) | 7 (100.0%) |
Monthly Housing Cost Tiers in Boon
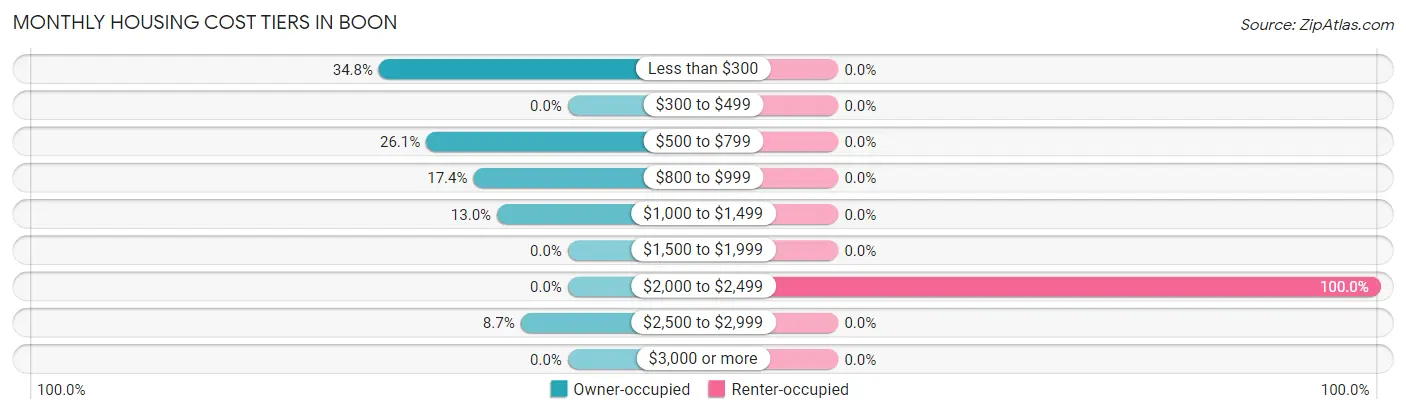
| Monthly Cost | Owner-occupied | Renter-occupied |
| Less than $300 | 8 (34.8%) | 0 (0.0%) |
| $300 to $499 | 0 (0.0%) | 0 (0.0%) |
| $500 to $799 | 6 (26.1%) | 0 (0.0%) |
| $800 to $999 | 4 (17.4%) | 0 (0.0%) |
| $1,000 to $1,499 | 3 (13.0%) | 0 (0.0%) |
| $1,500 to $1,999 | 0 (0.0%) | 0 (0.0%) |
| $2,000 to $2,499 | 0 (0.0%) | 7 (100.0%) |
| $2,500 to $2,999 | 2 (8.7%) | 0 (0.0%) |
| $3,000 or more | 0 (0.0%) | 0 (0.0%) |
| Total | 23 (100.0%) | 7 (100.0%) |
Physical Housing Characteristics in Boon
Housing Structures in Boon
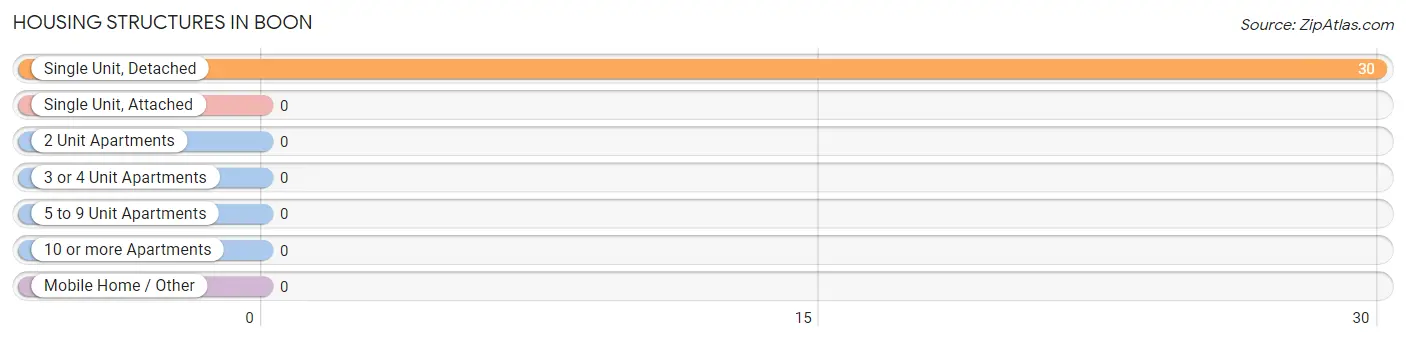
| Structure Type | # Housing Units | % Housing Units |
| Single Unit, Detached | 30 | 100.0% |
| Single Unit, Attached | 0 | 0.0% |
| 2 Unit Apartments | 0 | 0.0% |
| 3 or 4 Unit Apartments | 0 | 0.0% |
| 5 to 9 Unit Apartments | 0 | 0.0% |
| 10 or more Apartments | 0 | 0.0% |
| Mobile Home / Other | 0 | 0.0% |
| Total | 30 | 100.0% |
Housing Structures by Occupancy in Boon
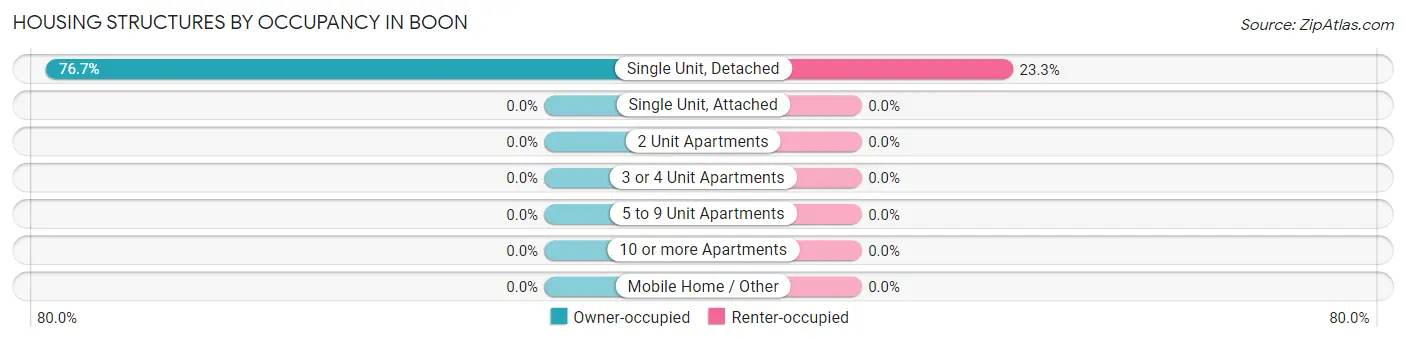
| Structure Type | Owner-occupied | Renter-occupied |
| Single Unit, Detached | 23 (76.7%) | 7 (23.3%) |
| Single Unit, Attached | 0 (0.0%) | 0 (0.0%) |
| 2 Unit Apartments | 0 (0.0%) | 0 (0.0%) |
| 3 or 4 Unit Apartments | 0 (0.0%) | 0 (0.0%) |
| 5 to 9 Unit Apartments | 0 (0.0%) | 0 (0.0%) |
| 10 or more Apartments | 0 (0.0%) | 0 (0.0%) |
| Mobile Home / Other | 0 (0.0%) | 0 (0.0%) |
| Total | 23 (76.7%) | 7 (23.3%) |
Housing Structures by Number of Rooms in Boon
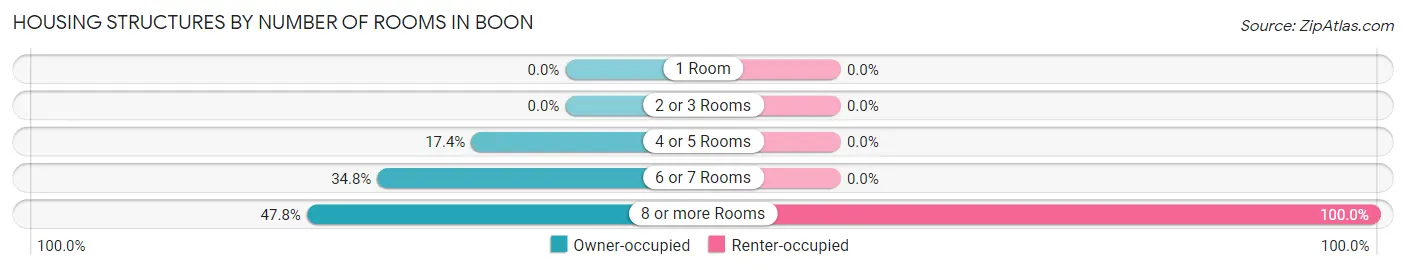
| Number of Rooms | Owner-occupied | Renter-occupied |
| 1 Room | 0 (0.0%) | 0 (0.0%) |
| 2 or 3 Rooms | 0 (0.0%) | 0 (0.0%) |
| 4 or 5 Rooms | 4 (17.4%) | 0 (0.0%) |
| 6 or 7 Rooms | 8 (34.8%) | 0 (0.0%) |
| 8 or more Rooms | 11 (47.8%) | 7 (100.0%) |
| Total | 23 (100.0%) | 7 (100.0%) |
Housing Structure by Heating Type in Boon
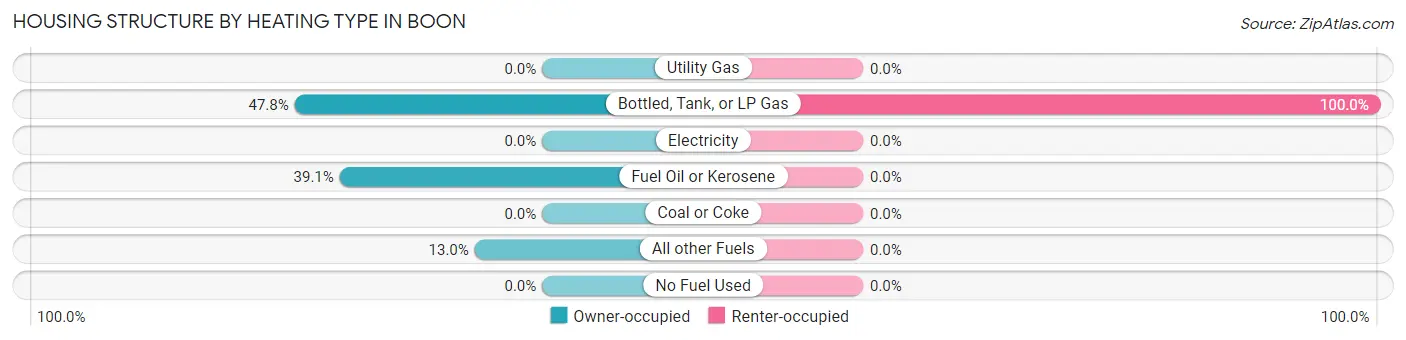
| Heating Type | Owner-occupied | Renter-occupied |
| Utility Gas | 0 (0.0%) | 0 (0.0%) |
| Bottled, Tank, or LP Gas | 11 (47.8%) | 7 (100.0%) |
| Electricity | 0 (0.0%) | 0 (0.0%) |
| Fuel Oil or Kerosene | 9 (39.1%) | 0 (0.0%) |
| Coal or Coke | 0 (0.0%) | 0 (0.0%) |
| All other Fuels | 3 (13.0%) | 0 (0.0%) |
| No Fuel Used | 0 (0.0%) | 0 (0.0%) |
| Total | 23 (100.0%) | 7 (100.0%) |
Household Vehicle Usage in Boon
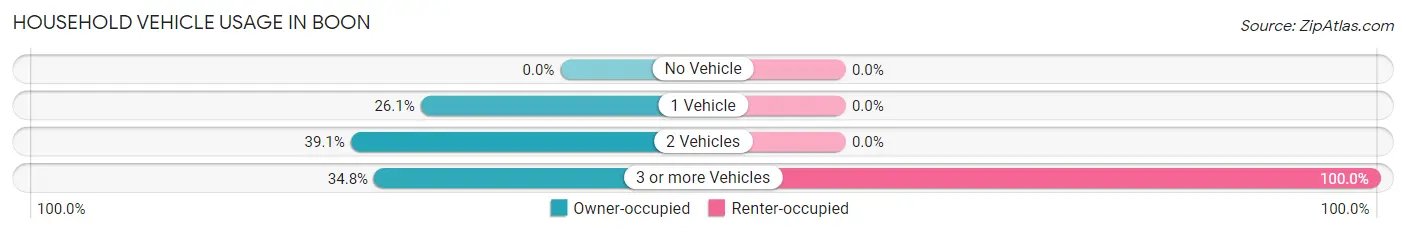
| Vehicles per Household | Owner-occupied | Renter-occupied |
| No Vehicle | 0 (0.0%) | 0 (0.0%) |
| 1 Vehicle | 6 (26.1%) | 0 (0.0%) |
| 2 Vehicles | 9 (39.1%) | 0 (0.0%) |
| 3 or more Vehicles | 8 (34.8%) | 7 (100.0%) |
| Total | 23 (100.0%) | 7 (100.0%) |
Real Estate & Mortgages in Boon
Real Estate and Mortgage Overview in Boon
| Characteristic | Without Mortgage | With Mortgage |
| Housing Units | 13 | 10 |
| Median Property Value | $102,500 | $156,300 |
| Median Household Income | $83,750 | $0 |
| Monthly Housing Costs | $241 | $0 |
| Real Estate Taxes | $888 | $0 |
Property Value by Mortgage Status in Boon
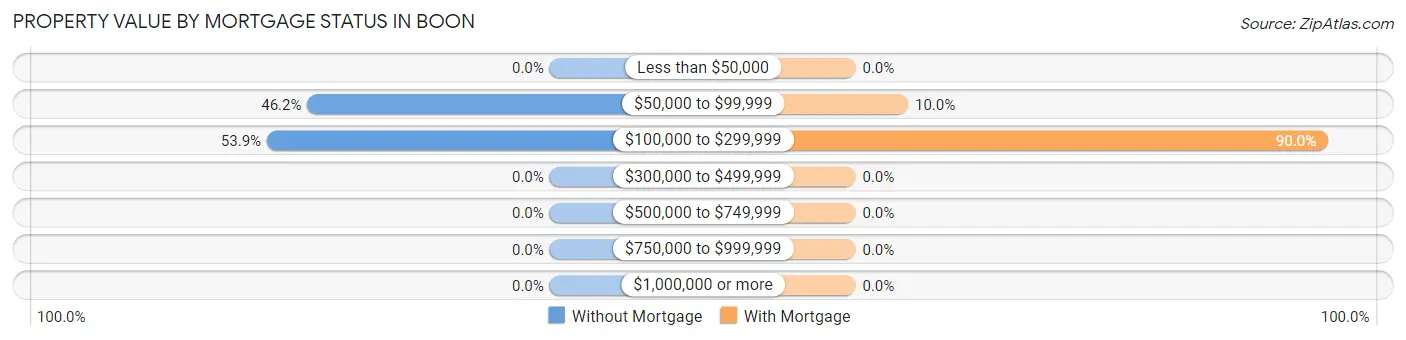
| Property Value | Without Mortgage | With Mortgage |
| Less than $50,000 | 0 (0.0%) | 0 (0.0%) |
| $50,000 to $99,999 | 6 (46.2%) | 1 (10.0%) |
| $100,000 to $299,999 | 7 (53.8%) | 9 (90.0%) |
| $300,000 to $499,999 | 0 (0.0%) | 0 (0.0%) |
| $500,000 to $749,999 | 0 (0.0%) | 0 (0.0%) |
| $750,000 to $999,999 | 0 (0.0%) | 0 (0.0%) |
| $1,000,000 or more | 0 (0.0%) | 0 (0.0%) |
| Total | 13 (100.0%) | 10 (100.0%) |
Household Income by Mortgage Status in Boon
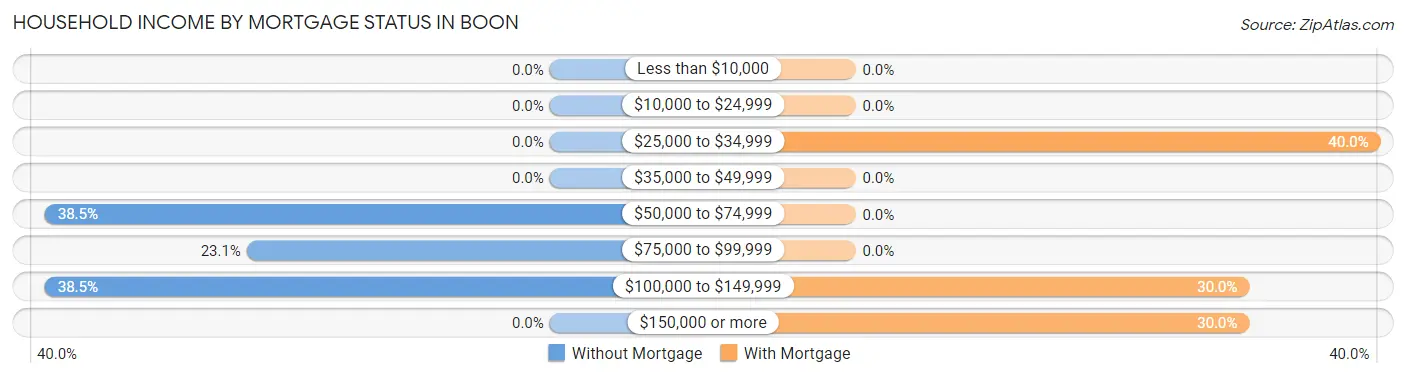
| Household Income | Without Mortgage | With Mortgage |
| Less than $10,000 | 0 (0.0%) | 0 (0.0%) |
| $10,000 to $24,999 | 0 (0.0%) | 0 (0.0%) |
| $25,000 to $34,999 | 0 (0.0%) | 4 (40.0%) |
| $35,000 to $49,999 | 0 (0.0%) | 0 (0.0%) |
| $50,000 to $74,999 | 5 (38.5%) | 0 (0.0%) |
| $75,000 to $99,999 | 3 (23.1%) | 0 (0.0%) |
| $100,000 to $149,999 | 5 (38.5%) | 3 (30.0%) |
| $150,000 or more | 0 (0.0%) | 3 (30.0%) |
| Total | 13 (100.0%) | 10 (100.0%) |
Property Value to Household Income Ratio in Boon
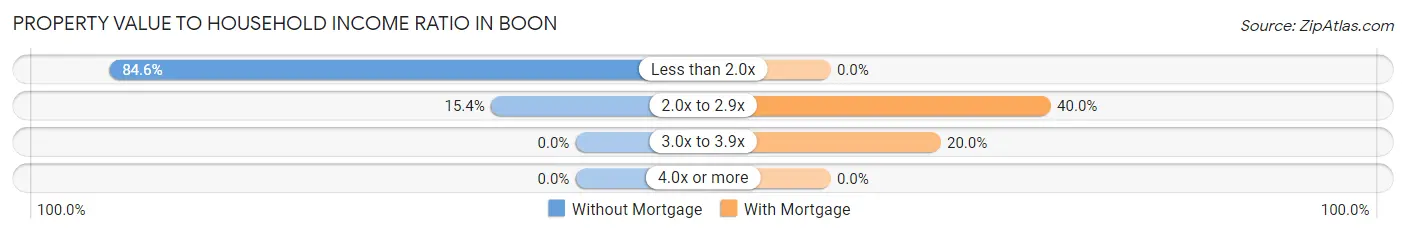
| Value-to-Income Ratio | Without Mortgage | With Mortgage |
| Less than 2.0x | 11 (84.6%) | 0 (0.0%) |
| 2.0x to 2.9x | 2 (15.4%) | 4 (40.0%) |
| 3.0x to 3.9x | 0 (0.0%) | 2 (20.0%) |
| 4.0x or more | 0 (0.0%) | 0 (0.0%) |
| Total | 13 (100.0%) | 10 (100.0%) |
Real Estate Taxes by Mortgage Status in Boon
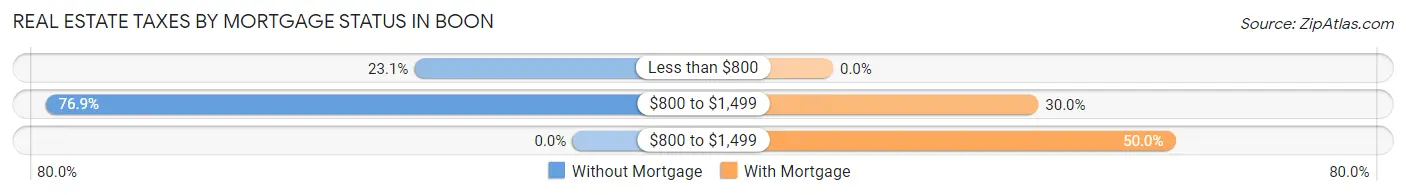
| Property Taxes | Without Mortgage | With Mortgage |
| Less than $800 | 3 (23.1%) | 0 (0.0%) |
| $800 to $1,499 | 10 (76.9%) | 3 (30.0%) |
| $800 to $1,499 | 0 (0.0%) | 5 (50.0%) |
| Total | 13 (100.0%) | 10 (100.0%) |
Health & Disability in Boon
Health Insurance Coverage by Age in Boon
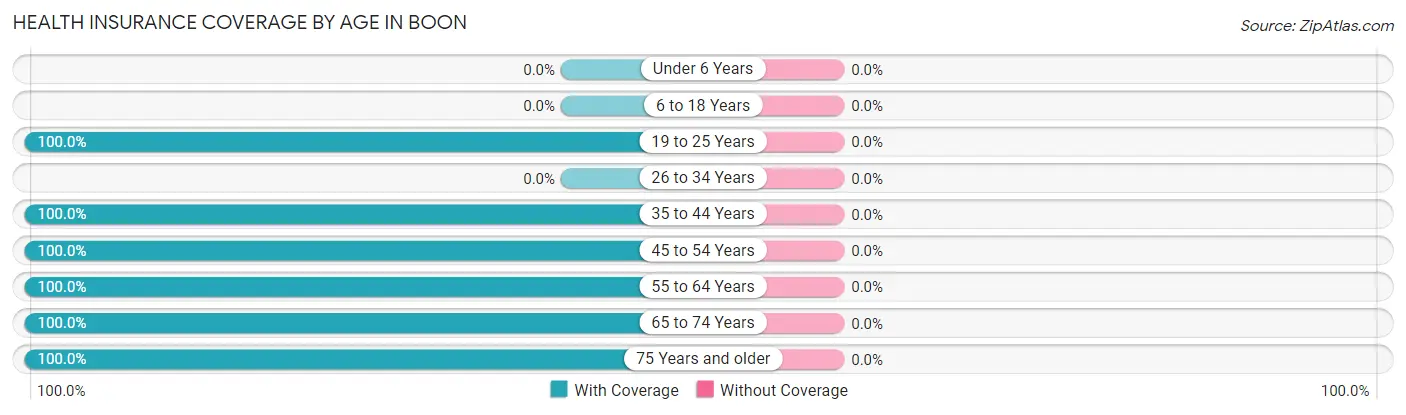
| Age Bracket | With Coverage | Without Coverage |
| Under 6 Years | 0 (0.0%) | 0 (0.0%) |
| 6 to 18 Years | 0 (0.0%) | 0 (0.0%) |
| 19 to 25 Years | 4 (100.0%) | 0 (0.0%) |
| 26 to 34 Years | 0 (0.0%) | 0 (0.0%) |
| 35 to 44 Years | 9 (100.0%) | 0 (0.0%) |
| 45 to 54 Years | 22 (100.0%) | 0 (0.0%) |
| 55 to 64 Years | 10 (100.0%) | 0 (0.0%) |
| 65 to 74 Years | 4 (100.0%) | 0 (0.0%) |
| 75 Years and older | 7 (100.0%) | 0 (0.0%) |
| Total | 56 (100.0%) | 0 (0.0%) |
Health Insurance Coverage by Citizenship Status in Boon
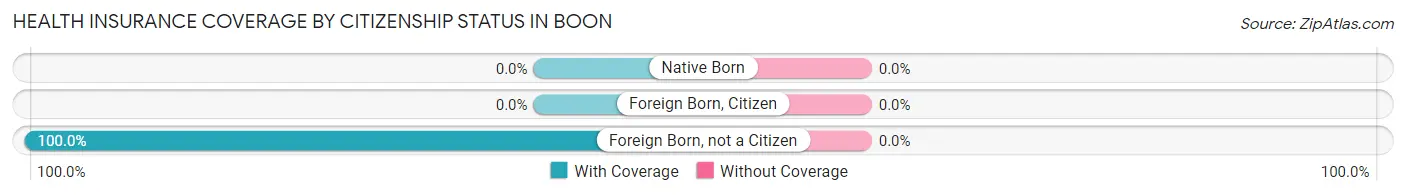
| Citizenship Status | With Coverage | Without Coverage |
| Native Born | 0 (0.0%) | 0 (0.0%) |
| Foreign Born, Citizen | 0 (0.0%) | 0 (0.0%) |
| Foreign Born, not a Citizen | 4 (100.0%) | 0 (0.0%) |
Health Insurance Coverage by Household Income in Boon
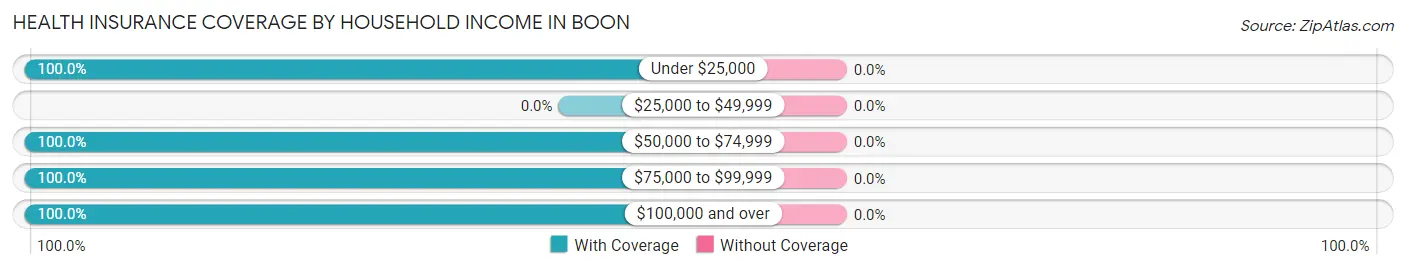
| Household Income | With Coverage | Without Coverage |
| Under $25,000 | 6 (100.0%) | 0 (0.0%) |
| $25,000 to $49,999 | 0 (0.0%) | 0 (0.0%) |
| $50,000 to $74,999 | 9 (100.0%) | 0 (0.0%) |
| $75,000 to $99,999 | 28 (100.0%) | 0 (0.0%) |
| $100,000 and over | 13 (100.0%) | 0 (0.0%) |
Public vs Private Health Insurance Coverage by Age in Boon
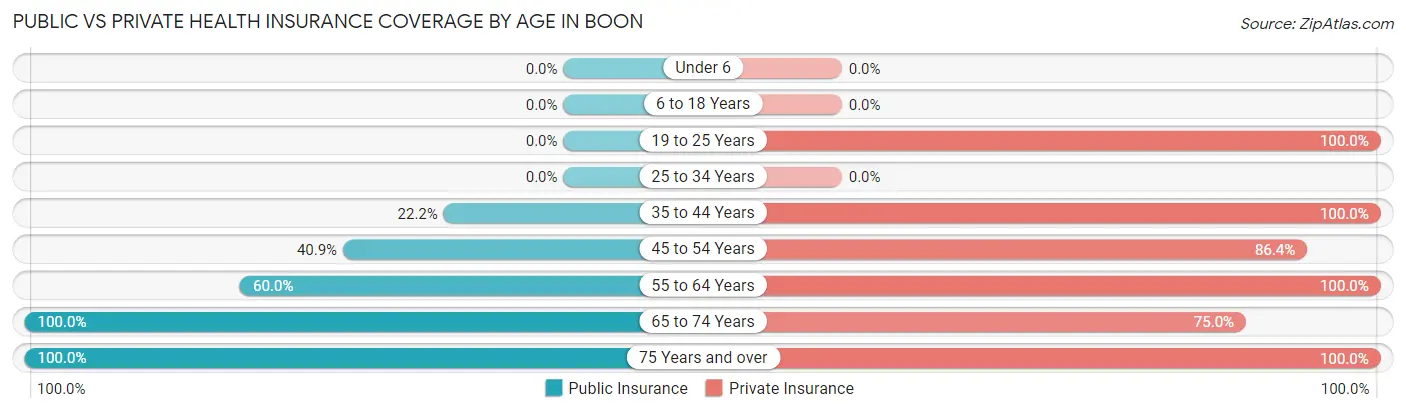
| Age Bracket | Public Insurance | Private Insurance |
| Under 6 | 0 (0.0%) | 0 (0.0%) |
| 6 to 18 Years | 0 (0.0%) | 0 (0.0%) |
| 19 to 25 Years | 0 (0.0%) | 4 (100.0%) |
| 25 to 34 Years | 0 (0.0%) | 0 (0.0%) |
| 35 to 44 Years | 2 (22.2%) | 9 (100.0%) |
| 45 to 54 Years | 9 (40.9%) | 19 (86.4%) |
| 55 to 64 Years | 6 (60.0%) | 10 (100.0%) |
| 65 to 74 Years | 4 (100.0%) | 3 (75.0%) |
| 75 Years and over | 7 (100.0%) | 7 (100.0%) |
| Total | 28 (50.0%) | 52 (92.9%) |
Disability Status by Sex by Age in Boon
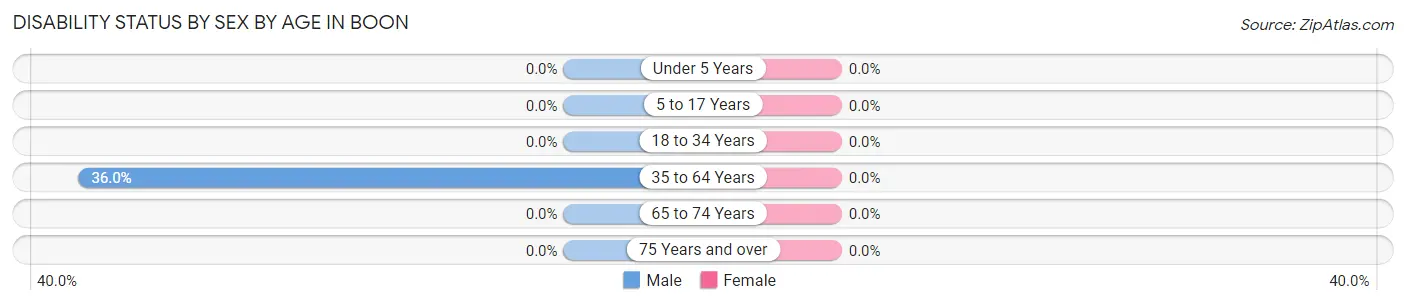
| Age Bracket | Male | Female |
| Under 5 Years | 0 (0.0%) | 0 (0.0%) |
| 5 to 17 Years | 0 (0.0%) | 0 (0.0%) |
| 18 to 34 Years | 0 (0.0%) | 0 (0.0%) |
| 35 to 64 Years | 9 (36.0%) | 0 (0.0%) |
| 65 to 74 Years | 0 (0.0%) | 0 (0.0%) |
| 75 Years and over | 0 (0.0%) | 0 (0.0%) |
Disability Class by Sex by Age in Boon
Disability Class: Hearing Difficulty
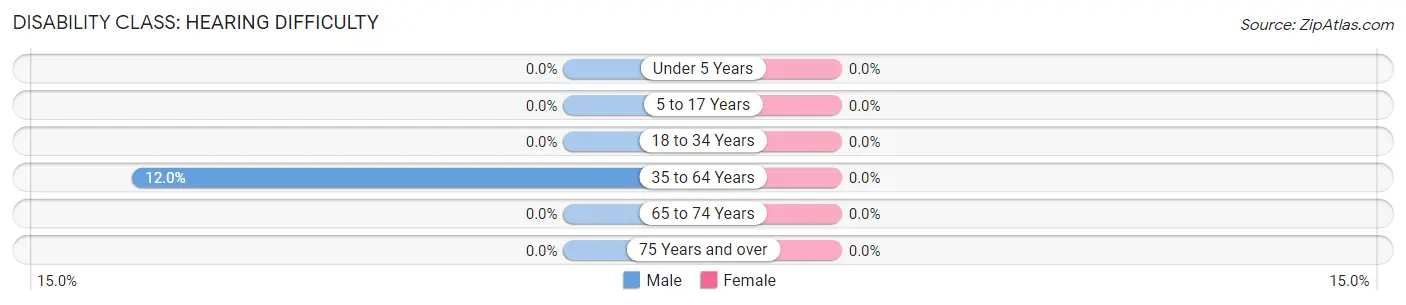
| Age Bracket | Male | Female |
| Under 5 Years | 0 (0.0%) | 0 (0.0%) |
| 5 to 17 Years | 0 (0.0%) | 0 (0.0%) |
| 18 to 34 Years | 0 (0.0%) | 0 (0.0%) |
| 35 to 64 Years | 3 (12.0%) | 0 (0.0%) |
| 65 to 74 Years | 0 (0.0%) | 0 (0.0%) |
| 75 Years and over | 0 (0.0%) | 0 (0.0%) |
Disability Class: Vision Difficulty
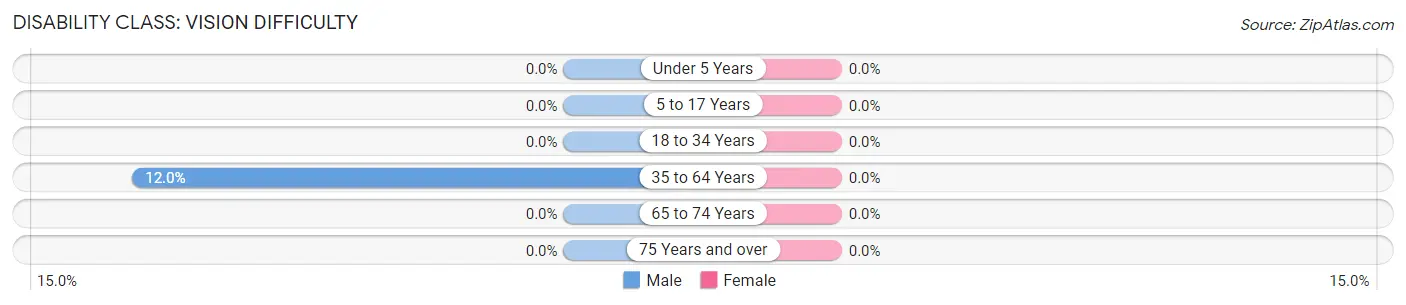
| Age Bracket | Male | Female |
| Under 5 Years | 0 (0.0%) | 0 (0.0%) |
| 5 to 17 Years | 0 (0.0%) | 0 (0.0%) |
| 18 to 34 Years | 0 (0.0%) | 0 (0.0%) |
| 35 to 64 Years | 3 (12.0%) | 0 (0.0%) |
| 65 to 74 Years | 0 (0.0%) | 0 (0.0%) |
| 75 Years and over | 0 (0.0%) | 0 (0.0%) |
Disability Class: Cognitive Difficulty
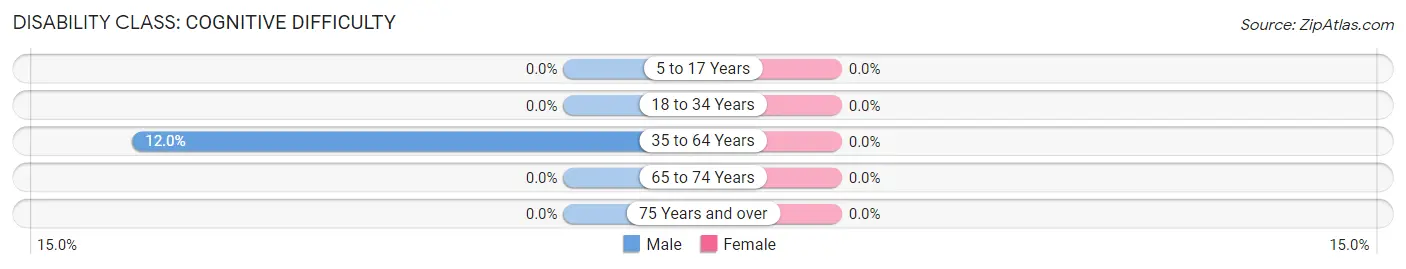
| Age Bracket | Male | Female |
| 5 to 17 Years | 0 (0.0%) | 0 (0.0%) |
| 18 to 34 Years | 0 (0.0%) | 0 (0.0%) |
| 35 to 64 Years | 3 (12.0%) | 0 (0.0%) |
| 65 to 74 Years | 0 (0.0%) | 0 (0.0%) |
| 75 Years and over | 0 (0.0%) | 0 (0.0%) |
Disability Class: Ambulatory Difficulty
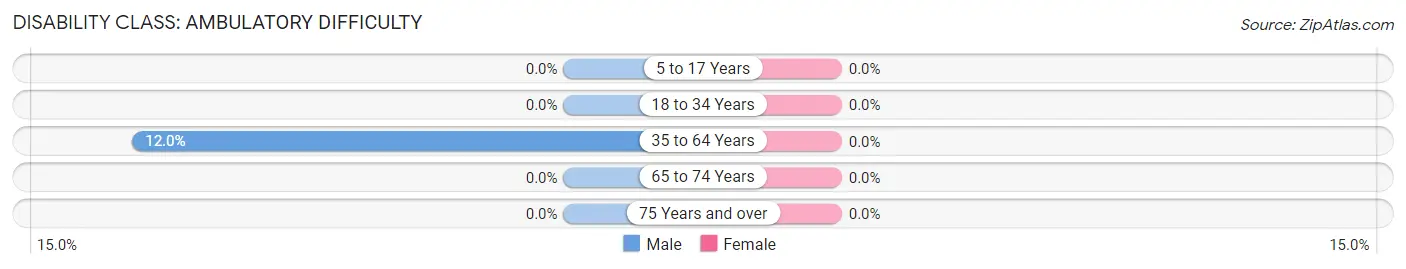
| Age Bracket | Male | Female |
| 5 to 17 Years | 0 (0.0%) | 0 (0.0%) |
| 18 to 34 Years | 0 (0.0%) | 0 (0.0%) |
| 35 to 64 Years | 3 (12.0%) | 0 (0.0%) |
| 65 to 74 Years | 0 (0.0%) | 0 (0.0%) |
| 75 Years and over | 0 (0.0%) | 0 (0.0%) |
Disability Class: Self-Care Difficulty
| Age Bracket | Male | Female |
| 5 to 17 Years | 0 (0.0%) | 0 (0.0%) |
| 18 to 34 Years | 0 (0.0%) | 0 (0.0%) |
| 35 to 64 Years | 0 (0.0%) | 0 (0.0%) |
| 65 to 74 Years | 0 (0.0%) | 0 (0.0%) |
| 75 Years and over | 0 (0.0%) | 0 (0.0%) |
Technology Access in Boon
Computing Device Access in Boon
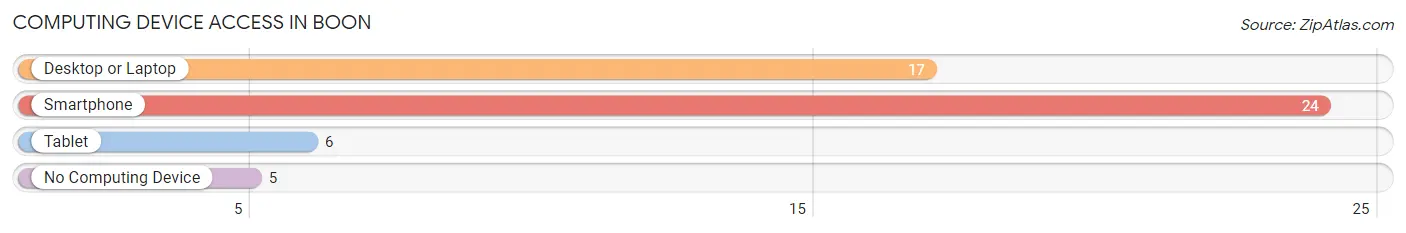
| Device Type | # Households | % Households |
| Desktop or Laptop | 17 | 56.7% |
| Smartphone | 24 | 80.0% |
| Tablet | 6 | 20.0% |
| No Computing Device | 5 | 16.7% |
| Total | 30 | 100.0% |
Internet Access in Boon
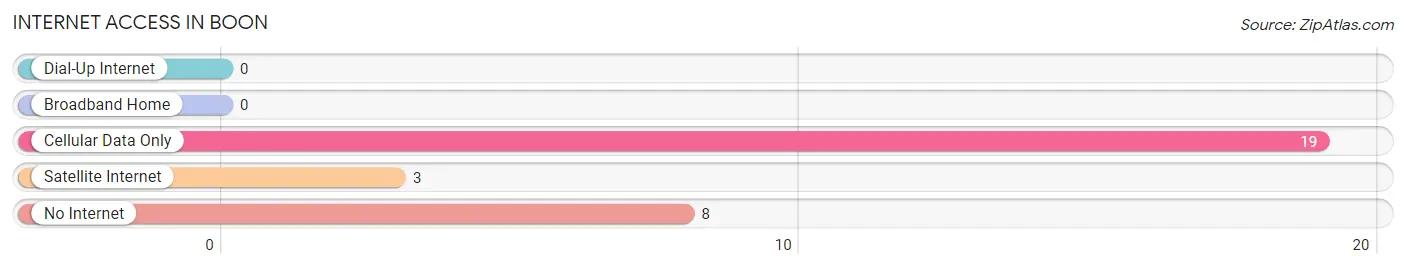
| Internet Type | # Households | % Households |
| Dial-Up Internet | 0 | 0.0% |
| Broadband Home | 0 | 0.0% |
| Cellular Data Only | 19 | 63.3% |
| Satellite Internet | 3 | 10.0% |
| No Internet | 8 | 26.7% |
| Total | 30 | 100.0% |
Boon Summary
Boon is a small unincorporated community located in the northern part of Michigan’s Lower Peninsula. It is situated in the northwest corner of Wexford County, approximately 10 miles south of Cadillac and 25 miles north of Manistee. Boon is a rural community with a population of just over 200 people, according to the 2010 census.
History
The area that is now Boon was first settled in the late 1800s by a group of German immigrants. The town was originally known as “Boonville” and was named after the first settler, John Boon. The town was officially incorporated in 1891 and was home to a variety of businesses, including a sawmill, a general store, a blacksmith shop, and a post office.
In the early 1900s, Boon began to experience a period of growth and prosperity. The town was home to several churches, a school, and a variety of businesses. The town also had a train station, which allowed for easy access to the surrounding towns and cities.
Geography
Boon is located in the northwest corner of Wexford County, approximately 10 miles south of Cadillac and 25 miles north of Manistee. The town is situated on the banks of the Manistee River, which flows through the area. The terrain is mostly flat, with some rolling hills in the surrounding area. The town is surrounded by a variety of forests, including maple, oak, and pine.
Economy
The economy of Boon is largely based on agriculture and tourism. The town is home to several farms, which produce a variety of crops, including corn, soybeans, and wheat. The town is also home to several small businesses, including a general store, a gas station, and a restaurant.
Tourism is also an important part of the local economy. The town is home to several recreational areas, including the Manistee River, which is popular for fishing and boating. The town is also home to several parks, including the Boonville State Park, which offers camping, hiking, and other outdoor activities.
Demographics
According to the 2010 census, the population of Boon was just over 200 people. The town is predominantly white, with a small percentage of African Americans and Native Americans. The median household income is just over $30,000, and the median age is just over 40 years old. The town is home to a variety of religious denominations, including Catholic, Lutheran, and Methodist.
Common Questions
What is Per Capita Income in Boon?
Per Capita income in Boon is $43,459.
What is the Median Family Income in Boon?
Median Family Income in Boon is $93,214.
What is the Median Household income in Boon?
Median Household Income in Boon is $90,000.
What is Inequality or Gini Index in Boon?
Inequality or Gini Index in Boon is 0.22.
What is the Total Population of Boon?
Total Population of Boon is 56.
What is the Total Male Population of Boon?
Total Male Population of Boon is 31.
What is the Total Female Population of Boon?
Total Female Population of Boon is 25.
What is the Ratio of Males per 100 Females in Boon?
There are 124.00 Males per 100 Females in Boon.
What is the Ratio of Females per 100 Males in Boon?
There are 80.65 Females per 100 Males in Boon.
What is the Median Population Age in Boon?
Median Population Age in Boon is 52.9 Years.
What is the Average Family Size in Boon
Average Family Size in Boon is 2.1 People.
What is the Average Household Size in Boon
Average Household Size in Boon is 1.9 People.
How Large is the Labor Force in Boon?
There are 23 People in the Labor Forcein in Boon.
What is the Percentage of People in the Labor Force in Boon?
41.1% of People are in the Labor Force in Boon.