Benzonia, MI Map & Demographics
Benzonia Map
Benzonia Overview
$30,132
PER CAPITA INCOME
$83,409
AVG FAMILY INCOME
$64,107
AVG HOUSEHOLD INCOME
2.7%
WAGE / INCOME GAP [ % ]
97.3¢/ $1
WAGE / INCOME GAP [ $ ]
0.40
INEQUALITY / GINI INDEX
679
TOTAL POPULATION
368
MALE POPULATION
311
FEMALE POPULATION
118.33
MALES / 100 FEMALES
84.51
FEMALES / 100 MALES
46.3
MEDIAN AGE
3.3
AVG FAMILY SIZE
2.6
AVG HOUSEHOLD SIZE
358
LABOR FORCE [ PEOPLE ]
59.2%
PERCENT IN LABOR FORCE
8.4%
UNEMPLOYMENT RATE
Benzonia Zip Codes
Benzonia Area Codes
Income in Benzonia
Income Overview in Benzonia
Per Capita Income in Benzonia is $30,132, while median incomes of families and households are $83,409 and $64,107 respectively.
| Characteristic | Number | Measure |
| Per Capita Income | 679 | $30,132 |
| Median Family Income | 146 | $83,409 |
| Mean Family Income | 146 | $91,936 |
| Median Household Income | 257 | $64,107 |
| Mean Household Income | 257 | $76,151 |
| Income Deficit | 146 | $0 |
| Wage / Income Gap (%) | 679 | 2.72% |
| Wage / Income Gap ($) | 679 | 97.28¢ per $1 |
| Gini / Inequality Index | 679 | 0.40 |
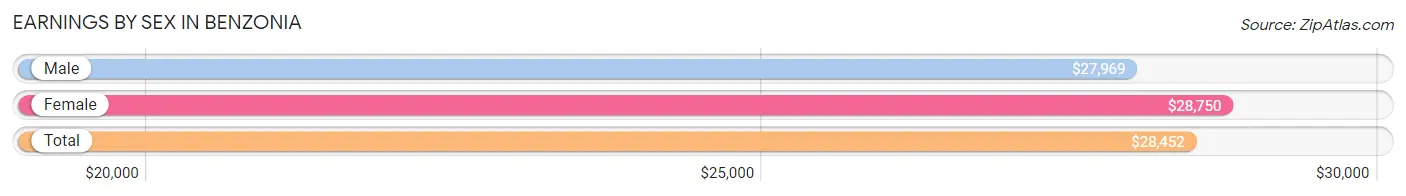
Earnings by Sex in Benzonia
Average Earnings in Benzonia are $28,452, $27,969 for men and $28,750 for women, a difference of 2.7%.
| Sex | Number | Average Earnings |
| Male | 171 (46.2%) | $27,969 |
| Female | 199 (53.8%) | $28,750 |
| Total | 370 (100.0%) | $28,452 |
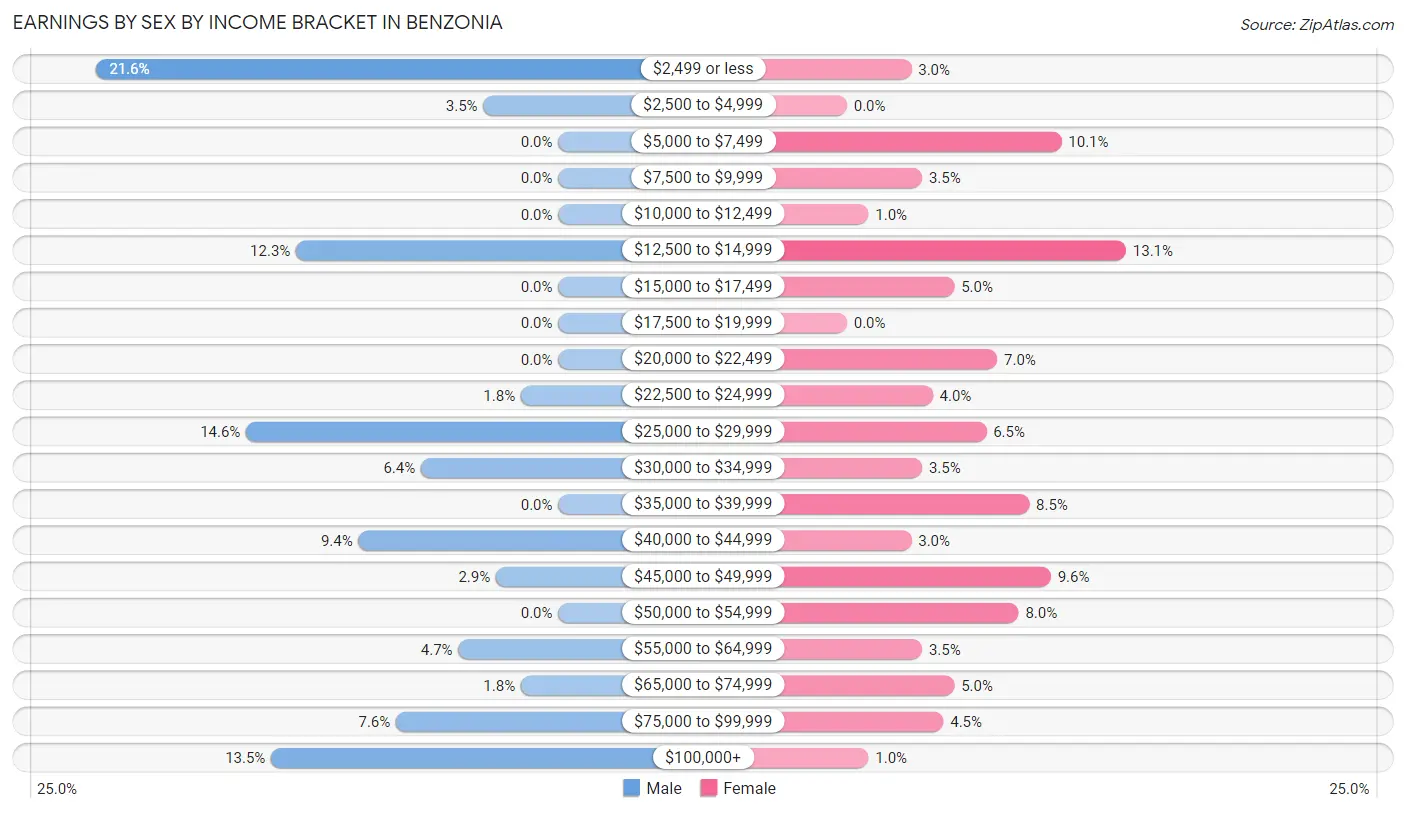
Earnings by Sex by Income Bracket in Benzonia
The most common earnings brackets in Benzonia are $2,499 or less for men (37 | 21.6%) and $12,500 to $14,999 for women (26 | 13.1%).
| Income | Male | Female |
| $2,499 or less | 37 (21.6%) | 6 (3.0%) |
| $2,500 to $4,999 | 6 (3.5%) | 0 (0.0%) |
| $5,000 to $7,499 | 0 (0.0%) | 20 (10.1%) |
| $7,500 to $9,999 | 0 (0.0%) | 7 (3.5%) |
| $10,000 to $12,499 | 0 (0.0%) | 2 (1.0%) |
| $12,500 to $14,999 | 21 (12.3%) | 26 (13.1%) |
| $15,000 to $17,499 | 0 (0.0%) | 10 (5.0%) |
| $17,500 to $19,999 | 0 (0.0%) | 0 (0.0%) |
| $20,000 to $22,499 | 0 (0.0%) | 14 (7.0%) |
| $22,500 to $24,999 | 3 (1.8%) | 8 (4.0%) |
| $25,000 to $29,999 | 25 (14.6%) | 13 (6.5%) |
| $30,000 to $34,999 | 11 (6.4%) | 7 (3.5%) |
| $35,000 to $39,999 | 0 (0.0%) | 17 (8.5%) |
| $40,000 to $44,999 | 16 (9.4%) | 6 (3.0%) |
| $45,000 to $49,999 | 5 (2.9%) | 19 (9.6%) |
| $50,000 to $54,999 | 0 (0.0%) | 16 (8.0%) |
| $55,000 to $64,999 | 8 (4.7%) | 7 (3.5%) |
| $65,000 to $74,999 | 3 (1.8%) | 10 (5.0%) |
| $75,000 to $99,999 | 13 (7.6%) | 9 (4.5%) |
| $100,000+ | 23 (13.5%) | 2 (1.0%) |
| Total | 171 (100.0%) | 199 (100.0%) |
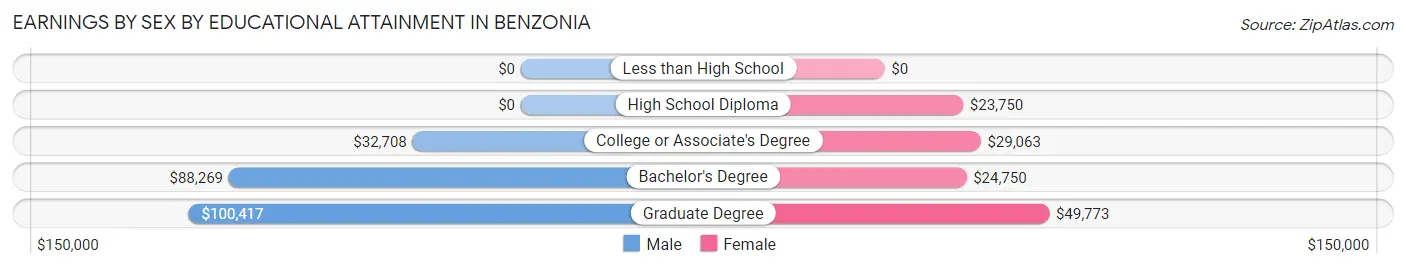
Earnings by Sex by Educational Attainment in Benzonia
Average earnings in Benzonia are $30,750 for men and $29,519 for women, a difference of 4.0%. Men with an educational attainment of graduate degree enjoy the highest average annual earnings of $100,417, while those with college or associate's degree education earn the least with $32,708. Women with an educational attainment of graduate degree earn the most with the average annual earnings of $49,773, while those with high school diploma education have the smallest earnings of $23,750.
| Educational Attainment | Male Income | Female Income |
| Less than High School | - | - |
| High School Diploma | - | - |
| College or Associate's Degree | $32,708 | $29,063 |
| Bachelor's Degree | $88,269 | $24,750 |
| Graduate Degree | $100,417 | $49,773 |
| Total | $30,750 | $29,519 |
Family Income in Benzonia
Family Income Brackets in Benzonia
According to the Benzonia family income data, there are 44 families falling into the $100,000 to $149,999 income range, which is the most common income bracket and makes up 30.1% of all families.
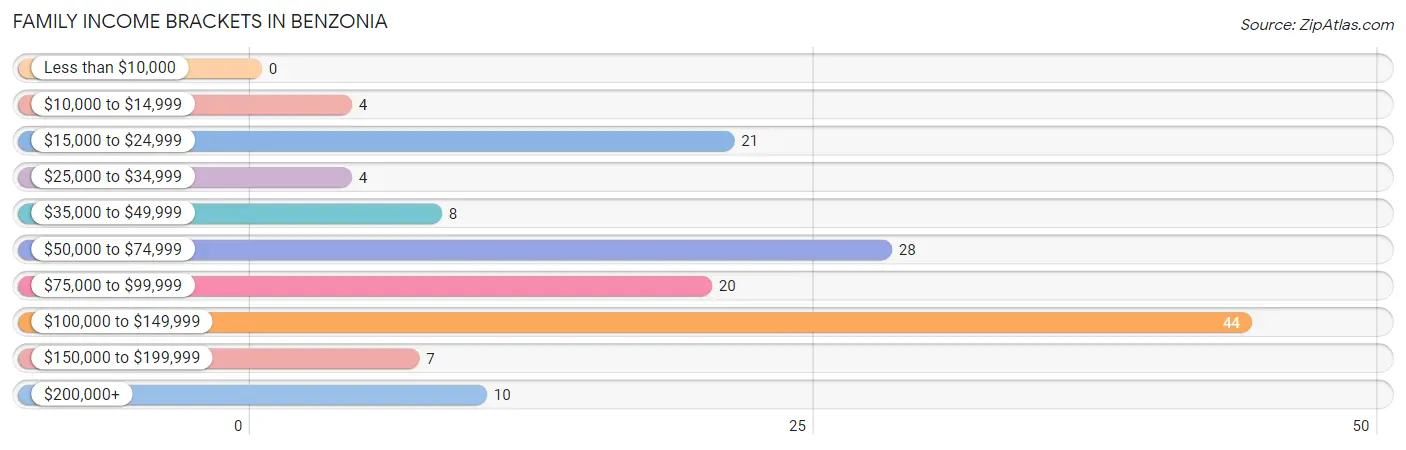
| Income Bracket | # Families | % Families |
| Less than $10,000 | 0 | 0.0% |
| $10,000 to $14,999 | 4 | 2.7% |
| $15,000 to $24,999 | 21 | 14.4% |
| $25,000 to $34,999 | 4 | 2.7% |
| $35,000 to $49,999 | 8 | 5.5% |
| $50,000 to $74,999 | 28 | 19.2% |
| $75,000 to $99,999 | 20 | 13.7% |
| $100,000 to $149,999 | 44 | 30.1% |
| $150,000 to $199,999 | 7 | 4.8% |
| $200,000+ | 10 | 6.8% |
Family Income by Famaliy Size in Benzonia
5-person families (13 | 8.9%) account for the highest median family income in Benzonia with $142,917 per family, while 2-person families (84 | 57.5%) have the highest median income of $50,416 per family member.
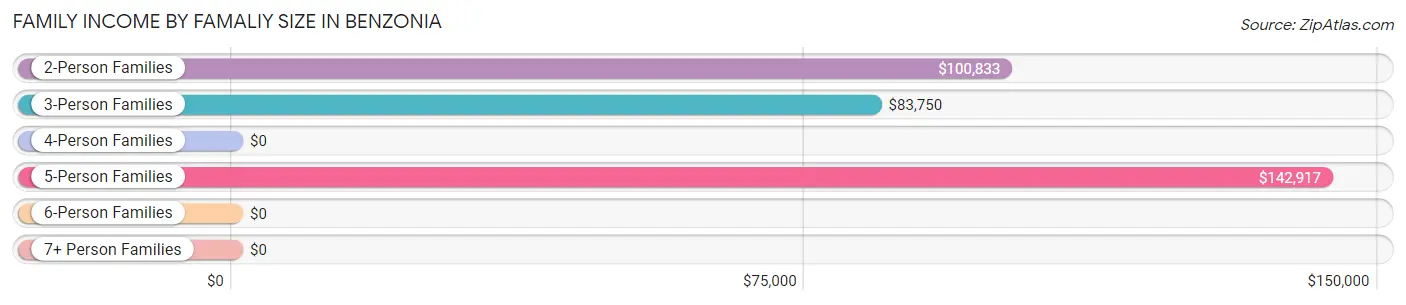
| Income Bracket | # Families | Median Income |
| 2-Person Families | 84 (57.5%) | $100,833 |
| 3-Person Families | 26 (17.8%) | $83,750 |
| 4-Person Families | 22 (15.1%) | $0 |
| 5-Person Families | 13 (8.9%) | $142,917 |
| 6-Person Families | 0 (0.0%) | $0 |
| 7+ Person Families | 1 (0.7%) | $0 |
| Total | 146 (100.0%) | $83,409 |
Family Income by Number of Earners in Benzonia
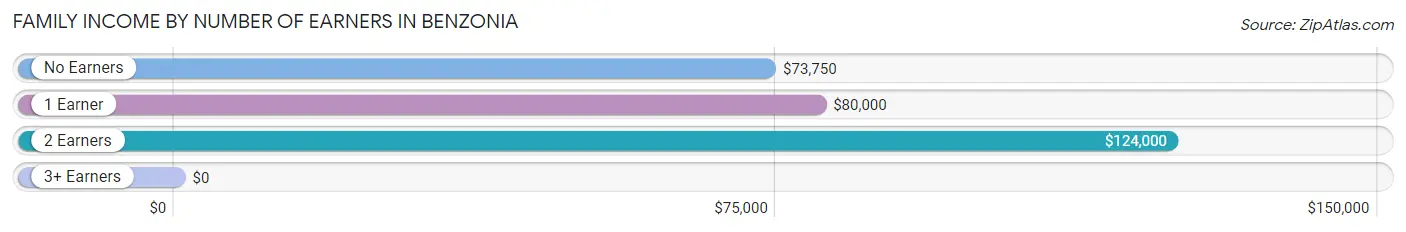
| Number of Earners | # Families | Median Income |
| No Earners | 24 (16.4%) | $73,750 |
| 1 Earner | 38 (26.0%) | $80,000 |
| 2 Earners | 50 (34.3%) | $124,000 |
| 3+ Earners | 34 (23.3%) | $0 |
| Total | 146 (100.0%) | $83,409 |
Household Income in Benzonia
Household Income Brackets in Benzonia
With 58 households falling in the category, the $100,000 to $149,999 income range is the most frequent in Benzonia, accounting for 22.6% of all households. In contrast, only 3 households (1.2%) fall into the less than $10,000 income bracket, making it the least populous group.
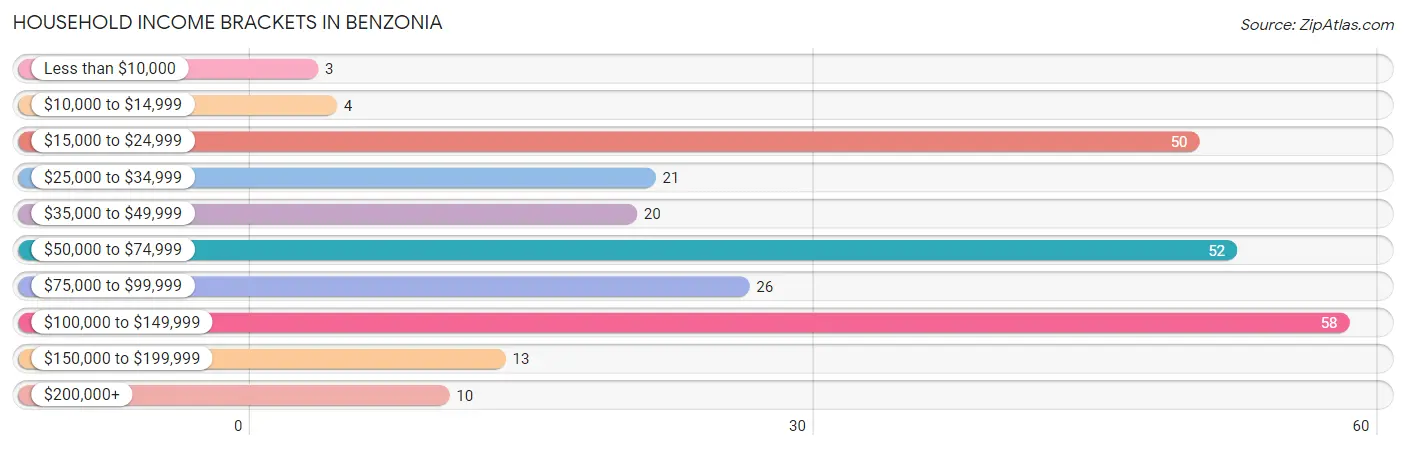
| Income Bracket | # Households | % Households |
| Less than $10,000 | 3 | 1.2% |
| $10,000 to $14,999 | 4 | 1.6% |
| $15,000 to $24,999 | 50 | 19.5% |
| $25,000 to $34,999 | 21 | 8.2% |
| $35,000 to $49,999 | 20 | 7.8% |
| $50,000 to $74,999 | 52 | 20.2% |
| $75,000 to $99,999 | 26 | 10.1% |
| $100,000 to $149,999 | 58 | 22.6% |
| $150,000 to $199,999 | 13 | 5.1% |
| $200,000+ | 10 | 3.9% |
Household Income by Householder Age in Benzonia
The median household income in Benzonia is $64,107, with the highest median household income of $75,833 found in the 65+ years age bracket for the primary householder. A total of 66 households (25.7%) fall into this category.
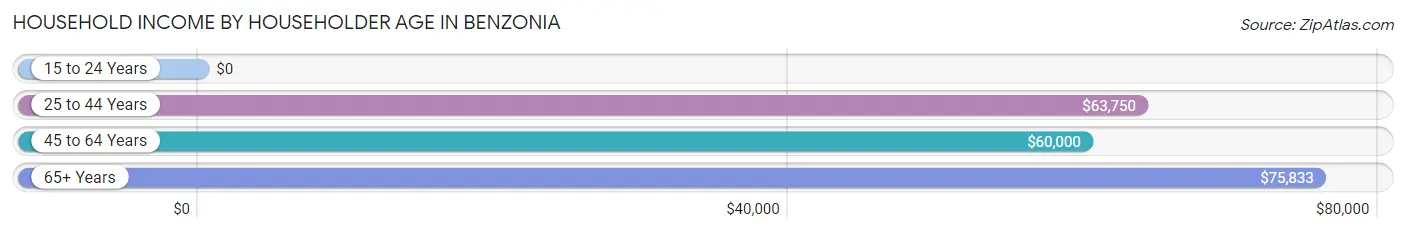
| Income Bracket | # Households | Median Income |
| 15 to 24 Years | 0 (0.0%) | $0 |
| 25 to 44 Years | 93 (36.2%) | $63,750 |
| 45 to 64 Years | 98 (38.1%) | $60,000 |
| 65+ Years | 66 (25.7%) | $75,833 |
| Total | 257 (100.0%) | $64,107 |
Poverty in Benzonia
Income Below Poverty by Sex and Age in Benzonia
With 25.5% poverty level for males and 15.1% for females among the residents of Benzonia, 45 to 54 year old males and 55 to 64 year old females are the most vulnerable to poverty, with 26 males (48.1%) and 30 females (37.5%) in their respective age groups living below the poverty level.
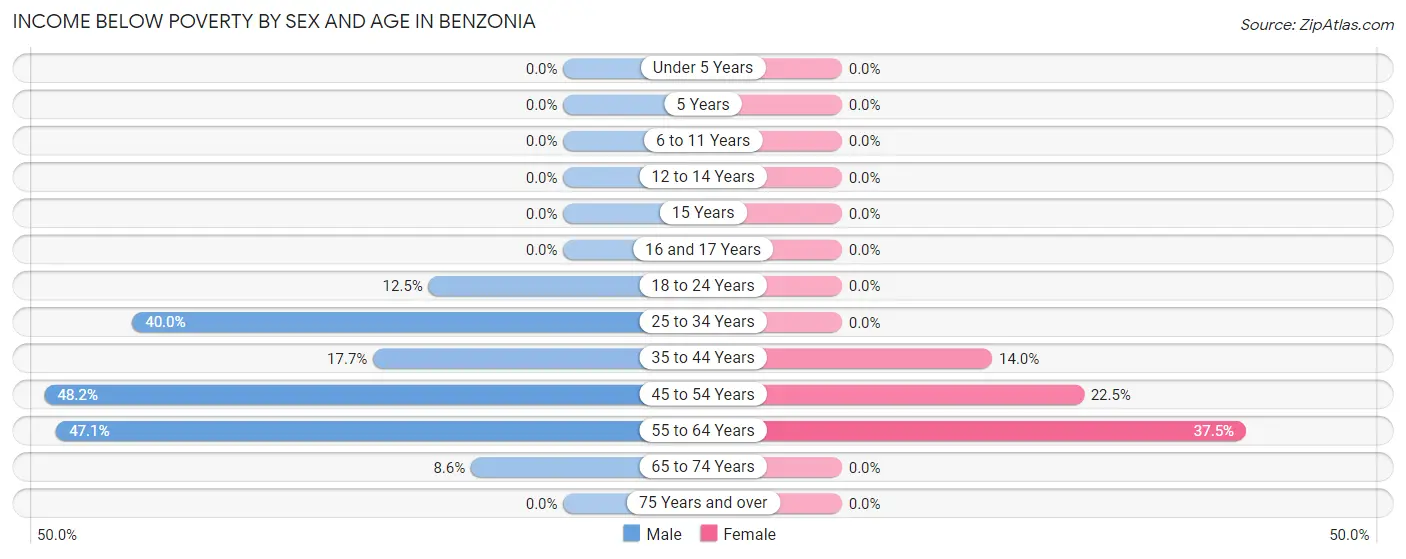
| Age Bracket | Male | Female |
| Under 5 Years | 0 (0.0%) | 0 (0.0%) |
| 5 Years | 0 (0.0%) | 0 (0.0%) |
| 6 to 11 Years | 0 (0.0%) | 0 (0.0%) |
| 12 to 14 Years | 0 (0.0%) | 0 (0.0%) |
| 15 Years | 0 (0.0%) | 0 (0.0%) |
| 16 and 17 Years | 0 (0.0%) | 0 (0.0%) |
| 18 to 24 Years | 3 (12.5%) | 0 (0.0%) |
| 25 to 34 Years | 28 (40.0%) | 0 (0.0%) |
| 35 to 44 Years | 9 (17.6%) | 6 (14.0%) |
| 45 to 54 Years | 26 (48.1%) | 11 (22.5%) |
| 55 to 64 Years | 24 (47.1%) | 30 (37.5%) |
| 65 to 74 Years | 3 (8.6%) | 0 (0.0%) |
| 75 Years and over | 0 (0.0%) | 0 (0.0%) |
| Total | 93 (25.5%) | 47 (15.1%) |
Income Above Poverty by Sex and Age in Benzonia
According to the poverty statistics in Benzonia, males aged under 5 years and females aged under 5 years are the age groups that are most secure financially, with 100.0% of males and 100.0% of females in these age groups living above the poverty line.
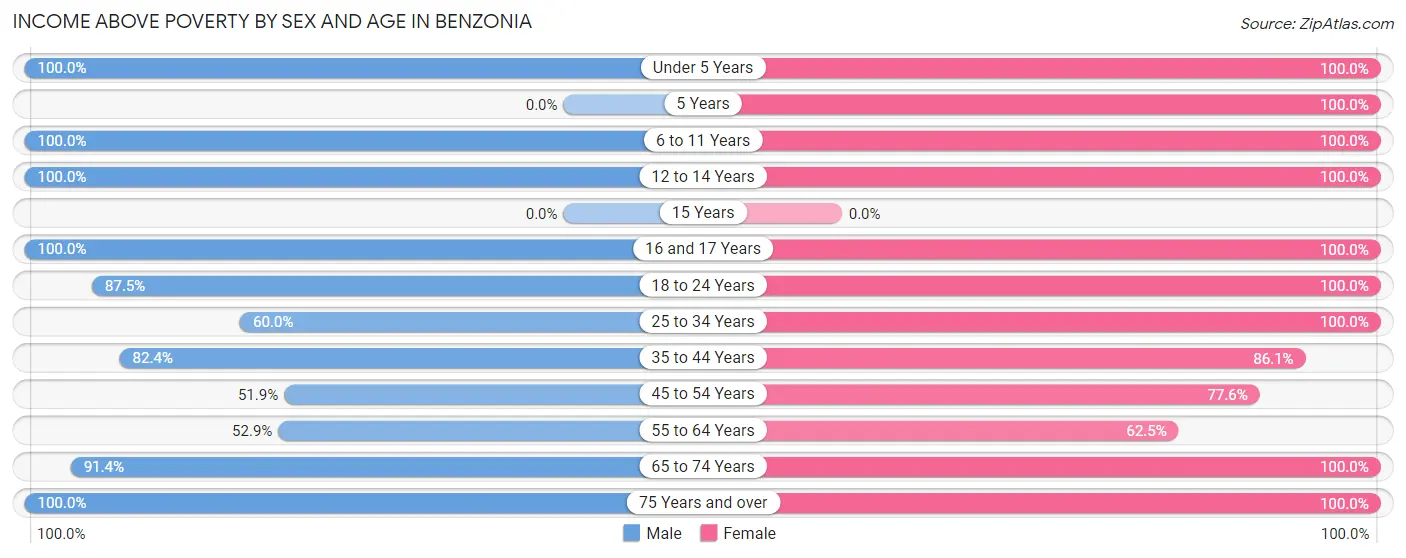
| Age Bracket | Male | Female |
| Under 5 Years | 22 (100.0%) | 9 (100.0%) |
| 5 Years | 0 (0.0%) | 5 (100.0%) |
| 6 to 11 Years | 11 (100.0%) | 6 (100.0%) |
| 12 to 14 Years | 14 (100.0%) | 7 (100.0%) |
| 15 Years | 0 (0.0%) | 0 (0.0%) |
| 16 and 17 Years | 8 (100.0%) | 7 (100.0%) |
| 18 to 24 Years | 21 (87.5%) | 8 (100.0%) |
| 25 to 34 Years | 42 (60.0%) | 40 (100.0%) |
| 35 to 44 Years | 42 (82.4%) | 37 (86.1%) |
| 45 to 54 Years | 28 (51.8%) | 38 (77.5%) |
| 55 to 64 Years | 27 (52.9%) | 50 (62.5%) |
| 65 to 74 Years | 32 (91.4%) | 13 (100.0%) |
| 75 Years and over | 25 (100.0%) | 44 (100.0%) |
| Total | 272 (74.5%) | 264 (84.9%) |
Income Below Poverty Among Married-Couple Families in Benzonia
The poverty statistics for married-couple families in Benzonia show that 16.2% or 19 of the total 117 families live below the poverty line. Families with no children have the highest poverty rate of 18.8%, comprising of 19 families. On the other hand, families with 1 or 2 children have the lowest poverty rate of 0.0%, which includes 0 families.
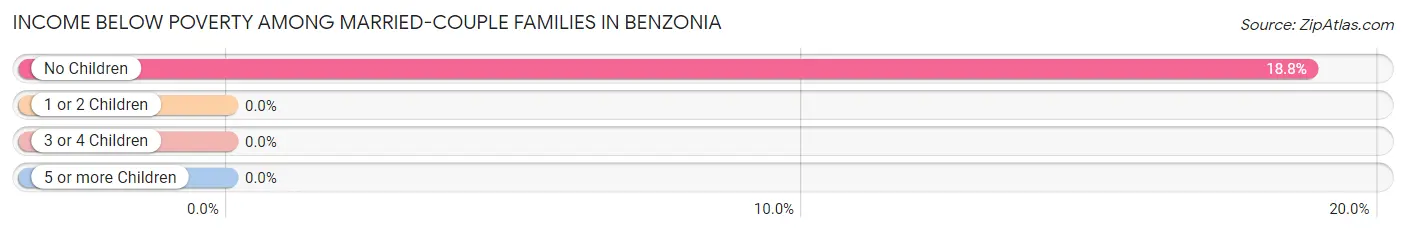
| Children | Above Poverty | Below Poverty |
| No Children | 82 (81.2%) | 19 (18.8%) |
| 1 or 2 Children | 10 (100.0%) | 0 (0.0%) |
| 3 or 4 Children | 6 (100.0%) | 0 (0.0%) |
| 5 or more Children | 0 (0.0%) | 0 (0.0%) |
| Total | 98 (83.8%) | 19 (16.2%) |
Income Below Poverty Among Single-Parent Households in Benzonia
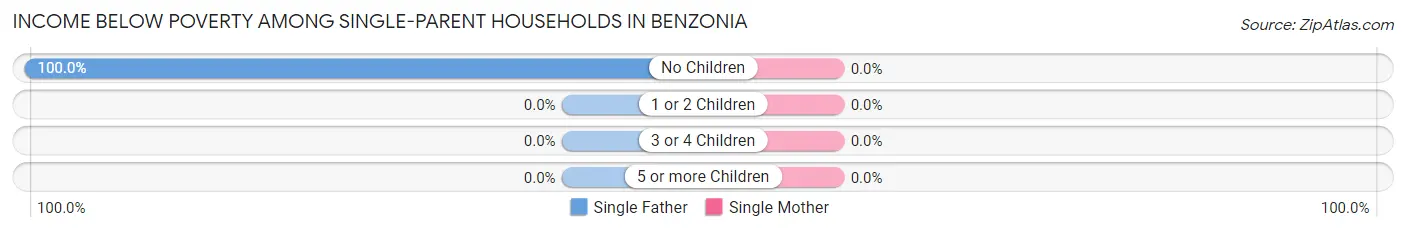
| Children | Single Father | Single Mother |
| No Children | 3 (100.0%) | 0 (0.0%) |
| 1 or 2 Children | 0 (0.0%) | 0 (0.0%) |
| 3 or 4 Children | 0 (0.0%) | 0 (0.0%) |
| 5 or more Children | 0 (0.0%) | 0 (0.0%) |
| Total | 3 (23.1%) | 0 (0.0%) |
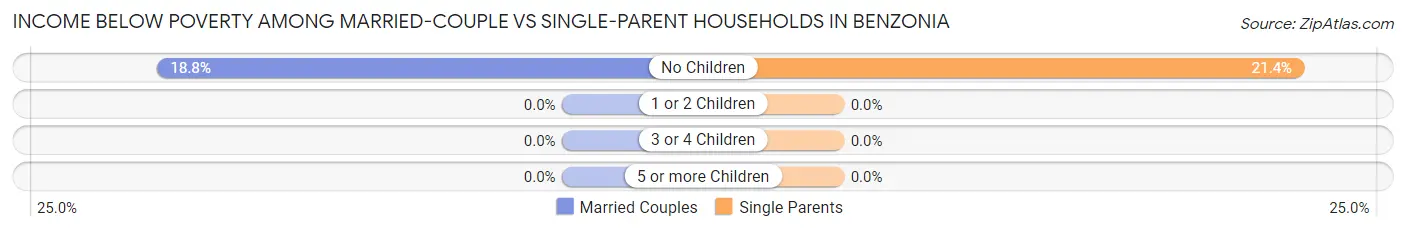
Income Below Poverty Among Married-Couple vs Single-Parent Households in Benzonia
The poverty data for Benzonia shows that 19 of the married-couple family households (16.2%) and 3 of the single-parent households (10.3%) are living below the poverty level. Within the married-couple family households, those with no children have the highest poverty rate, with 19 households (18.8%) falling below the poverty line. Among the single-parent households, those with no children have the highest poverty rate, with 3 household (21.4%) living below poverty.
| Children | Married-Couple Families | Single-Parent Households |
| No Children | 19 (18.8%) | 3 (21.4%) |
| 1 or 2 Children | 0 (0.0%) | 0 (0.0%) |
| 3 or 4 Children | 0 (0.0%) | 0 (0.0%) |
| 5 or more Children | 0 (0.0%) | 0 (0.0%) |
| Total | 19 (16.2%) | 3 (10.3%) |
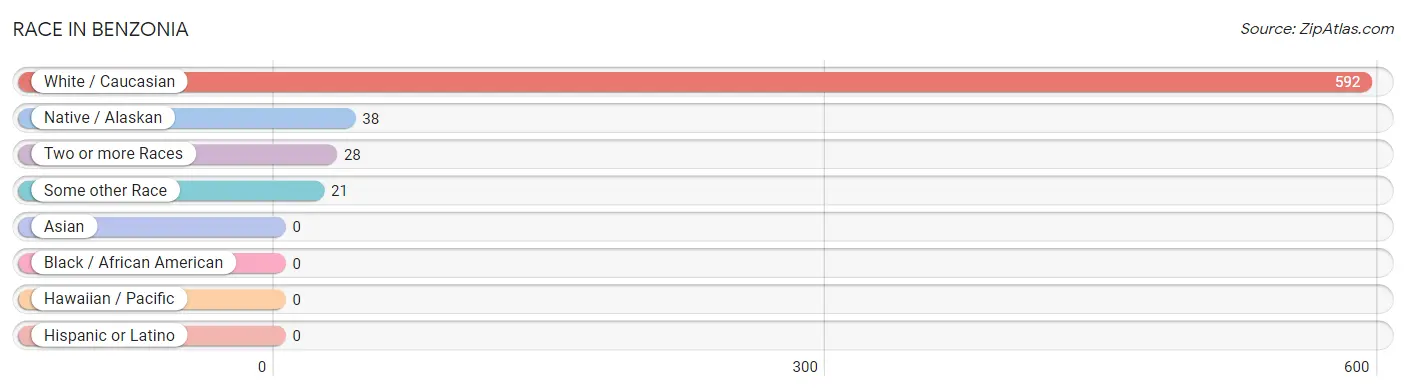
Race in Benzonia
The most populous races in Benzonia are White / Caucasian (592 | 87.2%), Native / Alaskan (38 | 5.6%), and Two or more Races (28 | 4.1%).
| Race | # Population | % Population |
| Asian | 0 | 0.0% |
| Black / African American | 0 | 0.0% |
| Hawaiian / Pacific | 0 | 0.0% |
| Hispanic or Latino | 0 | 0.0% |
| Native / Alaskan | 38 | 5.6% |
| White / Caucasian | 592 | 87.2% |
| Two or more Races | 28 | 4.1% |
| Some other Race | 21 | 3.1% |
| Total | 679 | 100.0% |
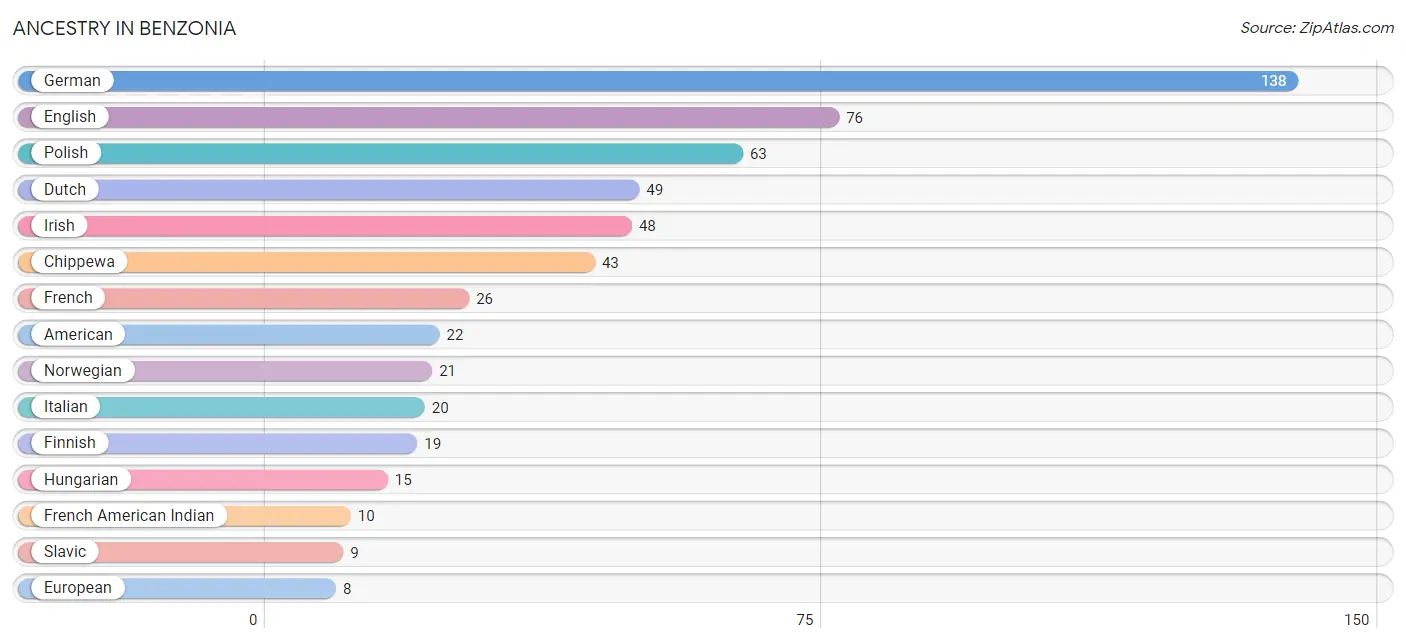
Ancestry in Benzonia
The most populous ancestries reported in Benzonia are German (138 | 20.3%), English (76 | 11.2%), Polish (63 | 9.3%), Dutch (49 | 7.2%), and Irish (48 | 7.1%), together accounting for 55.1% of all Benzonia residents.
| Ancestry | # Population | % Population |
| American | 22 | 3.2% |
| Chippewa | 43 | 6.3% |
| Dutch | 49 | 7.2% |
| English | 76 | 11.2% |
| European | 8 | 1.2% |
| Finnish | 19 | 2.8% |
| French | 26 | 3.8% |
| French American Indian | 10 | 1.5% |
| German | 138 | 20.3% |
| Hungarian | 15 | 2.2% |
| Irish | 48 | 7.1% |
| Italian | 20 | 2.9% |
| Norwegian | 21 | 3.1% |
| Ottawa | 3 | 0.4% |
| Polish | 63 | 9.3% |
| Romanian | 3 | 0.4% |
| Russian | 2 | 0.3% |
| Scandinavian | 3 | 0.4% |
| Scotch-Irish | 2 | 0.3% |
| Scottish | 7 | 1.0% |
| Slavic | 9 | 1.3% |
| Swedish | 2 | 0.3% |
| Welsh | 2 | 0.3% | View All 23 Rows |
Immigrants in Benzonia

| Immigration Origin | # Population | % Population | View All 0 Rows |
Sex and Age in Benzonia
Sex and Age in Benzonia
The most populous age groups in Benzonia are 25 to 29 Years (43 | 11.7%) for men and 60 to 64 Years (70 | 22.5%) for women.
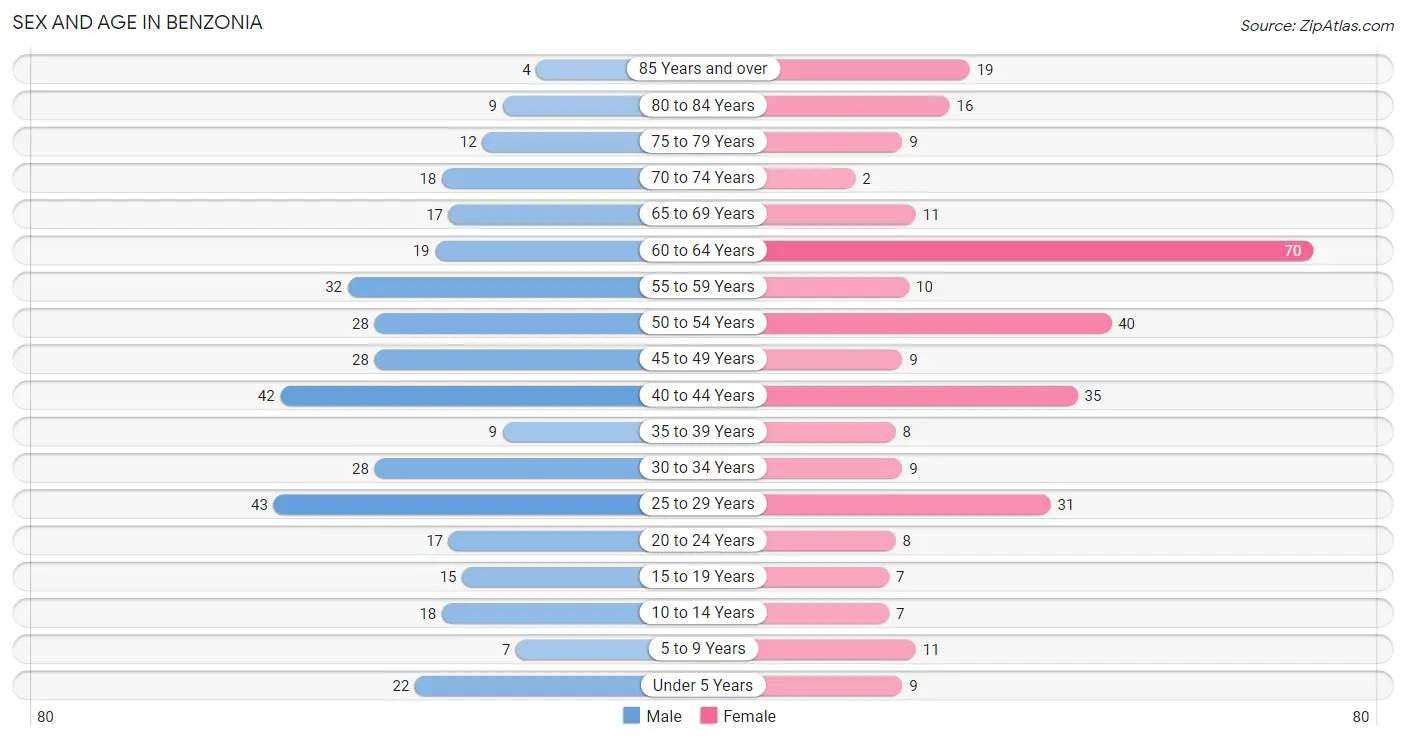
| Age Bracket | Male | Female |
| Under 5 Years | 22 (6.0%) | 9 (2.9%) |
| 5 to 9 Years | 7 (1.9%) | 11 (3.5%) |
| 10 to 14 Years | 18 (4.9%) | 7 (2.2%) |
| 15 to 19 Years | 15 (4.1%) | 7 (2.2%) |
| 20 to 24 Years | 17 (4.6%) | 8 (2.6%) |
| 25 to 29 Years | 43 (11.7%) | 31 (10.0%) |
| 30 to 34 Years | 28 (7.6%) | 9 (2.9%) |
| 35 to 39 Years | 9 (2.5%) | 8 (2.6%) |
| 40 to 44 Years | 42 (11.4%) | 35 (11.3%) |
| 45 to 49 Years | 28 (7.6%) | 9 (2.9%) |
| 50 to 54 Years | 28 (7.6%) | 40 (12.9%) |
| 55 to 59 Years | 32 (8.7%) | 10 (3.2%) |
| 60 to 64 Years | 19 (5.2%) | 70 (22.5%) |
| 65 to 69 Years | 17 (4.6%) | 11 (3.5%) |
| 70 to 74 Years | 18 (4.9%) | 2 (0.6%) |
| 75 to 79 Years | 12 (3.3%) | 9 (2.9%) |
| 80 to 84 Years | 9 (2.5%) | 16 (5.1%) |
| 85 Years and over | 4 (1.1%) | 19 (6.1%) |
| Total | 368 (100.0%) | 311 (100.0%) |
Families and Households in Benzonia
Median Family Size in Benzonia
The median family size in Benzonia is 3.33 persons per family, with single male/father families (13 | 8.9%) accounting for the largest median family size of 6.92 persons per family. On the other hand, married-couple families (117 | 80.1%) represent the smallest median family size with 2.90 persons per family.
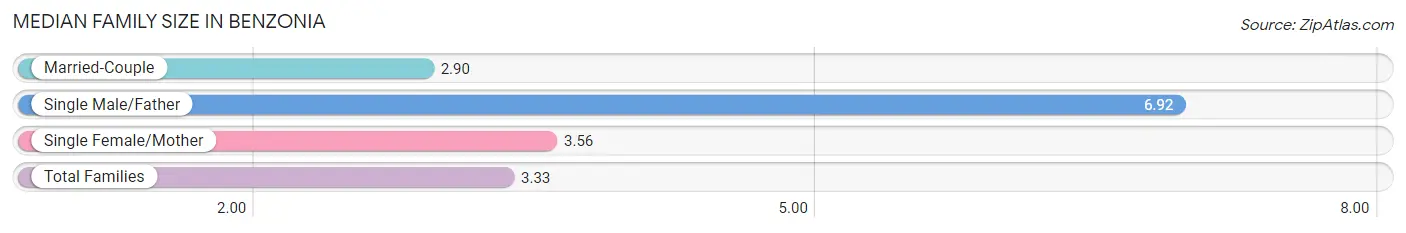
| Family Type | # Families | Family Size |
| Married-Couple | 117 (80.1%) | 2.90 |
| Single Male/Father | 13 (8.9%) | 6.92 |
| Single Female/Mother | 16 (11.0%) | 3.56 |
| Total Families | 146 (100.0%) | 3.33 |
Median Household Size in Benzonia
The median household size in Benzonia is 2.63 persons per household, with single male/father households (13 | 5.1%) accounting for the largest median household size of 6.92 persons per household. non-family households (111 | 43.2%) represent the smallest median household size with 1.55 persons per household.
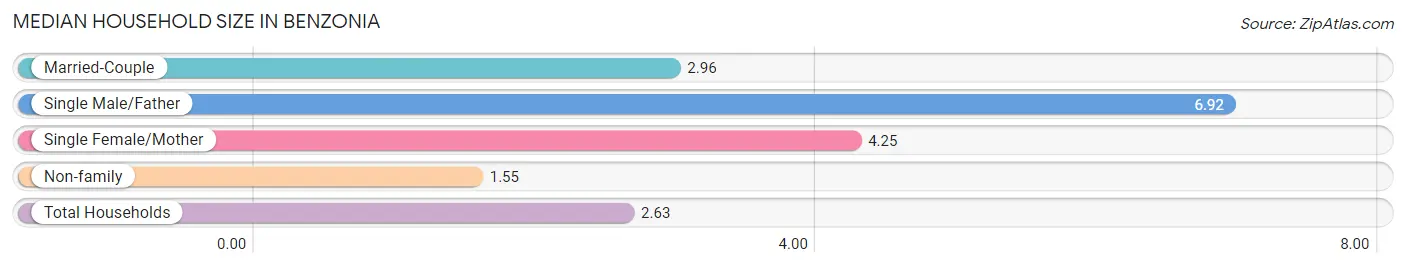
| Household Type | # Households | Household Size |
| Married-Couple | 117 (45.5%) | 2.96 |
| Single Male/Father | 13 (5.1%) | 6.92 |
| Single Female/Mother | 16 (6.2%) | 4.25 |
| Non-family | 111 (43.2%) | 1.55 |
| Total Households | 257 (100.0%) | 2.63 |
Household Size by Marriage Status in Benzonia
Out of a total of 257 households in Benzonia, 146 (56.8%) are family households, while 111 (43.2%) are nonfamily households. The most numerous type of family households are 2-person households, comprising 73, and the most common type of nonfamily households are 1-person households, comprising 80.
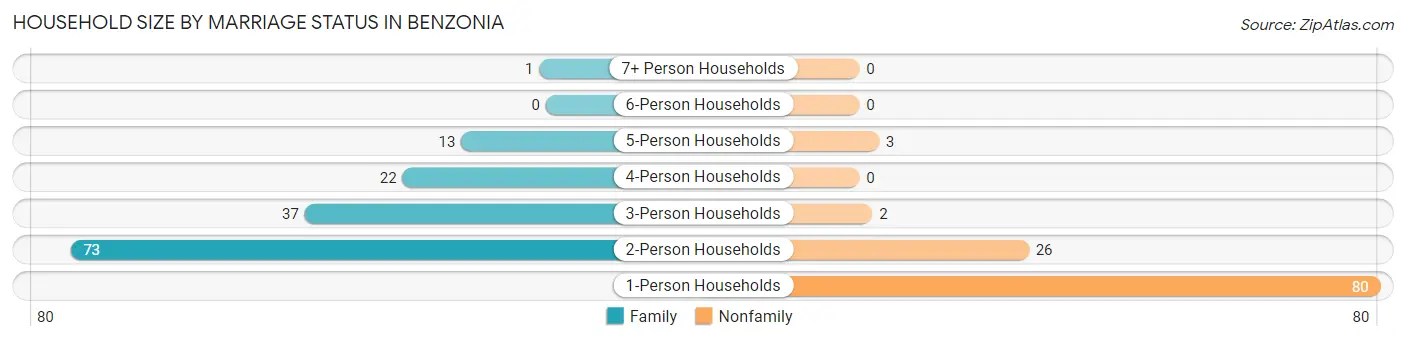
| Household Size | Family Households | Nonfamily Households |
| 1-Person Households | - | 80 (31.1%) |
| 2-Person Households | 73 (28.4%) | 26 (10.1%) |
| 3-Person Households | 37 (14.4%) | 2 (0.8%) |
| 4-Person Households | 22 (8.6%) | 0 (0.0%) |
| 5-Person Households | 13 (5.1%) | 3 (1.2%) |
| 6-Person Households | 0 (0.0%) | 0 (0.0%) |
| 7+ Person Households | 1 (0.4%) | 0 (0.0%) |
| Total | 146 (56.8%) | 111 (43.2%) |
Female Fertility in Benzonia
Fertility by Age in Benzonia
Average fertility rate in Benzonia is 85.0 births per 1,000 women. Women in the age bracket of 20 to 34 years have the highest fertility rate with 208.0 births per 1,000 women. Women in the age bracket of 20 to 34 years acount for 100.0% of all women with births.
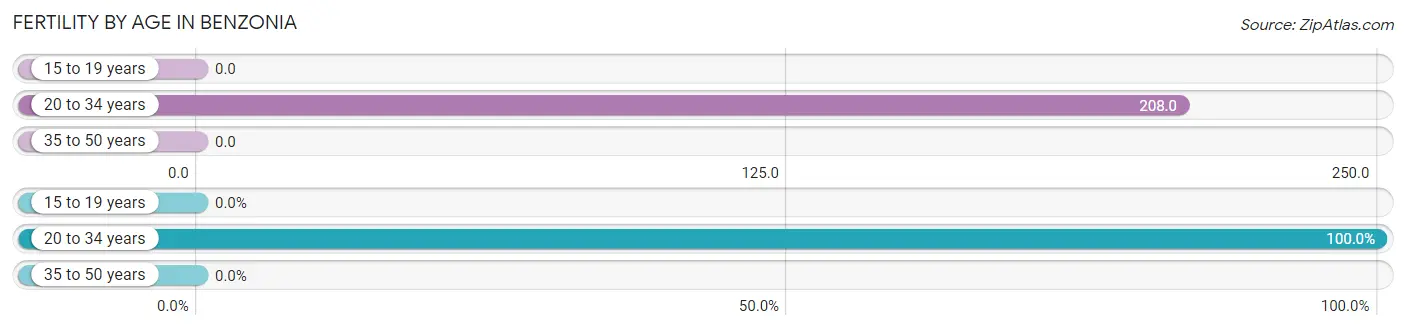
| Age Bracket | Women with Births | Births / 1,000 Women |
| 15 to 19 years | 0 (0.0%) | 0.0 |
| 20 to 34 years | 10 (100.0%) | 208.0 |
| 35 to 50 years | 0 (0.0%) | 0.0 |
| Total | 10 (100.0%) | 85.0 |
Fertility by Age by Marriage Status in Benzonia
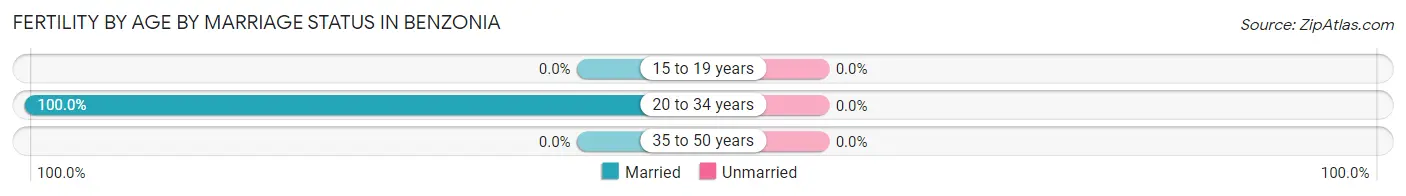
| Age Bracket | Married | Unmarried |
| 15 to 19 years | 0 (0.0%) | 0 (0.0%) |
| 20 to 34 years | 10 (100.0%) | 0 (0.0%) |
| 35 to 50 years | 0 (0.0%) | 0 (0.0%) |
| Total | 10 (100.0%) | 0 (0.0%) |
Fertility by Education in Benzonia
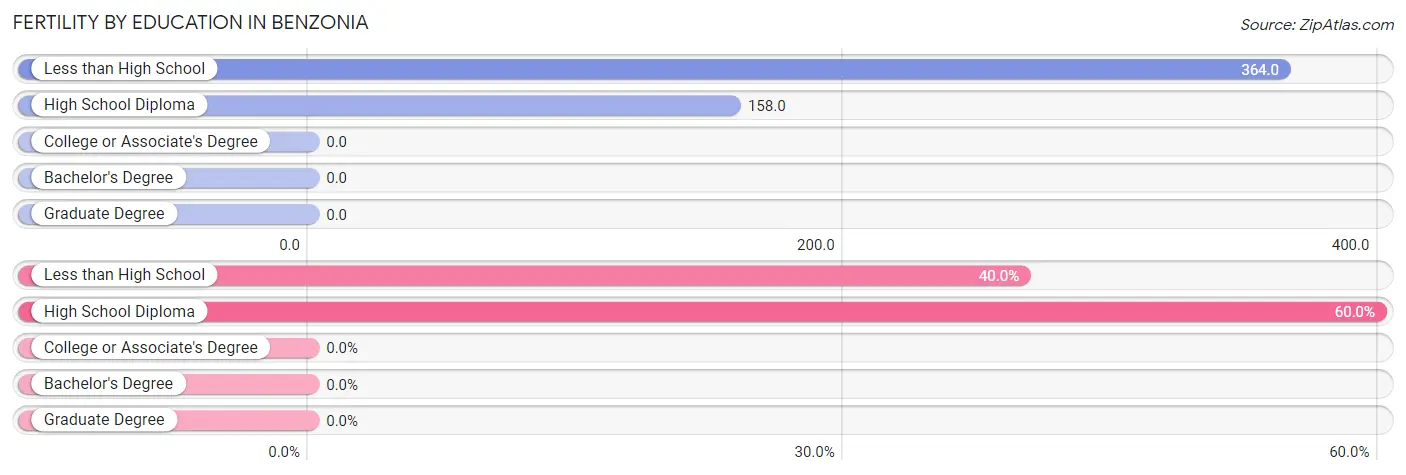
| Educational Attainment | Women with Births | Births / 1,000 Women |
| Less than High School | 4 (40.0%) | 364.0 |
| High School Diploma | 6 (60.0%) | 158.0 |
| College or Associate's Degree | 0 (0.0%) | 0.0 |
| Bachelor's Degree | 0 (0.0%) | 0.0 |
| Graduate Degree | 0 (0.0%) | 0.0 |
| Total | 10 (100.0%) | 85.0 |
Fertility by Education by Marriage Status in Benzonia
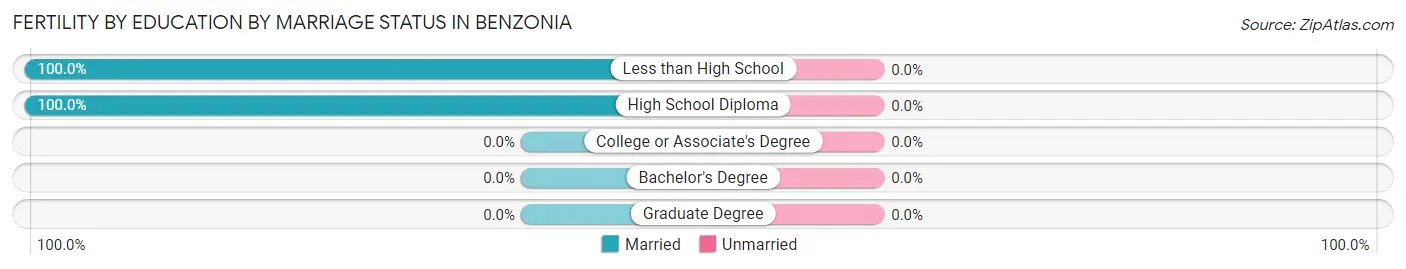
| Educational Attainment | Married | Unmarried |
| Less than High School | 4 (100.0%) | 0 (0.0%) |
| High School Diploma | 6 (100.0%) | 0 (0.0%) |
| College or Associate's Degree | 0 (0.0%) | 0 (0.0%) |
| Bachelor's Degree | 0 (0.0%) | 0 (0.0%) |
| Graduate Degree | 0 (0.0%) | 0 (0.0%) |
| Total | 10 (100.0%) | 0 (0.0%) |
Employment Characteristics in Benzonia
Employment by Class of Employer in Benzonia
Among the 322 employed individuals in Benzonia, private company employees (177 | 55.0%), not-for-profit organizations (45 | 14.0%), and local government employees (38 | 11.8%) make up the most common classes of employment.
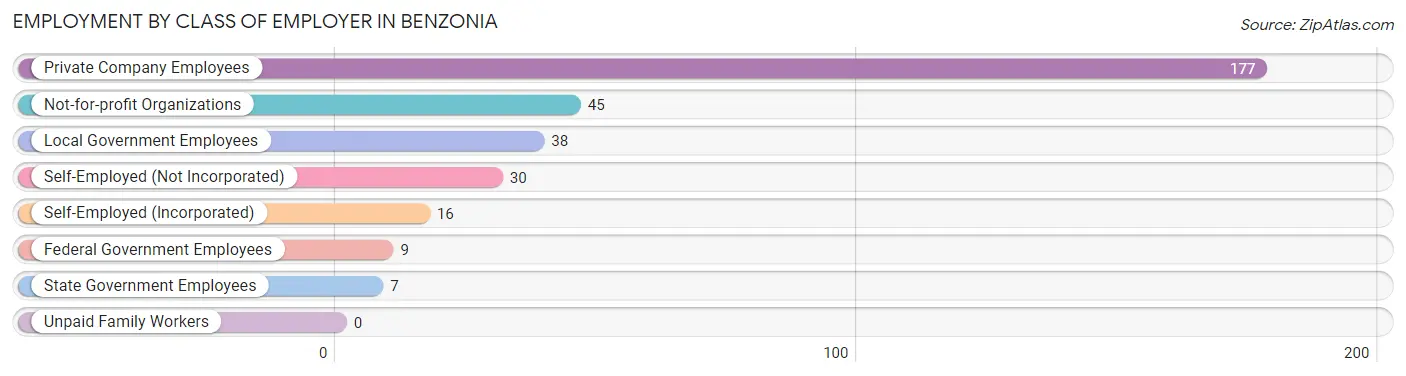
| Employer Class | # Employees | % Employees |
| Private Company Employees | 177 | 55.0% |
| Self-Employed (Incorporated) | 16 | 5.0% |
| Self-Employed (Not Incorporated) | 30 | 9.3% |
| Not-for-profit Organizations | 45 | 14.0% |
| Local Government Employees | 38 | 11.8% |
| State Government Employees | 7 | 2.2% |
| Federal Government Employees | 9 | 2.8% |
| Unpaid Family Workers | 0 | 0.0% |
| Total | 322 | 100.0% |
Employment Status by Age in Benzonia
According to the labor force statistics for Benzonia, out of the total population over 16 years of age (605), 59.2% or 358 individuals are in the labor force, with 8.4% or 30 of them unemployed. The age group with the highest labor force participation rate is 25 to 29 years, with 89.2% or 66 individuals in the labor force. Within the labor force, the 55 to 59 years age range has the highest percentage of unemployed individuals, with 73.3% or 11 of them being unemployed.
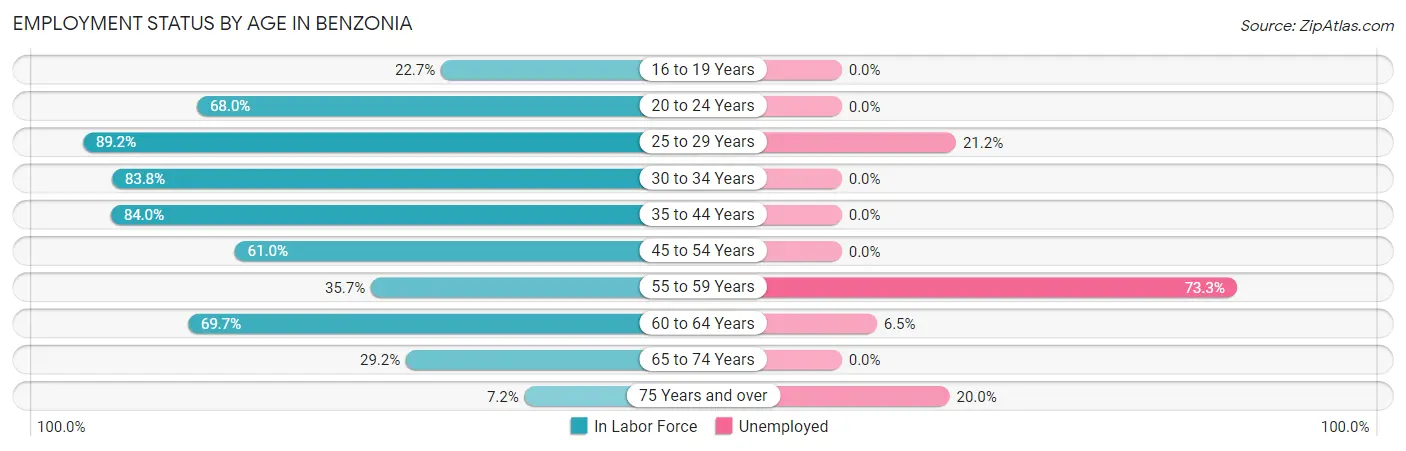
| Age Bracket | In Labor Force | Unemployed |
| 16 to 19 Years | 5 (22.7%) | 0 (0.0%) |
| 20 to 24 Years | 17 (68.0%) | 0 (0.0%) |
| 25 to 29 Years | 66 (89.2%) | 14 (21.2%) |
| 30 to 34 Years | 31 (83.8%) | 0 (0.0%) |
| 35 to 44 Years | 79 (84.0%) | 0 (0.0%) |
| 45 to 54 Years | 64 (61.0%) | 0 (0.0%) |
| 55 to 59 Years | 15 (35.7%) | 11 (73.3%) |
| 60 to 64 Years | 62 (69.7%) | 4 (6.5%) |
| 65 to 74 Years | 14 (29.2%) | 0 (0.0%) |
| 75 Years and over | 5 (7.2%) | 1 (20.0%) |
| Total | 358 (59.2%) | 30 (8.4%) |
Employment Status by Educational Attainment in Benzonia
According to labor force statistics for Benzonia, 71.9% of individuals (317) out of the total population between 25 and 64 years of age (441) are in the labor force, with 9.1% or 29 of them being unemployed. The group with the highest labor force participation rate are those with the educational attainment of bachelor's degree or higher, with 89.6% or 138 individuals in the labor force. Within the labor force, individuals with college / associate degree education have the highest percentage of unemployment, with 13.9% or 14 of them being unemployed.
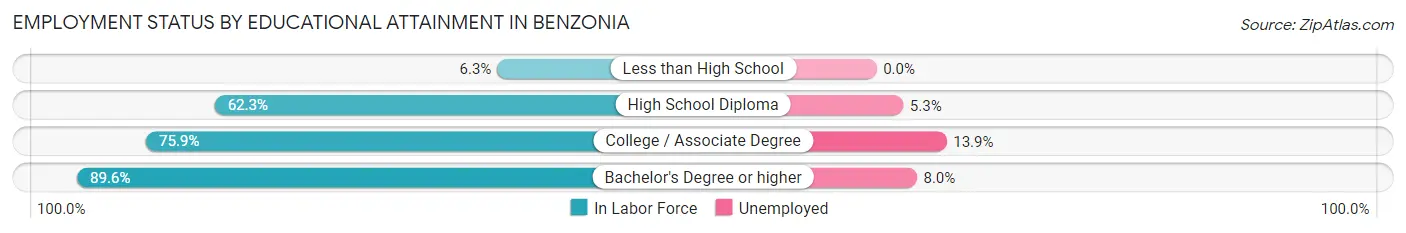
| Educational Attainment | In Labor Force | Unemployed |
| Less than High School | 2 (6.3%) | 0 (0.0%) |
| High School Diploma | 76 (62.3%) | 6 (5.3%) |
| College / Associate Degree | 101 (75.9%) | 18 (13.9%) |
| Bachelor's Degree or higher | 138 (89.6%) | 12 (8.0%) |
| Total | 317 (71.9%) | 40 (9.1%) |
Employment Occupations by Sex in Benzonia
Management, Business, Science and Arts Occupations
The most common Management, Business, Science and Arts occupations in Benzonia are Community & Social Service (62 | 18.9%), Arts, Media & Entertainment (24 | 7.3%), Education, Arts & Media (22 | 6.7%), Management (21 | 6.4%), and Business & Financial (17 | 5.2%).
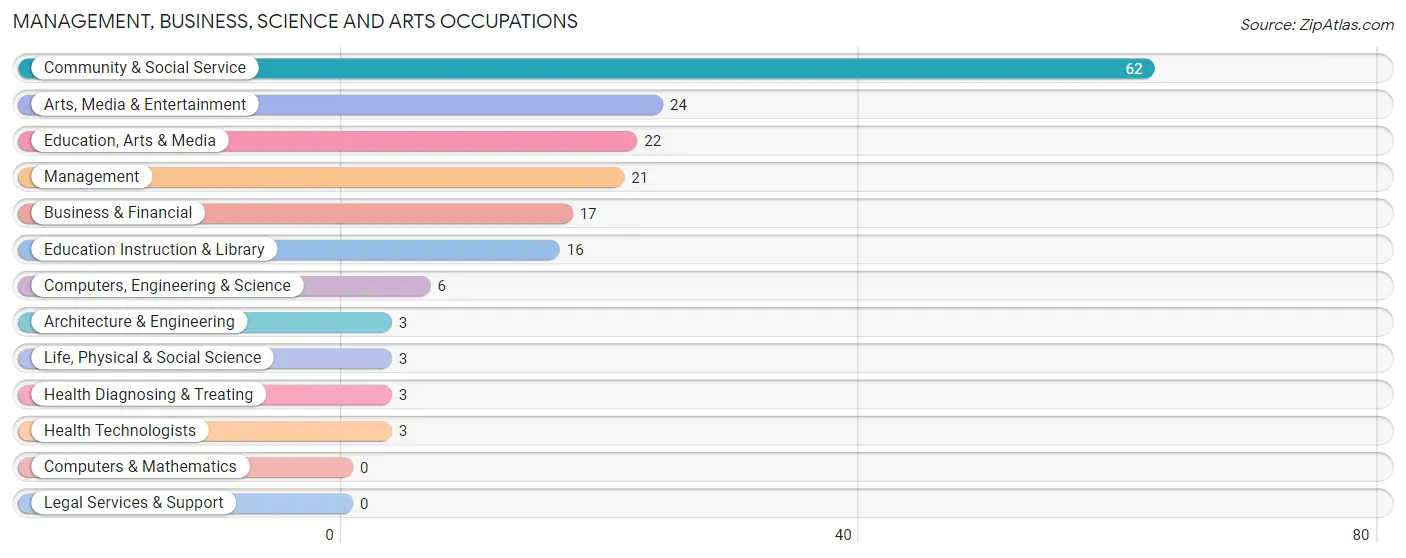
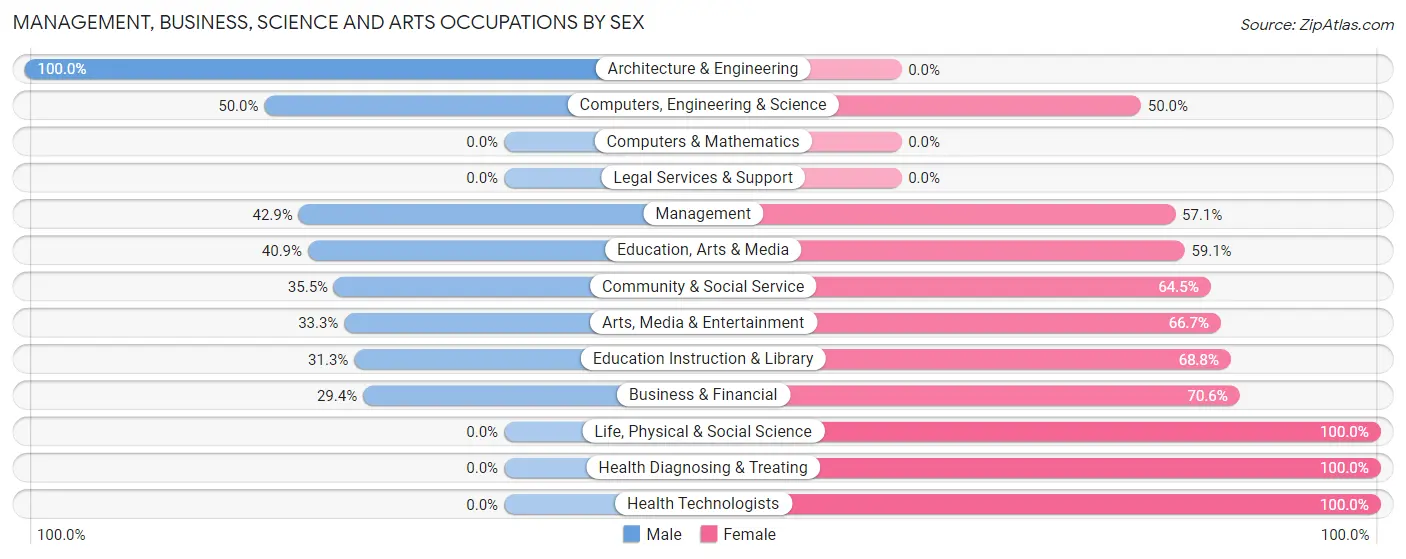
Management, Business, Science and Arts Occupations by Sex
Within the Management, Business, Science and Arts occupations in Benzonia, the most male-oriented occupations are Architecture & Engineering (100.0%), Computers, Engineering & Science (50.0%), and Management (42.9%), while the most female-oriented occupations are Life, Physical & Social Science (100.0%), Health Diagnosing & Treating (100.0%), and Health Technologists (100.0%).
| Occupation | Male | Female |
| Management | 9 (42.9%) | 12 (57.1%) |
| Business & Financial | 5 (29.4%) | 12 (70.6%) |
| Computers, Engineering & Science | 3 (50.0%) | 3 (50.0%) |
| Computers & Mathematics | 0 (0.0%) | 0 (0.0%) |
| Architecture & Engineering | 3 (100.0%) | 0 (0.0%) |
| Life, Physical & Social Science | 0 (0.0%) | 3 (100.0%) |
| Community & Social Service | 22 (35.5%) | 40 (64.5%) |
| Education, Arts & Media | 9 (40.9%) | 13 (59.1%) |
| Legal Services & Support | 0 (0.0%) | 0 (0.0%) |
| Education Instruction & Library | 5 (31.2%) | 11 (68.8%) |
| Arts, Media & Entertainment | 8 (33.3%) | 16 (66.7%) |
| Health Diagnosing & Treating | 0 (0.0%) | 3 (100.0%) |
| Health Technologists | 0 (0.0%) | 3 (100.0%) |
| Total (Category) | 39 (35.8%) | 70 (64.2%) |
| Total (Overall) | 145 (44.2%) | 183 (55.8%) |
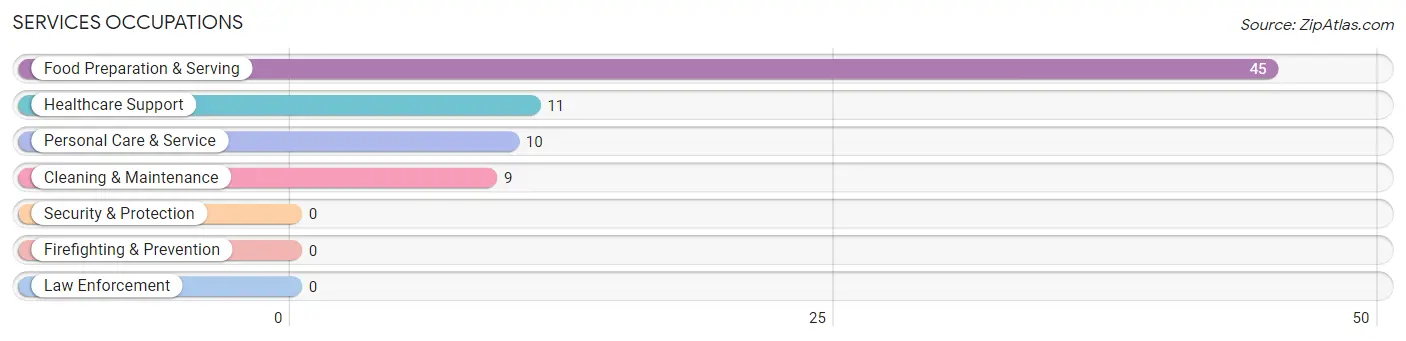
Services Occupations
The most common Services occupations in Benzonia are Food Preparation & Serving (45 | 13.7%), Healthcare Support (11 | 3.4%), Personal Care & Service (10 | 3.0%), and Cleaning & Maintenance (9 | 2.7%).
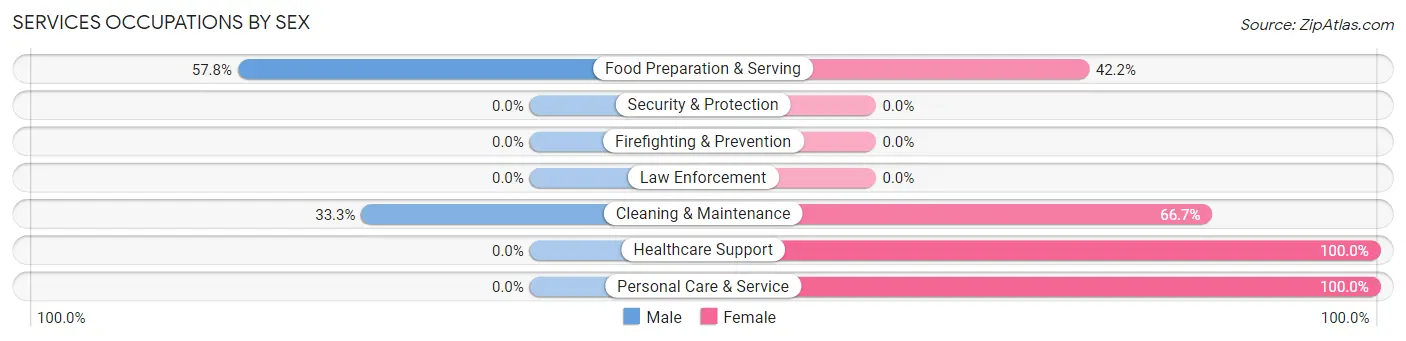
Services Occupations by Sex
Within the Services occupations in Benzonia, the most male-oriented occupations are Food Preparation & Serving (57.8%), and Cleaning & Maintenance (33.3%), while the most female-oriented occupations are Healthcare Support (100.0%), Personal Care & Service (100.0%), and Cleaning & Maintenance (66.7%).
| Occupation | Male | Female |
| Healthcare Support | 0 (0.0%) | 11 (100.0%) |
| Security & Protection | 0 (0.0%) | 0 (0.0%) |
| Firefighting & Prevention | 0 (0.0%) | 0 (0.0%) |
| Law Enforcement | 0 (0.0%) | 0 (0.0%) |
| Food Preparation & Serving | 26 (57.8%) | 19 (42.2%) |
| Cleaning & Maintenance | 3 (33.3%) | 6 (66.7%) |
| Personal Care & Service | 0 (0.0%) | 10 (100.0%) |
| Total (Category) | 29 (38.7%) | 46 (61.3%) |
| Total (Overall) | 145 (44.2%) | 183 (55.8%) |
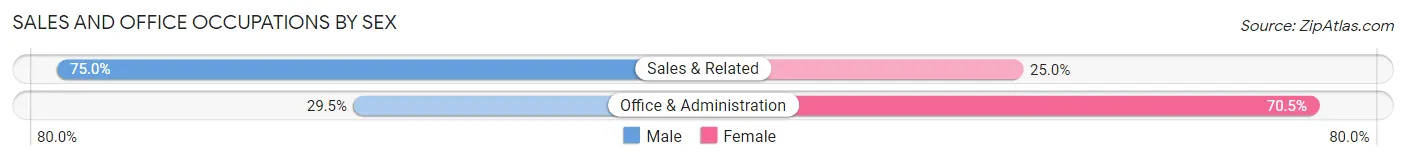
Sales and Office Occupations
The most common Sales and Office occupations in Benzonia are Office & Administration (61 | 18.6%), and Sales & Related (20 | 6.1%).

Sales and Office Occupations by Sex
| Occupation | Male | Female |
| Sales & Related | 15 (75.0%) | 5 (25.0%) |
| Office & Administration | 18 (29.5%) | 43 (70.5%) |
| Total (Category) | 33 (40.7%) | 48 (59.3%) |
| Total (Overall) | 145 (44.2%) | 183 (55.8%) |
Natural Resources, Construction and Maintenance Occupations
The most common Natural Resources, Construction and Maintenance occupations in Benzonia are , and Construction & Extraction (11 | 3.4%).
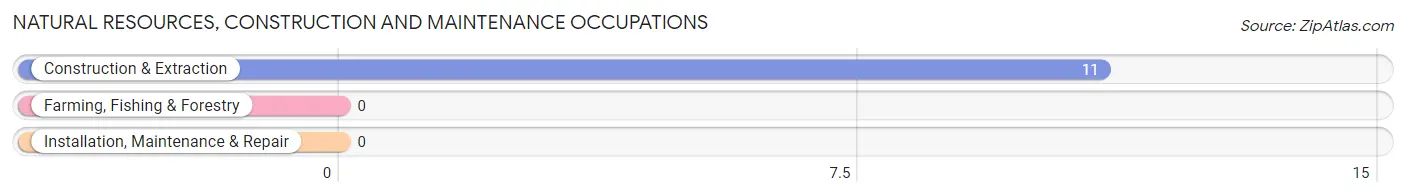
Natural Resources, Construction and Maintenance Occupations by Sex
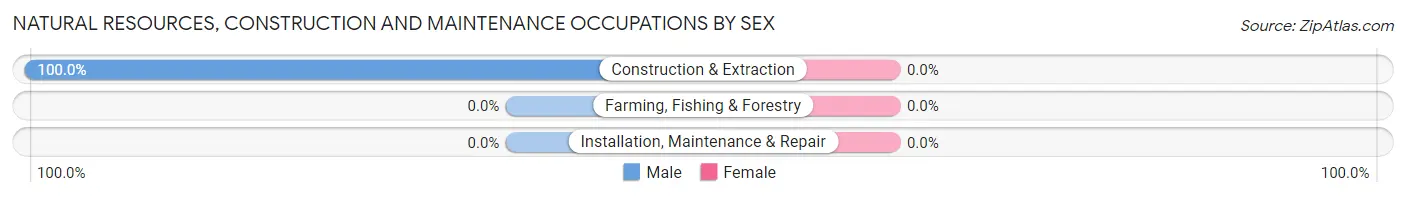
| Occupation | Male | Female |
| Farming, Fishing & Forestry | 0 (0.0%) | 0 (0.0%) |
| Construction & Extraction | 11 (100.0%) | 0 (0.0%) |
| Installation, Maintenance & Repair | 0 (0.0%) | 0 (0.0%) |
| Total (Category) | 11 (100.0%) | 0 (0.0%) |
| Total (Overall) | 145 (44.2%) | 183 (55.8%) |
Production, Transportation and Moving Occupations
The most common Production, Transportation and Moving occupations in Benzonia are Transportation (30 | 9.1%), Material Moving (18 | 5.5%), and Production (4 | 1.2%).
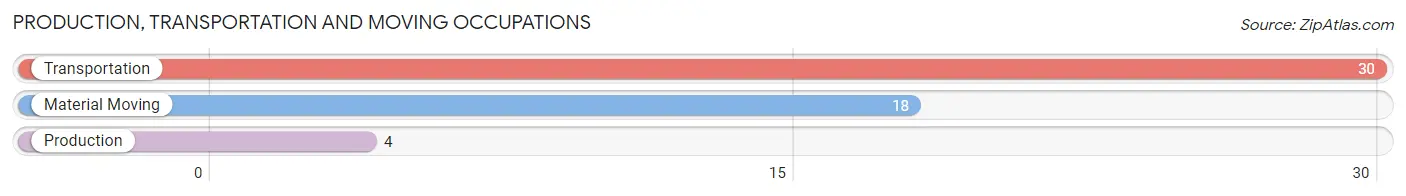
Production, Transportation and Moving Occupations by Sex
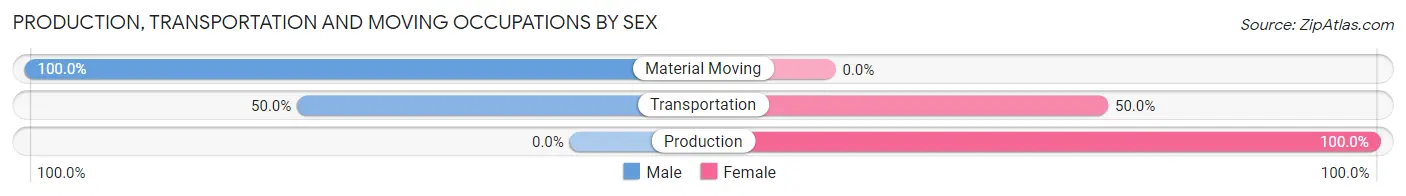
| Occupation | Male | Female |
| Production | 0 (0.0%) | 4 (100.0%) |
| Transportation | 15 (50.0%) | 15 (50.0%) |
| Material Moving | 18 (100.0%) | 0 (0.0%) |
| Total (Category) | 33 (63.5%) | 19 (36.5%) |
| Total (Overall) | 145 (44.2%) | 183 (55.8%) |
Employment Industries by Sex in Benzonia
Employment Industries in Benzonia
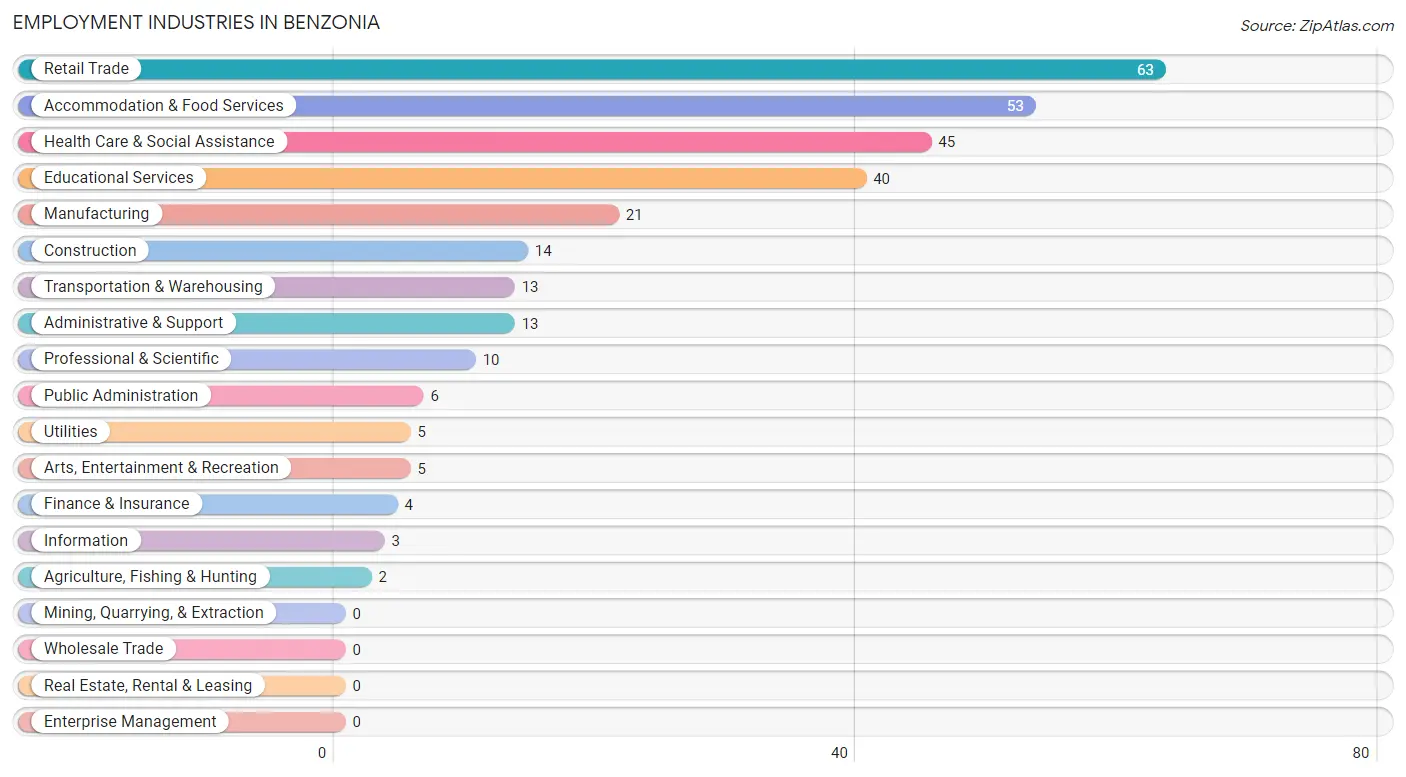
The major employment industries in Benzonia include Retail Trade (63 | 19.2%), Accommodation & Food Services (53 | 16.2%), Health Care & Social Assistance (45 | 13.7%), Educational Services (40 | 12.2%), and Manufacturing (21 | 6.4%).
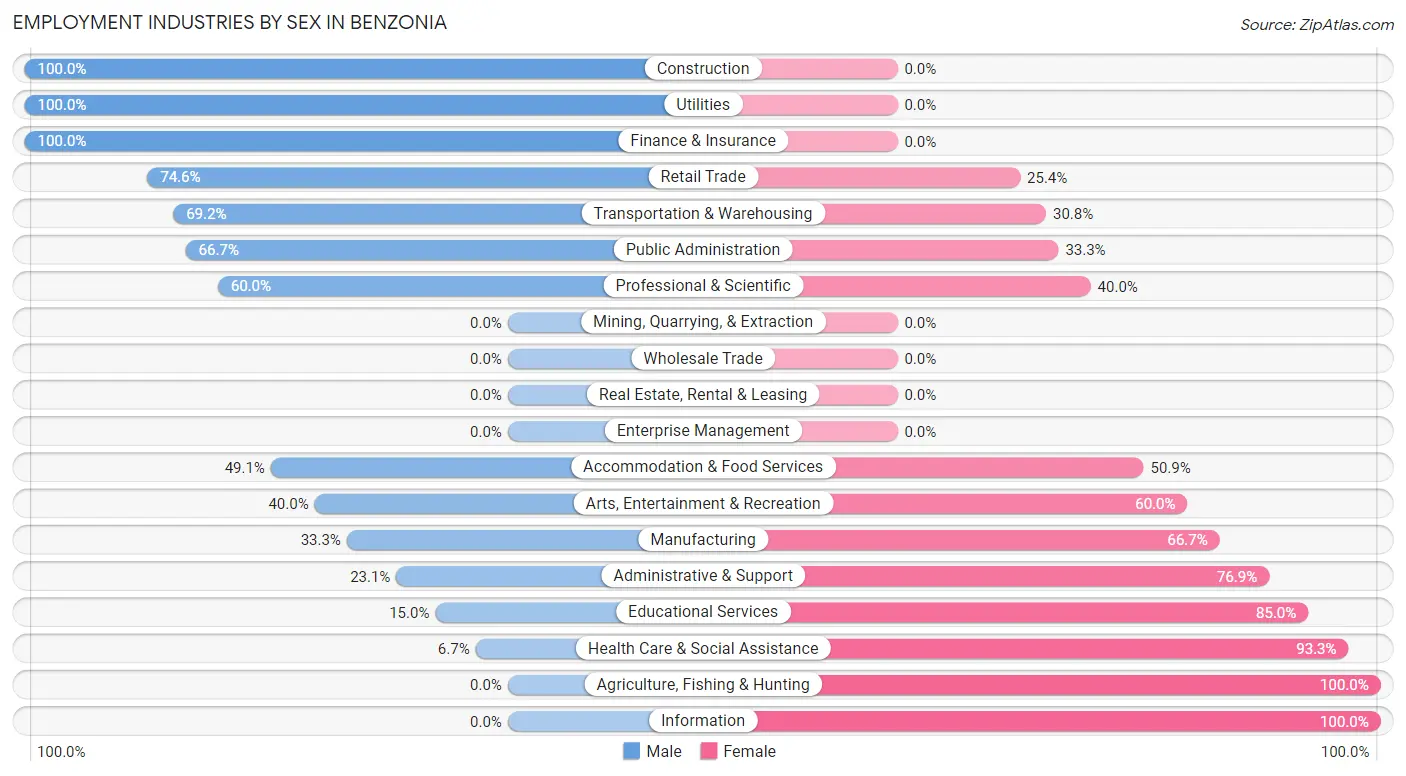
Employment Industries by Sex in Benzonia
The Benzonia industries that see more men than women are Construction (100.0%), Utilities (100.0%), and Finance & Insurance (100.0%), whereas the industries that tend to have a higher number of women are Agriculture, Fishing & Hunting (100.0%), Information (100.0%), and Health Care & Social Assistance (93.3%).
| Industry | Male | Female |
| Agriculture, Fishing & Hunting | 0 (0.0%) | 2 (100.0%) |
| Mining, Quarrying, & Extraction | 0 (0.0%) | 0 (0.0%) |
| Construction | 14 (100.0%) | 0 (0.0%) |
| Manufacturing | 7 (33.3%) | 14 (66.7%) |
| Wholesale Trade | 0 (0.0%) | 0 (0.0%) |
| Retail Trade | 47 (74.6%) | 16 (25.4%) |
| Transportation & Warehousing | 9 (69.2%) | 4 (30.8%) |
| Utilities | 5 (100.0%) | 0 (0.0%) |
| Information | 0 (0.0%) | 3 (100.0%) |
| Finance & Insurance | 4 (100.0%) | 0 (0.0%) |
| Real Estate, Rental & Leasing | 0 (0.0%) | 0 (0.0%) |
| Professional & Scientific | 6 (60.0%) | 4 (40.0%) |
| Enterprise Management | 0 (0.0%) | 0 (0.0%) |
| Administrative & Support | 3 (23.1%) | 10 (76.9%) |
| Educational Services | 6 (15.0%) | 34 (85.0%) |
| Health Care & Social Assistance | 3 (6.7%) | 42 (93.3%) |
| Arts, Entertainment & Recreation | 2 (40.0%) | 3 (60.0%) |
| Accommodation & Food Services | 26 (49.1%) | 27 (50.9%) |
| Public Administration | 4 (66.7%) | 2 (33.3%) |
| Total | 145 (44.2%) | 183 (55.8%) |
Education in Benzonia
School Enrollment in Benzonia
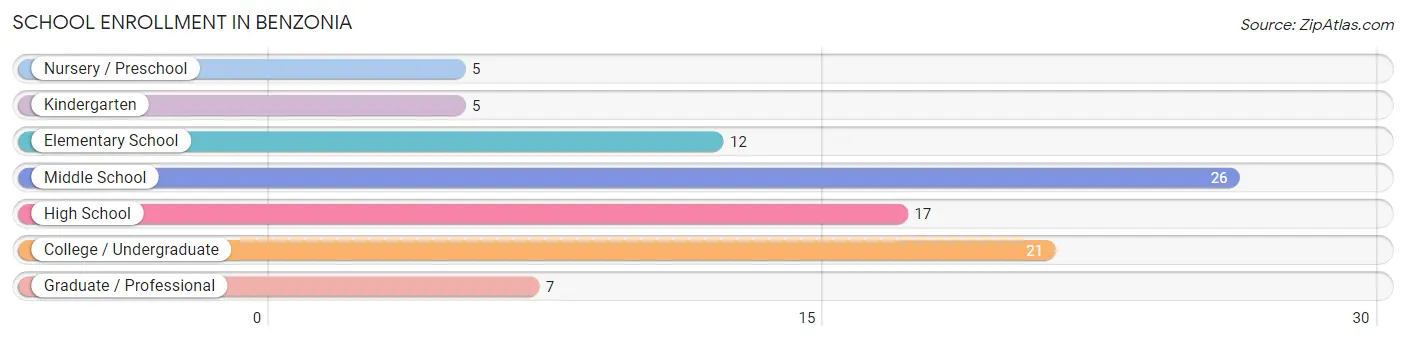
The most common levels of schooling among the 93 students in Benzonia are middle school (26 | 28.0%), college / undergraduate (21 | 22.6%), and high school (17 | 18.3%).
| School Level | # Students | % Students |
| Nursery / Preschool | 5 | 5.4% |
| Kindergarten | 5 | 5.4% |
| Elementary School | 12 | 12.9% |
| Middle School | 26 | 28.0% |
| High School | 17 | 18.3% |
| College / Undergraduate | 21 | 22.6% |
| Graduate / Professional | 7 | 7.5% |
| Total | 93 | 100.0% |
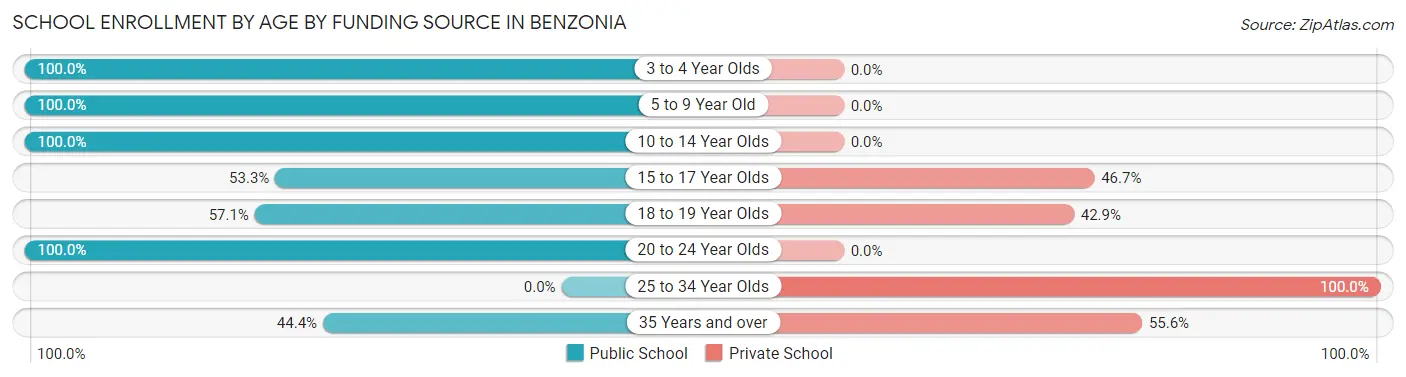
School Enrollment by Age by Funding Source in Benzonia
Out of a total of 93 students who are enrolled in schools in Benzonia, 18 (19.4%) attend a private institution, while the remaining 75 (80.6%) are enrolled in public schools. The age group of 25 to 34 year olds has the highest likelihood of being enrolled in private schools, with 3 (100.0% in the age bracket) enrolled. Conversely, the age group of 3 to 4 year olds has the lowest likelihood of being enrolled in a private school, with 5 (100.0% in the age bracket) attending a public institution.
| Age Bracket | Public School | Private School |
| 3 to 4 Year Olds | 5 (100.0%) | 0 (0.0%) |
| 5 to 9 Year Old | 18 (100.0%) | 0 (0.0%) |
| 10 to 14 Year Olds | 25 (100.0%) | 0 (0.0%) |
| 15 to 17 Year Olds | 8 (53.3%) | 7 (46.7%) |
| 18 to 19 Year Olds | 4 (57.1%) | 3 (42.9%) |
| 20 to 24 Year Olds | 11 (100.0%) | 0 (0.0%) |
| 25 to 34 Year Olds | 0 (0.0%) | 3 (100.0%) |
| 35 Years and over | 4 (44.4%) | 5 (55.6%) |
| Total | 75 (80.6%) | 18 (19.4%) |
Educational Attainment by Field of Study in Benzonia
Visual & performing arts (37 | 19.0%), education (27 | 13.9%), business (25 | 12.8%), liberal arts & history (21 | 10.8%), and bio, nature & agricultural (17 | 8.7%) are the most common fields of study among 195 individuals in Benzonia who have obtained a bachelor's degree or higher.
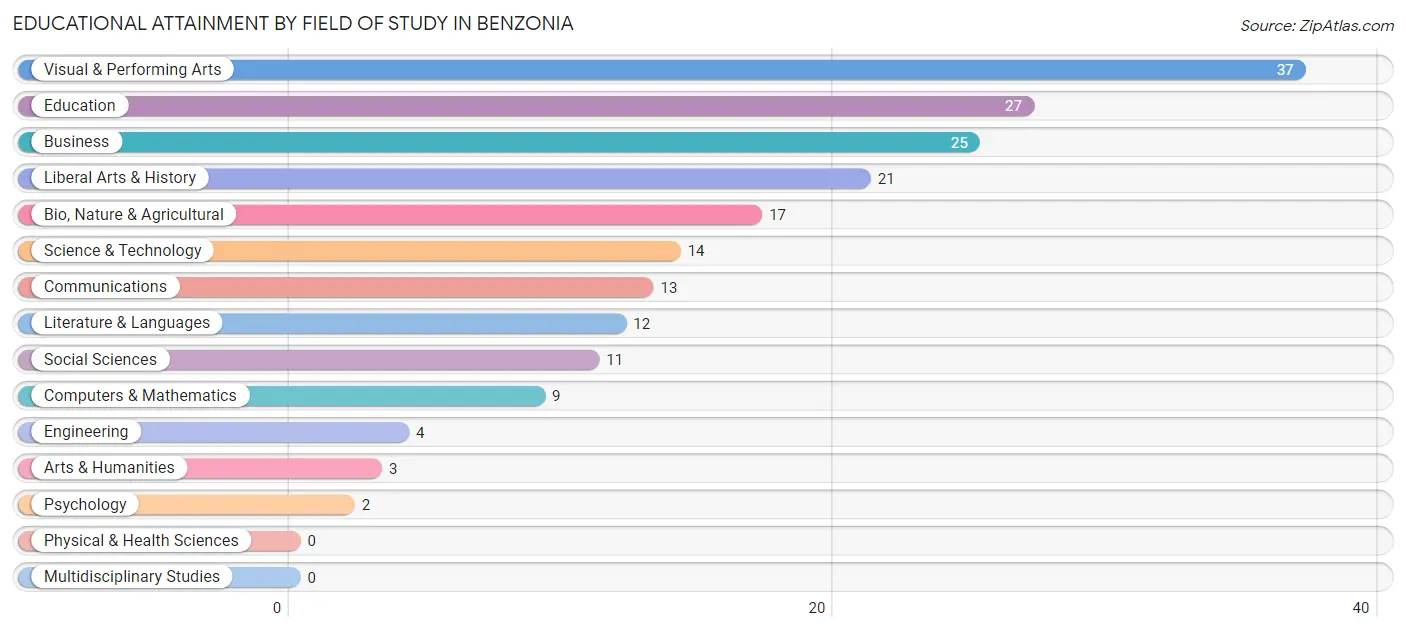
| Field of Study | # Graduates | % Graduates |
| Computers & Mathematics | 9 | 4.6% |
| Bio, Nature & Agricultural | 17 | 8.7% |
| Physical & Health Sciences | 0 | 0.0% |
| Psychology | 2 | 1.0% |
| Social Sciences | 11 | 5.6% |
| Engineering | 4 | 2.1% |
| Multidisciplinary Studies | 0 | 0.0% |
| Science & Technology | 14 | 7.2% |
| Business | 25 | 12.8% |
| Education | 27 | 13.9% |
| Literature & Languages | 12 | 6.1% |
| Liberal Arts & History | 21 | 10.8% |
| Visual & Performing Arts | 37 | 19.0% |
| Communications | 13 | 6.7% |
| Arts & Humanities | 3 | 1.5% |
| Total | 195 | 100.0% |
Transportation & Commute in Benzonia
Vehicle Availability by Sex in Benzonia
The most prevalent vehicle ownership categories in Benzonia are males with 2 vehicles (62, accounting for 44.6%) and females with 2 vehicles (70, making up 33.9%).
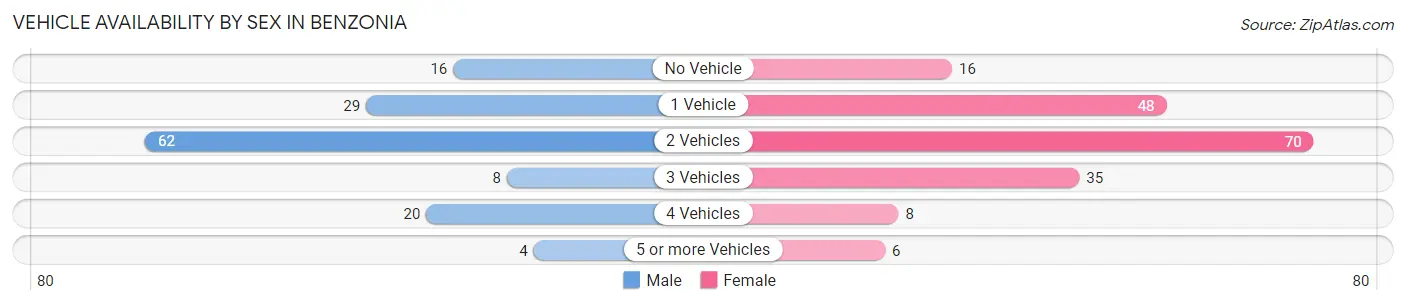
| Vehicles Available | Male | Female |
| No Vehicle | 16 (11.5%) | 16 (8.7%) |
| 1 Vehicle | 29 (20.9%) | 48 (26.2%) |
| 2 Vehicles | 62 (44.6%) | 70 (38.3%) |
| 3 Vehicles | 8 (5.8%) | 35 (19.1%) |
| 4 Vehicles | 20 (14.4%) | 8 (4.4%) |
| 5 or more Vehicles | 4 (2.9%) | 6 (3.3%) |
| Total | 139 (100.0%) | 183 (100.0%) |
Commute Time in Benzonia
The most frequently occuring commute durations in Benzonia are 10 to 14 minutes (49 commuters, 17.4%), 15 to 19 minutes (40 commuters, 14.2%), and 5 to 9 minutes (36 commuters, 12.8%).
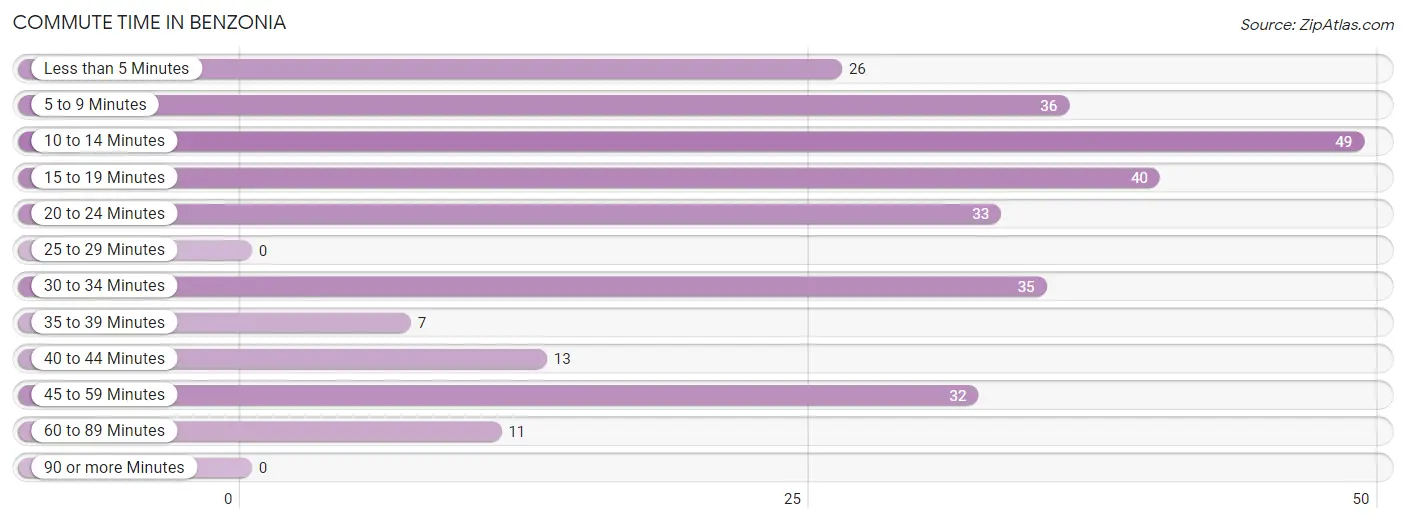
| Commute Time | # Commuters | % Commuters |
| Less than 5 Minutes | 26 | 9.2% |
| 5 to 9 Minutes | 36 | 12.8% |
| 10 to 14 Minutes | 49 | 17.4% |
| 15 to 19 Minutes | 40 | 14.2% |
| 20 to 24 Minutes | 33 | 11.7% |
| 25 to 29 Minutes | 0 | 0.0% |
| 30 to 34 Minutes | 35 | 12.4% |
| 35 to 39 Minutes | 7 | 2.5% |
| 40 to 44 Minutes | 13 | 4.6% |
| 45 to 59 Minutes | 32 | 11.4% |
| 60 to 89 Minutes | 11 | 3.9% |
| 90 or more Minutes | 0 | 0.0% |
Commute Time by Sex in Benzonia
The most common commute times in Benzonia are 10 to 14 minutes (31 commuters, 26.1%) for males and 30 to 34 minutes (27 commuters, 16.6%) for females.
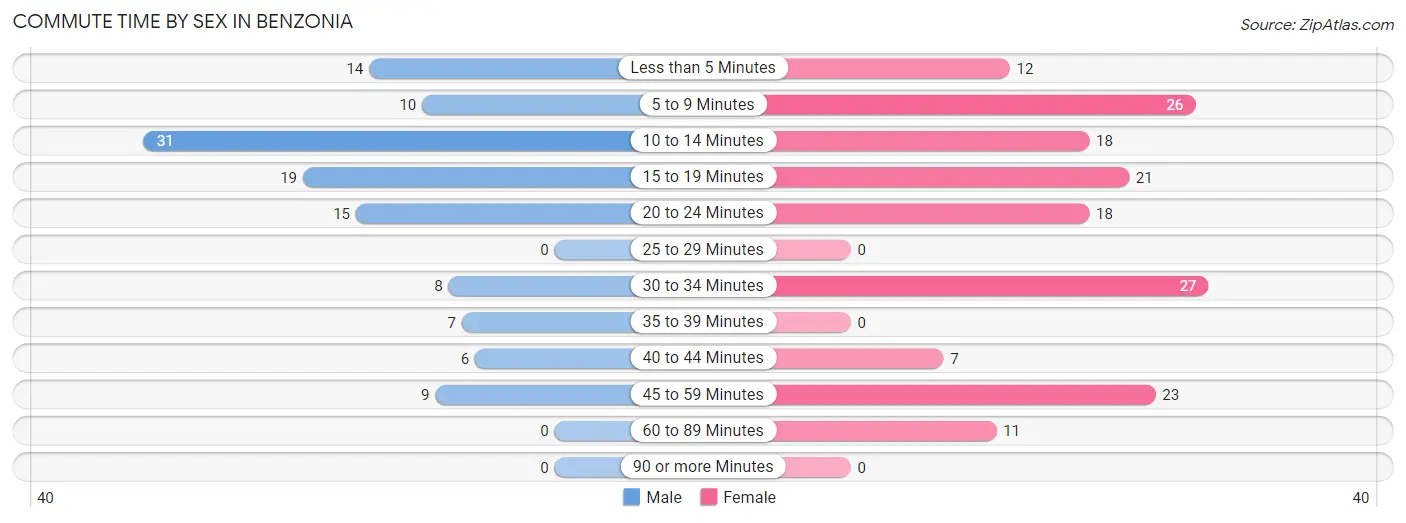
| Commute Time | Male | Female |
| Less than 5 Minutes | 14 (11.8%) | 12 (7.4%) |
| 5 to 9 Minutes | 10 (8.4%) | 26 (16.0%) |
| 10 to 14 Minutes | 31 (26.1%) | 18 (11.0%) |
| 15 to 19 Minutes | 19 (16.0%) | 21 (12.9%) |
| 20 to 24 Minutes | 15 (12.6%) | 18 (11.0%) |
| 25 to 29 Minutes | 0 (0.0%) | 0 (0.0%) |
| 30 to 34 Minutes | 8 (6.7%) | 27 (16.6%) |
| 35 to 39 Minutes | 7 (5.9%) | 0 (0.0%) |
| 40 to 44 Minutes | 6 (5.0%) | 7 (4.3%) |
| 45 to 59 Minutes | 9 (7.6%) | 23 (14.1%) |
| 60 to 89 Minutes | 0 (0.0%) | 11 (6.8%) |
| 90 or more Minutes | 0 (0.0%) | 0 (0.0%) |
Time of Departure to Work by Sex in Benzonia
The most frequent times of departure to work in Benzonia are 12:00 PM to 3:59 PM (22, 18.5%) for males and 7:00 AM to 7:29 AM (50, 30.7%) for females.
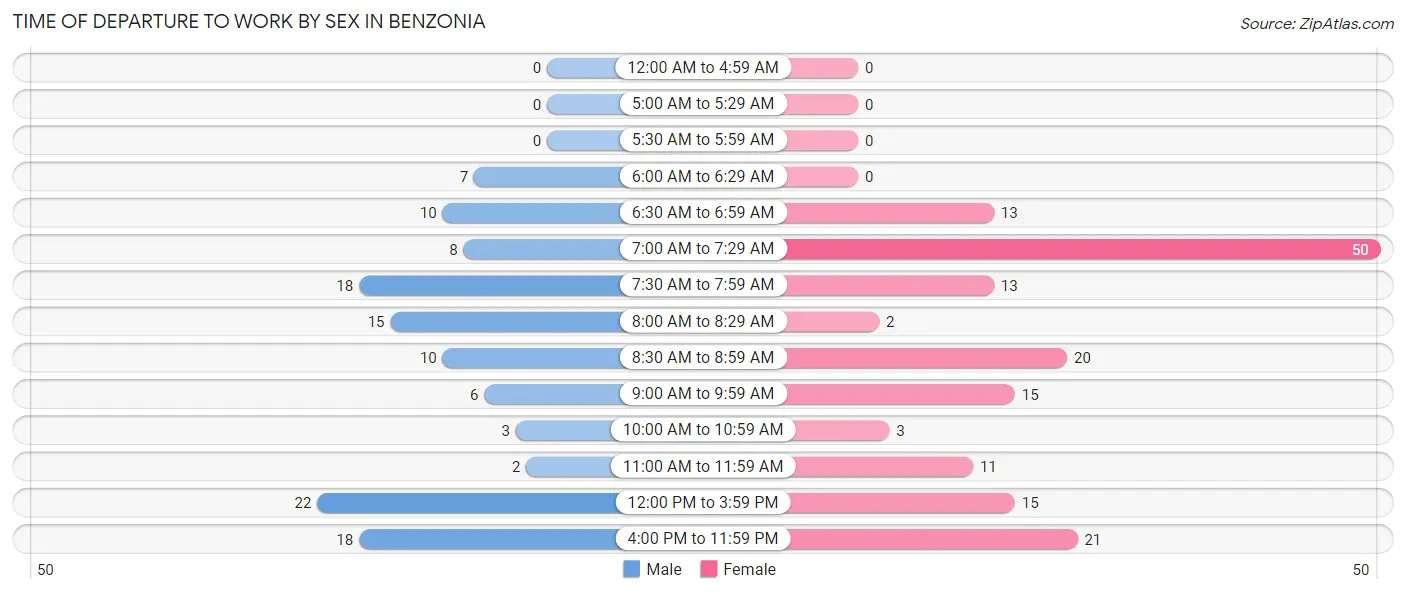
| Time of Departure | Male | Female |
| 12:00 AM to 4:59 AM | 0 (0.0%) | 0 (0.0%) |
| 5:00 AM to 5:29 AM | 0 (0.0%) | 0 (0.0%) |
| 5:30 AM to 5:59 AM | 0 (0.0%) | 0 (0.0%) |
| 6:00 AM to 6:29 AM | 7 (5.9%) | 0 (0.0%) |
| 6:30 AM to 6:59 AM | 10 (8.4%) | 13 (8.0%) |
| 7:00 AM to 7:29 AM | 8 (6.7%) | 50 (30.7%) |
| 7:30 AM to 7:59 AM | 18 (15.1%) | 13 (8.0%) |
| 8:00 AM to 8:29 AM | 15 (12.6%) | 2 (1.2%) |
| 8:30 AM to 8:59 AM | 10 (8.4%) | 20 (12.3%) |
| 9:00 AM to 9:59 AM | 6 (5.0%) | 15 (9.2%) |
| 10:00 AM to 10:59 AM | 3 (2.5%) | 3 (1.8%) |
| 11:00 AM to 11:59 AM | 2 (1.7%) | 11 (6.8%) |
| 12:00 PM to 3:59 PM | 22 (18.5%) | 15 (9.2%) |
| 4:00 PM to 11:59 PM | 18 (15.1%) | 21 (12.9%) |
| Total | 119 (100.0%) | 163 (100.0%) |
Housing Occupancy in Benzonia
Occupancy by Ownership in Benzonia
Of the total 257 dwellings in Benzonia, owner-occupied units account for 223 (86.8%), while renter-occupied units make up 34 (13.2%).
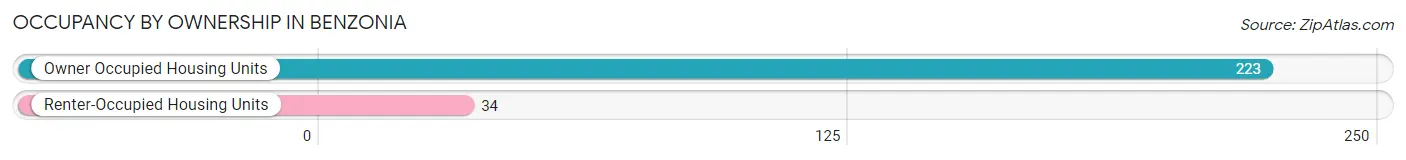
| Occupancy | # Housing Units | % Housing Units |
| Owner Occupied Housing Units | 223 | 86.8% |
| Renter-Occupied Housing Units | 34 | 13.2% |
| Total Occupied Housing Units | 257 | 100.0% |
Occupancy by Household Size in Benzonia
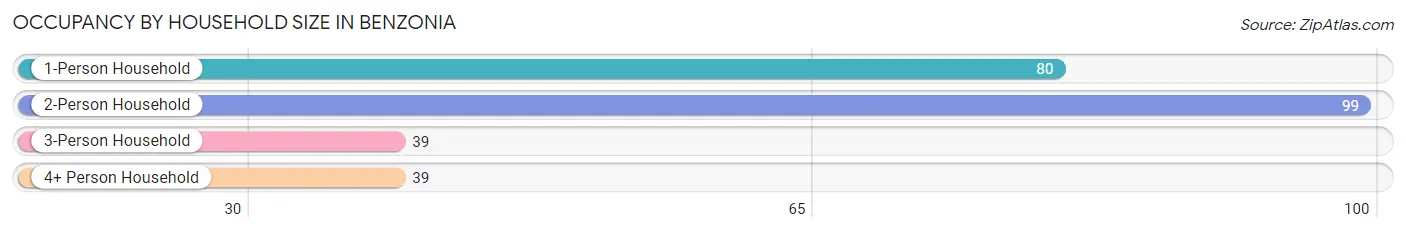
| Household Size | # Housing Units | % Housing Units |
| 1-Person Household | 80 | 31.1% |
| 2-Person Household | 99 | 38.5% |
| 3-Person Household | 39 | 15.2% |
| 4+ Person Household | 39 | 15.2% |
| Total Housing Units | 257 | 100.0% |
Occupancy by Ownership by Household Size in Benzonia
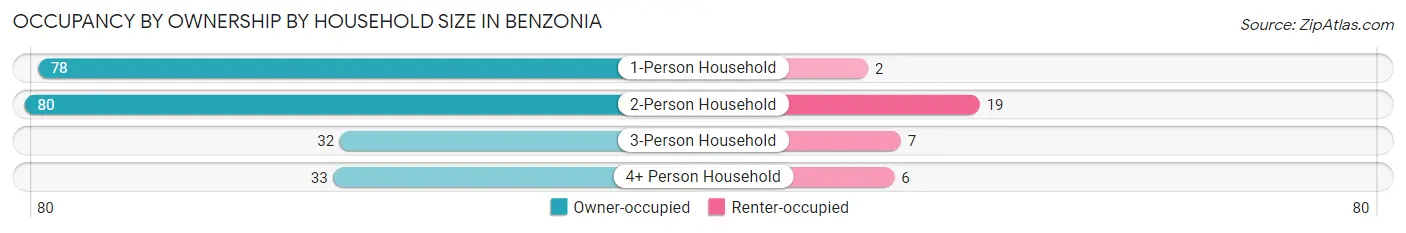
| Household Size | Owner-occupied | Renter-occupied |
| 1-Person Household | 78 (97.5%) | 2 (2.5%) |
| 2-Person Household | 80 (80.8%) | 19 (19.2%) |
| 3-Person Household | 32 (82.1%) | 7 (17.9%) |
| 4+ Person Household | 33 (84.6%) | 6 (15.4%) |
| Total Housing Units | 223 (86.8%) | 34 (13.2%) |
Occupancy by Educational Attainment in Benzonia
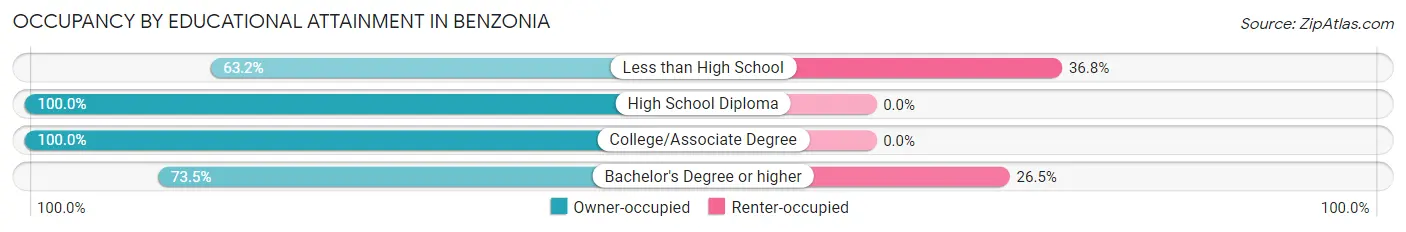
| Household Size | Owner-occupied | Renter-occupied |
| Less than High School | 12 (63.2%) | 7 (36.8%) |
| High School Diploma | 57 (100.0%) | 0 (0.0%) |
| College/Associate Degree | 79 (100.0%) | 0 (0.0%) |
| Bachelor's Degree or higher | 75 (73.5%) | 27 (26.5%) |
Occupancy by Age of Householder in Benzonia
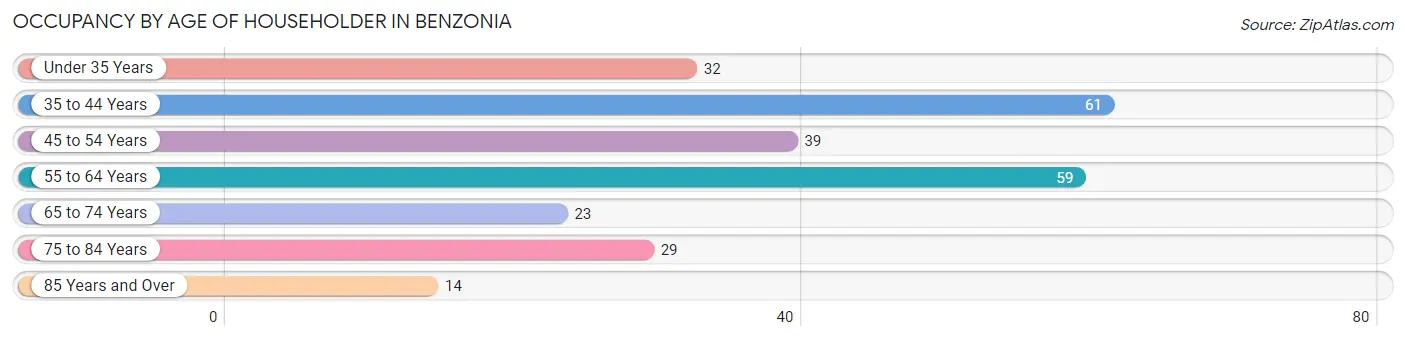
| Age Bracket | # Households | % Households |
| Under 35 Years | 32 | 12.4% |
| 35 to 44 Years | 61 | 23.7% |
| 45 to 54 Years | 39 | 15.2% |
| 55 to 64 Years | 59 | 23.0% |
| 65 to 74 Years | 23 | 8.9% |
| 75 to 84 Years | 29 | 11.3% |
| 85 Years and Over | 14 | 5.4% |
| Total | 257 | 100.0% |
Housing Finances in Benzonia
Median Income by Occupancy in Benzonia
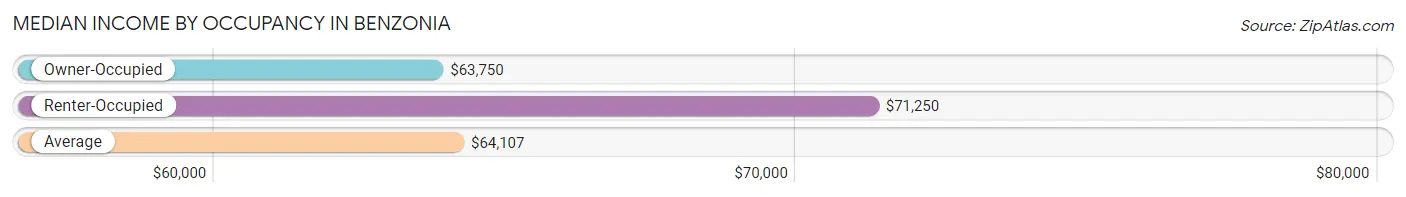
| Occupancy Type | # Households | Median Income |
| Owner-Occupied | 223 (86.8%) | $63,750 |
| Renter-Occupied | 34 (13.2%) | $71,250 |
| Average | 257 (100.0%) | $64,107 |
Occupancy by Householder Income Bracket in Benzonia
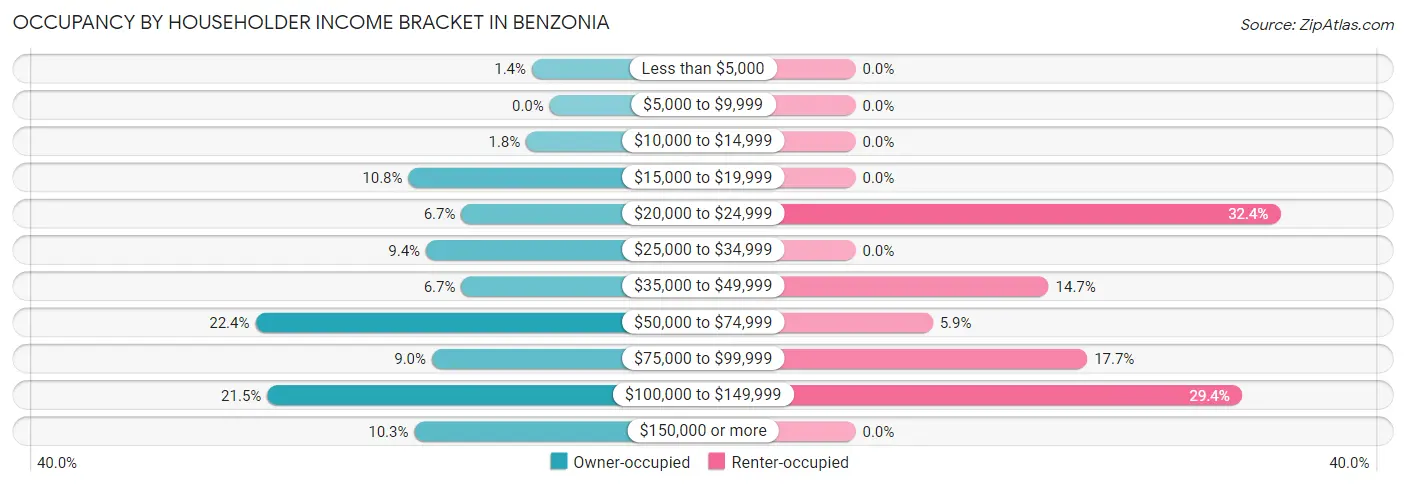
| Income Bracket | Owner-occupied | Renter-occupied |
| Less than $5,000 | 3 (1.3%) | 0 (0.0%) |
| $5,000 to $9,999 | 0 (0.0%) | 0 (0.0%) |
| $10,000 to $14,999 | 4 (1.8%) | 0 (0.0%) |
| $15,000 to $19,999 | 24 (10.8%) | 0 (0.0%) |
| $20,000 to $24,999 | 15 (6.7%) | 11 (32.4%) |
| $25,000 to $34,999 | 21 (9.4%) | 0 (0.0%) |
| $35,000 to $49,999 | 15 (6.7%) | 5 (14.7%) |
| $50,000 to $74,999 | 50 (22.4%) | 2 (5.9%) |
| $75,000 to $99,999 | 20 (9.0%) | 6 (17.6%) |
| $100,000 to $149,999 | 48 (21.5%) | 10 (29.4%) |
| $150,000 or more | 23 (10.3%) | 0 (0.0%) |
| Total | 223 (100.0%) | 34 (100.0%) |
Monthly Housing Cost Tiers in Benzonia
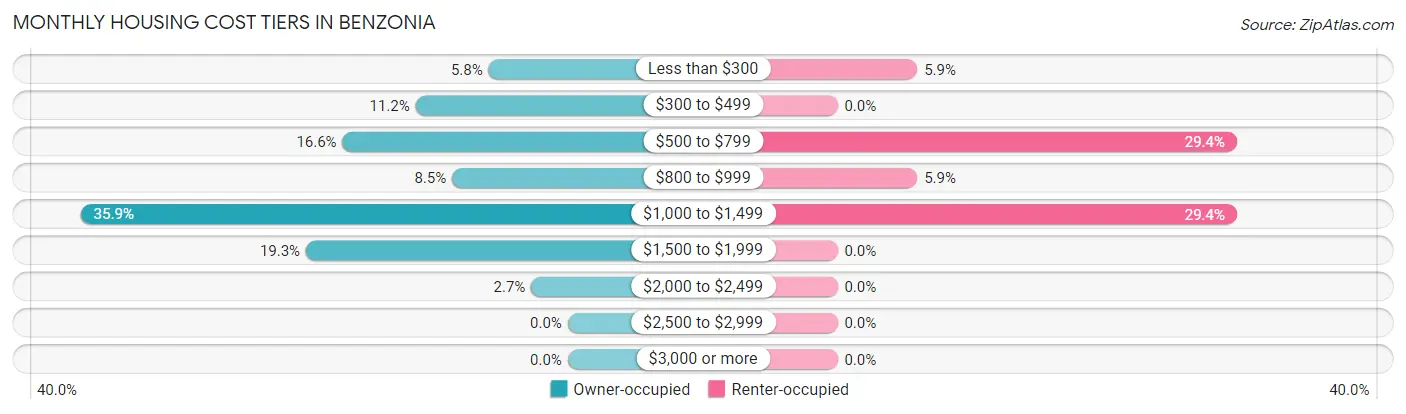
| Monthly Cost | Owner-occupied | Renter-occupied |
| Less than $300 | 13 (5.8%) | 2 (5.9%) |
| $300 to $499 | 25 (11.2%) | 0 (0.0%) |
| $500 to $799 | 37 (16.6%) | 10 (29.4%) |
| $800 to $999 | 19 (8.5%) | 2 (5.9%) |
| $1,000 to $1,499 | 80 (35.9%) | 10 (29.4%) |
| $1,500 to $1,999 | 43 (19.3%) | 0 (0.0%) |
| $2,000 to $2,499 | 6 (2.7%) | 0 (0.0%) |
| $2,500 to $2,999 | 0 (0.0%) | 0 (0.0%) |
| $3,000 or more | 0 (0.0%) | 0 (0.0%) |
| Total | 223 (100.0%) | 34 (100.0%) |
Physical Housing Characteristics in Benzonia
Housing Structures in Benzonia
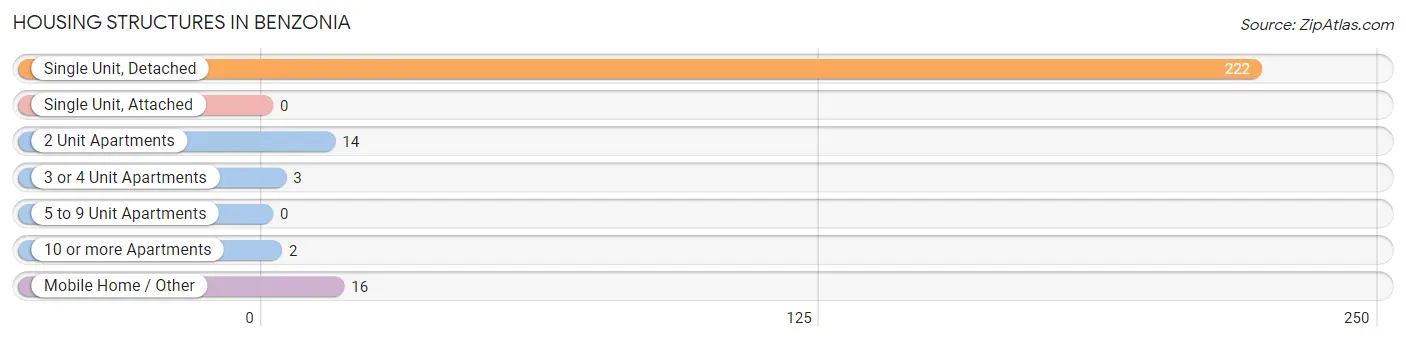
| Structure Type | # Housing Units | % Housing Units |
| Single Unit, Detached | 222 | 86.4% |
| Single Unit, Attached | 0 | 0.0% |
| 2 Unit Apartments | 14 | 5.4% |
| 3 or 4 Unit Apartments | 3 | 1.2% |
| 5 to 9 Unit Apartments | 0 | 0.0% |
| 10 or more Apartments | 2 | 0.8% |
| Mobile Home / Other | 16 | 6.2% |
| Total | 257 | 100.0% |
Housing Structures by Occupancy in Benzonia
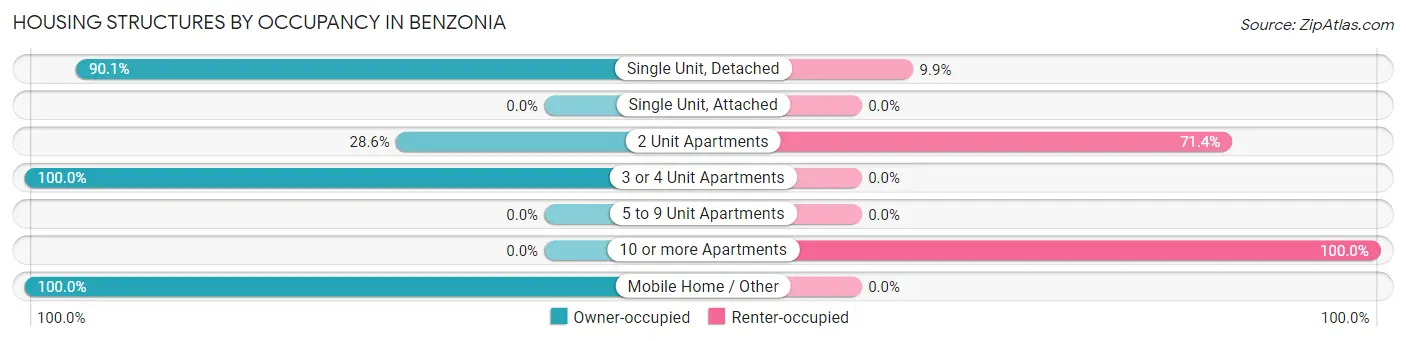
| Structure Type | Owner-occupied | Renter-occupied |
| Single Unit, Detached | 200 (90.1%) | 22 (9.9%) |
| Single Unit, Attached | 0 (0.0%) | 0 (0.0%) |
| 2 Unit Apartments | 4 (28.6%) | 10 (71.4%) |
| 3 or 4 Unit Apartments | 3 (100.0%) | 0 (0.0%) |
| 5 to 9 Unit Apartments | 0 (0.0%) | 0 (0.0%) |
| 10 or more Apartments | 0 (0.0%) | 2 (100.0%) |
| Mobile Home / Other | 16 (100.0%) | 0 (0.0%) |
| Total | 223 (86.8%) | 34 (13.2%) |
Housing Structures by Number of Rooms in Benzonia
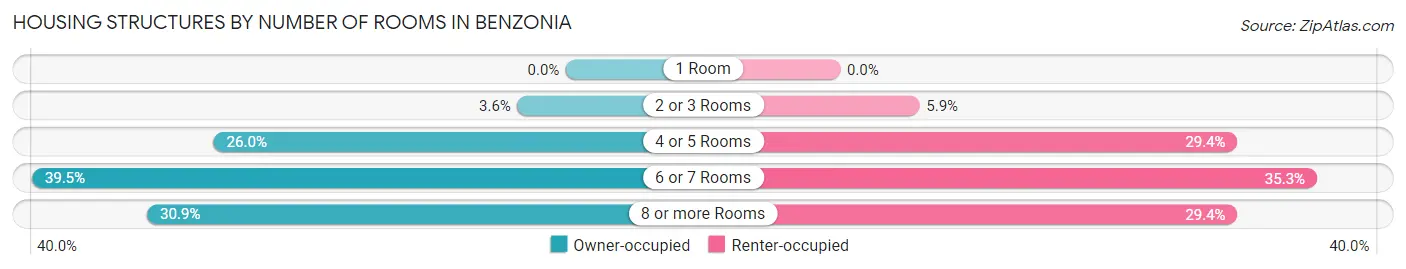
| Number of Rooms | Owner-occupied | Renter-occupied |
| 1 Room | 0 (0.0%) | 0 (0.0%) |
| 2 or 3 Rooms | 8 (3.6%) | 2 (5.9%) |
| 4 or 5 Rooms | 58 (26.0%) | 10 (29.4%) |
| 6 or 7 Rooms | 88 (39.5%) | 12 (35.3%) |
| 8 or more Rooms | 69 (30.9%) | 10 (29.4%) |
| Total | 223 (100.0%) | 34 (100.0%) |
Housing Structure by Heating Type in Benzonia
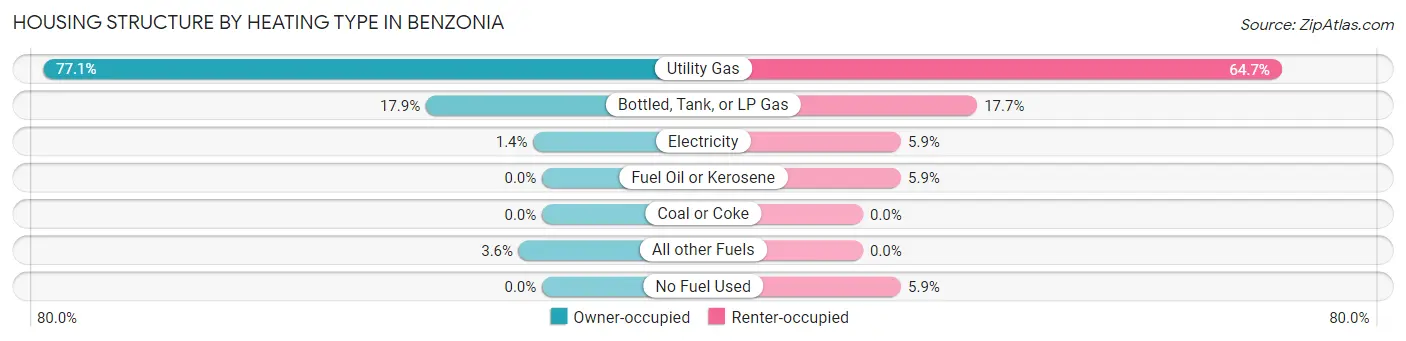
| Heating Type | Owner-occupied | Renter-occupied |
| Utility Gas | 172 (77.1%) | 22 (64.7%) |
| Bottled, Tank, or LP Gas | 40 (17.9%) | 6 (17.6%) |
| Electricity | 3 (1.3%) | 2 (5.9%) |
| Fuel Oil or Kerosene | 0 (0.0%) | 2 (5.9%) |
| Coal or Coke | 0 (0.0%) | 0 (0.0%) |
| All other Fuels | 8 (3.6%) | 0 (0.0%) |
| No Fuel Used | 0 (0.0%) | 2 (5.9%) |
| Total | 223 (100.0%) | 34 (100.0%) |
Household Vehicle Usage in Benzonia
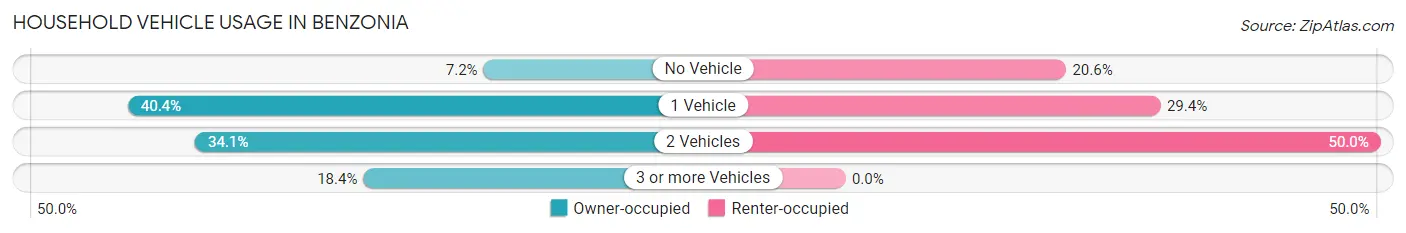
| Vehicles per Household | Owner-occupied | Renter-occupied |
| No Vehicle | 16 (7.2%) | 7 (20.6%) |
| 1 Vehicle | 90 (40.4%) | 10 (29.4%) |
| 2 Vehicles | 76 (34.1%) | 17 (50.0%) |
| 3 or more Vehicles | 41 (18.4%) | 0 (0.0%) |
| Total | 223 (100.0%) | 34 (100.0%) |
Real Estate & Mortgages in Benzonia
Real Estate and Mortgage Overview in Benzonia
| Characteristic | Without Mortgage | With Mortgage |
| Housing Units | 76 | 147 |
| Median Property Value | $155,000 | $184,900 |
| Median Household Income | $76,667 | $16 |
| Monthly Housing Costs | $500 | $0 |
| Real Estate Taxes | $1,868 | $16 |
Property Value by Mortgage Status in Benzonia
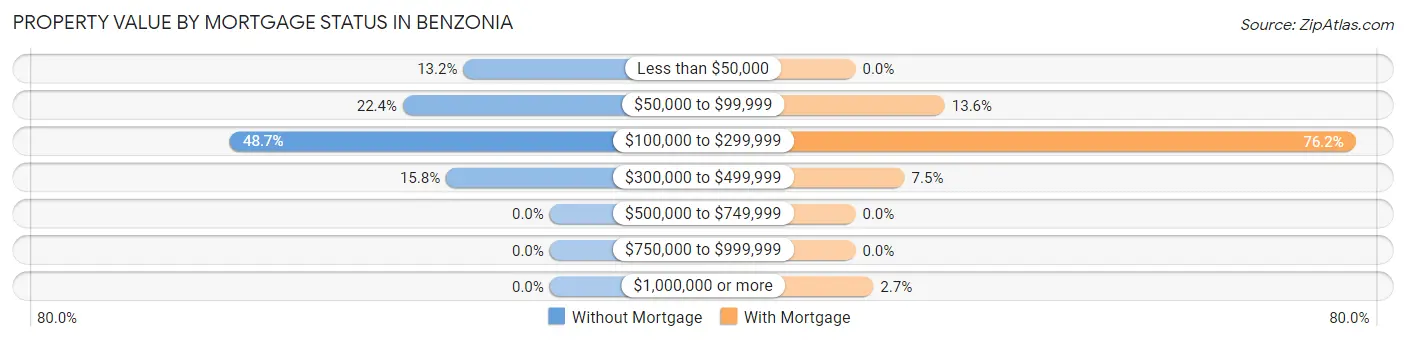
| Property Value | Without Mortgage | With Mortgage |
| Less than $50,000 | 10 (13.2%) | 0 (0.0%) |
| $50,000 to $99,999 | 17 (22.4%) | 20 (13.6%) |
| $100,000 to $299,999 | 37 (48.7%) | 112 (76.2%) |
| $300,000 to $499,999 | 12 (15.8%) | 11 (7.5%) |
| $500,000 to $749,999 | 0 (0.0%) | 0 (0.0%) |
| $750,000 to $999,999 | 0 (0.0%) | 0 (0.0%) |
| $1,000,000 or more | 0 (0.0%) | 4 (2.7%) |
| Total | 76 (100.0%) | 147 (100.0%) |
Household Income by Mortgage Status in Benzonia
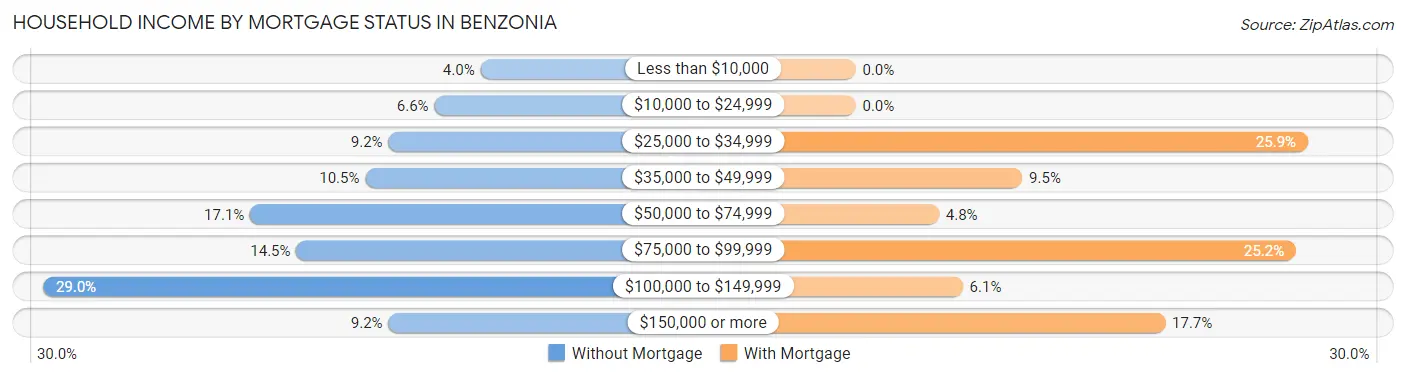
| Household Income | Without Mortgage | With Mortgage |
| Less than $10,000 | 3 (4.0%) | 0 (0.0%) |
| $10,000 to $24,999 | 5 (6.6%) | 0 (0.0%) |
| $25,000 to $34,999 | 7 (9.2%) | 38 (25.9%) |
| $35,000 to $49,999 | 8 (10.5%) | 14 (9.5%) |
| $50,000 to $74,999 | 13 (17.1%) | 7 (4.8%) |
| $75,000 to $99,999 | 11 (14.5%) | 37 (25.2%) |
| $100,000 to $149,999 | 22 (28.9%) | 9 (6.1%) |
| $150,000 or more | 7 (9.2%) | 26 (17.7%) |
| Total | 76 (100.0%) | 147 (100.0%) |
Property Value to Household Income Ratio in Benzonia
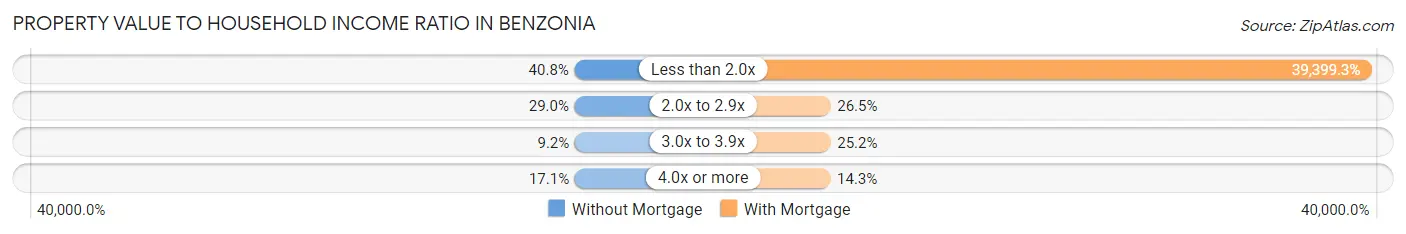
| Value-to-Income Ratio | Without Mortgage | With Mortgage |
| Less than 2.0x | 31 (40.8%) | 57,917 (39,399.3%) |
| 2.0x to 2.9x | 22 (28.9%) | 39 (26.5%) |
| 3.0x to 3.9x | 7 (9.2%) | 37 (25.2%) |
| 4.0x or more | 13 (17.1%) | 21 (14.3%) |
| Total | 76 (100.0%) | 147 (100.0%) |
Real Estate Taxes by Mortgage Status in Benzonia
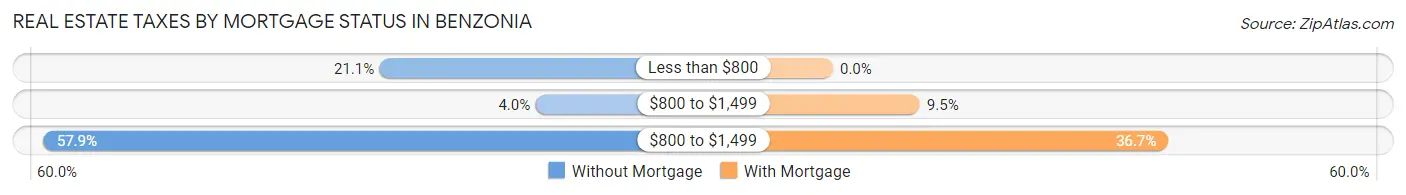
| Property Taxes | Without Mortgage | With Mortgage |
| Less than $800 | 16 (21.0%) | 0 (0.0%) |
| $800 to $1,499 | 3 (4.0%) | 14 (9.5%) |
| $800 to $1,499 | 44 (57.9%) | 54 (36.7%) |
| Total | 76 (100.0%) | 147 (100.0%) |
Health & Disability in Benzonia
Health Insurance Coverage by Age in Benzonia
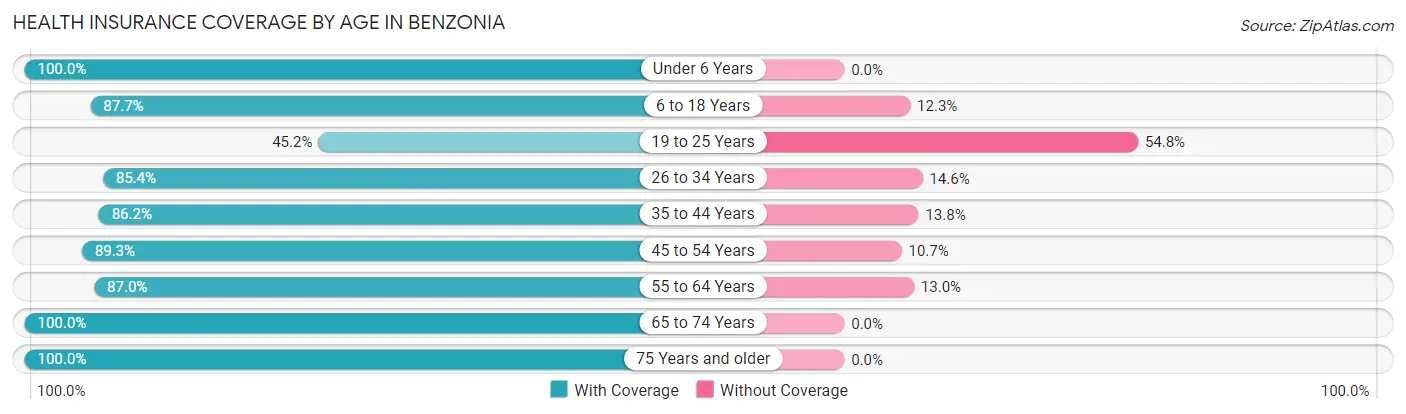
| Age Bracket | With Coverage | Without Coverage |
| Under 6 Years | 36 (100.0%) | 0 (0.0%) |
| 6 to 18 Years | 50 (87.7%) | 7 (12.3%) |
| 19 to 25 Years | 19 (45.2%) | 23 (54.8%) |
| 26 to 34 Years | 82 (85.4%) | 14 (14.6%) |
| 35 to 44 Years | 81 (86.2%) | 13 (13.8%) |
| 45 to 54 Years | 92 (89.3%) | 11 (10.7%) |
| 55 to 64 Years | 114 (87.0%) | 17 (13.0%) |
| 65 to 74 Years | 48 (100.0%) | 0 (0.0%) |
| 75 Years and older | 69 (100.0%) | 0 (0.0%) |
| Total | 591 (87.4%) | 85 (12.6%) |
Health Insurance Coverage by Citizenship Status in Benzonia
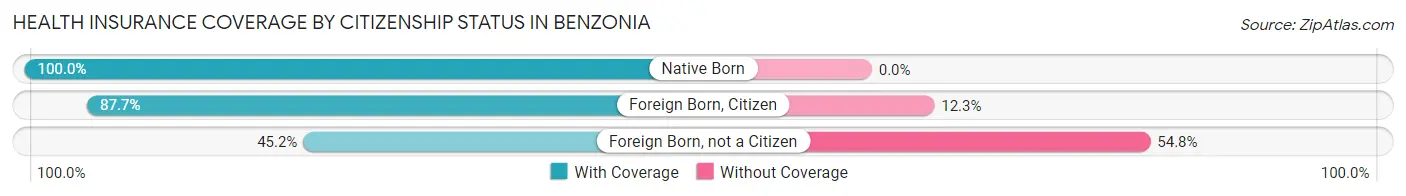
| Citizenship Status | With Coverage | Without Coverage |
| Native Born | 36 (100.0%) | 0 (0.0%) |
| Foreign Born, Citizen | 50 (87.7%) | 7 (12.3%) |
| Foreign Born, not a Citizen | 19 (45.2%) | 23 (54.8%) |
Health Insurance Coverage by Household Income in Benzonia
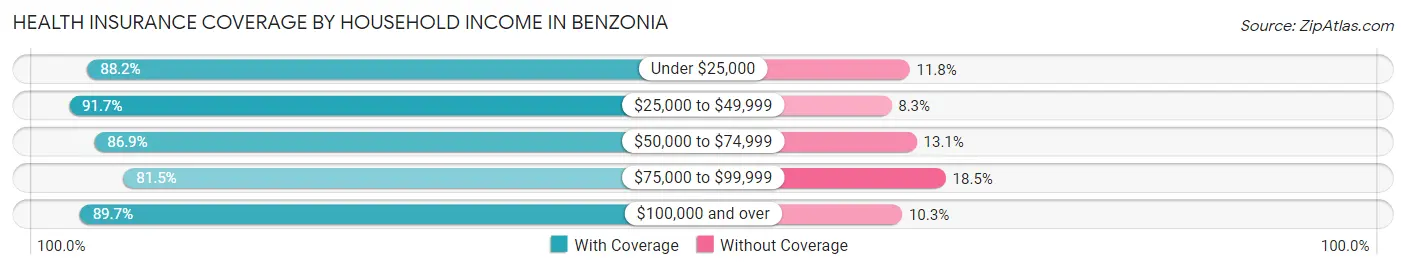
| Household Income | With Coverage | Without Coverage |
| Under $25,000 | 120 (88.2%) | 16 (11.8%) |
| $25,000 to $49,999 | 66 (91.7%) | 6 (8.3%) |
| $50,000 to $74,999 | 113 (86.9%) | 17 (13.1%) |
| $75,000 to $99,999 | 110 (81.5%) | 25 (18.5%) |
| $100,000 and over | 182 (89.7%) | 21 (10.3%) |
Public vs Private Health Insurance Coverage by Age in Benzonia
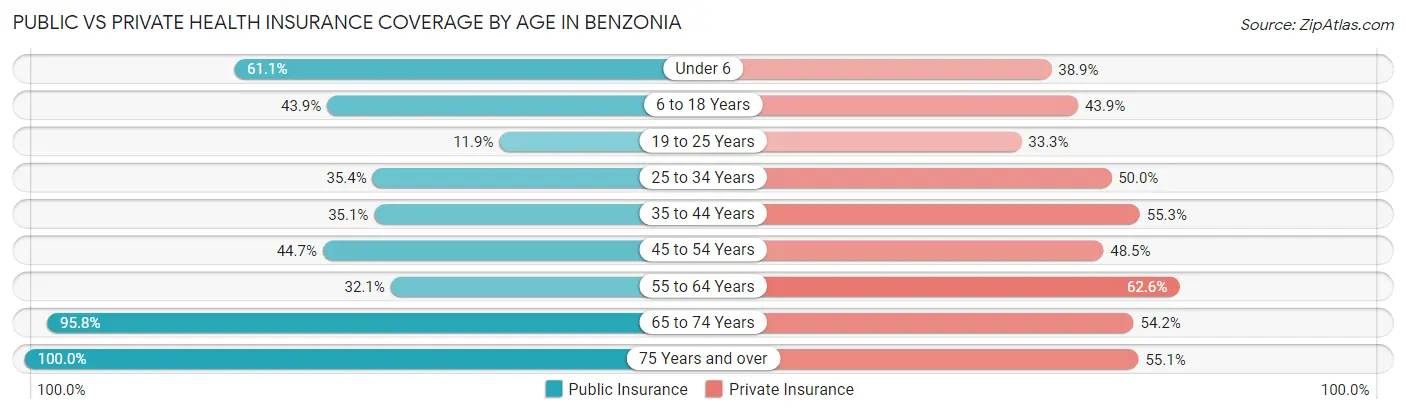
| Age Bracket | Public Insurance | Private Insurance |
| Under 6 | 22 (61.1%) | 14 (38.9%) |
| 6 to 18 Years | 25 (43.9%) | 25 (43.9%) |
| 19 to 25 Years | 5 (11.9%) | 14 (33.3%) |
| 25 to 34 Years | 34 (35.4%) | 48 (50.0%) |
| 35 to 44 Years | 33 (35.1%) | 52 (55.3%) |
| 45 to 54 Years | 46 (44.7%) | 50 (48.5%) |
| 55 to 64 Years | 42 (32.1%) | 82 (62.6%) |
| 65 to 74 Years | 46 (95.8%) | 26 (54.2%) |
| 75 Years and over | 69 (100.0%) | 38 (55.1%) |
| Total | 322 (47.6%) | 349 (51.6%) |
Disability Status by Sex by Age in Benzonia
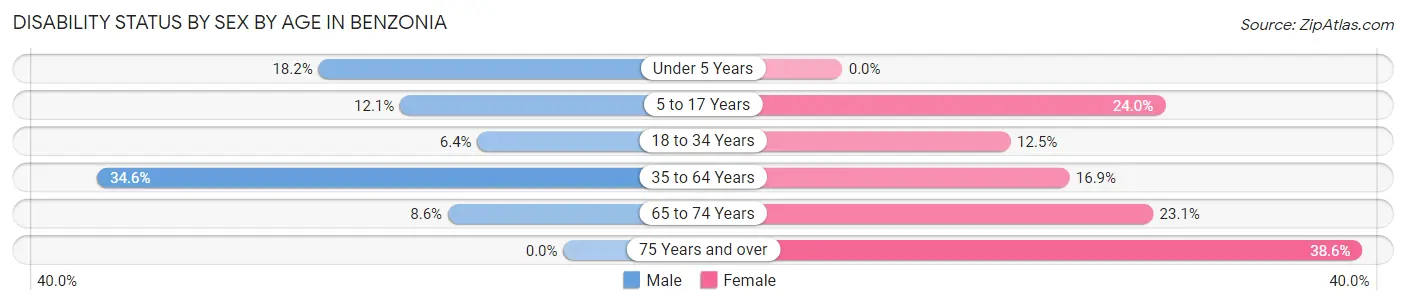
| Age Bracket | Male | Female |
| Under 5 Years | 4 (18.2%) | 0 (0.0%) |
| 5 to 17 Years | 4 (12.1%) | 6 (24.0%) |
| 18 to 34 Years | 6 (6.4%) | 6 (12.5%) |
| 35 to 64 Years | 54 (34.6%) | 29 (16.9%) |
| 65 to 74 Years | 3 (8.6%) | 3 (23.1%) |
| 75 Years and over | 0 (0.0%) | 17 (38.6%) |
Disability Class by Sex by Age in Benzonia
Disability Class: Hearing Difficulty
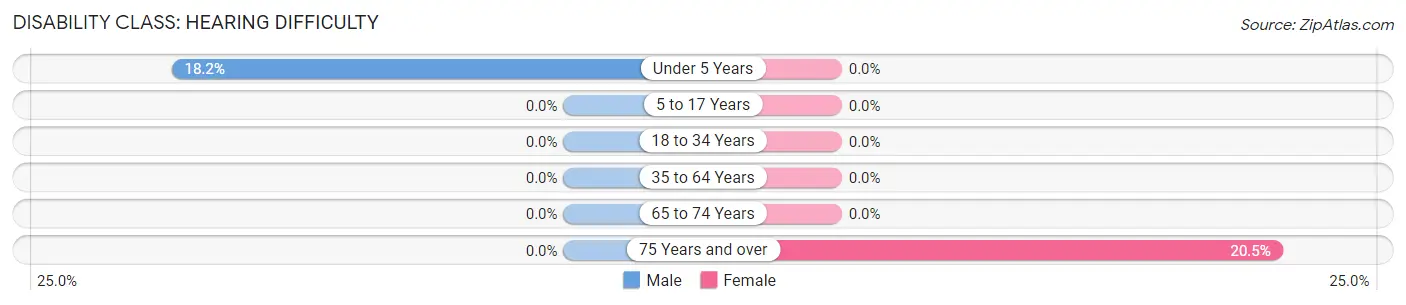
| Age Bracket | Male | Female |
| Under 5 Years | 4 (18.2%) | 0 (0.0%) |
| 5 to 17 Years | 0 (0.0%) | 0 (0.0%) |
| 18 to 34 Years | 0 (0.0%) | 0 (0.0%) |
| 35 to 64 Years | 0 (0.0%) | 0 (0.0%) |
| 65 to 74 Years | 0 (0.0%) | 0 (0.0%) |
| 75 Years and over | 0 (0.0%) | 9 (20.4%) |
Disability Class: Vision Difficulty
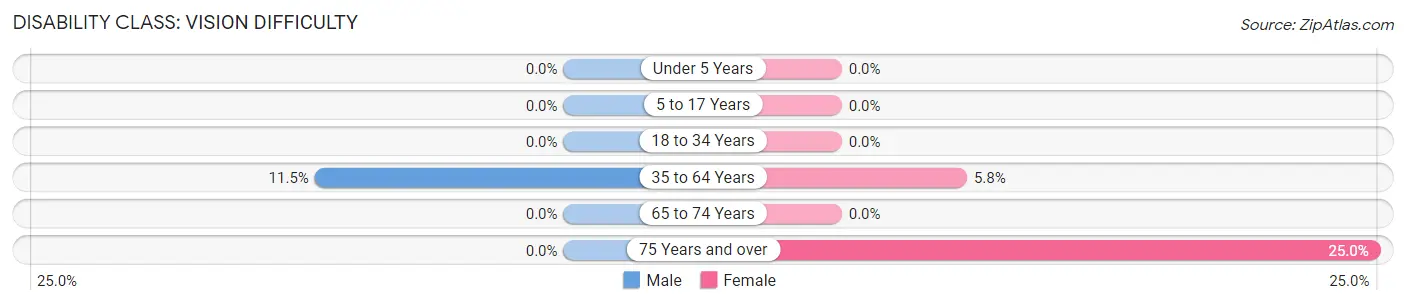
| Age Bracket | Male | Female |
| Under 5 Years | 0 (0.0%) | 0 (0.0%) |
| 5 to 17 Years | 0 (0.0%) | 0 (0.0%) |
| 18 to 34 Years | 0 (0.0%) | 0 (0.0%) |
| 35 to 64 Years | 18 (11.5%) | 10 (5.8%) |
| 65 to 74 Years | 0 (0.0%) | 0 (0.0%) |
| 75 Years and over | 0 (0.0%) | 11 (25.0%) |
Disability Class: Cognitive Difficulty
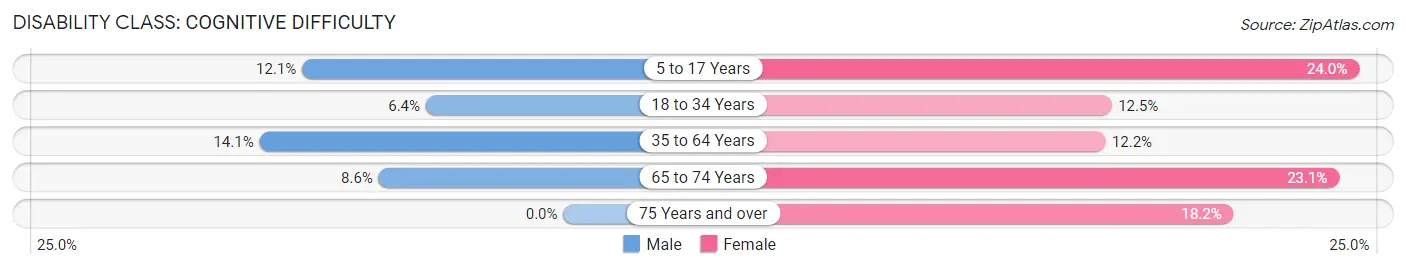
| Age Bracket | Male | Female |
| 5 to 17 Years | 4 (12.1%) | 6 (24.0%) |
| 18 to 34 Years | 6 (6.4%) | 6 (12.5%) |
| 35 to 64 Years | 22 (14.1%) | 21 (12.2%) |
| 65 to 74 Years | 3 (8.6%) | 3 (23.1%) |
| 75 Years and over | 0 (0.0%) | 8 (18.2%) |
Disability Class: Ambulatory Difficulty
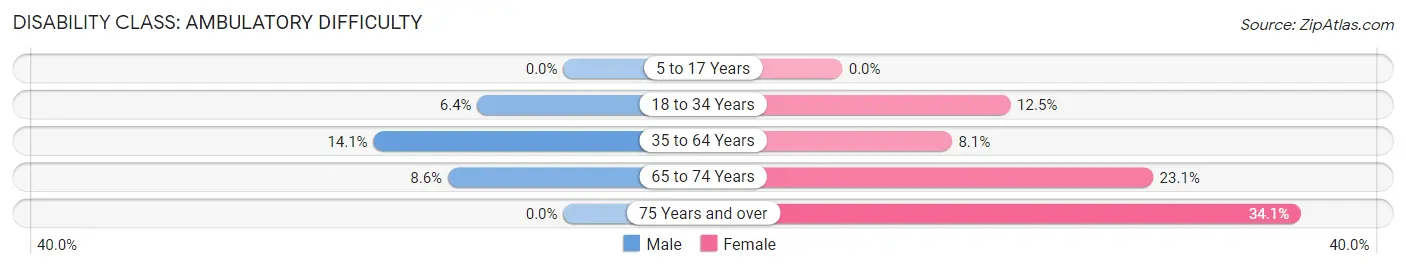
| Age Bracket | Male | Female |
| 5 to 17 Years | 0 (0.0%) | 0 (0.0%) |
| 18 to 34 Years | 6 (6.4%) | 6 (12.5%) |
| 35 to 64 Years | 22 (14.1%) | 14 (8.1%) |
| 65 to 74 Years | 3 (8.6%) | 3 (23.1%) |
| 75 Years and over | 0 (0.0%) | 15 (34.1%) |
Disability Class: Self-Care Difficulty
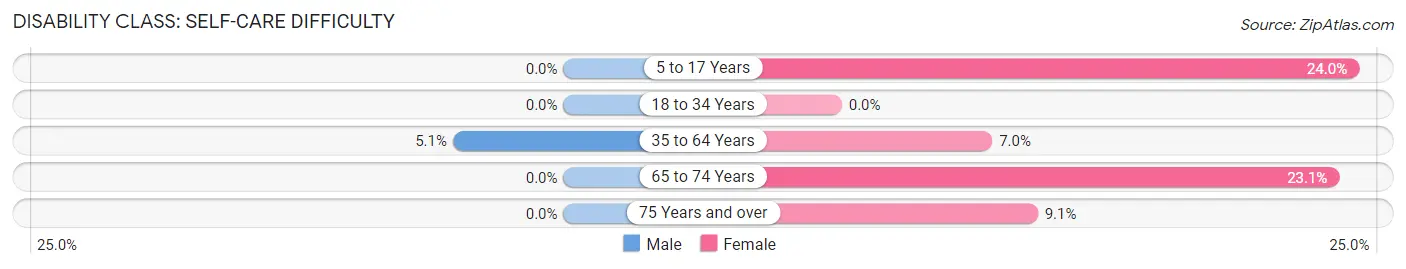
| Age Bracket | Male | Female |
| 5 to 17 Years | 0 (0.0%) | 6 (24.0%) |
| 18 to 34 Years | 0 (0.0%) | 0 (0.0%) |
| 35 to 64 Years | 8 (5.1%) | 12 (7.0%) |
| 65 to 74 Years | 0 (0.0%) | 3 (23.1%) |
| 75 Years and over | 0 (0.0%) | 4 (9.1%) |
Technology Access in Benzonia
Computing Device Access in Benzonia
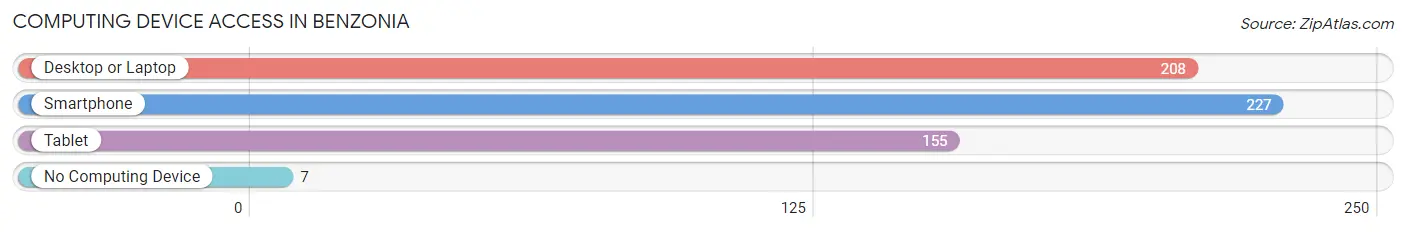
| Device Type | # Households | % Households |
| Desktop or Laptop | 208 | 80.9% |
| Smartphone | 227 | 88.3% |
| Tablet | 155 | 60.3% |
| No Computing Device | 7 | 2.7% |
| Total | 257 | 100.0% |
Internet Access in Benzonia
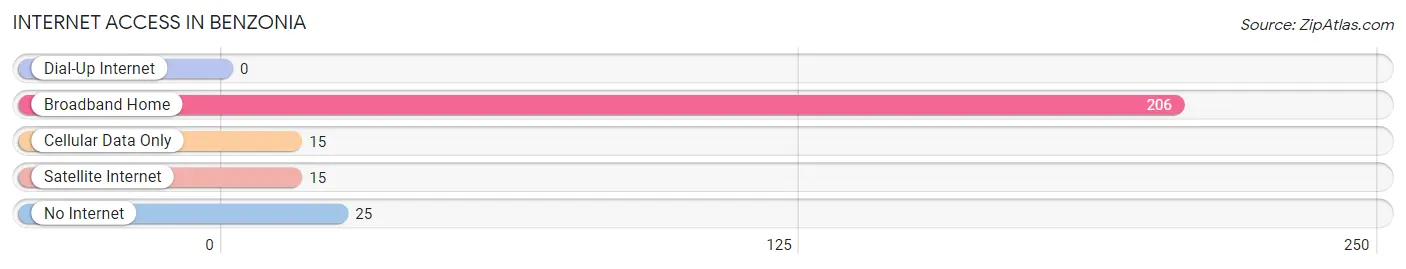
| Internet Type | # Households | % Households |
| Dial-Up Internet | 0 | 0.0% |
| Broadband Home | 206 | 80.2% |
| Cellular Data Only | 15 | 5.8% |
| Satellite Internet | 15 | 5.8% |
| No Internet | 25 | 9.7% |
| Total | 257 | 100.0% |
Benzonia Summary
Benzonia is a small village located in Benzie County, Michigan. It is situated on the shores of Lake Michigan and is part of the larger Traverse City metropolitan area. The village has a population of just over 1,000 people and is known for its small-town charm and natural beauty.
History
Benzonia was first settled in 1858 by a group of German immigrants led by John Benz. The village was named after Benz, who was a prominent figure in the area. The village was incorporated in 1871 and quickly grew to become a popular destination for tourists. The village was known for its picturesque views of Lake Michigan and its many outdoor activities.
In the late 19th century, Benzonia was a popular destination for wealthy vacationers from Chicago and other cities. The village was home to several grand hotels, including the Benzonia House and the Benzonia Hotel. These hotels attracted many visitors to the area and helped to boost the local economy.
In the early 20th century, Benzonia was a popular destination for artists and writers. The village was home to several writers, including Ernest Hemingway and Sinclair Lewis. Hemingway wrote his first novel, The Sun Also Rises, while staying at the Benzonia Hotel.
Geography
Benzonia is located in the northwest corner of Michigan, on the shores of Lake Michigan. The village is situated in a rural area, surrounded by forests and rolling hills. The village is located about 25 miles north of Traverse City and about 50 miles south of Mackinaw City.
The village is located in a temperate climate, with warm summers and cold winters. The average temperature in the summer is around 70 degrees Fahrenheit, while the average temperature in the winter is around 20 degrees Fahrenheit.
Economy
The economy of Benzonia is largely based on tourism. The village is home to several resorts and hotels, which attract visitors from all over the country. The village is also home to several restaurants, shops, and other businesses.
The village is also home to several wineries, which produce a variety of wines. The village is also home to several art galleries, which feature the work of local artists.
Demographics
As of the 2010 census, the population of Benzonia was 1,037. The racial makeup of the village was 97.3% White, 0.3% African American, 0.2% Native American, 0.3% Asian, 0.1% Pacific Islander, 0.7% from other races, and 1.1% from two or more races. Hispanic or Latino of any race were 1.7% of the population.
The median income for a household in the village was $37,500, and the median income for a family was $45,000. The per capita income for the village was $20,000. About 8.3% of families and 10.3% of the population were below the poverty line, including 14.3% of those under age 18 and 5.3% of those age 65 or over.
Common Questions
What is Per Capita Income in Benzonia?
Per Capita income in Benzonia is $30,132.
What is the Median Family Income in Benzonia?
Median Family Income in Benzonia is $83,409.
What is the Median Household income in Benzonia?
Median Household Income in Benzonia is $64,107.
What is Income or Wage Gap in Benzonia?
Income or Wage Gap in Benzonia is 2.7%.
Women in Benzonia earn 97.3 cents for every dollar earned by a man.
What is Inequality or Gini Index in Benzonia?
Inequality or Gini Index in Benzonia is 0.40.
What is the Total Population of Benzonia?
Total Population of Benzonia is 679.
What is the Total Male Population of Benzonia?
Total Male Population of Benzonia is 368.
What is the Total Female Population of Benzonia?
Total Female Population of Benzonia is 311.
What is the Ratio of Males per 100 Females in Benzonia?
There are 118.33 Males per 100 Females in Benzonia.
What is the Ratio of Females per 100 Males in Benzonia?
There are 84.51 Females per 100 Males in Benzonia.
What is the Median Population Age in Benzonia?
Median Population Age in Benzonia is 46.3 Years.
What is the Average Family Size in Benzonia
Average Family Size in Benzonia is 3.3 People.
What is the Average Household Size in Benzonia
Average Household Size in Benzonia is 2.6 People.
How Large is the Labor Force in Benzonia?
There are 358 People in the Labor Forcein in Benzonia.
What is the Percentage of People in the Labor Force in Benzonia?
59.2% of People are in the Labor Force in Benzonia.
What is the Unemployment Rate in Benzonia?
Unemployment Rate in Benzonia is 8.4%.