Bear Lake, MI Map & Demographics
Bear Lake Map
Bear Lake Overview
$23,506
PER CAPITA INCOME
$57,813
AVG FAMILY INCOME
$51,250
AVG HOUSEHOLD INCOME
52.9%
WAGE / INCOME GAP [ % ]
47.1¢/ $1
WAGE / INCOME GAP [ $ ]
0.33
INEQUALITY / GINI INDEX
247
TOTAL POPULATION
99
MALE POPULATION
148
FEMALE POPULATION
66.89
MALES / 100 FEMALES
149.49
FEMALES / 100 MALES
47.5
MEDIAN AGE
3.2
AVG FAMILY SIZE
2.7
AVG HOUSEHOLD SIZE
119
LABOR FORCE [ PEOPLE ]
55.1%
PERCENT IN LABOR FORCE
10.9%
UNEMPLOYMENT RATE
Bear Lake Zip Codes
Bear Lake Area Codes
Income in Bear Lake
Income Overview in Bear Lake
Per Capita Income in Bear Lake is $23,506, while median incomes of families and households are $57,813 and $51,250 respectively.
| Characteristic | Number | Measure |
| Per Capita Income | 247 | $23,506 |
| Median Family Income | 67 | $57,813 |
| Mean Family Income | 67 | $67,460 |
| Median Household Income | 92 | $51,250 |
| Mean Household Income | 92 | $58,836 |
| Income Deficit | 67 | $0 |
| Wage / Income Gap (%) | 247 | 52.86% |
| Wage / Income Gap ($) | 247 | 47.14¢ per $1 |
| Gini / Inequality Index | 247 | 0.33 |
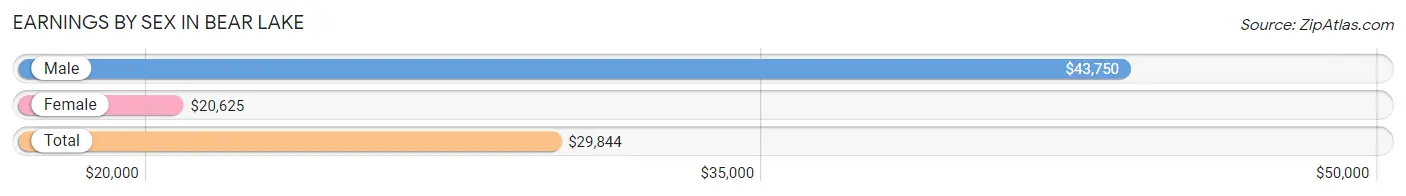
Earnings by Sex in Bear Lake
Average Earnings in Bear Lake are $29,844, $43,750 for men and $20,625 for women, a difference of 52.9%.
| Sex | Number | Average Earnings |
| Male | 60 (50.4%) | $43,750 |
| Female | 59 (49.6%) | $20,625 |
| Total | 119 (100.0%) | $29,844 |
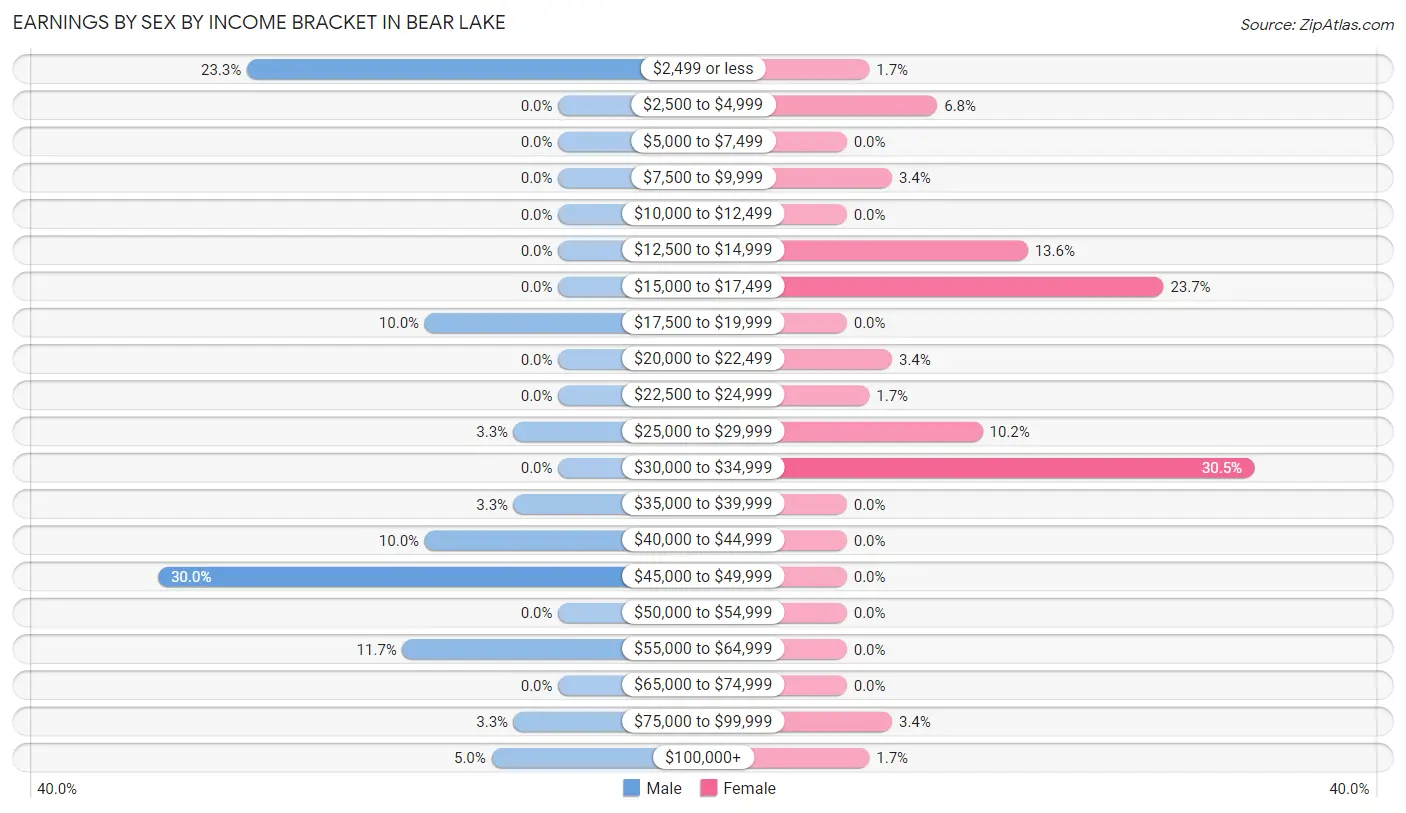
Earnings by Sex by Income Bracket in Bear Lake
The most common earnings brackets in Bear Lake are $45,000 to $49,999 for men (18 | 30.0%) and $30,000 to $34,999 for women (18 | 30.5%).
| Income | Male | Female |
| $2,499 or less | 14 (23.3%) | 1 (1.7%) |
| $2,500 to $4,999 | 0 (0.0%) | 4 (6.8%) |
| $5,000 to $7,499 | 0 (0.0%) | 0 (0.0%) |
| $7,500 to $9,999 | 0 (0.0%) | 2 (3.4%) |
| $10,000 to $12,499 | 0 (0.0%) | 0 (0.0%) |
| $12,500 to $14,999 | 0 (0.0%) | 8 (13.6%) |
| $15,000 to $17,499 | 0 (0.0%) | 14 (23.7%) |
| $17,500 to $19,999 | 6 (10.0%) | 0 (0.0%) |
| $20,000 to $22,499 | 0 (0.0%) | 2 (3.4%) |
| $22,500 to $24,999 | 0 (0.0%) | 1 (1.7%) |
| $25,000 to $29,999 | 2 (3.3%) | 6 (10.2%) |
| $30,000 to $34,999 | 0 (0.0%) | 18 (30.5%) |
| $35,000 to $39,999 | 2 (3.3%) | 0 (0.0%) |
| $40,000 to $44,999 | 6 (10.0%) | 0 (0.0%) |
| $45,000 to $49,999 | 18 (30.0%) | 0 (0.0%) |
| $50,000 to $54,999 | 0 (0.0%) | 0 (0.0%) |
| $55,000 to $64,999 | 7 (11.7%) | 0 (0.0%) |
| $65,000 to $74,999 | 0 (0.0%) | 0 (0.0%) |
| $75,000 to $99,999 | 2 (3.3%) | 2 (3.4%) |
| $100,000+ | 3 (5.0%) | 1 (1.7%) |
| Total | 60 (100.0%) | 59 (100.0%) |
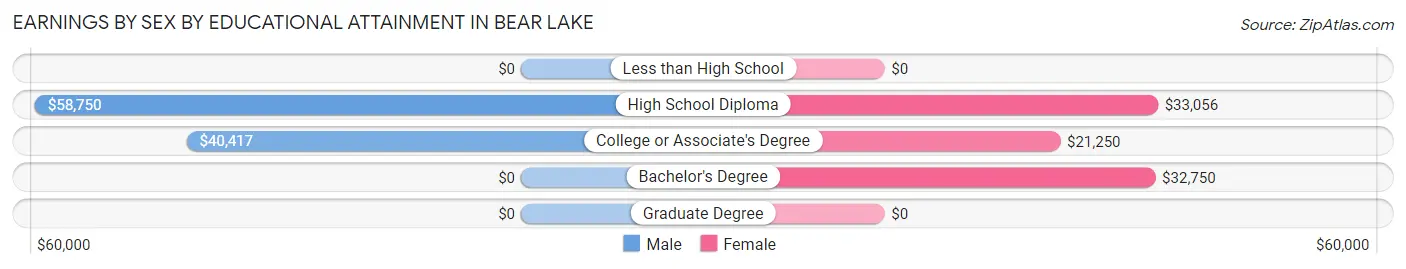
Earnings by Sex by Educational Attainment in Bear Lake
Average earnings in Bear Lake are $46,000 for men and $32,500 for women, a difference of 29.3%. Men with an educational attainment of high school diploma enjoy the highest average annual earnings of $58,750, while those with college or associate's degree education earn the least with $40,417. Women with an educational attainment of high school diploma earn the most with the average annual earnings of $33,056, while those with college or associate's degree education have the smallest earnings of $21,250.
| Educational Attainment | Male Income | Female Income |
| Less than High School | - | - |
| High School Diploma | $58,750 | $33,056 |
| College or Associate's Degree | $40,417 | $21,250 |
| Bachelor's Degree | - | - |
| Graduate Degree | - | - |
| Total | $46,000 | $32,500 |
Family Income in Bear Lake
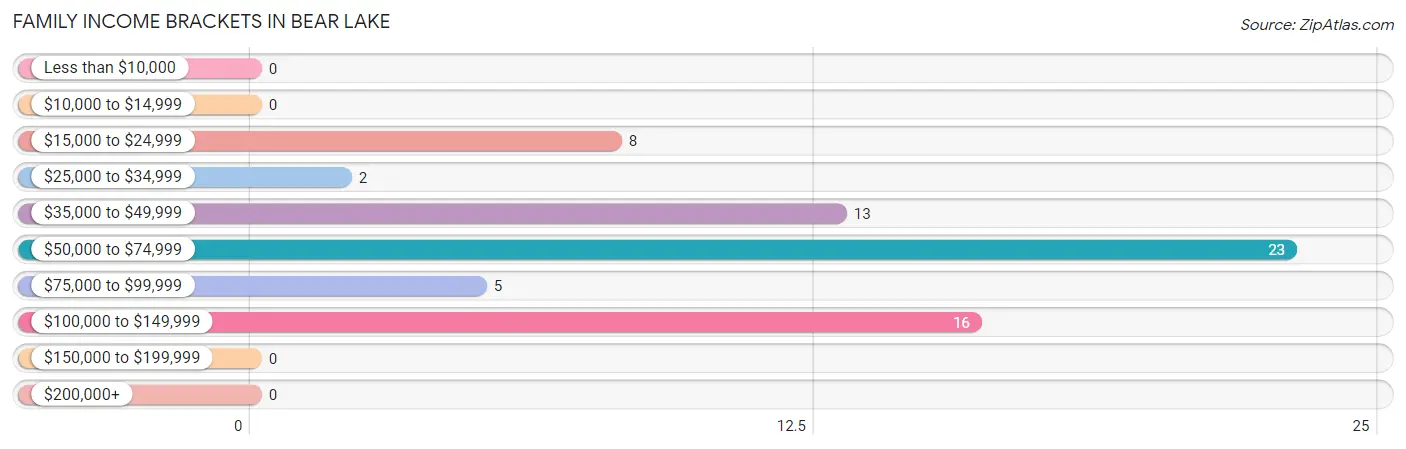
Family Income Brackets in Bear Lake
According to the Bear Lake family income data, there are 23 families falling into the $50,000 to $74,999 income range, which is the most common income bracket and makes up 34.3% of all families.
| Income Bracket | # Families | % Families |
| Less than $10,000 | 0 | 0.0% |
| $10,000 to $14,999 | 0 | 0.0% |
| $15,000 to $24,999 | 8 | 11.9% |
| $25,000 to $34,999 | 2 | 3.0% |
| $35,000 to $49,999 | 13 | 19.4% |
| $50,000 to $74,999 | 23 | 34.3% |
| $75,000 to $99,999 | 5 | 7.5% |
| $100,000 to $149,999 | 16 | 23.9% |
| $150,000 to $199,999 | 0 | 0.0% |
| $200,000+ | 0 | 0.0% |
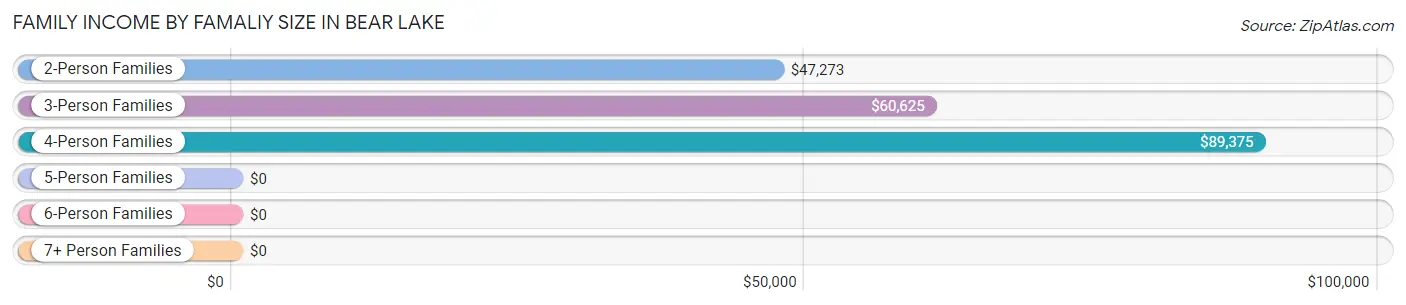
Family Income by Famaliy Size in Bear Lake
4-person families (7 | 10.4%) account for the highest median family income in Bear Lake with $89,375 per family, while 2-person families (40 | 59.7%) have the highest median income of $23,636 per family member.
| Income Bracket | # Families | Median Income |
| 2-Person Families | 40 (59.7%) | $47,273 |
| 3-Person Families | 15 (22.4%) | $60,625 |
| 4-Person Families | 7 (10.4%) | $89,375 |
| 5-Person Families | 0 (0.0%) | $0 |
| 6-Person Families | 0 (0.0%) | $0 |
| 7+ Person Families | 5 (7.5%) | $0 |
| Total | 67 (100.0%) | $57,813 |
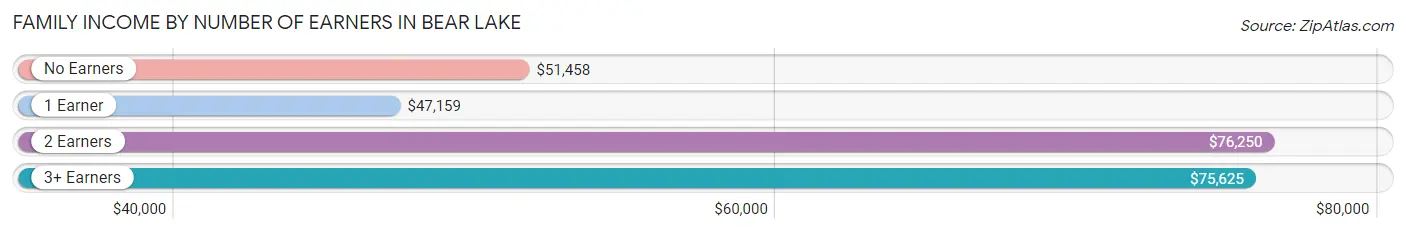
Family Income by Number of Earners in Bear Lake
The median family income in Bear Lake is $57,813, with families comprising 2 earners (8) having the highest median family income of $76,250, while families with 1 earner (23) have the lowest median family income of $47,159, accounting for 11.9% and 34.3% of families, respectively.
| Number of Earners | # Families | Median Income |
| No Earners | 23 (34.3%) | $51,458 |
| 1 Earner | 23 (34.3%) | $47,159 |
| 2 Earners | 8 (11.9%) | $76,250 |
| 3+ Earners | 13 (19.4%) | $75,625 |
| Total | 67 (100.0%) | $57,813 |
Household Income in Bear Lake
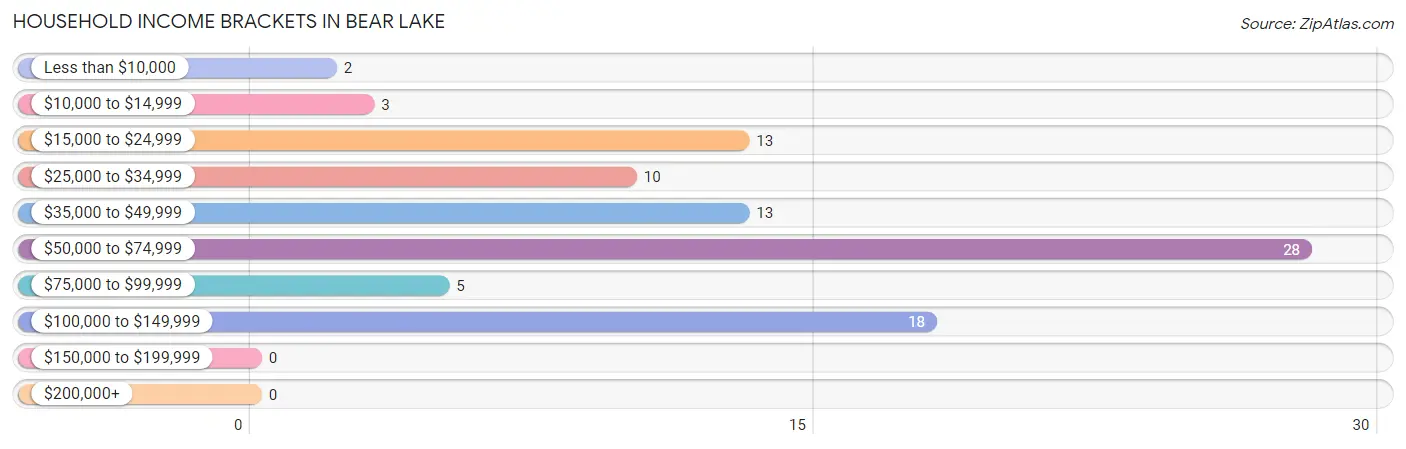
Household Income Brackets in Bear Lake
With 28 households falling in the category, the $50,000 to $74,999 income range is the most frequent in Bear Lake, accounting for 30.4% of all households.
| Income Bracket | # Households | % Households |
| Less than $10,000 | 2 | 2.2% |
| $10,000 to $14,999 | 3 | 3.3% |
| $15,000 to $24,999 | 13 | 14.1% |
| $25,000 to $34,999 | 10 | 10.9% |
| $35,000 to $49,999 | 13 | 14.1% |
| $50,000 to $74,999 | 28 | 30.4% |
| $75,000 to $99,999 | 5 | 5.4% |
| $100,000 to $149,999 | 18 | 19.6% |
| $150,000 to $199,999 | 0 | 0.0% |
| $200,000+ | 0 | 0.0% |
Household Income by Householder Age in Bear Lake
The median household income in Bear Lake is $51,250, with the highest median household income of $75,625 found in the 25 to 44 years age bracket for the primary householder. A total of 23 households (25.0%) fall into this category. Meanwhile, the 15 to 24 years age bracket for the primary householder has the lowest median household income of $0, with 4 households (4.3%) in this group.
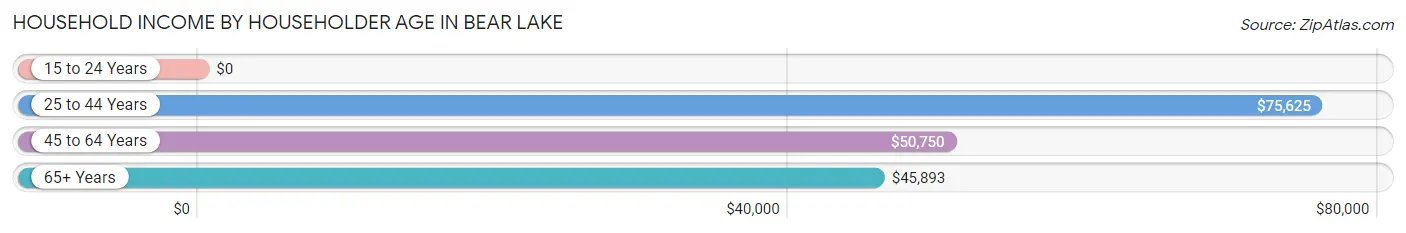
| Income Bracket | # Households | Median Income |
| 15 to 24 Years | 4 (4.3%) | $0 |
| 25 to 44 Years | 23 (25.0%) | $75,625 |
| 45 to 64 Years | 26 (28.3%) | $50,750 |
| 65+ Years | 39 (42.4%) | $45,893 |
| Total | 92 (100.0%) | $51,250 |
Poverty in Bear Lake
Income Below Poverty by Sex and Age in Bear Lake
With 3.1% poverty level for males and 3.4% for females among the residents of Bear Lake, 25 to 34 year old males and 25 to 34 year old females are the most vulnerable to poverty, with 3 males (25.0%) and 2 females (100.0%) in their respective age groups living below the poverty level.
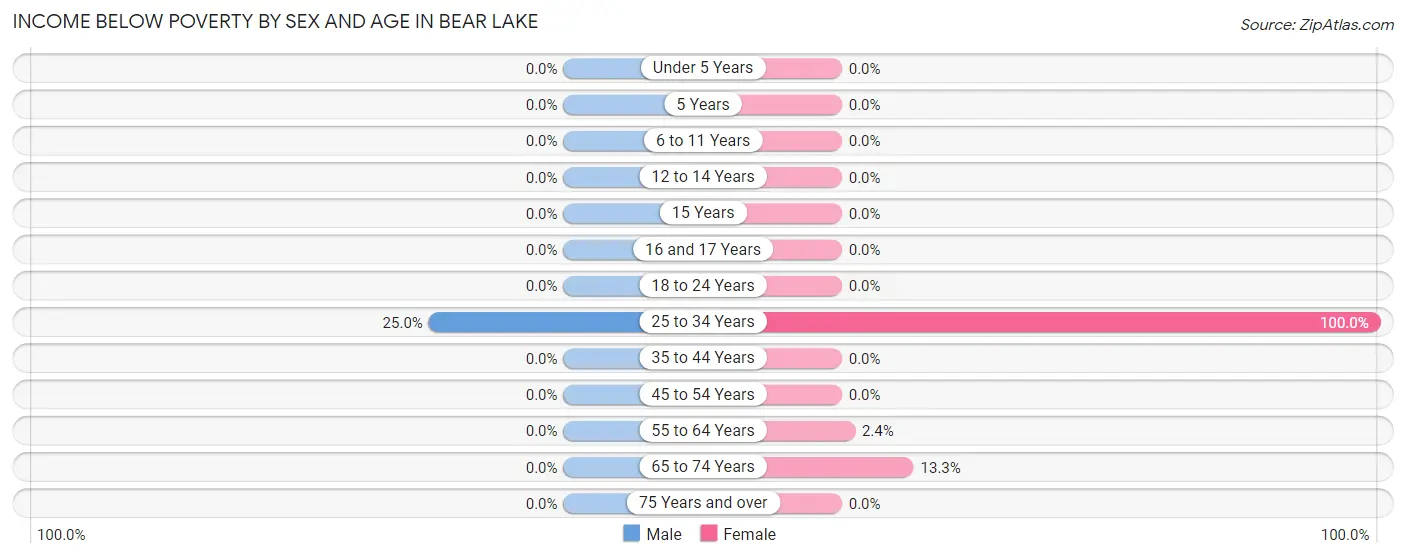
| Age Bracket | Male | Female |
| Under 5 Years | 0 (0.0%) | 0 (0.0%) |
| 5 Years | 0 (0.0%) | 0 (0.0%) |
| 6 to 11 Years | 0 (0.0%) | 0 (0.0%) |
| 12 to 14 Years | 0 (0.0%) | 0 (0.0%) |
| 15 Years | 0 (0.0%) | 0 (0.0%) |
| 16 and 17 Years | 0 (0.0%) | 0 (0.0%) |
| 18 to 24 Years | 0 (0.0%) | 0 (0.0%) |
| 25 to 34 Years | 3 (25.0%) | 2 (100.0%) |
| 35 to 44 Years | 0 (0.0%) | 0 (0.0%) |
| 45 to 54 Years | 0 (0.0%) | 0 (0.0%) |
| 55 to 64 Years | 0 (0.0%) | 1 (2.4%) |
| 65 to 74 Years | 0 (0.0%) | 2 (13.3%) |
| 75 Years and over | 0 (0.0%) | 0 (0.0%) |
| Total | 3 (3.1%) | 5 (3.4%) |
Income Above Poverty by Sex and Age in Bear Lake
According to the poverty statistics in Bear Lake, males aged 12 to 14 years and females aged under 5 years are the age groups that are most secure financially, with 100.0% of males and 100.0% of females in these age groups living above the poverty line.
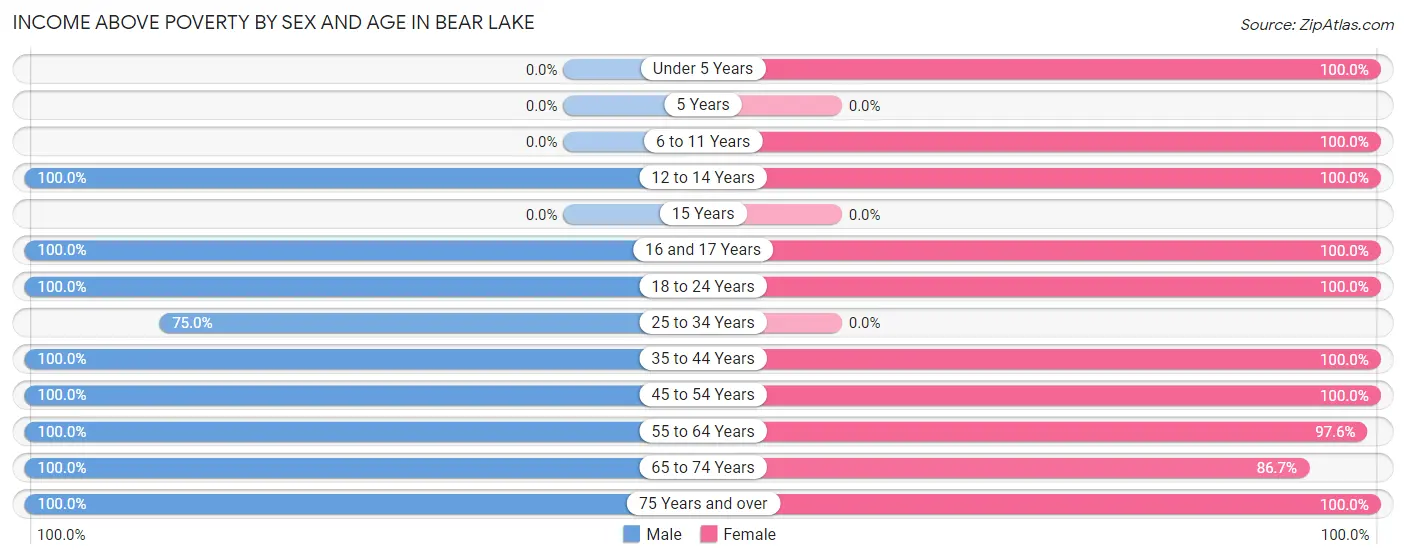
| Age Bracket | Male | Female |
| Under 5 Years | 0 (0.0%) | 14 (100.0%) |
| 5 Years | 0 (0.0%) | 0 (0.0%) |
| 6 to 11 Years | 0 (0.0%) | 4 (100.0%) |
| 12 to 14 Years | 5 (100.0%) | 5 (100.0%) |
| 15 Years | 0 (0.0%) | 0 (0.0%) |
| 16 and 17 Years | 8 (100.0%) | 5 (100.0%) |
| 18 to 24 Years | 16 (100.0%) | 26 (100.0%) |
| 25 to 34 Years | 9 (75.0%) | 0 (0.0%) |
| 35 to 44 Years | 13 (100.0%) | 9 (100.0%) |
| 45 to 54 Years | 7 (100.0%) | 11 (100.0%) |
| 55 to 64 Years | 5 (100.0%) | 40 (97.6%) |
| 65 to 74 Years | 22 (100.0%) | 13 (86.7%) |
| 75 Years and over | 8 (100.0%) | 16 (100.0%) |
| Total | 93 (96.9%) | 143 (96.6%) |
Income Below Poverty Among Married-Couple Families in Bear Lake
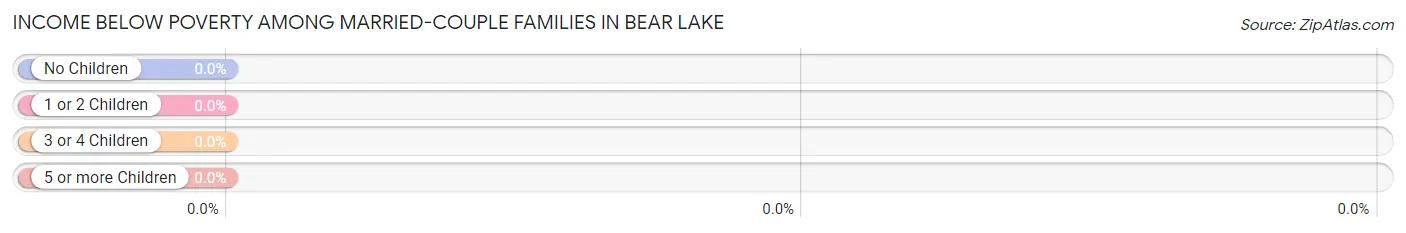
| Children | Above Poverty | Below Poverty |
| No Children | 40 (100.0%) | 0 (0.0%) |
| 1 or 2 Children | 4 (100.0%) | 0 (0.0%) |
| 3 or 4 Children | 5 (100.0%) | 0 (0.0%) |
| 5 or more Children | 0 (0.0%) | 0 (0.0%) |
| Total | 49 (100.0%) | 0 (0.0%) |
Income Below Poverty Among Single-Parent Households in Bear Lake
| Children | Single Father | Single Mother |
| No Children | 0 (0.0%) | 0 (0.0%) |
| 1 or 2 Children | 0 (0.0%) | 0 (0.0%) |
| 3 or 4 Children | 0 (0.0%) | 0 (0.0%) |
| 5 or more Children | 0 (0.0%) | 0 (0.0%) |
| Total | 0 (0.0%) | 0 (0.0%) |
Income Below Poverty Among Married-Couple vs Single-Parent Households in Bear Lake
| Children | Married-Couple Families | Single-Parent Households |
| No Children | 0 (0.0%) | 0 (0.0%) |
| 1 or 2 Children | 0 (0.0%) | 0 (0.0%) |
| 3 or 4 Children | 0 (0.0%) | 0 (0.0%) |
| 5 or more Children | 0 (0.0%) | 0 (0.0%) |
| Total | 0 (0.0%) | 0 (0.0%) |
Race in Bear Lake
The most populous races in Bear Lake are White / Caucasian (211 | 85.4%), Two or more Races (17 | 6.9%), and Hispanic or Latino (16 | 6.5%).
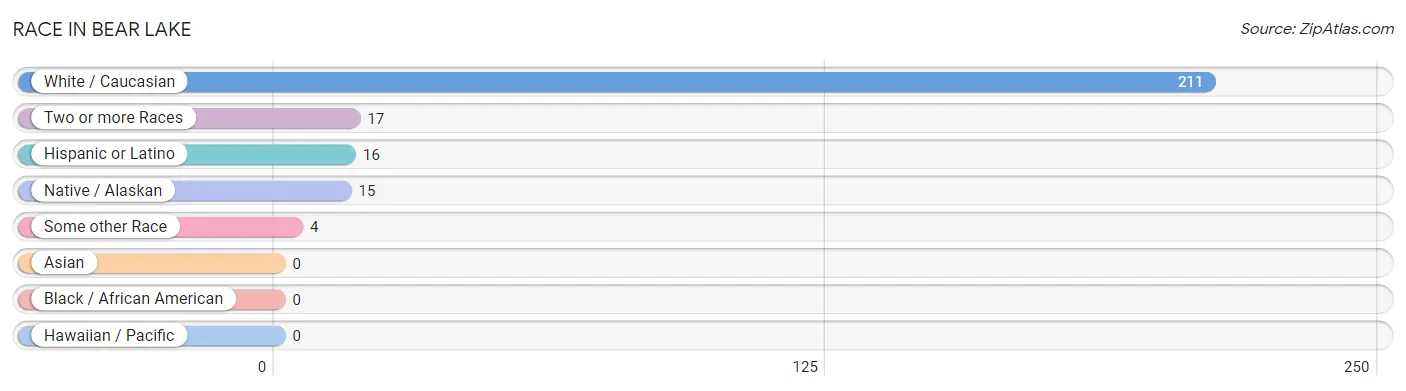
| Race | # Population | % Population |
| Asian | 0 | 0.0% |
| Black / African American | 0 | 0.0% |
| Hawaiian / Pacific | 0 | 0.0% |
| Hispanic or Latino | 16 | 6.5% |
| Native / Alaskan | 15 | 6.1% |
| White / Caucasian | 211 | 85.4% |
| Two or more Races | 17 | 6.9% |
| Some other Race | 4 | 1.6% |
| Total | 247 | 100.0% |
Ancestry in Bear Lake
The most populous ancestries reported in Bear Lake are German (83 | 33.6%), English (45 | 18.2%), American (33 | 13.4%), Irish (27 | 10.9%), and French (19 | 7.7%), together accounting for 83.8% of all Bear Lake residents.
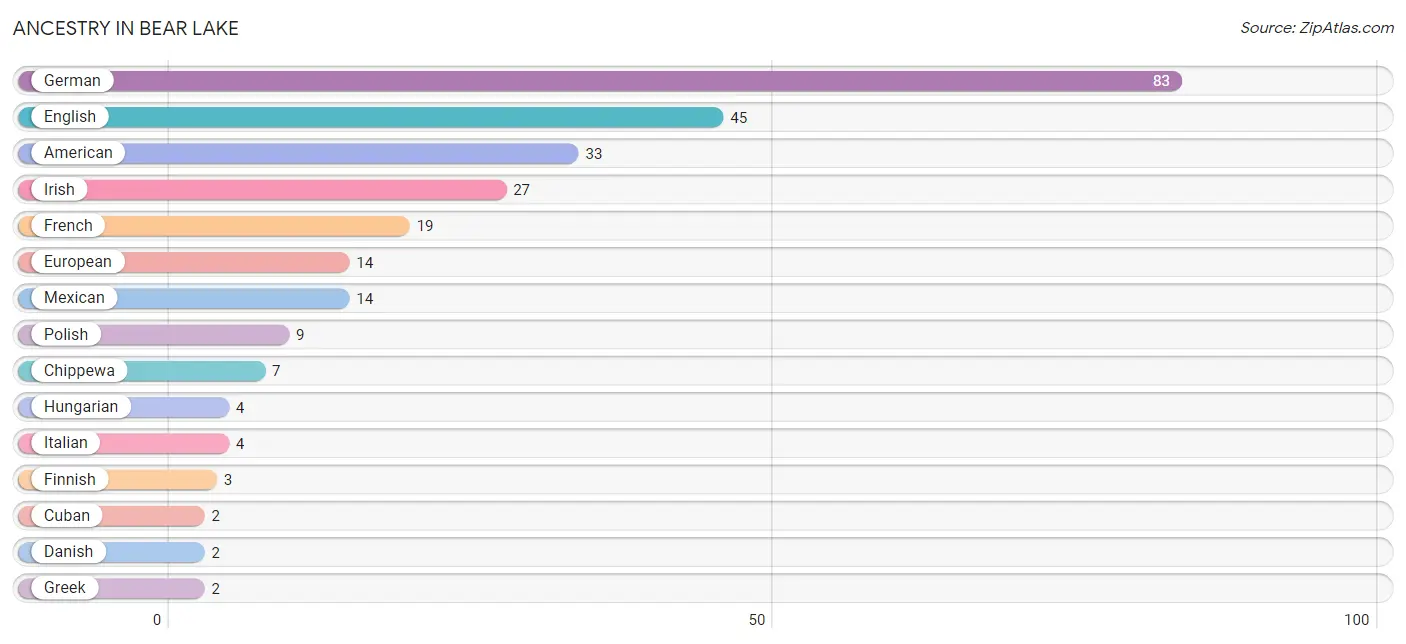
| Ancestry | # Population | % Population |
| American | 33 | 13.4% |
| Chippewa | 7 | 2.8% |
| Cuban | 2 | 0.8% |
| Danish | 2 | 0.8% |
| Dutch | 1 | 0.4% |
| English | 45 | 18.2% |
| European | 14 | 5.7% |
| Finnish | 3 | 1.2% |
| French | 19 | 7.7% |
| French Canadian | 1 | 0.4% |
| German | 83 | 33.6% |
| Greek | 2 | 0.8% |
| Hungarian | 4 | 1.6% |
| Irish | 27 | 10.9% |
| Italian | 4 | 1.6% |
| Mexican | 14 | 5.7% |
| Ottawa | 1 | 0.4% |
| Polish | 9 | 3.6% |
| Scotch-Irish | 1 | 0.4% |
| Scottish | 2 | 0.8% |
| Swedish | 1 | 0.4% | View All 21 Rows |
Immigrants in Bear Lake
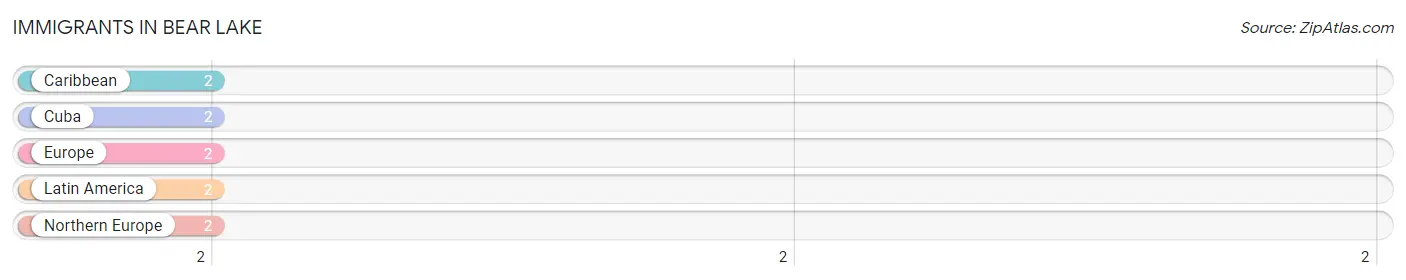
The most numerous immigrant groups reported in Bear Lake came from Caribbean (2 | 0.8%), Cuba (2 | 0.8%), Europe (2 | 0.8%), Latin America (2 | 0.8%), and Northern Europe (2 | 0.8%), together accounting for 4.0% of all Bear Lake residents.
| Immigration Origin | # Population | % Population |
| Caribbean | 2 | 0.8% |
| Cuba | 2 | 0.8% |
| Europe | 2 | 0.8% |
| Latin America | 2 | 0.8% |
| Northern Europe | 2 | 0.8% | View All 5 Rows |
Sex and Age in Bear Lake
Sex and Age in Bear Lake
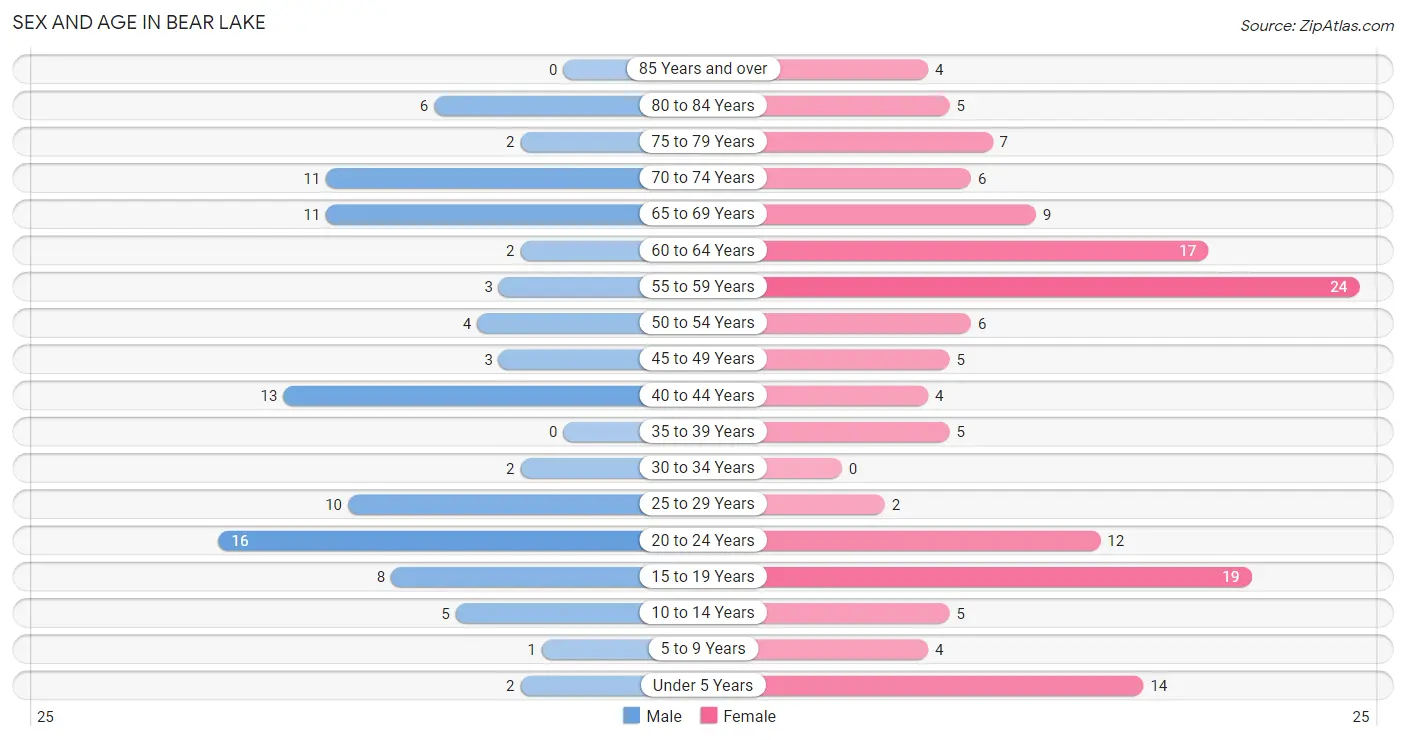
The most populous age groups in Bear Lake are 20 to 24 Years (16 | 16.2%) for men and 55 to 59 Years (24 | 16.2%) for women.
| Age Bracket | Male | Female |
| Under 5 Years | 2 (2.0%) | 14 (9.5%) |
| 5 to 9 Years | 1 (1.0%) | 4 (2.7%) |
| 10 to 14 Years | 5 (5.1%) | 5 (3.4%) |
| 15 to 19 Years | 8 (8.1%) | 19 (12.8%) |
| 20 to 24 Years | 16 (16.2%) | 12 (8.1%) |
| 25 to 29 Years | 10 (10.1%) | 2 (1.3%) |
| 30 to 34 Years | 2 (2.0%) | 0 (0.0%) |
| 35 to 39 Years | 0 (0.0%) | 5 (3.4%) |
| 40 to 44 Years | 13 (13.1%) | 4 (2.7%) |
| 45 to 49 Years | 3 (3.0%) | 5 (3.4%) |
| 50 to 54 Years | 4 (4.0%) | 6 (4.1%) |
| 55 to 59 Years | 3 (3.0%) | 24 (16.2%) |
| 60 to 64 Years | 2 (2.0%) | 17 (11.5%) |
| 65 to 69 Years | 11 (11.1%) | 9 (6.1%) |
| 70 to 74 Years | 11 (11.1%) | 6 (4.1%) |
| 75 to 79 Years | 2 (2.0%) | 7 (4.7%) |
| 80 to 84 Years | 6 (6.1%) | 5 (3.4%) |
| 85 Years and over | 0 (0.0%) | 4 (2.7%) |
| Total | 99 (100.0%) | 148 (100.0%) |
Families and Households in Bear Lake
Median Family Size in Bear Lake
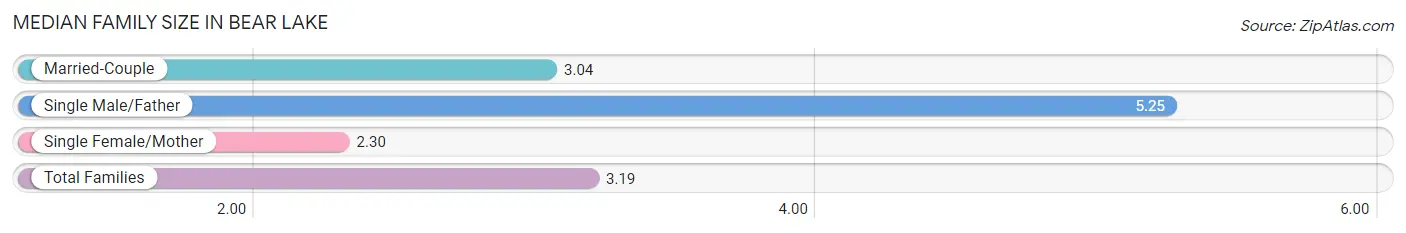
The median family size in Bear Lake is 3.19 persons per family, with single male/father families (8 | 11.9%) accounting for the largest median family size of 5.25 persons per family. On the other hand, single female/mother families (10 | 14.9%) represent the smallest median family size with 2.30 persons per family.
| Family Type | # Families | Family Size |
| Married-Couple | 49 (73.1%) | 3.04 |
| Single Male/Father | 8 (11.9%) | 5.25 |
| Single Female/Mother | 10 (14.9%) | 2.30 |
| Total Families | 67 (100.0%) | 3.19 |
Median Household Size in Bear Lake
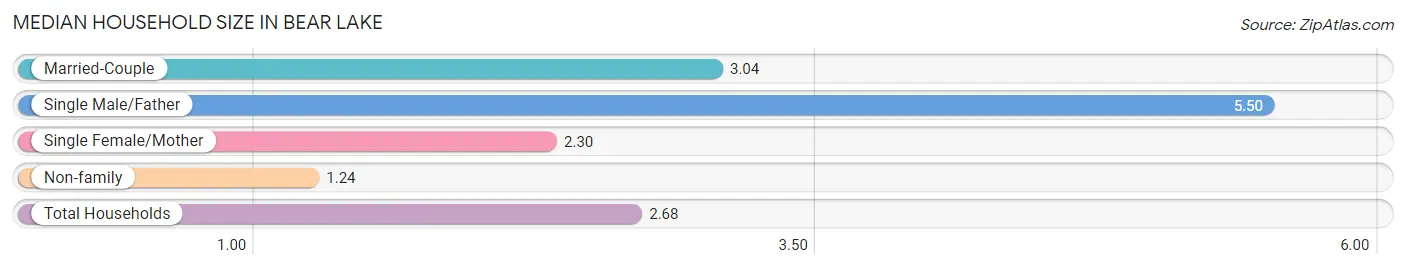
The median household size in Bear Lake is 2.68 persons per household, with single male/father households (8 | 8.7%) accounting for the largest median household size of 5.5 persons per household. non-family households (25 | 27.2%) represent the smallest median household size with 1.24 persons per household.
| Household Type | # Households | Household Size |
| Married-Couple | 49 (53.3%) | 3.04 |
| Single Male/Father | 8 (8.7%) | 5.50 |
| Single Female/Mother | 10 (10.9%) | 2.30 |
| Non-family | 25 (27.2%) | 1.24 |
| Total Households | 92 (100.0%) | 2.68 |
Household Size by Marriage Status in Bear Lake
Out of a total of 92 households in Bear Lake, 67 (72.8%) are family households, while 25 (27.2%) are nonfamily households. The most numerous type of family households are 2-person households, comprising 40, and the most common type of nonfamily households are 1-person households, comprising 20.
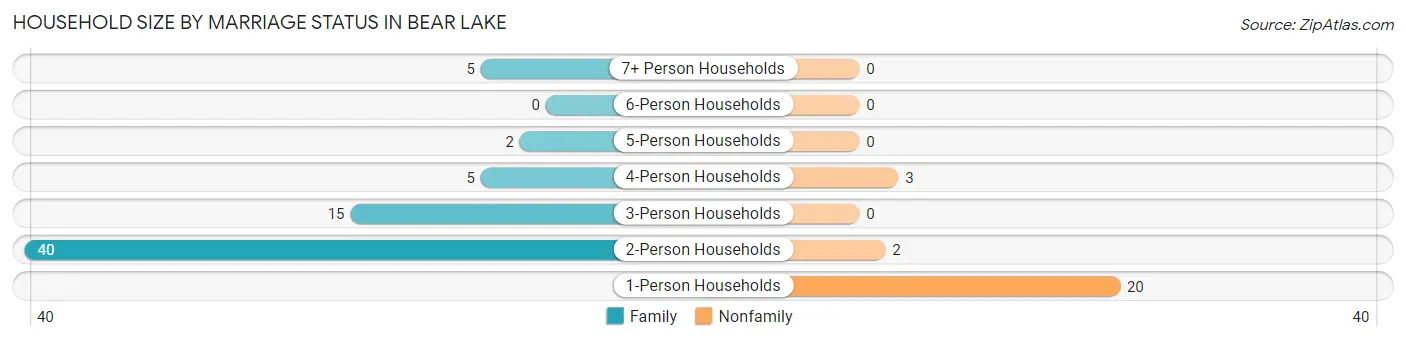
| Household Size | Family Households | Nonfamily Households |
| 1-Person Households | - | 20 (21.7%) |
| 2-Person Households | 40 (43.5%) | 2 (2.2%) |
| 3-Person Households | 15 (16.3%) | 0 (0.0%) |
| 4-Person Households | 5 (5.4%) | 3 (3.3%) |
| 5-Person Households | 2 (2.2%) | 0 (0.0%) |
| 6-Person Households | 0 (0.0%) | 0 (0.0%) |
| 7+ Person Households | 5 (5.4%) | 0 (0.0%) |
| Total | 67 (72.8%) | 25 (27.2%) |
Female Fertility in Bear Lake
Fertility by Age in Bear Lake
| Age Bracket | Women with Births | Births / 1,000 Women |
| 15 to 19 years | 0 (0.0%) | 0.0 |
| 20 to 34 years | 0 (0.0%) | 0.0 |
| 35 to 50 years | 0 (0.0%) | 0.0 |
| Total | 0 (0.0%) | 0.0 |
Fertility by Age by Marriage Status in Bear Lake
| Age Bracket | Married | Unmarried |
| 15 to 19 years | 0 (0.0%) | 0 (0.0%) |
| 20 to 34 years | 0 (0.0%) | 0 (0.0%) |
| 35 to 50 years | 0 (0.0%) | 0 (0.0%) |
| Total | 0 (0.0%) | 0 (0.0%) |
Fertility by Education in Bear Lake
| Educational Attainment | Women with Births | Births / 1,000 Women |
| Less than High School | 0 (0.0%) | 0.0 |
| High School Diploma | 0 (0.0%) | 0.0 |
| College or Associate's Degree | 0 (0.0%) | 0.0 |
| Bachelor's Degree | 0 (0.0%) | 0.0 |
| Graduate Degree | 0 (0.0%) | 0.0 |
| Total | 0 (0.0%) | 0.0 |
Fertility by Education by Marriage Status in Bear Lake
| Educational Attainment | Married | Unmarried |
| Less than High School | 0 (0.0%) | 0 (0.0%) |
| High School Diploma | 0 (0.0%) | 0 (0.0%) |
| College or Associate's Degree | 0 (0.0%) | 0 (0.0%) |
| Bachelor's Degree | 0 (0.0%) | 0 (0.0%) |
| Graduate Degree | 0 (0.0%) | 0 (0.0%) |
| Total | 0 (0.0%) | 0 (0.0%) |
Employment Characteristics in Bear Lake
Employment by Class of Employer in Bear Lake
Among the 106 employed individuals in Bear Lake, private company employees (83 | 78.3%), local government employees (17 | 16.0%), and not-for-profit organizations (4 | 3.8%) make up the most common classes of employment.
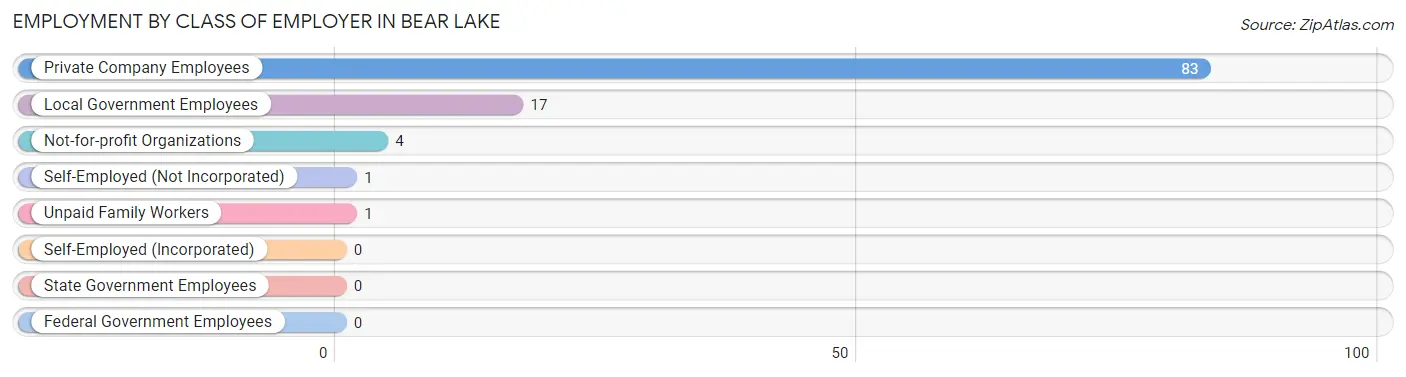
| Employer Class | # Employees | % Employees |
| Private Company Employees | 83 | 78.3% |
| Self-Employed (Incorporated) | 0 | 0.0% |
| Self-Employed (Not Incorporated) | 1 | 0.9% |
| Not-for-profit Organizations | 4 | 3.8% |
| Local Government Employees | 17 | 16.0% |
| State Government Employees | 0 | 0.0% |
| Federal Government Employees | 0 | 0.0% |
| Unpaid Family Workers | 1 | 0.9% |
| Total | 106 | 100.0% |
Employment Status by Age in Bear Lake
According to the labor force statistics for Bear Lake, out of the total population over 16 years of age (216), 55.1% or 119 individuals are in the labor force, with 10.9% or 13 of them unemployed. The age group with the highest labor force participation rate is 30 to 34 years, with 100.0% or 2 individuals in the labor force. Within the labor force, the 16 to 19 years age range has the highest percentage of unemployed individuals, with 36.4% or 8 of them being unemployed.
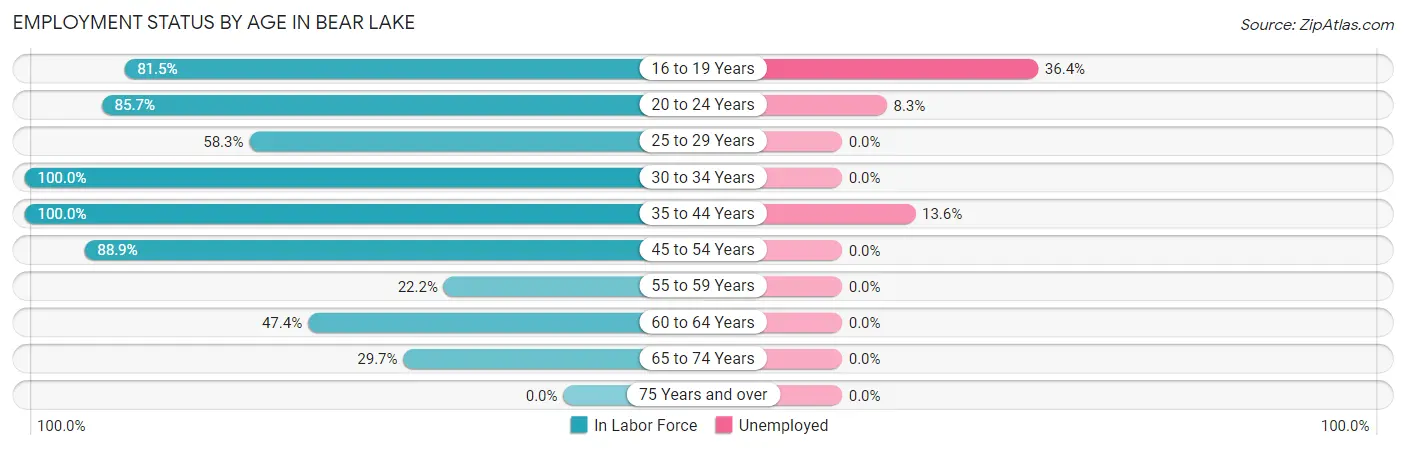
| Age Bracket | In Labor Force | Unemployed |
| 16 to 19 Years | 22 (81.5%) | 8 (36.4%) |
| 20 to 24 Years | 24 (85.7%) | 2 (8.3%) |
| 25 to 29 Years | 7 (58.3%) | 0 (0.0%) |
| 30 to 34 Years | 2 (100.0%) | 0 (0.0%) |
| 35 to 44 Years | 22 (100.0%) | 3 (13.6%) |
| 45 to 54 Years | 16 (88.9%) | 0 (0.0%) |
| 55 to 59 Years | 6 (22.2%) | 0 (0.0%) |
| 60 to 64 Years | 9 (47.4%) | 0 (0.0%) |
| 65 to 74 Years | 11 (29.7%) | 0 (0.0%) |
| 75 Years and over | 0 (0.0%) | 0 (0.0%) |
| Total | 119 (55.1%) | 13 (10.9%) |
Employment Status by Educational Attainment in Bear Lake
According to labor force statistics for Bear Lake, 62.0% of individuals (62) out of the total population between 25 and 64 years of age (100) are in the labor force, with 4.8% or 3 of them being unemployed. The group with the highest labor force participation rate are those with the educational attainment of bachelor's degree or higher, with 100.0% or 10 individuals in the labor force. Within the labor force, individuals with less than high school education have the highest percentage of unemployment, with 37.5% or 3 of them being unemployed.
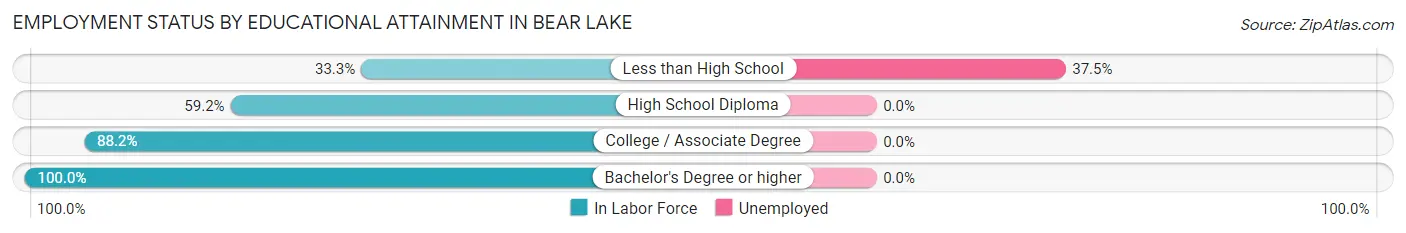
| Educational Attainment | In Labor Force | Unemployed |
| Less than High School | 8 (33.3%) | 9 (37.5%) |
| High School Diploma | 29 (59.2%) | 0 (0.0%) |
| College / Associate Degree | 15 (88.2%) | 0 (0.0%) |
| Bachelor's Degree or higher | 10 (100.0%) | 0 (0.0%) |
| Total | 62 (62.0%) | 5 (4.8%) |
Employment Occupations by Sex in Bear Lake
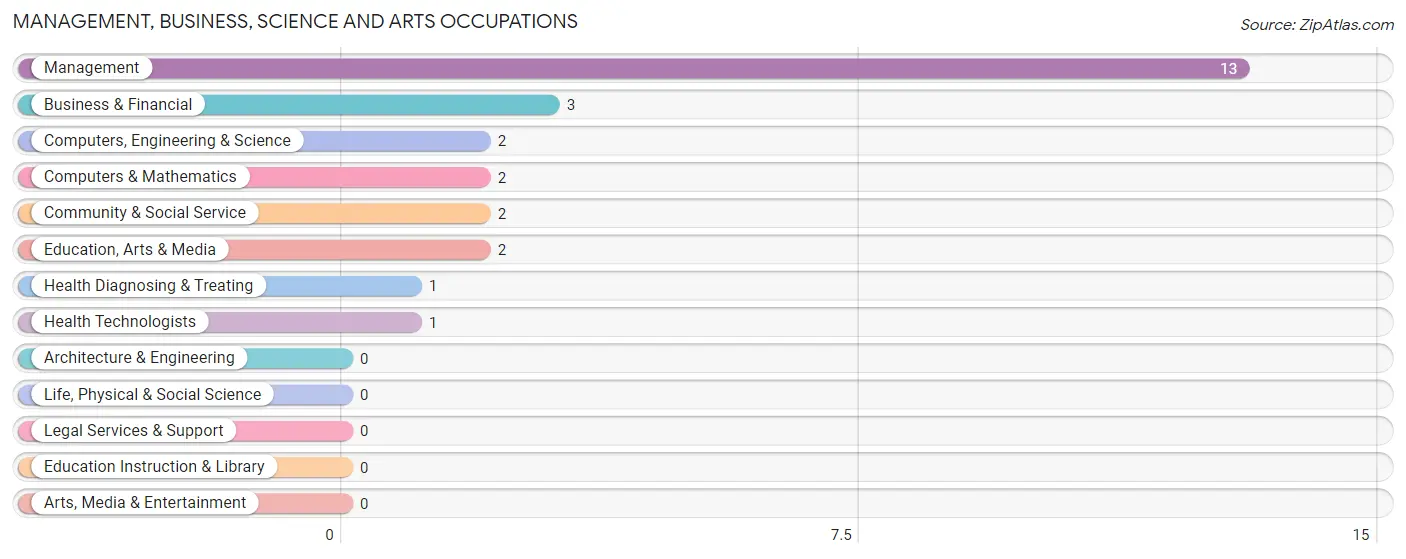
Management, Business, Science and Arts Occupations
The most common Management, Business, Science and Arts occupations in Bear Lake are Management (13 | 12.3%), Business & Financial (3 | 2.8%), Computers, Engineering & Science (2 | 1.9%), Computers & Mathematics (2 | 1.9%), and Community & Social Service (2 | 1.9%).
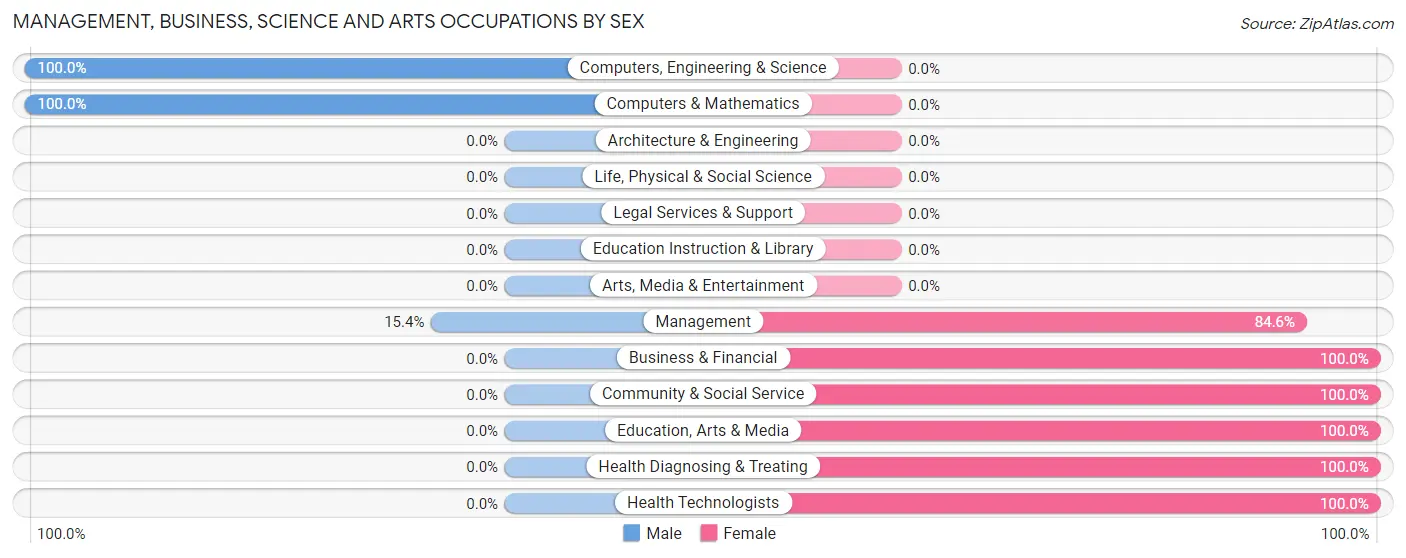
Management, Business, Science and Arts Occupations by Sex
Within the Management, Business, Science and Arts occupations in Bear Lake, the most male-oriented occupations are Computers, Engineering & Science (100.0%), Computers & Mathematics (100.0%), and Management (15.4%), while the most female-oriented occupations are Business & Financial (100.0%), Community & Social Service (100.0%), and Education, Arts & Media (100.0%).
| Occupation | Male | Female |
| Management | 2 (15.4%) | 11 (84.6%) |
| Business & Financial | 0 (0.0%) | 3 (100.0%) |
| Computers, Engineering & Science | 2 (100.0%) | 0 (0.0%) |
| Computers & Mathematics | 2 (100.0%) | 0 (0.0%) |
| Architecture & Engineering | 0 (0.0%) | 0 (0.0%) |
| Life, Physical & Social Science | 0 (0.0%) | 0 (0.0%) |
| Community & Social Service | 0 (0.0%) | 2 (100.0%) |
| Education, Arts & Media | 0 (0.0%) | 2 (100.0%) |
| Legal Services & Support | 0 (0.0%) | 0 (0.0%) |
| Education Instruction & Library | 0 (0.0%) | 0 (0.0%) |
| Arts, Media & Entertainment | 0 (0.0%) | 0 (0.0%) |
| Health Diagnosing & Treating | 0 (0.0%) | 1 (100.0%) |
| Health Technologists | 0 (0.0%) | 1 (100.0%) |
| Total (Category) | 4 (19.1%) | 17 (80.9%) |
| Total (Overall) | 51 (48.1%) | 55 (51.9%) |
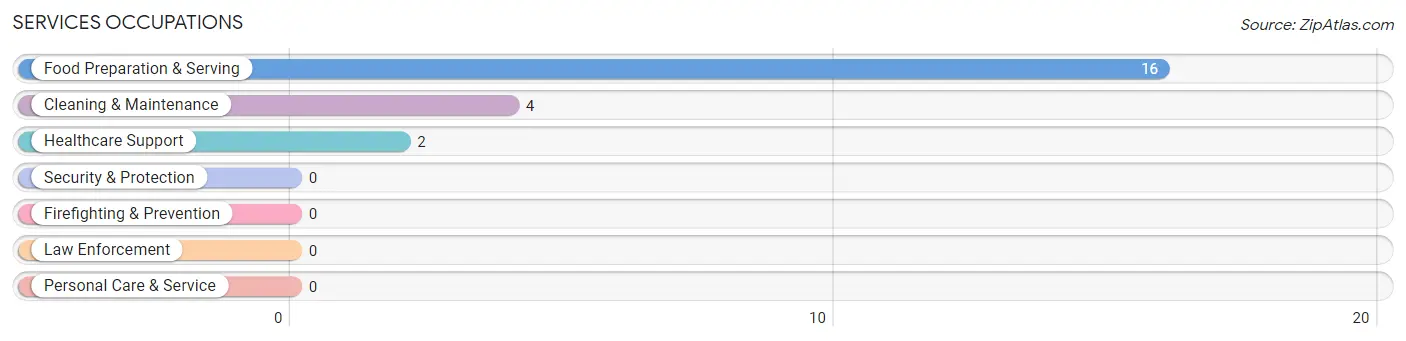
Services Occupations
The most common Services occupations in Bear Lake are Food Preparation & Serving (16 | 15.1%), Cleaning & Maintenance (4 | 3.8%), and Healthcare Support (2 | 1.9%).
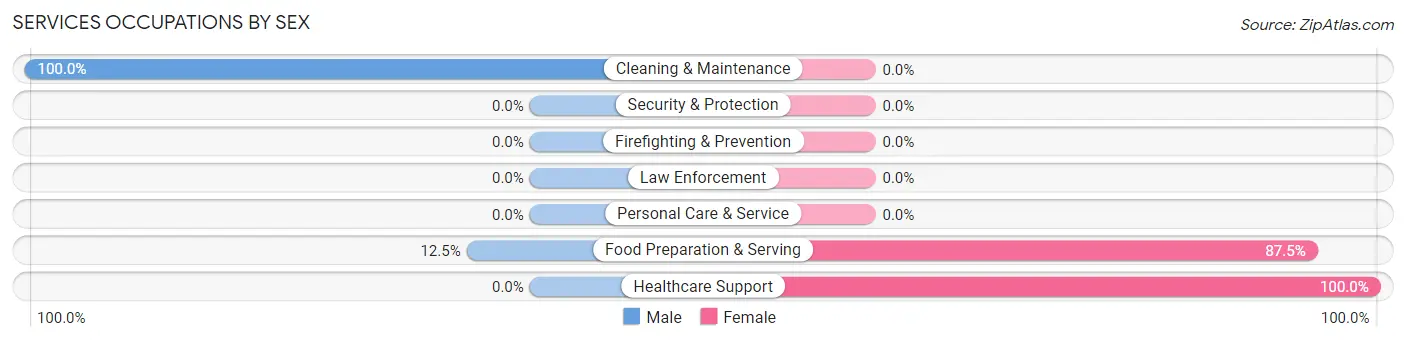
Services Occupations by Sex
Within the Services occupations in Bear Lake, the most male-oriented occupations are Cleaning & Maintenance (100.0%), and Food Preparation & Serving (12.5%), while the most female-oriented occupations are Healthcare Support (100.0%), and Food Preparation & Serving (87.5%).
| Occupation | Male | Female |
| Healthcare Support | 0 (0.0%) | 2 (100.0%) |
| Security & Protection | 0 (0.0%) | 0 (0.0%) |
| Firefighting & Prevention | 0 (0.0%) | 0 (0.0%) |
| Law Enforcement | 0 (0.0%) | 0 (0.0%) |
| Food Preparation & Serving | 2 (12.5%) | 14 (87.5%) |
| Cleaning & Maintenance | 4 (100.0%) | 0 (0.0%) |
| Personal Care & Service | 0 (0.0%) | 0 (0.0%) |
| Total (Category) | 6 (27.3%) | 16 (72.7%) |
| Total (Overall) | 51 (48.1%) | 55 (51.9%) |
Sales and Office Occupations
The most common Sales and Office occupations in Bear Lake are Sales & Related (5 | 4.7%), and Office & Administration (5 | 4.7%).
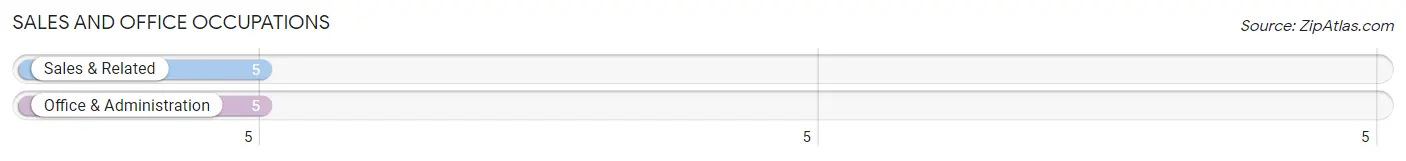
Sales and Office Occupations by Sex
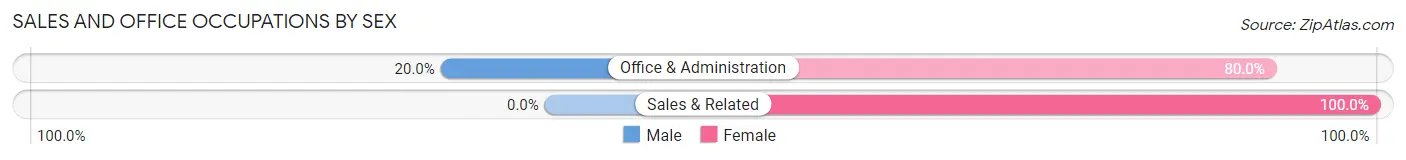
| Occupation | Male | Female |
| Sales & Related | 0 (0.0%) | 5 (100.0%) |
| Office & Administration | 1 (20.0%) | 4 (80.0%) |
| Total (Category) | 1 (10.0%) | 9 (90.0%) |
| Total (Overall) | 51 (48.1%) | 55 (51.9%) |
Natural Resources, Construction and Maintenance Occupations
The most common Natural Resources, Construction and Maintenance occupations in Bear Lake are Construction & Extraction (7 | 6.6%), and Installation, Maintenance & Repair (3 | 2.8%).
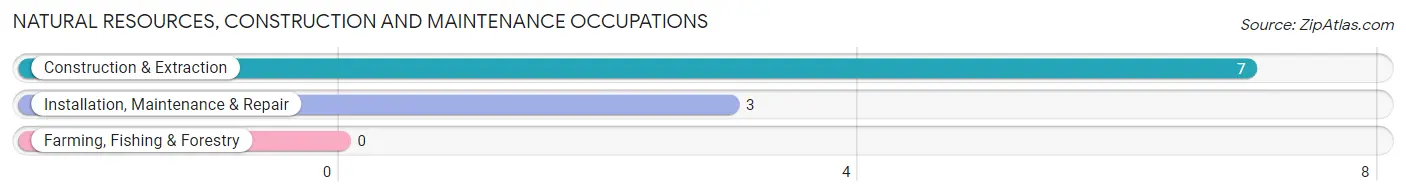
Natural Resources, Construction and Maintenance Occupations by Sex
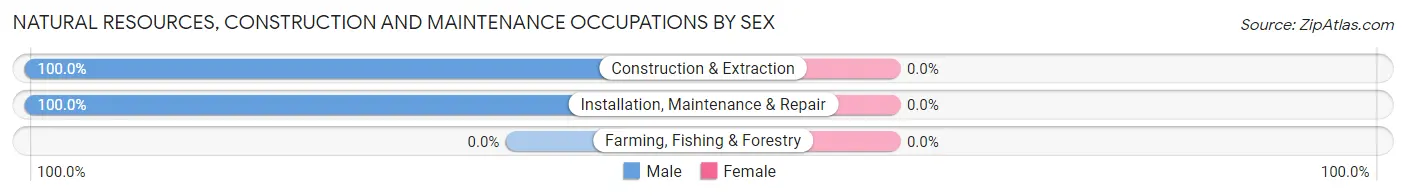
| Occupation | Male | Female |
| Farming, Fishing & Forestry | 0 (0.0%) | 0 (0.0%) |
| Construction & Extraction | 7 (100.0%) | 0 (0.0%) |
| Installation, Maintenance & Repair | 3 (100.0%) | 0 (0.0%) |
| Total (Category) | 10 (100.0%) | 0 (0.0%) |
| Total (Overall) | 51 (48.1%) | 55 (51.9%) |
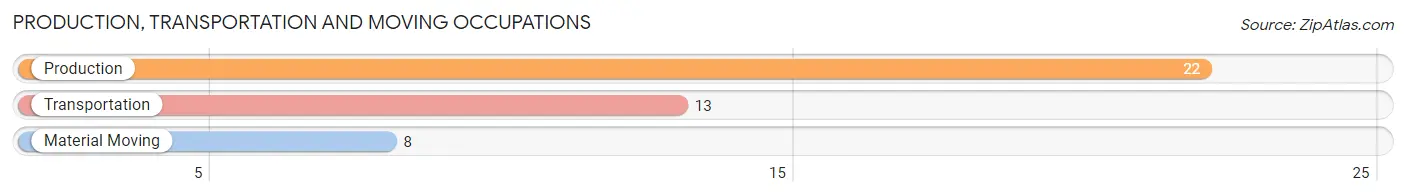
Production, Transportation and Moving Occupations
The most common Production, Transportation and Moving occupations in Bear Lake are Production (22 | 20.7%), Transportation (13 | 12.3%), and Material Moving (8 | 7.5%).
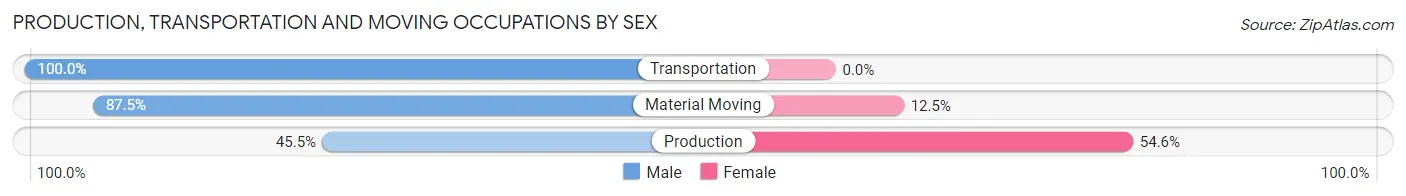
Production, Transportation and Moving Occupations by Sex
| Occupation | Male | Female |
| Production | 10 (45.5%) | 12 (54.5%) |
| Transportation | 13 (100.0%) | 0 (0.0%) |
| Material Moving | 7 (87.5%) | 1 (12.5%) |
| Total (Category) | 30 (69.8%) | 13 (30.2%) |
| Total (Overall) | 51 (48.1%) | 55 (51.9%) |
Employment Industries by Sex in Bear Lake
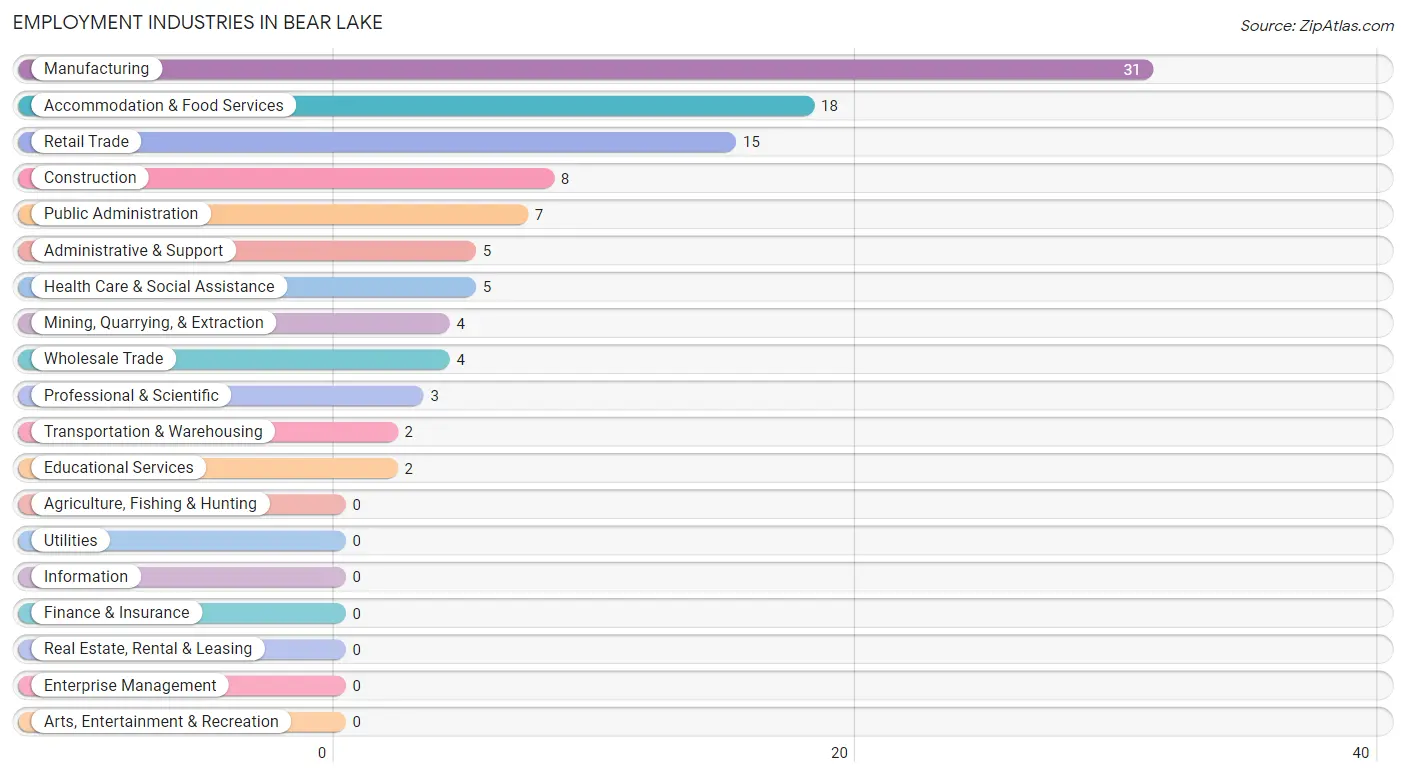
Employment Industries in Bear Lake
The major employment industries in Bear Lake include Manufacturing (31 | 29.2%), Accommodation & Food Services (18 | 17.0%), Retail Trade (15 | 14.1%), Construction (8 | 7.5%), and Public Administration (7 | 6.6%).
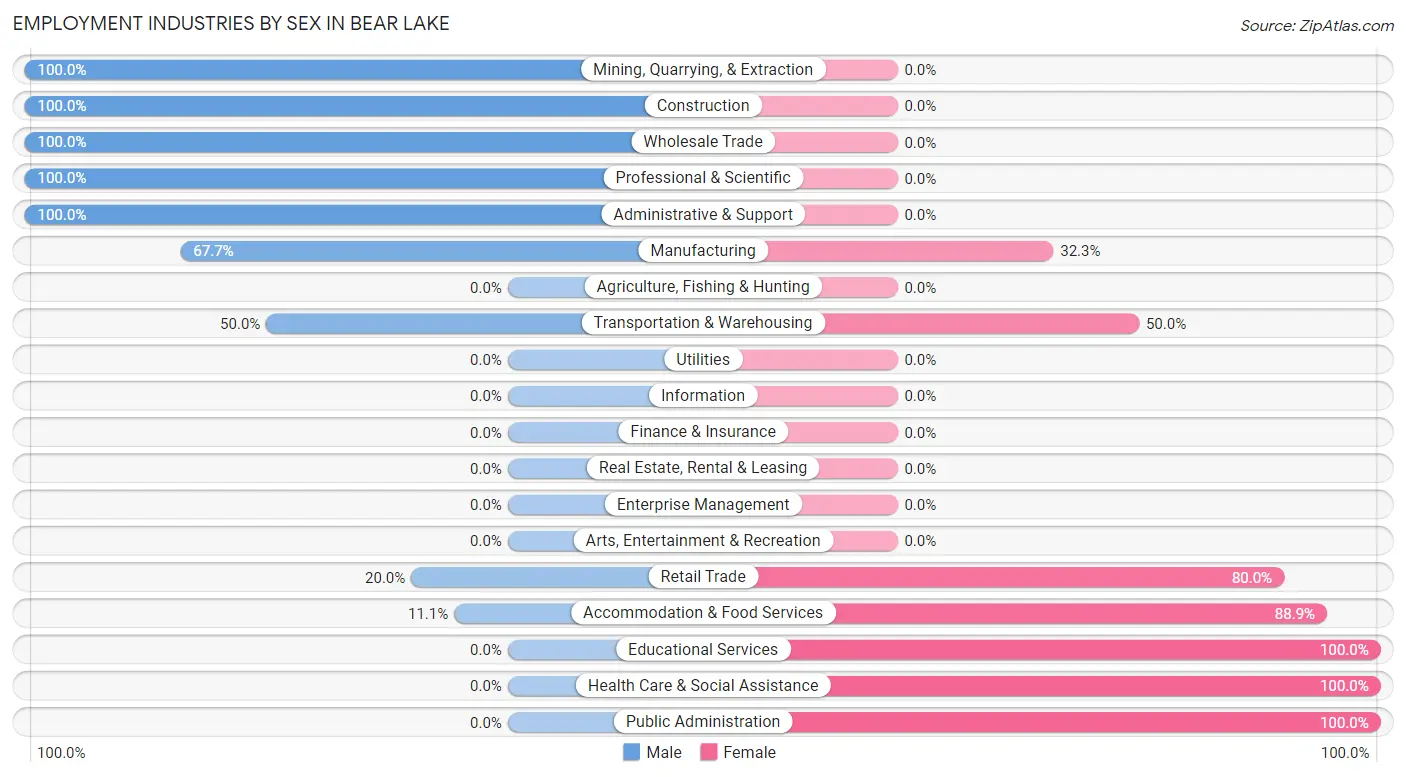
Employment Industries by Sex in Bear Lake
The Bear Lake industries that see more men than women are Mining, Quarrying, & Extraction (100.0%), Construction (100.0%), and Wholesale Trade (100.0%), whereas the industries that tend to have a higher number of women are Educational Services (100.0%), Health Care & Social Assistance (100.0%), and Public Administration (100.0%).
| Industry | Male | Female |
| Agriculture, Fishing & Hunting | 0 (0.0%) | 0 (0.0%) |
| Mining, Quarrying, & Extraction | 4 (100.0%) | 0 (0.0%) |
| Construction | 8 (100.0%) | 0 (0.0%) |
| Manufacturing | 21 (67.7%) | 10 (32.3%) |
| Wholesale Trade | 4 (100.0%) | 0 (0.0%) |
| Retail Trade | 3 (20.0%) | 12 (80.0%) |
| Transportation & Warehousing | 1 (50.0%) | 1 (50.0%) |
| Utilities | 0 (0.0%) | 0 (0.0%) |
| Information | 0 (0.0%) | 0 (0.0%) |
| Finance & Insurance | 0 (0.0%) | 0 (0.0%) |
| Real Estate, Rental & Leasing | 0 (0.0%) | 0 (0.0%) |
| Professional & Scientific | 3 (100.0%) | 0 (0.0%) |
| Enterprise Management | 0 (0.0%) | 0 (0.0%) |
| Administrative & Support | 5 (100.0%) | 0 (0.0%) |
| Educational Services | 0 (0.0%) | 2 (100.0%) |
| Health Care & Social Assistance | 0 (0.0%) | 5 (100.0%) |
| Arts, Entertainment & Recreation | 0 (0.0%) | 0 (0.0%) |
| Accommodation & Food Services | 2 (11.1%) | 16 (88.9%) |
| Public Administration | 0 (0.0%) | 7 (100.0%) |
| Total | 51 (48.1%) | 55 (51.9%) |
Education in Bear Lake
School Enrollment in Bear Lake
The most common levels of schooling among the 49 students in Bear Lake are college / undergraduate (16 | 32.7%), high school (13 | 26.5%), and middle school (10 | 20.4%).
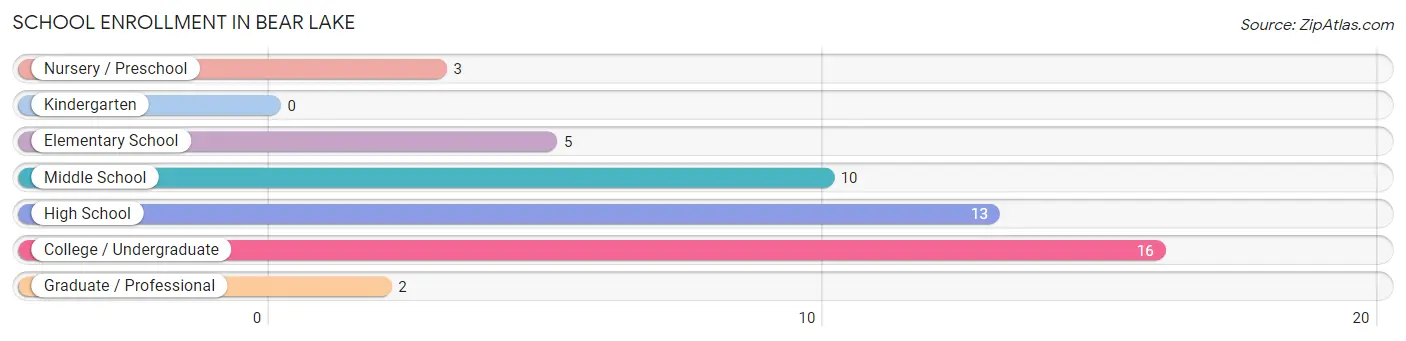
| School Level | # Students | % Students |
| Nursery / Preschool | 3 | 6.1% |
| Kindergarten | 0 | 0.0% |
| Elementary School | 5 | 10.2% |
| Middle School | 10 | 20.4% |
| High School | 13 | 26.5% |
| College / Undergraduate | 16 | 32.7% |
| Graduate / Professional | 2 | 4.1% |
| Total | 49 | 100.0% |
School Enrollment by Age by Funding Source in Bear Lake
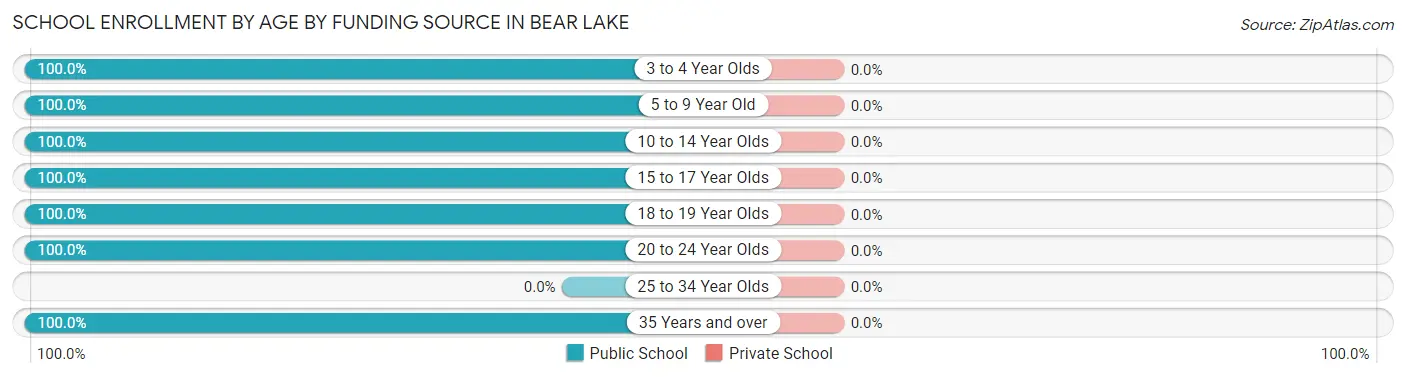
| Age Bracket | Public School | Private School |
| 3 to 4 Year Olds | 3 (100.0%) | 0 (0.0%) |
| 5 to 9 Year Old | 5 (100.0%) | 0 (0.0%) |
| 10 to 14 Year Olds | 10 (100.0%) | 0 (0.0%) |
| 15 to 17 Year Olds | 13 (100.0%) | 0 (0.0%) |
| 18 to 19 Year Olds | 14 (100.0%) | 0 (0.0%) |
| 20 to 24 Year Olds | 2 (100.0%) | 0 (0.0%) |
| 25 to 34 Year Olds | 0 (0.0%) | 0 (0.0%) |
| 35 Years and over | 2 (100.0%) | 0 (0.0%) |
| Total | 49 (100.0%) | 0 (0.0%) |
Educational Attainment by Field of Study in Bear Lake
Business (5 | 21.7%), liberal arts & history (4 | 17.4%), arts & humanities (4 | 17.4%), science & technology (3 | 13.0%), and education (3 | 13.0%) are the most common fields of study among 23 individuals in Bear Lake who have obtained a bachelor's degree or higher.
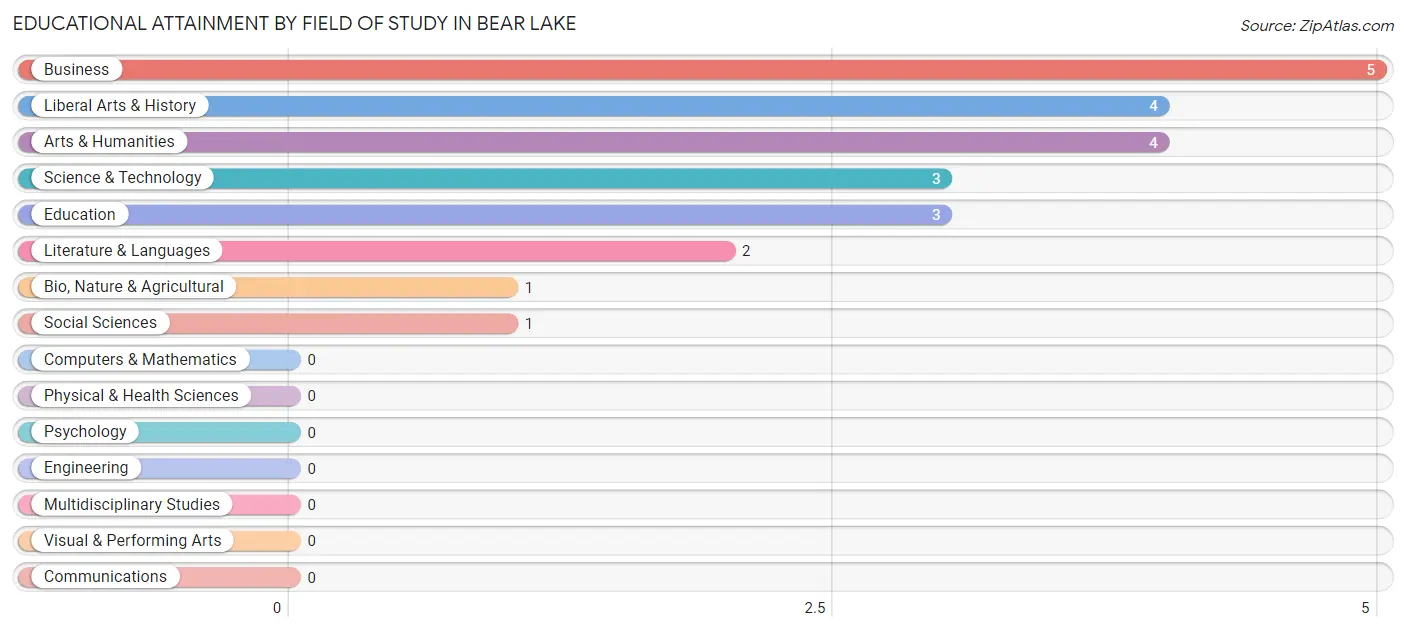
| Field of Study | # Graduates | % Graduates |
| Computers & Mathematics | 0 | 0.0% |
| Bio, Nature & Agricultural | 1 | 4.3% |
| Physical & Health Sciences | 0 | 0.0% |
| Psychology | 0 | 0.0% |
| Social Sciences | 1 | 4.3% |
| Engineering | 0 | 0.0% |
| Multidisciplinary Studies | 0 | 0.0% |
| Science & Technology | 3 | 13.0% |
| Business | 5 | 21.7% |
| Education | 3 | 13.0% |
| Literature & Languages | 2 | 8.7% |
| Liberal Arts & History | 4 | 17.4% |
| Visual & Performing Arts | 0 | 0.0% |
| Communications | 0 | 0.0% |
| Arts & Humanities | 4 | 17.4% |
| Total | 23 | 100.0% |
Transportation & Commute in Bear Lake
Vehicle Availability by Sex in Bear Lake
The most prevalent vehicle ownership categories in Bear Lake are males with 2 vehicles (21, accounting for 41.2%) and females with 2 vehicles (12, making up 38.2%).
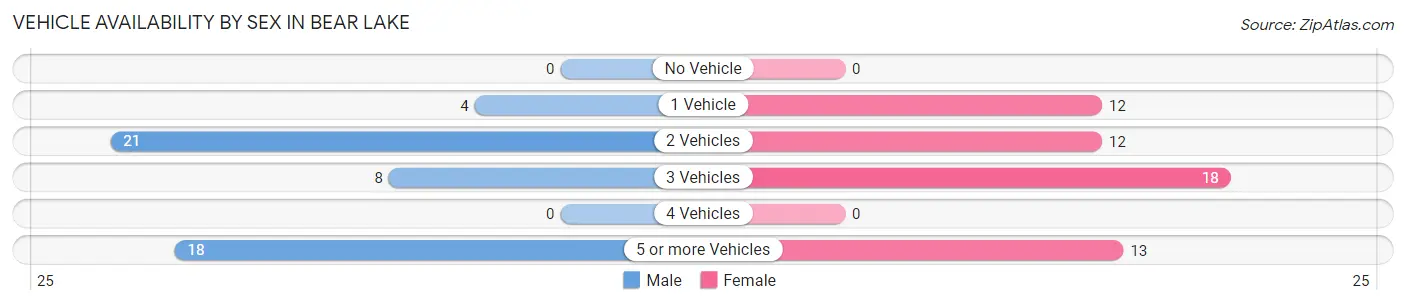
| Vehicles Available | Male | Female |
| No Vehicle | 0 (0.0%) | 0 (0.0%) |
| 1 Vehicle | 4 (7.8%) | 12 (21.8%) |
| 2 Vehicles | 21 (41.2%) | 12 (21.8%) |
| 3 Vehicles | 8 (15.7%) | 18 (32.7%) |
| 4 Vehicles | 0 (0.0%) | 0 (0.0%) |
| 5 or more Vehicles | 18 (35.3%) | 13 (23.6%) |
| Total | 51 (100.0%) | 55 (100.0%) |
Commute Time in Bear Lake
The most frequently occuring commute durations in Bear Lake are 5 to 9 minutes (30 commuters, 29.4%), 10 to 14 minutes (16 commuters, 15.7%), and less than 5 minutes (11 commuters, 10.8%).
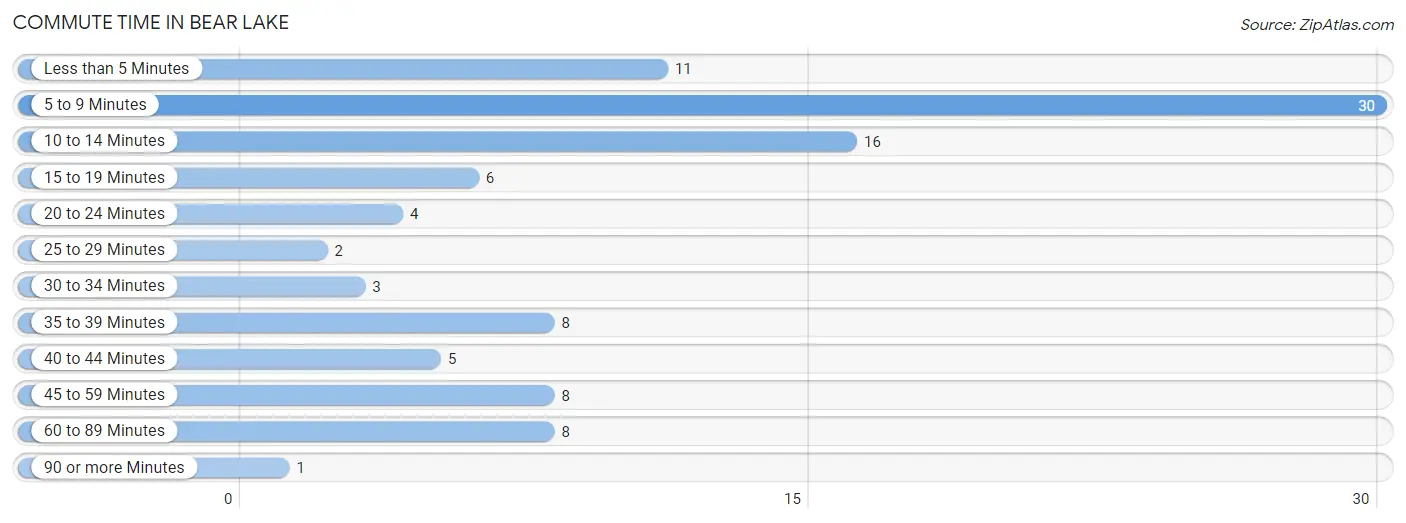
| Commute Time | # Commuters | % Commuters |
| Less than 5 Minutes | 11 | 10.8% |
| 5 to 9 Minutes | 30 | 29.4% |
| 10 to 14 Minutes | 16 | 15.7% |
| 15 to 19 Minutes | 6 | 5.9% |
| 20 to 24 Minutes | 4 | 3.9% |
| 25 to 29 Minutes | 2 | 2.0% |
| 30 to 34 Minutes | 3 | 2.9% |
| 35 to 39 Minutes | 8 | 7.8% |
| 40 to 44 Minutes | 5 | 4.9% |
| 45 to 59 Minutes | 8 | 7.8% |
| 60 to 89 Minutes | 8 | 7.8% |
| 90 or more Minutes | 1 | 1.0% |
Commute Time by Sex in Bear Lake
The most common commute times in Bear Lake are 5 to 9 minutes (23 commuters, 45.1%) for males and 10 to 14 minutes (15 commuters, 29.4%) for females.
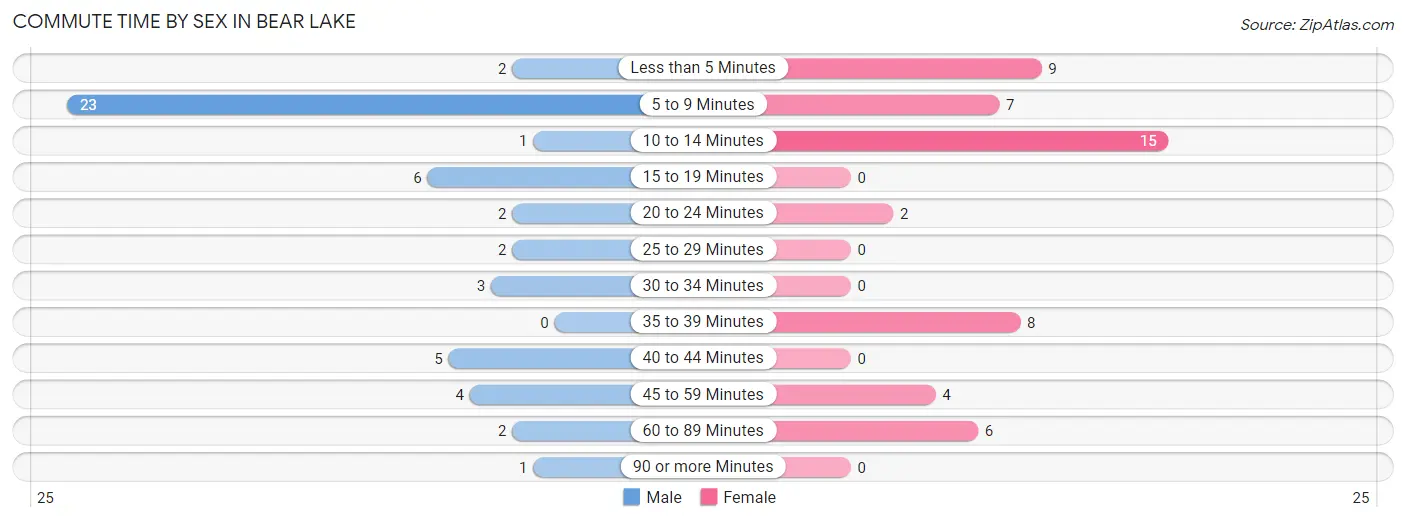
| Commute Time | Male | Female |
| Less than 5 Minutes | 2 (3.9%) | 9 (17.6%) |
| 5 to 9 Minutes | 23 (45.1%) | 7 (13.7%) |
| 10 to 14 Minutes | 1 (2.0%) | 15 (29.4%) |
| 15 to 19 Minutes | 6 (11.8%) | 0 (0.0%) |
| 20 to 24 Minutes | 2 (3.9%) | 2 (3.9%) |
| 25 to 29 Minutes | 2 (3.9%) | 0 (0.0%) |
| 30 to 34 Minutes | 3 (5.9%) | 0 (0.0%) |
| 35 to 39 Minutes | 0 (0.0%) | 8 (15.7%) |
| 40 to 44 Minutes | 5 (9.8%) | 0 (0.0%) |
| 45 to 59 Minutes | 4 (7.8%) | 4 (7.8%) |
| 60 to 89 Minutes | 2 (3.9%) | 6 (11.8%) |
| 90 or more Minutes | 1 (2.0%) | 0 (0.0%) |
Time of Departure to Work by Sex in Bear Lake
The most frequent times of departure to work in Bear Lake are 6:30 AM to 6:59 AM (14, 27.5%) for males and 12:00 PM to 3:59 PM (16, 31.4%) for females.
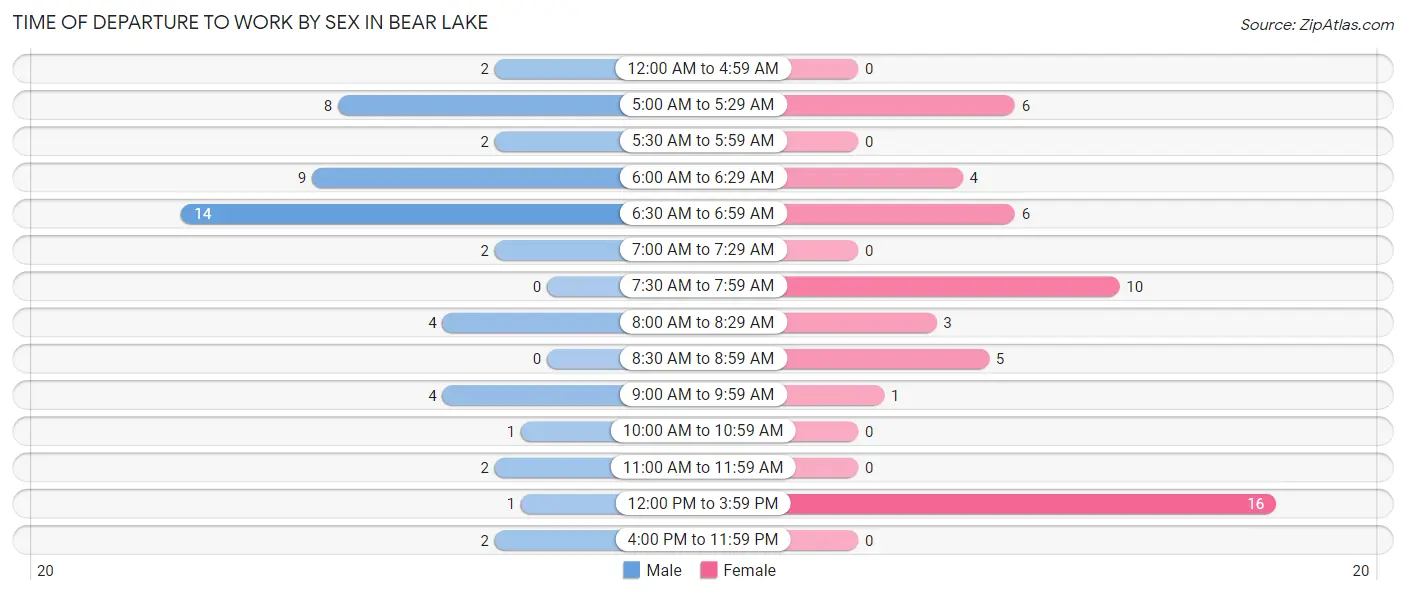
| Time of Departure | Male | Female |
| 12:00 AM to 4:59 AM | 2 (3.9%) | 0 (0.0%) |
| 5:00 AM to 5:29 AM | 8 (15.7%) | 6 (11.8%) |
| 5:30 AM to 5:59 AM | 2 (3.9%) | 0 (0.0%) |
| 6:00 AM to 6:29 AM | 9 (17.6%) | 4 (7.8%) |
| 6:30 AM to 6:59 AM | 14 (27.5%) | 6 (11.8%) |
| 7:00 AM to 7:29 AM | 2 (3.9%) | 0 (0.0%) |
| 7:30 AM to 7:59 AM | 0 (0.0%) | 10 (19.6%) |
| 8:00 AM to 8:29 AM | 4 (7.8%) | 3 (5.9%) |
| 8:30 AM to 8:59 AM | 0 (0.0%) | 5 (9.8%) |
| 9:00 AM to 9:59 AM | 4 (7.8%) | 1 (2.0%) |
| 10:00 AM to 10:59 AM | 1 (2.0%) | 0 (0.0%) |
| 11:00 AM to 11:59 AM | 2 (3.9%) | 0 (0.0%) |
| 12:00 PM to 3:59 PM | 1 (2.0%) | 16 (31.4%) |
| 4:00 PM to 11:59 PM | 2 (3.9%) | 0 (0.0%) |
| Total | 51 (100.0%) | 51 (100.0%) |
Housing Occupancy in Bear Lake
Occupancy by Ownership in Bear Lake
Of the total 164 dwellings in Bear Lake, owner-occupied units account for 151 (92.1%), while renter-occupied units make up 13 (7.9%).
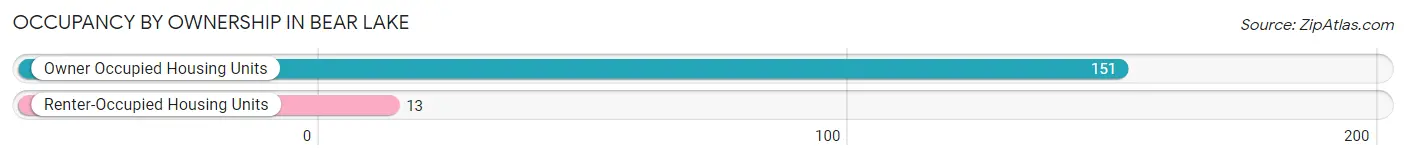
| Occupancy | # Housing Units | % Housing Units |
| Owner Occupied Housing Units | 151 | 92.1% |
| Renter-Occupied Housing Units | 13 | 7.9% |
| Total Occupied Housing Units | 164 | 100.0% |
Occupancy by Household Size in Bear Lake
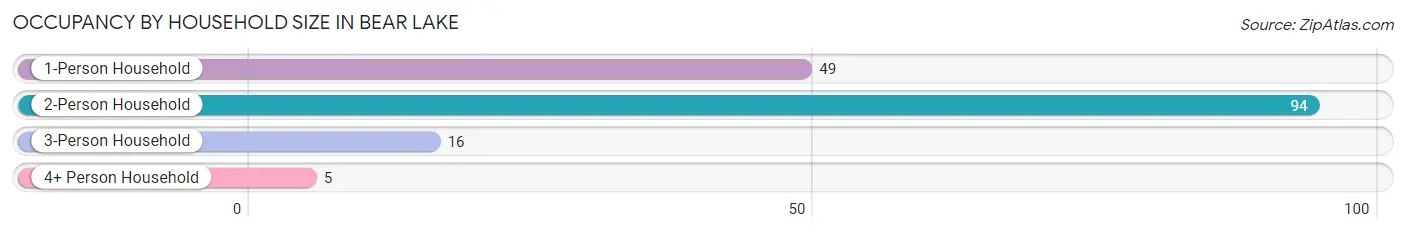
| Household Size | # Housing Units | % Housing Units |
| 1-Person Household | 49 | 29.9% |
| 2-Person Household | 94 | 57.3% |
| 3-Person Household | 16 | 9.8% |
| 4+ Person Household | 5 | 3.0% |
| Total Housing Units | 164 | 100.0% |
Occupancy by Ownership by Household Size in Bear Lake
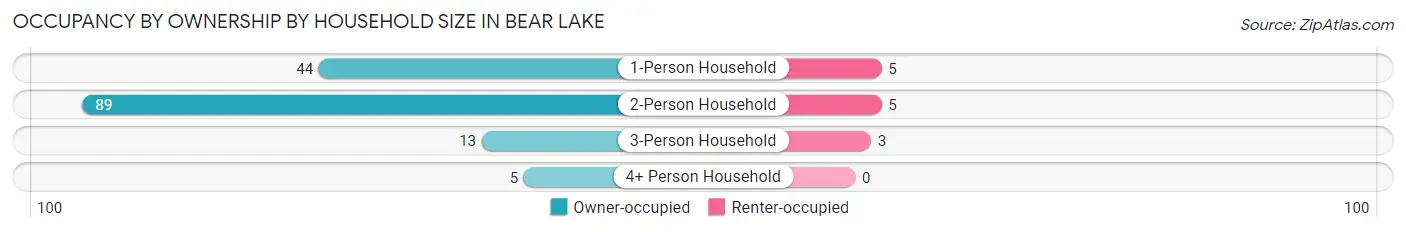
| Household Size | Owner-occupied | Renter-occupied |
| 1-Person Household | 44 (89.8%) | 5 (10.2%) |
| 2-Person Household | 89 (94.7%) | 5 (5.3%) |
| 3-Person Household | 13 (81.2%) | 3 (18.8%) |
| 4+ Person Household | 5 (100.0%) | 0 (0.0%) |
| Total Housing Units | 151 (92.1%) | 13 (7.9%) |
Occupancy by Educational Attainment in Bear Lake
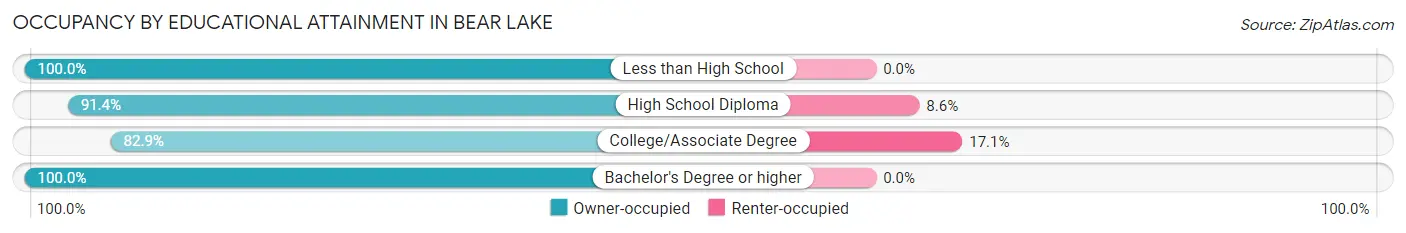
| Household Size | Owner-occupied | Renter-occupied |
| Less than High School | 2 (100.0%) | 0 (0.0%) |
| High School Diploma | 64 (91.4%) | 6 (8.6%) |
| College/Associate Degree | 34 (82.9%) | 7 (17.1%) |
| Bachelor's Degree or higher | 51 (100.0%) | 0 (0.0%) |
Occupancy by Age of Householder in Bear Lake
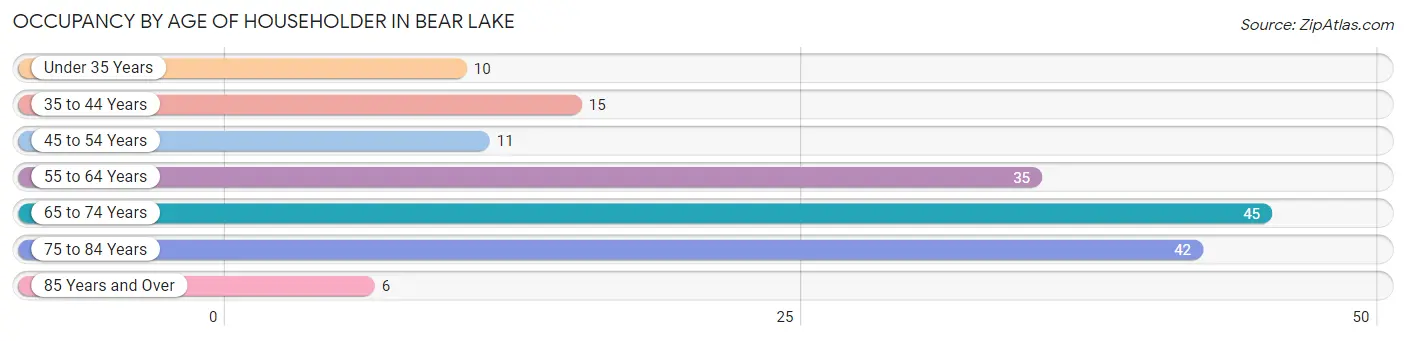
| Age Bracket | # Households | % Households |
| Under 35 Years | 10 | 6.1% |
| 35 to 44 Years | 15 | 9.1% |
| 45 to 54 Years | 11 | 6.7% |
| 55 to 64 Years | 35 | 21.3% |
| 65 to 74 Years | 45 | 27.4% |
| 75 to 84 Years | 42 | 25.6% |
| 85 Years and Over | 6 | 3.7% |
| Total | 164 | 100.0% |
Housing Finances in Bear Lake
Median Income by Occupancy in Bear Lake
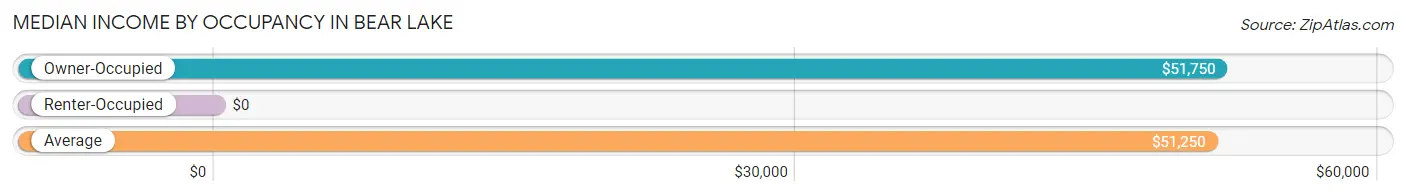
| Occupancy Type | # Households | Median Income |
| Owner-Occupied | 88 (95.7%) | $51,750 |
| Renter-Occupied | 4 (4.3%) | $0 |
| Average | 92 (100.0%) | $51,250 |
Occupancy by Householder Income Bracket in Bear Lake
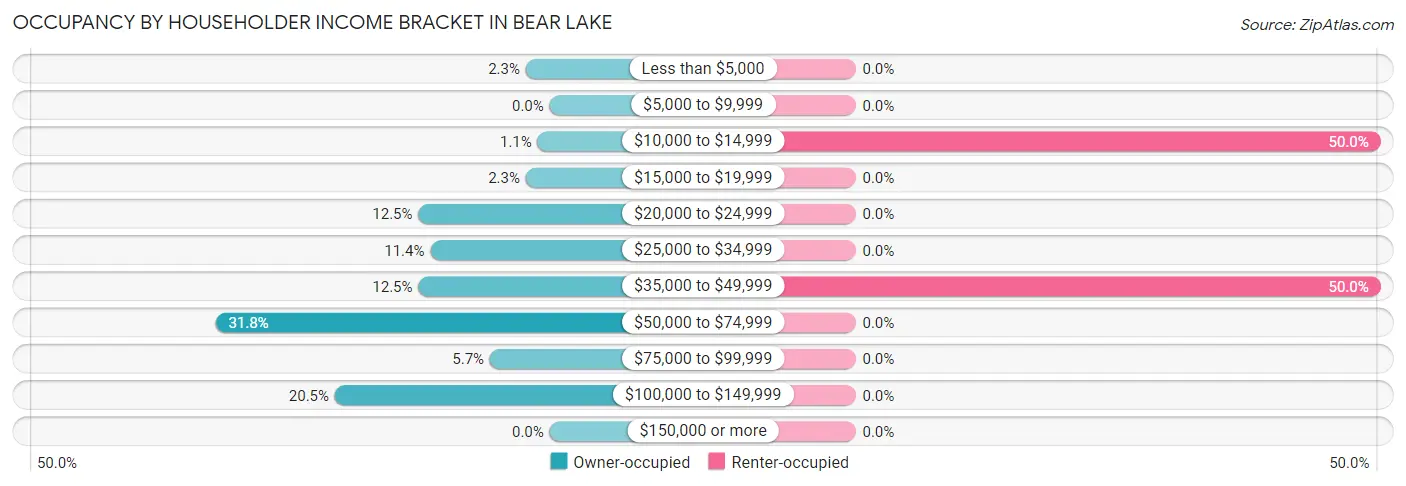
| Income Bracket | Owner-occupied | Renter-occupied |
| Less than $5,000 | 2 (2.3%) | 0 (0.0%) |
| $5,000 to $9,999 | 0 (0.0%) | 0 (0.0%) |
| $10,000 to $14,999 | 1 (1.1%) | 2 (50.0%) |
| $15,000 to $19,999 | 2 (2.3%) | 0 (0.0%) |
| $20,000 to $24,999 | 11 (12.5%) | 0 (0.0%) |
| $25,000 to $34,999 | 10 (11.4%) | 0 (0.0%) |
| $35,000 to $49,999 | 11 (12.5%) | 2 (50.0%) |
| $50,000 to $74,999 | 28 (31.8%) | 0 (0.0%) |
| $75,000 to $99,999 | 5 (5.7%) | 0 (0.0%) |
| $100,000 to $149,999 | 18 (20.4%) | 0 (0.0%) |
| $150,000 or more | 0 (0.0%) | 0 (0.0%) |
| Total | 88 (100.0%) | 4 (100.0%) |
Monthly Housing Cost Tiers in Bear Lake
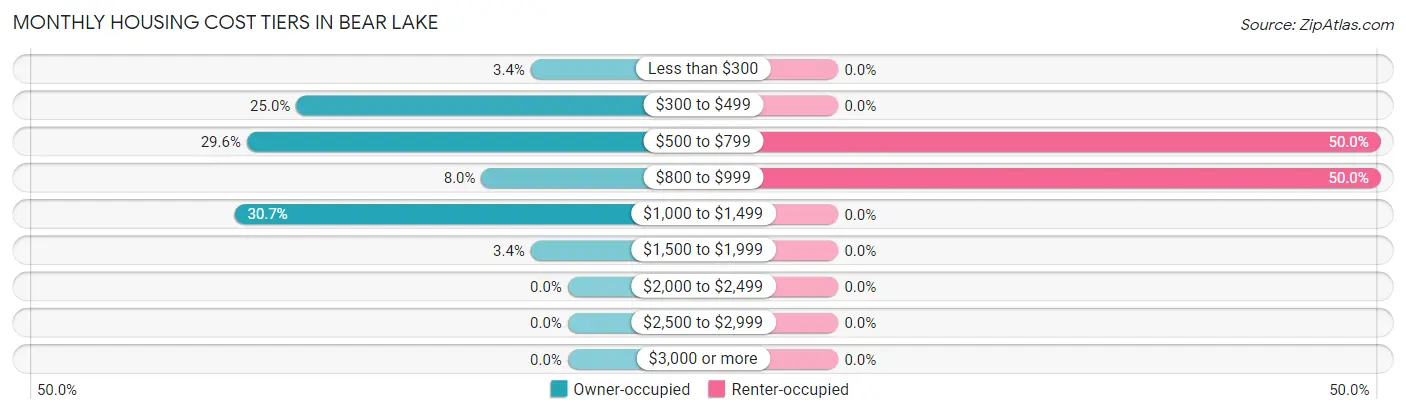
| Monthly Cost | Owner-occupied | Renter-occupied |
| Less than $300 | 3 (3.4%) | 0 (0.0%) |
| $300 to $499 | 22 (25.0%) | 0 (0.0%) |
| $500 to $799 | 26 (29.5%) | 2 (50.0%) |
| $800 to $999 | 7 (8.0%) | 2 (50.0%) |
| $1,000 to $1,499 | 27 (30.7%) | 0 (0.0%) |
| $1,500 to $1,999 | 3 (3.4%) | 0 (0.0%) |
| $2,000 to $2,499 | 0 (0.0%) | 0 (0.0%) |
| $2,500 to $2,999 | 0 (0.0%) | 0 (0.0%) |
| $3,000 or more | 0 (0.0%) | 0 (0.0%) |
| Total | 88 (100.0%) | 4 (100.0%) |
Physical Housing Characteristics in Bear Lake
Housing Structures in Bear Lake
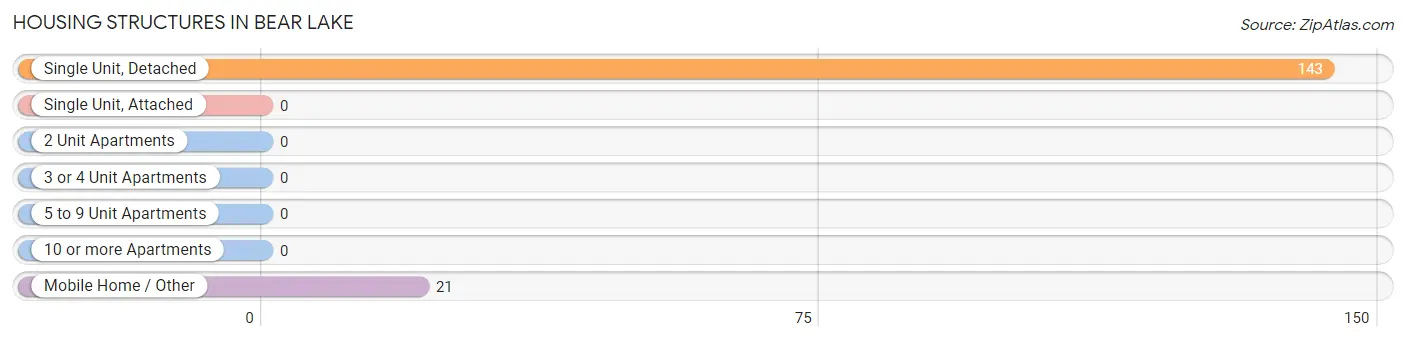
| Structure Type | # Housing Units | % Housing Units |
| Single Unit, Detached | 143 | 87.2% |
| Single Unit, Attached | 0 | 0.0% |
| 2 Unit Apartments | 0 | 0.0% |
| 3 or 4 Unit Apartments | 0 | 0.0% |
| 5 to 9 Unit Apartments | 0 | 0.0% |
| 10 or more Apartments | 0 | 0.0% |
| Mobile Home / Other | 21 | 12.8% |
| Total | 164 | 100.0% |
Housing Structures by Occupancy in Bear Lake
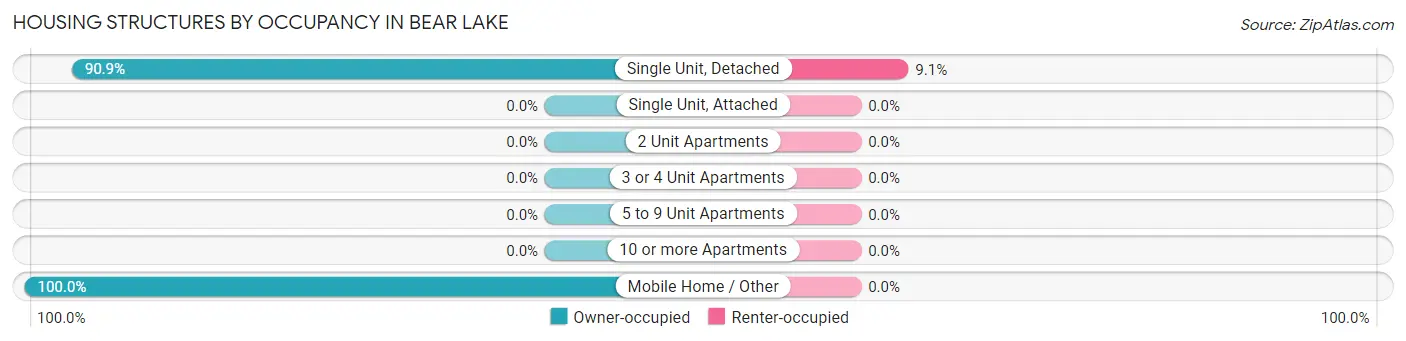
| Structure Type | Owner-occupied | Renter-occupied |
| Single Unit, Detached | 130 (90.9%) | 13 (9.1%) |
| Single Unit, Attached | 0 (0.0%) | 0 (0.0%) |
| 2 Unit Apartments | 0 (0.0%) | 0 (0.0%) |
| 3 or 4 Unit Apartments | 0 (0.0%) | 0 (0.0%) |
| 5 to 9 Unit Apartments | 0 (0.0%) | 0 (0.0%) |
| 10 or more Apartments | 0 (0.0%) | 0 (0.0%) |
| Mobile Home / Other | 21 (100.0%) | 0 (0.0%) |
| Total | 151 (92.1%) | 13 (7.9%) |
Housing Structures by Number of Rooms in Bear Lake
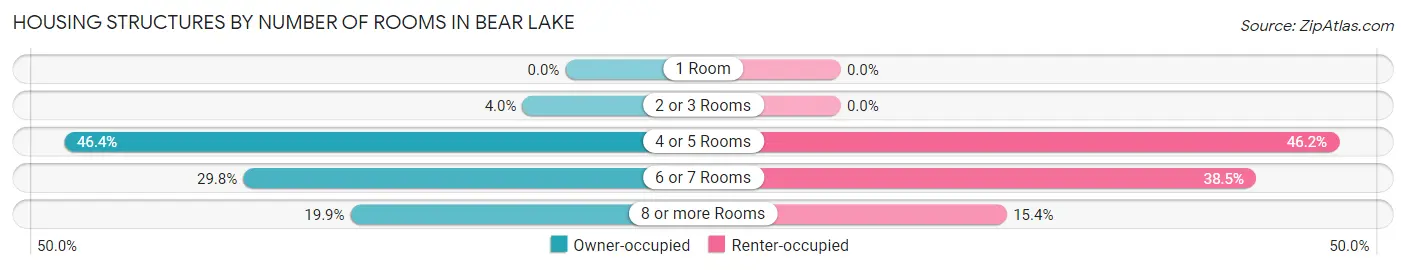
| Number of Rooms | Owner-occupied | Renter-occupied |
| 1 Room | 0 (0.0%) | 0 (0.0%) |
| 2 or 3 Rooms | 6 (4.0%) | 0 (0.0%) |
| 4 or 5 Rooms | 70 (46.4%) | 6 (46.2%) |
| 6 or 7 Rooms | 45 (29.8%) | 5 (38.5%) |
| 8 or more Rooms | 30 (19.9%) | 2 (15.4%) |
| Total | 151 (100.0%) | 13 (100.0%) |
Housing Structure by Heating Type in Bear Lake
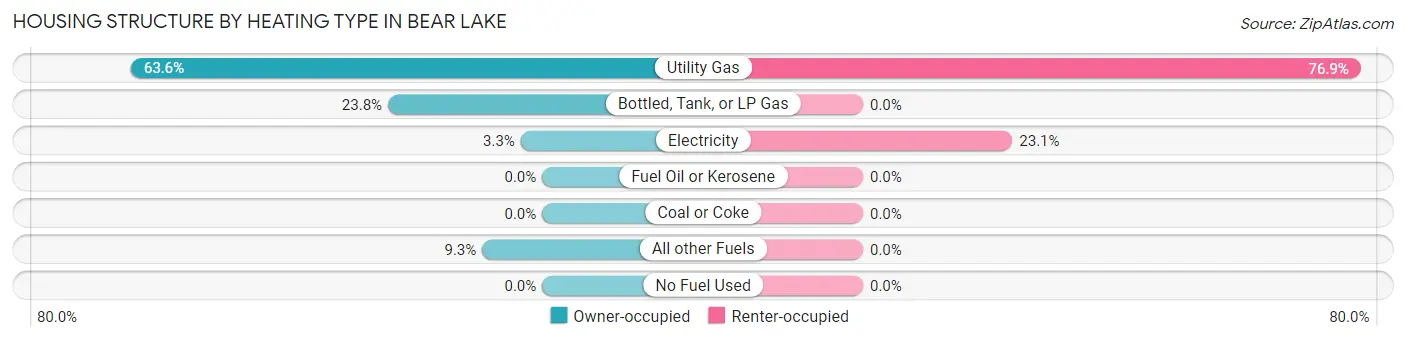
| Heating Type | Owner-occupied | Renter-occupied |
| Utility Gas | 96 (63.6%) | 10 (76.9%) |
| Bottled, Tank, or LP Gas | 36 (23.8%) | 0 (0.0%) |
| Electricity | 5 (3.3%) | 3 (23.1%) |
| Fuel Oil or Kerosene | 0 (0.0%) | 0 (0.0%) |
| Coal or Coke | 0 (0.0%) | 0 (0.0%) |
| All other Fuels | 14 (9.3%) | 0 (0.0%) |
| No Fuel Used | 0 (0.0%) | 0 (0.0%) |
| Total | 151 (100.0%) | 13 (100.0%) |
Household Vehicle Usage in Bear Lake
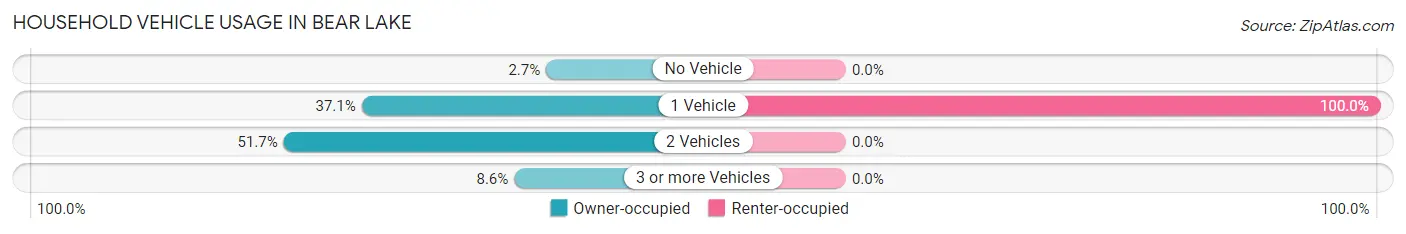
| Vehicles per Household | Owner-occupied | Renter-occupied |
| No Vehicle | 4 (2.6%) | 0 (0.0%) |
| 1 Vehicle | 56 (37.1%) | 13 (100.0%) |
| 2 Vehicles | 78 (51.7%) | 0 (0.0%) |
| 3 or more Vehicles | 13 (8.6%) | 0 (0.0%) |
| Total | 151 (100.0%) | 13 (100.0%) |
Real Estate & Mortgages in Bear Lake
Real Estate and Mortgage Overview in Bear Lake
| Characteristic | Without Mortgage | With Mortgage |
| Housing Units | 30 | 58 |
| Median Property Value | $112,500 | $82,500 |
| Median Household Income | $47,143 | $0 |
| Monthly Housing Costs | $453 | $0 |
| Real Estate Taxes | $1,679 | $8 |
Property Value by Mortgage Status in Bear Lake
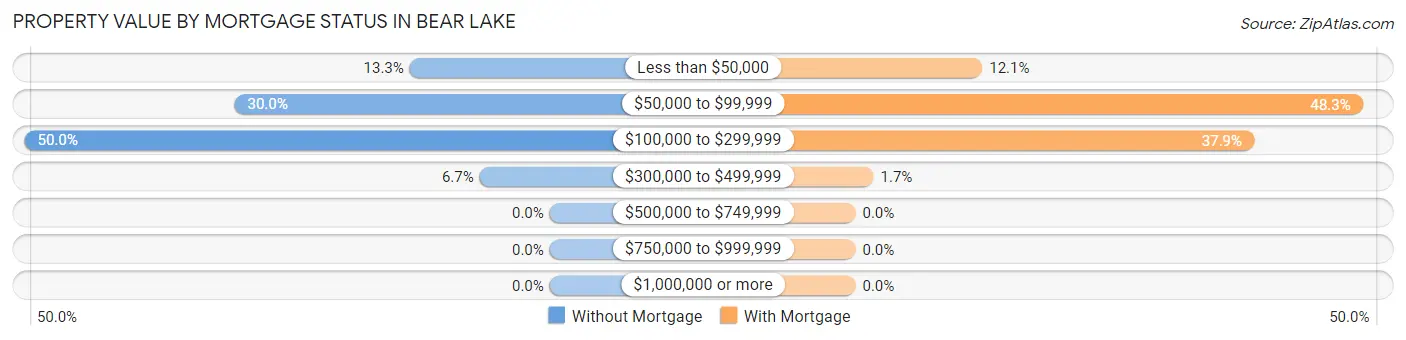
| Property Value | Without Mortgage | With Mortgage |
| Less than $50,000 | 4 (13.3%) | 7 (12.1%) |
| $50,000 to $99,999 | 9 (30.0%) | 28 (48.3%) |
| $100,000 to $299,999 | 15 (50.0%) | 22 (37.9%) |
| $300,000 to $499,999 | 2 (6.7%) | 1 (1.7%) |
| $500,000 to $749,999 | 0 (0.0%) | 0 (0.0%) |
| $750,000 to $999,999 | 0 (0.0%) | 0 (0.0%) |
| $1,000,000 or more | 0 (0.0%) | 0 (0.0%) |
| Total | 30 (100.0%) | 58 (100.0%) |
Household Income by Mortgage Status in Bear Lake
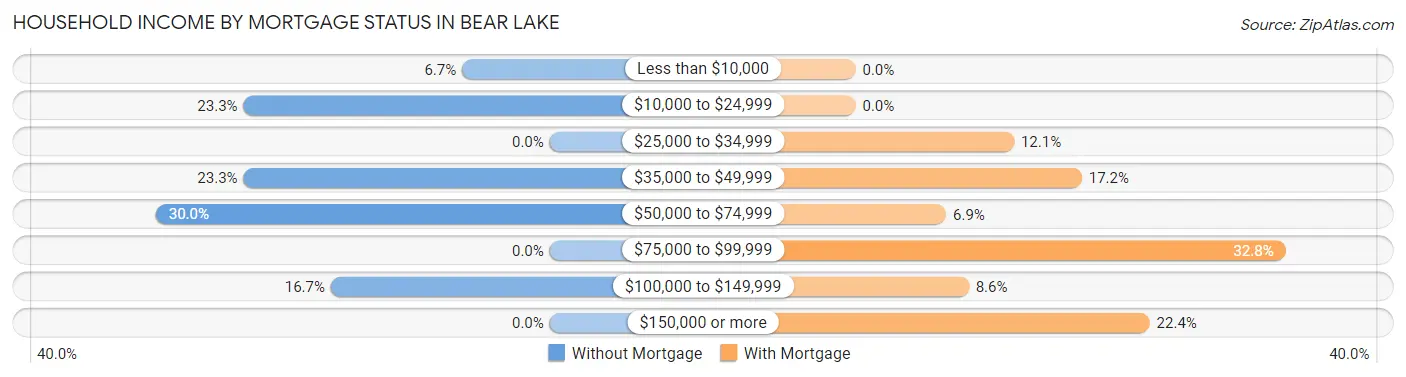
| Household Income | Without Mortgage | With Mortgage |
| Less than $10,000 | 2 (6.7%) | 0 (0.0%) |
| $10,000 to $24,999 | 7 (23.3%) | 0 (0.0%) |
| $25,000 to $34,999 | 0 (0.0%) | 7 (12.1%) |
| $35,000 to $49,999 | 7 (23.3%) | 10 (17.2%) |
| $50,000 to $74,999 | 9 (30.0%) | 4 (6.9%) |
| $75,000 to $99,999 | 0 (0.0%) | 19 (32.8%) |
| $100,000 to $149,999 | 5 (16.7%) | 5 (8.6%) |
| $150,000 or more | 0 (0.0%) | 13 (22.4%) |
| Total | 30 (100.0%) | 58 (100.0%) |
Property Value to Household Income Ratio in Bear Lake
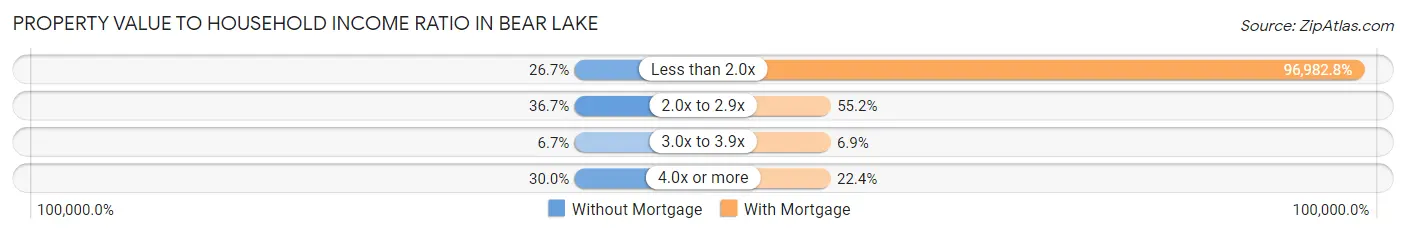
| Value-to-Income Ratio | Without Mortgage | With Mortgage |
| Less than 2.0x | 8 (26.7%) | 56,250 (96,982.8%) |
| 2.0x to 2.9x | 11 (36.7%) | 32 (55.2%) |
| 3.0x to 3.9x | 2 (6.7%) | 4 (6.9%) |
| 4.0x or more | 9 (30.0%) | 13 (22.4%) |
| Total | 30 (100.0%) | 58 (100.0%) |
Real Estate Taxes by Mortgage Status in Bear Lake
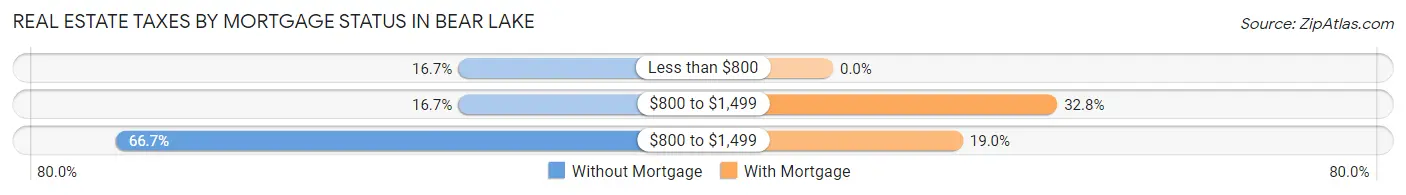
| Property Taxes | Without Mortgage | With Mortgage |
| Less than $800 | 5 (16.7%) | 0 (0.0%) |
| $800 to $1,499 | 5 (16.7%) | 19 (32.8%) |
| $800 to $1,499 | 20 (66.7%) | 11 (19.0%) |
| Total | 30 (100.0%) | 58 (100.0%) |
Health & Disability in Bear Lake
Health Insurance Coverage by Age in Bear Lake
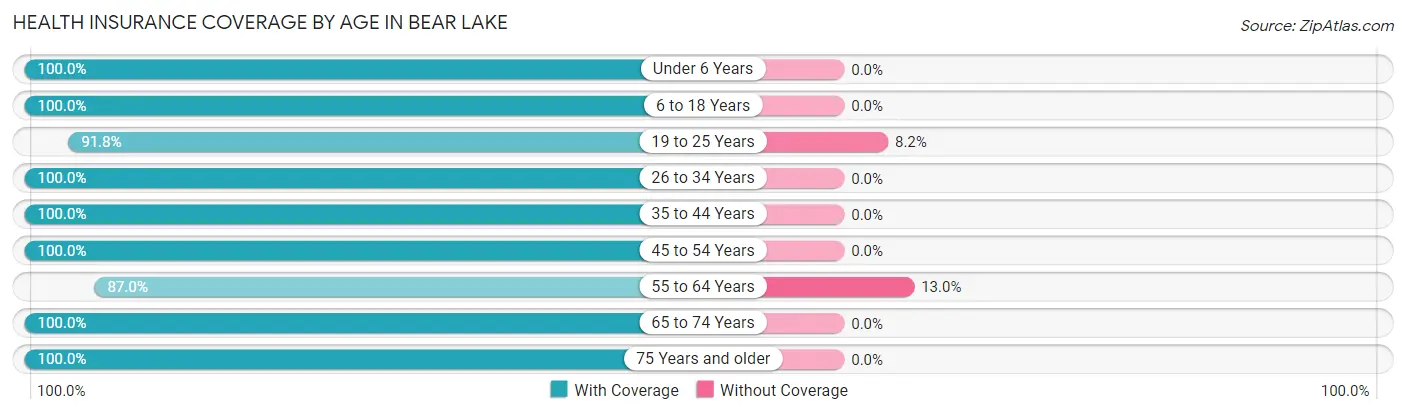
| Age Bracket | With Coverage | Without Coverage |
| Under 6 Years | 16 (100.0%) | 0 (0.0%) |
| 6 to 18 Years | 28 (100.0%) | 0 (0.0%) |
| 19 to 25 Years | 45 (91.8%) | 4 (8.2%) |
| 26 to 34 Years | 7 (100.0%) | 0 (0.0%) |
| 35 to 44 Years | 22 (100.0%) | 0 (0.0%) |
| 45 to 54 Years | 18 (100.0%) | 0 (0.0%) |
| 55 to 64 Years | 40 (87.0%) | 6 (13.0%) |
| 65 to 74 Years | 37 (100.0%) | 0 (0.0%) |
| 75 Years and older | 24 (100.0%) | 0 (0.0%) |
| Total | 237 (96.0%) | 10 (4.1%) |
Health Insurance Coverage by Citizenship Status in Bear Lake
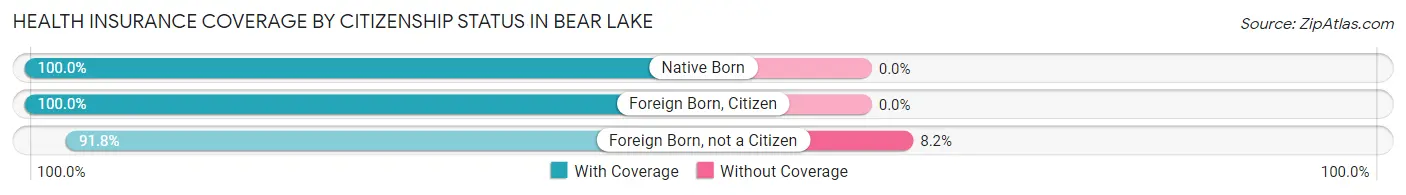
| Citizenship Status | With Coverage | Without Coverage |
| Native Born | 16 (100.0%) | 0 (0.0%) |
| Foreign Born, Citizen | 28 (100.0%) | 0 (0.0%) |
| Foreign Born, not a Citizen | 45 (91.8%) | 4 (8.2%) |
Health Insurance Coverage by Household Income in Bear Lake
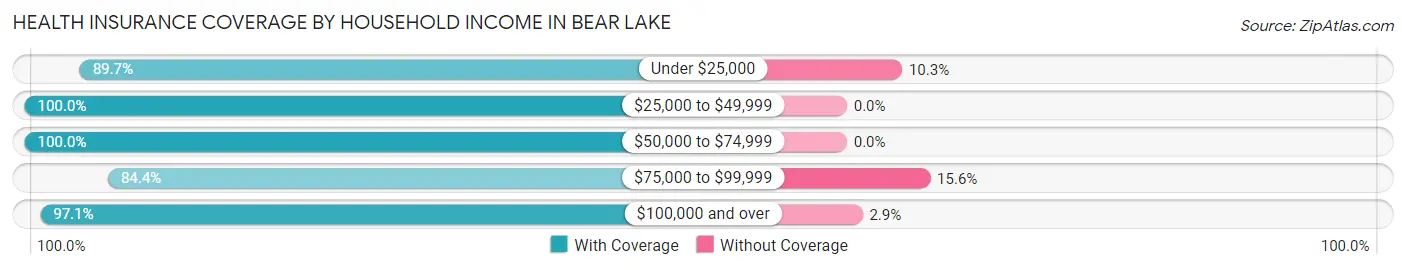
| Household Income | With Coverage | Without Coverage |
| Under $25,000 | 26 (89.7%) | 3 (10.3%) |
| $25,000 to $49,999 | 46 (100.0%) | 0 (0.0%) |
| $50,000 to $74,999 | 72 (100.0%) | 0 (0.0%) |
| $75,000 to $99,999 | 27 (84.4%) | 5 (15.6%) |
| $100,000 and over | 66 (97.1%) | 2 (2.9%) |
Public vs Private Health Insurance Coverage by Age in Bear Lake
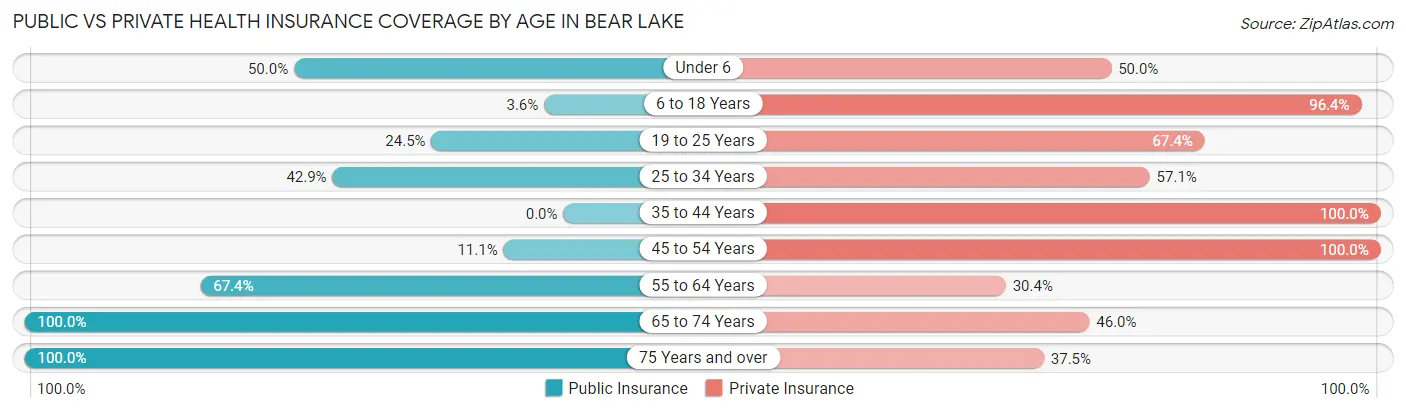
| Age Bracket | Public Insurance | Private Insurance |
| Under 6 | 8 (50.0%) | 8 (50.0%) |
| 6 to 18 Years | 1 (3.6%) | 27 (96.4%) |
| 19 to 25 Years | 12 (24.5%) | 33 (67.3%) |
| 25 to 34 Years | 3 (42.9%) | 4 (57.1%) |
| 35 to 44 Years | 0 (0.0%) | 22 (100.0%) |
| 45 to 54 Years | 2 (11.1%) | 18 (100.0%) |
| 55 to 64 Years | 31 (67.4%) | 14 (30.4%) |
| 65 to 74 Years | 37 (100.0%) | 17 (46.0%) |
| 75 Years and over | 24 (100.0%) | 9 (37.5%) |
| Total | 118 (47.8%) | 152 (61.5%) |
Disability Status by Sex by Age in Bear Lake
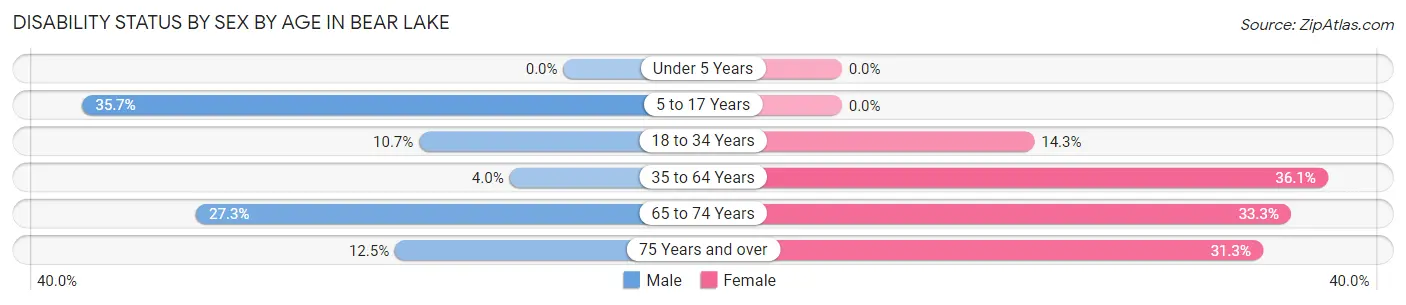
| Age Bracket | Male | Female |
| Under 5 Years | 0 (0.0%) | 0 (0.0%) |
| 5 to 17 Years | 5 (35.7%) | 0 (0.0%) |
| 18 to 34 Years | 3 (10.7%) | 4 (14.3%) |
| 35 to 64 Years | 1 (4.0%) | 22 (36.1%) |
| 65 to 74 Years | 6 (27.3%) | 5 (33.3%) |
| 75 Years and over | 1 (12.5%) | 5 (31.2%) |
Disability Class by Sex by Age in Bear Lake
Disability Class: Hearing Difficulty
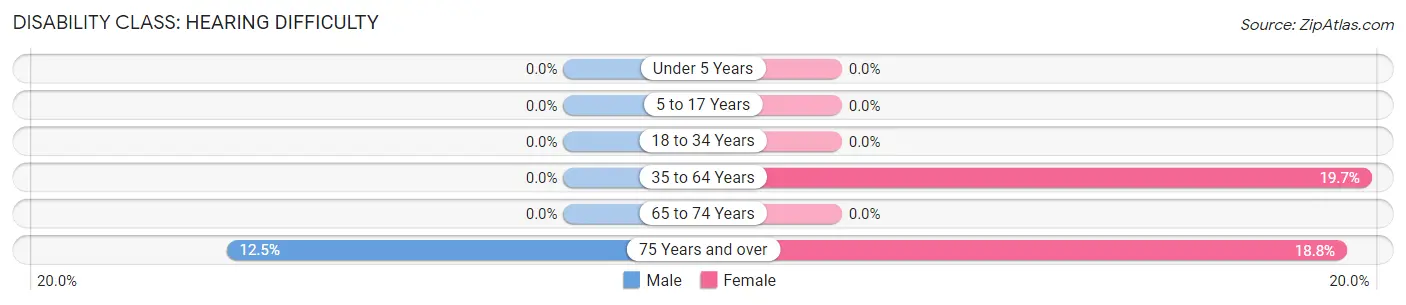
| Age Bracket | Male | Female |
| Under 5 Years | 0 (0.0%) | 0 (0.0%) |
| 5 to 17 Years | 0 (0.0%) | 0 (0.0%) |
| 18 to 34 Years | 0 (0.0%) | 0 (0.0%) |
| 35 to 64 Years | 0 (0.0%) | 12 (19.7%) |
| 65 to 74 Years | 0 (0.0%) | 0 (0.0%) |
| 75 Years and over | 1 (12.5%) | 3 (18.8%) |
Disability Class: Vision Difficulty
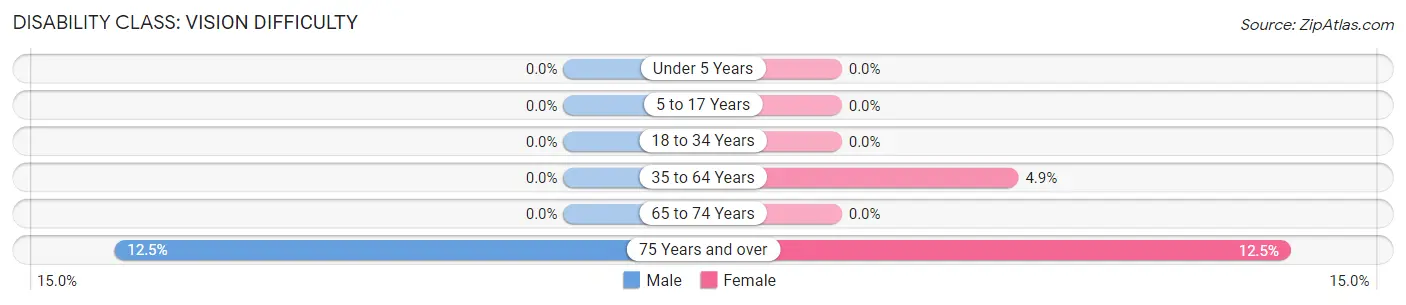
| Age Bracket | Male | Female |
| Under 5 Years | 0 (0.0%) | 0 (0.0%) |
| 5 to 17 Years | 0 (0.0%) | 0 (0.0%) |
| 18 to 34 Years | 0 (0.0%) | 0 (0.0%) |
| 35 to 64 Years | 0 (0.0%) | 3 (4.9%) |
| 65 to 74 Years | 0 (0.0%) | 0 (0.0%) |
| 75 Years and over | 1 (12.5%) | 2 (12.5%) |
Disability Class: Cognitive Difficulty
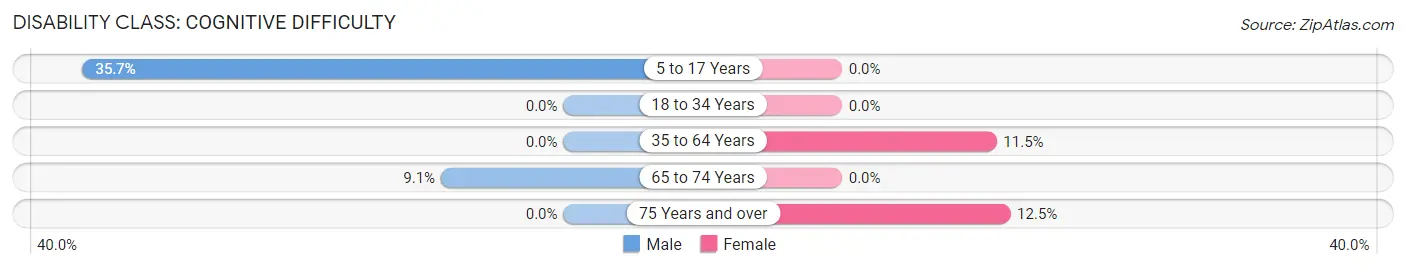
| Age Bracket | Male | Female |
| 5 to 17 Years | 5 (35.7%) | 0 (0.0%) |
| 18 to 34 Years | 0 (0.0%) | 0 (0.0%) |
| 35 to 64 Years | 0 (0.0%) | 7 (11.5%) |
| 65 to 74 Years | 2 (9.1%) | 0 (0.0%) |
| 75 Years and over | 0 (0.0%) | 2 (12.5%) |
Disability Class: Ambulatory Difficulty
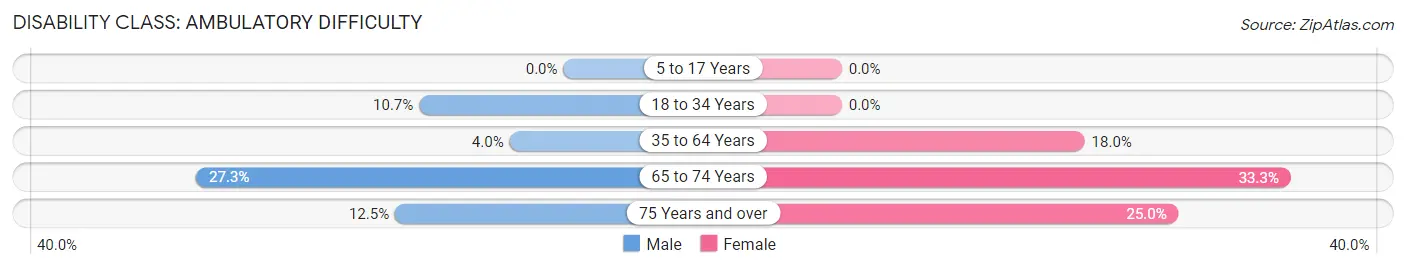
| Age Bracket | Male | Female |
| 5 to 17 Years | 0 (0.0%) | 0 (0.0%) |
| 18 to 34 Years | 3 (10.7%) | 0 (0.0%) |
| 35 to 64 Years | 1 (4.0%) | 11 (18.0%) |
| 65 to 74 Years | 6 (27.3%) | 5 (33.3%) |
| 75 Years and over | 1 (12.5%) | 4 (25.0%) |
Disability Class: Self-Care Difficulty
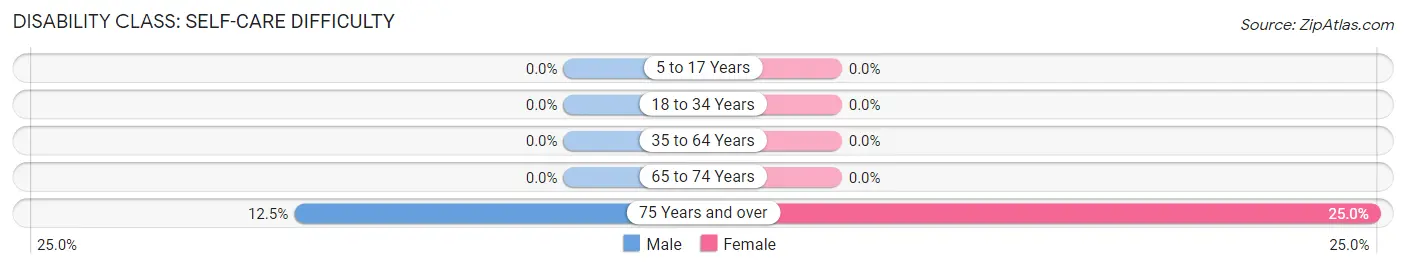
| Age Bracket | Male | Female |
| 5 to 17 Years | 0 (0.0%) | 0 (0.0%) |
| 18 to 34 Years | 0 (0.0%) | 0 (0.0%) |
| 35 to 64 Years | 0 (0.0%) | 0 (0.0%) |
| 65 to 74 Years | 0 (0.0%) | 0 (0.0%) |
| 75 Years and over | 1 (12.5%) | 4 (25.0%) |
Technology Access in Bear Lake
Computing Device Access in Bear Lake
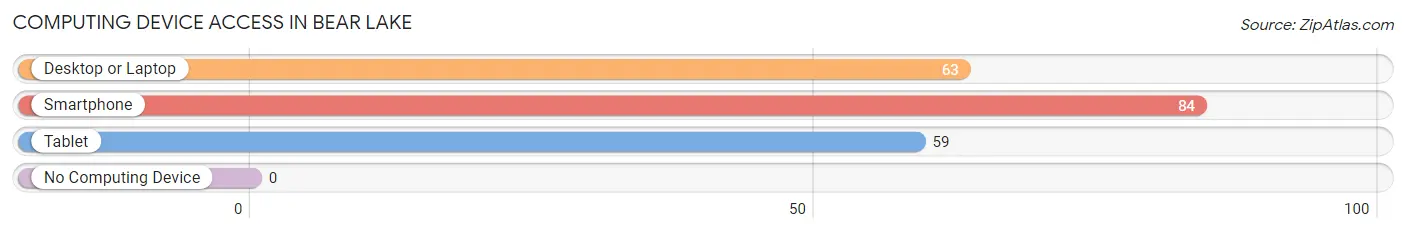
| Device Type | # Households | % Households |
| Desktop or Laptop | 63 | 68.5% |
| Smartphone | 84 | 91.3% |
| Tablet | 59 | 64.1% |
| No Computing Device | 0 | 0.0% |
| Total | 92 | 100.0% |
Internet Access in Bear Lake
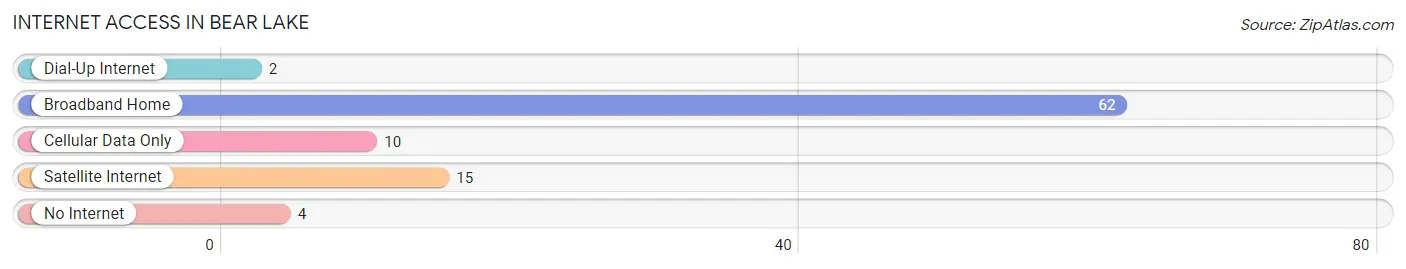
| Internet Type | # Households | % Households |
| Dial-Up Internet | 2 | 2.2% |
| Broadband Home | 62 | 67.4% |
| Cellular Data Only | 10 | 10.9% |
| Satellite Internet | 15 | 16.3% |
| No Internet | 4 | 4.3% |
| Total | 92 | 100.0% |
Bear Lake Summary
Lake Michigan is a large lake located in the Midwest region of the United States. It is the fifth largest lake in the world and the largest lake entirely within the United States. It is bordered by the states of Wisconsin, Illinois, Indiana, and Michigan. The lake is connected to the Atlantic Ocean via the St. Lawrence Seaway and the Great Lakes Waterway.
Bear Lake is a small lake located in the northwest corner of Michigan, near the town of Manistee. It is part of the Manistee National Forest and is surrounded by the Manistee River. The lake is approximately 1,000 acres in size and is a popular destination for fishing, swimming, and boating.
History
The area around Bear Lake has been inhabited by Native Americans for thousands of years. The first Europeans to explore the area were French fur traders in the late 1600s. The lake was named after a Native American chief who lived in the area.
In the early 1800s, the area around Bear Lake was settled by European immigrants. The first permanent settlement was established in 1836. The settlers were mostly farmers and loggers who harvested the abundant timber in the area.
In the late 1800s, the area around Bear Lake became a popular tourist destination. The lake was a popular spot for fishing and boating, and the surrounding forests were a popular destination for hunting and camping.
Geography
Bear Lake is located in the northwest corner of Michigan, near the town of Manistee. It is part of the Manistee National Forest and is surrounded by the Manistee River. The lake is approximately 1,000 acres in size and is a popular destination for fishing, swimming, and boating.
The lake is fed by several small streams and is connected to the Manistee River. The lake is shallow, with an average depth of only 10 feet. The lake is surrounded by a variety of wildlife, including deer, beavers, and bald eagles.
Economy
The economy of Bear Lake is largely based on tourism. The lake is a popular destination for fishing, swimming, and boating. The surrounding forests are also popular for hunting and camping.
The area around Bear Lake is also home to several small businesses, including restaurants, lodging, and retail stores. The local economy is also supported by the logging industry, which harvests the abundant timber in the area.
Demographics
The population of Bear Lake is approximately 1,000 people. The majority of the population is white, with a small percentage of African Americans and Native Americans. The median household income is approximately $40,000.
The majority of the population is employed in the tourism industry, with many people working in restaurants, lodging, and retail stores. The logging industry is also an important part of the local economy.
Conclusion
Bear Lake is a small lake located in the northwest corner of Michigan, near the town of Manistee. It is part of the Manistee National Forest and is surrounded by the Manistee River. The lake is approximately 1,000 acres in size and is a popular destination for fishing, swimming, and boating. The area around Bear Lake has been inhabited by Native Americans for thousands of years and was later settled by European immigrants in the early 1800s. The economy of Bear Lake is largely based on tourism, with many people employed in the tourism industry, as well as the logging industry. The population of Bear Lake is approximately 1,000 people, with the majority of the population being white.
Common Questions
What is Per Capita Income in Bear Lake?
Per Capita income in Bear Lake is $23,506.
What is the Median Family Income in Bear Lake?
Median Family Income in Bear Lake is $57,813.
What is the Median Household income in Bear Lake?
Median Household Income in Bear Lake is $51,250.
What is Income or Wage Gap in Bear Lake?
Income or Wage Gap in Bear Lake is 52.9%.
Women in Bear Lake earn 47.1 cents for every dollar earned by a man.
What is Inequality or Gini Index in Bear Lake?
Inequality or Gini Index in Bear Lake is 0.33.
What is the Total Population of Bear Lake?
Total Population of Bear Lake is 247.
What is the Total Male Population of Bear Lake?
Total Male Population of Bear Lake is 99.
What is the Total Female Population of Bear Lake?
Total Female Population of Bear Lake is 148.
What is the Ratio of Males per 100 Females in Bear Lake?
There are 66.89 Males per 100 Females in Bear Lake.
What is the Ratio of Females per 100 Males in Bear Lake?
There are 149.49 Females per 100 Males in Bear Lake.
What is the Median Population Age in Bear Lake?
Median Population Age in Bear Lake is 47.5 Years.
What is the Average Family Size in Bear Lake
Average Family Size in Bear Lake is 3.2 People.
What is the Average Household Size in Bear Lake
Average Household Size in Bear Lake is 2.7 People.
How Large is the Labor Force in Bear Lake?
There are 119 People in the Labor Forcein in Bear Lake.
What is the Percentage of People in the Labor Force in Bear Lake?
55.1% of People are in the Labor Force in Bear Lake.
What is the Unemployment Rate in Bear Lake?
Unemployment Rate in Bear Lake is 10.9%.