Zip Codes with the Highest Percentage of Population Employed in Architecture & Engineering in Bowie, MD
RELATED REPORTS & OPTIONS
Architecture & Engineering
Bowie
Compare Zip Codes
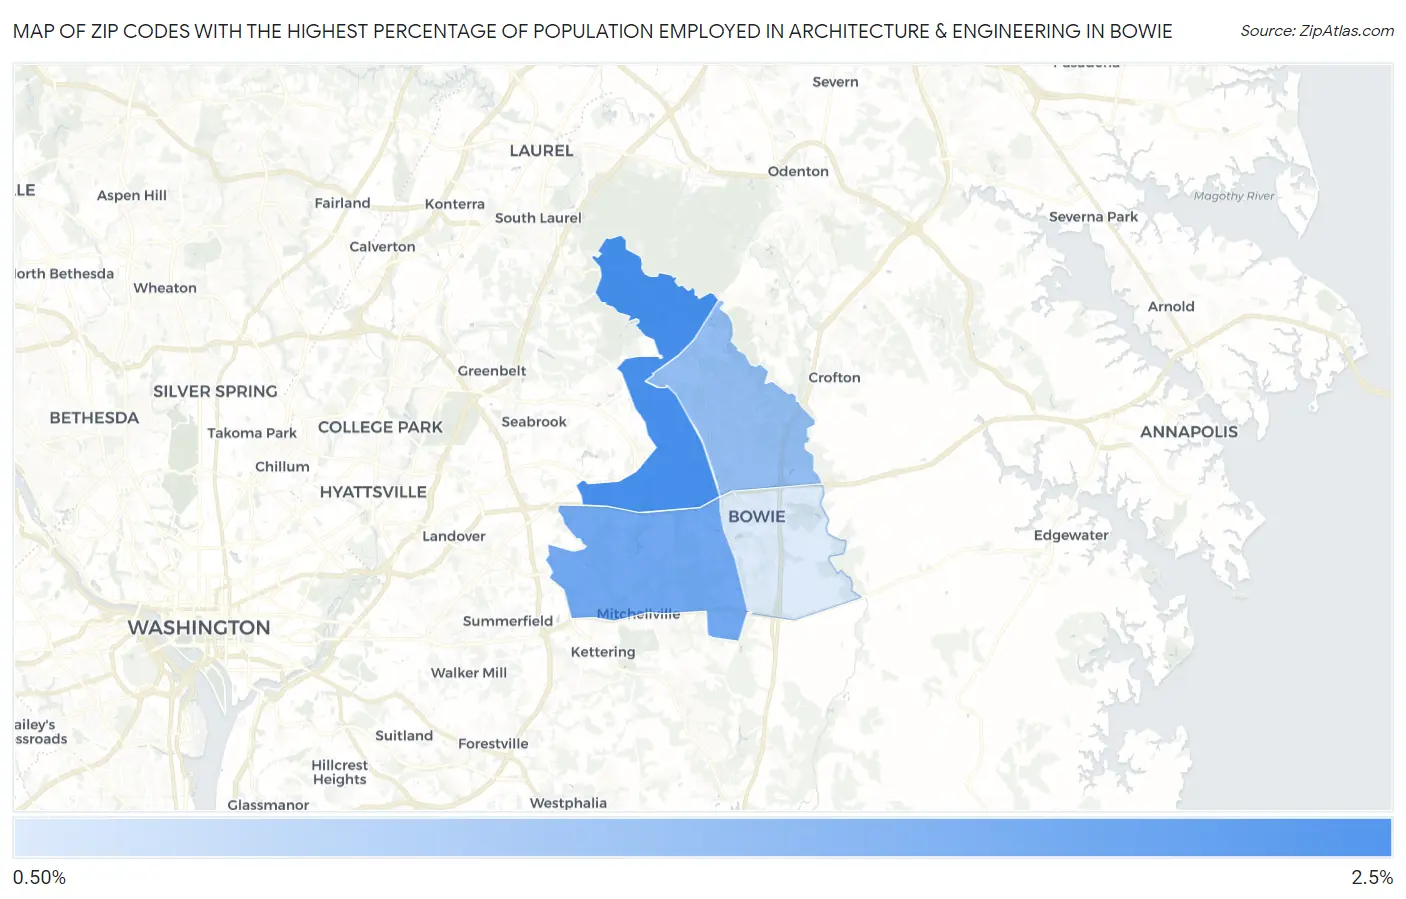
Map of Zip Codes with the Highest Percentage of Population Employed in Architecture & Engineering in Bowie
0.51%
2.2%
Zip Codes with the Highest Percentage of Population Employed in Architecture & Engineering in Bowie, MD
| Zip Code | % Employed | vs State | vs National | |
| 1. | 20720 | 2.2% | 2.4%(-0.158)#198 | 2.1%(+0.080)#8,311 |
| 2. | 20721 | 1.7% | 2.4%(-0.641)#239 | 2.1%(-0.403)#11,190 |
| 3. | 20715 | 1.4% | 2.4%(-1.02)#280 | 2.1%(-0.786)#13,856 |
| 4. | 20716 | 0.51% | 2.4%(-1.87)#343 | 2.1%(-1.63)#20,178 |
1
Common Questions
What are the Top 3 Zip Codes with the Highest Percentage of Population Employed in Architecture & Engineering in Bowie, MD?
Top 3 Zip Codes with the Highest Percentage of Population Employed in Architecture & Engineering in Bowie, MD are:
What zip code has the Highest Percentage of Population Employed in Architecture & Engineering in Bowie, MD?
20720 has the Highest Percentage of Population Employed in Architecture & Engineering in Bowie, MD with 2.2%.
What is the Percentage of Population Employed in Architecture & Engineering in Bowie, MD?
Percentage of Population Employed in Architecture & Engineering in Bowie is 1.0%.
What is the Percentage of Population Employed in Architecture & Engineering in Maryland?
Percentage of Population Employed in Architecture & Engineering in Maryland is 2.4%.
What is the Percentage of Population Employed in Architecture & Engineering in the United States?
Percentage of Population Employed in Architecture & Engineering in the United States is 2.1%.