Zip Codes with the Highest Percentage of Population Employed in Real Estate, Rental & Leasing in Bowie, MD
RELATED REPORTS & OPTIONS
Real Estate, Rental & Leasing
Bowie
Compare Zip Codes
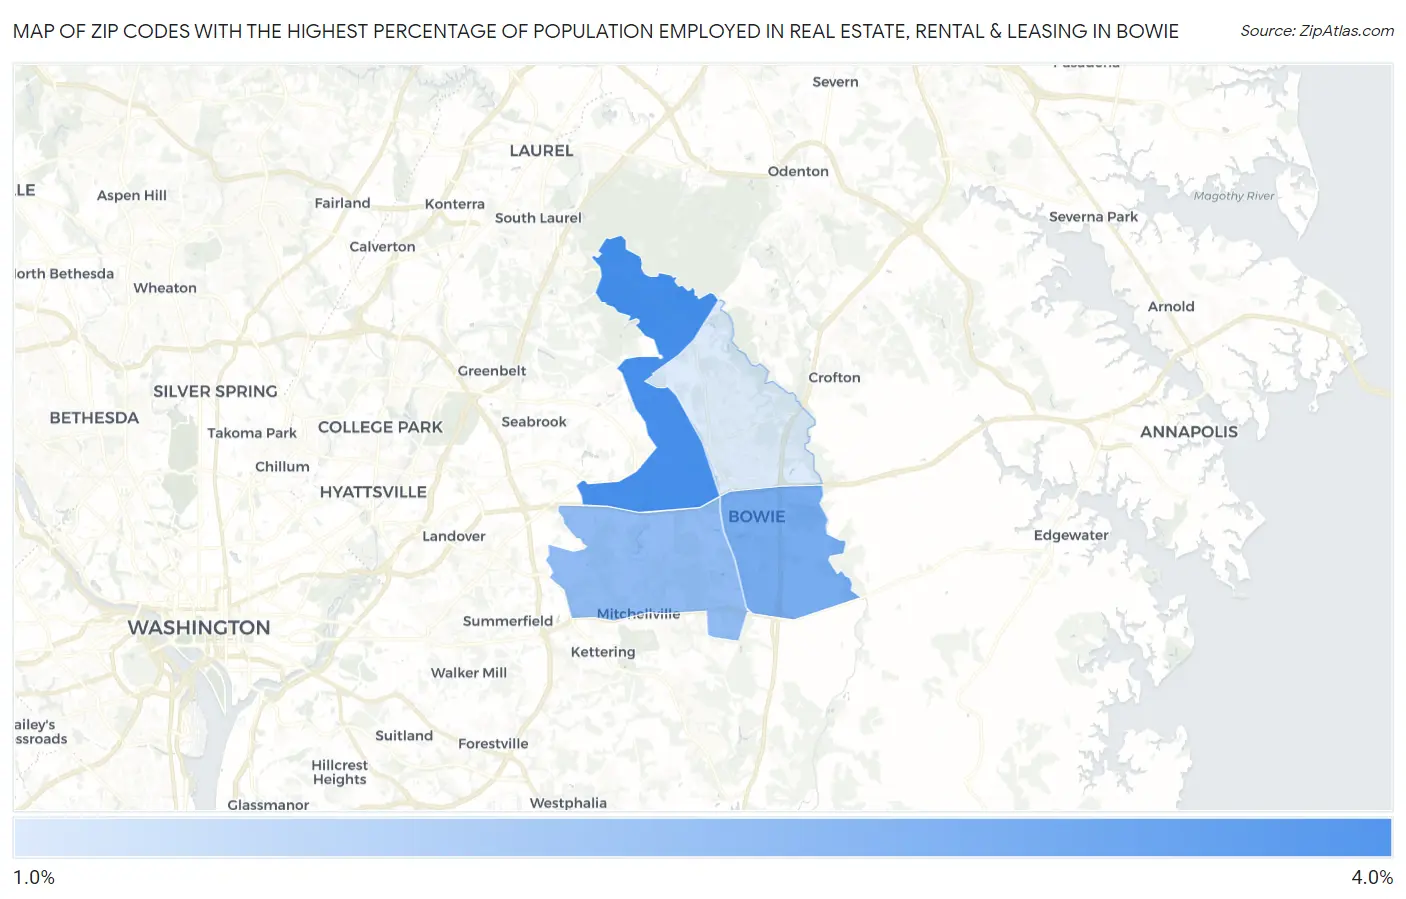
Map of Zip Codes with the Highest Percentage of Population Employed in Real Estate, Rental & Leasing in Bowie
1.7%
3.6%
Zip Codes with the Highest Percentage of Population Employed in Real Estate, Rental & Leasing in Bowie, MD
| Zip Code | % Employed | vs State | vs National | |
| 1. | 20720 | 3.6% | 2.1%(+1.55)#55 | 1.9%(+1.75)#2,594 |
| 2. | 20716 | 3.0% | 2.1%(+0.910)#95 | 1.9%(+1.11)#3,903 |
| 3. | 20721 | 2.7% | 2.1%(+0.581)#113 | 1.9%(+0.780)#4,847 |
| 4. | 20715 | 1.7% | 2.1%(-0.425)#223 | 1.9%(-0.227)#10,006 |
1
Common Questions
What are the Top 3 Zip Codes with the Highest Percentage of Population Employed in Real Estate, Rental & Leasing in Bowie, MD?
Top 3 Zip Codes with the Highest Percentage of Population Employed in Real Estate, Rental & Leasing in Bowie, MD are:
What zip code has the Highest Percentage of Population Employed in Real Estate, Rental & Leasing in Bowie, MD?
20720 has the Highest Percentage of Population Employed in Real Estate, Rental & Leasing in Bowie, MD with 3.6%.
What is the Percentage of Population Employed in Real Estate, Rental & Leasing in Bowie, MD?
Percentage of Population Employed in Real Estate, Rental & Leasing in Bowie is 2.7%.
What is the Percentage of Population Employed in Real Estate, Rental & Leasing in Maryland?
Percentage of Population Employed in Real Estate, Rental & Leasing in Maryland is 2.1%.
What is the Percentage of Population Employed in Real Estate, Rental & Leasing in the United States?
Percentage of Population Employed in Real Estate, Rental & Leasing in the United States is 1.9%.