Zip Codes with the Highest Percentage of Population Employed in Architecture & Engineering in Hyattsville, MD
RELATED REPORTS & OPTIONS
Architecture & Engineering
Hyattsville
Compare Zip Codes
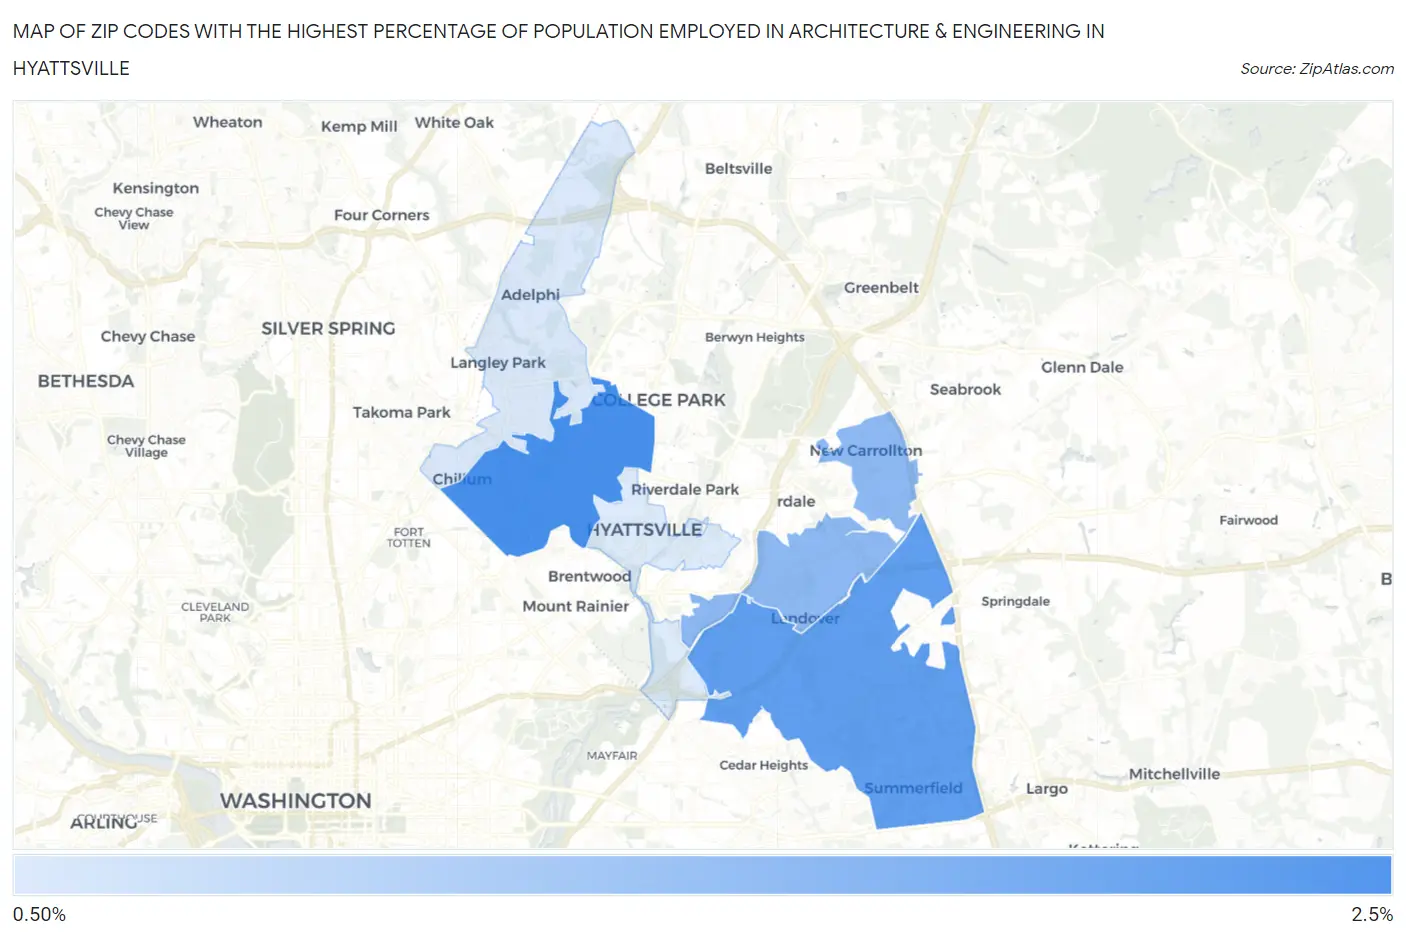
Map of Zip Codes with the Highest Percentage of Population Employed in Architecture & Engineering in Hyattsville
0.73%
2.4%
Zip Codes with the Highest Percentage of Population Employed in Architecture & Engineering in Hyattsville, MD
| Zip Code | % Employed | vs State | vs National | |
| 1. | 20782 | 2.4% | 2.4%(+0.013)#180 | 2.1%(+0.251)#7,474 |
| 2. | 20785 | 2.1% | 2.4%(-0.272)#211 | 2.1%(-0.034)#8,949 |
| 3. | 20784 | 1.6% | 2.4%(-0.764)#253 | 2.1%(-0.526)#12,028 |
| 4. | 20783 | 0.77% | 2.4%(-1.62)#323 | 2.1%(-1.38)#18,397 |
| 5. | 20781 | 0.73% | 2.4%(-1.66)#330 | 2.1%(-1.42)#18,687 |
1
Common Questions
What are the Top 3 Zip Codes with the Highest Percentage of Population Employed in Architecture & Engineering in Hyattsville, MD?
Top 3 Zip Codes with the Highest Percentage of Population Employed in Architecture & Engineering in Hyattsville, MD are:
What zip code has the Highest Percentage of Population Employed in Architecture & Engineering in Hyattsville, MD?
20782 has the Highest Percentage of Population Employed in Architecture & Engineering in Hyattsville, MD with 2.4%.
What is the Percentage of Population Employed in Architecture & Engineering in Hyattsville, MD?
Percentage of Population Employed in Architecture & Engineering in Hyattsville is 1.1%.
What is the Percentage of Population Employed in Architecture & Engineering in Maryland?
Percentage of Population Employed in Architecture & Engineering in Maryland is 2.4%.
What is the Percentage of Population Employed in Architecture & Engineering in the United States?
Percentage of Population Employed in Architecture & Engineering in the United States is 2.1%.