Zip Codes with the Highest Percentage of Population Employed in Accommodation & Food Services in Bowie, MD
RELATED REPORTS & OPTIONS
Accommodation & Food Services
Bowie
Compare Zip Codes
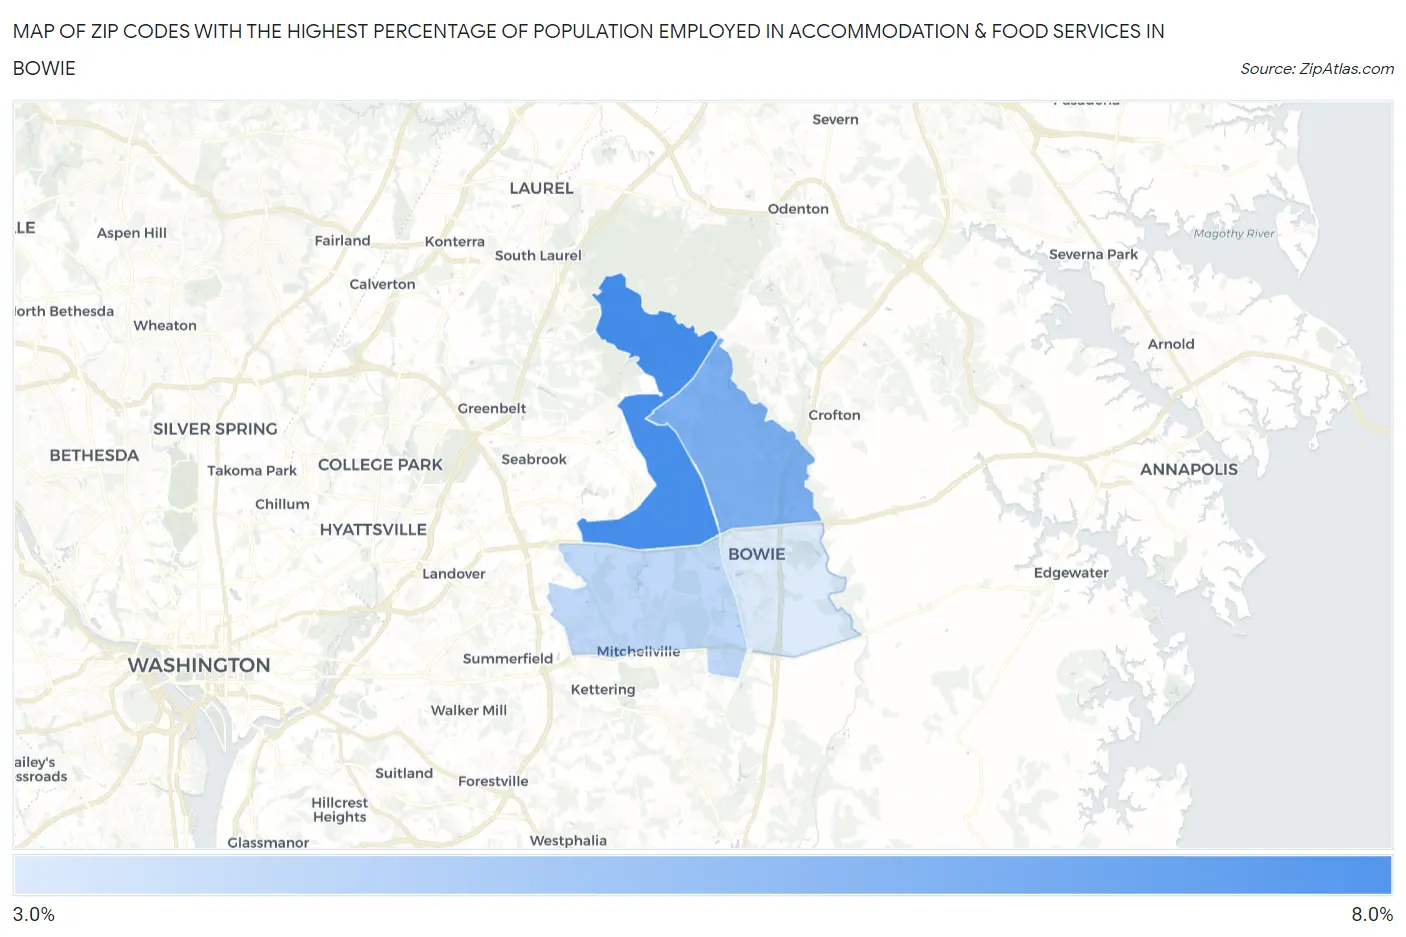
Map of Zip Codes with the Highest Percentage of Population Employed in Accommodation & Food Services in Bowie
3.5%
6.1%
Zip Codes with the Highest Percentage of Population Employed in Accommodation & Food Services in Bowie, MD
| Zip Code | % Employed | vs State | vs National | |
| 1. | 20720 | 6.1% | 5.8%(+0.208)#156 | 6.9%(-0.826)#13,285 |
| 2. | 20715 | 5.1% | 5.8%(-0.712)#209 | 6.9%(-1.75)#16,339 |
| 3. | 20721 | 4.0% | 5.8%(-1.85)#284 | 6.9%(-2.89)#20,184 |
| 4. | 20716 | 3.5% | 5.8%(-2.38)#319 | 6.9%(-3.41)#21,888 |
1
Common Questions
What are the Top 3 Zip Codes with the Highest Percentage of Population Employed in Accommodation & Food Services in Bowie, MD?
Top 3 Zip Codes with the Highest Percentage of Population Employed in Accommodation & Food Services in Bowie, MD are:
What zip code has the Highest Percentage of Population Employed in Accommodation & Food Services in Bowie, MD?
20720 has the Highest Percentage of Population Employed in Accommodation & Food Services in Bowie, MD with 6.1%.
What is the Percentage of Population Employed in Accommodation & Food Services in Bowie, MD?
Percentage of Population Employed in Accommodation & Food Services in Bowie is 4.4%.
What is the Percentage of Population Employed in Accommodation & Food Services in Maryland?
Percentage of Population Employed in Accommodation & Food Services in Maryland is 5.8%.
What is the Percentage of Population Employed in Accommodation & Food Services in the United States?
Percentage of Population Employed in Accommodation & Food Services in the United States is 6.9%.