Zip Codes with the Highest Percentage of Population Employed in Architecture & Engineering in Waldorf, MD
RELATED REPORTS & OPTIONS
Architecture & Engineering
Waldorf
Compare Zip Codes
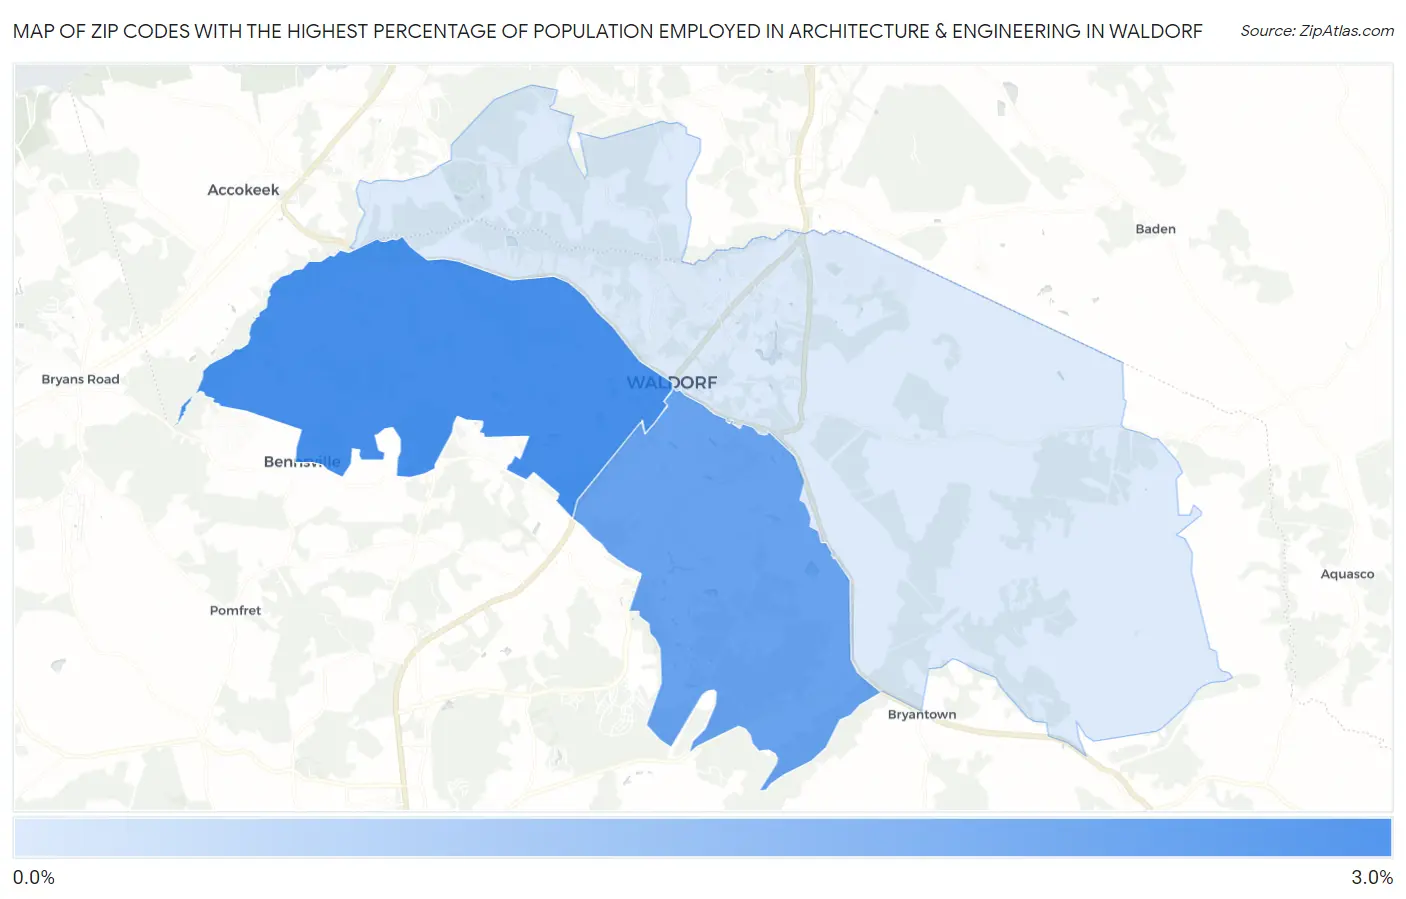
Map of Zip Codes with the Highest Percentage of Population Employed in Architecture & Engineering in Waldorf
0.80%
2.8%
Zip Codes with the Highest Percentage of Population Employed in Architecture & Engineering in Waldorf, MD
| Zip Code | % Employed | vs State | vs National | |
| 1. | 20603 | 2.8% | 2.4%(+0.394)#142 | 2.1%(+0.633)#5,853 |
| 2. | 20602 | 2.4% | 2.4%(-0.030)#186 | 2.1%(+0.208)#7,685 |
| 3. | 20601 | 0.80% | 2.4%(-1.59)#320 | 2.1%(-1.35)#18,125 |
1
Common Questions
What are the Top Zip Codes with the Highest Percentage of Population Employed in Architecture & Engineering in Waldorf, MD?
Top Zip Codes with the Highest Percentage of Population Employed in Architecture & Engineering in Waldorf, MD are:
What zip code has the Highest Percentage of Population Employed in Architecture & Engineering in Waldorf, MD?
20603 has the Highest Percentage of Population Employed in Architecture & Engineering in Waldorf, MD with 2.8%.
What is the Percentage of Population Employed in Architecture & Engineering in Waldorf, MD?
Percentage of Population Employed in Architecture & Engineering in Waldorf is 2.1%.
What is the Percentage of Population Employed in Architecture & Engineering in Maryland?
Percentage of Population Employed in Architecture & Engineering in Maryland is 2.4%.
What is the Percentage of Population Employed in Architecture & Engineering in the United States?
Percentage of Population Employed in Architecture & Engineering in the United States is 2.1%.