Zip Codes with the Highest Percentage of Population Employed in Architecture & Engineering in Upper Marlboro, MD
RELATED REPORTS & OPTIONS
Architecture & Engineering
Upper Marlboro
Compare Zip Codes
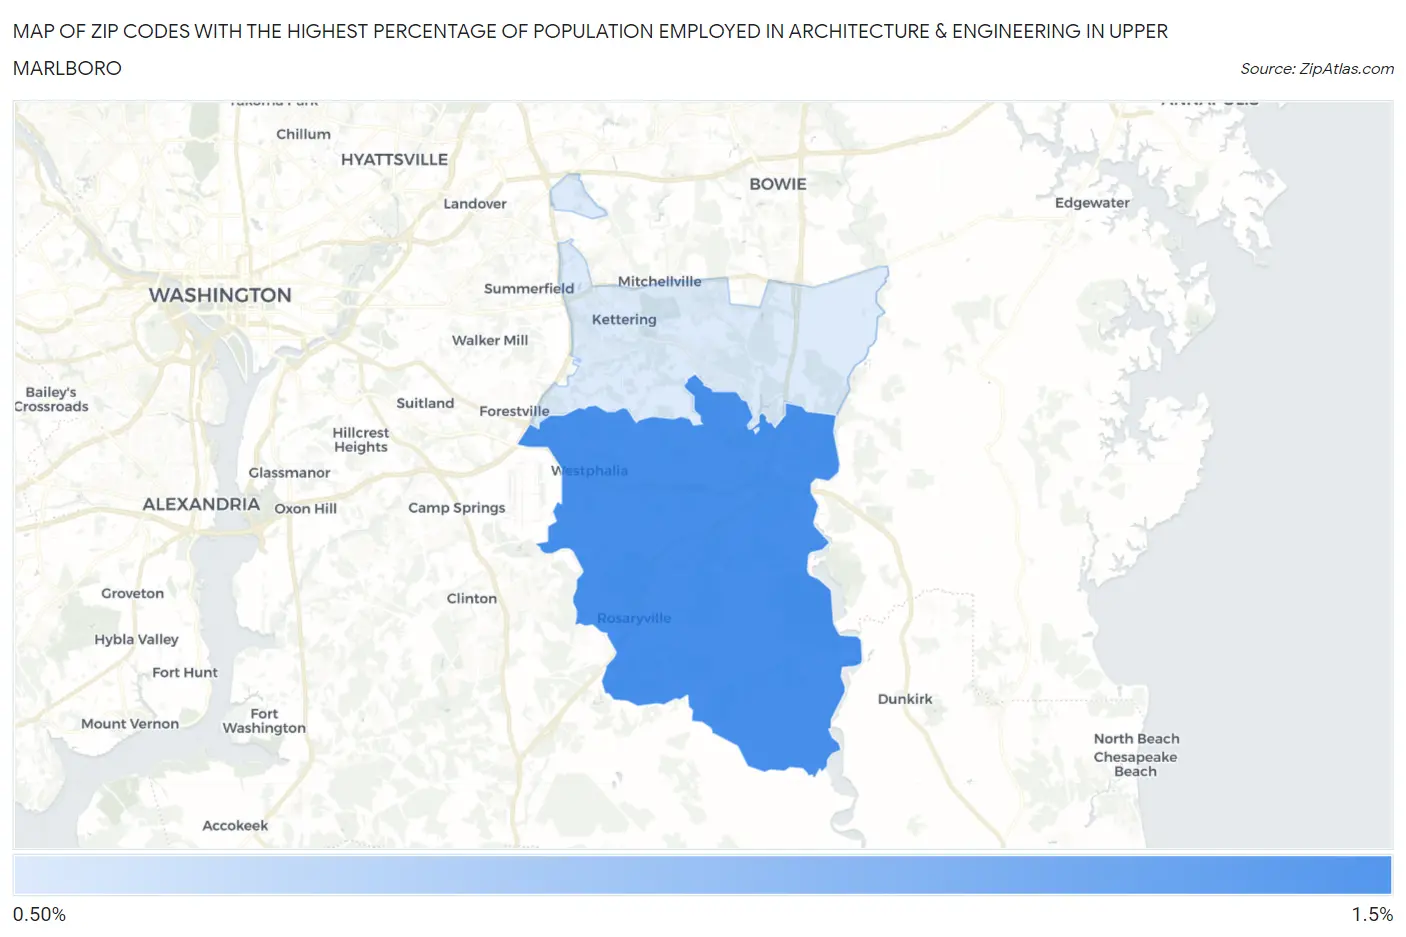
Map of Zip Codes with the Highest Percentage of Population Employed in Architecture & Engineering in Upper Marlboro
1.1%
1.5%
Zip Codes with the Highest Percentage of Population Employed in Architecture & Engineering in Upper Marlboro, MD
| Zip Code | % Employed | vs State | vs National | |
| 1. | 20772 | 1.5% | 2.4%(-0.929)#270 | 2.1%(-0.690)#13,172 |
| 2. | 20774 | 1.1% | 2.4%(-1.29)#297 | 2.1%(-1.06)#15,901 |
1
Common Questions
What are the Top Zip Codes with the Highest Percentage of Population Employed in Architecture & Engineering in Upper Marlboro, MD?
Top Zip Codes with the Highest Percentage of Population Employed in Architecture & Engineering in Upper Marlboro, MD are:
What zip code has the Highest Percentage of Population Employed in Architecture & Engineering in Upper Marlboro, MD?
20772 has the Highest Percentage of Population Employed in Architecture & Engineering in Upper Marlboro, MD with 1.5%.
What is the Percentage of Population Employed in Architecture & Engineering in Upper Marlboro, MD?
Percentage of Population Employed in Architecture & Engineering in Upper Marlboro is 1.9%.
What is the Percentage of Population Employed in Architecture & Engineering in Maryland?
Percentage of Population Employed in Architecture & Engineering in Maryland is 2.4%.
What is the Percentage of Population Employed in Architecture & Engineering in the United States?
Percentage of Population Employed in Architecture & Engineering in the United States is 2.1%.