Zip Codes with the Highest Percentage of Population Employed in Accommodation & Food Services in Lowell, MA
RELATED REPORTS & OPTIONS
Accommodation & Food Services
Lowell
Compare Zip Codes
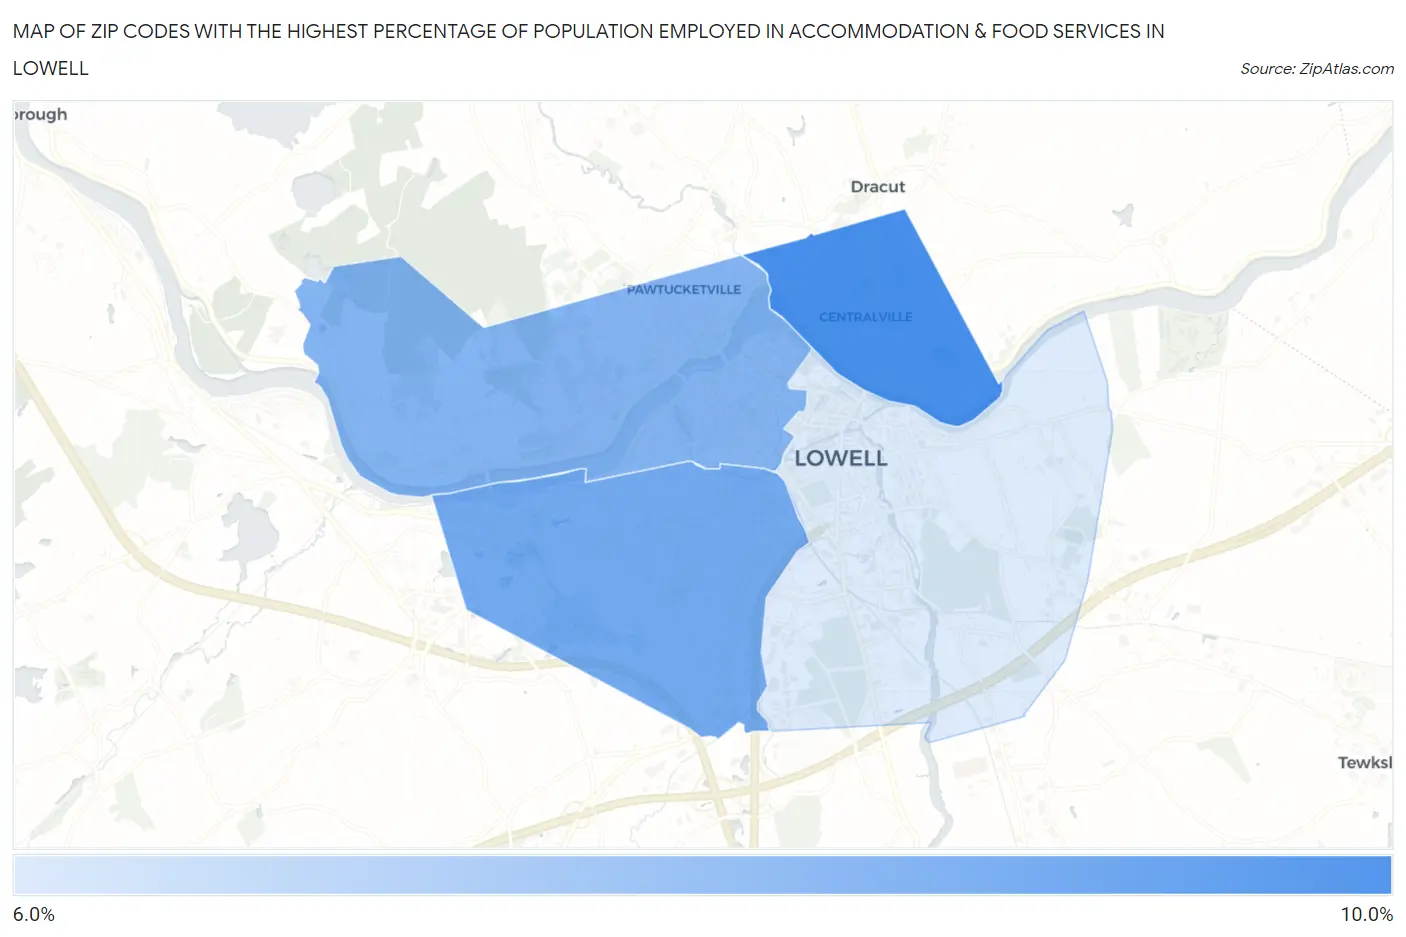
Map of Zip Codes with the Highest Percentage of Population Employed in Accommodation & Food Services in Lowell
6.3%
8.9%
Zip Codes with the Highest Percentage of Population Employed in Accommodation & Food Services in Lowell, MA
| Zip Code | % Employed | vs State | vs National | |
| 1. | 01850 | 8.9% | 5.8%(+3.13)#61 | 6.9%(+2.01)#6,127 |
| 2. | 01851 | 8.1% | 5.8%(+2.36)#89 | 6.9%(+1.24)#7,588 |
| 3. | 01854 | 7.9% | 5.8%(+2.10)#95 | 6.9%(+0.983)#8,113 |
| 4. | 01852 | 6.3% | 5.8%(+0.542)#172 | 6.9%(-0.577)#12,471 |
1
Common Questions
What are the Top 3 Zip Codes with the Highest Percentage of Population Employed in Accommodation & Food Services in Lowell, MA?
Top 3 Zip Codes with the Highest Percentage of Population Employed in Accommodation & Food Services in Lowell, MA are:
What zip code has the Highest Percentage of Population Employed in Accommodation & Food Services in Lowell, MA?
01850 has the Highest Percentage of Population Employed in Accommodation & Food Services in Lowell, MA with 8.9%.
What is the Percentage of Population Employed in Accommodation & Food Services in Lowell, MA?
Percentage of Population Employed in Accommodation & Food Services in Lowell is 7.6%.
What is the Percentage of Population Employed in Accommodation & Food Services in Massachusetts?
Percentage of Population Employed in Accommodation & Food Services in Massachusetts is 5.8%.
What is the Percentage of Population Employed in Accommodation & Food Services in the United States?
Percentage of Population Employed in Accommodation & Food Services in the United States is 6.9%.