Ethiopian vs German In Labor Force | Age 16-19

COMPARE

Ethiopian
Race
Ancestry
AfghanAfricanAlaska NativeAlaskan AthabascanAlbanianAleutAlsatianAmericanApacheArabArapahoArgentineanArmenianAssyrian/Chaldean/SyriacAustralianAustrianBahamianBangladeshiBarbadianBasqueBelgianBelizeanBermudanBhutaneseBlackfeetBolivianBrazilianBritishBritish West IndianBulgarianBurmeseCajunCambodianCanadianCape VerdeanCarpatho RusynCelticCentral AmericanCentral American IndianCherokeeCheyenneChickasawChileanChineseChippewaChoctawColombianColvilleComancheCosta RicanCreeCreekCroatianCrowCubanCypriotCzechCzechoslovakianDanishDelawareDominicanDutchDutch West IndianEastern EuropeanEcuadorianEgyptianEnglishEstonianEthiopianEuropeanFijianFilipinoFinnishFrenchFrench American IndianFrench CanadianGerman RussianGhanaianGreekGuamanian/ChamorroGuatemalanGuyaneseHaitianHmongHonduranHopiHoumaHungarianIcelanderIndian (Asian)IndonesianInupiatIranianIraqiIrishIroquoisIsraeliItalianJamaicanJapaneseJordanianKenyanKiowaKoreanLaotianLatvianLebaneseLiberianLithuanianLumbeeLuxembourgerMacedonianMalaysianMalteseMarshalleseMenomineeMexicanMexican American IndianMongolianMoroccanNative HawaiianNavajoNepaleseNew ZealanderNicaraguanNigerianNorthern EuropeanNorwegianOkinawanOsageOttawaPaiutePakistaniPalestinianPanamanianParaguayanPennsylvania GermanPeruvianPimaPolishPortuguesePotawatomiPuebloPuerto RicanPuget Sound SalishRomanianRussianSalvadoranSamoanScandinavianScotch-IrishScottishSeminoleSenegaleseSerbianShoshoneSierra LeoneanSiouxSlavicSlovakSloveneSomaliSouth AfricanSouth AmericanSouth American IndianSoviet UnionSpaniardSpanishSpanish AmericanSpanish American IndianSri LankanSubsaharan AfricanSudaneseSwedishSwissSyrianTaiwaneseThaiTlingit-HaidaTohono O'OdhamTonganTrinidadian and TobagonianTsimshianTurkishU.S. Virgin IslanderUgandanUkrainianUruguayanUteVenezuelanVietnameseWelshWest IndianYakamaYaquiYugoslavianYumanYup'ikZimbabwean
Immigration
NonimmigrantsImmigrantsAfghanistanAfricaAlbaniaArgentinaArmeniaAsiaAustraliaAustriaBahamasBangladeshBarbadosBelarusBelgiumBelizeBoliviaBosnia and HerzegovinaBrazilBulgariaBurma/MyanmarCabo VerdeCambodiaCameroonCanadaCaribbeanCentral AmericaChileChinaColombiaCongoCosta RicaCroatiaCubaCzechoslovakiaDenmarkDominicaDominican RepublicEastern AfricaEastern AsiaEastern EuropeEcuadorEgyptEl SalvadorEnglandEritreaEthiopiaEuropeFijiFranceGermanyGhanaGreeceGrenadaGuatemalaGuyanaHaitiHondurasHong KongHungaryIndiaIndonesiaIranIraqIrelandIsraelItalyJamaicaJapanJordanKazakhstanKenyaKoreaKuwaitLaosLatin AmericaLatviaLebanonLiberiaLithuaniaMalaysiaMexicoMicronesiaMiddle AfricaMoldovaMoroccoNepalNetherlandsNicaraguaNigeriaNorth AmericaNorth MacedoniaNorthern AfricaNorthern EuropeNorwayOceaniaPakistanPanamaPeruPhilippinesPolandPortugalRomaniaRussiaSaudi ArabiaScotlandSenegalSerbiaSierra LeoneSingaporeSomaliaSouth AfricaSouth AmericaSouth Central AsiaSouth Eastern AsiaSouthern EuropeSpainSri LankaSt. Vincent and the GrenadinesSudanSwedenSwitzerlandSyriaTaiwanThailandTrinidad and TobagoTurkeyUgandaUkraineUruguayUzbekistanVenezuelaVietnamWest IndiesWestern AfricaWestern AsiaWestern EuropeYemenZaireZimbabweAzores
German
Race
Ancestry
AfghanAfricanAlaska NativeAlaskan AthabascanAlbanianAleutAlsatianAmericanApacheArabArapahoArgentineanArmenianAssyrian/Chaldean/SyriacAustralianAustrianBahamianBangladeshiBarbadianBasqueBelgianBelizeanBermudanBhutaneseBlackfeetBolivianBrazilianBritishBritish West IndianBulgarianBurmeseCajunCambodianCanadianCape VerdeanCarpatho RusynCelticCentral AmericanCentral American IndianCherokeeCheyenneChickasawChileanChineseChippewaChoctawColombianColvilleComancheCosta RicanCreeCreekCroatianCrowCubanCypriotCzechCzechoslovakianDanishDelawareDominicanDutchDutch West IndianEastern EuropeanEcuadorianEgyptianEnglishEstonianEuropeanFijianFilipinoFinnishFrenchFrench American IndianFrench CanadianGermanGerman RussianGhanaianGreekGuamanian/ChamorroGuatemalanGuyaneseHaitianHmongHonduranHopiHoumaHungarianIcelanderIndian (Asian)IndonesianInupiatIranianIraqiIrishIroquoisIsraeliItalianJamaicanJapaneseJordanianKenyanKiowaKoreanLaotianLatvianLebaneseLiberianLithuanianLumbeeLuxembourgerMacedonianMalaysianMalteseMarshalleseMenomineeMexicanMexican American IndianMongolianMoroccanNative HawaiianNavajoNepaleseNew ZealanderNicaraguanNigerianNorthern EuropeanNorwegianOkinawanOsageOttawaPaiutePakistaniPalestinianPanamanianParaguayanPennsylvania GermanPeruvianPimaPolishPortuguesePotawatomiPuebloPuerto RicanPuget Sound SalishRomanianRussianSalvadoranSamoanScandinavianScotch-IrishScottishSeminoleSenegaleseSerbianShoshoneSierra LeoneanSiouxSlavicSlovakSloveneSomaliSouth AfricanSouth AmericanSouth American IndianSoviet UnionSpaniardSpanishSpanish AmericanSpanish American IndianSri LankanSubsaharan AfricanSudaneseSwedishSwissSyrianTaiwaneseThaiTlingit-HaidaTohono O'OdhamTonganTrinidadian and TobagonianTsimshianTurkishU.S. Virgin IslanderUgandanUkrainianUruguayanUteVenezuelanVietnameseWelshWest IndianYakamaYaquiYugoslavianYumanYup'ikZimbabwean
Immigration
NonimmigrantsImmigrantsAfghanistanAfricaAlbaniaArgentinaArmeniaAsiaAustraliaAustriaBahamasBangladeshBarbadosBelarusBelgiumBelizeBoliviaBosnia and HerzegovinaBrazilBulgariaBurma/MyanmarCabo VerdeCambodiaCameroonCanadaCaribbeanCentral AmericaChileChinaColombiaCongoCosta RicaCroatiaCubaCzechoslovakiaDenmarkDominicaDominican RepublicEastern AfricaEastern AsiaEastern EuropeEcuadorEgyptEl SalvadorEnglandEritreaEthiopiaEuropeFijiFranceGermanyGhanaGreeceGrenadaGuatemalaGuyanaHaitiHondurasHong KongHungaryIndiaIndonesiaIranIraqIrelandIsraelItalyJamaicaJapanJordanKazakhstanKenyaKoreaKuwaitLaosLatin AmericaLatviaLebanonLiberiaLithuaniaMalaysiaMexicoMicronesiaMiddle AfricaMoldovaMoroccoNepalNetherlandsNicaraguaNigeriaNorth AmericaNorth MacedoniaNorthern AfricaNorthern EuropeNorwayOceaniaPakistanPanamaPeruPhilippinesPolandPortugalRomaniaRussiaSaudi ArabiaScotlandSenegalSerbiaSierra LeoneSingaporeSomaliaSouth AfricaSouth AmericaSouth Central AsiaSouth Eastern AsiaSouthern EuropeSpainSri LankaSt. Vincent and the GrenadinesSudanSwedenSwitzerlandSyriaTaiwanThailandTrinidad and TobagoTurkeyUgandaUkraineUruguayUzbekistanVenezuelaVietnamWest IndiesWestern AfricaWestern AsiaWestern EuropeYemenZaireZimbabweAzores
In Labor Force | Age 16-19
Income
Poverty
Unemployment
Labor Participation
Family Structure
Vehicle Availability
Education Level
Disability

In Labor Force | Age 16-19 Comparison

Ethiopians

Germans

Exceptional
Exceptional
38.2%
IN LABOR FORCE | AGE 16-19
97.4/ 100
METRIC RATING
121st/ 347
METRIC RANK
44.2%
IN LABOR FORCE | AGE 16-19
100.0/ 100
METRIC RATING
10th/ 347
METRIC RANK

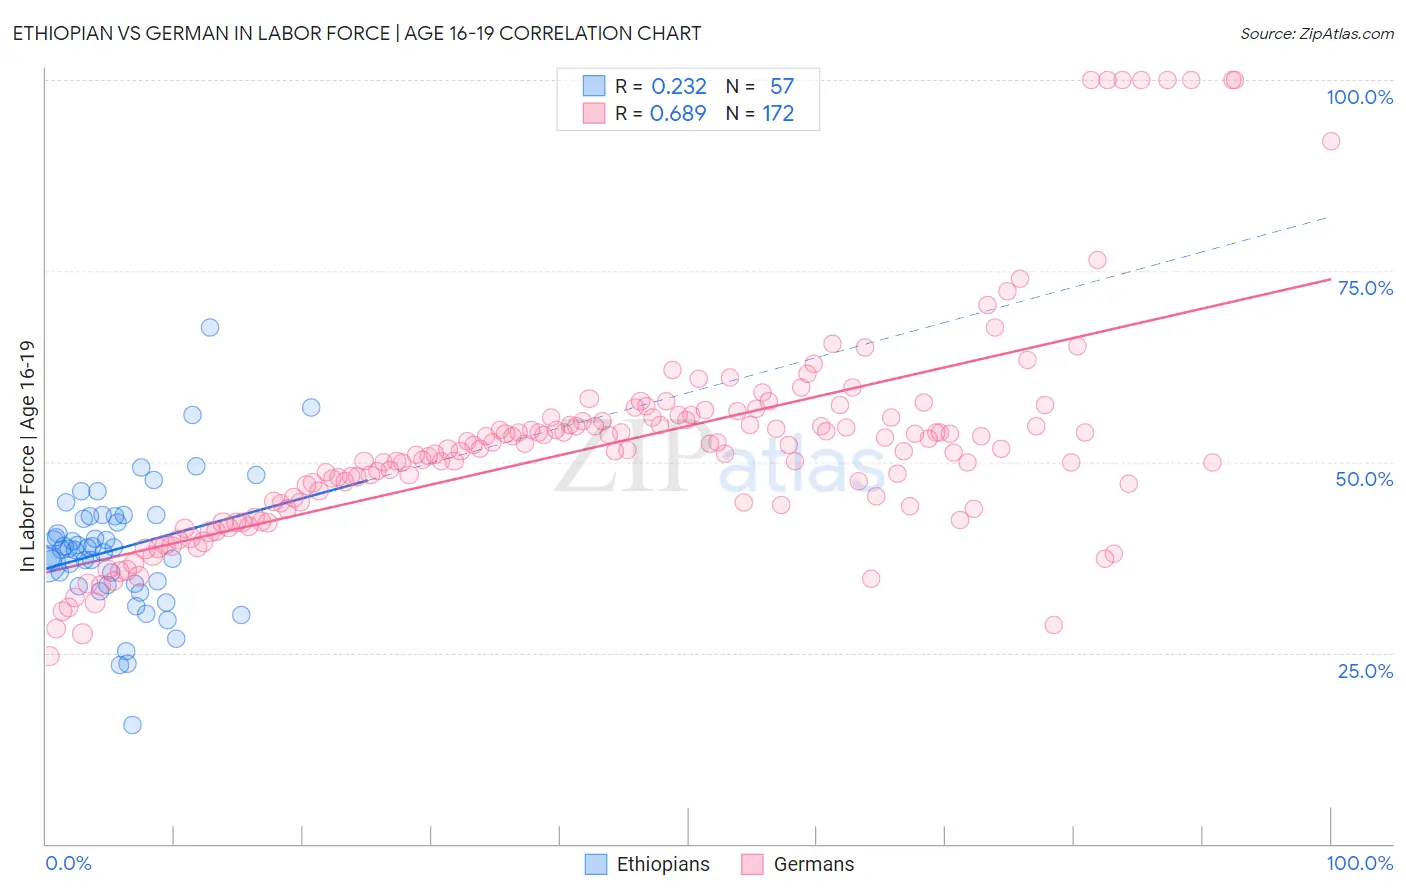
Ethiopian vs German In Labor Force | Age 16-19 Correlation Chart

The statistical analysis conducted on geographies consisting of 223,172,424 people shows a weak positive correlation between the proportion of Ethiopians and labor force participation rate among population between the ages 16 and 19 in the United States with a correlation coefficient (R) of 0.232 and weighted average of 38.2%. Similarly, the statistical analysis conducted on geographies consisting of 575,301,683 people shows a significant positive correlation between the proportion of Germans and labor force participation rate among population between the ages 16 and 19 in the United States with a correlation coefficient (R) of 0.689 and weighted average of 44.2%, a difference of 15.5%.
Ethiopian vs German In Labor Force | Age 16-19

In Labor Force | Age 16-19 Correlation Summary

MeasurementEthiopianGerman
Minimum15.6%24.6%
Maximum67.6%100.0%
Range52.0%75.4%
Mean38.6%52.2%
Median38.6%51.6%
Interquartile 25% (IQ1)34.0%44.2%
Interquartile 75% (IQ3)42.8%55.7%
Interquartile Range (IQR)8.9%11.4%
Standard Deviation (Sample)8.5%14.3%
Standard Deviation (Population)8.4%14.2%

Similar Demographics by In Labor Force | Age 16-19

Demographics Similar to Ethiopians by In Labor Force | Age 16-19

In terms of in labor force | age 16-19, the demographic groups most similar to Ethiopians are Guamanian/Chamorro (38.2%, a difference of 0.030%), Ukrainian (38.3%, a difference of 0.11%), Assyrian/Chaldean/Syriac (38.3%, a difference of 0.19%), Immigrants from Nepal (38.3%, a difference of 0.21%), and Chickasaw (38.3%, a difference of 0.22%).
DemographicsRating | RankIn Labor Force | Age 16-19
Hawaiians
98.2
/100
|
#114
Exceptional
38.4%
Bulgarians
97.9
/100
|
#115
Exceptional
38.3%
Colville
97.9
/100
|
#116
Exceptional
38.3%
Chickasaw
97.8
/100
|
#117
Exceptional
38.3%
Immigrants | Nepal
97.8
/100
|
#118
Exceptional
38.3%
Assyrians/Chaldeans/Syriacs
97.8
/100
|
#119
Exceptional
38.3%
Ukrainians
97.6
/100
|
#120
Exceptional
38.3%
Ethiopians
97.4
/100
|
#121
Exceptional
38.2%
Guamanians/Chamorros
97.4
/100
|
#122
Exceptional
38.2%
Seminole
96.7
/100
|
#123
Exceptional
38.1%
Immigrants | England
96.4
/100
|
#124
Exceptional
38.1%
Immigrants | Africa
96.1
/100
|
#125
Exceptional
38.0%
Africans
95.6
/100
|
#126
Exceptional
38.0%
Choctaw
95.6
/100
|
#127
Exceptional
38.0%
New Zealanders
95.6
/100
|
#128
Exceptional
38.0%

Demographics Similar to Germans by In Labor Force | Age 16-19

In terms of in labor force | age 16-19, the demographic groups most similar to Germans are Swedish (44.1%, a difference of 0.080%), Finnish (43.9%, a difference of 0.54%), Dutch (43.8%, a difference of 0.73%), Cape Verdean (44.5%, a difference of 0.74%), and Chippewa (43.8%, a difference of 0.83%).
DemographicsRating | RankIn Labor Force | Age 16-19
Immigrants | Somalia
100.0
/100
|
#3
Exceptional
45.6%
Luxembourgers
100.0
/100
|
#4
Exceptional
45.3%
Alaskan Athabascans
100.0
/100
|
#5
Exceptional
45.2%
Somalis
100.0
/100
|
#6
Exceptional
45.1%
Danes
100.0
/100
|
#7
Exceptional
44.7%
Immigrants | Cabo Verde
100.0
/100
|
#8
Exceptional
44.7%
Cape Verdeans
100.0
/100
|
#9
Exceptional
44.5%
Germans
100.0
/100
|
#10
Exceptional
44.2%
Swedes
100.0
/100
|
#11
Exceptional
44.1%
Finns
100.0
/100
|
#12
Exceptional
43.9%
Dutch
100.0
/100
|
#13
Exceptional
43.8%
Chippewa
100.0
/100
|
#14
Exceptional
43.8%
Slovenes
100.0
/100
|
#15
Exceptional
43.7%
Czechs
100.0
/100
|
#16
Exceptional
43.6%
Scandinavians
100.0
/100
|
#17
Exceptional
43.6%