Ethiopian vs German In Labor Force | Age 30-34
COMPARE
Ethiopian
German
In Labor Force | Age 30-34
In Labor Force | Age 30-34 Comparison
Ethiopians
Germans
86.6%
IN LABOR FORCE | AGE 30-34
100.0/ 100
METRIC RATING
2nd/ 347
METRIC RANK
84.8%
IN LABOR FORCE | AGE 30-34
75.1/ 100
METRIC RATING
150th/ 347
METRIC RANK
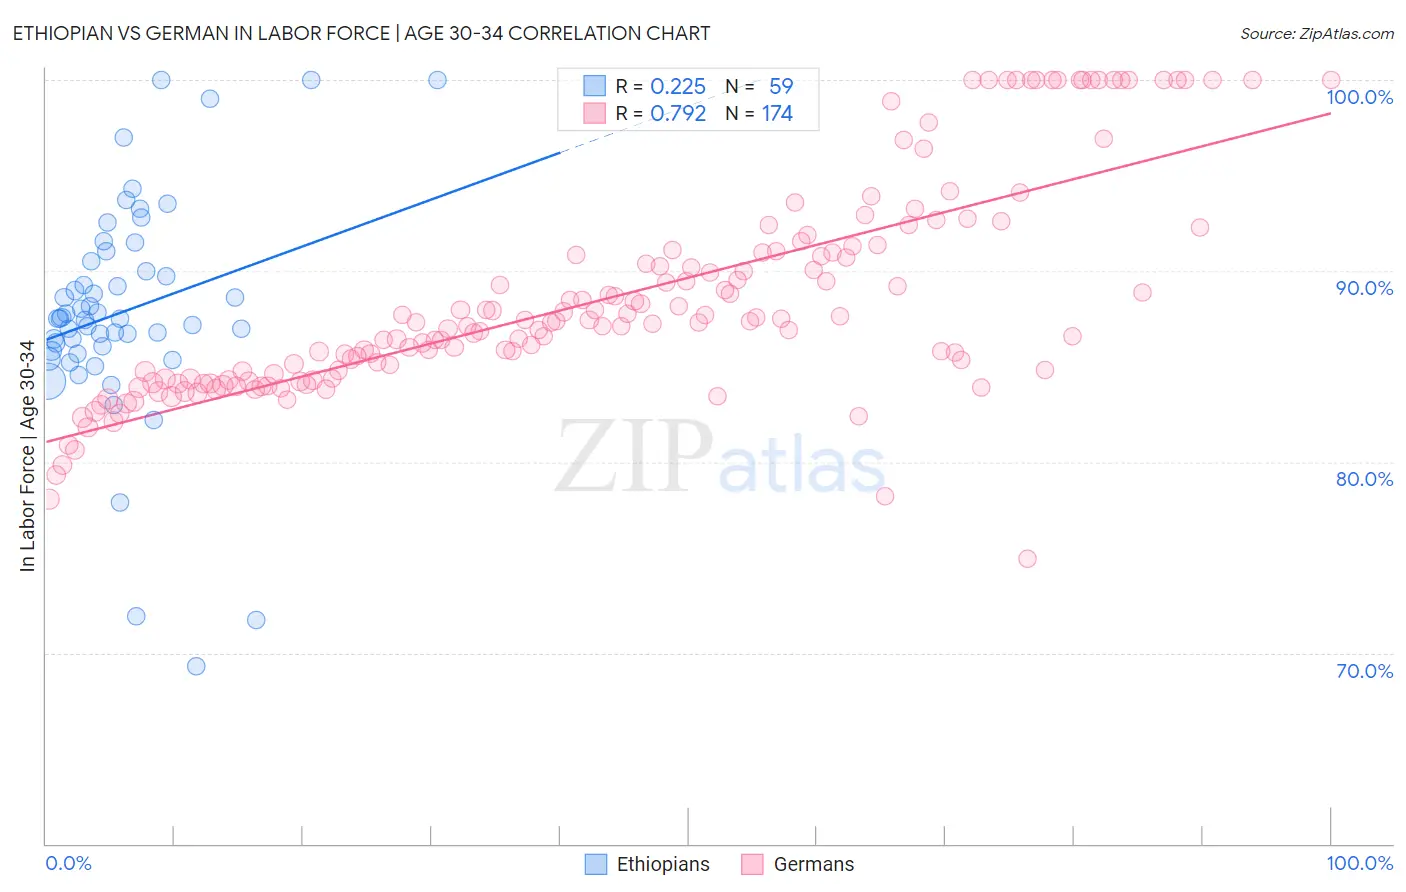
Ethiopian vs German In Labor Force | Age 30-34 Correlation Chart
The statistical analysis conducted on geographies consisting of 223,145,375 people shows a weak positive correlation between the proportion of Ethiopians and labor force participation rate among population between the ages 30 and 34 in the United States with a correlation coefficient (R) of 0.225 and weighted average of 86.6%. Similarly, the statistical analysis conducted on geographies consisting of 579,117,313 people shows a strong positive correlation between the proportion of Germans and labor force participation rate among population between the ages 30 and 34 in the United States with a correlation coefficient (R) of 0.792 and weighted average of 84.8%, a difference of 2.0%.
In Labor Force | Age 30-34 Correlation Summary
| Measurement | Ethiopian | German |
| Minimum | 69.3% | 75.0% |
| Maximum | 100.0% | 100.0% |
| Range | 30.7% | 25.0% |
| Mean | 87.9% | 88.6% |
| Median | 87.5% | 87.3% |
| Interquartile 25% (IQ1) | 85.8% | 84.4% |
| Interquartile 75% (IQ3) | 90.5% | 91.0% |
| Interquartile Range (IQR) | 4.7% | 6.7% |
| Standard Deviation (Sample) | 5.9% | 5.6% |
| Standard Deviation (Population) | 5.8% | 5.6% |
Similar Demographics by In Labor Force | Age 30-34
Demographics Similar to Ethiopians by In Labor Force | Age 30-34
In terms of in labor force | age 30-34, the demographic groups most similar to Ethiopians are Immigrants from Ethiopia (86.6%, a difference of 0.010%), Luxembourger (86.6%, a difference of 0.070%), Liberian (86.4%, a difference of 0.20%), Immigrants from Ireland (86.3%, a difference of 0.35%), and Somali (86.2%, a difference of 0.38%).
| Demographics | Rating | Rank | In Labor Force | Age 30-34 |
| Luxembourgers | 100.0 /100 | #1 | Exceptional 86.6% |
| Ethiopians | 100.0 /100 | #2 | Exceptional 86.6% |
| Immigrants | Ethiopia | 100.0 /100 | #3 | Exceptional 86.6% |
| Liberians | 100.0 /100 | #4 | Exceptional 86.4% |
| Immigrants | Ireland | 100.0 /100 | #5 | Exceptional 86.3% |
| Somalis | 100.0 /100 | #6 | Exceptional 86.2% |
| Immigrants | Bolivia | 100.0 /100 | #7 | Exceptional 86.2% |
| Cambodians | 100.0 /100 | #8 | Exceptional 86.2% |
| Immigrants | Somalia | 100.0 /100 | #9 | Exceptional 86.2% |
| Immigrants | Serbia | 100.0 /100 | #10 | Exceptional 86.2% |
| Carpatho Rusyns | 100.0 /100 | #11 | Exceptional 86.2% |
| Bolivians | 100.0 /100 | #12 | Exceptional 86.1% |
| Immigrants | Croatia | 100.0 /100 | #13 | Exceptional 86.1% |
| Immigrants | Cabo Verde | 100.0 /100 | #14 | Exceptional 86.1% |
| Immigrants | Albania | 100.0 /100 | #15 | Exceptional 86.1% |
Demographics Similar to Germans by In Labor Force | Age 30-34
In terms of in labor force | age 30-34, the demographic groups most similar to Germans are Immigrants from Ukraine (84.8%, a difference of 0.0%), Immigrants from Saudi Arabia (84.9%, a difference of 0.010%), Immigrants from Colombia (84.9%, a difference of 0.010%), Immigrants from Pakistan (84.9%, a difference of 0.010%), and Immigrants from Senegal (84.8%, a difference of 0.010%).
| Demographics | Rating | Rank | In Labor Force | Age 30-34 |
| Colombians | 82.2 /100 | #143 | Excellent 84.9% |
| Uruguayans | 78.5 /100 | #144 | Good 84.9% |
| Palestinians | 77.7 /100 | #145 | Good 84.9% |
| Immigrants | Saudi Arabia | 76.6 /100 | #146 | Good 84.9% |
| Immigrants | Colombia | 76.3 /100 | #147 | Good 84.9% |
| Immigrants | Pakistan | 76.2 /100 | #148 | Good 84.9% |
| Immigrants | Ukraine | 75.1 /100 | #149 | Good 84.8% |
| Germans | 75.1 /100 | #150 | Good 84.8% |
| Immigrants | Senegal | 74.0 /100 | #151 | Good 84.8% |
| Romanians | 73.5 /100 | #152 | Good 84.8% |
| Syrians | 70.1 /100 | #153 | Good 84.8% |
| Northern Europeans | 70.0 /100 | #154 | Good 84.8% |
| Immigrants | Sudan | 69.5 /100 | #155 | Good 84.8% |
| French Canadians | 67.3 /100 | #156 | Good 84.8% |
| Peruvians | 65.9 /100 | #157 | Good 84.8% |